Embed Size (px)
Citation preview

2019 EDELMAN
TRUST BAROMETER
South Korea

Methodology
19th ANNUAL
EDELMAN TRUST
BAROMETER
Online Survey in 27 Markets
33,000+ respondents total
All fieldwork was conducted between
October 19 and November 16, 2018
27-market global data margin of error: General population +/- 0.6%
(N=31,050), informed public +/- 1.3% (N=6,000), mass population +/-
0.6% (26,000+), half-sample global general online population +/- 0.8
(N=15,525).
Market-specific data margin of error: General population +/- 2.9
(N=1,150), informed public +/- 6.9% (N=min 200, varies by market,
China and U.S. +/- 4.4% (N=500), mass population +/- 3.0 to 3.6 (N
=min 739, varies by market).
Employee MOE: 27-market = +/- 0.8% (N=16,944)
Market-specific = +/- 3.2 to 4.6% (N=min 446, varies by market)2
General Online Population
1,150 respondents per market
Ages 18+
All slides show general online
population data unless otherwise noted
Mass Population
All population not including informed public
Represents 84% of total global population
Informed Public
500 respondents in U.S. and China;
200 in all other markets
Represents 16% of total global population
Must meet 4 criteria
- Ages 25-64
- College-educated
- In top 25% of household income per
age group in each market
- Report significant media consumption and
engagement in public policy and business news
2019 Focus on
Employer-Employee
Relationship
55% of global general population are full- or
part-time employees (but not self-employed)
Oversample of employees of multinational
companies: 500 respondents per market

3
TRUST IN RETROSPECT
2001 2002 2003 2004 2005 2006 2007 2008 2009
Rising
Influence of
NGOs
Fall of the
Celebrity CEO
Earned Media
More Credible
Than
Advertising
U.S.
Companies in
Europe Suffer
Trust Discount
Trust
Shifts from
“Authorities”
to Peers
A “Person Like
Me” Emerges
as Credible
Spokesperson
Business More
Trusted Than
Government
and Media
Young
Influencers
Have More
Trust in
Business
Business Must
Partner with
Government to
Regain Trust
2010 2011 2012 2013 2014 2015 2016 2017 2018 2019
Trust is Now
an Essential
Line of
Business
Rise of
Authority
Figures
Fall of
Government
Crisis of
Leadership
Business
to Lead
the Debate
for Change
Trust is
Essential to
Innovation
Growing
Inequality
of Trust
Trust in
Crisis
The Battle
for TruthTrust
at Work

4
Global Trust Index increases 3 pts to neutral
15 of 26 markets are distrusters,
down 3 from 2018
2019 Edelman Trust Barometer. The Trust Index is the average
percent trust in NGOs, business, government and media. TRU_INS.
Below is a list of institutions. For each one, please indicate how
much you trust that institution to do what is right using a nine-point
scale where one means that you “do not trust them at all” and nine
means that you “trust them a great deal.” 9-point scale; top 4 box,
trust. General population, 26-market global average.
DISTRUST
CONTINUESTrust Index
Biggest changes in
49 Global 26
74 China
71 Indonesia
68 India
66 UAE
58 Singapore
54 Mexico
54 The Netherlands
53 Malaysia
49 Canada
47 Argentina
47 Colombia
47 Spain
46 Turkey
45 Hong Kong
44 Brazil
44 S. Korea
43 Italy
43 U.S.
41 Germany
40 Australia
40 France
39 U.K.
38 Ireland
38 S. Africa
37 Japan
36 Russia
Hong Kong +10
Australia +8
Canada +7
S. Africa +7
Russia -7
Spain -7
52 Global 26
79 China
73 Indonesia
72 India
71 UAE
62 Singapore
59 Malaysia
58 Mexico
56 Canada
55 Hong Kong
54 The Netherlands
52 Colombia
49 U.S.
48 Australia
46 Argentina
46 Brazil
46 Italy
46 S. Korea
45 S. Africa
45 Turkey
44 France
44 Germany
43 U.K.
42 Ireland
40 Spain
39 Japan
29 Russia
2018General Population
2019General Population Trust
(60-100)
Neutral
(50-59)
Distrust
(1-49)

63 Global 26
88 China
83 India
83 Indonesia
83 UAE
74 Canada
70 Malaysia
69 Singapore
68 Mexico
67 The Netherlands
66 Hong Kong
64 U.K.
61 S. Korea
60 Germany
60 U.S.
59 Australia
59 France
56 Colombia
53 Argentina
53 Italy
53 Japan
53 S. Africa
53 Turkey
51 Brazil
48 Ireland
47 Spain
35 Russia
59 Global 26
83 China
81 Indonesia
77 India
76 UAE
70 Singapore
67 The Netherlands
65 Malaysia
65 Mexico
62 Canada
60 Argentina
57 Italy
57 Turkey
56 France
55 Australia
55 Germany
55 Spain
52 U.K.
51 Brazil
50 Colombia
49 Hong Kong
49 S. Korea
48 Ireland
47 Russia
46 Japan
45 S. Africa
45 U.S.
5
A 4-point increase in the global Trust Index
2019 Edelman Trust Barometer. The Trust Index is the average
percent trust in NGOs, business, government and media. TRU_INS.
Below is a list of institutions. For each one, please indicate how
much you trust that institution to do what is right using a nine-point
scale where one means that you “do not trust them at all” and nine
means that you “trust them a great deal.” 9-point scale; top 4 box,
trust. Informed public, 26-market global average.
TRUST RISES FOR
INFORMED PUBLICTrust Index
2018Informed Public
2019Informed Public Trust
(60-100)
Neutral
(50-59)
Distrust
(1-49)
Biggest changes in
Hong Kong +17
U.S. +15
Canada +12
U.K. +12
South Korea +12
Russia -12

50 Global 27
76 China
69 Indonesia
69 Saudi Arabia
68 UAE
66 India
60 Singapore
58 Malaysia
54 Canada
54 Mexico
54 The Netherlands
52 Hong Kong
51 Colombia
47 U.S.
46 Australia
46 Italy
45 Argentina
44 S. Africa
44 S. Korea
43 Brazil
42 Germany
41 France
41 Ireland
41 Turkey
40 U.K.
39 Spain
37 Japan
28 Russia
Trust
(60-100)
Neutral
(50-59)
Distrust
(1-49)
6
Mass population 14 points less trusting
18 markets with double-digit trust gaps
2019 Edelman Trust Barometer. The Trust Index is the
average percent trust in NGOs, business, government and
media. TRU_INS. Below is a list of institutions. For each one,
please indicate how much you trust that institution to do what
is right using a nine-point scale where one means that you
“do not trust them at all” and nine means that you “trust them
a great deal.” 9-point scale; top 4 box, trust. Informed public
and mass population, 27-market global average.
A WORLD
OUT OF BALANCETrust Index
64 Global 27
88 China
84 Saudi Arabia
83 India
83 Indonesia
83 UAE
74 Canada
70 Malaysia
69 Singapore
68 Mexico
67 The Netherlands
66 Hong Kong
64 U.K.
61 S. Korea
60 Germany
60 U.S.
59 Australia
59 France
56 Colombia
53 Argentina
53 Italy
53 Japan
53 S. Africa
53 Turkey
51 Brazil
48 Ireland
47 Spain
35 Russia
2019Informed Public
2019Mass Population Trust gap
14
12
14*
15
15
17*
9
12
20*
14
13
14
5
13
13
7
8
9
17*
8
18*
18
7
12
24*
8
16
7
*highest-ever
trust inequality

Divided
by Trust

55
3645
40
56
3948
42
Percent trust
TRUST RISES IN SOUTH KOREA; BUSINESS,
GOVERNMENT, MEDIA ALL DISTRUSTED
82019 Edelman Trust Barometer. TRU_INS. Below is a list of institutions. For each one, please indicate how much you trust that institution to do what is right using a nine-point scale where one
means that you “do not trust them at all” and nine means that you “trust them a great deal.” 9-point scale; top 4 box, trust. Informed public and general population, S. Korea.
Business MediaNGO Government
64
37
54
42
73
56 6055
General population
Informed public
+9 +19 +6 +13
+1 +3 +3 +2
2018 2019 2018 2019 2018 2019 2018 2019
2018 2019 2018 2019 2018 2019 2018 2019
Business, government and media still distrusted
Y-to-Y Change- +0
TrustNeutralDistrust

Trust Index (23-market average)
TRUST INEQUALITY RETURNS TO RECORD HIGHS
9
2019 Edelman Trust Barometer. The Trust Index is the average percent trust in NGOs, business, government and media. TRU_INS. Below is a list of institutions. For each one, please indicate
how much you trust that institution to do what is right using a nine-point scale where one means that you “do not trust them at all” and nine means that you “trust them a great deal.” 9-point scale;
top 4 box, trust. Informed public and mass population, 23-market average.
54
5857
56
62 62
60
65
45
4847 47
49
4647
49
2012 2013 2014 2015 2016 2017 2018 2019
Previous high
9pt gap
Informed
Public
Mass
Population
16pt gap
16pt gap
Trust
(60-100)
Neutral
(50-59)
Distrust
(1-49)

44
48
51
47
50 5049
61
38
4241
35
40
36
42
44
2012 2013 2014 2015 2016 2017 2018 2019
10
2019 Edelman Trust Barometer. The Trust Index is the average percent trust in NGOs, business, government and media. TRU_INS. Below is a list of institutions. For each one, please indicate
how much you trust that institution to do what is right using a nine-point scale where one means that you “do not trust them at all” and nine means that you “trust them a great deal.” 9-point scale;
top 4 box, trust. Informed public and mass population, S. Korea.
South Korea Trust Index
TRUST INEQUALITY AT RECORD HIGH IN SOUTH KOREA
Previous high
6pt gap
Informed
Public
Mass
Population
14pt gap
17pt gap
Trust
(60-100)
Neutral
(50-59)
Distrust
(1-49)

55 58 6051 50
5055 53
46 45
112019 Edelman Trust Barometer. TRU_INS. Below is a list of institutions. For each one, please indicate how much you trust that institution to do what is right using a nine-point scale where one
means that you “do not trust them at all” and nine means that you “trust them a great deal.” 9-point scale; top 4 box, trust. General population, 27-market average, by gender.
Percent trust
DIVIDED ALONG GENDER LINES
Trust Index
Germany 12
U.S. 11
UAE 10
Women
Men
NGOs Business Government Media
U.S. 14
Germany 11
Japan 11
U.S. 15
Germany 14
UAE 14
Germany 10
Japan 10
S. Africa 10
UAE 16
Germany 11
Japan 11
TrustNeutralDistrust
Trust gap 5 3 7 5 5
Largest gaps in:
Largest trust gap
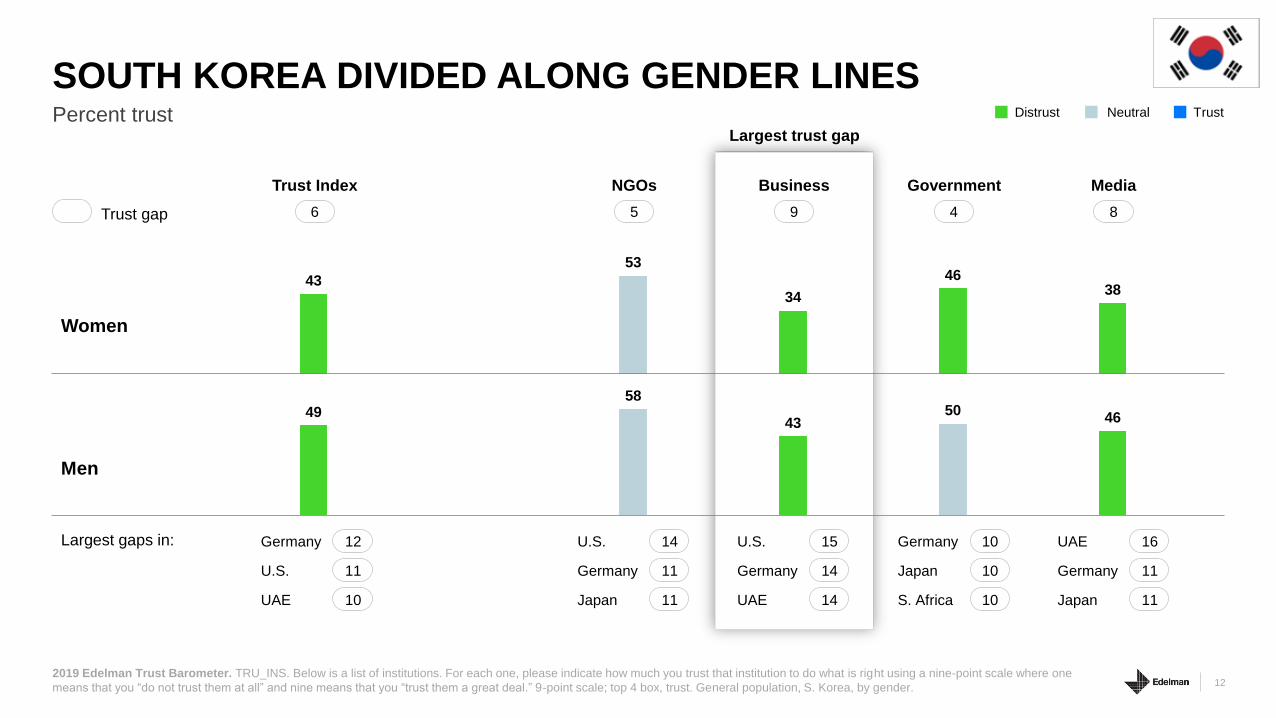
4958
4350
46
43
53
34
4638
122019 Edelman Trust Barometer. TRU_INS. Below is a list of institutions. For each one, please indicate how much you trust that institution to do what is right using a nine-point scale where one
means that you “do not trust them at all” and nine means that you “trust them a great deal.” 9-point scale; top 4 box, trust. General population, S. Korea, by gender.
Percent trust
SOUTH KOREA DIVIDED ALONG GENDER LINES
Trust Index
Germany 12
U.S. 11
UAE 10
Women
Men
NGOs Business Government Media
U.S. 14
Germany 11
Japan 11
U.S. 15
Germany 14
UAE 14
Germany 10
Japan 10
S. Africa 10
UAE 16
Germany 11
Japan 11
TrustNeutralDistrust
Trust gap 6 5 9 4 8
Largest gaps in:
Largest trust gap
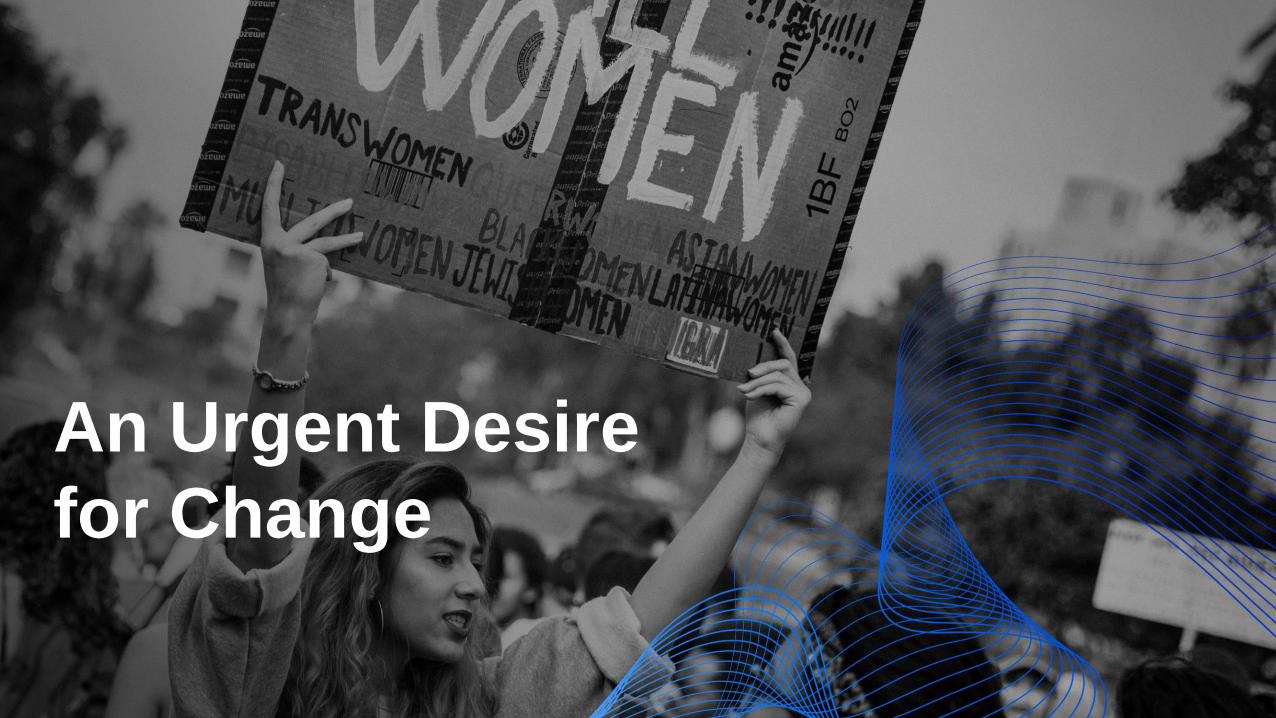
An Urgent Desire
for Change

49
1621
26 2831 32 34 34
38 39 3944 45
48 5053 54
59
69 70 71 71 73 73
7982 84
63
38 37 3843
47
54 5350 48
38
44
56
6562
56 54
69 6972
8386
7974
81
88 8986
Glo
bal
27
Ja
pan
Fra
nce
Germ
an
y
U.K
.
Th
e N
eth
erl
an
ds
Au
str
alia
Ca
na
da
Italy
Ho
ng
Ko
ng
Ru
ss
ia
S. K
ore
a
Sp
ain
Irela
nd
U.S
.
Sin
gap
ore
Tu
rkey
S. A
fric
a
Arg
en
tin
a
Ma
lay
sia
UA
E
Ch
ina
Sau
di A
rab
ia
Bra
zil
Me
xic
o
Ind
ia
Ind
on
es
ia
Co
lom
bia
Percent who believe they and their families will be better off in five years’ time
DEVELOPED WORLD
PESSIMISTIC ABOUT FUTURE
142019 Edelman Trust Barometer. CNG_FUT. Thinking about the economic prospects for yourself and your family, how do you think you and your family will be doing in five years’ time?
5-point scale; top 2 box, better off. Informed public and mass population, 27-market average.
14 markets in which majority of mass population
do not believe that they will be better off in five years
Mass population Informed public
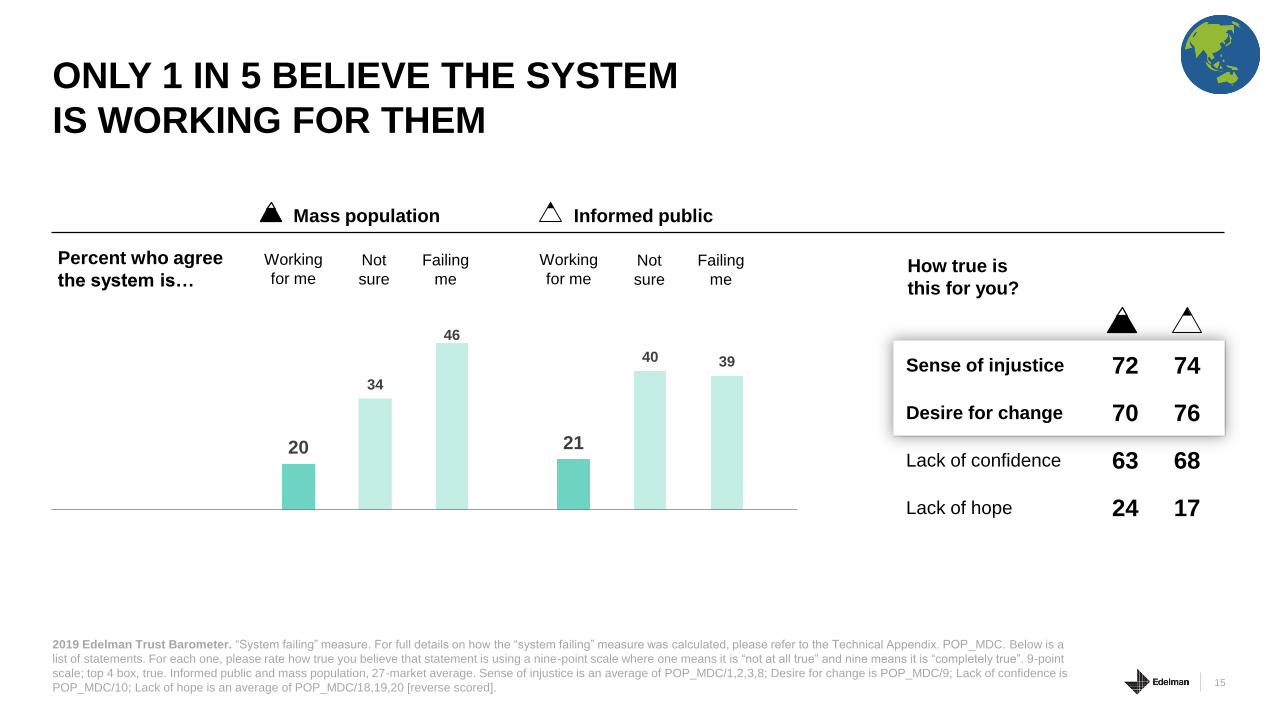
ONLY 1 IN 5 BELIEVE THE SYSTEM
IS WORKING FOR THEM
15
2019 Edelman Trust Barometer. “System failing” measure. For full details on how the “system failing” measure was calculated, please refer to the Technical Appendix. POP_MDC. Below is a
list of statements. For each one, please rate how true you believe that statement is using a nine-point scale where one means it is “not at all true” and nine means it is “completely true”. 9-point
scale; top 4 box, true. Informed public and mass population, 27-market average. Sense of injustice is an average of POP_MDC/1,2,3,8; Desire for change is POP_MDC/9; Lack of confidence is
POP_MDC/10; Lack of hope is an average of POP_MDC/18,19,20 [reverse scored].
Sense of injustice 72 74
Desire for change 70 76
Lack of confidence 63 68
Lack of hope 24 17
Mass population
20
34
46
21
40 39
Percent who agree
the system is…
Informed public
How true is
this for you?
Working
for meNot
sure
Failing
me
Working
for meNot
sure
Failing
me
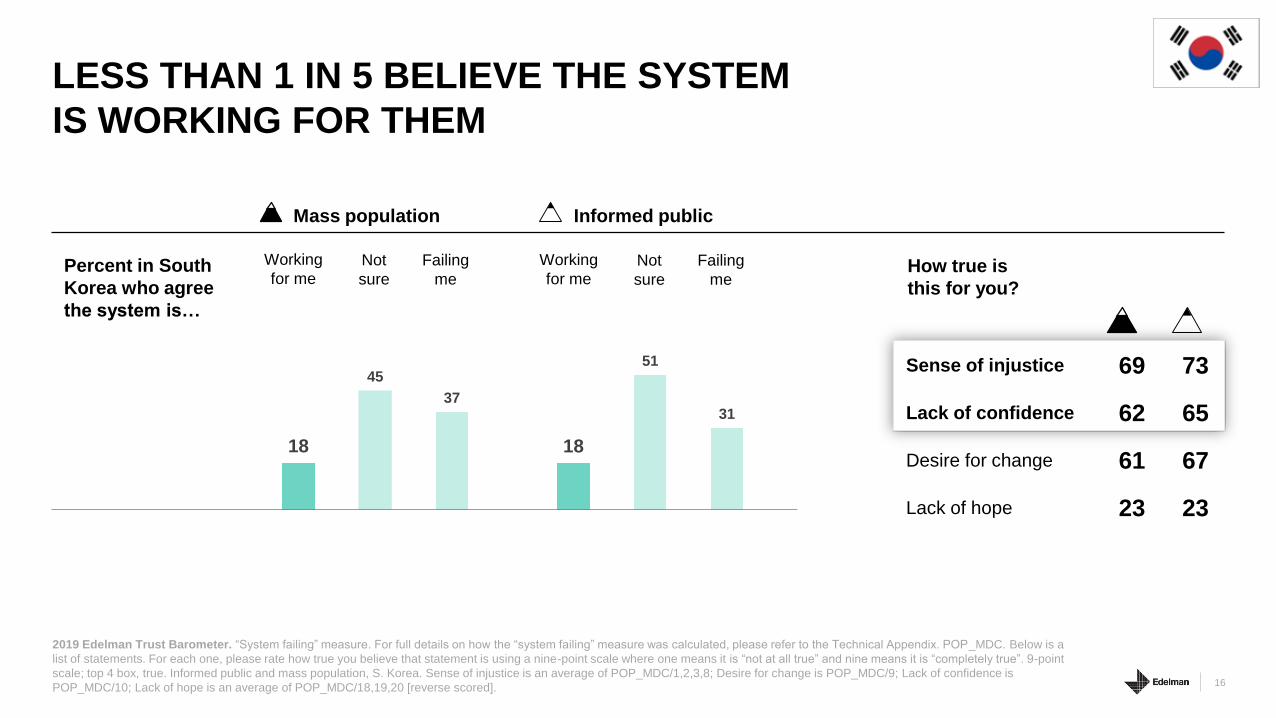
LESS THAN 1 IN 5 BELIEVE THE SYSTEM
IS WORKING FOR THEM
16
2019 Edelman Trust Barometer. “System failing” measure. For full details on how the “system failing” measure was calculated, please refer to the Technical Appendix. POP_MDC. Below is a
list of statements. For each one, please rate how true you believe that statement is using a nine-point scale where one means it is “not at all true” and nine means it is “completely true”. 9-point
scale; top 4 box, true. Informed public and mass population, S. Korea. Sense of injustice is an average of POP_MDC/1,2,3,8; Desire for change is POP_MDC/9; Lack of confidence is
POP_MDC/10; Lack of hope is an average of POP_MDC/18,19,20 [reverse scored].
Sense of injustice 69 73
Lack of confidence 62 65
Desire for change 61 67
Lack of hope 23 23
Mass population
18
45
37
18
51
31
Percent in South
Korea who agree
the system is…
Informed public
How true is
this for you?
Working
for meNot
sure
Failing
me
Working
for meNot
sure
Failing
me
17
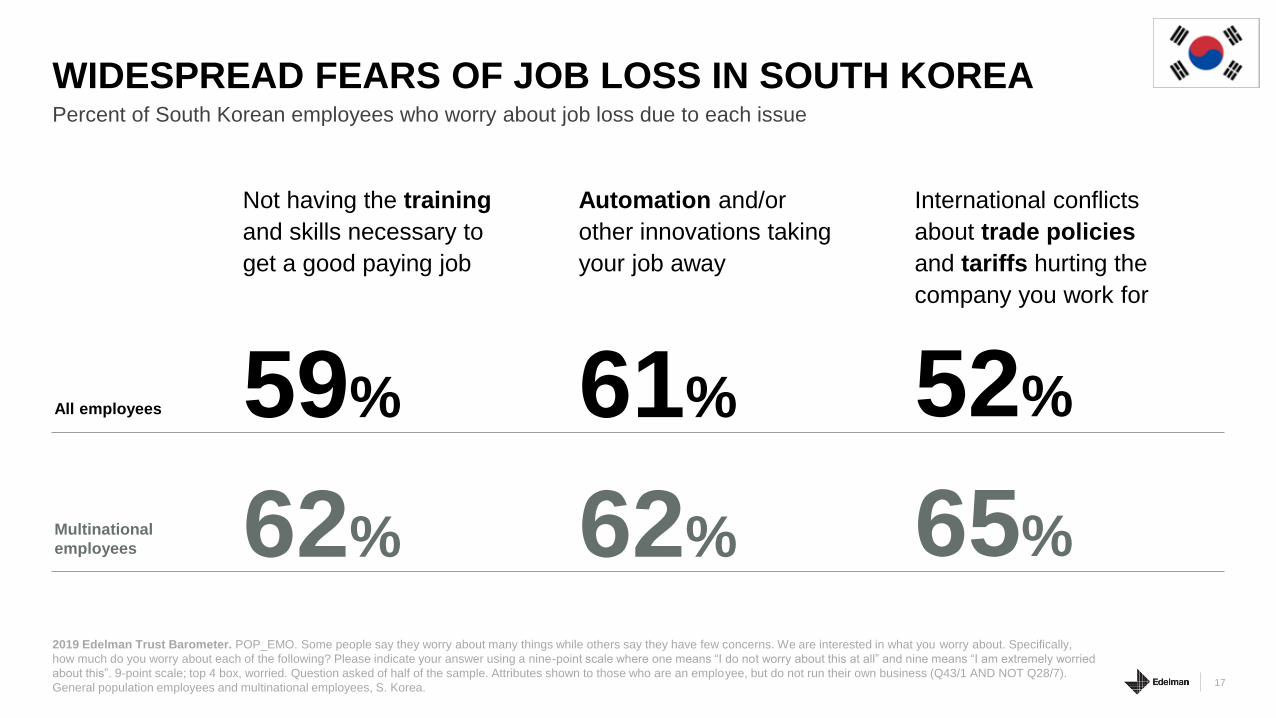
2019 Edelman Trust Barometer. POP_EMO. Some people say they worry about many things while others say they have few concerns. We are interested in what you worry about. Specifically,
how much do you worry about each of the following? Please indicate your answer using a nine-point scale where one means “I do not worry about this at all” and nine means “I am extremely worried
about this”. 9-point scale; top 4 box, worried. Question asked of half of the sample. Attributes shown to those who are an employee, but do not run their own business (Q43/1 AND NOT Q28/7).
General population employees and multinational employees, S. Korea.
Percent of South Korean employees who worry about job loss due to each issue
WIDESPREAD FEARS OF JOB LOSS IN SOUTH KOREA
All employees
Not having the training
and skills necessary to
get a good paying job
Automation and/or
other innovations taking
your job away
International conflicts
about trade policies
and tariffs hurting the
company you work for
59% 61% 52%
Multinational
employees 62% 62% 65%

21
27 27 29
4245
5155 56
59 60 62 63 63 6569
Ch
ina
Bra
zil
Me
xic
o
Ind
ia
Sp
ain
Jap
an
Ita
ly
S. K
ore
a
U.K
.
Th
e N
eth
erl
an
ds
Ca
na
da
Fra
nce
Au
str
ali
a
U.S
.
Ge
rman
y
Sw
itzerl
an
d
Percent in South Korea who trust companies headquartered in each market
SOUTH KOREAN TRUST RISES
FOR 7 OF 16 COUNTRY BRANDS
18
2019 Edelman Trust Barometer. TRU_NAT. Now we would like to focus on global companies headquartered in specific countries. Please indicate how much you trust global companies
headquartered in the following countries to do what is right. Use the same nine-point scale where one means that you “do not trust them at all” and nine means that you “trust them a great deal”.
9-point scale; top 4 box, trust. Markets shown to half of the sample. General population, S. Korea.
Y-to-Y Change- +0
TrustNeutralDistrust
l l l l l l l l ll l l l l l l+5 -3 -2 +2 -4 +1 -2 +5 -4 -4 -7 +2 +3 +6 -3 -1

THEY’RE TAKING CHANGE INTO THEIR OWN HANDS
19
“Yellow Vests” demonstrate
for economic justice
India’s “Women’s Wall”
demonstrate for equality
Salesforce employees protest
work for U.S. border agency

Making
Change Happen

22
36
18
27
60
36
21
2019 Edelman Trust Barometer. News Engagement Scale, built from MED_SEG_OFT. How often do you engage in the following activities related to news and information? Indicate your
answer using the 7-point scale below. Question asked of half of the sample. General population, S. Korea. For details on how the News Engagement Scale was built, please refer to the Technical
Appendix.
MASSIVE RISE IN NEWS ENGAGEMENTHow often do you engage in the following activities related to news and information?
THE DISENGAGEDConsume news less than weekly
AMPLIFIERSConsume news about weekly or
more AND share or post content
several times a month or more
CONSUMERSConsume news about weekly or more
+23pts
More engaged
with the news
2018
+14pts
+9pts
Y-to-Y Change- +0
2019

MORE WOMEN THAN MEN
BECOME AMPLIFIERS
24
3627
39
21
34
22
2019 Edelman Trust Barometer. News Engagement Scale, built from MED_SEG_OFT. How often do you engage in the following activities related to news and information? Indicate your
answer using the 7-point scale below. Question asked of half of the sample. Mass population and informed public, 26-market average, among amplifiers by gender. For details on how the News
Engagement Scale was built, please refer to the Technical Appendix.
Percent of amplifiers in each segment
Mass population
+12
2018 2019
36
56
38
56
34
57
Men Women Men Women
Informed public
2018 2019 2018 2019 2018 2019 2018 2019 2018 2019
+12+13
+20 +18 +23
Y-to-Y Change- +0

Search engines*
Traditional media
Online-only media**
Social media
Owned media
23
2019 Edelman Trust Barometer. COM_MCL. When looking for general news and information, how much would you trust each type of source for general news and information? Please use a
nine-point scale where one means that you “do not trust it at all” and nine means that you “trust it a great deal.” 9-point scale; top 4 box, trust. Question asked of half of the sample. General
population, S. Korea.
*From 2012-2015, “Online Search Engines” were included as a media type. In 2016, this was changed to “Search Engines.”
**From 2012-2015, “Hybrid Media” was included as a media type. In 2016, this was changed to “Online-Only media.”
Percent in South Korea who trust each source for general news and information
SEARCH MOST TRUSTED IN SOUTH KOREA
58 5860
52
47
42
5354
4543
44
43
47
41
51 4653 52
56
5856
58
55
60
4243 42
45
4038 40
37
3132 33
35
32
26
32
35
2012 2013 2014 2015 2016 2017 2018 2019

SOUTH KOREA LOOKING FOR RELIABLE SOURCESPercent in South Korea who trust each source of news
2019 Edelman Trust Barometer. ATT_MED_AGR. Below is a list of statements. For each one, please rate how much you agree or disagree with that statement using a nine-point scale where
one means “strongly disagree” and nine means “strongly agree”. 9-point scale; top 4 box, agree. Question asked of half of the sample. General population, S. Korea. COM_MCL. When looking
for general news and information, how much would you trust each type of source for general news and information? Please use a 9-point scale where one means that you “do not trust it at all”
and nine means that you “trust it a great deal”. 9-point scale; top 4 box, trust. Question asked of half of the sample. General population, S. Korea and by region. 24
60 59 6168
75
5460
65 66 66
37 34 34
50 53
S. Korea Europe U.S./Canada APACMEA Latin America
Low trust in social media
worry about false
information or fake news
being used as a weapon
72%
Search Traditional media Social media
64
51 5047 47 46
4036
30 2925
25
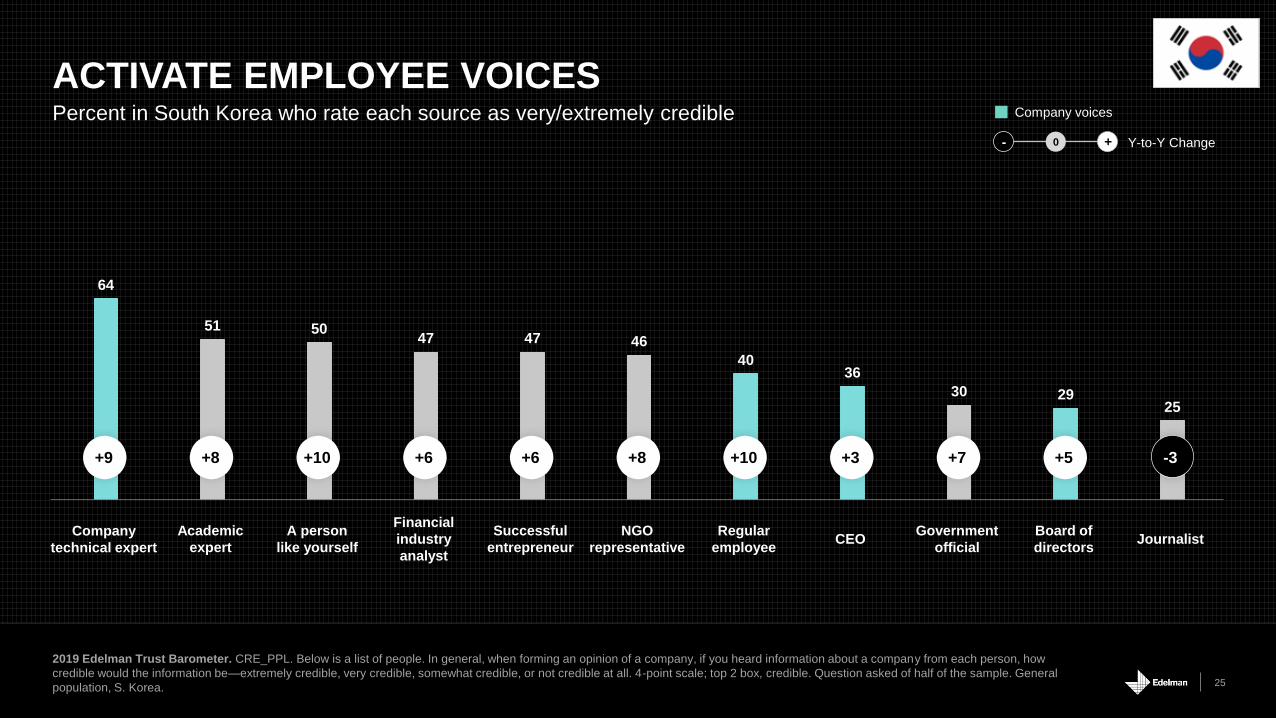
2019 Edelman Trust Barometer. CRE_PPL. Below is a list of people. In general, when forming an opinion of a company, if you heard information about a company from each person, how
credible would the information be—extremely credible, very credible, somewhat credible, or not credible at all. 4-point scale; top 2 box, credible. Question asked of half of the sample. General
population, S. Korea.
ACTIVATE EMPLOYEE VOICESPercent in South Korea who rate each source as very/extremely credible
Y-to-Y Change- +0
Company voices
l l l l l l l l l l+9 +8 +10 +6 +6 +8 +10 +3 +7 +5 -3
Company
technical expert
Academic
expert
A person
like yourself
Financial
industry
analyst
Successful
entrepreneur
NGO
representative
Regular
employeeCEO
Government
official
Board of
directorsJournalist
26
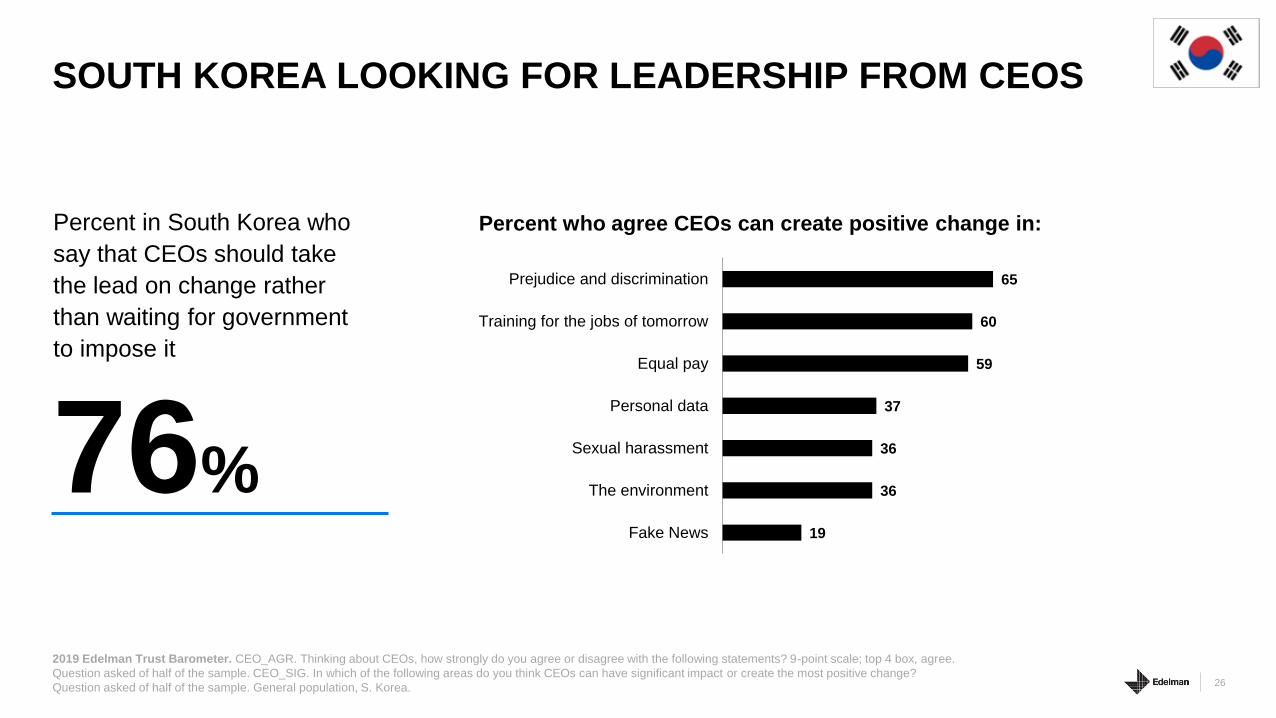
2019 Edelman Trust Barometer. CEO_AGR. Thinking about CEOs, how strongly do you agree or disagree with the following statements? 9-point scale; top 4 box, agree.
Question asked of half of the sample. CEO_SIG. In which of the following areas do you think CEOs can have significant impact or create the most positive change?
Question asked of half of the sample. General population, S. Korea.
SOUTH KOREA LOOKING FOR LEADERSHIP FROM CEOS
Percent in South Korea who
say that CEOs should take
the lead on change rather
than waiting for government
to impose it
76%19
36
36
37
59
60
65
Fake News
The environment
Sexual harassment
Personal data
Equal pay
Training for the jobs of tomorrow
Prejudice and discrimination
Percent who agree CEOs can create positive change in:
My Employer:
A Trusted Partner
for Change

75
5659
63 64 66 68 69 6972 73 73 73 74 74 76 77 77
80 80 82 82 83 83 84 8689
Glo
ba
l 2
6
S. K
ore
a
Jap
an
Ru
ss
ia
Sp
ain
Fra
nc
e
Arg
en
tin
a
Ire
lan
d
Tu
rke
y
Ita
ly
Ge
rma
ny
S. A
fric
a
U.K
.
Ho
ng
Ko
ng
Sin
ga
po
re
Ma
lay
sia
Au
str
alia
Bra
zil
Ca
na
da
U.S
.
Me
xic
o
Th
e N
eth
erl
an
ds
Co
lom
bia
UA
E
Ind
ia
Ch
ina
Ind
on
esia
Percent trust in “my employer”
STRONG RELATIONSHIP WITH
MY EMPLOYER AROUND THE WORLD
28
2019 Edelman Trust Barometer. TRU_INS. [YOUR EMPLOYER] Below is a list of institutions. For each one, please indicate how much you trust that institution to do what is right using a nine-
point scale where one means that you “do not trust them at all” and nine means that you “trust them a great deal”. 9-point scale; top 4 box, trust. Question asked of those who are employed, but
not self employed (Q206/1 OR 2 AND NOT Q421/8). General population employees, 26-market average.
l llllllllllllllllllllllllll+2 0 +3 -2 -2 +6 +7 +2 +6 -1 0 +2 +1 +6 0 +3 +3 +5 +4 +1 +2 0 -1 +7 -3 +3 0
TrustNeutralDistrust
Y-to-Y Change- +0

56 56
39
4842
29
2019 Edelman Trust Barometer. TRU_INS. Below is a list of institutions. For each one, please indicate how much you trust that institution to do what is right using a nine-point scale where one
means that you “do not trust them at all” and nine means that you “trust them a great deal.” 9-point scale; top 4 box, trust. “Your employer” asked of those who are employed, but not self
employed (Q206/1 OR 2 AND NOT Q421/8). General population, S. Korea.
Percent trust
MY EMPLOYER AND NGOs MOST-TRUSTED
RELATIONSHIPS IN SOUTH KOREA
Business MediaNGOs GovernmentMy employer
TrustNeutralDistrust

Percent trust in “my employer”
EMPLOYERS TRUSTED
EVEN BY THE DISENFRANCHISED
30
2019 Edelman Trust Barometer. TRU_INS. [YOUR EMPLOYER] Below is a list of institutions. For each one, please indicate how much you trust that institution to do what is right using a nine-point
scale where one means that you “do not trust them at all” and nine means that you “trust them a great deal”. 9-point scale; top 4 box, trust. Question asked of those who are employed, but not self
employed (Q206/1 OR 2 AND NOT Q421/8). General population employees, mass population employees and informed public employees, 27-market average, by gender, and “system failing” scale.
For details on how the “system failing” measure was calculated, please refer to the Technical Appendix.
72
82
7178 77
7377
Mass
population
Informed
public
System is
failing me
Not sure System is
working for
me
Women Men
TrustNeutralDistrust

Percent trust in “my employer”
EMPLOYERS MUST EARN TRUST
AMONG THE DISENFRANCHISED
31
2019 Edelman Trust Barometer. TRU_INS. [YOUR EMPLOYER] Below is a list of institutions. For each one, please indicate how much you trust that institution to do what is right using a nine-
point scale where one means that you “do not trust them at all” and nine means that you “trust them a great deal”. 9-point scale; top 4 box, trust. Question asked of those who are employed, but
not self employed (Q206/1 OR 2 AND NOT Q421/8). General population employees, mass population employees and informed public employees, S. Korea, by gender, and “system failing” scale.
For details on how the “system failing” measure was calculated, please refer to the Technical Appendix.
54
64
5459
50 50
61
Mass
population
Informed
public
System is
failing me
Not sure System is
working for
me
Women Men
TrustNeutralDistrust
Percent who agree
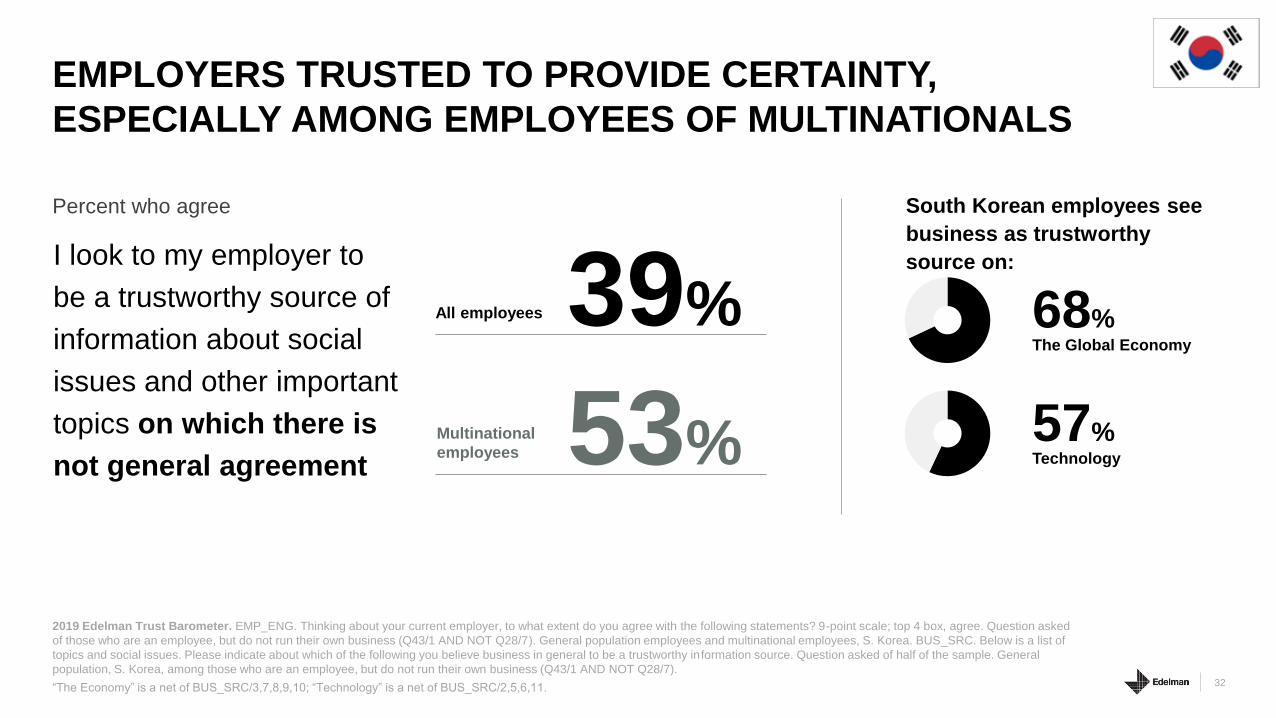
EMPLOYERS TRUSTED TO PROVIDE CERTAINTY,
ESPECIALLY AMONG EMPLOYEES OF MULTINATIONALS
32
2019 Edelman Trust Barometer. EMP_ENG. Thinking about your current employer, to what extent do you agree with the following statements? 9-point scale; top 4 box, agree. Question asked
of those who are an employee, but do not run their own business (Q43/1 AND NOT Q28/7). General population employees and multinational employees, S. Korea. BUS_SRC. Below is a list of
topics and social issues. Please indicate about which of the following you believe business in general to be a trustworthy information source. Question asked of half of the sample. General
population, S. Korea, among those who are an employee, but do not run their own business (Q43/1 AND NOT Q28/7).
“The Economy” is a net of BUS_SRC/3,7,8,9,10; “Technology” is a net of BUS_SRC/2,5,6,11.
I look to my employer to
be a trustworthy source of
information about social
issues and other important
topics on which there is
not general agreement
39%
South Korean employees see
business as trustworthy
source on:
68%The Global Economy
57%Technology
All employees
Multinational
employees 53%

Trust at Work

42
25Percent of employees who expect each
from a prospective employer
EMPLOYEE EXPECTATIONS
NOW INCLUDE
SOCIETAL CHANGE
2019 Edelman Trust Barometer. EMP_IMP. When considering an organization
as a potential place of employment, how important is each of the following to you
in deciding whether or not you would accept a job offer there? Question asked of
those who are an employee, but do not run their own business (Q43/1 AND NOT
Q28/7). General population employees, 27-market average. Buckets are the sum
of the average of codes 1 & 2 for the items that make up each dimension. For
details on the full list of items that went into each of the three dimensions, please
refer to the Technical Appendix.
Strong expectation
You would have to pay
me a lot more to work
for an organization that
does not offer this
Deal breaker
I would never work
for an organization
that does not offer this
Job Opportunity
My employer offers wage growth,
training, career growth and work
which I find interesting & fulfilling
Personal Empowerment
I know what is going on, I am part
of the planning process, and I have
a voice in key decisions; the culture
is values-driven and inclusive
Shared Action
My employer has a
greater purpose, and my
job has a meaningful
societal impact
67%
43
31
74%
42
38
80%
34

43
14
45
28
46
22
Percent of South Korean employees
who expect each from a prospective
employer
SOUTH KOREAN EMPLOYEE
EXPECTATIONS NOW
INCLUDE SOCIETAL
CHANGE
2019 Edelman Trust Barometer. EMP_IMP. When considering an
organization as a potential place of employment, how important is each
of the following to you in deciding whether or not you would accept a job
offer there? Question asked of those who are an employee, but do not
run their own business (Q43/1 AND NOT Q28/7). General population
employees, S. Korea. Buckets are the sum of the average of codes 1 &
2 for the items that make up each dimension. For details on the full list of
items that went into each of the three dimensions, please refer to the
Technical Appendix.
Strong expectation
You would have to pay
me a lot more to work
for an organization that
does not offer this
Deal breaker
I would never work
for an organization
that does not offer this
Job Opportunity
My employer offers wage growth,
training, career growth and work
which I find interesting & fulfilling
Personal Empowerment
I know what is going on, I am part
of the planning process, and I have
a voice in key decisions; the culture
is values-driven and inclusive
Shared Action
My employer has a
greater purpose, and my
work has a meaningful
societal impact
57%
68%
73%
35

Percent of South Korean employees who engage in these
types of behaviors on behalf of their employer
TRUST CEMENTS THE
EMPLOYER-EMPLOYEE PARTNERSHIP
36
2019 Edelman Trust Barometer. EMP_ENG. Thinking about your current employer, to what extent do you agree with the following statements? 9-point scale; top 4 box, agree. Question asked
of those who are an employee, but do not run their own business (Q43/1 AND NOT Q28/7). General population employees, S. Korea, cut by those who trust their employer (codes 6-9) and those
who do not (codes 1-5; 99). TRU_INS. [YOUR EMPLOYER] Below is a list of institutions. For each one, please indicate how much you trust that institution to do what is right using a nine-point
scale where one means that you “do not trust them at all” and nine means that you “trust them a great deal”. Question asked of those who are an employee, but do not run their own business
(Q43/1 AND NOT Q28/7). General population employees, S. Korea. Advocacy is an average of (EMP_ENG/3-5); Loyalty is an average of (EMP_ENG/1-2); Engagement is an average of
(EMP_ENG/10-15); Commitment is an average of (EMP_ENG/6-9). See the tech appendix for a complete list of the items that went into each employee KPI dimension.
Trust advantage
Loyalty +40
Advocacy +38
Engagement +36
Commitment +35
28
64
30
70
28
66
41
76
Trust their employer
Do not trust their employer
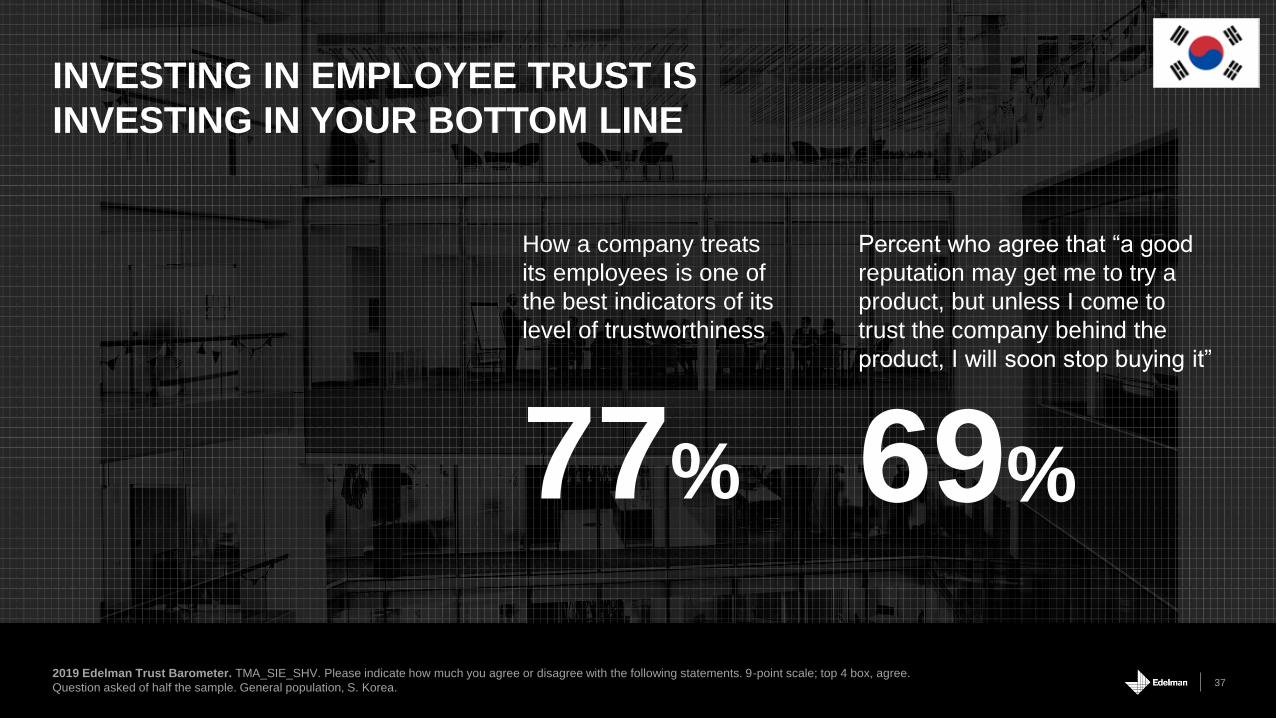
372019 Edelman Trust Barometer. TMA_SIE_SHV. Please indicate how much you agree or disagree with the following statements. 9-point scale; top 4 box, agree.
Question asked of half the sample. General population, S. Korea.
INVESTING IN EMPLOYEE TRUST IS
INVESTING IN YOUR BOTTOM LINE
Percent who agree that “a good
reputation may get me to try a
product, but unless I come to
trust the company behind the
product, I will soon stop buying it”
69%
How a company treats
its employees is one of
the best indicators of its
level of trustworthiness
77%

382019 Edelman Trust Barometer. TMA_SIE_SHV. Please indicate how much you agree or disagree with the following statements. 9-point scale; top 4 box, agree.
Question asked of half the sample. General population, 26-market average.
Percent who agree
COMPANIES CAN IMPROVE SOCIETY—AND ALSO DO WELL
73
51
62 64 65 66 67 68 70 70 71 72 72 74 75 76 76 77 77 78 78 78 80 81 82 8487
Glo
bal
26
Jap
an
Ho
ng
Ko
ng
Th
eN
eth
erl
an
ds
S. K
ore
a
Ru
ss
ia
Germ
an
y
U.K
.
Fra
nce
Irela
nd
UA
E
Au
str
alia
Tu
rkey
U.S
.
Ind
on
esia
Can
ad
a
Sin
gap
ore
Ma
lay
sia
Sp
ain
Arg
en
tin
a
Bra
zil
Ita
ly
Ch
ina
Ind
ia
S. A
fric
a
Co
lom
bia
Me
xic
o
l llllllllllllllllllllllllll+9 +3 +7 +10 0 +9 +6 +5 +12 +9 +9 +9 +20 +3 +7 +8 +11 +14 +6 +12 +5 +12 +10 +5 +17 +11 +13
“A company can take specific actions that both increase
profits and improve the economic and social conditions
in the communities where it operates”
Y-to-Y Change- +0
39
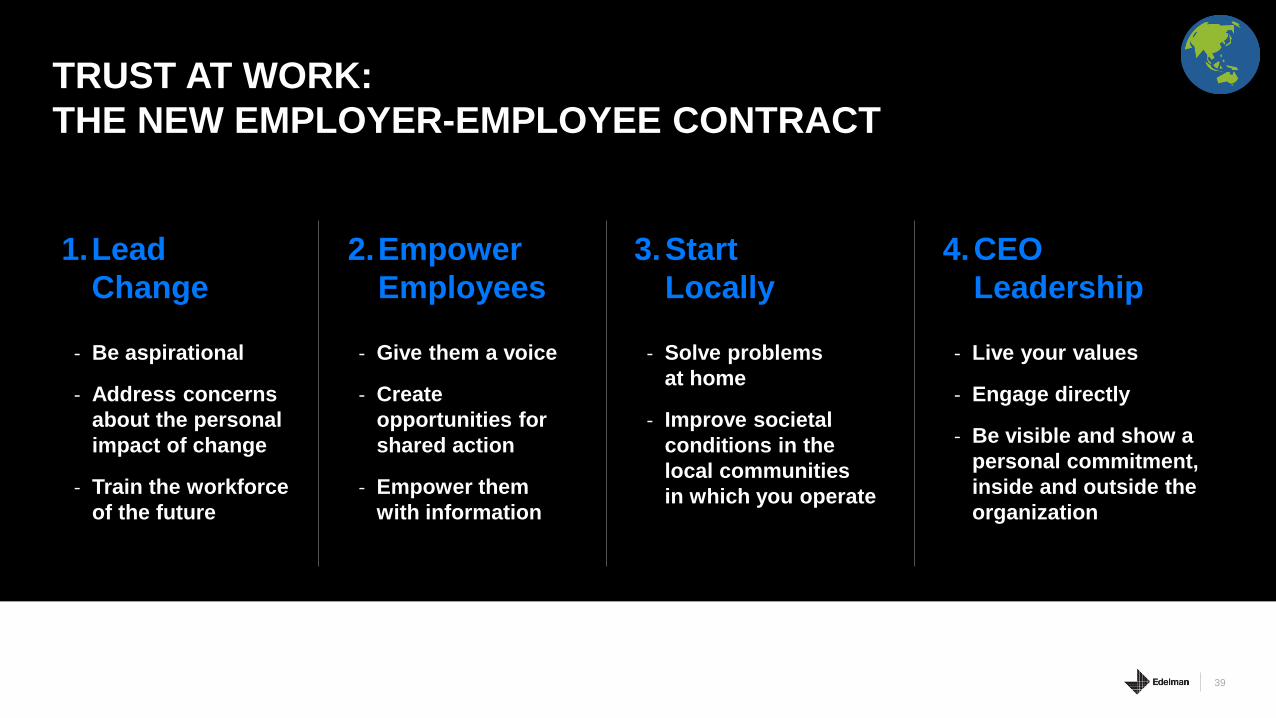
TRUST AT WORK:
THE NEW EMPLOYER-EMPLOYEE CONTRACT
1.Lead
Change
2.Empower
Employees
3.Start
Locally
4.CEO
Leadership
- Be aspirational
- Address concerns
about the personal
impact of change
- Train the workforce
of the future
- Give them a voice
- Create
opportunities for
shared action
- Empower them
with information
- Solve problems
at home
- Improve societal
conditions in the
local communities
in which you operate
- Live your values
- Engage directly
- Be visible and show a
personal commitment,
inside and outside the
organization
TRUST AT WORK:
THE NEW EMPLOYER-EMPLOYEE CONTRACT
Thank You