Embed Size (px)
Citation preview
Building Energy Efficiency Standards
2019 Building Energy Efficiency Standards ZNE Strategy
Building Standards Office:
Mazi Shirakh, PEZNE Technical LeadChristopher MeyerManager, Building Standards OfficeBill PenningtonSenior Technical and Program Advisor to the Energy Efficiency Division
BayREN forum on Household Electrification as a Pathway to On‐Site ZNE
March 30, 2017
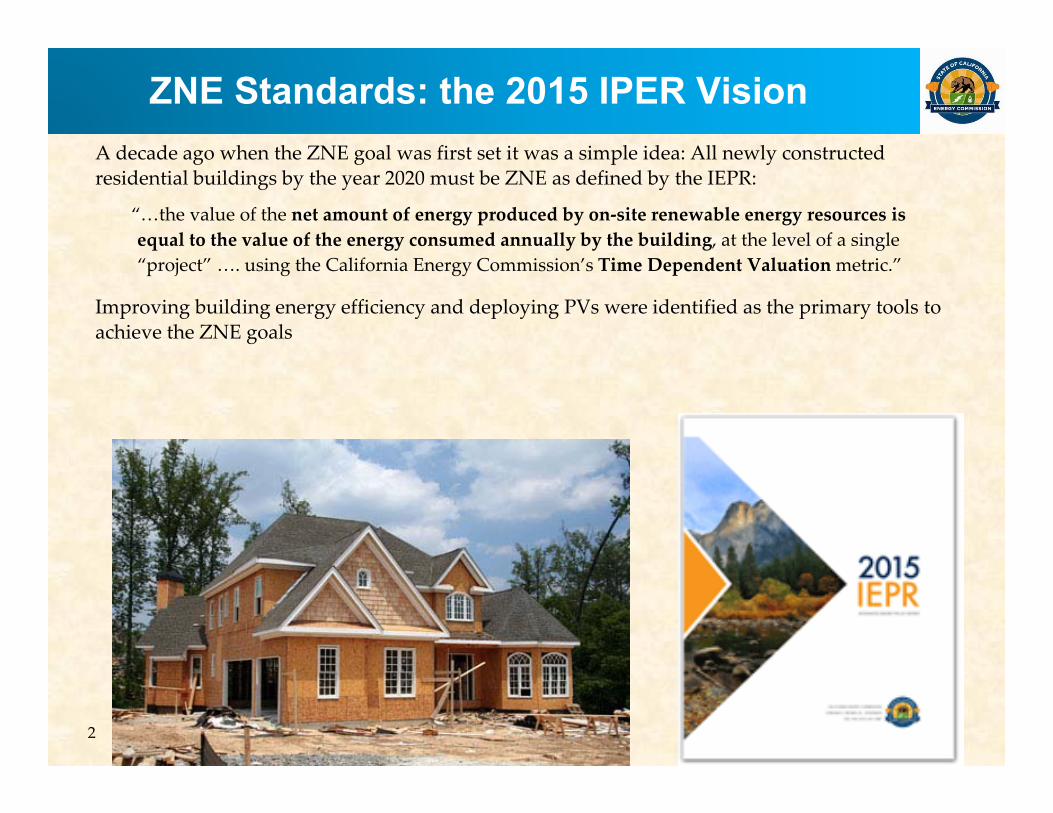
ZNE Standards: the 2015 IPER VisionA decade ago when the ZNE goal was first set it was a simple idea: All newly constructed residential buildings by the year 2020 must be ZNE as defined by the IEPR:
“…the value of the net amount of energy produced by on‐site renewable energy resources is equal to the value of the energy consumed annually by the building, at the level of a single “project” …. using the California Energy Commission’s Time Dependent Valuationmetric.”
Improving building energy efficiency and deploying PVs were identified as the primary tools to achieve the ZNE goals
2
3
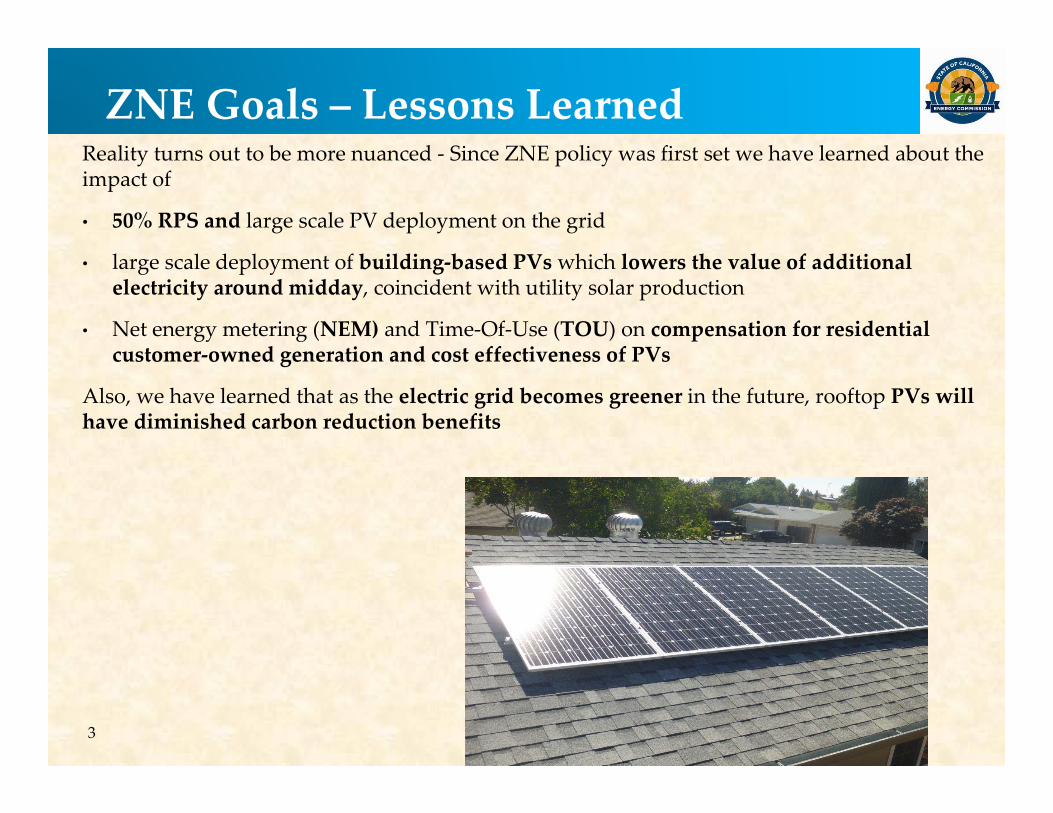
ZNE Goals – Lessons LearnedReality turns out to be more nuanced ‐ Since ZNE policy was first set we have learned about the impact of
• 50% RPS and large scale PV deployment on the grid
• large scale deployment of building‐based PVs which lowers the value of additional electricity around midday, coincident with utility solar production
• Net energy metering (NEM) and Time‐Of‐Use (TOU) on compensation for residential customer‐owned generation and cost effectiveness of PVs
Also, we have learned that as the electric grid becomes greener in the future, rooftop PVs will have diminished carbon reduction benefits
4
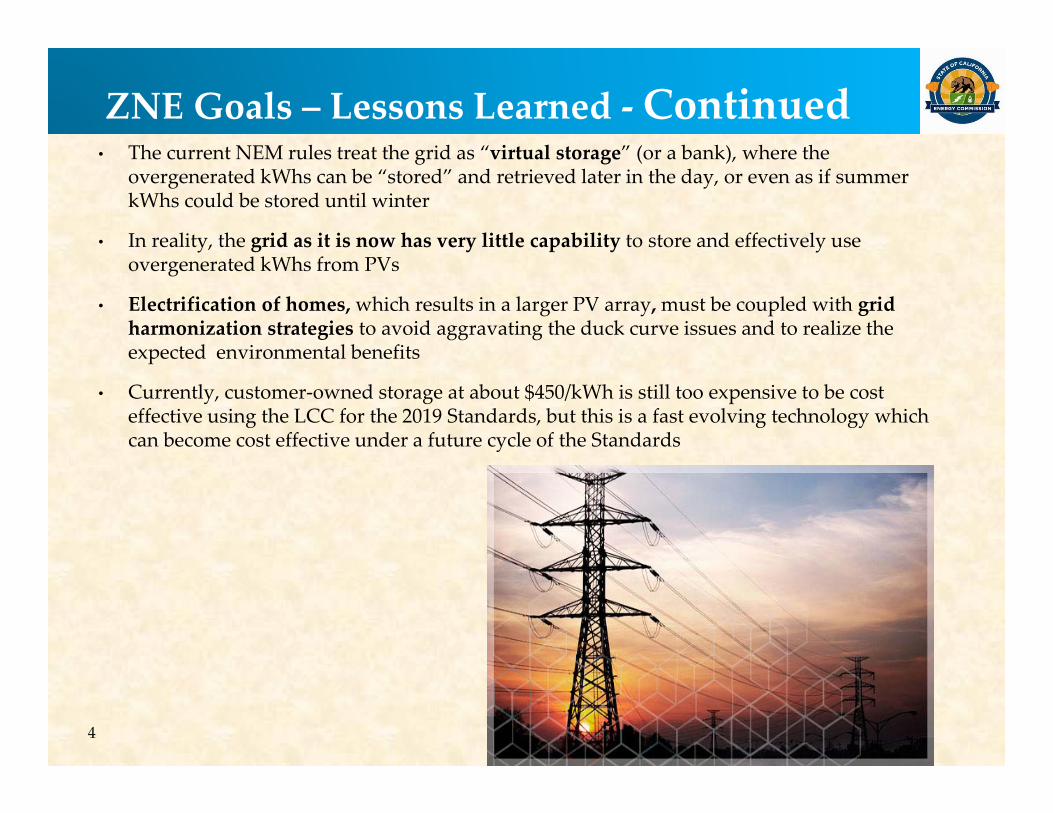
ZNE Goals – Lessons Learned ‐ Continued• The current NEM rules treat the grid as “virtual storage” (or a bank), where the
overgenerated kWhs can be “stored” and retrieved later in the day, or even as if summer kWhs could be stored until winter
• In reality, the grid as it is now has very little capability to store and effectively use overgenerated kWhs from PVs
• Electrification of homes, which results in a larger PV array, must be coupled with grid harmonization strategies to avoid aggravating the duck curve issues and to realize the expected environmental benefits
• Currently, customer‐owned storage at about $450/kWh is still too expensive to be cost effective using the LCC for the 2019 Standards, but this is a fast evolving technology which can become cost effective under a future cycle of the Standards
5
ZNE Goals – Lessons Learned ‐ ContinuedThe most important lesson is that within a few years, perhaps by 2025 grid harmonization strategies (GHS) must be coupled with customer owned PV systems to bring maximum benefits to the grid, environment, and the home owner
GHSs are strategies that maximize self‐utilization of the PV array output and minimizes uneconomic exports to the grid, examples of GHS include but not limited to battery storage, demand response, thermal storage, and EV integration.
the 2019 Standards approach must consider these issues
6
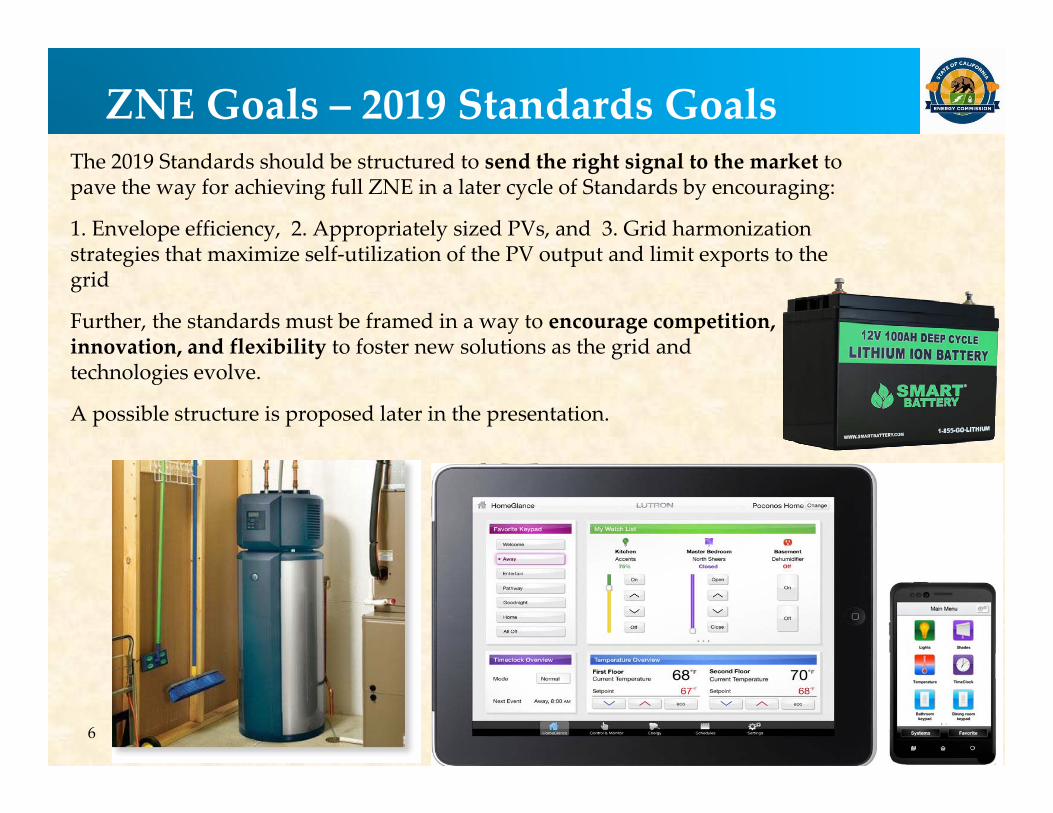
ZNE Goals – 2019 Standards GoalsThe 2019 Standards should be structured to send the right signal to the market to pave the way for achieving full ZNE in a later cycle of Standards by encouraging:
1. Envelope efficiency, 2. Appropriately sized PVs, and 3. Grid harmonization strategies that maximize self‐utilization of the PV output and limit exports to the grid
Further, the standards must be framed in a way to encourage competition, innovation, and flexibility to foster new solutions as the grid and technologies evolve.
A possible structure is proposed later in the presentation.
7
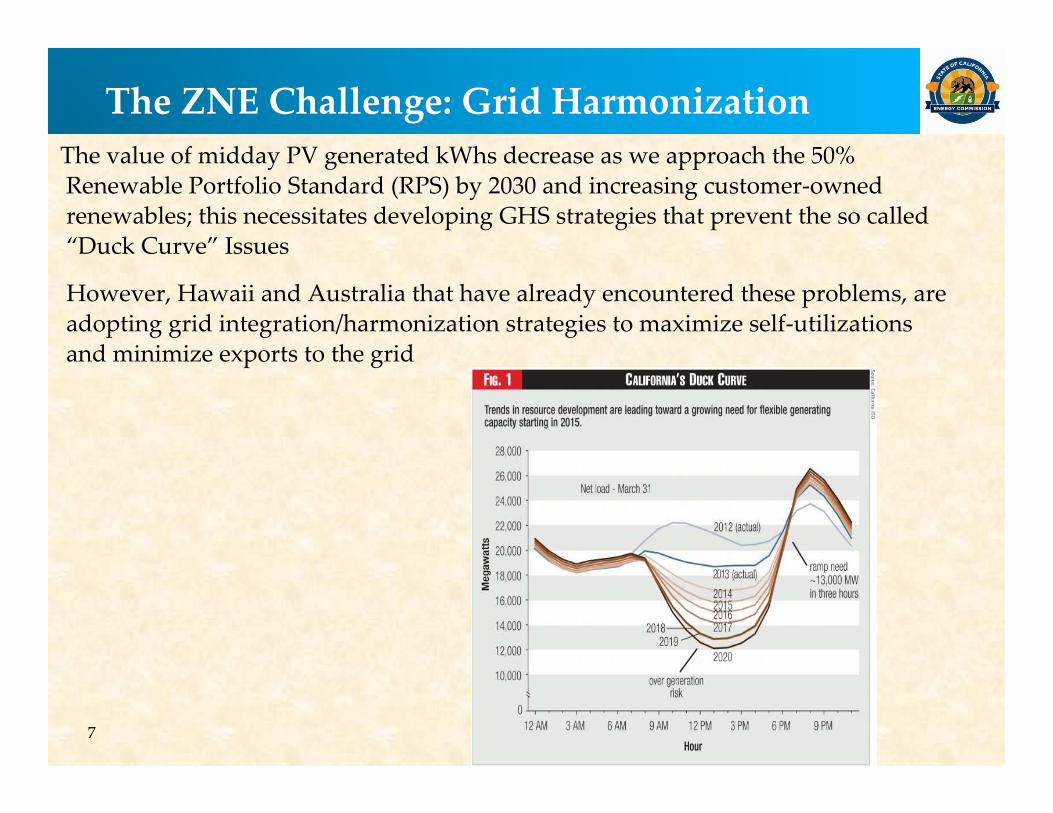
The ZNE Challenge: Grid HarmonizationThe value of midday PV generated kWhs decrease as we approach the 50% Renewable Portfolio Standard (RPS) by 2030 and increasing customer‐owned renewables; this necessitates developing GHS strategies that prevent the so called “Duck Curve” Issues
However, Hawaii and Australia that have already encountered these problems, are adopting grid integration/harmonization strategies to maximize self‐utilizations and minimize exports to the grid
8
PV Cost Effectiveness ‐ FindingsAll Standards measures , whether efficiency or renewables, must be cost effective in each CZ, using life cycle costing
Using the 2019 TDVs which captures the impact of 50% RPS by 2030, the LCC finds:
Appropriately sized PVs that displace the site kWh are found to be cost effective in all climate zones, even if the NEM2 rules are changed to compensate exported kWhs at wholesale ‐ even assuming no Federal ITC
9
Proposed 2019 Standards Approach
Energy Design Rating (EDR) targets for each climate zone:1. An EDR level for energy efficiency features based on 2019 prescriptive
measures – This EDR target can only be met using energy efficiency measures
2. An EDR Contribution for PV array that is sized to displace the annual site kWhs
3. Combine the energy efficiency EDR with the PV EDR for one final target EDR
10
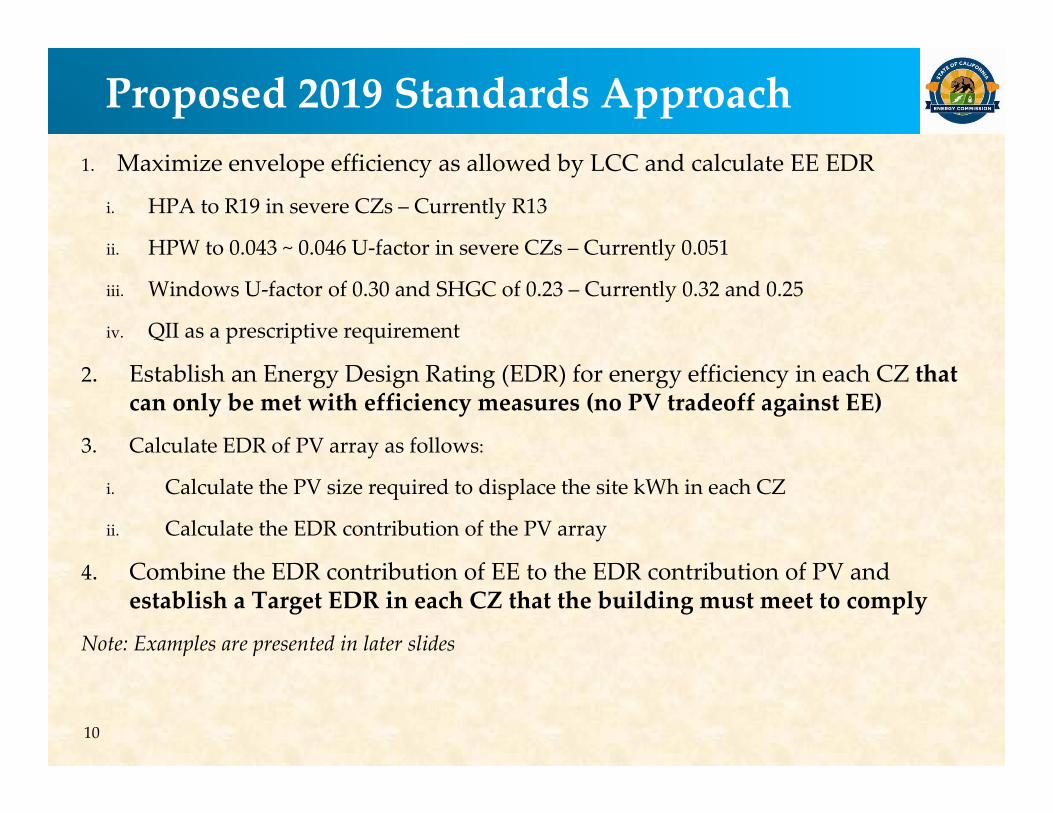
Proposed 2019 Standards Approach1. Maximize envelope efficiency as allowed by LCC and calculate EE EDR
i. HPA to R19 in severe CZs – Currently R13
ii. HPW to 0.043 ~ 0.046 U‐factor in severe CZs – Currently 0.051
iii. Windows U‐factor of 0.30 and SHGC of 0.23 – Currently 0.32 and 0.25
iv. QII as a prescriptive requirement
2. Establish an Energy Design Rating (EDR) for energy efficiency in each CZ that can only be met with efficiency measures (no PV tradeoff against EE)
3. Calculate EDR of PV array as follows:
i. Calculate the PV size required to displace the site kWh in each CZ
ii. Calculate the EDR contribution of the PV array
4. Combine the EDR contribution of EE to the EDR contribution of PV and establish a Target EDR in each CZ that the building must meet to comply
Note: Examples are presented in later slides
11
Target EDR’s Many Advantages1. A target EDR establishes a performance benchmark that the building must meet to comply; the
concept is a modern version of California’s performance standards consistent with the Warren‐Alquist Act expectation to provide builders with compliance flexibility
2. As shown by the 2016 HPA and HPW approach, builders appreciated having many options to comply, leading to a flurry of innovation in attics and walls, which continues to date
3. Similarly, the target EDR if structured correctly, can send the right signals to the market about EE, PV sizing, demand response and flexibility, and other options that can achieve ZNE in the future
4. Target EDR allows the builder to use more efficiency and less PV to get to the target; the builder can also use high performance glazing or appliances that are higher than minimum efficiency levels that we are prevented to require because of preemption
5. Target EDR can provide credit for demand response and flexibility, storage, EV integration, and other grid harmonization strategies that can achieve full ZNE in the future
6. Target EDR is fully compatible with the reach codes, local jurisdiction simply identify a lower target EDR (or zero) that can be met with a combination of additional EE, PV, demand response/flexibility, EV integration, or storage
7. Target EDR works well with varying building sizes – static PV size does not
12
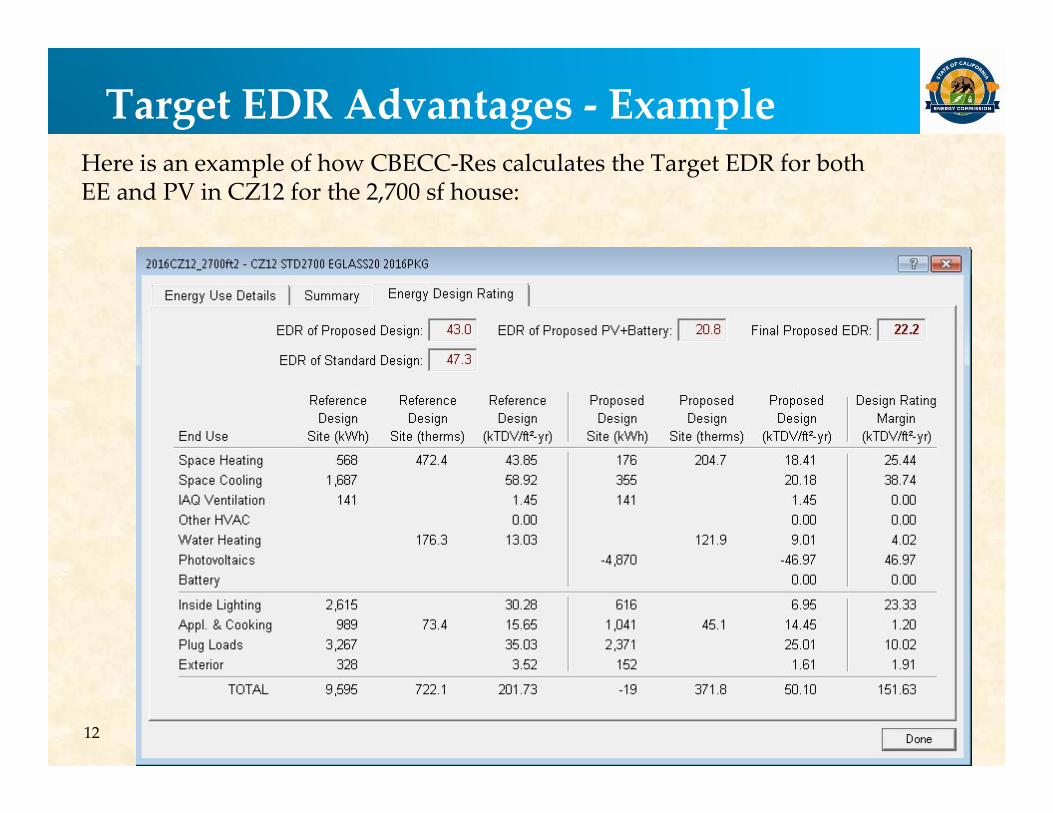
Target EDR Advantages ‐ ExampleHere is an example of how CBECC‐Res calculates the Target EDR for both EE and PV in CZ12 for the 2,700 sf house:
13
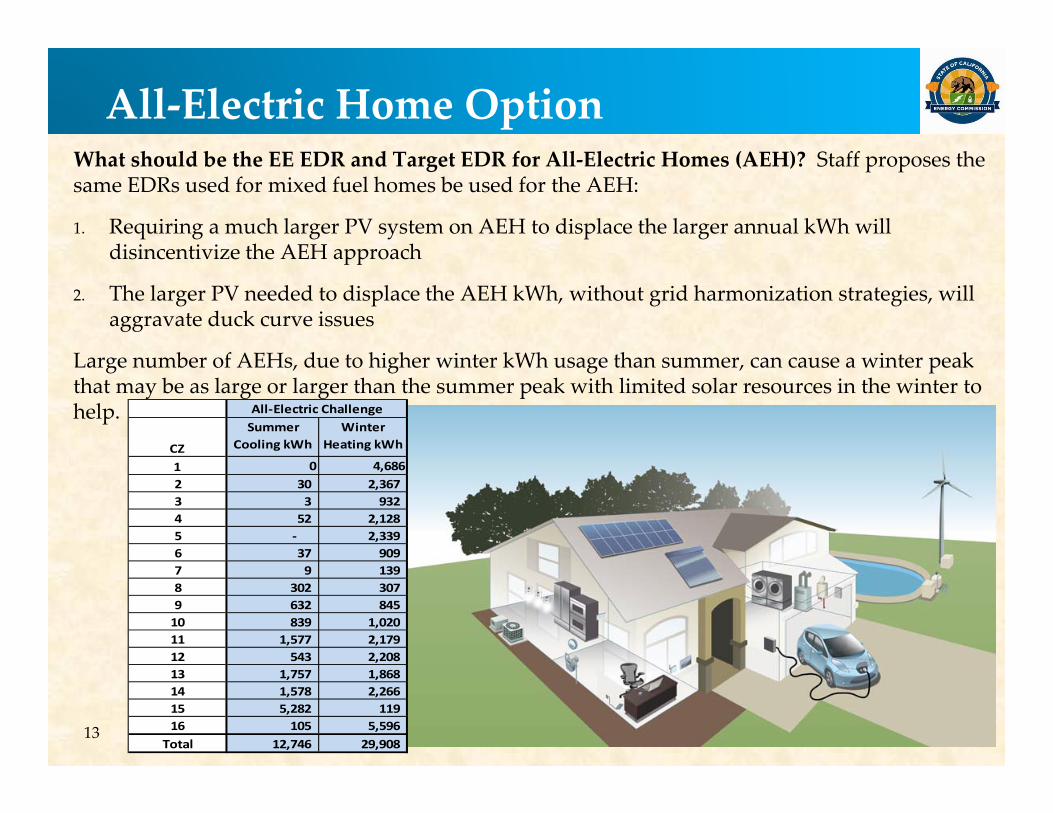
All‐Electric Home OptionWhat should be the EE EDR and Target EDR for All‐Electric Homes (AEH)? Staff proposes the same EDRs used for mixed fuel homes be used for the AEH:
1. Requiring a much larger PV system on AEH to displace the larger annual kWh will disincentivize the AEH approach
2. The larger PV needed to displace the AEH kWh, without grid harmonization strategies, will aggravate duck curve issues
Large number of AEHs, due to higher winter kWh usage than summer, can cause a winter peak that may be as large or larger than the summer peak with limited solar resources in the winter to help.
CZ
Summer Cooling kWh
Winter Heating kWh
1 0 4,686 2 30 2,367 3 3 932 4 52 2,128 5 ‐ 2,339 6 37 909 7 9 139 8 302 307 9 632 845 10 839 1,020 11 1,577 2,179 12 543 2,208 13 1,757 1,868 14 1,578 2,266 15 5,282 119 16 105 5,596
Total 12,746 29,908
All‐Electric Challenge
14
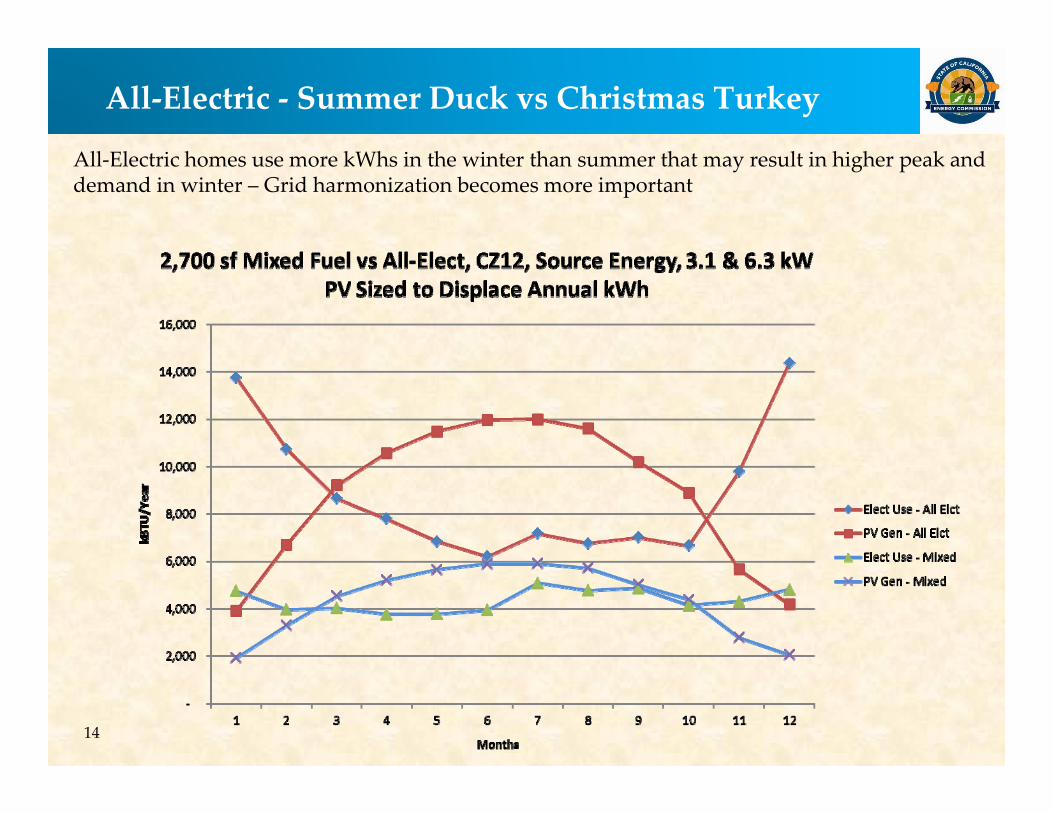
All‐Electric ‐ Summer Duck vs Christmas Turkey
All‐Electric homes use more kWhs in the winter than summer that may result in higher peak and demand in winter – Grid harmonization becomes more important
15
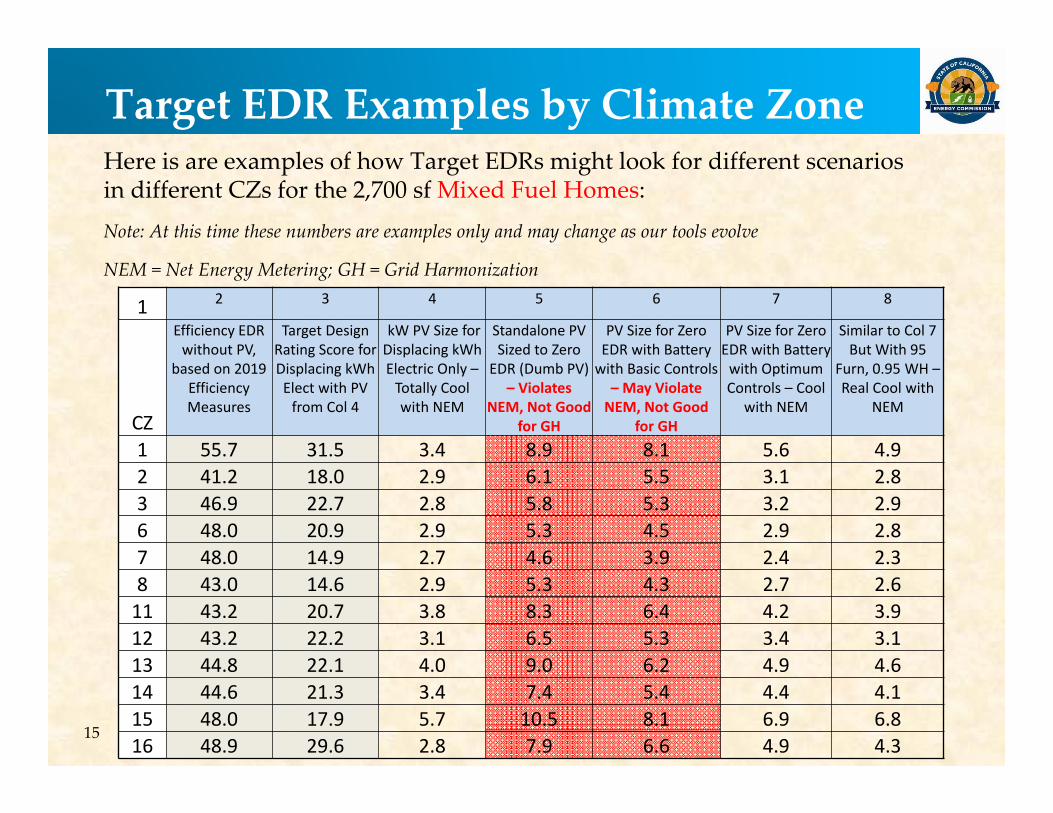
Target EDR Examples by Climate ZoneHere is are examples of how Target EDRs might look for different scenarios in different CZs for the 2,700 sf Mixed Fuel Homes:Note: At this time these numbers are examples only and may change as our tools evolve
NEM = Net Energy Metering; GH = Grid Harmonization
1 2 3 4 5 6 7 8
CZ
Efficiency EDR without PV,
based on 2019 Efficiency Measures
Target Design Rating Score for Displacing kWh Elect with PV from Col 4
kW PV Size for Displacing kWh Electric Only –Totally Cool with NEM
Standalone PV Sized to Zero
EDR (Dumb PV) – Violates
NEM, Not Good for GH
PV Size for Zero EDR with Battery with Basic Controls
– May Violate NEM, Not Good
for GH
PV Size for Zero EDR with Battery with Optimum Controls – Cool
with NEM
Similar to Col 7 But With 95
Furn, 0.95 WH –Real Cool with
NEM
1 55.7 31.5 3.4 8.9 8.1 5.6 4.92 41.2 18.0 2.9 6.1 5.5 3.1 2.83 46.9 22.7 2.8 5.8 5.3 3.2 2.96 48.0 20.9 2.9 5.3 4.5 2.9 2.87 48.0 14.9 2.7 4.6 3.9 2.4 2.38 43.0 14.6 2.9 5.3 4.3 2.7 2.611 43.2 20.7 3.8 8.3 6.4 4.2 3.912 43.2 22.2 3.1 6.5 5.3 3.4 3.113 44.8 22.1 4.0 9.0 6.2 4.9 4.614 44.6 21.3 3.4 7.4 5.4 4.4 4.115 48.0 17.9 5.7 10.5 8.1 6.9 6.816 48.9 29.6 2.8 7.9 6.6 4.9 4.3
16
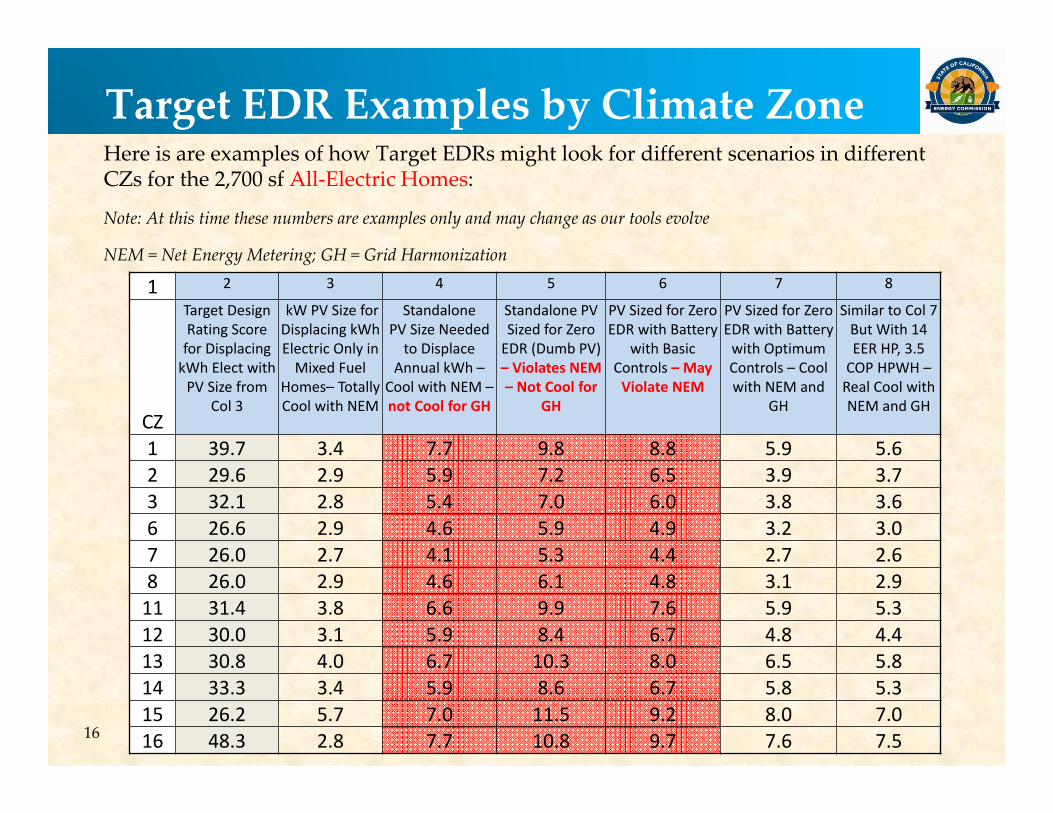
Target EDR Examples by Climate ZoneHere is are examples of how Target EDRs might look for different scenarios in different CZs for the 2,700 sf All‐Electric Homes:
Note: At this time these numbers are examples only and may change as our tools evolve
NEM = Net Energy Metering; GH = Grid Harmonization
1 2 3 4 5 6 7 8
CZ
Target Design Rating Score for Displacing kWh Elect with PV Size from
Col 3
kW PV Size for Displacing kWh Electric Only in Mixed Fuel
Homes– Totally Cool with NEM
StandalonePV Size Needed to Displace
Annual kWh –Cool with NEM –not Cool for GH
Standalone PV Sized for Zero EDR (Dumb PV) – Violates NEM – Not Cool for
GH
PV Sized for Zero EDR with Battery
with Basic Controls – May Violate NEM
PV Sized for Zero EDR with Battery with Optimum Controls – Cool with NEM and
GH
Similar to Col 7 But With 14 EER HP, 3.5 COP HPWH –Real Cool with NEM and GH
1 39.7 3.4 7.7 9.8 8.8 5.9 5.62 29.6 2.9 5.9 7.2 6.5 3.9 3.73 32.1 2.8 5.4 7.0 6.0 3.8 3.66 26.6 2.9 4.6 5.9 4.9 3.2 3.07 26.0 2.7 4.1 5.3 4.4 2.7 2.68 26.0 2.9 4.6 6.1 4.8 3.1 2.911 31.4 3.8 6.6 9.9 7.6 5.9 5.312 30.0 3.1 5.9 8.4 6.7 4.8 4.413 30.8 4.0 6.7 10.3 8.0 6.5 5.814 33.3 3.4 5.9 8.6 6.7 5.8 5.315 26.2 5.7 7.0 11.5 9.2 8.0 7.016 48.3 2.8 7.7 10.8 9.7 7.6 7.5
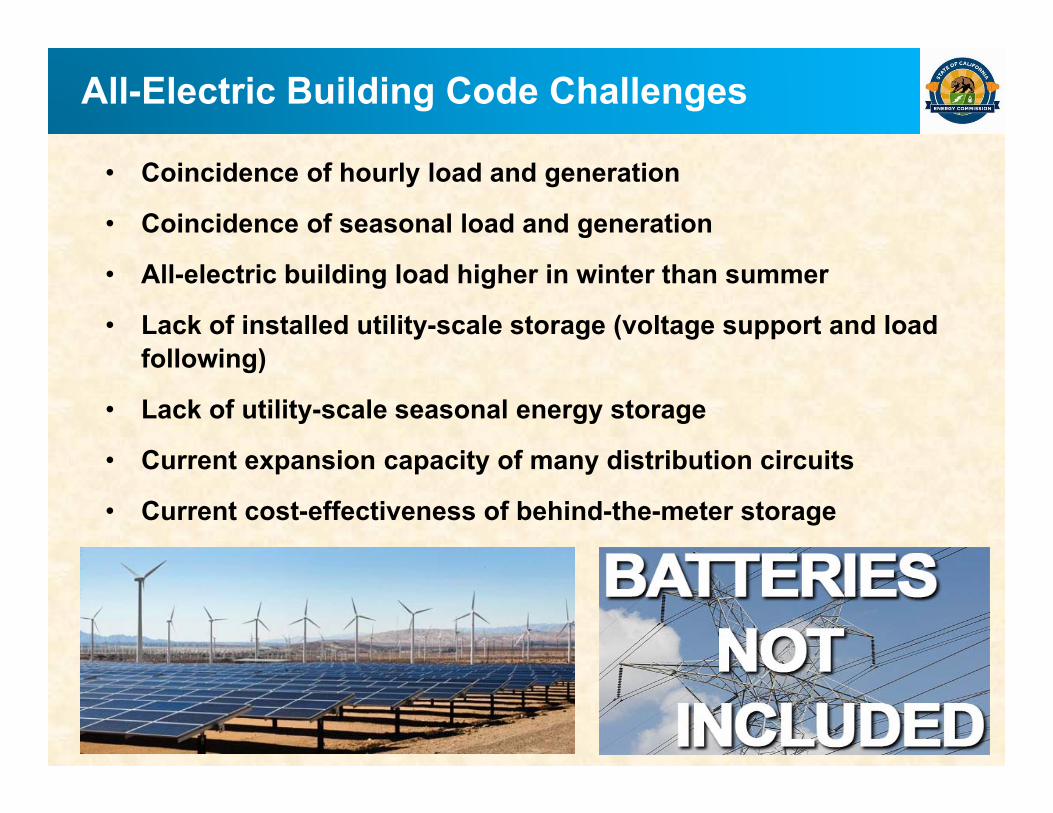
All-Electric Building Code Challenges
• Coincidence of hourly load and generation
• Coincidence of seasonal load and generation
• All-electric building load higher in winter than summer
• Lack of installed utility-scale storage (voltage support and load following)
• Lack of utility-scale seasonal energy storage
• Current expansion capacity of many distribution circuits
• Current cost-effectiveness of behind-the-meter storage
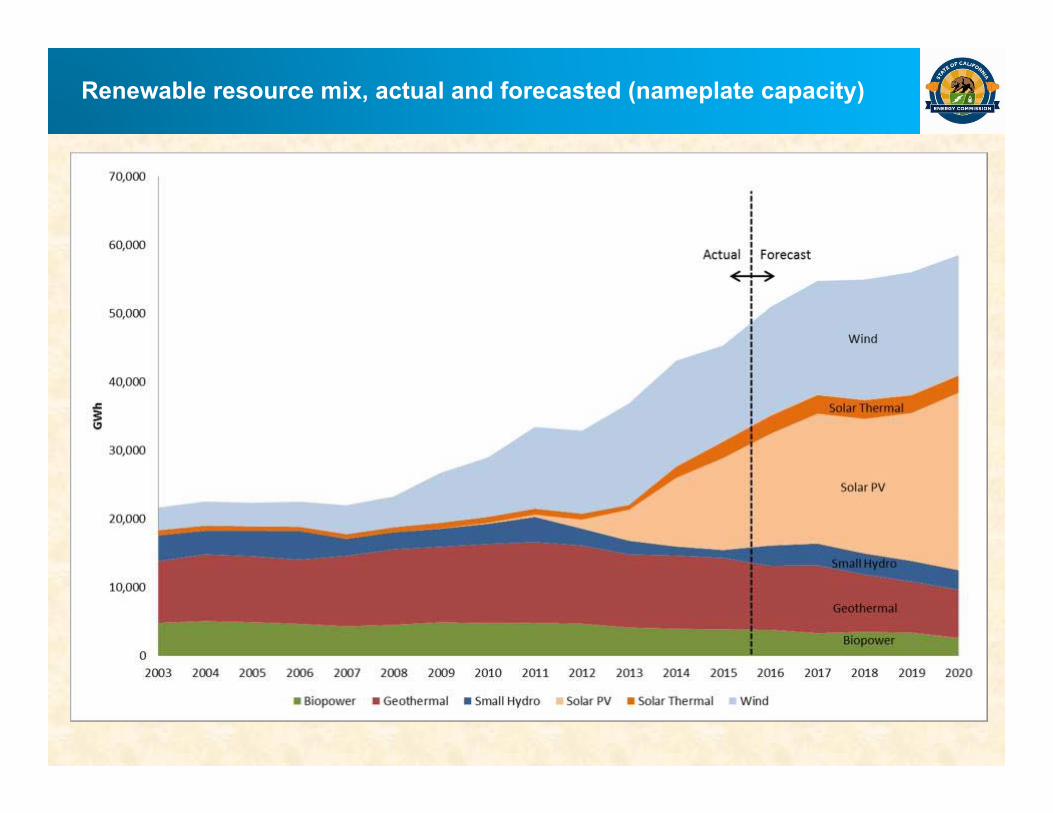
Renewable resource mix, actual and forecasted (nameplate capacity)
19
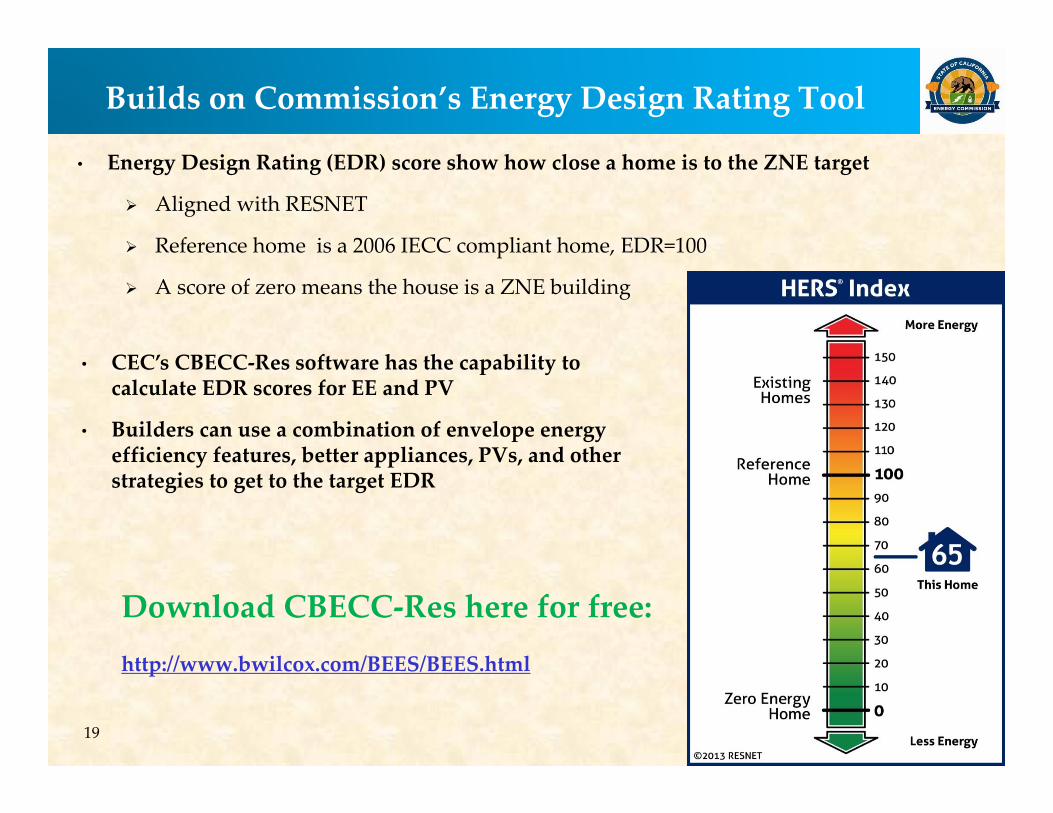
Builds on Commission’s Energy Design Rating Tool
• Energy Design Rating (EDR) score show how close a home is to the ZNE target
Aligned with RESNET
Reference home is a 2006 IECC compliant home, EDR=100
A score of zero means the house is a ZNE building
• CEC’s CBECC‐Res software has the capability to calculate EDR scores for EE and PV
• Builders can use a combination of envelope energy efficiency features, better appliances, PVs, and other strategies to get to the target EDR
Download CBECC‐Res here for free:
http://www.bwilcox.com/BEES/BEES.html
20
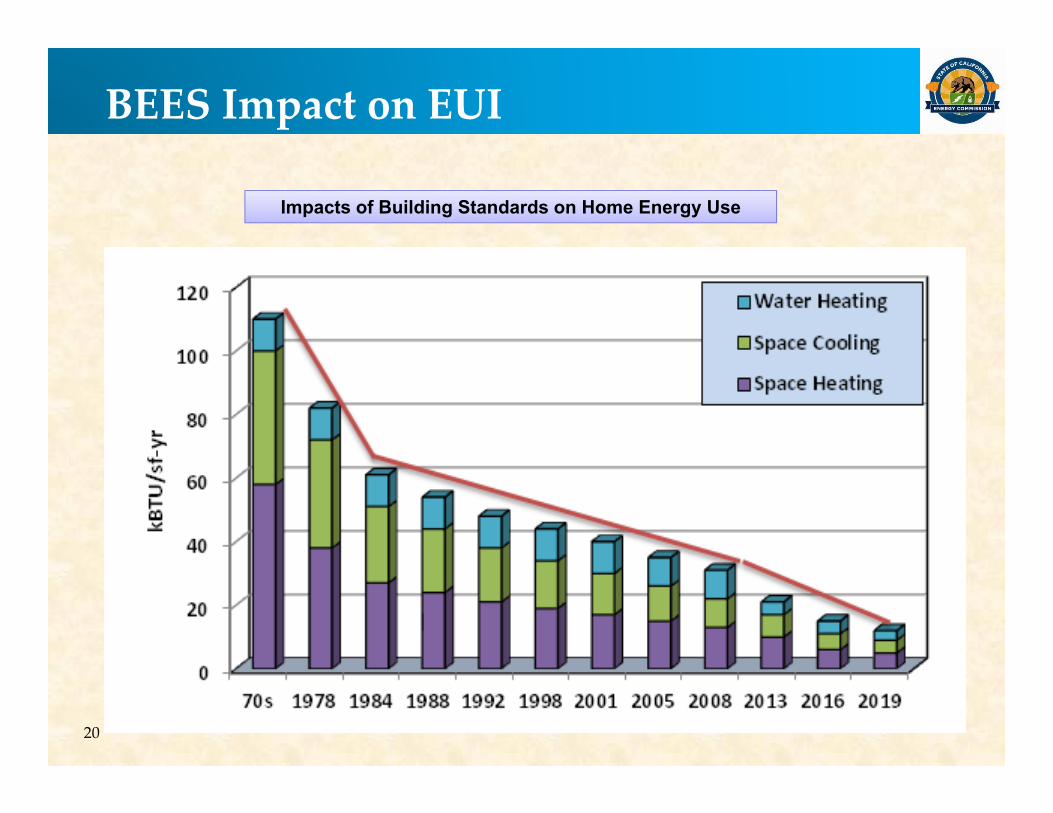
BEES Impact on EUI
Impacts of Building Standards on Home Energy Use
21
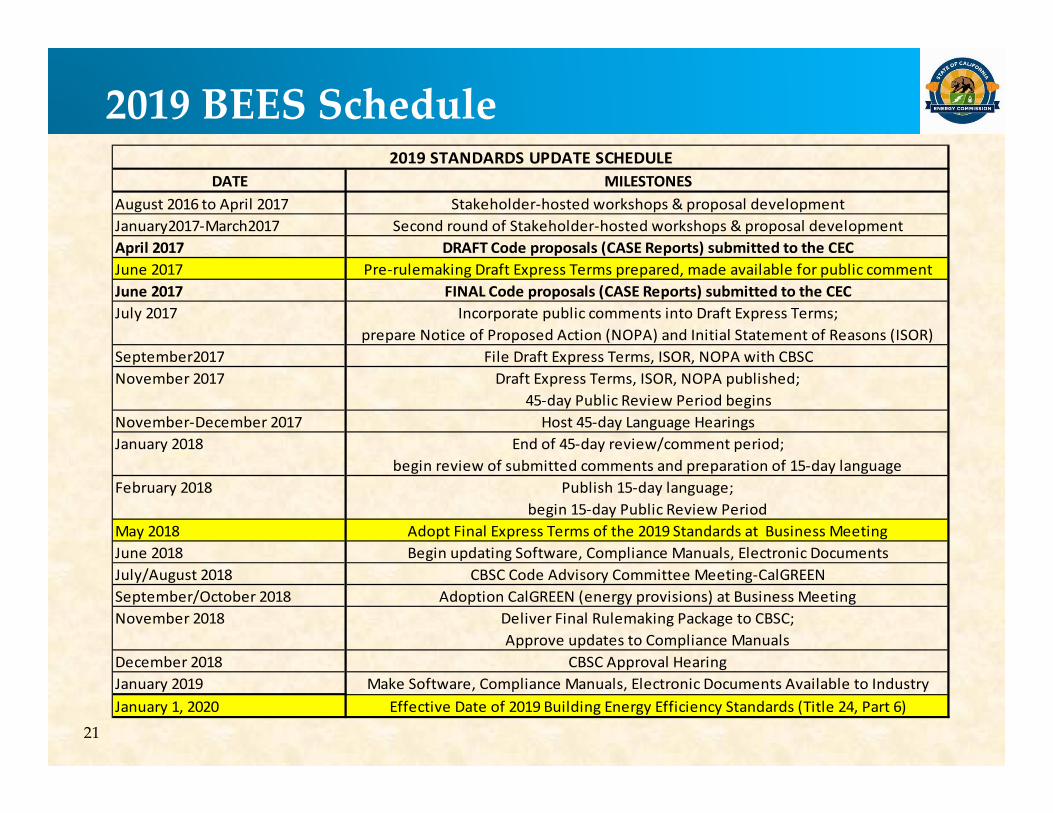
2019 BEES ScheduleDATE MILESTONES
August 2016 to April 2017 Stakeholder‐hosted workshops & proposal developmentJanuary2017‐March2017 Second round of Stakeholder‐hosted workshops & proposal developmentApril 2017 DRAFT Code proposals (CASE Reports) submitted to the CECJune 2017 Pre‐rulemaking Draft Express Terms prepared, made available for public commentJune 2017 FINAL Code proposals (CASE Reports) submitted to the CECJuly 2017 Incorporate public comments into Draft Express Terms;
prepare Notice of Proposed Action (NOPA) and Initial Statement of Reasons (ISOR)September2017 File Draft Express Terms, ISOR, NOPA with CBSCNovember 2017 Draft Express Terms, ISOR, NOPA published;
45‐day Public Review Period beginsNovember‐December 2017 Host 45‐day Language HearingsJanuary 2018 End of 45‐day review/comment period;
begin review of submitted comments and preparation of 15‐day languageFebruary 2018 Publish 15‐day language;
begin 15‐day Public Review PeriodMay 2018 Adopt Final Express Terms of the 2019 Standards at Business MeetingJune 2018 Begin updating Software, Compliance Manuals, Electronic DocumentsJuly/August 2018 CBSC Code Advisory Committee Meeting‐CalGREENSeptember/October 2018 Adoption CalGREEN (energy provisions) at Business MeetingNovember 2018 Deliver Final Rulemaking Package to CBSC;
Approve updates to Compliance ManualsDecember 2018 CBSC Approval HearingJanuary 2019 Make Software, Compliance Manuals, Electronic Documents Available to IndustryJanuary 1, 2020 Effective Date of 2019 Building Energy Efficiency Standards (Title 24, Part 6)
2019 STANDARDS UPDATE SCHEDULE
Informational Resources
• Energy Efficiency Standards approved computer compliance programs, CBECC‐Res and CBECC‐Com can be downloaded for free at: http://www.energy.ca.gov/title24/2016standards/2016_computer_prog_list.html
• Information on the current 2016 Building Energy Efficiency Standards, including Compliance Manuals, worksheets and additional resources can be found at: http://www.energy.ca.gov/title24/2016standards/index.html
• To receive documents and notification of upcoming events, please sign up on the List Serve for the 2019 Building Energy Efficiency Standards (Docket #2016‐BSTD‐06) at: http://www.energy.ca.gov/title24/2019standards/prerulemaking/index.html
• Title 24 Support Hotline: [email protected]

23
Questions?
24
Additional Information
E3 Life Cycle Costing Analysis Finds:
PV systems sized to displace site annual kWh cost effective in all climate zones
Even if NEM2 rules are changed to compensate exported kWhs at avoided cost
With no federal ITC
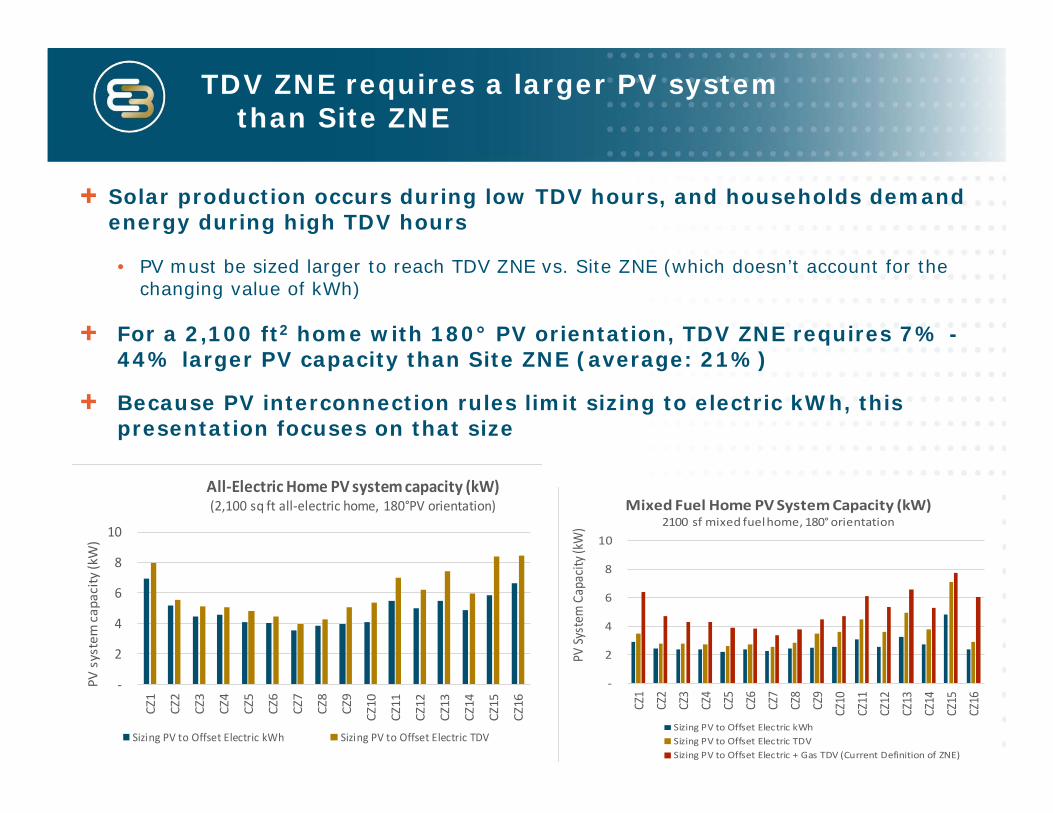
Solar production occurs during low TDV hours, and households demand energy during high TDV hours
• PV must be sized larger to reach TDV ZNE vs. Site ZNE (which doesn’t account for the changing value of kWh)
For a 2,100 ft2 home with 180° PV orientation, TDV ZNE requires 7% -44% larger PV capacity than Site ZNE (average: 21%)
Because PV interconnection rules limit sizing to electric kWh, this presentation focuses on that size
TDV ZNE requires a larger PV system than Site ZNE
25
‐
2
4
6
8
10
CZ1
CZ2
CZ3
CZ4
CZ5
CZ6
CZ7
CZ8
CZ9
CZ10
CZ11
CZ12
CZ13
CZ14
CZ15
CZ16
PV System Cap
acity
(kW)
Mixed Fuel Home PV System Capacity (kW)2100 sf mixed fuel home, 180°orientation
Sizing PV to Offset Electric kWhSizing PV to Offset Electric TDVSizing PV to Offset Electric + Gas TDV (Current Definition of ZNE)
‐
2
4
6
8
10
CZ1
CZ2
CZ3
CZ4
CZ5
CZ6
CZ7
CZ8
CZ9
CZ10
CZ11
CZ12
CZ13
CZ14
CZ15
CZ16
PV system cap
acity
(kW)
All‐Electric Home PV system capacity (kW)(2,100 sq ft all‐electric home, 180°PV orientation)
Sizing PV to Offset Electric kWh Sizing PV to Offset Electric TDV
PV Costs
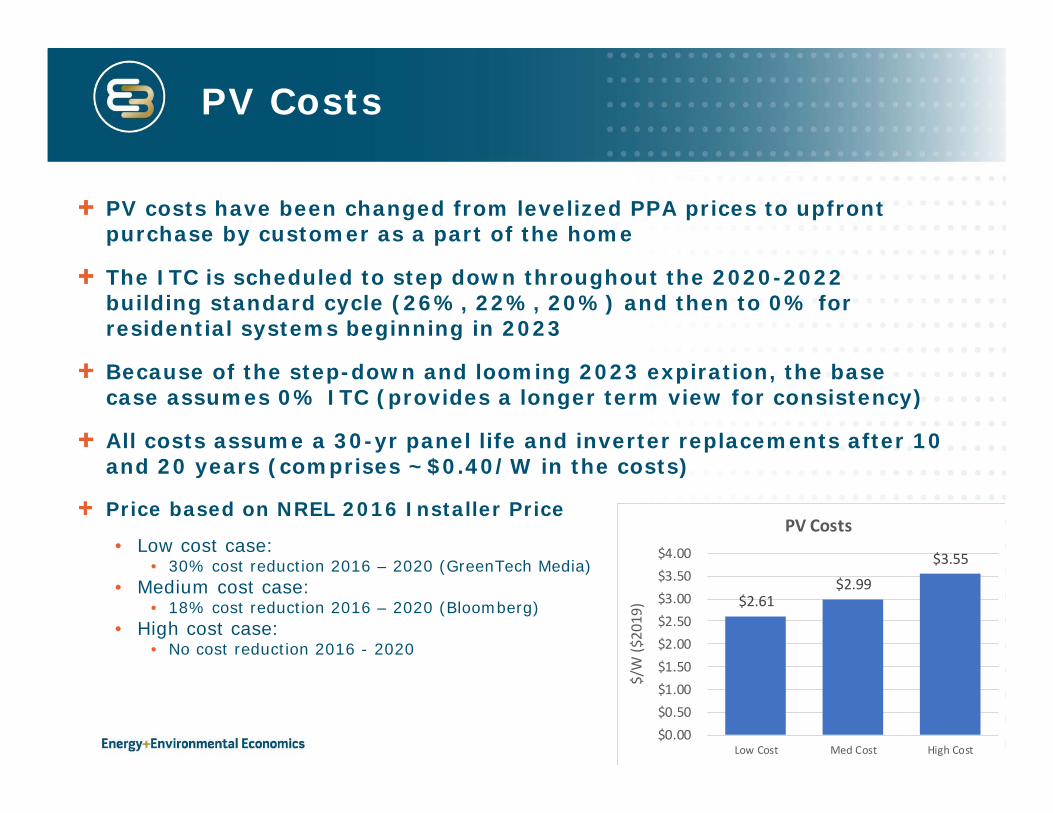
PV costs have been changed from levelized PPA prices to upfront purchase by customer as a part of the home
The ITC is scheduled to step down throughout the 2020-2022 building standard cycle (26%, 22%, 20%) and then to 0% for residential systems beginning in 2023
Because of the step-down and looming 2023 expiration, the base case assumes 0% ITC (provides a longer term view for consistency)
All costs assume a 30-yr panel life and inverter replacements after 10 and 20 years (comprises ~$0.40/W in the costs)
$2.61 $2.99
$3.55
$0.00$0.50$1.00$1.50$2.00$2.50$3.00$3.50$4.00
Low Cost Med Cost High Cost
$/W ($
2019
)
PV CostsPrice based on NREL 2016 Installer Price
• Low cost case:• 30% cost reduction 2016 – 2020 (GreenTech Media)
• Medium cost case: • 18% cost reduction 2016 – 2020 (Bloomberg)
• High cost case: • No cost reduction 2016 - 2020
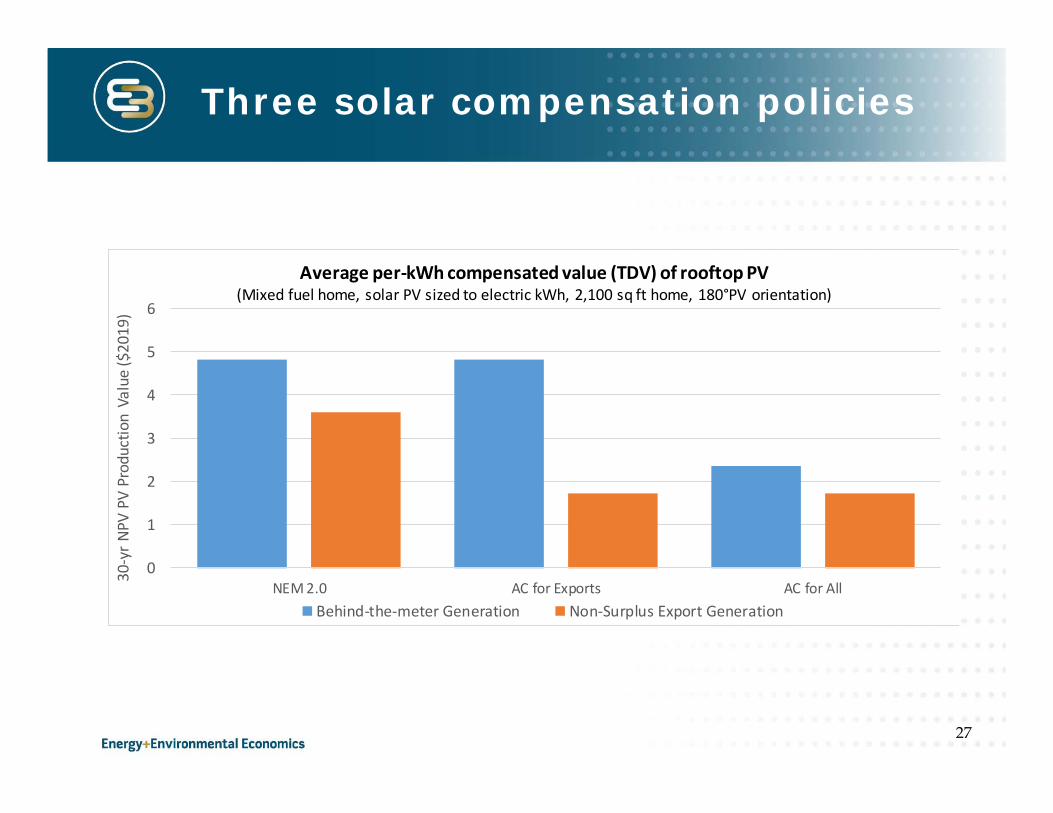
Three solar compensation policies
27
0
1
2
3
4
5
6
NEM 2.0 AC for Exports AC for All
30‐yr NPV
PV Prod
uctio
n Va
lue ($20
19)
Average per‐kWh compensated value (TDV) of rooftop PV(Mixed fuel home, solar PV sized to electric kWh, 2,100 sq ft home, 180°PV orientation)
Behind‐the‐meter Generation Non‐Surplus Export Generation
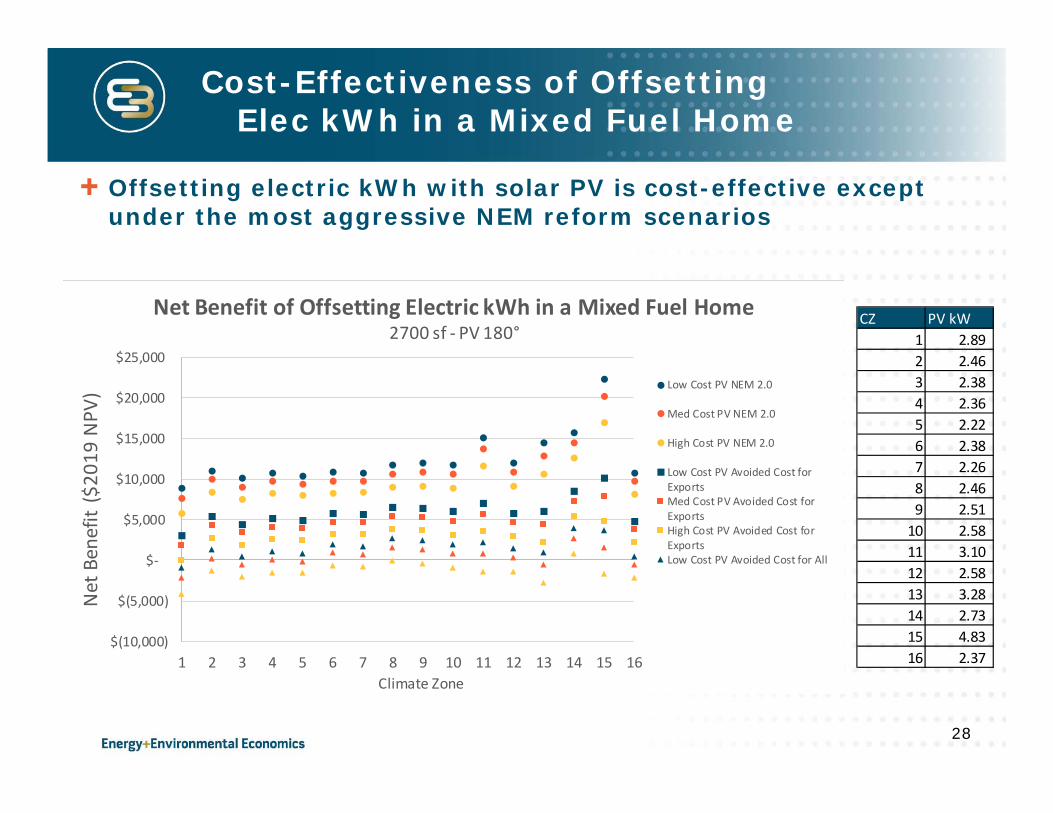
Offsetting electric kWh with solar PV is cost-effective except under the most aggressive NEM reform scenarios
Cost-Effectiveness of Offsetting Elec kWh in a Mixed Fuel Home
28
CZ PV kW1 2.89 2 2.46 3 2.38 4 2.36 5 2.22 6 2.38 7 2.26 8 2.46 9 2.51 10 2.58 11 3.10 12 2.58 13 3.28 14 2.73 15 4.83 16 2.37
$(10,000)
$(5,000)
$‐
$5,000
$10,000
$15,000
$20,000
$25,000
1 2 3 4 5 6 7 8 9 10 11 12 13 14 15 16
Net Ben
efit ($20
19 NPV
)
Climate Zone
Net Benefit of Offsetting Electric kWh in a Mixed Fuel Home2700 sf ‐ PV 180°
Low Cost PV NEM 2.0
Med Cost PV NEM 2.0
High Cost PV NEM 2.0
Low Cost PV Avoided Cost forExportsMed Cost PV Avoided Cost forExportsHigh Cost PV Avoided Cost forExportsLow Cost PV Avoided Cost for All