Embed Size (px)
Citation preview

2019Annual Reportwww.suezcement.com.eg

2
Suez Cement | Annual Report 2019
2019 Annual ReportSuez Cement Company
www.suezcement .com.eg
KM30 Maadi/Ein Sokhna RoadP.O. Box: 2691 - Cairo, Egypt

3
Contents
1. Annual Report
At a Glance, Our Vision, Our Mission 4
Shareholder Structure, Key facts 6
Suez Cement Company, Tourah Portland Cement Company, Ready Mix Beton. 7
Our History 7
CEO’s Note 8
Our Market 10
Our Board of Directors 16
Corporate Social Responsibility 17
Health, Safety & Environment 19
Our People 24
2. Financial Statements
Suez Cement Company (S.A.E)
Separate Financial Svtatements 28
Suez Cement Company (S.A.E)
Consolidated Financial Statements 66

4
Suez Cement | Annual Report 2019
44
AT A GLANCE The Suez Cement Group of Companies (Suez Cement) is Egypt’s leading producer of cement, with a production capacity of around 12 million tons per year. Since 1977, Suez Cement has manufactured and distributed the highest quality cement, aggregates and ready-mix concrete, and its products have been used to build some of Egypt’s most notable landmarks. As of 2019, Suez Cement has a 13.2% market share across Egypt, with a web of subsidiaries spanning four cement plants and 18 concrete batching units, including Suez, Kattameya, Tourah and Helwan. In addition, the Suez Cement Group has 14 operating quarries and 7 kilns. With such an expansive industrial network, the Group is afforded a degree of national exposure unmatched by competitors for its comprehensiveness and longevity. The Group’s 1,400 professionals continuously pursue innovation, providing customers at home and abroad with a suite of unparalleled services that differentiates the Group’s offering. Suez Cement is majority-owned by the HeidelbergCement Group, one of the world’s largest global cement producers, making it part of a family of organizations that represents one of the world’s most influential building materials companies and export markets.
OUR VISION To be a world-class local business building a better and sustainable future for all our stakeholders.
OUR MISSION To create value in the building materials sector through the innovative and sustainable use of natural resources for the benefit of our communities and clients.

5
5
Suez Cement | Annual Report 2017
5
2019ANNUAL REPORT

6
Suez Cement | Annual Report 2019
SHAREHOLDER STRUCTURE
KEY FACTS:
EGP 6,461 bn Total Revenues in 2019
12 mn tonsAnnual Cement Capacity
7.8 mn m2Owned Land
4 Integrated Plants
6.4 mn tons Cement Sold in 2019
1,400 Employees
EGP 388 bn EBITDA in 2019
All Plants ISO 9001, ISO 14001
and OHSAS 18001 certified
Free Float12.1%
Public Sector Entities13.4%
Arab and Foreign Investors19.4%
HeidelbergCement55.1%
HeidelbergCement Arab and Foreign Investors Public Sector Entities Free Float
13.2% Market Share in 2019

7
Suez Cement CompanyThe Suez Cement Company was established in 1977. With plants in Suez and Kattameya, the company is one of Egypt’s largest private owner producers of grey cement, with capacity to produce cement of the highest quality using whitewash and primary heating. The company’s markets include Egypt, as well as a number of Arab, African and European countries.
Plant Location Suez and Kattameya
Products produced CEM I 42,5 N; CEM II BL 32.5; SRC 42.5 N
Tourah Portland Cement CompanyThe Tourah Portland Cement Company, Egypt’s first cement company, was established in 1927. It was the first to use the dry cement production method in Egypt and licensed the country’s oldest clay quarry. It has established a number of training centers to provide technical and administrative trainings catering to the needs of the cement industry.
Plant Location Tourah
Products produced CEM I 42.5 R; Techno CEM II/A-S 32.5 R
Helwan Cement Company The Helwan Cement Company, the second cement producer to enter the Egyptian market, was established in 1929. The company is located south of Cairo and has two dry production lines in operation.
Plant Location Helwan
Products produced CEMI 42.5 R; Oasis CEMII B-L 32.5N
Ready Mix BetonEstablished in 1985, Ready Mix Beton is one of Egypt’s leading producers of ready-mix concrete. Suez Cement Company has owned 52% of Ready Mix Beton since 2006. Together with the ready-mix company Decom, Ready Mix Beton produces more than 1.2 million cubic meters of concrete and holds a 16% market share.
OUR HISTORY Suez Cement Company has been building foundations for the construction of Egypt’s most essential infrastructure for four decades, making it the largest grey cement producer in the country.
2001 Italcementi Group enters the Egyptian market2005 Suez Cement Company acquires 99% of Helwan Cement Company2006 Suez Cement Company acquires Ready Mix Beton & DECOM2007 Suez Cement Company acquires 51% of Hilal Cement (Kuwait)2016 Suez Cement Company becomes part of Heidelberg Cement Group2018 Suez Cement Company sells Suez Bags2019 Temporary cease of cement production activities in Tourah company

8
Suez Cement | Annual Report 2019
CEO’S NOTEThere’s no denying that 2019 was the most challenging year the cement industry has ever witnessed in its recent years, deepening the downturn of Egypt’s cement sector as excessive oversupply and very intense competition, coupled with a continuous slowdown in demand for cement during the last 3 years have put the industry into an official recession. Cement sold was down by 5% y-o-y to 48.8 million tons, same level as year’s 2011, similarly, prices fell to historical lows in 2019 dropping by around 8.5% y-o-y, underpinned by a production surplus of c. 35 million tons by year-end. Against this backdrop, revenues for Suez Cement came in at EGP 6.5 billion in 2019, down 13.0% year-on-year which trickled down to a net loss for the fifth consecutive year, reaching EGP 1,178.6 million in 2019, compared to a net loss of EGP 1,318.3 million in 2018, yet including c. EGP 447 million one-off costs attributed to the restructuring process, as well as c. EGP 178 million one-off impairments.
The Group sold 6.44 million tons of cement and clinker in 2019 compared to 6.98 million tons in 2018, representing a decrease of 8% y-o-y. The continuous drop in individual purchasing power, has led to fewer private contracting projects, accompanied by the slowdown in Government’s and mega projects have in turn caused an inevitable fall in the demand for cement. Macroeconomic policy changes have directly impacted the cement industry over the last half-decade, with fast growing input prices on the back of continuously decreasing fuel and electricity subsidies and the EGP float in November 2016. These factors, alongside the 2019 imposition of a tax on the limestone used in the manufacture of cement and a new real estate tax imposed on factories, have increased our production costs by almost three-fold and put significant pressure on our margins. Despite these cost pressures, during the last quarter of 2019 we have successfully reduced our variable expenses by 11% y-o-y and narrowed our net losses significantly.
While some believe that the solution to current industry challenges is to encourage export activity through incentives, the transportation cost for cement is exceptionally high due to its weight. Moreover, like Egypt, neighboring markets have been experiencing a domestic production surplus and are screening potential export markets and so increasing competition. These markets have the advantage of a low cost of production, resulting in exporting their cement at approximately USD 12 per ton lower than their Egyptian counterparts, as Egyptian cement has limited export opportunities.
Despite these ongoing difficulties, our market share recorded 13.2% in 2019, enabling Suez Cement to maintain its leading position within Egypt’s cement space and positioning it for significant gains once the market recovers.
As we continue to adjust our strategies and streamline operations, we remain committed to maintaining the quality of the Group’s health and safety standards. As one of the safest companies in the sector, Suez Cement persisted in promoting safe work practices in its facilities in 2019, maintaining operations in line with international best practices and ensuring the safety and health of every one of our valued employees.
In line with Suez Cement’s commitment to prioritizing the well-being of its employees and surrounding communities, all plants achieved zero lost time injuries during 2019, and the Group succeeded in receiving ISO 45001 certification. When it comes to environmental preservation, the Group seeks to consistently adhere to local regulations and minimize the environmental impact of our operations. In 2019, Suez Cement utilized biomass and refuse-derived fuels to power cement production, with a total substitution rate of 16.5%. The use of these alternative energy sources is mainly concentrated in Kattameya, Suez and Helwan Plants.
Driven by its continued commitment to improving the quality of life and well-being of members of the communities it operates in, Suez Cement further strengthened its social responsibility initiatives in 2019, focusing on the basic needs of the local communities, as well as the education and health of the community members. During the year, the Group also worked on improving relationships with stakeholders through dialogue and cooperation. Through these initiatives, Suez Cement aims to promote the principle of giving back to the community, encouraging its workers to adopt this approach through volunteer opportunities as a mean to achieving sustainable development goals.

9
We expect the market to remain challenging in 2020 as the new capacities added to the market in the past two years continues to put downward pressure on an already uneconomical cement sector. Moreover, the current inflationary environment from energy price hikes has put further pressure on margins. On the positive side, interest rate cuts in 2019 should translate into increased private and government sector investments, which may see a recovery in the demand for cement over the medium to long term. However, in the absence of a solution to the current excessive oversupply of cement we do not see any significant change from the current climate.
However, our group, after completing the restructure, has improved our cost base and we expect our results in 2020 to improve compared to previous periods.
To conclude, I would like to express my utmost appreciation and gratitude to our valued shareholders, loyal customers and our dedicated employees who consistently put forth their best efforts for the sustainability of the Group. In addition, our esteemed Board of Directors has been instrumental in guiding our execution of the strategies that will keep us resilient in this challenging climate and ensure the Group’s long-term success.
José Maria MagrinaCEO

10
Suez Cement | Annual Report 2019
OUR MARKETEgypt’s cement industry primarily serves the country’s construction sector, which has witnessed a number of contradictory developments since the government began implementing a wide-ranging program of economic reforms in 2016. Despite this, the cement sector remains central to the government’s economic agenda, ensuring the availability of medium- to long-term contracts. However, contractors have experienced considerable pain due to rising costs as a result of the removal of fuel subsidies and the flotation of the Egyptian pound. In addition to weakening demand, the cement market has faced significant problems of significant oversupply resulting in intensifying disruptive competition.
Despite these market trends, major construction developers have been somewhat shielded from the adverse effects of the economic reform program, growing their portfolios and accelerating their investment prior to the devaluation of the Egyptian pound. Additionally, increased public expenditure on infrastructure and national housing programs have spurred increased demand for Ready Mix and Asphalt.
Demand for cement and other construction materials continues to be driven by three sectors:
Infrastructure activity accounts for 30% from the total cement consumption at the national level due to the construction of several urban megaprojects, including the New Administrative Capital, East Kantara Power Station, East Kantara Water Purification Plant, water and sewage stations and extensions to the national road system. The Armed Forces Engineering Authority remains the main contributor in all segment activities.
Residential real estate development consumes 50% of total cement production in Egypt. Investors and developers in the segment have sustained construction on existing projects and launched several new ones in partnership with the Armed Forces to stimulate the economy. Many developments are located in new urban areas such as the New Capital, New Alamein City and New Mansoura City.
Non-residential real estate development accounts for 20% of total cement construction, with demand being driven by the health and education sectors, as well as the numerous administrative and governmental building construction taking place at the New Administrative Capital.
OUR MARKET

11
Our StrategySince the devaluation of the Egyptian pound in late 2016, cement and related products among the industry’s leading consumers fell steadily in the face of significant inflationary pressures. As this crisis reaches its fourth year, the cement industry has been weighed down significantly as it works to formulate potential solutions. The most acute crises hitting the industry is an extreme oversupply of cement while demand drops 5% annually, thus taking the production surplus in the market up to around 33 million tons.
As a leader in the Egyptian cement industry, Suez Cement has undoubtedly been impacted by the unfavorable macro environment. To shield the Group from persistent industry headwinds, management has developed a strategy designed to strengthen the Group’s business model so that its operational and financial performance remains robust in the face of these headwinds while positioning the group to capitalize off the future market recovery.
Management has adopted a comprehensive restructuring process to maximize efficiency while prioritizing Suez Cement’s ability to grow and maintain its market leadership over the long run, safeguarding quality and ensuring that the Group is able to generate maximum value for its stakeholders.
This approach involves an extensive reorganization of Suez Cement operations, requiring a number of difficult yet necessary decisions that will ensure the Group’s long-term growth. Comprehensive cost-reduction has been at the forefront of the strategy and no aspect of the organization has been untouched by these efforts. We are concentrating all our efforts on our main business and have disposed of non-core operations. Although a difficult decision, this drastic pivot has allowed the Group to direct all proceeds, totaling EGP 686 million, to sustain our operations by funding capital expenditures and continued restructuring costs, shielding the Group from further deterioration in market conditions.
These same circumstances also informed Suez Cement’s decision to temporarily cease operations at Tourah Portland Cement in light of negative medium- to long-term market forecast. The estimated annual savings from the temporary closure totals around EGP 180 million, demonstrating the Group’s prioritization of protecting shareholders’ interests and safeguarding the enterprise’s value.
On the ground, Suez Cement is taking further steps to safeguard the sustainability of its business model. By decreasing the cost of production in electricity and fuel consumption, and focusing on local petroleum coke (petcoke) despite quality challenges, to acquire logistical benefits, the Group has been able to reduce costs while minimizing the environmental impact of the Group’s operations.
In the midst of these changes, management recognizes the importance of maintaining a culture of inclusivity and accountability within the Group, delegating responsibility to relevant staff wherever possible, encouraging employees on the ground to take initiative and engage in informed risk-taking and innovation. Another area where the Group is making progress is in releasing new products operating advanced technology, like supplying cement to some projects in New El-Alamein and the New Administrative Capital, where advanced construction methods are applied.
To strengthen client communication and deepen its position as a market leader, Suez Cement launched several loyalty programs during the year, including organized trips awarded to top customers and the ‘Primo Program’, which awards existing clients with points for purchasing the Group’s products that can be redeemed with shopping coupons.

12
Suez Cement | Annual Report 2019
Management Discussion & Analysis
Consolidated Operating Results
Summary Income Statement | EGP mn 31-Dec-19 31-Dec-18 YoY ChangeRevenues 6,461.1 7,428.4 -13.0%
Gross Profit (62.9) 625.6 -110.1%
Gross Profit Margin -1.0% 8.4% pts (9.4)
*EBITDA (387.7) 681.9 -156.9%
EBITDA Margin -6.0% 9.2% pts (15.2)
Net Profit (1,178.6) (1,318.3) 10.6%
Net Profit Margin -18.2% -17.7% pts (0.5)
(*) After eliminating non-cash and exceptional items
Revenues
FY19 Consolidated Revenues
EGP 6,461.1 mnYoY Revenue Growth in FY19
13.0%Consolidated revenues dropped 13.0% y-o-y to EGP 6,461.1 million in 2019 from EGP 7,428.4 million in 2018, mainly driven by price and volume decreases in cement and concrete ready mix.
Cement and clinker sales recorded EGP 4,631.8 million in 2019, down by 13.1% y-o-y from EGP 5,332.7million in 2018, representing 71.7% of total revenues in 2019. Concrete ready-mix sales decreased 12.7% y-o-y in 2019 to post EGP 1,829.3 million versus EGP 2,095.6 million in 2018, and so contributing by 28.3% to total revenues in 2019.
Cost of salesCost of sales decreased 4.1% y-o-y in 2019 to EGP 6,524.0 million from EGP 6,802.8 million in 2018, mainly due to the absence of Tourah Portland Cement Company, since stopping plant operations in June 2019. In the aftermath of the government’s structural financial reforms, the cost of fuel, electricity, raw materials and quarries’ fees increased dramatically. However, management succeeded in partially offsetting this increase by implementing strict saving policies in wages, salaries and lower depreciation expenses.
Cost of sales expense | EGP mn 31-Dec-19 31-Dec-18 YoY Change Fuels 1,537.5 2,084.1 -26.2%
Raw Material and Quarries rents 1,851.0 1,978.7 -6.5%
Electricity 858.2 835.7 +2.7%
Wages and Salaries 481.7 538.7 -10.6%
Fixed Assets Depreciation 419.4 429.2 -2.3%
Maintenances 394.4 395.7 -0.3%
Other 981.8 540.7 +81.6%
Total cost of sales 6,524.0 6,802.8 -4.1%

13
Gross Profit
Despite the measures undertaken by management, the Group recorded a gross loss of EGP 62.9 million, representing a -1.0% gross margin in 2019, compared to a gross profit of EGP 625.6 million in 2018.
General and administrative expenses
General and administrative expenses increased by 9.8% to EGP 521.8 million in 2019 compared to EGP 475.0 million in 2018.
General and administrative expense | EGP mn 31-Dec-19 31-Dec-18 YoY ChangeSalaries 218.6 183.5 +19.1%
Technical assistance fees 87.6 95.6 -8.3%
Expenses restructuring - social costs 50.5 48.3 +4.5%
Other general and administrative expenses 165.1 147.6 +11.9%
Total general and administrative expenses 521.8 475.0 +9.8%
Net Loss
FY19 Consolidated Net Loss
EGP 1,178.6 mnNet Loss Margin in FY19
18.2%Net loss recorded EGP 1,178.6 million in 2019, up from a net loss of EGP 1,318.3 million in 2018, mainly due to improved operational results and the implementation of cost reduction policies. In 2018, the company booked a one-off gain from the sale of Suez Bags Company (EGP 103 million) and a one-off gain from El Minya operations (EGP 28 million) for a total of EGP 131 million (reclassified as discontinued). It also booked a one-off loss due to impairment of goodwill for Helwan Cement Company (EGP 1,540 million). In 2019, the Group booked a one-off gain from the sale of El Minya (EGP 316 million) and a one-off loss due to impairment of goodwill for Hilal Cement Company (EGP 177 million).

14
Suez Cement | Annual Report 2019
Working Capital
Net working capital stood at EGP 765.9 million as of 31 December 2019, higher than EGP 652.3 million as of 31 December 2018. The increase is mainly due to lower advances from customers and lower trade payables. The cash conversion cycle increased to 57.0 days as of 31 December 2019 versus 48.3 days as of 31 December 2018.
Working Capital | EGP mn 31-Dec-19 31-Dec-19
Inventory 1,441.3 1,534.2
(DOH) Cost of cost of sales 110.6 112.3
Accounts and notes receivable 498.0 523.9
(DOH) Revenues 28.1 25.7
Prepayments and others 709.2 833.6
(DOH) Revenues 40.1 41.0
Trade payables 1,263.4 1,356.3
(DOH) Total cost of sales 87.1 83.3
Advances from customers 619.3 883.1
(DOH) Total cost of sales 34.6 47.4
Net Working Capital 765.9 652.3
Cash Conversion Cycle 57.0 48.3
Fixed Assets additions
Fixed asset additions throughout the year amounted to EGP 478 million, while depreciation amounted to EGP 448.0 million during the same period.
Net Financial Position
Net Debt | EGP mn 31-Dec-19 31-Dec-18Medium term loans (83.8) (93.4)
Bank overdraft (1,517.5) (427.4)
Total Debt (1,601.3) (520.8)Cash on hand and at banks 743.4 798.1
Net Financial Position (857.9) 277.3
The net financial position reached EGP 857.9 million in 2019, EGP 1,135 million below 2018 as a result of the increase in bank overdrafts and lower cash on hand and at banks, which was necessary to strengthen the Group’s business model in the face of continuing market pressures.

15
Investment Highlights
As a part of the Group’s target to increase the utilization of alternative fuels, Suez Cement started the operation of refuse derived fuels/biomass feeding systems in the main burner for Helwan L1&2 and Kattameya plants at a total investment cost of EGP 75 million. The project includes new alternative fuel storage in the Helwan plant equipped with all protective measures, in line with civil defense requirements and international construction standards.
Following successful initiatives to decrease specific heat consumption, Suez Cement modified the cooler at its Kattameya plant to install a fixed inlet at a total investment of EGP 9 million. This included necessary modifications to increase cooler efficiency and minimize clinker temperature, which resulted in the decrease of specific heat consumption at the Kattameya plant by 20 kcal/kg clk.
New alternative sources of electrical energy have been explored, including waste heat recovery projects and a 20 MW solar energy facility at the Suez plant. A power purchase agreement for the solar facility is under way and will be executed upon receiving necessary regulatory approvals. The project will be executed on a build, own, operate, transfer (BOOT) basis with a discounted price per grid. The target is to proceed in the same objective with adding the possibility of waste heat recovery projects in 2020.
Outlook
As we move into 2020, the Group is continuously taking steps to ensure its business model remains resilient in the face of continuous industry challenges. We expect the market to remain challenging in 2020 as new capacities added in the past two years continue to put downward pressure on an already uneconomical cement sector.
Moreover, the current inflationary environment from energy price hikes has put further pressure on margins. On the positive side, interest rate cuts in 2019 should translate into increased private and government sector investments, which may see a recovery in the medium- to long-term demand for cement. However, in the absence of a solution to the current excessive oversupply of cement, we do not see any significant change from the current climate.
However, after completing the restructuring process, the Group has improved its cost base and we expect our results in 2020 to remain flat compared to previous periods. Despite the continuing market oversupply and the industry remaining limited in its ability to pass on rising costs, Suez Cement will continue to create a leaner, more efficient organization that is ready to capitalize on the market turnaround when it arises.
Corporate Governance
To retain the interest of all stakeholders, Suez Cement Company holds itself to the highest standards of corporate governance, while leveraging a proven track record in Egypt’s cement industry. The Group believes, wholeheartedly, that outlining and adhering to stringent, best-in-practice corporate governance standards is the cornerstone to a company’s success as a transparent and sustainable organization that drives value for its shareholders.
The Group’s Board of Directors plays a vital role in the governance of the entire organization, leading it with prudent strategies and straightforward objectives that drive its growth. In addition to monitoring the performance of executive management, the Board of Directors works to ensure the efficiency of the system of control and risk management, identifies optimal governance methods and adjusts the employee guidelines and policies to professional standards.

16
Suez Cement | Annual Report 2019
OUR BOARD OF DIRECTORSThe company’s Board of Directors consists of 13 members, two of which are executive members and 11 of which are non-executives.
Number Name In his Capacity as
1 Mr. Hayrullah Hakan Gurdal Executive Chairman of the Board of Directors
2 Mr. José Maria Magrina Executive Managing Director
3 Mr. Antonio Clausi Non-executive Member of the Board of Directors
4 Mr. Mohamed Chaibi Non-executive Member of the Board of Directors
5 Mr. Dominik Michel Executive Member of the Board of Directors
6 Mr. Mohamed Gamal Shanan Executive Member of the Board of Directors
7 Mr. Ali Aynachi Executive Member of the Board of Directors
8 Mr. Raed Ibrahim Sulaiman El Mudaiham Non-executive Member of the Board of Directors
9 Mr. Veli Pekka Ettala Non-executive Member of the Board of Directors
10 Mr. Saad Abdel Raouf Salama Non-executive Member of the Board of Directors
11 Mr. Walid Mohamed Al Rasheed Non-executive Member of the Board of Directors
12 Ms. Dina Andrea George Khayat Non-executive Member of the Board of Directors
13 Dr. Mounir Soliman Nemattallah Non-executive Member of the Board of Directors
Audit Committee
In order to assist the board in fulfilling its duties, the Group formed a standalone Audit Committee with its own individual charter and scope of governance. The Audit Committee guides the Group in terms of clearly outlined regulations, responsibilities and capabilities in accordance with the laws and regulatory directives of the company. While analyzing the financial reporting process, the Committee also reviews internal procedures of functions, whether administrative reports or control procedures. The committee met 6 times in 2019 and is made up of the following members:
Number Name
1 Mr. Antonio Clausi
2 Ms. Dina Andrea George Khayat
3 Dr. Mounir Soliman Nemattallah
4 Mr. Saad Abdel Raouf Salama

17
CORPORATE SOCIAL RESPONSIBILITYAs part of Suez Cement’s strategy for its corporate social responsibility (CSR) department and to encourage the sustainable development of its local communities, the Group expanded its community service efforts by contributing to the implementation of several CSR programs in 2019. In addition to building partnerships with civil society organizations, the Group launched a number of new initiatives during the year supporting educational programs, sports events and community development projects.
In line with Suez Cement’s belief that education is a key pillar for a country’s development, the Group continued its support for the school restoration initiative in cooperation with the Ministry of Education and civil society organizations. This initiative contributes to improving educational conditions by developing school infrastructure to create a healthy environment for students. In the same context, the company paid school tuition for students attending Kafr El-Alou Cement School.
To develop and support urban thought and its relationship to architecture, Suez Cement sponsored the Architecture and Urbanism Conference, which was organized by the Faculty of Engineering’s Department of Architecture at Ain Shams University in October.
In partnership with its parent company, HeidelbergCement, Suez Cement launched the 2019 Summer Internship Program, which provided 62 university undergraduates from 18 different universities with real work experience. The one-month program, designed to provide undergraduates with an extra edge for their job search upon graduation, included a week of orientation and an assigned coach to guide interns through assignments. Interns who showed exceptional technical and behavioural skills will be recommended for future consideration.
Emphasizing its firm commitment to supporting local communities, the Group sponsored a number of community events aimed at bringing together community members. The company held a ceremony honoring mothers for their role in community development and recognizing their efforts. An event for Orphans’ Day was also organized in cooperation with civil society organizations and with the participation of the company’s employees, where children were given new clothes and school supplies. Another ceremony was held to honor distinguished primary and secondary students in the community for their achievement and hard work. During the winter, Suez Cement also distributed blankets in the areas surrounding Helwan Cement plant, in cooperation with civil society organizations and with the participation of a number of its employees.
In support of sustainable development and Egypt’s 2030 Vision, Suez Cement, in cooperation with the Directorate of Roads and Transport in the Suez Governorate, developed the Suez Desert Road to contribute to the improvement of the infrastructure in the country.
The Group has always been at the forefront of charitable activities during the holy month of Ramadan and Eid al-Adha, distributing aid packages consisting of food and other necessities to families in need in the local community. The Group also sponsored a number of athletic and cultural events throughout the year as part of the Group’s support of sports as a means of positive influence on young people and to foster close community ties.
During 2019, the Group also launched the Go Green initiative as part of Suez Cement’s endeavor to spread environmental awareness and embed it in the minds and behaviors of the workers and their families, echoing the Group’s commitment to 2030 sustainability principles.

18
Suez Cement | Annual Report 2019
CORPORATE SOCIAL RESPONSIBILITY
19
HEALTH, SAFETY & ENVIRONMENTOne of Suez Cement’s greatest priorities is to foster a robust culture of health, safety and environmental preservation as the Group works to set an industry benchmark for best practice. We pride ourselves on adherence to international health and safety standards as well as our comprehensive environmental preservation frameworks that exceed the requirements set forth by the Egyptian government.
Health and Safety
As a company operating in an industrial setting, we understand that employee perceptions of their organization’s commitment to safety are important concerning both the adoption and maintenance of safe work practices and workplace injury rates. We can never allow ourselves to be truly proud of our industry when there are people still risking their lives and suffer injuries as they work on our sites.
Suez Cement works diligently to be one of the safest cement companies in the industry, taking active measures to provide a safe working environment and lower the frequency of workplace accidents. In 2019, the Group’s lost time injury (LTI) frequency rate for employees — the number of accidents that resulted in lost time per million hours worked — came to zero. Additionally, the severity rate of recorded injuries was zero, while the number of days lost was zero. The total case injury (TCI) rate for employees was 0.9, including fatalities, lost time injuries and medical treatment accidents. Regrettably, one fatal accident in our cement division occurred in 2019, involving one of our contractors at the Tourah plant. We succeeded in reducing our LTI for both employees and contractors, with the Kattameya plant marking two years without LTI, the Suez plant marking one year and headquarters marking three years.
To enhance our employees’ safety awareness and improve safety practices at our plants, we conducted a total of 18,544 training hours and 7,363 training seats for both employees and contractors in 2019. During the year, we also organized a health and safety awareness week on our premises with several activities — a best practice competition, an on-spot award competition by company management, a newsletter competition, daily safety awareness for all employees and contractors and a safety video song with the participation of all departments. During the initiative, Suez Cement recognized its subcontractors and employees for their contribution to improving the safety of the workplace and their safe work performance. The Group also organized a Cement and Concrete Industry Techniques seminar for quality control managers working in Ready Mix Beton.
The Group seeks to go above and beyond in its adherence to local regulations when it comes to environmental preservation. As such, Suez Cement successfully received its ISO 45001:2018 certifications to be the first country in HeidelbergCement - AEM region. Safety audits are always a critical element of the integration process for all acquisitions. All of Suez Cement’s operations have safety programs that include safety inspection, training, auditing, sharing best practices, close follow up, reporting and investigation of accident causes, as well as prevention of future accidents.
2019 EmployeeLTI FR
Non- Employee
LTI FR Employee
LTI SR
Number Fatalities
OwnEmployees
Number Fatalities
Non-Employees
Total case Injuries TCI
(Own (Employees
FR
Suez 0 0 0 0 0 1.2
Kattameya 0 0 0 0 0 4.3
Tourah 0 0 0 0 1 0
Helwan 0 0.49 0 0 0 0
(Head Quarter (HQ 0 0.23 0 0 0 1.0
Egypt w/o RMC 0 0.22 0 0 1 0.9

20
Suez Cement | Annual Report 2019
2019 NEAR HIT SAFETY CONVERSATION
Suez 8,723 10,957 Kattameya 8,329 8,321 Tourah 2,145 2,626 Helwan 10,224 10,718 (Overhead (HQ 833 1,724 Logistics and others 26 48 Cement Egypt 30,348 34,474Egypt w/o RMC 30,348 34,474
HEALTH, SAFETY

21
Environmental Protection
The Group has adopted a strict environmental policy that aims to promote sustainable use of resources, cultivate long-term economic growth and improve the quality of life for generations to come.
In 2019, Suez Cement adopted even firmer policies geared at preserving and improving the environment and ecosystems of the areas surrounding the Group’s facilities as recommended by Environmental Management Systems (EMS). The Group seeks to go above and beyond in its adherence to local regulations when it comes to environmental preservation. As such, each plant renewed its ISO 14001 certificate and its certification to the latest ISO 14001/2015 standards. In April 2015, the Egyptian government issued amendments to law no. 4 of 1994, outlining the requirements to integrate coal and petcoke as a primary fuel source to power cement kilns and included further restrictions on air pollutants and greenhouse gas emissions. The Group is complying with these requirements at all plants.
Climate Protection
Cement production is an energy and carbon-intensive process. Since 2006, Suez Cement has been monitoring and reporting carbon dioxide emissions from its operations to track its carbon emissions, following the WBCSD CSI CO2 protocol for the cement industry.
In 2015, the Suez and Kattameya plants received permission to use coal as their primary energy source for two years. These permits were renewed for the Kattameya and Suez plants in 2017 based on annual performance reports submitted from each plant. In 2019, the permits were renewed for a second time to the Kattameya and Suez plants in 2019 for two more years.
The approval process to integrate coal/petcoke power at the Helwan plant was approved in April 2017 and renewed for two more years in April 2019 based on two annual performance reports submitted by the Helwan plant.
Emissions
All plant emissions are carefully monitored using international standards and best practices. All our clinker production lines are equipped with CEMs to measure SO2, NOx, CO, O2, THC and dust as per HeidelbergCement guidelines. Pollutants like heavy metals, mercury, dioxin and furan, work environment, ambient environment and wastewater are measured as part of plant emissions monitoring. The Group equipped all kilns stacks with FTIR monitoring devices in the Kattameya, Suez and Helwan plants to regularly measure HCl and HF at main stacks and the physical properties in cement mills, coal mills and coolers stacks to comply with the environmental law requirements.
CO2 Cement Production* Emissions (2019)
Absolute gross (ton/year) 4,885,831
Specific gross (kg/ton clinker) 875
Specific gross (kg/ton cem.**) 743
* These calculations are based on the WBCSD-CSI CO2 protocol, May 2011
**”Cem.” is a cementitious product that includes both clinker and cement substitutes used for grinding.
22
Suez Cement | Annual Report 2019
Energy & Fuel
In 2019, the Group continued to substitute fossil fuel with other types of fuel, mainly coal, high sulfur coal, petcoke and alternative fuel. Coal, petcoke and alternative fuel comprise about 96% of the Group’s cement production fuel mix, compared to 81% in 2017 and 83% in 2018. The coal consignment stock approach started in August 2017 and continued through 2019, which improved the working capital.
Suez Cement has been studying the feasibility of solar energy and other green sources to generate part of electricity for its Suez, Kattameya and Helwan plants. In 2019, the Group started to review and negotiate with potential suppliers and signed a term sheet for its Suez plant with one of the suppliers to start the approval process.
Projects, Equipment and Consumables
With the strengthening of the Egyptian pound’s positive impact on commodity prices and the global price decrease boosting competition around the world, the Group’s Procurement Department was able to improve price management in 2019. The department was also able to enhance the stability of supply by aggregating projects, sourcing from low-cost countries and partnering with the Technical Department to bundle strategic materials. As a result, the Group achieved a total cost savings of EGP 35 million. During the year, the department successfully sold the old production lines of Tourah and Helwan plants and other scrap materials, with sales totaling EGP 139 million. Furthermore, the department successfully saved around EGP 5.6 million in expert commission and administrative fees.
Subcontracting
In 2019, the Procurement, Technical and Human Resources departments reduced the number of subcontractors by 515 workers in outsourced industrial services and general service categories, with no impact on the Group’s service quality.
Raw Material Sourcing and Quarry Operation
In 2019, the Procurement Department maintained a stable supply of standard quality raw material, while introducing new material and sources. Although fuel prices increased during 2019, the department managed to keep the prices fixed for the Group’s contracted raw material and quarry operation service. Additionally, a decrease in some prices resulting in a cost-savings of EGP 2.3 million. The department also successfully contracted the excavation operation for the newly acquired limestone quarry for the Helwan plant at a competitive price.
Supplier Qualification
The Supplier Qualification Program continued in 2019 as part of Suez Cement’s commitment to Sustainable Development. The initiative aims to objectively evaluate suppliers by analyzing their performance, financial stability and commitment to health, safety and environmental protection. The program also aims to assess the Group’s Code of Ethics, including its commitment to human rights. The program is supported by the Technical, Safety, Finance and Legal Departments, as each are responsible for the evaluation of suppliers in their areas of expertise. In 2019, the pre-qualification process was completed for 87 suppliers.

23
ENVIRONMENT

24
Suez Cement | Annual Report 2019
OUR PEOPLESuez Cement prides itself on its ability to recruit some of the best talent in the market and its constant efforts to construct a positive and productive work environment where employees can continue to grow. Accordingly, throughout 2019, we have worked to develop a strategy to support our employees so they can enhance their professional skills and thereby build a strong foundation for the Group to thrive as a direct result.
Training
Throughout 2019, Suez Cement continued to invest in training for staff members ranging from comprehensive programs for new recruits to technical and skills training for current employees. Trainings are provided to Suez staff with the intention of enhancing their capabilities and supporting them in building new skills and progress in their careers
For the first time this year, Suez Cement introduced a new memory-retention program designed for staff to use after trainings. Delivered through a mobile application, the 12-week program helps staff to quickly implement newly learned concepts at work.
New Stars Program
The New Stars program, an eight-month training program to teach fresh graduates technical and administrative skills, concluded in August 2019. Designed to support Suez Cement’s commitment to hiring the best talent available in the market, the program involved a series of training modules and an end-of-program project. Members were provided with mentors throughout the process and those in administrative positions were required to receive 1,100 hours of training across multiple fields. Upon completion of the program and after careful evaluation, the entire cohort was hired by Suez Cement, adding to the Group’s diversity across age and gender.
Skills Trainings
Throughout the year, Suez Cement employees received a number of skills trainings to further improve their capabilities. To determine training needs among the Group’s technical staff, Human Resources utilized their skills matrix, a tool that identifies skill gaps based on management assessment of employees’ skills.
In 2019, 111 technical staff members received ‘soft skills’ trainings in communication skills, coping with change, attitude and teamwork.
15 engineers and section heads across various Suez Cement plants were selected to participate in a Root Cause Failure Analysis program. The three-day training aims to convey that effective root cause failure analysis (RCA) requires correct application of the right tools to make accurate conclusions. Participants developed an RCA process tailored to the Group’s operating environment, encouraging future problem-solving at work.
In 2019, the Group trained 23-selected key users and nine managers to master the SAP Plant Maintenance software, which will help them plan and execute end-to-end maintenance processes.
During 2019, Human Resources provided over 39 company car users with over 555 hours of safety driving courses as part of Suez Cement’s goal of creating a safer working environment. The initiative launched with the goal of preventing vehicle accidents and promoting safe driving habits by educating trainees on driving behavior both inside and outside the company.
59 technicians were trained by internal certified experts on cement manufacturing to improve overall performance and understanding the complete cement production process.

25
Career Development
In 2019, the Human Resources Department enhanced current initiatives and launched new initiatives focused on career development to help Suez Cement staff reach their potential within the Group.
The Group continued developing its performance management system, which aims to evaluate employees’ skills while helping them improve their capabilities and better apply them at work through a transparent evaluation process. Additionally, the system sets the safety evaluation criteria for technical and nontechnical teams.
The succession planning mechanism continued during 2019, distributed to key positions through to middle management along with an assessment center for some Human Resources staff and commercial departments to identify the highest calibers and identify future managers.
To enhance overall leadership competency, Suez Cement expanded its executive management certificate to 28 members, including newly appointed managers. Under this certification, which is expected to be completed by April 2020, qualified members receive comprehensive training covering nearly all vital managerial skills.
To ensure Suez Cement employee’s needs are being met, the Group conducted an employee satisfaction survey that covered four different dimensions: work environment, job stability and security, trust and transparency and manpower status. As part of Suez Cement’s efforts to promote staff wellbeing and health, the Group started a corporate football league in November.
Organizational Development
Suez Cement prides itself in creating a healthy and conducive work environment for its staff. During 2019, the Group continued working on initiatives with the aim of improving the physical workspace and establishing a transparent work environment across all departments.
Suez Cement continued its Group-wide initiative to create official job descriptions for all company roles, along with the establishment of a job evaluation committee to address any issues regarding job descriptions or organizational charts. Based on the committee’s findings, the Group added 148 job descriptions, each addressing job objectives, responsibilities, reporting system, skills and competences.
Human Resources enhanced its employee services by continuing its journey to automation by launching a self-service module, implementing all HR modules with payroll, providing reports to top management to improve transparency on overtime and leave and eliminating cash payments.
The department also revised its company-wide HR handbook initiative, including the issuing of department-specific handbooks for employees to establish transparent rules and regulations regarding workplace conduct within their individual roles.
During the year, the Group launched a new organizational chart to standardize and compile all staff information, including positions, titles, reporting lines, names and ID numbers. The organizational chart will enhance communications, ensure standardization and high performance across the Group, and integrate sustainability, as well as better track talent, succession plans and key positions.
In December, the department launched the 5S System of visual management to improve organization and efficiency by keeping the workplace clean, uncluttered, safe and well organized, helping to reduce waste and optimize productivity.

26
Suez Cement | Annual Report 2019
Manpower Planning and Recruitment
During 2019, Human Resources successfully recruited 52 new employees across different departments, including both fresh graduates and talented candidates within the market. As for current employees, the Group continued to promote internal career movement, reaching 158 internal transfers.
The department also successfully forecasted its 2020 Manpower Plan to continue to build on the successes it was able to achieve in this area throughout the year.
The company also participated as a Platinum sponsor at the German University in Cairo’s employment fair and as an associate sponsor at the American University in Cairo’s employment fair. By participating in two prominent employment fairs in Egypt, the Group was able to enhance its employer branding image in the market.
A new initiative launched by the Group, Professional Background Databank Project, aims to build a complete database of all Suez Cement employees’ professional background from graduation until the present. The database will provide accurate, easily accessible information about previous professional experiences and increase the potential for internal mobility and more effective formulation of cross-functional projects..

27
OUR PEOPLE

28
Financial Statements | Separate Financial Statements
SUEZ CEMENT COMPANY (S.A.E) FINANCIAL STATEMENTS SEPARATEFOR THE YEAR ENDED 31 DECEMBER 2019TOGETHER WITH THE AUDITOR’S REPORT
29
Suez Cement | Annual Report 2019
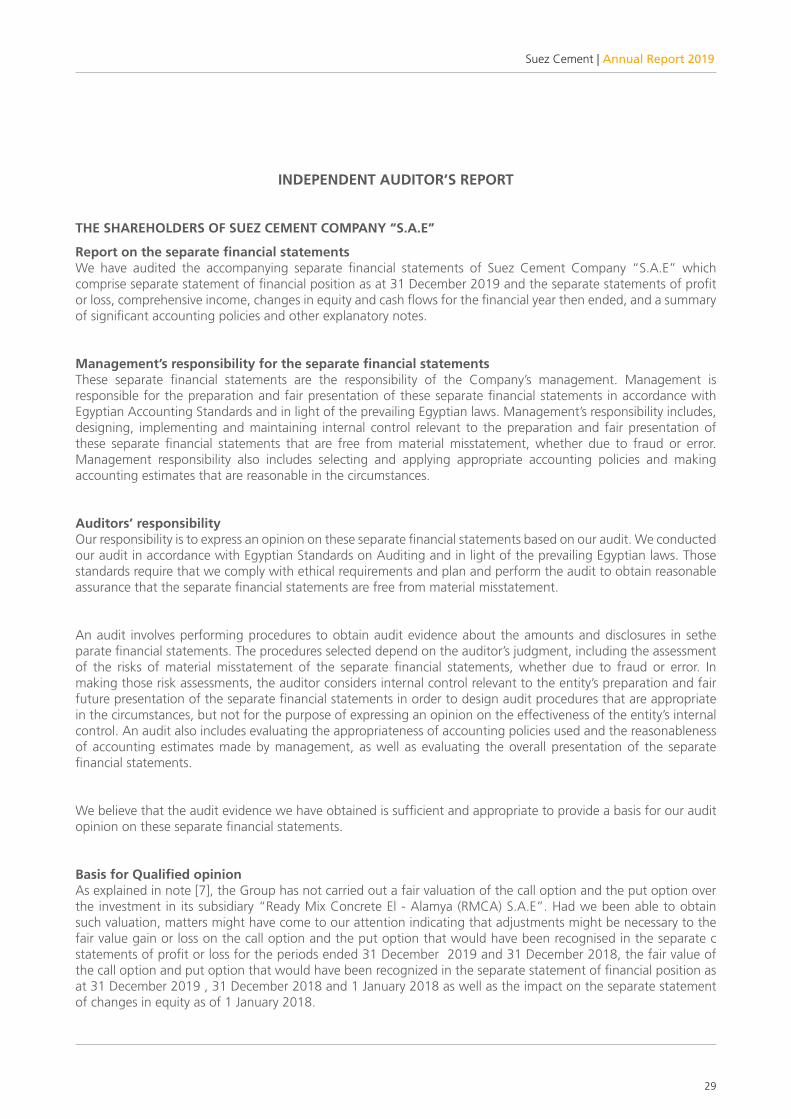
INDEPENDENT AUDITOR’S REPORT
THE SHAREHOLDERS OF SUEZ CEMENT COMPANY “S.A.E”
Report on the separate financial statementsWe have audited the accompanying separate financial statements of Suez Cement Company “S.A.E” which comprise separate statement of financial position as at 31 December 2019 and the separate statements of profit or loss, comprehensive income, changes in equity and cash flows for the financial year then ended, and a summary of significant accounting policies and other explanatory notes.
Management’s responsibility for the separate financial statementsThese separate financial statements are the responsibility of the Company’s management. Management is responsible for the preparation and fair presentation of these separate financial statements in accordance with Egyptian Accounting Standards and in light of the prevailing Egyptian laws. Management’s responsibility includes, designing, implementing and maintaining internal control relevant to the preparation and fair presentation of these separate financial statements that are free from material misstatement, whether due to fraud or error. Management responsibility also includes selecting and applying appropriate accounting policies and making accounting estimates that are reasonable in the circumstances.
Auditors’ responsibilityOur responsibility is to express an opinion on these separate financial statements based on our audit. We conducted our audit in accordance with Egyptian Standards on Auditing and in light of the prevailing Egyptian laws. Those standards require that we comply with ethical requirements and plan and perform the audit to obtain reasonable assurance that the separate financial statements are free from material misstatement.
An audit involves performing procedures to obtain audit evidence about the amounts and disclosures in sethe parate financial statements. The procedures selected depend on the auditor’s judgment, including the assessment of the risks of material misstatement of the separate financial statements, whether due to fraud or error. In making those risk assessments, the auditor considers internal control relevant to the entity’s preparation and fair future presentation of the separate financial statements in order to design audit procedures that are appropriate in the circumstances, but not for the purpose of expressing an opinion on the effectiveness of the entity’s internal control. An audit also includes evaluating the appropriateness of accounting policies used and the reasonableness of accounting estimates made by management, as well as evaluating the overall presentation of the separate financial statements.
We believe that the audit evidence we have obtained is sufficient and appropriate to provide a basis for our audit opinion on these separate financial statements.
Basis for Qualified opinionAs explained in note [7], the Group has not carried out a fair valuation of the call option and the put option over the investment in its subsidiary “Ready Mix Concrete El - Alamya (RMCA) S.A.E”. Had we been able to obtain such valuation, matters might have come to our attention indicating that adjustments might be necessary to the fair value gain or loss on the call option and the put option that would have been recognised in the separate c statements of profit or loss for the periods ended 31 December 2019 and 31 December 2018, the fair value of the call option and put option that would have been recognized in the separate statement of financial position as at 31 December 2019 , 31 December 2018 and 1 January 2018 as well as the impact on the separate statement of changes in equity as of 1 January 2018.

30
Financial Statements | Separate Financial Statements
PAGES 32 - 55
Qualified OpinionIn our opinion, except for the effect of the matter described in the basis of qualified opinion paragraph above,the separate financial statements referred to above present fairly, in all material respects, the financial position of Suez Cement Company “S.A.E.” as at December 31, 2019, and its financial performance and cash flows for the financial year then ended in accordance with the Egyptian Accounting Standards and in light of related Egyptian laws and regulations.
Report on the other legal and regulatory requirementsThe Company maintains proper financial records, which includes all that is required by the law and the Company’s statutes, and the accompanying financial statements are in agreement therewith. Also the Company applies a costing system that meets its designated purpose, and the inventory counts were taken by the management in accordance with proper principles.
The financial statements attached to the report of the Board of Directors, which is prepared according to the requirements of the Law No. 159 of 1981 and its executive regulations, are consistent with the Company’s books to the extent such statements are evidenced in such books.
Wael SakrMember of Egyptian Society of Accountants & Auditors
Accountants and Auditors Register Number 26144
EFSA Registration 381

31
Suez Cement | Annual Report 2019
SEPARATE STATEMENT OF PROFIT AND LOSS - FOR THE YEAR ENDED 31 DECEMBER 2019
(All amounts are shown in Egyptian Pounds) Note 2019 Restated2018
Non-current assets
Fixed assets 5 990,513,916 902,172,886
Projects in progress 6 36,238,292 153,515,874
Investments in subsidiaries a/7 3,120,663,952 3,983,786,710
Investments in associates and shares in joint ventures b/7 30,267,255 30,267,255
Available-for-sale investments c/7 1,440,001 1,440,001
Loans to subsidiaries 8 - 20,000,000
Total non-current assets 4,179,123,416 5,091,182,726
Current assets
cccInventories 9 595,835,836 604,623,827
Loans to subsidiaries 8 1,138,331,628 400,540,152
Customers 10 - 2,478,770
Due from related parties b/12 8,439,653 27,006,711
Prepaid expenses and other receivables 11 204,955,271 240,083,956
Cash at banks 13 186,834,542 229,295,672
Total current assets 2,134.396,930 1,504,029,088
Total assets 6,313,520,346 6,595,211,814
Equity and liabilities
Equity
Capital 19 909,282,535 909,282,535
Legal reserve 20 454,641,267 454,641,267
Other reserves 2,214,245,360 2,214,245,360
Reserve of unrealized ptofits on available-for-sale investments 327,001 327,001
Retained earnings 25,000,865 1,312,306,287
Total equity 3,603,497,028 4,890,802,450
Non-current liabilities
Other long term liabilities 21 27,304,985 20,177,981
Deferred tax liabilities 22 73,705,571 77,637,534
Total non-current liabilities 101,010,556 97,815,515
Current liabilities
Provisions 14 229,889,792 180,337,562
Bank overdraft 15 1,146,960,189 3,434
Loan from subsidiaries 16 99,407,066 -
Creditors and other payables 17 611,788,762 728,271,594
Due to related parties c/12 237,485,074 429,416,484
Due to tax authority 18 29,019,100 48,551,308
Advances to customers 254,462,779 220,013,467
Total current liabilities 2,609,012,762 1,606,593,849
Total liabilities 2,710,023,318 1,704,409,364
Total equity and liabilities 6,313,520,346 6,595,211,814
- The accompanying notes on pages 7 to 42 form an integral part of these separate financial statements
- Independent auditor’s report – attached
Sherif El Masry Dominik Michel José Maria Magrina Hayrullah Hakan Gürdal
Accounts Manager Financial Director Managing Director Board Chairman

32
Financial Statements | Separate Financial Statements
SEPARATE STATEMENT OF PROFIT AND LOSS - FOR THE YEAR ENDED 31 DECEMBER 2019
(All amounts are shown in Egyptian Pounds) Note 2019 2018
Sales 23 2,165,105,858 2,673,093,778
Cost of sales 29 (2,374,120,273) (2,503,965,658)
Gross profit (209,014,415) 169,128,120
General and administrative expenses 30 (190,000,891) (196,248,220)
Other operating expenses 24 (25,865,643) (28,793,672)
Other operating income 25 39,636,683 43,438,357
Provisions formed 14 (90,447,861) (12,821,713)
Provisions no longer required - 5,706,004
Dividends revenue 26 71,512,456 30,302,053
Profits on sale of investments - 123,466,134
Impairment of investments in subsidiaries a/7 (863,122,758) (189,171,973)
Operating profit (1,267,302,430) (54,994,911)
(Finance expenses (Net 27 6,789,311 87,326,761
Profit before taxes (1,260,513,119) 32,331,850
Deferred income tax 28 3,737,970 (21,642,772)
Net profit (loss) for the year (1,256,775,149) 10,689,078
Profit (loss) ( basic and delitued)per share 31 (6,91) 0.06
The accompanying notes on pages 8 to 45 form an integral part of these separate financial statements

33
Suez Cement | Annual Report 2019
SEPARATE STATEMENT OF COMPREHENSIVE INCOME - FOR THE YEAR ENDED 31 DECEMBER 2019
(All amounts are shown in Egyptian Pounds) 2019 2018
Net (losses) profits for the year (1,256,775,149) 10,689,079
Other comprehensive income
Acturial profits (losses) from defined plan of pension (9,458,007) 589,775
Total (comprehensive loss) income for the year (1,266,233,156) 11,278,854
The accompanying notes on pages 8 to 45 form an integral part of these separate financial statements

34
Financial Statements | Separate Financial Statements
SEPA
RATE
STA
TEM
ENT
OF
CHA
NG
ES IN
EQ
UIT
Y -
FOR
THE
YEA
R EN
DED
31
DEC
EMBE
R 20
19
(All
amou
nts
are
show
n in
Egy
ptia
n Po
unds
)
Capi
tal
Issu
ed a
nd p
aid-
upLe
gal r
eser
veO
ther
res
erve
s U
nrea
lized
pro
fits
fro
m a
vaila
ble
for
sale
inve
stm
ents
Reta
ined
ear
ning
sTo
tal
Equi
ty
Bala
nce
at Ja
nuar
y 1,
201
890
9,28
2,53
545
4,64
1,26
72,
214,
245,
360
327,
001
1,32
7,18
5,68
8 4
,905
,681
,851
Profi
ts s
ettle
men
t-
--
-(2
5,65
8,25
5)(2
5,65
8,25
5)
Inde
pend
ent d
irect
ors’
rem
uner
atio
n-
--
-(5
00,0
00)
(500
,000
)
Item
s of
com
preh
ensiv
e in
com
e fo
r the
yea
r aft
er ta
x-
--
-58
9,77
5 5
89,7
75
Profi
ts fo
r the
yea
r-
--
-19
9,86
1,05
2 1
99,8
61,0
52
Bal
ance
at 3
1 D
ecem
ber 2
018
909
,282
,535
454
,641
,267
2,2
14,2
45,3
60 3
27,0
011,
501,
478,
260
5,0
79,9
74,4
23
Bala
nce
at 1
Janu
ary
2019
as
prev
ious
ly is
sued
909
,282
,535
454
,641
,267
2,2
14,2
45,3
60 3
27,0
011,
501,
478,
260
5,0
79,9
74,4
23
(Prio
r yea
rs a
djus
tmen
ts (N
ote
16-
-
-
-
(1
89,1
71,9
73)
(189
,171
,973
)
(Bal
ance
at 1
Janu
ary
2019
(res
tate
d 9
09,2
82,5
35 4
54,6
41,2
67 2
,214
,245
,360
327
,001
1,3
12,3
06,2
87 4
,890
,802
,450
Empl
oyee
Pro
ft S
hare
--
--
(20,
572,
266)
(20,
572,
266)
Inde
pend
ent d
irect
ors’
rem
uner
atio
n-
--
-(5
00,0
00)
(500
,000
)
Item
s of
com
preh
ensiv
e in
com
e fo
r the
yea
r aft
er ta
x-
--
-(9
,458
,007
)(9
,458
,007
)
Loss
es fo
r the
yea
r-
--
-(1
,256
,775
,149
)(1
,256
,775
,149
)
Bala
nce
at 3
1 D
ecem
ber 2
019
909
,282
,535
454
,641
,267
2,2
14,2
45,3
60 3
27,0
01 2
5,00
0,86
5 3
,603
,497
,028
The
acco
mpa
nyin
g no
tes
on p
ages
7 to
42
form
an
inte
gral
par
t of t
hese
sep
arat
e fin
anci
al s
tate
men
ts
35
Suez Cement | Annual Report 2019
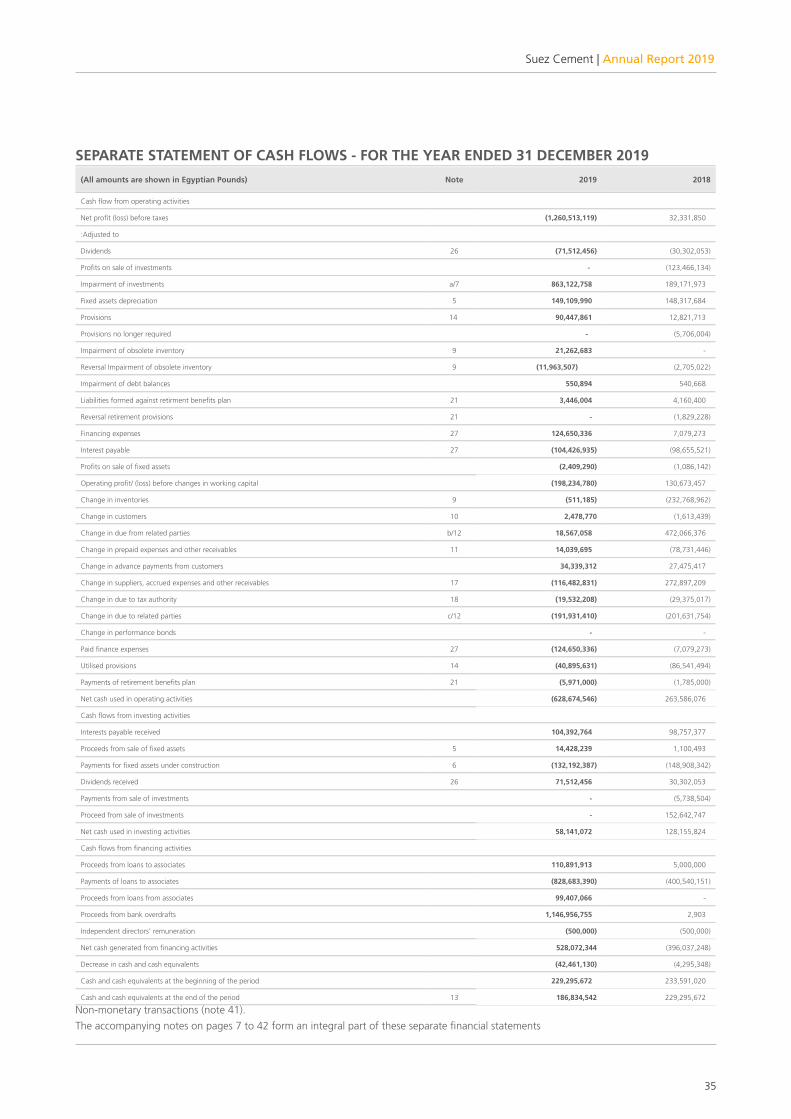
SEPARATE STATEMENT OF CASH FLOWS - FOR THE YEAR ENDED 31 DECEMBER 2019(All amounts are shown in Egyptian Pounds) Note 2019 2018
Cash flow from operating activities
Net profit (loss) before taxes (1,260,513,119) 32,331,850
:Adjusted to
Dividends 26 (71,512,456) (30,302,053)
Profits on sale of investments - (123,466,134)
Impairment of investments a/7 863,122,758 189,171,973
Fixed assets depreciation 5 149,109,990 148,317,684
Provisions 14 90,447,861 12,821,713
Provisions no longer required - (5,706,004)
Impairment of obsolete inventory 9 21,262,683 -
Reversal Impairment of obsolete inventory 9 (11,963,507) (2,705,022)
Impairment of debt balances 550,894 540,668
Liabilities formed against retirment benefits plan 21 3,446,004 4,160,400
Reversal retirement provisions 21 - (1,829,228)
Financing expenses 27 124,650,336 7,079,273
Interest payable 27 (104,426,935) (98,655,521)
Profits on sale of fixed assets (2,409,290) (1,086,142)
Operating profit/ (loss) before changes in working capital (198,234,780) 130,673,457
Change in inventories 9 (511,185) (232,768,962)
Change in customers 10 2,478,770 (1,613,439)
Change in due from related parties b/12 18,567,058 472,066,376
Change in prepaid expenses and other receivables 11 14,039,695 (78,731,446)
Change in advance payments from customers 34,339,312 27,475,417
Change in suppliers, accrued expenses and other receivables 17 (116,482,831) 272,897,209
Change in due to tax authority 18 (19,532,208) (29,375,017)
Change in due to related parties c/12 (191,931,410) (201,631,754)
Change in performance bonds - -
Paid finance expenses 27 (124,650,336) (7,079,273)
Utilised provisions 14 (40,895,631) (86,541,494)
Payments of retirement benefits plan 21 (5,971,000) (1,785,000)
Net cash used in operating activities (628,674,546) 263,586,076
Cash flows from investing activities
Interests payable received 104,392,764 98,757,377
Proceeds from sale of fixed assets 5 14,428,239 1,100,493
Payments for fixed assets under construction 6 (132,192,387) (148,908,342)
Dividends received 26 71,512,456 30,302,053
Payments from sale of investments - (5,738,504)
Proceed from sale of investments - 152,642,747
Net cash used in investing activities 58,141,072 128,155,824
Cash flows from financing activities
Proceeds from loans to associates 110,891,913 5,000,000
Payments of loans to associates (828,683,390) (400,540,151)
Proceeds from loans from associates 99,407,066 -
Proceeds from bank overdrafts 1,146,956,755 2,903
Independent directors’ remuneration (500,000) (500,000)
Net cash generated from financing activities 528,072,344 (396,037,248)
Decrease in cash and cash equivalents (42,461,130) (4,295,348)
Cash and cash equivalents at the beginning of the period 229,295,672 233,591,020
Cash and cash equivalents at the end of the period 13 186,834,542 229,295,672
Non-monetary transactions (note 41).The accompanying notes on pages 7 to 42 form an integral part of these separate financial statements

36
Financial Statements | Separate Financial Statements
1. INTRODUCTION
Suez Cement Company (SAE) was incorporated in 1977 as an Egyptian joint stock company in accordance with the provisions of Law No. 43 of 1974, as amended by Law No. 230 of 1989 which was amended by Law No. 8 of 1997. The company is registered in the commercial register under number 181134 Cairo.
Heidelberg Cement company (after acquiring 100% of its shares of Italcementi Group through its subsidiaries) owns 55% of the company’s capital as at 31 December 2019.
The main objective of the Company is to produce all types of cement and other products stemming from the cement industry and related thereto and the production of other building materials and construction requirements and trading therein, utilization of mines and quarries except sand and gravels. The company may have an interest or participate in any manner in organization caring out activities which are similar to the company’s activities, or which may contribute to the fulfilment of the Company’s objects in Egypt or abroad. The company may also be merged in any of the aforementioned organizations, or may buy or have them subsidiary to the company, subject to the approval of the General Authority for Investment and Free Zones.
The separate financial statements of the Company for the year ended 31 December 2019 were signed by the company’s Managing Director on 5 March and will be presented to the upcoming BOD meeting for ratification.
2. ACCOUNTING POLICIES
The principal accounting policies applied in the preparation of these Separate financial statements are summarised below, which are applied consistently over the presented financial periods unless otherwise stated:
A- Basis of preparation of the separate financial statements
These separate financial statements have been prepared in accordance with Egyptian Accounting Standards (EAS) and the relevant laws, and on the basis of the historical cost convention and the employees’ defined benefits liabilities, which are measured at the present value of liabilities.
The Company presents its assets and liabilities in the statement of financial position based on the current/ non-current classification. The asset is classified as current when it is:
* Expected to be realised or intended to be sold or used in normal operating course.
* Held primarily for trading.
* Expected to be realised within 12 months after the end of the financial reporting period, or
* Cash or cash equivalents unless restricted from being exchanged or used to settle a liability for at least twelve months after the financial reporting period.
All other assets are classified as non-current.
The liability is classified as current when:
* It is expected to be settled in the normal operating course.
* Held primarily for trading.
* Required to be settled within 12 months after the end of the reporting period, or
* The entity does not have an unconditional right to defer the settlement of the liability for at least twelve months after the end of the reporting period.

37
Suez Cement | Annual Report 2019
The Company classifies all other liabilities as non-current. Deferred tax assets and liabilities are classified as non-current.
The preparation of the separate financial statements in conformity with EASs requires the use of critical accounting estimates and assumptions. It also requires the Company’s management to exercise its judgment upon applying the Company’s accounting policies. Note (4) explains the critical accounting estimates and assumptions of these separate financial statements, as well as critical judgments used by the Company’s management when applying the Company’s accounting policies.
Users of these separate financial statements should read them with the Group’s consolidated financial statements
as of and for the year ended 31 December 2019 in order to obtain full information on the financial position, results of operations, its cash flows and changes in equity of the Group.
EASs require the reference to the International Financial Reporting Standards (IFRS) when there is no EAS, or legal requirements that explain the treatment of specific balances and transactions.
B- Amended and new standards not yet adopted by the Group
The Ministry of Investment issued a decision on 28 March 2019 No.69 of 2019 which includes new standards and amendments on the current standards. Amendments were published in the Official Gazette on 7 April 2019. These changes are mainly represented in three new standards that should be applied for financial periods beginning on or after 1 January 2020 as follows:
Standard name “EAS (47) “Financial instruments
Nature of thechange
The new impairment menu requires recognition of the impairment allowances based on the ex- pected credit losses instead of the incurred credit losses solely, in accordance with EAS 26. It is applied to financial assets classified at amortised cost and debt instruments measured at fair value through other comprehensive income and contract assets under EAS 48, “Revenues fromcontracts with clients”, lease receivables, loan commitments, and some financial guarantees con-.tracts
Effect
The Group has reviewed its financial assets and liabilities, and according to the initial assessment by the management to date, the Group expects that this new standard will have a material impact.on the increase in the impairment of customers and other receivablesThe new standard also provides extended requirements for disclosure and changes in presenta- tion. It is expected to change the nature and size of the Group’s disclosures regarding its financial.instruments, especially in the year which the new standard is applied
Mandatory date of application/ implementationby the Group
This standard is applied for financial periods beginning on or after 1 January 2020. Early adoption.is permitted

38
Financial Statements | Separate Financial Statements
Standard name “EAS (48) “Financial instruments
Nature of the change A new standard for revenues recognition was issued, replacing EAS 11 whichcovers contracts for sales of goods and services and EAS 8 which covers con-.struction contracts
The new standard is based on the revenues recognition convention upon trans-.ferring control on goods or services to the client
Effect The management assessed the effects of applying the new standard on the :Group’s financial statements, and it has specified the effect as follows.Reclassification of advances to customers to contracts obligations
Mandatory date ofapplication/ implemen-tation by the Group
This standard is applied for financial periods beginning on or after 1 January2020. Early adoption is permitted
Standard name (EAS (49) “Lease contracts”: Stage 2 (Operating leases
Nature of the change
EAS 49 for leases was issued, which requires adoption for financial periods be- ginning on or after 1 January 2020. In accordance with the new standard, in the statement of financial position, an asset (the right to use the leased asset) and a financial obligation to settle the lease payments are recognised. This excludes.short-term and small-value leasing contracts .There is no material effect of the new standard on the lessor’s books
Effect
The management has assessed the effects of applying the new standard to the Group’s financial statements, and has reviewed the operating lease arrangementsof the Group during the previous year in light of the new operating lease account- .ing rules
The Group has no activities in which it functions as a lessee or as a lessor for op- erating leases, and therefore does not expect a significant impact on the financial statements. However, there will be some new notes required starting from the.next year
Mandatory date ofapplication/ implemen-tation by the Group
The Group will apply EAS (49) on operating leases from the mandatory date of application from 1 January 2020. The Group intends to use the practical means provided by the standard and the comparison figures for the year. It will not be modified before the initial application of the standard. Usufruct assets arising from operating leases will be measured at the amount of the lease obligation at the.(date of the initial application (adjusted at any advance or due rental expense
C- Foreign currency translation
Functional and presentation currency (1)The financial statements of the Company are measured and presented using the currency of the primary economic environment in which the Company operates (‘the functional currency”). The separate financial statements are presented in Egyptian Pounds, which is the Company’s functional and presentation currency.

39
Suez Cement | Annual Report 2019
Transactions and balances (2)Transactions made in foreign currency during the period are initially recognised in the functional currency of the Company on the basis of translation of foreign currency using the spot prevailing exchange rates between the functional currency and the foreign currency at the date of the transaction, and the monetary items denominated in foreign currency are also translated using the closing rates at the end of each financial period. Foreign exchange gains and losses resulting from the settlement of such monetary items and from the translation of monetary items denominated in foreign currencies at the same period or in previous financial statements, are generally recognised by the Company in profit and loss in the period in which these difference arise, except when currency exchange differences resulting from the translation of non-monetary item are deferred in other comprehensive income, which constitutes an effective part of net investment hedges in a foreign operation or an effective part of cash flow risk hedges.
Exchange differences resulting from the changes in the amortised cost of the monetary financial asset available for sale are recognised in gains and losses. Any changes in the book amount are recognised within other comprehensive income.
Translation differences on non-monetary financial assets and liabilities are recognised as part of the fair value gain or loss. Translation differences on non-monetary financial assets and liabilities such as equities held at fair value through profit or loss are recognised as profit or loss as part of fair value gain or loss. For available for sale financial assets, which do not represent monetary items (e.g. equity instruments), gains or losses recognised within other comprehensive income include any elements of related foreign currencies swaps.
D- Fixed assets
The Company of that the cost model at measurement of fixed assets, and the fixed assets are recognised on their costs net of the accumulated depreciation and accumulated impairment losses. The cost of fixed asset includes any costs directly associated with bringing the asset to the site and into a working condition that it is ready for use intended by the management of the Company.
The Company recognises subsequent costs of the acquisition of the fixed asset as a separate asset, only when it is probable that future economic benefits will flow to the Company and the cost of the item can be measured reliably. The Company recognises in the carrying value of fixed asset the cost incurred to replace part of that asset at the date such costs are borne, and the carrying amount of replaced parts are derecognised. The Company recognises the costs of daily servicing of the fixed assets in the statement of profit or loss.
The straight line method is used to allocate the depreciation of fixed assets consistently to their residual values over their estimated useful lives, except for lands, which are characterised with unlimited estimated useful life. Below are the estimated useful lives of each type of the assets’ groups:
- Buildings, constructions, infrastructure & roads years 20 - 6
- Machinery, equipment and tools years 20 - 5
- Vehicles years 5
- Furniture and office equipment years 10 - 5
The Company reviews the residual value of fixed assets and estimated useful lives of fixed assets at the end of each fiscal year, and adjusted when expectations differ from previous estimates.
The book amount of the fixed asset is reduced to the amount of recoverable value, if the recoverable value of an asset is less than its book value. This reduction is considered as a loss resulting from impairment.

40
Financial Statements | Separate Financial Statements
Gains or losses on the disposal of an item of fixed assets from the books are determined based on the difference between the net proceeds from the disposal of the item and the book value of the item, and the profit or loss resulting from the disposal of fixed assets is included in the statement of profit and loss.
E- Investment in subsidiaries
The subsidiaries are entities controlled by the Company, a subsidiary is consolidated when the Company is exposed, or has rights, to variable returns from its involvement with the investee and has the ability to affect those returns through its power over the investee. Investment in subsidiaries in the separate financial statements is stated at cost. The cost method requires recognition of investment in subsidiaries at cost, and recording of investment income to the extent of dividends distribution received from investee.
F- Investments in associates
Associates are entities that are under significant influence of an investor. These investments are shown in the separate financial statements using the cost method. Significant influence is the ability to participate in making decisions related to the financial and operating policies of the investee, but it does not qualify to control or joint control over these policies.
G- Inventory
Inventories are measured at the lower of cost and net recoverable value. Cost is determined based on the moving average method. The cost of finished goods and work in process comprises costs of purchase, costs of conversion and other costs (based on normal operating capacity), incurred by the Company in bringing the inventories to their present location and condition, and excludes borrowing costs. Net realisable value is the estimated selling price in the ordinary course of business less the estimated costs of completion and any other costs necessary to make the sale. The amount of any write-down of inventories resulting from the decrease in the net realisable value of the inventory from its carrying value and all losses of other inventories shall be recognised as an expense in the period the write-down or loss occurs.
H- Financial assets
(1) Classification The Company classifies its financial assets as financial assets at fair value through profit and loss and loans and receivables. The classification depends on the purpose for which the financial assets were acquired. Management determines the classification of its financial assets at initial recognition.
Loans and receivables:Loans and receivables are non-derivative financial assets with fixed or determinable payments that are not quoted in an active market. Financial assets listed are presented in the Company as current assets if expected to be recovered within 12 months from the date of the end of the financial period. The Company’s loans and receivables comprise ‘trade and other receivables’ and ‘cash and cash equivalents’ in the statement of financial position.
(2) Initial recognition and measurementA financial asset is recognised when the Company becomes a party to the contractual provisions of the financial asset.
The acquisition of a financial asset is initially measured at fair value, in addition to other costs directly associated with the execution of the transaction, except for financial assets that are designated at fair value through profit or loss, which are measured initially at fair value only and all other costs associated with the execution of the transaction are charged to the statement of profit or loss.
(3) Subsequent measurementLoans and receivables and held to maturity financial assets are subsequently measured at amortised cost using the effective interest rate. Interests calculated are recognised in the statement of profit or loss within income (costs) - net.
(4) De-recognition
- Financial assets are de-recognised when the rights to receive cash flows from the financial assets have expired or where the Company has transferred substantially all risks and rewards of ownership.

41
Suez Cement | Annual Report 2019
- The financial asset is derecognised at its carrying amount at the date of derecognition, and profit (loss) of derecognition is recognised in the statement of profit or loss within the profit (loss) on investment.
- The profit (loss) of the derecognition of a financial asset represents the difference between the carrying amount at the date of derecognition and the proceeds resulting from the derecognition of the financial asset, except for the available for sale financial assets which, where the profit (loss) of the derecognition of financial asset represents the difference between the carrying amount at the date of derecognition and the proceeds resulting from the financial asset, in addition to the accumulated profit or loss previously recognised within other comprehensive income items.
I- Offsetting financial asset and liability
Financial assets and liabilities are offset and the net amount reported in the statement of financial position when there is a legally enforceable right to offset the recognised amounts and the Company has an intention to settle on a net basis or realise the asset and settle the liability simultaneously. The legally enforceable right must not be contingent on future events and must be enforceable in the normal course of business and in the event of default of the counterparty, and should reflect the Company’s normal practices and requirements of financial requirements and other conditions related to the considerations of the risk and timing of the Company’s cash flows.
J- Impairment of financial assets
Financial assets carried at amortised cost
The Company assesses impairment at the end of each financial period whenever there is objective evidence that a specific financial asset or a group of financial assets may be impaired. A financial asset or a group of financial assets is impaired and impairment losses are incurred only if there is an objective evidence of impairment as a result of one or more events that occurred after the initial recognition of the asset (a ‘loss event’) and that loss event (or events) has an impact on the estimated future cash flows of the financial asset or group of financial assets that can be reliably estimated.
Evidence of impairment may include indications that the debtors or a group of debtors is experiencing significant financial difficulty, violation of contract terms such as default or delinquency in interest or principal payments, or the probability that they will enter bankruptcy or other financial reorganisation, and where observable data indicate that there is a measurable decrease in the estimated future cash flows since the initial recognition, or changes in national or domestic conditions that correlate with defaults of the Company’s assets.
For loans and receivables category. The amount of the loss is measured as the difference between the asset’s book amount and the present value of estimated future cash flows (excluding future credit losses that have not been incurred) discounted at the financial asset’s original effective interest rate. The book amount of the asset is reduced and the amount of the loss is recognised in the statement of profit or loss. Loans expected to be uncollectible are written off by deduction from the relevant provision, and any subsequent proceeds are recognised as revenue in the statement of profit and loss. If a loan or held-to-maturity investment has a variable interest rate, the discount rate for measuring any impairment loss is the current effective interest rate determined under the contract. As a practical expedient, the Company may measure impairment of a financial asset on the basis of an instrument’s fair value using an observable market price.
If, in a subsequent period, the amount of the impairment loss decreases and the decrease can be related objectively to an event occurring after the impairment was recognised (such as an improvement in the debtor’s credit rating), the reversal of the previously recognised impairment loss is recognised in the separate statement of profit or loss.
K- Impairment of non-financial assets
The Company assesses, at each reporting date, whether there is an indication that an asset may be impaired. If any indication exists, the Company estimates the asset’s recoverable amount. An asset’s recoverable amount is the higher of an asset’s fair value or CGUs less costs to sell and its value in use. Recoverable amount is determined for an individual asset, unless the asset does not generate cash inflows that are largely independent of those from the Company’s assets. When the carrying amount of an asset or CGU exceeds its recoverable amount, the asset is considered impaired and is written down to its recoverable amount.

42
Financial Statements | Separate Financial Statements
In assessing value in use, the estimated future cash flows are discounted to their present value using a pre-tax discount rate that reflects current market assessments of the time value of money and the risks specific to the asset. In determining fair value less costs to sell, recent market transactions are taken into account. If no such transactions can be identified, an appropriate valuation model is used. These calculations are corroborated by valuation multiples, quoted share prices for publicly traded companies or other available fair value indicators.
The Company bases its impairment calculation on detailed budgets and forecast calculations, which are prepared separately for each of the Company’s CGUs to which the individual assets are allocated. These budgets and forecast calculations generally cover a period of one to five years, a long-term growth rate is calculated and applied to project future cash flows after the fifth year.
Impairment losses are recognized in the separate statement of profit or loss in expense categories consistent with the function of the impaired asset.
L- Trade receivables
Trade receivables are amounts due from the Company’s customers for merchandise sold or services performed in the Company’s ordinary course of business. If collection is expected within 12 months from the date of the financial statements or in the Company’s normal operating cycle of the business, trade receivables are classified as current assets. Trade receivables are recognised initially at fair value and subsequently measured at amortised cost using the effective interest method, less provisions for impairment.
M- Assets held-for-sale
The Company classifies the non-current asset as held-for-sale if their carrying amount will be recovered principally through a sale transaction rather than through continuing use. The asset should be available for immediate sale in its condition without any conditions except the conventional and usual conditions for such assets, and sale is considered highly probable. The Company measures the non-current asset, which is classified as assets held for sale on the basis of the lower of carrying amount and fair value less costs to sell.
N- Cash and cash equivalents
In the separate statement of cash flows, cash and cash equivalents includes cash in hand and with banks, deposits held at call with banks, with original maturities of not more than three months from the date of placement. In the separate statement of financial position, bank overdrafts are shown within current liabilities.
O- Financial liabilities
Classification
The Company classifies its financial liabilities as financial liabilities at fair value through profit and loss and other financial liabilities. The classification of the financial liability depends on the purpose of acquisition at the initial recognition.
Recognition and derecognition
A financial asset is recognised by the Company in the statement of financial position when - and only when- the Company becomes a party to the contractual provisions of the financial liability. The Company removes the financial liability (or part of it) from the statement of financial position when it is discharged, cancelled or expired.
The Company accounts for the exchange between an existing borrower and lender of debt instruments with substantially different terms as an extinguishment of the original financial liability and the recognition of a new financial liability. The difference between the book amount of a financial liability (or part of it) extinguished or transferred to another party including non-amortised expenses, and the consideration paid to settle the liability are recognised in profit or loss.
Measurement
At initial recognition, the Company measures the financial liabilities at fair value plus transaction costs, except for financial liabilities the fair value through profit or loss where all other attributable costs are charged to the statement of profit or loss. The other financial liabilities, represented in trade payables and other receivables and bank loans are subsequently measured at amortised cost using the effective interest method.

43
Suez Cement | Annual Report 2019
P- Capital
Ordinary shares are classified within equity. Share premiums, if any, are added to legal reserve to the extent of half of the issued capital, and the remaining balance of the premium is transferred to a share premium reserve. after deducting the shares issue expenses (net of any advantage related to their income taxes) from the amount of share premium.
If the Company repurchases its own equity instruments (treasury shares), these instruments are presented net of equity, the amount paid or received in exchange for those instruments is recognised directly in the Company’s equity.
Q- Current and deferred income tax
The Company recognises the current and deferred income tax as revenues or expenses and is included in the profit or loss for the period. Current and deffered income tax is recognised in other comprehensive income or directly in equity if it related to items recognised - in the same period or different periods- in the statement of other comprehensive income or directly in equity.
The income tax for the year is calculated on the basis of the tax laws enacted at the balance sheet date. Management annually evaluates tax situation through tax returns, taking into account the differences that may arise from some interpretations issued by administrative or regulatory authorities, and establishes the appropriate provisions on basis of the amounts expected to be paid to the tax authority.
Deferred income taxes are recognised on temporary differences arising between the tax bases of assets and liabilities and their carrying amounts in the separate financial statements.
Deferred income tax is measured using prevailing tax rates and laws that have been enacted at the date of the separate financial statements and are expected to be applied when the related deferred income tax asset is used or the deferred income tax liability is settled
Deferred income tax liability is not recognised if it arises from the initial recognition of goodwill. Deferred income tax is not recognised if it arises from initial recognition of an asset or liability in a transaction - other than a business combination - that at the time of the transaction affects neither accounting nor taxable profit or loss.
Deferred income tax assets are recognised to the extent that it is probable that future taxable profit will be available against which the temporary differences can be utilised.
Deferred income tax assets and liabilities are offset when the Company has a legally enforceable right to offset current tax assets against current tax liabilities and when the deferred income taxes assets and liabilities relate to income taxes levied by the same taxation authority on either the same taxable Company or different taxable entities where there is an intention to settle the current taxable liabilities and assets on a net basis.
R- Employee’s benefits
The Company operates various employees’ benefits schemes, including both defined benefit and defined contribution pension plans and post-employment medical plans:
(1) Retirement benefits obligations
The Company has two types of pension schemes as follows:
Defined contribution plans
The defined contribution plan is a pension plan under which the Company pays fixed contributions to the General Authority for Social Insurance on a mandatory basis. The Company has no further liabilities once its obligations are paid. The regular contributions are recognised as periodic cost for the year in which they are due and as such are included in staff costs.
Defined benefit plans
A defined benefit plan is a post-employment benefit plan that is not a defined contribution plan.
Typically defined benefit plans define an amount of pension benefit that an employee will receive on retirement, using a formula that is usually dependent on employees’ average wages, and the number of the years of service.

44
Financial Statements | Separate Financial Statements
The net defined benefit liability recognised in the separate statement of financial position is the present value of the defined benefit liability at the end of the reporting period less the fair value of plan assets. The annual defined benefits obligations are determined annually by independent actuary using the projected unit credit method. The present value of the defined benefit obligations is calculated by discounting the estimated future cash outflows using discount rate at the end of the financial reporting period on market returns of government bonds that are denominated in the currency and the estimated period for the defined benefit obligations.
The Company recognises the current service cost of the defined benefit obligations in the statement of profit or loss, except where included in the cost of an asset that reflects the increase in the defined benefit obligations relating to services performed to the Company during the current year or when changes or curtailments are made to the plan.
The Company recognises the cost of past service as an expense when plan changes or is curtailed, and when the Company recognises the restructuring costs, whichever is earlier in the statement of profit or loss.
Net interest is calculated on the net defined benefit obligation by multiplying the net defined benefit obligation by a discount rate as determined at the beginning of the annual financial period. These costs are included within finance costs in the statement of profit or loss.
(2) Actuarial profits and losses
Actuarial profits and losses, which are the changes in the present value of the defined benefit liability that arises from experience adjustments and changes in actuarial assumptions, are charged in other comprehensive income in the period in which they arise.
(3) Employees’ share in legally defined profits
The Company recognises expected cash dividends as the employees’ share in accordance with the Company’ articles of association, to be included as part of dividends in equity, and as liabilities when the ordinary general assembly meeting of the Quota holders of the Company approved the proposed dividends. The Company does not record any liabilities in the employees’ share of undistributed dividends.
S- Operating Lease
Leases in which the risks and rewards of ownership are retained by the lessor are classified as operating leases.
Payments made under operating leases, net of any discounts received from the lessor, are recognised as expense in the statement of income on a straight-line basis over the period of the lease.
T- Provisions
Provisions are recognised when the Company has a present (legal or constructive) obligation as a result of past events; it is probable that an outflow of resources embodying economic benefits will be required to settle the obligation; and the amount has been reliably estimated. The Company recognises the commitments required for restructuring and not related to the Company’s effective activities within the costs of the provision for restructure.
Contingent obligation is a present obligation that arose due to past events, and was not recognised because it was not expected to have an outflow of resources embodying economic benefits to settle the obligation, or the amount could be reliably estimated. The Company does not recognise the contingent obligation; instead, it is disclosed in notes to the separate financial statements.
Where there are a number of similar obligations, the likelihood that an outflow will be required in settlement is determined by considering the class of obligations as a whole. A provision is recognised even if the likelihood of an outflow with respect to any one item included in the same class of obligations may be small. However, it is expected that an outflow of resources is required to settle all items of obligations.
Where the impact of the time value of cash is significant, the amount of the provision is the present value of expenditures expected to be required to settle the obligation using a pre-tax rate that reflects current market assessments of the time value of money and the risks specific to the obligation. The increase in the provision due to passage of time is recognised as borrowing cost in the statement of profit or loss.

45
Suez Cement | Annual Report 2019
If some or all of the expenditure required to settle a provision is expected to be reimbursed by another party, the Company recognises the reimbursement when it is virtually certain that reimbursement will be received if the Company settles the obligation. The reimbursement should be recognised as a separate asset in the statement of financial position. The amount recognised should not exceed the amount of the provision.
U- Contingent Assets
A contingent asset is a possible asset that may arise from past events because of occurring or non-occurring of contingent future events that are not under full control of the company . The Company recognises the contingent assets in the statement of financial position when the realisation of the relevant revenue is certain. Contingent assets are disclosed only when there is a possibility of inflow of economic benefits.
V- Trade payables
Trade payables are recognised initially at the amount of goods and services received from others, whether they have been billed or not. When they are material, goods and services received, as well as the trade receivables are recognised at the present value of the cash flows expected by using interest rate of similar loans. Trade payables are then carried at amortised cost using the effective interest rate.
W- Revenue recognition
Revenue is measured at the fair value of the consideration received or receivable, and represents amounts receivable for goods sold or service rendered due to the Company’s normal course of business, stated net of value added taxes, rebates or discounts. The Company recognises revenue when the amount of revenue can be reliably measured; when it is probable that future economic benefits will flow to the Company; and when specific criteria have been met for each of the transactions, as described below. The amount of revenue is not considered accurately measurable unless all cases of uncertainty regarding the possibility of the collection of the amount due are excluded. The Company bases its estimates of return on historical results of returns from sale of goods, taking into consideration the type of customer and the related specifics arrangements.
(1) Sale of goods
Revenue is recognised from the sale of goods to traders or contractors who have the right to sell them and determine their prices when the goods are delivered to them, and the Company does not retain significant risks of ownership of the goods, there is no obligation that prevent those traders or contractors to accept the goods sold. Delivery is recognised, both in the Company’s stores or in specific locations, according to the agreements. When the Company transfers the significant risk and rewards of the ownership of the goods to the traders, it retains neither continuing managerial involvement to the degree usually associated with ownership nor effective control over the goods sold. Sales to traders do not comprise the element of financing.
(2) Interest income
Interest income is recognised on a time-proportionate basis using the effective interest method. When a receivable balance resulting from the recognition of interest is impaired, the carrying amount is reduced to the present value of the future cash flows discounted at the original effective interest rate.
X- Dividends
Dividends are recognised as liabilities in the separate financial statements at the end of the financial period in which the dividends are approved by the Company’s General Assembly of Shareholders.
Y- Fair value of financial instruments
Fair value is the price that would be received from any sale of any asset or any payment against any liability in an orderly transaction between market participants at the measurement date. The fair value measurement is based on the assumption that the transaction to sell the asset or pay the liability takes place either:
- In the principal market for the asset or liability, or
- In the absence of a principal market, the most advantageous market for the asset or the liability.

46
Financial Statements | Separate Financial Statements
The Company should be able to have access to the principal market or the most advantageous market. In the absence of principal market, the Company does not need to conduct a thorough search of all possible markets to determine the principal or the most advantageous market. However, the Company takes into consideration all information reasonably available.
The table below shows the financial assets and liabilities at fair value in the separate financial statements at 31 December 2019 within the hierarchy of the fair value, based on the input levels that are considered to be significant to the fair value measurement as a whole:
- Level 1 - Quoted (unadjusted) market prices in active markets for identical assets or liabilities, which the Company can have access to at the date of measurement.
- Level 2 - Inputs other than quoted prices included within level 1 that are observable for the asset or liability, either directly or indirectly.
- Level 3 - Unobservable inputs of the asset or the liability.
Z- Comparatives figures
Where necessary, comparative figures are reclassified to conform to changes in presentation in the current year.
3- Financial risk management
(1) Financial risk factors
The Company’s regular activities expose it to a variety of financial risks. These risks include market risks (including foreign currency of changes in exchange risks, the Company is not exposed to price of change in risk as there is no investments traded in financial markets in the fair value and the effect of interest rate on cash flows and fair value risk), credit risks, and liquidity risks.
The Company’s management aims to minimise the potential adverse effects on the Company’s financial performance.
( A ) Market Risks
1. Risks of change in foreign currency rates
Foreign currency exchange risk is the risk that the fair value of the financial instrument will fluctuate because of the changes in foreign exchange rates, the following analysis shows the effect of a reasonably possible changes of foreign currencies in relation to the functional currency of the Company with all other variables held constant on the separate statement of profit or loss:
2019 2018
US Dollars 10% 5,758,778 26,629,893
Euro 10% 9,879,215 11,933,334
KWD 10% 619,451 101,104
The following table shows the currencies position denominated in Egyptian Pounds at the date of the statement of financial position:
2019 2018
Assets Liabilities Net Net
USD 131,854,246 (189,442,028) (57,587,782) 266,298,930
Euro 6,503,382 (105,295,536) (98,792,154) 119,333,340
KWD 6,930,591 (736,078) 6,194,513 1,011,040

47
Suez Cement | Annual Report 2019
2. Cash flows and fair value interest rate risks
Interest rate risk is the risk that the fair value of future cash flows of financial instruments will fluctuate because of changes in the market interest rates.
The Company is exposed to interest rate risk on its interest bearing liabilities (bank overdrafts, and term loans). The risk is managed by the Company by maintaining an appropriate mix of variable rate loans and bank facilities.
The following table demonstrates the sensitivity of the separate statement of profit or loss to reasonably possible changes in interest rates, with all other variables held constant.
The sensitivity of the separate statement of profit or loss is the effect of the assumed changes in the interest rates on the Company’s results for one year based on financial assets and liabilities with variable interest rates at 31 December 2019.
Increase/ decrease inbasis points
Effect on profits or losses for the year
Egyptian Pounds
December 2019 31 %1 ± 25,287
(25,287)
December 2018 31 %1 ± 4,528,452
(4,528,452)
(B) Credit risks
Credit risk arises from cash and deposits with banks, as well as credit risk related to the balances of trade and notes receivable, credit risk is managed for the Company as whole.
The Company deals with banks with high credit rating and banks with high credit profiles.if there is no independent credit rating. All Egyptian banks that the Company deals with are subject to supervision by the Central Bank of Egypt. For the customers, the credit management assess the credit quality in light of the financial position, past experiences in transactions and other factors. The provisions required to hedge the customer’s default risk are made for each case separately.
Transactions with major customers
The revenue obtained from the two major customers (one of them is a related party) is almost equivalent to 11% of the total revenues for the financial year ended 31 December 2019 (31 December 2018:16%).
(C) Liquidity risks
Liquidity risk is the risk that the Company will not be able to meet its financial obligations as they fall due, as a result of a shortage of funding. The Company’s exposure to liquidity risk results primarily from the lack of offset between profiles of maturities of profiles and liabilities.
The Company limits liquidity risk by maintaining sufficient bank facilities and reserves, and by monitoring cash forecast and actual cash flows and matching the maturity profiles of financial assets and liabilities. Trade payables are normally settled within 90 days of the date of purchase.
The table below summarises the maturities of the Company’s undiscounted financial liabilities at 31 December 2019 based on contractual payment dates and current market interest rates.

48
Financial Statements | Separate Financial Statements
December 2019 31 Less than
months 6
months 6
to one year
year 1
to two years
More than
years 2
Trade suppliers and notes payable 554,695,917 - - -
* Due expenses and other receivables 57,092,845 - - -
Due to related parties 237,485,074 - - -
Bank overdraft - 1,146,960,189 - -
Loan from subsidiaries - 99,407,066 - -
Total 849,273,836 1,246,367,255 - -
December 2018 31
Trade suppliers and notes payable - 642,684,468 - -
* Due expenses and other receivables - 85,587,126 - -
Due to related parties - 429,416,484 - -
Bank overdraft - 3,434 - -
Loan from subsidiaries - - - -
Total 1,157,691,512
* Due expenses and other receivables not including advances to customers.
The unused credit facilities on 31 December 2019 amounted to EGP 858,040,000
(2) Capital risk management
The objective of Company’s management when managing capital is to safeguard the Company’s ability to continue as a going concern in order to provide returns for shareholders and benefits for other stakeholders using the financial statements. The Company also aims to provide and maintain an optimal capital structure to reduce the cost of capital.
In order to maintain or adjust the capital structure, the Company’s management may adjust the amount of dividends paid to shareholders, return capital to shareholders, issue new shares or sell assets to reduce the Company’s debts.
The Company monitors the capital structure on the basis of the gearing ratio. This ratio is calculated as net debt divided by total capital. Net debt comprises total borrowings and bank overdrafts less cash and bank balances. The total share capital comprises the amount of equity and net loans.
The gearing ratios at 31 December 2019 and 31 December 2018 were as follows:
2019 2018
Loan from subsidiaries 99,407,066 -
Bank overdraft 1,146,960,189 3,434
Total loans 1,246,367,255 3,434
Less: Cash and bank balances (186,834,542) (229,295,672)
Net loans 1,059,532,713 (229,292,238)
Equity (3,603,497,028) (4,890,802,450)
Total capital 2,543,964,315 (5,120,094,688)
Gearing ratio (41.6%) -
The reason for the decrease in the gearing ratio is due to the achievement of net loss in the amount of EGP 1,190,318,148 during the year.

49
Suez Cement | Annual Report 2019
4- Critical accounting estimates and judgements
1-4 Critical accounting estimates and assumptions
Estimates and assumptions are continually evaluated and are based on historical experience and other factors, including expectations of future events that are believed to be reasonable under these circumstances:
- The Company makes estimates and assumptions concerning the future. The resulting accounting estimates may not equal the actual results. The following are the most important estimates and assumptions that may result in significant adjustments of assets and liabilities during the following financial year:
Retirement benefits and pension liabilities
The Company’s management determines employee pension benefit liabilities using an independent actuarial expert and it revises the sufficiency of these liabilities on an annual basis according to the accounting policy (2-Q). Note (25) shows the main assumptions used to estimate the employees’ pension plans.
Useful lives of fixed assets
The Group’s management depreciates its fixed assets using the straight-line method so that the value of the asset is reduced to its estimated residual value over the estimated useful life. Estimation of the useful life relies on the estimation and judgment based on the entity’s experience with similar fixed assets, taking into consideration the expected usage, number of shifts in which these machineries are used and their technical ageing. The depreciation methods applied to these assets are reviewed when there is a significant change in the method of obtaining economic benefits from those assets.
Impairment of investments in subsidiaries
The Company determines that investments in subsidiaries have been impaired when there is a significant or prolonged impairment to below their cost. This determination of what is significant or prolonged requires several factors that depend on judgement, industry, market, technological progress and financing and operating cash flows.
2-4 Critical judgements in applying the Company’s accounting policies
Generally, applying the Company’s accounting policies does not require the management to use the personal judgement (other than the accounting estimates and assumptions referred to in the “Note 4-1”), as such judgement could have a material effect on the amounts recognised in its financial statements.

50
Financial Statements | Separate Financial Statements
5- Fixed assets
Lands Buildings
Machinery, equip-
ment and mouldsVehicles
Furniture and
office equipmentTotal
December 2018 31
cost
Balance at the beginning of the year 327,686 559,331,556 2,135,094,611 28,278,693 68,137,906 2,791,170,452
Additions - - - - 5,500 5,500
Transferred from projects in
progress- 31,467,601 132,445,218 - 1,784,723 165,697,542
Disposals - - (5,278,183) (1,129,791) (50,454) (6,458,428)
Balance at the end of the year 327,686 590,799,157 2,262,261,646 27,148,902 69,877,675 2,950,415,066
Accumulated depreciation
Balance at the beginning of the year - (446,079,122) (1,384,406,648) (22,435,220) (53,447,583) (1,906,368,573)
Depreciation expense - (21,866,732) (120,749,063) (1,186,187) (4,515,702) (148,317,684)
Inventory differences (should be
(deleted- - 4,954,427 - - 4,954,427
Depreciation of disposals - - 5,278,183 1,129,791 36,103 6,444,077
Balance at the end of the year - (467,945,854) (1,499,877,528) (22,491,616) (57,927,182) (2,048,242,180)
Net book value at the end of the
year327,686 122,853,303 762,384,118 4,657,286 11,950,493 902,172,886
cost
At 1 January 2019 327,686 590,799,157 2,262,261,646 27,148,902 69,877,675 2,950,415,066
Transferred from projects in
progress- 19,672,449 206,808,230 - 22,989,291 249,469,970
Disposals - (19,961,561) (154,402,812) (9,790,322) (200,646) (184,355,341)
Inventory differences (should be
(deleted- (19,373,355) (139,093,339) (5,635,034) 0 (164,101,728)
December 2019 31 327,686 590,510,045 2,314,667,064 17,358,580 92,666,320 3,015,529,695
Accumulated depreciation
At 1 January 2019 - (467,945,854) (1,499,877,528) (22,491,616) (57,927,182) (2,048,242,180)
Depreciation for the year - (18,034,117) (124,528,299) (966,885) (5,580,689) (149,109,990)
Disposals - 19,290,355 143,103,735 9,789,322 152,979 172,336,391
December 2019 31 - (466,689,616) (1,481,302,092) (13,669,179) (63,354,892) (2,025,015,779)
Net carrying value at 31 December
2019 327,686 123,820,429 833,364,973 3,689,401 29,311,427 990,513,916

51
Suez Cement | Annual Report 2019
Depreciation expense is classified as follows:
2019 2018
Cost of production 142,619,446 142,661,749
General and administrative expenses 6,238,293 5,385,151
Selling and marketing expenses 252,251 270,785
149,109,990 148,317,684
Proceeds from sale of fixed assets in the statement of cash flows are as follows:
2019 2018
Net carrying amount of disposed assets 8,228,479 14,351
Losses) profits on disposal of fixed assets) 6,199,760 1,086,142
Proceeds on sale of fixed assets 14,428,239 1,100,493
All the machinery, equipment and production lines are subject to commercial pledges, as collateral in the first degree against bank borrowings and credit facilities.
6 - Projects in progress
Projects under implementation are renovations and replacement of existing fixed assets that aim to improve and increase efficiency and productive capacity as well as extend the useful life of these assets, and it is expected that most of these projects will be completed during the year 2020:
2019 2018
Line 2 upgrade project 3,932,990 -
Complete gear replacement Mill-4 3,783,143 -
Thermal kiln crusher 3,309,396 -
Coal project spare parts - 2,174,536
gears for cement mill-1 2 - 4,548,920
gears for cement mill-2 2 - 3,186,118
Group IT system - 11,015,733
Alternative fuel project for main furnace ignition - 26,007,090
Main parts for line 2 furnace cooler - 6,609,224
Human resources IT system - 8,033,548
Projects - other 25,212,763 91,940,705
Balance at the end of the year 36,238,292 153,515,874
2019 2018
Balance at the beginning of the year 153,515,875 170,310,574
Additions during the year 132,192,387 148,902,842
Transferred to fixed assets during the year (249,469,970) (165,697,542)
Balance at the end of the year 36,238,292 153,515,874

52
Financial Statements | Separate Financial Statements
7- Investments
(A) Investments in subsidiaries
Total
% Shareholding
Par value
Pershare 2019
Restated
2018
Subsidiaries
(Helwan Cement Company (SAE 99,55 5 2,832,496,952 2,832,496,952
Impairment of investment cost
* (Tourah Cement Company) (321,000,000) -
(Egyptian Tourah Portland Cement (S,A,E 66,12 5 1,287,617,992 1,287,617,992
Impairment of investment cost
* (Tourah Cement Company) (979,267,677) (491,676,920)
Hilal Cemenet Kuwait 51 15.29 270,415,816 270,415,816
Imperment in the cost of investement (54,532,001) -
Ready Mix Concrete El - Alamya S,A,E 52 100 81,432,859 81,432,859
** (Suez for transportation and trading Company (SAE 96,37 100 3,500,000 3,500,000
Development & Construction Materials Co, Egypt “Decom” ((SAE 52 10 11 11
3,120,663,952 3,983,786,710
* Suez Cement Company (S.A.E) controls Suez for transportation and trade Company through direct investment by 35% in addition to indirect shareholding by 61% through Helwan Cement Company (a subsidiary of Suez Cement Company) and Tourah Portland Cement Company (a subsidiary of Suez Cement Company).
** The Company has potential voting rights represented in the shares’ purchase option of non-controlling interests. The Group is entitled to exercise that right in the event of a dispute between the Group and other shareholders on a significant issue related to resolutions that have an impact on the subsidiary. The Group’s management believes that in the event of a dispute, it may exercise the purchase option on the non-controlling interests, which gives the Company control.
Impairment testing of investments in subsidiaries
An impairment test is performed in investments in subsidiaries by the management if there are indicators of impairment in value.
The impairment test is performed in investments in subsidiaries at the level of the cash generating units.
For the purpose of the test, each subsidiary was considered a cash generating unit. The Group has used the following assumptions when testing the impairment of investments in subsidiaries as at 31 December 2019:
Impairment of investment cost (Helwan Cement Company S.A.E)
Average of gross profit 20%
Average sales growth rate 11%
Discount Rate 20%
Growth rate 7.89%

53
Suez Cement | Annual Report 2019
The management has determined the value assigned to each of the above major assumptions as follows:
Assumptions Used method
Sales volume Average annual growth rate over the expected five-year period; based on past performance and.management expectations regarding market development
Sale price Average annual growth rate over the expected five-year period, based on current business trends.including long-term inflation expectations
Gross profit margin in thebudget .based on past performance and management future expectations
Other operating costs Constant costs of the cash-generating unit, which were not materially different from the volume orprices of the sale. Management expects these costs based on the current business structure
Annual capital expendi-tures
Cash costs expected in cash generating units. This is based on management’s historical experience,.and planned replenishment expenses
Long-term growth rate It is the average rate of growth used to conclude cash flows after the budget period. The rates are in.line with the expectations presented in the business field reports
Discount rates .It reflects the specific risks related to the industry it operates
The company has tested the impairment of investment cost in Helwan Cement Company based on the financial, operational and market performance in previous years and its expectations for the market in the future by preparing a business plan using the prevailing growth rate and discount rate. This resulted in the recognition of impairment losses of 321 million pounds.
Recoverable amount sensitivity
The growth rate in the assumption period is estimated at 7.89% If all other assumptions remain the same, a 1% reduction in the growth rate will give a value in use that exceeds the carrying value of EGP 21 Million.
The discount rate for the assumption period was estimated at 20%. If all other assumptions remain the same, an increase in the discount rate by 1% gives a value in use that exceeds the carryig value of EGP 105 Million.
Impairment of investment cost (Tourah Cement Company):
On 10 June 2019, the General Assembly of Tourah Portland Cement Company S.A.E decided to temporarily suspend cement activity until the market circumstances improves. This is regarded as an indicator of impairment in investments of Tourah Portland Cement Company (S.A.E). Accordingly, the Company’s management has tested impairment and recognized impairment losses at increase in carrying amount of investments over recoverable amount. The recoverable amount has been measured based on fair value of Tourah Portland Cement Company (S.A.E)’s share by referring to the share price in stock exchange less sale costs. Accordingly, the impairment of investment has been recognized at EGP 487.590.758.
2019Adjusted
2018
Balance at January 1 491,676,920 302,504,947
(Prior years adjustments (Note 16 - 189,171,973
(Balance at 1 January (restated 491,676,920 491,676,920
Impairment during the year 487,590,758 -
Balance at the end of the year 979,267,678 491,676,920

54
Financial Statements | Separate Financial Statements
Impairment of investement cost (Hilal Cement Kuwait S.A.K)
On a date after preparing the financial statements, the company’s management decided on January 6, 2020 to sell its investments in Al Hilal Cement Company - Kuwait (S.A.K) valued at KWD 4.08 million, which is considered an indication of the impairment in the cost of the investment on December 31, 2019.
Therefore The company’s management has conducted a test for impairment of investment cost, and impairment losses have been recognized by an increase in the book value of the investment over the recovered value, and the recoverable amount has been determined on the basis of the fair value of the investments by reference to the stock price quotations in an inactive market available to the company and accordingly the fair value has been determined at EGP 215,883,816 million on the date of preparing financial statements for the period ended 31 December 2019.
Accordingly, the losses have been recognized in the impairment of the value of investment amounting to EGP 5,532,000 million.
(B) Investments in associates and shares in joint ventures
Total
Shareholding%
Nom- inal value of theshare
2019 2018
Investment in associates
(Tecno Gravel Quarries - Egypt (SAE 45 10 28,334,257 28,334,257
Total investment in associates 28,334,257 28,334,257
Shares in joint ventures - entities subject to common control
*(Suez Lime Company (S,A,E 49,66 100 3,621,100
Total shares in joint ventures 3,621,100
Impairment of investment cost (1,688,102)
Total Investments in associates and shares in Jointventures 30,267,255
* Suez Cement Company S.A.E holds a 49.66% share in Suez Lime Company S.A.E, a jointly controlled entity, managed jointly by Unicalce Company (an Italian company with a 50% share) and Egyptian Tourah Portland Cement (S.A.E), which owns a 1% share.
Participants are associated with a contractual agreement to participate in controlling the economic activities of the project. The project requires unanimous approval on financial and operational resolutions among the participants. Suez Cement Company recognizes its share in the joint venture in the separate financial statements at cost and in the separate financial statements using the equity method.
(C) Available-for-sale investments
Total
Sharehold-% ing
Nominal valueof the share 2019 2018
Lafarge Cement Company – Egypt S,A,E
Listed in the stock exchange (inactive mar- - (ket 0,137 10 1,113,000 1,113,000
Reserve of unrealized gain on available-for-sale investments 327,001 327,001
1,440,001 1,440,001
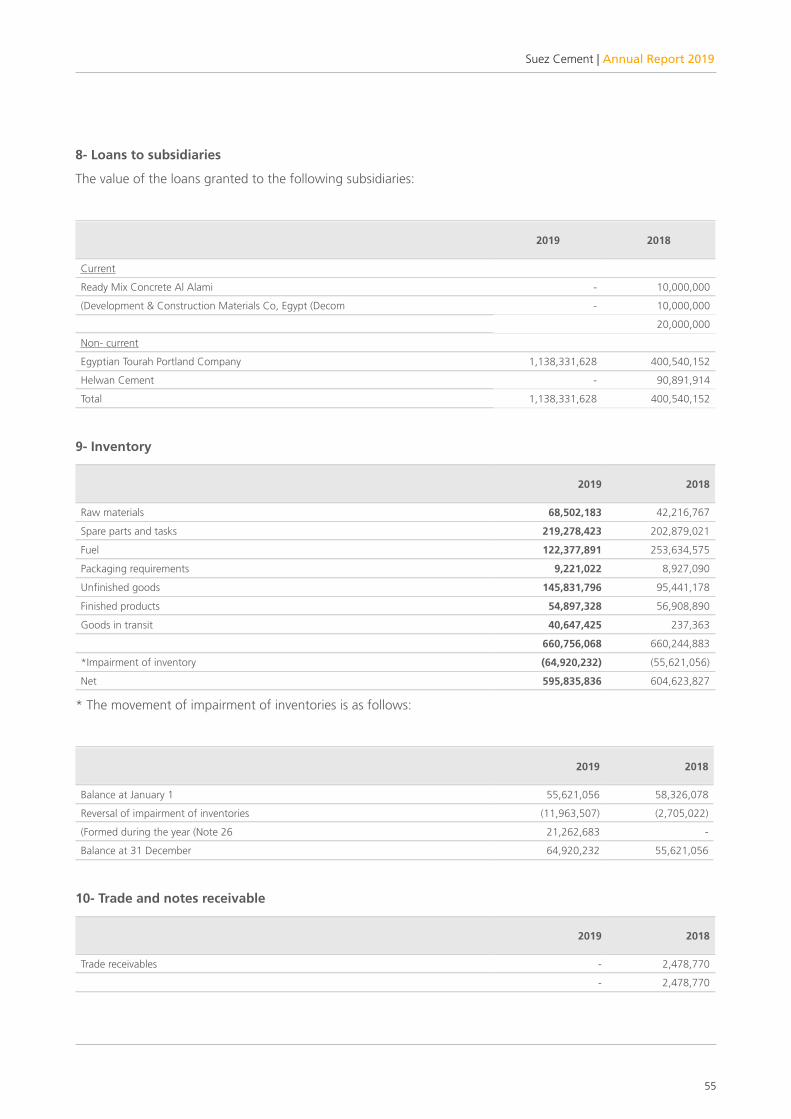
55
Suez Cement | Annual Report 2019
8- Loans to subsidiaries
The value of the loans granted to the following subsidiaries:
2019 2018
Current
Ready Mix Concrete Al Alami - 10,000,000
(Development & Construction Materials Co, Egypt (Decom - 10,000,000
20,000,000
Non- current
Egyptian Tourah Portland Company 1,138,331,628 400,540,152
Helwan Cement - 90,891,914
Total 1,138,331,628 400,540,152
9- Inventory
2019 2018
Raw materials 68,502,183 42,216,767
Spare parts and tasks 219,278,423 202,879,021
Fuel 122,377,891 253,634,575
Packaging requirements 9,221,022 8,927,090
Unfinished goods 145,831,796 95,441,178
Finished products 54,897,328 56,908,890
Goods in transit 40,647,425 237,363
660,756,068 660,244,883
*Impairment of inventory (64,920,232) (55,621,056)
Net 595,835,836 604,623,827
* The movement of impairment of inventories is as follows:
2019 2018
Balance at January 1 55,621,056 58,326,078
Reversal of impairment of inventories (11,963,507) (2,705,022)
(Formed during the year (Note 26 21,262,683 -
Balance at 31 December 64,920,232 55,621,056
10- Trade and notes receivable
2019 2018
Trade receivables - 2,478,770
- 2,478,770
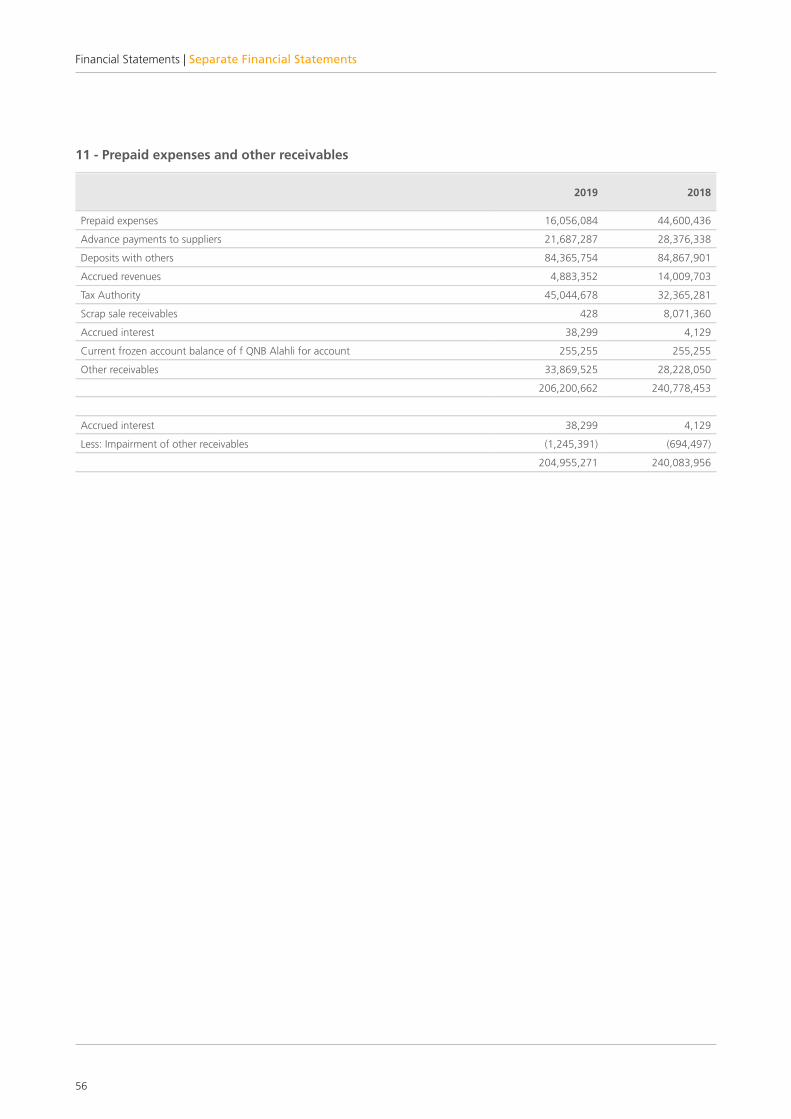
56
Financial Statements | Separate Financial Statements
11 - Prepaid expenses and other receivables
2019 2018
Prepaid expenses 16,056,084 44,600,436
Advance payments to suppliers 21,687,287 28,376,338
Deposits with others 84,365,754 84,867,901
Accrued revenues 4,883,352 14,009,703
Tax Authority 45,044,678 32,365,281
Scrap sale receivables 428 8,071,360
Accrued interest 38,299 4,129
Current frozen account balance of f QNB Alahli for account 255,255 255,255
Other receivables 33,869,525 28,228,050
206,200,662 240,778,453
Accrued interest 38,299 4,129
Less: Impairment of other receivables (1,245,391) (694,497)
204,955,271 240,083,956

57
Suez Cement | Annual Report 2019
12 - Related parties
The Company entered into several transactions with companies and entities that are included within the definition of related parties, as stated in neither accounting nor taxable (15), “Disclosure of related parties”. Related parties are members of the Company’s key management, related facilities, and companies under joint ownership and / or joint control. Management decides the terms and conditions of transactions and services provided by / to related parties and any other expenses in a fair manner and based on the contracts and agreements concluded. Below is the statement that shows the nature and values of transaction with related parties during the year, and the balances due at the date the separate financial statements:
The value of trans-actions in thou-
sand pounds
Name of the Company Nature of relation Nature of transactions 2019 2018
Tourah Portland Cement Compamy Subsidiary Loan interests 92,581 -
Common services to / fromthe group 19,328 33,719
(Purchases (clinker, cement 41,944 -
Purchase of raw materialsand spare parts 13,799 4,342
Helwan Cement Subsidiary Loan interests 26,480 -
Common services to / fromthe group 60,007 60,157
(Sales (clinker, cement 484 14,401
(Purchases (clinker, cement 96,993 4,617
Sales - Spare Parts - Fuel - 9,406
Purchase of raw materialsand spare parts 2,774 13,276
Ready Mix Concrete Al Alami Subsidiary (Sales (clinker, cement 61,010 62,162
Management fees 11,346 -
Development & ConstructionMaterials Co, Egypt Decom Subsidiary (Sales (clinker, cement 62,341 99,372
Suez For Transport Subsidiary Purchases of transportservices 2,956 15,705
(Sales (clinker, cement 566 565
Heidelberg Cement Trading MaltaLimited Related party (Sales (clinker, cement - 36,162
Purchase of raw materials andspare parts 44,826 -
Heidelberg Cement Related party Technical assistance fees 23,511 31,359
Group’s expenditure 26,124 23,836
Consultants’ fees 717 2,316
Heidelberg Cement France Related party Consultants’ fees 10,747 18,367
HC Green Trading Related party Purchase of raw materialsand spare parts 13,115 11,819
HC Trading PV Related party Consultants’ fees 581 -

58
Financial Statements | Separate Financial Statements
B - Due from related parties
2019 2018
(Suez For Transport and Trade (S,A,E 55,851 -
(Global Ready Mix Concrete Company (SAE 5,849,367 9,087,366
(Inter bulk Company S,A,E (related 684,847 1,667,580
Technohraphil 1,778,314 405,495
(Heidelberg Cement Trading Malta (subsidiary - 1,206
(Suez for Import & Export (S,A,E 14,050 14,050
Tanzania Portland Cement Company 14,852 40,675
Cimenteries CBR 42,372 42,372
(Decom (S,A,E - 15,747,967
8,439,653 27,006,711
C- Due to related parties
2019 2018
(Ciments Francais (main shareholder 52,215,388 59,436,941
ItalCementi Company 6,333,362 16,059,273
(Suez For Transport and Trade (S,A,E - 1,839,493
Heidelberg Cement 29,646,549 37,916,391
(Inter bulk Logano (related 102,236,340 299,997,283
(Heidelberg Cement Trading Malta (subsidiary 44,824,603 -
(Decom (S,A,E 2,170,304 -
Heidelberg Cement France - 1,939,057
Sociedad Financera 58,528 62,262
HC Green Trading - 11,822,316
HC Trading International - 343,468
237,485,074 429,416,484
13- Cash and bank balances
2019 2018
A,Local currency
Current accounts with banks 61,413,476 191,742,955
Cash in hand 0 -
61,413,476 191,742,955
B Foreign currency
Current accounts with banks 2,603,442 5,244,218
(Term deposits (due within 3 months 122,817,624 32,308,499
125,421,066 37,552,717
186,834,542 229,295,672

59
Suez Cement | Annual Report 2019
14 - Provisions
Total
Other provisions Provision for
lawsuitsEmployee redun- dancy Provision 2019 2018
Balance at the beginning ofthe year 172,565,616 5,950,233 1,821,713 180,337,562 259,763,347
formed during the year 2,000,000 1,447,861 87,000,000 90,447,861 12,821,713
Utilised during the year (25,500,000) (3,255,525) (12,140,106) (40,895,631) (86,541,494)
Transferred to other provisions - - - - (5,706,004)
149,065,616 4,142,569 76,681,607 229,889,792 180,337,562
Other provisions
Other provisions relate to claims expected to be made by other parties in connection with the company’s operations. The information usually required by accounting standards is not disclosed because the management believes that to do so would seriously prejudice the outcome of the negotiations with those other parties. These provisions are reviewed by management annually and the amount provided is adjusted based on latest developments, discussions and agreements with those other parties.
Employee redundancy Provision
Employee redundancy provision has been formed against the expected cost of employees’ contracts termination costs and are recognized in the period in which the Company becomes legally or constructively committed to pay such amounts, with proper communication to employees.
15- Bank overdrafts
- The Company obtained a total credit limit in the form of overdrafts from banks to finance working capital requirements and imported goods in Egyptian pound or its equivalent in foreign currencies at an average interest rate of 5.46% for the Egyptian pounds, and 13.25% for the foreign currencies.
The total user value of these credit limits at 31 December 2019 amounted to EGP 1.146.960.189.
2019 2018
Egyptian Pounds 1,146,960,189 3,434
1,146,960,189 3,434
16- Loans from subsidiaries
The management decided to borrow from Helwan Cement to finance the cash deficit that is due during the year with an interest rate of 1% more than the interest rate on the Egyptian treasury bonds.
2019 2018
(Loan from Helwan Cement (subsidiary 99,407,066 -
99,407,066 -

60
Financial Statements | Separate Financial Statements
17- Accrued expenses and other payables
2019 2018
suppliers 554,695,917 642,684,468
Accrued expenses 29,198,446 63,039,673
Other receivables 12,282,863 8,556,800
Social Security Authority 1,712,412 1,537,093
Retention 13,899,124 12,453,560
611,788,762 728,271,594
18- Due to tax authority
2019 2018
Tax Authority - Salary tax 2,395,683 4,964,776
Tax Authority - Withholding tax 4,906,852 4,151,446
Tax authority - value added tax 11,715,545 27,877,214
Tax authority - clay development fees 9,999,150 11,557,630
Tax authority - stamp duty fee 1,870 242
29,019,100 48,551,308

61
Suez Cement | Annual Report 2019
Current income tax movement:
Settlement of income tax effective rate
2019 2018
Net profits / (losses) before income taxes (1,260,513,119) 32,331,850
:Add
Accounting depreciation 149,109,990 148,317,684
Donations 327,675 630,817
Board of directors’ expenses 4,752,124 3,614,250
Provisions 113,395,931 21,475,552
Penalties and compensations 1,247,798 995,028
Employees services 4,448,179 4,892,948
Dividends costs 9,222,758 1,582,401
Realised profits on currency valuation differences 2018 26,095,089 176,050,320
Unrealised profits on currency valuation differences 42,022,460 26,577,320
Capital profits- buildings 132,017 -
Impairment of investment cost 1,052,294,730 189,171,973
Capital profits - assets - 8,458
Insurance contribution 5,412,765 3,260,920
Prior years expenses - 2,380,533
Net profits in accordance with tax law 147,948,398 611,290,570
:Less
Tax depreciation (158,700,924) (169,990,858)
Capital Losses (2,515,055) (1,094,600)
Utilised provisions (21,366,630) (70,195,542)
Provisions no longer required - (12,249,004)
Realised losses on currency valuation differences 2018 (26,577,320) (195,464,512)
Dividends (71,512,456) (30,302,053)
Losses on sale of investments - (123,480,024)
Losses on unrealised currency valuation differences (74,542,223) (26,095,089)
The taxable profits base for the year (207,266,210) (17,581,627)
Tax losses carried forward from previous years (27,879,214) (10,297,587)
Tax losses carried forward at year end (235,145,424) (27,879,214)
19 - Issued and paid up capital
September 2019 30 December 2018 31
Authorized capital 3,600,000,000 3,600,000,000
Issued and paid up Capital 909,282,535 909,282,535
Number of shares 181,856,507 181,856,507
The authorized capital of the Company amounted to EGP 1 billion. The issued and paid up capital amounted to EGP 640 million distributed over 64000000 shares, the value of each share is EGP 10. On 30 June 2005, the Minister of Investment issued a decision approving the decision of the Extraordinary General Assembly held on 17

62
Financial Statements | Separate Financial Statements
April 2005 to approve the division of each share of the Company into two. The issued and paid up capital becomes 128000000 shares with a value of EGP 5 per share. On 10 November 2005, the Extraordinary General Assembly of the Company decided to increase the authorized capital to one billion and three hundred million Egyptian pounds and to increase the issued and paid up capital to EGP 909,282,535 distributed on 181856507 shares with a value of EGP 5 for each. On 25 March 2013, the Extraordinary General Assembly of the Company decided to increase the authorized capital to three billion six hundred million Egyptian pounds.
20 - Legal reserve
In accordance with the companies’ law number 159 for year 1981, 5 % of the net profit for the period is transferred to the legal reserve account. The transfer to legal reserve account stops once it reaches 20% of paid up capital. This reserve is not available for distribution to shareholders.
21- Pension retirement benefit liabilities
Employees of the Company are entitled upon their retirement, partial disability or to an end of service gratuity based on a defined benefit plan. The entitlement is based on the length of service and final remuneration package of the employee upon retirement. The defined benefit obligation is calculated using the projected additional unit method after taking into consideration the following assumptions:
2019 2018
Discount Rate 13.7% 15,25%
Average rate of salaries increase 7% 7%
Life schedule 45% 45%
The amounts recognized at the statement of financial position date are comprised as follows:
2019 2018
Present value of liabilities 27,304,985 20,177,981
Liabilities at the financial position statement 27,304,985 20,177,981
Movement in the liability recognized in the statement of financial position
2019 2018
Balance at the beginning of the year 20,177,981 20,392,809
Cost of interests 2,625,000 3,118,800
Current service cost 821,004 5,755,372
Recognized past service costs - (6,543,000)
Losses (profits) of retirement pension benefits settelment 9,652,000 (761,000)
Total amount recognised in profit or loss 13,098,004 1,570,172
Paid during the year (5,971,000) (1,785,000)
Balance at the end of the year 27,304,985 20,177,981

63
Suez Cement | Annual Report 2019
22 - Deferred tax liabilities
2019 2018
Fixed assets depreciation (109,491,393) (102,427,216)
Provisions 50,551,073 20,506,980
Actuarial provision 1,943,507 (193,993)
Unrealised losses on currency valuation differences (2,840,251) 4,476,695
- -
(Net recognized deferred tax (as a liability (59,837,064) (77,637,534)
23- Sales
2019 2018
(Local sales (Unpacked Cement 616,287,590 803,114,694
(Local sales (Packed Cement 1,548,316,433 1,807,482,967
(Export sales (Packed Cement 17,813 14,812,014
(Clinker sales (Local 484,022 11,258,640
(Clinker sales (Export - 36,425,463
2,165,105,858 2,673,093,778
24- Other operating expenses
2019 2018
Rent of unused quarries 5,409,119 -
Prior years expenses 4,956,072 2,380,533
Penalties and compensations 2,709,876 1,305,285
Delay interests 3,899,271 10,794,984
Decrease in the value of receivables 550,895 540,668
Loss on disposal of obeslete inventory 5,671,981 12,590,157
Other expenses 2,668,429 1,182,045
25,865,643 28,793,672
25- Other operating income
2019 2018
Governmental grants - 9,126,352
Company’s fees from management of subsidiaries 18,340,604 13,449,559
Rentals 2,026,478 1,916,300
Penalties 2,320,867 919,606
Net profit on sale of fixed assets 2,409,290 1,086,142
(Services proft – Suez Bags Company (S.A.E 5,833,333 1,971,247
Other Income 8,706,111 14,969,151
39,636,683 43,438,357

64
Financial Statements | Separate Financial Statements
26- Dividends revenues
2019 2018
Ready Mix Concrete El - Alamya S,A,E 24,336,000 21,710,000
(Suez for transportation and trading Company (SAE - 3,192,053
(EL Helal Cement Company- Kuwait ( Kuwaiti Joint Stock Company 42,676,456 -
(Tecno Gravel Quarries - Egypt (SAE 4,500,000 5,400,000
71,512,456 30,302,053
27- Finance expenses
2019 2018
Interests on overdrafts (87,672,328) -
Loan interests from subsidiaries (27,872,996) -
Interest on pension benefits plan ( 2,625,000) (3,118,800)
Other bank expenses (6,480,012) (3,960,473)
( 124,650,336) (7,079,273)
Finance income
2019 2018
* Interests from a loan to a subsidiary 95,104,829 81,486,485
Interests from deposits 9,322,106 17,169,036
104,426,935 98,655,521
Gain/loss on foreign exchange 27,012,712 (4,249,487)
6,789,311 87,326,761
The Company’s management decided to grant loans to its subsidiaries to finance the cash deficit it faces. The loan is entitled to an interest rate of 1% over the interest rate of Egyptian treasury bonds.
28- Income taxes
2019 2018
Income taxes - -
(Deferred income tax for the year (P&L 3,737,970 (21,642,772)
(Deferred income tax (total revenue 193,993 (171,225)
3,931,963 (21,813,997)

65
Suez Cement | Annual Report 2019
29- Cost of sales
2019 2018
Clinker purchases 167,371,249 5,145,423
Fuel 690,692,376 949,908,477
Electricity 413,080,754 410,264,000
Raw materials 203,970,875 237,371,297
Clay development fees 112,077,376 88,837,600
Maintenance 170,226,243 156,820,538
Contractor’s services 53,700,955 47,231,566
Transportation 89,953,410 125,480,321
Salaries 174,151,816 167,555,031
Packaging 151,002,833 153,141,919
Depreciation 142,871,697 142,932,534
Change in inventories (55,438,835) (53,846,310)
Impairment in inventories 9,299,176 -
Reversal of Impairment in inventories - (2,705,022)
Others 51,160,348 75,828,284
2,374,120,273 2,503,965,658
30- General and administrative expenses
2019 2018
Depreciation and amortisation expenses 6,238,293 5,385,151
Technical assistance fees 23,510,957 31,359,042
Salaries 87,387,946 59,889,011
Pension benefits plan - current and prior service costs 821,004 5,755,372
Reversal of retirement benefits plan expenses - (6,543,000)
Public relations and promotion and advertisement expenses 5,981,505 5,991,946
Restructuring expenses 2,747,865 45,379,822
Board members transportation allowances 102,000 183,000
Heidelberg information system expenses 16,093,775 17,628,273
Other general and adminstartive expneses 45,675,746 30,382,603
Tax coupons 1,441,800 837,000
190,000,891 196,248,220

66
Financial Statements | Separate Financial Statements
31- Profit (loss) per share
Basic earnings per share on profit / (loss) for the year is calculated by dividing the net profit / (loss) of the period by the weighted average number of outstanding shares during the year, and considering the proposed future dividends for the employees as approved by the Board of Directors.
2019 2018
Net (loss) profit for the period (1,257,775,149) 10,689,078
Share of the Independent Board of Directors (500,000) (500,000)
Net profit distributable on ordinary shareholders (1,257,275,149) 10,189,078
Weighted average number of ordinary paid and issued shares 181856507 181856507
Earnings per share in (loss) profit (6,91) 0.06
The diluted loss per share is calculated by ) adjusting the weighted average number of ordinary shares outstanding to assume conversion of all dilutive potential ordinary shares. As of 31 December 2019 and 31 December 2018, the Company does not have dilutive potential shares and therefore, diluted loss per share equal to basic loss per share.
32 - Financial instruments by category
Loans and receivables
Assets as per the statement of financial position 2019 2018
*Trade and other receivables 168,418,992 167,797,550
Loans to subsidiaries 1,138,331,628 420,540,151
Cash and cash equivalent 186,834,542 229,295,672
Due from related parties 8,439,653 27,006,711
Total 1,502,024,815 844,640,084
Loans and receivables
Liabilities as per the statement of financial position 2019 2018
Loan from subsidiaries 99,407,066 -
**Suppliers and other receivables 727,581,172 726,734,500
Bank overdrafts 1,146,960,189 3,434
Due to related parties 237,485,074 429,416,484
Total 2,211,433,500 1,156,154,418
* Trade receivables excludes prepaid expenses and advances to suppliers.
** Suppliers and other payables excludes advances from customers insurance.
33- Tax position
Due to the nature of the tax assessment process in Egypt, the final outcome of the assessment by the Tax Authority cannot be realistically estimated. Therefore, additional liabilities are contingent upon the tax inspection and assessment of the Tax Authority.

67
Suez Cement | Annual Report 2019
For the period ended 31 December 2019
Corporate tax:
Period from incorporation to 2007:
The payment of taxes due in accordance with the agreement of the Internal Committee - what has been paid within the limits of the provision.
The period from 2008 to 2011:
The Company’s documents were inspected during this period and results differences have been agreed upon with the internal committee and complying with the final results from the seizure and collection department
The period from 2012 to 2014:
The Company was inspected, and the Company objected to the claim of the errand, and the dispute is pending before the internal committees for re-examination.
The period from 2015 to 2019:
The Company has not been tax tested for this period, and the Company submits the annual declaration regularly and pays the tax dues in accordance with a decision on legal deadlines.
Tax on sales / Value added tax (VAT):
2.1- Sales tax:
Period from incorporation to 2009:
The tax inspection of the Company was conducted for this period, and there are some points that were not agreed upon with the Tax Authority and were referred to the court and the dispute is pending before the court.
The period from 2010 to 2013:
The tax inspection of the Company for this period was completed and the examination differences were paid. Some items of examination were contested and the dispute was pending before the Supreme Grievance Committee.
The period from 2014 to 2015:
The inspection of the period assessment was completed, and the results were objected and the internal committee was completed and the rest of the items were referred to the appeals committees
Period from 1 January 2016 to 7 September 2016.
The Company has not been tax-inspected for this period.
The Company regularly submits the monthly returns within the legal deadlines.
68
Financial Statements | Separate Financial Statements
2.2- Value Added Tax (VAT):
Period from 8 September 2016 till 31 December 2019.
The Company has not been tax-inspected for this period.
The Company regularly submits the monthly returns within the legal deadlines.
Tax on earnings:
Period from incorporation to 1998:
The Company was tax inspected for this period, and the due tax was paid.
Period from 1999 to 2014:
The Company’s documents are being examined for this period, and the Company deducts the tax from employees and supplies it to the Tax Authority (monthly) on legal deadlines.
Period from 2015 to 2019:
The Company has not been tax inspected for this period. The Company pays the tax to the Tax Authority within the legal deadlines.
Stamp tax:
Period from incorporation to 2014:
The Company was tax inspected, the tax due settled and paid.
the period from 2015 to 2017:
The Company has not been tax-inspected for this period.
Real estate tax:
The real estate tax of the Suez plant was paid up to 2019.
We have not been provided yet with the return of Katameya factory since the law was issued.
Clay development fee:
The period from the beginning of the implementation of the law on 5/5/2008 to 31 December 2017:
The Company was tax inspected for this period, and the due tax was paid to the Tax Authority.
Period 2018 / 2019:
The Company was not inspected for this period.

69
Suez Cement | Annual Report 2019
34 - Contingent liabilities
The Company is contingently liable for letters of guarantee and shipping documents arising in the ordinary course of business amounting to be EGP 13,654,781 as of 31 December 2019 and EGP 60,304,972 in the form of letters of credit, (As of 31 Decmeber 2018 letters of guarantee and shiping documents amounted to: EGP 10,235,454 and letters of credit amounted to: EGP 8,322,549.)
35- Segment reporting
The Company did not prepare a clarification of the segment reports because the Company believes that it has one business sector as all of the Company’s activities consist in selling cement, according to what is presented to the Board of Directors.
36 - Prior Years’ adjustments
The error in accounting treatment of impairment in investment of Tourah Portland Cement Company has been corrected
During the period, the Company’s management reviewed the recoverable amount of investment in Tourah Portland Cement Company S.A.E (a subsidiary) as at 31 December 2018, and figured out indicators of impairment on such date and did not take it into consideration due to decline in cement industries occurred from the second half of 2018.
And found that investment in Tourah Portland Cement Company exceeds its recoverable amount by EGP 189,171,973 whereas the recoverable amount had to be measured at price of Tourah Portland Cement Company’s share declared in Egyptian Stock Exchange as at 31 December 2018.
The abovementioned misrepresentations have been corrected by amending the financial statements of previous year according to required effective as follows:
Balance at
31December 2018
As previously issued Restatement
Balance at
31December 2018
Restated
Investments in subsidiaries 4,172,958,683 (189,171,973) 3,983,786,710
Retained earnings 1,501,478,260 (189,171,973) 1,312,306,287
37- Comparative figures
Certain comparative figures for 2018 have been reclassified to conform with the presentation of the seperate financial statements for the year
38- Subsequent events
At a subsequent date for preparing the financial statements, the Company’s management decided on 6 January 2020 to sell its investments in Hilal Cement Company - Kuwait (Kuwaiti Joint Stock Company) at a realisable value of KWD 4,08 million, equivalent of EGP 215,883,816 at the date of preparing the financial statements on 31 December 2019 and it is expected that the sale will be completed during the second quarter of 2020.

66
Suez Cement | Annual Report 2019
SUEZ CEMENT COMPANY (S.A.E) CONSOLIDATED FINANCIAL STATEMENTSFOR THE YEAR ENDED 31 DECEMBER 2019 TOGETHER WITH THE AUDITOR’S REPORT

67
INDEPENDENT AUDITOR’S REPORT
THE SHAREHOLDERS OF SUEZ CEMENT COMPANY “S.A.E”
Report on the consolidated financial statementsWe have audited the accompanying consolidated financial statements of Suez Cement Company “S.A.E” which comprise consolidated statement of financial position at 31 December 2019 and the consolidated statements of profit or loss, comprehensive income, changes in equity and cash flows for the financial year then ended, and a summary of significant accounting policies and other explanatory notes.
Management responsibility for the consolidated financial statementsThese consolidated financial statements are the management’s responsibility. Management is responsible for the preparation and fair presentation of these consolidated financial statements in accordance with Egyptian Accounting Standards and in light of the prevailing Egyptian laws, management responsibility includes, designing, implementing and maintaining internal control relevant to the preparation and fair presentation of consolidated financial statements that are free from material misstatement, whether due to fraud or error; management responsibility also includes selecting and applying appropriate accounting policies; and making accounting estimates that are reasonable in the circumstances.
Auditors’ responsibilityOur responsibility is to express an opinion on these financial statements based on our audit. We conducted our audit in accordance with Egyptian Standards on Auditing and in light of the prevailing Egyptian laws. Those standards require that we comply with ethical requirements and plan and perform the audit to obtain reasonable assurance that the consolidated financial statements are free from material misstatement.An audit involves performing procedures to obtain audit evidence about the amounts and disclosures in the consolidated financial statements. The procedures selected depend on the auditor’s judgement, including the assessment of the risks of material misstatement of the consolidated financial statements, whether due to fraud or error. In making those risk assessments, the auditor considers internal control relevant to the group’s preparation and fair presentation of the consolidated financial statements in order to design audit procedures that are appropriate in the circumstances, but not for the purpose of expressing an opinion on the effectiveness of the group’s internal control. An audit also includes evaluating the appropriateness of accounting policies used and the reasonableness of accounting estimates made by management, as well as evaluating the overall presentation of the consolidated financial statements.
We believe that the audit evidence we have obtained is sufficient and appropriate to provide a basis for our audit opinion on these consolidated financial statements.
OpinionIn our opinion, the consolidated financial statements referred to above present fairly, in all material respects, the financial position of Suez Cement Company “S.A.E.” as at December 31, 2019, and its financial performance and cash flows for the financial year then ended in accordance with the Egyptian Accounting Standards and in light of related Egyptian laws and regulations.
Other important mattersMaterial uncertainty about continuityWithout qualifying our opinion, we draw attention to what is included in Note 40 in the notes to the

68
Suez Cement | Annual Report 2019
consolidated financial statements which indicates that the Group’s net current liabilities reached EGP 1,5 billion, and the group’s accumulated losses amounted to EGP 1,3 billion at 31 December 2019. This resulted principally from Egyptian Tourah Portland Company (Subsidiary) and which net current liabilities amounted to EGP 1,3 billion and the subsidiary’s accumulated losses at 31 December 2019 amounted to EGP 617 million. Due to the current deterioration of the market’s conditions, the Extraordinary General Assembly of the Company’s shareholders held on 10 June 2019 decided to temporarily suspend the cement production and halt the plant activity until the improvement of market conditions. Our opinion regarding this matter is unqualified.
Wael Sakr Member of Egyptian Society of Accountants & AuditorsAccountants and Auditors Register Number 26144EFSA Registration 381
Cairo on 5 March 2020

69
(All amounts are shown in Egyptian Pounds) Note 31 December 2019
Restated31 December 2018
Restated1 January 2018
Non-current assetsFixed assets 5 3,366,179,533 3,395,700,943 3,685,167,935Projects in progress 6 153,667,960 376,553,157 394,184,010Goodwill 8 1,071,639,568 1,266,643,250 2,689,429,222Investments in an associate and shares in Joint ventures 9/a 40,161,391 40,821,719 41,610,569
Available-for-sale investments 9/b 1,560,562 1,560,562 1,460,562Investments held to maturity date 9/c 8,429,279 8,429,279 8,429,279Payments under investment account in other subsidiaries - - 2,000,000 Total non-current assets 4,641,638,293 5,089,708,910 6,822,281,577Current assetsInventories 10 1,441,323,608 1,534,192,621 1,067,684,474Trade and notes receivables 11 498,042,892 523,883,580 546,405,863Prepaid expenses and Different debtors and other debit balances 12 709,229,987 833,617,078 511,345,664
Due from related parties 13/b 3,313,890 11,964,033 28,603,106Cash at banks 14 743,374,558 798,121,644 726,756,599 Total current assets 3,395,284,935 3,701,778,956 2,880,795,706Assets associated with held for sale assets 7 - 414,231,927 186,257,654Total assets 8,036,923,228 9,205,719,793 9,889,334,937
Equity and liabilitiesEquityCapital 22 909,282,535 909,282,535 909,282,535Other 23 2,406,577,834 2,406,577,834 2,451,200,510Foreign transactions translation differences reserve 307,215,438 345,177,393 260,113,607Reserve of unrealised profits on available-for-sale investments 327,001 327,001 327,001(Accumulated losses) retained earnings (1,279,917,050) (255,432,866) 1,264,914,113Total shareholders’ equity attributable to Shareholders of the parent company 2,343,485,758 3,405,931,897 4,885,837,766
Non-controlling interests 24 320,067,067 623,318,894 483,412,133Total equity 2,663,552,825 4,029,250,791 5,369,249,899Non-current liabilitiesMedium term loans 17 83,755,514 93,407,880 63,578,576Other long term liabilities 18 42,848,704 46,419,331 43,587,637Retirement benefits plan obligations 25 72,006,717 72,678,768 80,565,670Deferred tax liabilities - Net 26 261,835,871 255,993,357 171,080,205 Total non-current liabilities 460,446,806 468,499,336 358,812,088Current liabilitiesProvisions 15 471,601,638 390,876,596 964,075,282Bank overdraft 16 1,517,496,181 427,416,695 316,008,855Suppliers, accrued expenses and other credit balances 19 1,462,623,225 1,916,376,233 1,257,567,663Due to tax authority 20 102,653,437 151,264,190 170,924,554Advances from customers 619,312,672 883,068,862 429,927,621Due to related parties 13/ c 396,294,519 613,892,330 750,271,522Settlement of right of sale liability 21 342,941,925 262,308,793 217,686,117 Total current liabilities 4,912,923,597 4,645,203,699 4,106,461,614Liabilities related to non-current assets held for-sale - 62,765,967 54,811,336
Total liabilities 5,373,370,403 5,176,469,002 4,520,085,038Total equity and liabilities 8,036,923,228 9,205,719,793 9,889,334,937
- The accompanying notes on pages 8 to 65 form an integral part of these financialstatements.
- Independent auditor’s report – attached
Sherif El Masry Dominik Michel José Maria Magrina Hayrullah Hakan GürdalAccounts Manager Financial Direc Managing Director Board Chairman

70
Suez Cement | Annual Report 2019
Cairo on 5 March 2020
(All amounts in Egyptian Pounds) Note 2019 Restated2018
Sales 27 6,461,097,865 7,428,390,738
Cost of sales 32 (6,524,040,046) (6,802,830,808)
Gross (loss)/ profit (62,942,181) 625,559,930
General and administration expenses 33 (521,777,255) (475,035,486)
Investment income in an associate 4,289,672 5,474,646
Dividends revenues 85,876 114,147
Provisions formed 15 (407,947,861) (38,635,260)
Provisions no longer required 15 15,393,479 65,828,515
Other operating expenses 28 (242,526,037) (68,695,214)
Other operating income 29 182,641,559 177,297,194
Impairment in goodwill 8 (177,714,296) (1,595,778,049)
Operating losses (1,210,497,044) (1,303,869,577)
Finance (expenses) income - net 30 (242,444,782) (28,152,879)
Loss for the year before income taxes (1,452,941,826) (1,332,022,456)
Deferred income taxes for the year (8,167,048) (84,913,152)
Income taxes for the year 31 (33,098,890) (32,799,615)
Losses from the year from continued operations (1,494,207,764) (1,449,735,223)
Discontinued operations
Net profits from discontinued operations 7 1,161,878 28,634,983
Profits on sale from discontinued operations 7 314,460,976 102,788,922
Profits for the year from discontinued operations 315,622,854 131,423,905
Net losses for the year (1,178,584,910) (1,318,311,318)
Profit attributable to:
Shareholders of the parent company (977,683,108) (1,387,416,448)
Non-controlling interests (200,901,802) 69,105,130
(1,178,584,910) (1,318,311,318)
Net profit attributable to the parent company’s shareholders
Continued operations (1,293,305,962) (1,518,840,353)
Discontinued operations 315,622,854 131,423,905
(977,683,108) (1,387,416,448)Loss per share (basic/diluted) for the continued and discontinued operationsContinued operations per share 34 (7,11) (8,35)
Discontinued operations per share 34 1,73 0,72
(5,38) (7,63)
The accompanying notes on pages 7 to 65 form an integral part of the financial statements

71
(All amounts in Egyptian Pounds) 2019 2018
Net loss for the year (1,178,584,910) (1,318,311,318)
Other comprehensive income
Items that may be reclassified in profit or loss
Foreign currency translation differences (74,435,205) 166,791,736
Items will not be reclassified in profit or loss
Remeasurement of defined benefit plan outcome - (actuarial losses) (8,550,318) 3,052,672
Total items may be reclassified in profit or loss (82,985,523) 169,844,408
Total other comprehensive income items for the year (1,261,570,433) (1,148,466,910)
Total comprehensive loss for the year
Owners of the parent company (1,024,195,381) (1,299,299,990)
Non-controlling interests (237,375,052) 150,833,080
Total comprehensive loss (1,261,570,433) (1,148,466,910)
Total comprehensive loss attributable to the parent company’s shareholders fromContinued operations (1,339,818,235) (1,430,723,895)
Discontinued operations 315,622,854 131,423,905
(1,024,195,381) (1,299,299,990)
The accompanying notes on pages 7 to 65 form an integral part of the financial statements.

72
Suez Cement | Annual Report 2019
(All
amou
nts
in E
gypt
ian
Poun
ds)
Cap
ital
Issu
ed a
nd
paid
-up
Oth
er
Res
erve
of
unr
ealiz
ed
gai
n on
avai
labl
e-
for
-sal
e
inve
stm
ents
For
eign
tra
nsac
tion
s
tra
nsla
tion
dif
fere
nces
rese
rve
Ret
aine
d
ear
ning
s
(Acc
umul
ated
loss
es)
Tota
l N
on-c
ontr
ollin
g
inte
rest
s
Tot
al
Equi
ty
Bala
nce
at J
anua
ry 1
, 201
890
9,28
2,53
52,
668,
886,
627
327,
001
260,
113,
607
1,26
4,91
4,11
35,
103,
523,
883
483,
412,
133
5,58
6,93
6,01
6
Adj
ustm
ents
on
reta
ined
earn
ings
and
non
-co
ntro
lling
inte
rest
s
-(2
62,3
08,7
93)
-
-
(80,
364,
875)
(342
,673
,668
)(1
,074
,823
)(3
43,7
48,4
91)
Sett
lem
ent
of n
on-
con
trol
ling
inte
rest
s in
Hila
l C
emen
t G
roup
equ
ity -
Kuw
ait
-
-
-
-
-
-
10,3
21,6
2710
,321
,627
Adj
ustm
ents
to
equi
ty re
late
d to
sha
re c
apita
l of
Hel
wan
Cem
ent
-
-
-
-
(92,
267)
(92,
267)
-
(92,
267)
Com
preh
ensi
ve in
com
eite
ms
-
-
-
85
,063
,786
(1,3
84,3
63,7
76)
(1,2
99,2
99,9
90)
150,
833,
080
(1,1
48,4
66,9
10)
Tot
al c
ompr
ehen
sive
inco
me
for
the
year
-
-
-
85
,036
,786
(1,3
84,3
63,7
76)
(1,2
99,2
99,9
90)
150,
833,
080
(1,1
48,4
66,9
10)
Tra
nsfe
rred
to
reta
ined
earn
ings
-
-
-
-
-
-
--
Div
iden
ds a
nd a
djus
tmen
tsto
reta
ined
ear
ning
s
-
-
-
-(5
5,52
6,06
1)(5
5,52
6,06
1)(2
0,17
3,12
3)(7
5,69
9,18
4)
Bal
ance
at
31 D
ecem
ber
2018
(res
tate
d)90
9,28
2,53
52,
406,
577,
834
327,
001
345,
177,
393
(255
,432
,866
)3,
405,
931,
897
623,
318,
894
4,02
9,25
0,79
1

73
(All
amou
nts
are
show
n in
Egyp
tian
Poun
ds)
Cap
ital
Issu
ed a
nd
paid
-up
Oth
er
Res
erve
of
unr
ealiz
ed
gai
n on
avai
labl
e-
for-s
ale
inve
stm
ents
For
eign
tran
sact
ions
tran
slatio
n
diff
eren
ces
rese
rve
Ret
aine
d
ear
ning
s
(Acc
umul
ated
loss
es)
Tota
l N
on-c
ontr
ollin
g
inte
rest
s
Tot
al
Equi
ty
Bal
ance
at 1
Janu
ary
201
9 (a
s pr
evio
usly
issue
d)90
9,28
2,53
52,
668,
886,
627
327,
001
256,
951,
432
1,26
7,45
2,95
45,
102,
900,
549
604,
625,
725
5,70
7,52
6,27
4
Prio
r yea
rs s
ettle
men
ts (N
ote
38)
-
(262
,308
,793
)
-88
,225
,961
(1,5
22,8
85,8
20)
(1,6
96,9
68,6
52)
18,6
93,1
69(1
,678
,275
,483
)
Bal
ance
at 1
Janu
ary
2019
(rest
ated
)90
9,28
2,53
52,
406,
577,
834
327,
001
345,
177,
393
(255
,432
,866
)3,
405,
931,
897
623,
318,
894
4,02
9,25
0,79
1
Profi
ts fo
r the
yea
r
-
-
--
(986
,233
,426
)(9
86,2
33,4
26)
(200
,901
,802
)(1
,187
,135
,228
)
Com
preh
ensiv
e in
com
e ite
ms
for
the
year
-
-
-
(37,
961,
955)
-(3
7,96
1,95
5)(3
6,47
3,25
0)(7
4,43
5,20
5)
Tot
al c
ompr
ehen
sive
inco
me
for
the
year
-
-
-
(37,
961,
955)
(986
,233
,426
)(1
,024
,195
,381
)(2
37,3
75,0
52)
(1,2
61,5
70,4
33)
Div
iden
ds
-
-
-
-(3
8,25
0,75
8)(3
8,25
0,75
8)(6
5,87
6,77
5)(1
04,1
27,5
33)
Bala
nce
at 3
1 D
ecem
ber 2
019
909,
282,
535
2,40
6,57
7,83
432
7,00
130
7,21
5,43
8(1
,279
,917
,050
)2,
343,
485,
758
320,
067,
067
2,66
3,55
2,82
5
The
acco
mpa
nyin
g no
tes
on p
ages
7 t
o 65
for
m a
n in
tegr
al p
art
of t
he fi
nanc
ial s
tate
men
ts.

74
Suez Cement | Annual Report 2019
(All amounts in Egyptian Pounds) Note 31 December
2019
31 December
2018Cash flows from operating activitiesLosses for the year before income taxes from continued operations (1,454,103,704) (1,332,022,456)Profits for the year before income taxes from discontinued operations 316,784,732 128,893,267
(1,137,318,972) (1,203,129,189)Adjusted to:Depreciation of fixed assets 448,376,901 461,990,403Impairment of inventories 10 453,492 (45,302,078)Provisions 15 407,947,861 38,635,260Provisions no longer required 15 (15,393,479) (65,828,515)impairment of trade and notes receivable 20,658,195 18,821,837Impairment of other debit balances 23,174,412 755,348Impairment of the shop’s goodwill 177,714,296 1,595,778,049Settlement of right of sale liability 80,633,132 -Formed against retirement benefits plan 8,910,996 11,006,361Investment income in associates (4,289,672) (5,474,646)Gain from sale of property, plant and equipment (68,787,413) (106,351,648)Disposal profits of discontinued operations 7 (315,622,854) (102,788,922)Adjustments on fixed assets - (221,564,388)Unrealized foreign currency (719,502) 85,063,786Financing expenses 306,875,123 53,230,165Interest payable (23,426,823) (33,132,286)Operating profits (losses) before changes in working capital (90,814,307) 481,709,537Change in inventories 92,415,521 (421,206,069)Change in different debtors and other receivables 115,045,315 (302,687,243)Change in suppliers and accrued expenses and other credit balances (935,107,009) 975,570,619Paid interests (306,875,123) (53,230,165)Paid income taxes (83,969,363) (56,940,404)Payments against retirement benefit plan (64,893,047) (7,398,263)Utilised provisions (311,829,340) (541,005,431)Net cash (used in) generated from operating activities (1,586,027,353) 74,812,581Cash flows from investing activitiesPayments to purchase fixed assets (59,402,309) (110,224,850)Proceeds from sale of fixed assets 99,130,809 142,149,897Payments for fixed assets under construction (195,446,274) (309,504,254)Dividends from investments in subsidiaries 9 4,950,000 6,263,496Proceeds from discontinued operations sale 7 685,892,258 166,498,475Interests payable received 23,426,823 33,132,286Net cash generated from (used in) investing activities 558,551,307 (71,684,950)Cash flows from financing activitiesChange in medium term loans and other long term obligations (13,222,993) 32,660,998Proceeds from bank overdrafts 1,090,079,486 111,407,840Dividends paid (38,250,758) (55,658,301)Dividends paid for minority interests 24 (65,876,775) (20,173,123)Net cash generated from (used in) financing activities 972,728,960 68,237,414
Net decrease in cash and cash equivalents - during the year (54,747,086) 71,365,045Cash and cash equivalents at beginning of the year 798,121,644 726,756,599Cash and cash equivalents at end of the year 743,374,558 798,121,644
Non-cash transactions:* An amount of EGP 28,628,265 has been disposed from the inventory item and that is the held inventory amount as part against the sale of discontinued operations
The accompanying notes on pages 7 to 65 form an integral part of the financial statements.

75
1. IntroductionSuez Cement Company (SAE) was incorporated in 1977 as an Egyptian joint stock company in accordance with the provisions of Law No. 43 of 1974, as amended by Law No. 230 of 1989 which was amended by Law No. 8 of 1997. The Company is registered in the commercial register under number 181134 Cairo.Heidelberg Cement company (after acquiring 100% of its shares of Italcementi Group through its subsidiaries) owns 55% of the company’s capital as at 31 December 2016.The purpose of the Company is to produce various types of cement and other products from the cement industry associated with it, production of other construction materials, construction supplies and trade it, mining and quarrying, except sand and aggregate. The company may have an interest or participate in any way with the authorities that carry out works similar to companies’ work or which may cooperate to achieve its purpose in Egypt or abroad. It may also merge into mentioned entities, or purchase or attach to the authorities with the approval of the Investment and Free Zones Authority.The consolidated financial statements of the Company for the year ended 31 December 2019 were signed by the company’s Managing Director on 5 March 2020 and will be presented to the upcoming BOD meeting for ratification.The following is a background of Suez Cement Group companies and the direct and indirect contribution percentages of Suez Cement Company (SAE) in its subsidiaries as follows:
31 December 2019
%
31 December 2018
%Portland Tourah Egypt Company (S.A.E) 66,12 66,12
Helwan Cement Company (S.A.E) 99,55 99,55
Ready Mix Concrete El - Alamya (S.A.E) 52 52
Hilal Cement Group (SAK) 51 51Development & Construction Materials Co. Egypt “Decom” (S.A.E)
Subsidiary of Ready Mix Beton Company - Egypt (S.A.E) at 99.99%52 52
Suez for transportation and trading Company (S.A.E) - Subsidiary of Helwan Cement Company (S.A.E) at 55% 96,37 96,37
Suez for Import & Export (S.A.E) 96,37 96,37
Tourah Portland Cement Egyptian Company (SAE)Tourah Portland Cement Egyptian Company (SAE) was established on 23 June 1927 and the legal form of the company was changed from the period sector to the business sector according to Law 203 of 1991.On 26 January 2000, the share of the Holding Company for Mining and Refractories was sold in the share capital until the percentage of sold shares reached 81.4% of the total shares of the company. Suez Cement Company (SAE) acquired 66.12% of the shares. Thus, the company came out of the application of the provisions of the Business Sector Law 203 of 1991 and its executive regulations. The company was then subject to Law 159 of 1981 and became a subsidiary of Suez Cement Company since that date.On 12 March 2000, the General Assembly decided to amend its status in accordance with Law 159 of 1981 and its executive regulations.The main purpose of the company is to manufacture all kinds of Portland cement, lime, construction materials and products.
The acquisition cost amounted to EGP 1,287 billion, resulting in a goodwill of EGP 746,008,413, which was treated as the share of Suez Cement Company in the fair value of the assets of Tourah Cement Egyptian Company (SAE). Accordingly, the values of the fixed assets of Tourah Portland Cement Egyptian

76
Suez Cement | Annual Report 2019
Company (SAE) are recognised in the consolidated financial statements at their historical cost in addition to the share of Suez Cement Company in the increase in the fair value of these assets over historical cost. The surplus of the fair value over the historical cost is depreciated using the straight-line method based on the estimated useful life for each type (Note 4-3).The total amortisation at 31 March 2019 amounted to EGP 737,143,699 in addition to reducing the fair value of some currently discontinued production lines of an amount of EGP 8,864,714.
Suez Bags Company (SAE) In accordance with the resolution of the Board of Directors of Suez Cement Company, with approval on the sale of all its shares in the company to a Mondi Bags “Mondi Industrial Bags BV”. - On 06 August 2018 Suez Bags Company was sold on the Egyptian Stock Exchange.
Helwan Cement Company (SAE) Helwan Cement Company (SAE) (formerly ASEC Cement Company) was established in accordance with the provisions of Law 159 of 1981 on 26 December 1999 under the name of Al-Ahram Cement Company (SAE) and was registered in Commercial Register under No. 4451 on 26 December 1999.In accordance with the resolution of Extraordinary Assembly held on 14 September 2000, the Company’s name was changed to ASEC Cement Company (SAE), and on 29 November 2001 the extraordinary assembly approved the merge of the company with Helwan Portland Cement Company (SAE) as of 1 October 2001 and according to the resolution of the extraordinary assembly on 17 March 2003 the assets and deductions assessment was approved according to the committee’s resolution by Capital Market Authority on 25 September 2002 with No. 540 0f 2002 and the ministerial resolution No. (1699). As ASEC Cement Company (SAE) replaces Helwan Portland Cement legally with its assets and liabilities.On 1 October 200, the managements of the two companies terminated all legal procedures related to merger. The merger was registered in the commercial registration no. 3142 on 30 June 2003 and Helwan Portland Cement Company (SAE) was written off from the commercial register on 29 June 2003.On 30 March 2006, the Extraordinary Assembly decided to amend some of the provisions of the Articles of Association including the name of the Company, to become Helwan Cement Company (SAE) instead of ASEC Cement Company (SAE).The Extraordinary General Assembly Resolution was adopted by the Companies Authority on 2 May 2006 and was registered in the Commercial Register on 6 November 2006 by amending the Company’s name to Helwan Cement Company (Egyptian Shareholding Company). The amendment of the company’s name was registered in the commercial registration on 6 November 2006 to be Helwan Cement Company (SAE).The main purpose of the company is to manufacture all kinds of cement, building materials, quarry extract, related items or other companies as well as marketing them in the Arab Republic of Egypt or exporting them abroad and manufacturing bags for packing cement and building materials from craft paper.On 25 August 2005, Suez Cement Company (SAE) acquired the shares of Helwan Cement Company (SAE) (formerly ASEC Cement Company). The shareholding of Suez Cement Company (SAE) 98.99% for 116151662 shares, The nominal value of the share is EGP 10 resulting in goodwill of EGP 2,454,952,377 representing the difference between the investment cost of EGP 3,413,255,262 and 98.69% of the net value of the assets of Helwan Cement Company (SAE) (formerly ASEC Cement Company) on the date of acquisition amounted to EGP 958,302,925.Goodwill is recognised in long-term assets in the consolidated financial statements. Impairment of goodwill is tested on the date of the consolidated financial statements periodically and in the event of a loss arising from impairment of goodwill, it is included in the consolidated statement of profit and loss.On 31 December 2018, goodwill was tested for impairment resulting in a decrease in the goodwill of the shop which was included in the consolidated profit and loss statement of EGP 1,540,475,000. Accordingly the goodwill of the shop will be Helwan Cement Company (SAE) of EGP 914,477,377.

77
Helwan Cement Company (S.A.E) (continued)On 28 October 2007, Helwan Cement Company (SAE) contributed to the establishment of Suez for transportation and trading Company (SAE) with 55% of the capital and and the contribution of Suez Cement Company (SAE) and Tourah Portland Cement Egyptian Company (SAE) by 35% and 10% respectively. Thus, the direct indirect contribution of Suez Cement Company (SAE) to the capital of Suez for transportation trading Company reached 96.37%.During 2010, Helwan Cement Company (SAE) purchased 92.690 shares of the Company’s shares (treasury shares) amounting to EGP 34,063,566.On 6 December 2010, the Extraordinary Assembly issued a resolution to reduce the issued capital of the Company by 921690 shares and to reduce the nominal value of the share to EGP 5 instead of EGP 10. Accordingly, the number of shares outstanding has reached 116775085 shares.
Suez for transportation and trading Company (SAE)Suez for transportation and trading Company (SAE) was established on 28 October 2007 as an Egyptian joint stock company subject to the Law 159 of 1981. The purpose of the company is to manage cement transportation, cement trade, building materials and owning a fleet of trucks.
Ready Mix Concrete Production Company (SAE) - ( formerly Ready Mix Beton Company)Ready Mix Concrete Production Company (SAE) was established on 16 March 1986 in accordance with the provisions of the Law no. 159 of 1981.The Company’s purpose is represented in producing and manufacturing of building materials and specially ready mixed concrete production.On 1 October 2006, Suez Cement Company (S.A.E) acquired the shares of Ready Mix Concrete Production Company (S.A.E).The shareholding of Suez Cement Company (S.A.E) 52% for 260000 shares, The nominal value of the share is EGP 10 resulting in goodwill of EGP 23,113,779 representing the difference between the investment cost of EGP 26,277,866 and 52% of the net value of the assets of Ready Mix Concrete Production Company (S.A.E) on the acquisition date amounted to EGP 3,164,087.Goodwill is recognised in non-current assets in the consolidated financial statements. Impairment of goodwill is tested on the date of the financial statements periodically and in the event of a loss arising from impairment of goodwill, it is included in the consolidated statement of income.In accordance with the Extraordinary Assembly resolution held on 25 September 2008, the Company’s name was changed to Ready Mix Concrete Production Company (S.A.E).The company was merged to form Universal Ready Mix Concrete (S.A.E), which was established on 21 February 2012.
Global Ready Mix Concrete Company (S.A.E)-( formerly Ready Mix Beton Egypt Company) Global Ready Mix Concrete Company (S.A.E)-(formerly Ready Mix Beton - Egypt Company) was established on 14 April 1996 in accordance with the provisions of Investment Guarantee and Incentives Law No.8 of 1997.The Company’s objective is producing and manufacturing of building materials specially producing ready mix concrete.On 1 October 2006, Suez Cement Company (S.A.E) acquired the shares of Ready Mix Beton - Egypt (S.A.E).The shareholding of Suez Cement Company (S.A.E) 52% for 520000 shares, The nominal value of the share is EGP 10 resulting in goodwill of EGP 46,308,524 representing the difference between the investment cost of EGP 52,554,993 and 52% of the net value of the assets of Ready Mix Concrete Beton - Egypt (S.A.E) on the date of acquisition amounted to EGP 6,246,469.In accordance with the Extraordinary Assembly resolution held on 25 September 2008, the Company’s name was changed to Global Ready Mix Concrete Company (SAE).The Company was merged to form Universal Ready Mix Concrete Company (SAE), which was established on 21 February 2012.

78
Suez Cement | Annual Report 2019
Universal Ready Mix Concrete Company (SAE)Universal Ready Mix Concrete Company (SAE) according to Law no. 8 of 1997 on 21 February 2012, as a result of the merger of the companies of Ready Mix Concrete Company and Universal Ready Mix Concrete Company.The Extraordinary Assembly of the Company held on 26 February 2012 decided to change the name of the Company to become Universal Ready Mix Concrete Company.The Company’s objective is producing and manufacturing of building materials specially producing ready mix concrete.The merger was carried out in accordance with the consolidated assets and deductions assessment of the consolidated company as at 31 December 2009, taking into consideration changes in the financial position up to the date of the inception of the Company on 21 February 2012.On the occasion of the merger of the Ready Mix Concrete Company (SAE) ( a subsidiary) and Global Ready Mix Concrete Company (SAE) (a subsidiary), resulted in an increase in fixed assets value of EGP 129,758,310 was included in the fixed asset additions In exchange for a decrease in goodwill of EGP 68,686,548 and a decrease in minority interest of EGP 61,071,762. Thus, Universal Ready Mix Concrete Company (SAE) becomes an amount of EGP 735,755.
Development & Construction Materials Co. Egypt “Decom” (SAE)Development & Construction Materials Co. Egypt “Decom” (SAE) was established in 3 August 1996 as Egyptian Joint Stock Company subject to Law No. 95 of 1992, the company’s objective is manfucturing cement and building materials.On 5 July 2007, Global Ready Mix Concrete Company (SAE) acquired 99.99% of the shares of Development & Construction Materials Co. Egypt “Decom” (SAE) representing 7364524 shares. The nominal value is EGP 10 per share resulted in goodwill of EGP 43,548,446 represents the difference between the investment cost of EGP 63,565,568 and 99.99% of the net value of the assets of Development & Construction Materials Co. Egypt “Decom” (SAE) at the acquisition date of EGP 20,017,122.Accordingly, the share of Suez Cement Company (SAE) indirectly contributed to 52% in the capital of Development & Construction Materials Co. Egypt “Decom” (SAE). The share of Suez Cement Company (SAE) was included as 52% of the goodwill of the amount of EGP 43,548,446 in the goodwill account in the consolidated financial statements.
Hilal Cement Company (SAK)Hilal Cement Company (SAK) was established on 19 January 1984 as a Kuwait Closed Joint Stock Company. The Company’s objective is to import, store and distribute cement products.On 19 September 2007, Suez Cement Company (SAE) acquired the shares of Hilal Cement Company (SAK). The share of Suez Cement Company (SAE) was 51% for 16830000 shares. The nominal value is KWD 0.10 per share resulted in goodwill amounts to KWD 5,434,286 equivalent to EGP 108,641,431 represents difference between the investment cost of KWD 13,128,213 equivalent to EGP 262,457,272 and 51% of the net asset value of Hilal Cement Company (SAK) at the date of acquisition of KWD 7,693,927 equivalent to the amount of EGP 153,815,841.Based on the contracts for the purchase of Hilal Cement Company (SAK). As the old partners settled the due debt of Hilal Cement Company (SAK) with the Kuwaiti Government, Suez Cement Company (SAE) paid KWD 409,779 equivalent to EGP 7,958,544 represents 51% of the debt settlement, and was charged at the expense of goodwill, thus the goodwill of Hilal Cement Company (SAK) of EGP 116,599,975.In addition, there is goodwill related to Hilal Company and its subsidiaries of KWD 5,047,444 equivalent to EGP 111,378,059, therefore, the goodwill of Hilal Cement Company (SAK) amounts to EGP 227,978,034.Goodwill is recognised in non-current assets in the consolidated financial statements. Impairment of goodwill is tested on the date of the financial statements periodically and in the event of a loss arising

79
from impairment of goodwill, it is included in the consolidated statement of profit and loss.The Company’s accounts have been held in Kuwaiti Dinars and the financial statements have been consolidated in the consolidated financial statements after being translated into Egyptian Pound using the translation procedures referred to in note (3). The total translation differences arising from the translation and related to the Holding Company’s rights amounting to EGP 307,215,438 31 December 2019 as a separate item in the consolidated statement of equity.The total translation differences arising from translation, which is related to minority interests of EGP 295,167,774, was recognised on 31 December 2019 as part of the minority interests in the consolidated statement of financial position (note 21).
Suez for importation and exportation Company (SAE)Suez for importation and exportation Company (SAE) was established on8July 2009 according to the provisions of Law no. 159 of 1981 and its amendments. The Company is registered under commercial register no. 39989 on 8 July 2009.The Company’s objective is importing and exporting cement and all building materials.On 10 August 2015, Suez for Transportation and Trading Company (SAE) acquired 100% of Suez for Importation and exportation Company (SAE) capital. As a result, the contribution of Suez Cement (SAE) indirectly in the capital of Suez for Transportation and Trading Company (SAE) reached 96.37% .
2. ACCOUNTING POLICIESThe principal accounting policies applied in the preparation of these consolidated financial statements are summarised below, which are applied consistently over the presented financial periods unless otherwise stated:
A. Basis of preparation of the consolidated financial statementsThese consolidated financial statements have been prepared in accordance with Egyptian Accounting Standards (EASs) and the relevant laws, and on the basis of the historical cost convention, except for the settlement liability of the sale option right measured at the liability’s fair value, which are measured at fair value, and the employees’ defined benefits obligations, which are measured at the present value of the obligations.The Group presents its assets and liabilities in the statement of financial position based on current/ non-current classification. The asset is classified as current when it is:* Expected to be realised or intended to be sold or used in normal operating course.* Held primarily for trading.* Expected to be realised within 12 months after the end of the financial reporting period, or* Cash or cash equivalents unless restricted from being exchanged or used to settle a liability for at least twelve months after the financial reporting period.All other assets are classified as non-current.The liability is classified as current when:* It is expected to be settled in the normal operating course.* Held primarily for trading.* Required to be settled within 12 months after the end of the reporting period, or* The entity does not have an unconditional right to defer the settlement of the liability for at least twelve months after the end of the reporting period.The Group classifies all other liabilities as non-current. Deferred tax assets and liabilities are classified as non-current.The preparation of the consolidated financial statements in conformity with EASs requires the use of certain critical accounting estimates and assumptions. It also requires the Group’s management to

80
Suez Cement | Annual Report 2019
exercise its judgement in the process of applying the Group’s accounting policies. Note (4) describes the significant accounting estimations and assumptions of these consolidated financial statements, as well as significant judgements used by the Group’s management when applying the Group’s accounting policies.EASs require the reference to the International Financial Reporting Standards (IFRS) when there is no EAS, or legal requirements that explain the treatment of specific balances and transactions.
B. Amended and new standards not yet adopted by the GroupThe Ministry of Investment issued a decision on 28 March 2019 No.69 of 2019 which includes new standards and amendments on the current standards. Amendments were published in the Official Gazette on 7 April 2019. These changes are mainly represented in three new standards that should be applied for financial periods beginning on or after 1 January 2020 as follows:
Standard name EAS (47) “Financial instruments”
Nature of the change The new impairment menu requires recognition of the impairment allowances based on the expected credit losses instead of the incurred credit losses solely, in accordance with EAS 26. It is applied to financial assets classified at amortised cost and debt instruments measured at fair value through other comprehensive income and contract assets under EAS 48, “Revenues from contracts with clients”, lease receivables, loan commitments, and some financial guaranteescontracts.
Effect The Group has reviewed its financial assets and liabilities, and according to the initial assessmentby the management to date, the Group expects that this new standard will have a material im-pact on the increase in the impairment of customers and other receivables.
The new standard also provides extended requirements for disclosure and changes in presenta- tion. It is expected to change the nature and size of the Group’s disclosures regarding its financialinstruments, especially in the year which the new standard is applied.
Mandatory date ofapplication/ imple-
mentation by theGroup
This standard is applied for financial periods beginning on or after 1 January 2020. Early adop-tion is permitted.
B. Amended and new standards not yet adopted by the Group (continued)
Standard name EAS (48) “Revenues from contracts with customers”
Nature of thechange
A new standard for revenues recognition was issued, replacing EAS 11 which covers contracts forsales of goods and services and EAS 8 which covers construction contracts. The new standard is based on the revenues recognition convention upon transferring control ongoods or services to the client.
Effect
The management assessed the effects of applying the new standard on the Group’s financial state- ments, and it has specified the effect as follows:
Reclassification of advances to customers to contracts obligations.
Mandatory date ofapplication/ imple-
mentation by theGroup
This standard is applied for financial periods beginning on or after 1 January 2020. Early adoptionis permitted
Standard name EAS (49) “Lease contracts”: Stage 2 (Operating leases)
Nature of thechange
EAS 49 for leases was issued, which requires adoption for financial periods beginning on or after 1 January 2020. In accordance with the new standard, in the statement of financial position, an asset (the right to use the leased asset) and a financial obligation to settle the lease payments arerecognised. This excludes short-term and small-value leasing contracts.
There is no material effect of the new standard on the lessor’s books.

81
Effect The management has assessed the effects of applying the new standard to the Group’s financial statements, and has reviewed the operating lease arrangements of the Group during the previous year in light of the new operating lease accounting rules.
The Group has no activities in which it functions as a lessee or as a lessor for operating leases, and therefore does not expect a significant impact on the financial statements. However, there will besome new notes required starting from the next year.
Mandatory date ofapplication/ imple-
mentation by theGroup
The Group will apply EAS (49) on operating leases from the mandatory date of application from 1 January 2020. The Group intends to use the practical means provided by the standard and thecomparison figures for the year. It will not be modified before the initial application of the stan- dard. Usufruct assets arising from operating leases will be measured at the amount of the leaseobligation at the date of the initial application (adjusted at any advance or due rental expense).
C. Basis of consolidation1. SubsidiariesSubsidiaries are all entities (including structured entities) over which the Group has control. The Group controls an entity when the group is exposed to, or has rights to, variable returns from its involvement with the entity and has the ability to affect those returns through its power over the entity. Subsidiaries are fully consolidated from the date on which control is transferred to the Group. They are de-consolidated from the date that control ceases.
1.1 Acquisition methodThe Group applies the acquisition method to account for business combinations.The consideration transferred in a business combination is measured at the fair value accounted for as the fair value of the assets transferred and the liabilities incurred by the Group to the former owners of the acquiree and the equity interests issued by the Group. The consideration transferred includes the fair value of any asset or liability resulting from a contingent consideration arrangement. Identifiable assets acquired and liabilities and contingent liabilities assumed are measured at their fair values at the acquisition date. In any business combination, the Group recognises any non-controlling interests in the subsidiary at the proportionate share of the recognised amounts of acquiree’s identifiable net assets at the date of acquisition.Acquisition-related costs are expensed as incurred.If the business combination is achieved in stages, the Group re-measures the previously held equity interest in the acquiree at fair value in the acquisition date. Any gain or loss arising from such re- measurement are recognised within other comprehensive income.Inter-company assets, liabilities, equity, income, expenses and cash flows related to transactions between the Group’s companies are eliminated. When necessary, amounts reported by subsidiaries have been adjusted to conform with the Group’s accounting policies.
1.2 Changes in ownership interests held within controlling interestsWhen the ratio of equity held within controlling interests changes, the Group changes the amounts recorded for controlling and non-controlling shares to reflect such changes in the relevant shares in the subsidiary. The Group recognises directly within the equity of the parent company any difference between the amount of changing the non-controlling shares and the fair value of the consideration paid or received.
1.3 Disposal of subsidiariesWhen the Group ceases to have control, the Group recognises any retained investment in the company that was a subsidiary at its fair value at the date when control is lost, with the resultant change recognised as profit or loss attributable to the owners of the parent company.

82
Suez Cement | Annual Report 2019
1.4 GoodwillGoodwill arises on the acquisition of subsidiaries and represents the excess of the consideration transferred, the amount of any non-controlling interest in the acquiree and the acquisition-date fair value of any previous equity interest in the acquiree over the fair value of the identifiable net assets acquired, liabilities, and contingent liabilities at the date of acquisition. If the consideration transferred, non-controlling interest in the acquiree and the date of acquisition fair value of the Group’s equity previously held at the acquiree is less than the net of the identifiable acquired assets, liabilities, and contingent liabilities assumed at the date of acquisition, the Group recognises the gain resulting from profits and losses at the date of acquisition and the gains are attributed to the Group.For the purpose of impairment testing, goodwill acquired in a business combination is allocated to each of the Group’s CGUs, or groups of CGUs, that is expected to benefit from the synergies of the combination. Each unit or group of units to which the goodwill is allocated represents the lowest level within the Group at which the goodwill is monitored for internal management purposes.The Group undertakes impairment reviews of goodwill acquired in a business combination annually if indicators or evidence indicate impairment of the CGU by comparing its carrying amount including goodwill with its recoverable amount, which is the higher of fair value less costs to sell and value in use. The Group recognises any impairment loss immediately in profit or loss, and is not subsequently reversed.
1.5 Measurement periodThe measurement period is the period required for the Group to obtain the information needed for initial measurement of the items resulting from the acquisition of the subsidiary, and does not exceed one year from the date of acquisition. In case the Group obtains new information during the measurement period relative to the acquisition, amendment is made retrospectively for the amounts recognised at the date of acquisition.
2. AssociatesAssociates are all entities over which the Group has significant influence but not control, generally accompanying a shareholding of between 20% and 50% of the voting rights in the associate.
2.1 Equity method in accountingInvestments in associates are accounted for using the equity method of accounting. In accordance with the equity method, the investment is initially recognised at cost, and the carrying amount is increased or decreased to recognise the investor’s share of the profit or loss of the investee company after the date of acquisition from the change in the company’s share of the associate’s net assets. The Group’s share of profit or loss after acquisition is recognised in the statement of profit or loss, and its share in the movement after acquisition is recognised in other comprehensive income with a corresponding adjustment to the investment’s carrying amount. In addition to the Group’s share of changes in equity after the acquisition date.
2.2 Changes in equityIf the ownership interest in an associate is reduced but significant influence is retained, only a proportionate share of the reduction rate of the amount of profit or loss previously recognised in other comprehensive income is reclassified to profit or loss, if necessary, when relevant assets or liabilities are disposed of.
2.3 Losses of an associate:When the Group’s share of losses in an associate equals or exceeds its interest in the associate, the Group ceases to recognise its further losses. Once the Group’s share is reduced to zero, any further losses are

83
recognised but only to the extent of incurred legal or constructive obligations or made payments on behalf of the associates. When those companies start generating profits in subsequent periods, the Group resumes to recognise its share in those profits, only after its share of profits equals its share in unrecognised losses.
2.4 Transactions with associatesProfits and losses resulting from upstream and downstream transactions between the Group (including its subsidiaries) and the associate are recognised in the Group’s financial statements to the extent of other investor’s interests in the associate.D. Foreign currency translation(1) Functional and presentation currencyThe financial statements of each of the Group’s companies are measured and presented using the currency of the primary economic environment in which the Group operates (‘the functional currency’). The consolidated financial statements are presented in Egyptian Pounds, which represents the Group’s presentation currency.(2) Transactions and balancesTransactions made in foreign currency during the year are initially recognised in the functional currency of the Company on the basis of translation of foreign currency used in the transaction, using the spot prevailing exchange rate between the functional currency and the foreign currency at the date of the transaction, and the monetary items denominated in foreign currency are also translated using the closing rate at the end of each financial period. Foreign exchange gains and losses resulting from the settlement of such monetary items and from the translation of monetary items denominated in foreign currencies at the same period or in previous financial statements, are generally recognised by the Group in the profit and loss in the period in which these difference arise, except when currency exchange differences resulting from the translation of non-monetary item are deferred in other comprehensive income, which constitutes an effective part of net investment hedges in a foreign operation or an effective part of cash flow risk hedges.
D. Foreign currency translation (continued)Exchange differences resulting from the changes in the amortised cost of the monetary financial asset available for sale are recognised in gains and losses. Any changes in the carrying amount are recognised within other comprehensive income.Translation differences on non-monetary financial assets and liabilities are recognised as part of the fair value gain or loss. Translation differences on non-monetary financial assets and liabilities such as equity instruments held at fair value through profit or loss are recognised as profit or loss as part of fair value gain or loss. For available for sale financial assets, which do not represent monetary items (e.g. equity instruments), gains or losses recognised within other comprehensive income include any elements of related foreign currencies swaps.
E. Fixed assetsThe Group applies the cost model at measured of fixed assets, and the fixed assets are recognised on their costs net of the accumulated depreciation and accumulated impairment losses. The cost of fixed asset includes any costs directly associated with bringing the asset to a working condition for its use intended by the management of the Group.The Group recognises subsequent costs of the acquisition of the fixed asset as a separate asset, only when it is probable that future economic benefits will flow to the Group and the cost of the item can be measured reliably. The Group recognises in the carrying value of fixed asset the cost incurred to replace part of that asset on the date such costs are borne, and the carrying amount of replaced parts are de-

84
Suez Cement | Annual Report 2019
recognised. The Group recognises the costs of daily servicing of the fixed asset in the statement of profit or loss.The straight line method is used to allocate the depreciation of fixed assets consistently to their residual values over their estimated useful lives, except for lands, which are characterised with unlimited estimated useful life. Below are the estimated useful lives of each type of the assets’ groups:
- Buildings 6 - 20 years
- Machinery, equipment and moulds 5 - 20 years
- Vehicles 5 years
- Furniture and office equipment 5 - 10 years
The Group reviews the residual value of fixed assets and estimated useful lives of fixed assets at the end of each fiscal year, and adjusted when expectations differ from previous estimates.The book amount of the fixed asset is reduced to the amount of recoverable value, if the recoverable value of an asset is less than its carrying amount. This reduction is considered as a loss resulting from impairment.Gains or losses on the disposal of an item of fixed assets from the books are determined based on the difference between the net proceeds from the disposal of the item and the carrying amount of the item, and the profit or loss resulting from the disposal of fixed assets is included in the statement of profit and loss.
F. Impairment of non-financial assetsIntangible assets that have an indefinite useful life or goodwill are tested annually by the Group for impairment at the date of financial statements.Non-financial assets that have definite useful lives, and they are subject to depreciation or amortisation are tested for impairment whenever events or changes in circumstances indicate that the asset incurred impairment losses.The asset is tested for impairment by comparing its carrying amount with its recoverable amount. The recoverable amount is an asset’s fair value less the higher of costs of disposal or value in use. For the purposes of assessing impairment, assets are grouped at the lowest levels for which there are largely independent cash inflows from other inflows of assets or groups of assets (cash-generating units). The Group recognises impairment losses in the statement of profit or loss whenever the carrying amount of an asset exceeds its recoverable amount. At the end of each financial period the Group assesses whether there is an indication that the impairment loss of any asset other than goodwill, which is recognised in prior years are not impaired, the Group then evaluates the recoverable amount of that asset.Impairment losses recognised in prior years are reversed when there is an indication that such losses no longer exist or have decreased. Loss of impairment, which should not exceed the carrying amount that would have been determined (net of depreciation), are also reversed. Such reversal is recognised in the statement of profit or loss.
G. Intangible assetsGoodwillGoodwill represents the value of excessing the cost of the contributions’ acquisition in subsidiaries over the fair value of the Group’s share in the Group’s net assets acquired at the date of acquisition. Goodwill arising on the acquisition of subsidiaries is included in the intangible assets. The Group’s

85
management annually assesses goodwill to determine whether goodwill’s carrying amount can be fully recovered. The carrying amount of goodwill is reduced if it is higher than its recoverable amount. Any goodwill impairment losses are charged to the consolidated statement of profits or losses and cannot be subsequently reversed.
H. InventoriesInventories are stated at the lower of cost or net realisable value. Cost is determined based on the moving average method. The cost of finished goods and work in progress comprises costs of purchase, costs of conversion and other costs incurred by the Group in bringing the inventory, and excludes borrowing costs. Net realisable value is the estimated selling price in the ordinary course of business, less the costs of completion and selling expenses. The provision’s balance is reduced at the obsolete and slow-moving inventories according to the management’s estimations.
I. Non-current assets (or disposal groups) held for saleThe Group classifies the non-current asset as held-for-sale if their carrying amount will be recovered principally through a sale transaction rather than through continuing use. An asset must be available for immediate sale in its condition without any conditions except the conventional and usual conditions for such assets, and sale is considered highly probable. Until the probability of selling is high, the administration must abide by the plan of selling the asset (the Group disposal). Futher, there shall be an active program for determining the buyer, and it must be expected that the sale will be completed within one year from the date of the reclassification. In the event that the terms of the classification are no longer fulfilled, the assets available for sale (the Group disposal) are reclassified to the fixed assets with depreciation calculated as if the assets were not classified as held for sale. The Group measures the non-current asset, which is classified as assets held for sale on the basis of the lower of carrying amount and fair value less costs to sell.
J. Financial assets1. Classification The Group classifies its financial assets in the following categories: Financial asset at fair value through profits and losses, loans and receivables. The classification of the financial asset depends on the purpose for which the financial assets were acquired. Management determines the classification of its financial assets at initial recognition.Financial assets at fair value through profit or lossFinancial assets at fair value through profit or loss are financial assets held for trading. A financial asset is classified in this category if acquired principally for the purpose of selling or re-purchase in the short-term or as the part of a specified managed financial instruments portfolio. Derivatives are also categorised as held for trading unless they are designated as hedges. Assets in this category are classified as current assets if expected to be recovered within 12 months from the date of the end of financial period.Loans and receivables:Loans and receivables are non-derivative financial assets with fixed or determinable payments that are not quoted in an active market. Financial assets listed in such Group are presented as current asset if expected to be recovered within 12 months from the date of the end of the financial period. The Group’s loans and receivables comprise ‘trade receivables and other debit balances’ and ‘cash and cash equivalents’ due from related parties in the statement of financial position.

86
Suez Cement | Annual Report 2019
2. Initial recognition and measurementA financial asset is recognised when the Group becomes a party to the contractual provisions of the financial asset.The acquisition of a financial asset is initially measured at fair value, in addition to other costs directly associated with the execution of the transaction, except for financial assets that are designated at fair value through profit or loss, which are measured initially at fair value only and all other costs associated with the execution of the transaction are charged to the statement of profit or loss.
3. Subsequent measurementLoans and receivables and held to maturity financial assets are subsequently measured at amortised cost using the effective interest rate. Interests calculated are recognised in the statement of profit or loss within income (costs) - net.
4. De-recognition- Financial assets are derecognised when the rights to receive cash flows from the financial assets have expired or where the Group has transferred substantially all risks and rewards of ownership.- The financial asset is derecognised at its carrying amount at the date of derecognition, and profit (loss) of derecognition is recognised in the statement of profit or loss within the profit (loss) on investment.- The profit (loss) of the derecognition of a financial asset represents the difference between the carrying amount at the date of derecognition and the proceeds resulting from the derecognition of the financial asset, except for the available for sale financial assets which, where the profit (loss) of the derecognition of financial asset represents the difference between the carrying amount at the date of derecognition and the proceeds resulting from the financial asset, in addition to the accumulated profit or loss previously recognised within other comprehensive income items.K. Offsetting financial asset and liabilityFinancial assets and liabilities are offset and the net amount is reported in the statement of financial position when there is a legally enforceable right to offset the recognised amounts and the Group has an intention to settle on a net basis or realise the asset and settle the liability simultaneously. The legally enforceable right must not be contingent on future events of default of the counter party, and should reflect the Group’s normal practices and requirements of financial requirements of financial requirements and other conditions related to the consideration of the risk and timing of the Group’s cash flows.
L. Impairment of financial assetsFinancial assets carried at amortised cost The Group assesses impairment at the end of each reporting period whenever there is objective evidence that a specific financial asset or a group of financial assets may be impaired. A financial asset or a group of financial assets is impaired and impairment losses are incurred only if there is an objective evidence of impairment as a result of one or more events that occurred after the initial recognition of the asset (a ‘loss event’) and that loss event (or events) has an impact on the estimated future cash flows of the financial asset or group of financial assets that can be reliably estimated.Evidence of impairment may include indications that the debtors or a group of debtors is experiencing significant financial difficulty, violation of contract terms such as default or delinquency in interest or principal payments, or the probability that they will enter bankruptcy or other financial reorganisation, and where observable data indicate that there is a measurable decrease in the estimated future cash flows since the initial recognition, or, changes in economic of domestic conditions that correlate with defaults of the Group’s assets.For loans and receivables category. The amount of the loss is measured as the difference between the

87
asset’s book amount and the present value of estimated future cash flows (excluding future credit losses that have not been incurred) discounted at the financial asset’s original effective interest rate. The book amount of the asset is reduced and the amount of the loss is recognised in the statement of profit or loss. Loans expected to be uncollectible are written off by deduction from the relevant provision, and any subsequent proceeds are recognised as revenue in the statement of profit and loss. If a loan or held-to-maturity investment has a variable interest rate, the discount rate for measuring any impairment loss is the current effective interest rate determined under the contract. As a practical expedient, the Group may measure impairment on the basis of an instrument’s fair value using an observable market price. If, in a subsequent period, the amount of the impairment loss decreases and the decrease can be related objectively to an event occurring after the impairment was recognised (such as an improvement in the debtor’s credit rating), the reversal of the previously recognised impairment loss is recognised in the consolidated statement of profits or losses.
M. Trade receivablesTrade receivables are amounts due from the Group’s customers for merchandise sold or services performed in the Group’s ordinary course of business. If collection is expected within 12 months from the date of the financial statements or in the Group’s normal operating cycle of the business, they are classified as current assets. Trade receivables are recognised initially at fair value and subsequently measured at amortised cost using the effective interest method, less provisions for impairment.
N. Cash and cash equivalentsIn the consolidated statement of cash flows, cash and cash equivalents includes cash in hand and with banks, deposits held at call with banks, short-term investments with original maturities of not more than three months from the date of placement, less bank payables. In the consolidated statement of financial position, bank overdrafts are shown within current liabilities.
O. BorrowingsThe Group recognises borrowings initially at fair value plus any directly attributable transaction costs incurred. Borrowings are subsequently carried at amortised cost; any difference between the original value (net of transaction costs) and value at the date of maturity is recognised in the statement of profit or loss over the period of the borrowings using the effective interest method.Transaction cost includes costs paid when obtaining the loan at the beginning of the contractual right to the extent that the Group expects that all of the loan amount will be drawn down in the future. In this case, depreciation of part of the transaction cost relating to the unutilised amounts of the loan is deferred until utilised.Borrowings are classified as current liabilities unless the Group has an unconditional right to defer the settlement of the liability for at least 12 months after the date of the consolidated financial statements.
P. Borrowing costGeneral and specific borrowing costs directly attributable to the acquisition, construction or production of qualifying assets, which are assets that necessarily take a substantial period of time to get ready for their intended use or sale, are added to the cost of those assets, until such time as the assets are substantially ready for their intended use or sale.When funds are borrowed for the purpose of acquiring a qualifying asset to bear the cost of borrowing, the Group determines the amount of borrowing costs that are capitalised on this asset, which is the actual borrowing costs incurred by the entity during the period because of the borrowing transaction less any revenue realised from the temporary investment of borrowed funds.The Group recognises other borrowing costs as expenses in the period the Group incurs such costs.

88
Suez Cement | Annual Report 2019
Q. Financial liabilities1. ClassificationThe Goup classifies its financial liabilities as financial liabilities at fair value through profit and loss and other financial liabilities. The classification of the financial liability depends on the purpose of acquisition at the initial recognition.
2. Recognition and derecognitionA financial asset is recognised in the statement of financial position when - and only when- the Group becomes a party to the contractual provisions of the financial liability. The Company removes the financial liability (or part of it) from the statement of financial position when it is disposed, cancelled or expired.The Group accounts for the exchange between an existing borrower and lender of debt instruments with substantially different terms as an extinguishment of the original financial liability and the recognition of a new financial liability. The difference between the carrying amount of a financial liability (or part of it) extinguished or transferred to another party including non-amortised expenses, and the consideration paid to settle liability are recognised in profit or loss.
3. MeasurementAt initial recognition, the Group measures the financial liabilities at fair value plus transaction costs, except for financial liabilities at fair value through profit or loss where all other attributable costs are charged to the statement of profit or loss. The other financial liabilities, represented in trade payables and other receivables and bank loans are subsequently measured at amortised cost using the effective interest method.
R. Share capitalOrdinary shares are classified within equity. Share premiums, if any, are added to legal reserve to the extent of half of the issued capital, and the remaining balance of the premium is transferred to a share premium reserve. after deducting the shares issue expenses (net of any advantage related to their income taxes) from the amount of share premium.If any of the Group’s companies repurchases its own equity instruments (treasury shares), these instruments are presented net of equity, amount paid or received in exchange for those instruments is recognised directly in the parent company’s equity.
S. Current and deferred income taxesThe Group recognises the current and deferred income tax as revenues or expenses and is included in the profit or loss for the year. Current and deferred income tax is recognised in other comprehensive income or directly in equity if it related to items recognised - in the same period or different periods- in the statement of other comprehensive income or directly in equity.The income tax for the year is calculated on the basis of the tax laws enacted at the balance sheet date. Management annually evaluates tax situation through tax returns, taking into account the differences that may arise from some interpretations issued by administrative or regulatory authorities, and establishes the appropriate provisions on basis of the amounts expected to be paid to the tax authority.Deferred income tax is recognised on temporary differences arising between the tax bases of assets and liabilities and their carrying amounts in the consolidated financial statements.Deferred income tax is determined using tax rates and laws that have been enacted at the date of the consolidated financial statements and are expected to apply when the related deferred income tax asset is used or the deferred income tax liability is settledDeferred income tax liability is not recognised if it arises from the initial recognition of goodwill. Deferred income tax is not recognised if it arises from initial recognition of an asset or liability in a transaction -

89
other than a business combination - that at the time of the transaction affects neither accounting nor taxable profit or loss.Deferred income tax assets are recognised to the extent that it is probable that future taxable profit will be available against which the temporary differences can be utilised.Deferred income tax liabilities are recognised on temporary differences arising from investments in subsidiaries, associates and shares in joint ventures, except for such cases where the timing of the settlement of the temporary difference is controlled by the Group and it is probable that the temporary differences will not be settled in the foreseeable future. Generally, the Group is unable to control the settlement of the temporary difference for associates, only where there is an agreement in place that gives the Group the ability to control the settlement of the temporary difference.Deferred income tax assets are recognised on deductible temporary differences arising from investments in subsidiaries, associates and equity shares in joint ventures only to the extent that it is probable the temporary differences will be settled in the future and there is future taxable profit available against which the temporary differences can be utilised.Deferred income tax assets and liabilities are offset when the Group has a legally enforceable right to offset current tax assets against current tax liabilities and when the deferred income taxes assets and liabilities relate to income taxes levied by the same taxation authority on either the same taxable Group or different taxable entities where there is an intention to settle the current taxable liabilities and assets on a net basis.
T. Employee benefitsThe Group operates various employees’ benefits schemes, including both defined benefit and defined contribution pension plans and post-employment medical plans:
(1) Retirement benefits obligationsDefined contribution plansThe defined contribution plan is a pension plans under which the Group pays fixed contributions to the General Authority for Social Insurance on mandatory basis. The Group has no further liabilities once its obligations are paid. The regular contributions are recognised as periodic cost for the year in which they are due and as such are included in staff costs.Defined benefit plansA defined benefit plan is a post-employment benefit plan that is not a defined contribution plan.Typically defined benefit plans define an amount of pension benefit that an employee will receive on retirement, using a formula that is usually dependent on employees’ average wages, and the number of the years of service.The net defined benefit obligation recognised in the statement of financial position is the present value of the defined benefit obligation at the end of the reporting year. The annual defined benefits obligations are determined annually by independent actuary using the projected unit credit method. The present value of the defined benefit obligations is calculated by discounting the estimated future cash outflows using discount rate at the end of the financial reporting year on market returns of government bonds that are denominated in the currency and the estimated period for the defined benefit obligations.The Group recognises the current service cost of the defined benefit obligation in the statement of profit or loss, except where included in the cost of an asset that reflects the increase in the defined benefit obligations relating to services performed to the Group during the current year or when changes or curtailments are made to the plan.The Group recognises the cost of past service as an expense when plan changes or is curtailed, and when the Group recognises the restructuring costs, whichever is earlier in the statement of profit or loss.Net interest is calculated on the net defined benefit obligation by multiplying the net defined benefit

90
Suez Cement | Annual Report 2019
obligation by a discount rate as determined at the beginning of the annual financial period. It is recognised within profits and losses.Actuarial profits and losses, which are the changes in the present value of the defined benefit liability that arises from experience adjustments and changes in actuarial assumptions, are charged in other comprehensive income in the period in which they arise.
(2) Optional retirement program pension benefitsTermination benefits are payable when employment is terminated by the group before the normal retirement date, or whenever an employee accepts voluntary redundancy in exchange for these benefits. The group recognises termination benefits at the earlier of the following dates: (a) when the group can no longer withdraw the offer of those benefits; and (b) when the entity recognises costs for a restructuring that is within the scope of EAS 28 and involves the payment of termination benefits. In the event that the Group offers benefits in exchange for the employee terminating his service optionally, the cost and end of services obligation benefits are measured at the initial recognition. The Group also measures and recognizes subsequent changes according to the nature of the benefits based on an estimate of the number of employees expected to accept the offered benefits. Where it is not expected to settle the benefits falling due before 12 months after the end of the reporting period, the benefits are discounted to their present value.
(3) Actuarial profits and lossesActuarial profits and losses, which are the changes in the present value of the defined benefit liability that arises from experience adjustments and changes in actuarial assumptions, are charged in other comprehensive income in the period in which they arise.
(4) Employees’ share in legally defined profitsThe Group recognises expected cash dividends as the employees’ share in accordance with the companies’ articles of association, to be included as part of dividends in equity, and as liabilities when the ordinary general assembly meeting of the shareholders of the Group approved the proposed dividends. The Group does not record any liabilities in the employees’ share of undistributed dividends.
U. LeasingOperating LeaseLeases in which the risks and rewards of ownership are retained by the lessor are classified as operating leases.Payments made under operating leases (net of any discounts received from the lessor) are recognised as expense in the statement of profit or loss on a straight-line basis over the period of the lease.
V. ProvisionsProvisions are recognised when the Group has a present (legal or constructive) obligation as a result of past events; it is probable that an outflow of resources embodying economic benefits will be required to settle the obligation, and the amount has been reliably estimated. The Group recognises the commitments required for restructuring and not related to the Group’s effective activities within the costs of the provision of restructure.Contingent obligation is a present obligation that arose due to past events, and was not recognised because it was not expected to have an outflow of resources embodying economic benefits to settle the obligation, or the amount could be reliably estimated. Instead the Group disclosed its contingent liabilities in its note to the consolidated financial statements.Where there are a number of similar obligations, the likelihood that an outflow will be required in

91
settlement is determined by considering the class of obligations as a whole. A provision is recognised even if the likelihood of an outflow with respect to any one item included in the same class of obligations may be small. However, it is expected that an outflow of resources is required to settle all items of obligations.Where the impact of the time value of cash is significant, the amount of the provision is the present value of expenditures expected to be required to settle the obligation using a pre-tax rate that reflects current market assessments of the time value of money and the risks specific to the obligation. The increase in the provision due to passage of time is recognised as borrowing cost in the statement of profit or loss.If some or all of the expenditure required to settle a provision is expected to be reimbursed by another party outside the Group, the reimbursement should be recognised as a separate asset in the statement of financial position, when and only when, it is virtually certain that reimbursement will be received if the Group settles the obligation. The amount recognised should not exceed the amount of the provision.
W. Trade payablesTrade payables are recognised initially at the amount of goods and services received from others, whether they have been billed or not. When they are material, goods and services received, as well as the trade receivables are recognised at the present value of the cash flows expected by using interest rate of similar loans. Trade payables are then carried at amortised cost using the effective interest rate.
X. Revenue recognitionRevenue is measured at the fair value of the consideration received or receivable, and represents amounts receivable for goods sold or service rendered due to the Group’s normal course of business, stated net of value added taxes, discounts, or deductions. The Group recognises revenue when the amount of revenue can be reliably measured; when it is probable that future economic benefits will flow to the Group; and when specific criteria have been met for each of the Group’s activities, as described below. The amount of revenue is not considered accurately measurable unless all cases of uncertainty regarding the possibility of the collection of the amount due are excluded. The Group bases its estimates of return on historical results, taking into consideration the sale of goods, type of customer and the related specifics arrangement.
(1) Sale of goodsRevenue is recognised from the sale of goods to traders or contractors who have the right to sell them and determine their prices when the goods are delivered to them, and the Group does not retain significant risks of ownership of the goods, there is no obligation that prevent those traders or contractors to accept the goods sold. Delivery is recognised, both in the Group’s stores or in specific locations, according to the agreements. When the Group transfers the significant risk and rewards of the ownership of the goods to the traders, it retains neither continuing managerial involvement to the degree usually associated with ownership nor effective control over the goods sold. Sales to traders do not comprise the element of financing.
(2) Interest incomeInterest income is recognised on a time-proportionate basis using the effective interest method. When a receivable balance resulting from the recognition of interest is impaired, the carrying amount is reduced to the present value of the future cash flows discounted at the original effective interest rate.
(4) Dividends incomeDividends income is recognised when the right to receive payment is established.

92
Suez Cement | Annual Report 2019
Y. DividendsDividends are recognised as liabilities in the consolidated financial statements at the end of the financial year in which the dividends are approved by the Group’s General Assembly of Shareholders.
Z. Operating segmentsThe Group reports the operating segments in accordance with the Egyptian Accounting Standards. The Group’s revenues are realised through two main activities: the manufacture and sale of glass, as well as the plastics industry for the beverage and pharmaceutical industries. In accordance with the Group’s organisational structure, the Board of directors has been considered as the Group’s chief operating decision-maker, as it allocates resources and assesses performance on the segments level. Accordingly, the Group has two operating segments.
AA. Fair value estimationFair value is the price that would be received from any sale of any asset or any payment against any liability in an orderly transaction between market participants at the measurement date. The fair value measurement is based on the assumption that the transaction to sell the asset or pay the liability takes place either:
- In the principal market for the asset or liability, or - In the absence of a principal market, the most advantageous market for the asset or the liability.
The Group should be able to have access to the principal market or the most advantageous market. In the absence of principal market, the Group does not need to conduct a thorough search of all possible markets to determine the principal or the most advantageous market. However, the Group takes into consideration all information reasonably available.The table below shows the financial assets and liabilities at fair value in the consolidated financial statements at 31 December 2018 within the hierarchy of the fair value, based on the input levels that are considered to be significant to the fair value measurement as a whole: - Level 1 - Quoted (unadjusted) market prices in active markets for identical assets or liabilities, which the Group can have access to at the date of measurement.- Level 2 - Inputs other than quoted prices included within level 1 that are observable for the asset or liability, either directly or indirectly.- Level 3 - Unobservable inputs of the asset or the liability.
BB. Comparative figuresWhere necessary, comparative figures are reclassified to conform to changes in presentation in the current year.
3. Financial risk management(1) Financial risk factorsThe Group’s activities expose it to a variety of financial risks. These risks include market risks (including foreign currency exchange risks, prices risks, fair value interest rate risks and fair value risks), credit risks, and liquidity risks.The Group’s management aims to minimise the potential adverse effects on the Group’s financial performance, This is done through the monitoring process performed by the Group’s Finance Department and the parent company’s Board of directors.
(A) Market Risks

93
1. Risk of change in foreign exchange ratesForeign currency exchange rates risks are the risks of fluctuations in the fair value of future cash flows of a financial instrument due to changes in foreign currency exchange rates. The following analysis shows the calculation of the effect of reasonable and possible changes in foreign currencies against the functional currency of the Group while keeping all other variables constant, on the consolidated statement of profit or loss:
2019 2018
USD 10% 13,656,236 27,367,613
Euro 10% 18,280,689 26,934,230
KWD 10% 619,451 101,104
The following table shows the currency position denominated in EGP at the date of the financial position:2019 2018
Assets Liabilities Net Net
USD 138,960,552 (275,522,915) (136,562,363) 273,676,133
Euro 14,691,946 (197,498,837) (182,806,891) (30,675,617)
KWD 6,930,591 (736,078) 6,194,513 1,011,040
2. Price risksThe Group does not have investments in equity or debt instruments listed and traded in financial markets, and accordingly are not subject to risk of change in the fair value of the investments as a result of the changes in prices.
3. Cash flows and fair value interest rate risksInterest rate risk is the risk that the fair value of future cash flows of financial instruments will fluctuate because of changes in the market interest rates.
The Group is exposed to changes in interest rate risks on its interest bearing assets and liabilities (bank overdrafts, and term loans). The Group maintains an appropriate mix of floating rate borrowings and bank facilities to manage the interest rate risk.
The below table shows the analysis of sensitivity to possible and reasonable changes in interest rates, while holding the other variables constant, on the consolidated statement of profit or loss.
The sensitivity on the consolidated statement of profit or loss is the effect of the assumed changes in the interest rates on the Group’s results for one year based on financial assets and liabilities with variable interest rates at 31 December:
Increase (decrease)
In basis points
Effect on profits or losses for the year
Egyptian Pounds31 December 2019 ± 1% (14,321,673)
14,321,67331 December 2018 ± 1% (3,941,416)
3,941,416

94
Suez Cement | Annual Report 2019
B) Credit risks- Credit risk arises from cash and cash equivalents, deposits with banks and financial institutions, as well as credit risk resulting from the credit limit granted to customers and committed transactions. The Group’s credit risk is managed as a whole, except for the credit risk related to the customers’ account balances, as each of the Group’s companies manages and analyses the credit risk of their own customers.
- For banks and institutions, only high-credit-quality and rating banks and financial institutions are accepted.- For the new customers, their credit risks are analysed before standard payment and delivery terms and conditions are agreed upon with the customer.
- For existing customers, independent credit rating is used. In the absence of such independent credit rating, the Group’s credit risk management assesses the creditworthiness of the customer in the light of the financial position, previous experience in dealing with the customer and other factors. Individual risk limits are set based on internal or external ratings in accordance with limits set by the board. The utilisation of credit limits of each individual customer is regularly monitored.
The Group’s management believes that the customers’ impairment provisions are adequate. Note (9) relative to the financial statements provides other information on the credit risks.
No customer contributed more than 10% to the Group’s total sales for the year ended at 31 December 2019.
(C) Liquidity risksLiquidity risk is the risk that the Group will not be able to meet its financial obligations as they fall due, because of shortage of funding. Group’s exposure to liquidity risk results primarily from the lack of offset between assets of maturities of financial assets and liabilities.
The management makes cash flow projections on periodic basis, which are discussed during the Executive Committee’s meeting of the parent company, and takes the necessary actions to negotiate with suppliers, follow-up the collection process from customers and manage the inventory balances in order to ensure sufficient cash is maintained to discharge the Group’s liabilities. The Group’s management monitors liquidity requirements by ensuring that it has sufficient cash and cash equivalents to meet operational needs while maintaining sufficient cash cover to meet the cash outflows requiured to settle the obligations of debts and loans in order to be able to maintain financial terms, guarantees and covenants at all times.
The Group limits liquidity risk by maintaining sufficient bank facilities and reserves, and by monitoring cash forecast and actual cash flows and matching the maturity profiles of financial assets and liabilities. Balances due to suppliers are normally paid within an average of 120 days from the date of purchase.
The table below summarises the maturities of the Group’s undiscounted financial liabilities at 31 December 2019 and 31 December 2018, based on contractual payment dates and current market interest rates.

95
31 December 2019 Less than
6 months
6 months
to one year
1 year
to twoyears
More than
years 2
Trade payables and other credit balances 1,184,794,331 - - -Accrued expenses and other payables* 156,879,810 - - -Bank overdraft - 1,517,496,181 - -Due to related parties 396,294,519 - - -Loans and advances - 83,755,514 - -Settlement of right of sale liability - 342,941,925 - -Total 1,737,968,660 1,944,193,620 - -31 December 2018Trade payables and other credit balances 1,386,582,372 - - -Accrued expenses and other payables* 292,573,580 - - -Bank overdraft - 427,416,695 - -Due to related parties 613,892,330 - - -Loans and advances - 93,407,880 - -Settlement of right of sale liability - 262,308,793 - -Total 2,293,048,282 783,133,368 - -
Unused credit facilities at 31 December 2019 amounted to EGP 937,700,242 in 31 December 2019 (31 December 2018: EGP 249,249,807).* Does not include accrued expenses and other payables - advances to customers.
(2) Capital risk managementThe Group’s objective when managing capital is to safeguard the Group’s ability to continue as a going concern in order to provide returns for shareholders and benefits for other stakeholders using the financial statements. The Group also aims to provide and maintain an optimal capital structure to reduce the cost of capital.In order to maintain the capital structure, the Group’s management may adjust the amount of dividends paid to shareholders, reduce capital, issue new shares or reduce debts due on the Group.The Group monitors the capital structure on the basis of the gearing ratio. This ratio is calculated as net debt divided by total capital. Net debt is calculated as total borrowings and bank overdrafts less cash and bank balances. The total share capital comprises the amount of equity and net loans. The gearing ratios at 31 December 2019 and 31 December 2018 were as follows:
Total loans 2019 2018
Loans and advances 83,755,514 93,407,880
Bank overdraft 1,517,496,181 427,416,695
Long term notes payable 42,848,704 46,419,331
Total loans 1,644,100,399 567,243,906
Less: Cash and bank balances (734,374,558) (798,121,644)
Net loans 909,725,841 (230,877,738)
Equity 2,859,285,951 4,029,250,791
Total capital 3,769,011,792 3,798,373,053
Gearing ratio 24.14% 6.08%
The decrease in the net debts to total capital is due to the achievement of net profit during the year in addition to the repayment of the loan portion.

96
Suez Cement | Annual Report 2019
4. Critical accounting estimates and judgements(1) Critical accounting estimates and assumptionsEstimates and assumptions are continually evaluated and are based on historical experience and other factors, including expectations of future events that are believed to be reasonable under these circumstances:- The Group makes estimates and assumptions concerning the future. The resulting accounting estimates may not equal the actual results. the following are the critical estimates and assumptions that the entity uses:(A) Retirement benefits and pension liabilitiesThe Group’s management determines employee pension benefit liabilities using an independent actuarial expert and it revises the sufficiency of these liabilities on an annual basis according to the accounting policy (2-V). Note (25) shows the main assumptions used to estimate the employees’ pension plans.(B) Useful lives of fixed assetsFixed assets are considered a significant part of the Group’s total assets and the relevant depreciation expense is also considered a significant part of the annual operating expenses. The useful lives of fixed assets, which is based on management’s estimates and assumptions had a material impact on the amounts of fixed assets. The useful life of each item of fixed assets is estimated based on experience of similar assets, as well as the expected period for the flow of economic benefits to the Group by operating that asset. Estimates and assumptions of the useful lives of fixed assets are reviewed periodically in the event of any changes or adjustment to useful lives and the residual value. Such adjustment, if any, will be applied on the future periods. (C) Impairment of goodwillThe Group reviews annually whether it is probable that goodwill may suffer any impairment of goodwill in view of the accounting policy stated in note (2 - H, 2).For the purposes of determining the recoverable amount of CGU, the value in use is calculated which requires the use of estimates (Note 6).(2) Critical judgements in applying the Company’s accounting policiesConsolidation of Ready Mix Concrete Al Alamia (RMC) and its subsidiaries “Development & Construction Materials Co. Egypt Decom”The Group’s management took into account the accounting treatment required to be applied and the principles set forth in EAS (42) “Consolidated Financial Statements” and concluded that the Group controls the Ready Mix Concrete Al Alamia (RMC), and the Group’s management has applied the personal judgement in determining the appropriate accounting treatment for the Ready Mix Concrete Al Alamia (RMC). In the event that the personal judgement of the management changes, it will result in the failure to consolidate the Ready Mix Concrete Al Alamia (RMC). Assets and liabilities of the Ready Mix Concrete Al Alamia (RMC) have amounted to EGP 796 million and approximately EGP 185 million, respectively, on 31 December 2019.Below are the most significant considerations and judgements that have been applied by the management to reach a conclusion regarding the accounting treatment to be applied:- The Group is exposed to variable returns resulting from its partnerships in Ready Mix Concrete Al Alamia (RMC), and the variable returns consist of dividends on ownership shares, contracts for the supply of raw materials required for the subsidiary.- The Group has potential voting rights represented in the shares’ purchase option of non-controlling interests. The Group is entitled to exercise that right in the event of a dispute between the Group and other shareholders on a significant issue related to resolutions that have an impact on the subsidiary. The Group’s management believes that in the event of a dispute, it may exercise the purchase option on the non-controlling interests, which gives the Group control.- Other shareholders have a right of sale option that allows them to sell the non-controlling interests to the Group at an exercise price determined in accordance with the shareholders agreement.

97
5. F
ixed
ass
ets
Land
sBu
ildin
gs
Mac
hine
ry, e
quip
-m
ent
and
mou
lds
Vehi
cles
Fur
nitu
re a
ndeq
uipm
ent
equi
pmen
t
Tota
l
31 D
ecem
ber
2018
cost
Bala
nce
at t
he b
egin
ning
of
the
year
580,
057,
683
1,90
4,26
6,44
37,
501,
916,
684
350,
828,
527
144,
664,
317
10,4
81,7
33,6
54
Exch
ange
rat
es t
rans
latio
n di
ffer
ence
s80
,298
2,66
5,09
91,
754,
900
1,23
0,38
514
1,86
15,
872,
543
Add
ition
s4,
580,
105
3,23
1,37
557
,584
,558
44,0
64,2
6476
4,54
911
0,22
4,85
1
Tran
sfer
fro
m p
roje
cts
unde
r co
nstr
uctio
n
-43
,286
,924
238,
848,
360
43,1
16,5
081,
883,
619
327,
135,
411
Dis
posa
ls(2
3,70
9,90
9)(2
0,93
0,33
0)(7
0,19
6,26
7)(2
0,70
9,26
4)(4
,363
,467
)(1
39,9
09,2
37)
Recl
assi
ficat
ion
to a
vaila
ble
for
sale
ass
ets
(124
,201
,876
)(7
2,00
3,35
7)(3
80,7
46,9
90)
(2,6
75,7
49)
(5,2
87,3
31)
(584
,915
,303
)
Bala
nce
at t
he e
nd o
f th
e ye
ar43
6,80
6,30
11,
860,
516,
154
7,34
9,16
1,24
541
5,85
4,67
113
7,80
3,54
810
,200
,141
,919
Acc
umul
ated
dep
reci
atio
n
Bala
nce
at t
he b
egin
ning
of
the
year
-
(1,4
43,8
02,8
89)
(4,9
34,0
50,3
29)
(297
,096
,215
)(1
21,6
16,2
86)
(6,7
96,5
65,7
19)
Dep
reci
atio
n ex
pens
e
-(7
8,79
6,43
6)(3
49,3
71,1
06)
(26,
324,
129)
(7,4
98,7
32)
(461
,990
,403
)
Dep
reci
atio
n of
dis
posa
ls
-10
,459
,716
68,6
01,8
0720
,652
,393
4,34
9,11
510
4,06
3,03
1
Exch
ange
rat
es t
rans
latio
n di
ffer
ence
s
-(2
,036
,519
)(1
,507
,453
)(1
,024
,489
)(1
36,3
89)
(4,7
04,8
50)
Recl
assi
ficat
ion
to a
vaila
ble
for
sale
ass
ets
-
54,5
28,4
7329
3,31
2,89
32,
564,
833
4,35
0,76
635
4,75
6,96
5
Bala
nce
at t
he e
nd o
f th
e ye
ar
-(1
,459
,647
,655
)(4
,923
,014
,188
)(3
01,2
27,6
07)
(120
,551
,526
)(6
,804
,440
,976
)
Net
car
ryin
g am
ount
at
the
end
of t
he y
ear
436,
806,
301
400,
868,
499
2,42
6,14
7,05
711
4,62
7,06
417
,252
,022
3,39
5,70
0,94
3
cost
At
1 Ja
nuar
y 20
1943
6,80
6,30
11,
860,
516,
154
7,34
9,16
1,24
541
5,85
4,67
113
7,80
3,54
810
,200
,141
,919
Tran
sfer
fro
m p
roje
cts
unde
r co
nstr
uctio
n
-41
,052
,519
354,
289,
661
-
22,9
89,2
9141
8,33
1,47
1
Add
ition
s
-1,
711,
670
56,0
51,8
471,
138,
665
500,
127
59,4
02,3
09
Dis
posa
ls(3
,815
,913
)(4
1,80
4,17
3)(4
51,6
70,7
94)
(35,
731,
422)
(305
,784
)(5
33,3
28,0
86)
Exch
ange
rat
es t
rans
latio
n di
ffer
ence
s(1
,636
,530
)(5
4,31
6,53
2)(3
6,33
9,45
3)(3
2,16
3,41
0)(2
,459
,161
)(1
26,9
15,0
86)
31 D
ecem
ber
2019
431,
353,
858
1,80
7,15
9,63
87,
271,
492,
506
349,
098,
504
158,
528,
021
10,0
17,6
32,5
27
Acc
umul
ated
dep
reci
atio
n
At
1 Ja
nuar
y 20
19
-(1
,459
,647
,655
)(4
,923
,014
,188
)(3
01,2
27,6
07)
(120
,551
,526
)(6
,804
,440
,976
)
Dep
reci
atio
n ex
pens
e
-(6
0,40
8,77
7)(3
54,4
34,5
52)
(26,
238,
833)
(7,2
94,7
39)
(448
,376
,901
)
Dis
posa
ls
-37
,767
,950
428,
818,
574
35,6
90,1
9925
8,11
750
2,53
4,84
0
Exch
ange
rat
es t
rans
latio
n di
ffer
ence
s
-43
,809
,259
31,0
95,5
9521
,503
,006
2,42
2,18
398
,830
,043
31 D
ecem
ber
2019
-
(1,4
38,4
79,2
23)
(4,8
17,5
34,5
71)
(270
,273
,235
)(1
25,1
65,9
65)
(6,6
51,4
52,9
94)
Net
car
ryin
g va
lue
at 3
1 D
ecem
ber
2019
431,
353,
858
368,
680,
415
2,45
3,95
7,93
578
,825
,269
33,3
62,0
563,
366,
179,
533

98
Suez Cement | Annual Report 2019
Impairment of fixed assets (Suez Cement Company)On 31 December 2019, the Company assessed whether there were indications of impairment of its fixed assets with a net carrying value exceeding its recoverable value.Impairment of fixed assets is treated in accordance with Egyptian Accounting Standards (Standard 31) (Impairment of Assets). The recoverable value is determined according to the useful value calculated using (future cash flows resulting from the statement of financial position approved by senior management as the statement of financial position is for 5 years). It was concluded that the fair value less costs of sales is lower than the value in use.As a result of the study, the recoverable value was EGP 1,321 million as at 31 December 2019. As a result, the Company’s management has not recognised impairment of its fixed assets against carrying value of machines and equipment amounting to EGP 833 million as at 31 December 2019.The main assumptions used to calculate the value in useThe average profit before interest, tax, depreciation and amortization was assumed to be 9% based on the improvement in prices based on the average realized value in the five years from the statement of financial position date.The pre-tax discount rate used in calculating the future cash flows of 20% represents the current market risk assessment, taking into account the time value of money and the individual risks that are based on assets that have not been taken into account in future cash flow estimates.The discount rate is calculated using the weighted average method for cost of capital, which includes both equity and debt. The cost of equity is calculated by means of the future return on investment of the Company’s investors, While the cost of debt is calculated through interest bearing loans of the Company.The expected long-term growth rate of 7.89 % was calculated based on the long-term inflation rate of the Arab Republic of Egypt.An increase in market growth was assumed at -2% in 2020 in order to increase and develop the growth rate and continues to increase by 2% to 3% in the remaining years, assuming that the company’s market share reaches 7.6 % in 2020 as an increase of 0.6% from 2019 and the Company’s share reaches 6.6% in the remaining years.An increase in raw material price inflation was assumed at a rate of 3% annually due to a general increase in prices.An increase in cement price inflation was assumed at rate of 2% in 2020, 15% in 2020 and 7%, and 4% to 7% in the remaining years.
Impairment of fixed assets (Helwan Cement Company)On 31 December 2019, the Company assessed whether there were indications of impairment of its fixed assets with a net carrying value exceeding its recoverable value.Impairment of fixed assets is treated in accordance with Egyptian Accounting Standards (Standard 31) (Impairment of Assets). The recoverable value is determined according to the useful value calculated using (future cash flows resulting from the statement of financial position approved by senior management as the statement of financial position is for 5 years). It was concluded that the fair value less costs of sales is lower than the value in use.As a result of the study, the recoverable value was EGP 2,732 million as at 31 December 2019. As a result, the Company’s management has not recognised impairment of its fixed assets against carrying value of machines and equipment amounting to EGP 1,192 million as at 31 December 2019.
Impairment of fixed assets (Tourah Cement Company)The Company took into consideration the factors that indicate the impairment of the assets as a result of the cessation of cement activity during 2019.Therefore, the Company determined the recoverable value of the asset through (net fair value less the sale costs) as the value in use cannot be estimated due to the

99
cessation of the cement activity.The Company appointed an independent appraiser expert to determine the assets’ fair value. The assets were assessed as follows:-The plant land was evaluated using the ideal sale method by referring to the prices of selling similar lands with some adjustments made due to the difference of location and area. The plant and machinery buildings were evaluated using the replaceable cost method due to the specialised nature of these assets, and it was found that the recoverable value of the assets is not less than its carrying amount and therefore to recognise the impairment losses.
Depreciation expense is classified as follows:
2019 2018
Cost of production 419,382,835 429,219,330General and administrative expenses 28,994,066 32,771,073
448,376,901 461,990,403
Proceeds from sale of fixed assets in the statement of cash flows are as follows:
2019 2018
Net carrying amount of disposed assets 30,343,396 35,798,249Losses) profits on disposal of fixed assets) 68,787,413 106,351,648Proceeds on sale of fixed assets 99,130,809 142,149,897
There are no mortgages or restrictions on ownership of fixed assets.
6. Projects under constructionProjects under implementation are renovations and replacement of existing fixed assets that aim to improve and increase efficiency and productive capacity as well as extend the useful life of these assets, and it is expected that most of these projects will be completed during the year 2020:
2019 2018
Balance at the beginning of the year 376,553,157 394,184,010Exchange rates translation differences during the year - 304Additions during the year 221,380,096 328,486,375Transferred to fixed assets during the year (418,331,471) (327,135,411)Assets under construction from discontinued activities - (17,090,131)Disposals during the year (25,933,822) (1,891,990)Balance at the end of the year 153,667,960 376,553,157
2019 2018
Spare parts for coal project 36,766,694 45,550,455Heating tower improvement - 25,654,966 Civil works project 2,606,643 2,606,643Spare parts for crude mills and cement 29,628,909 52,133,736Information technology systems of the group - 19,049,281Safety improvement and bypass filters development 3,073,517 3,073,517Others 81,592,197 228,484,559
153,667,960 376,553,157

100
Suez Cement | Annual Report 2019
7. Discontinued operationsOn 4 November 2018, the Extraordinary General Assembly of Helwan Cement (subsidiary) was held, where the assessment of Company’s assets and liabilities report, prepared by the committee formed by the General Authority for Investment & Free Zones, was approved. The meeting discussed dividing the Company into two joint stock companies and concluded the following:-Net equity of the ongoing company on 31 December 2017 (Helwan Cement Company) - (subsidiary) amounted to EGP 1,069,720,456 other than the divided Company below: -The net equity of the divided Company (wholly owned by the divided company on 31 December 2017 at the Company’s plant in Minya Governorate is EGP 322,830,977.Also, it was approved to divide the Company vertically at the carrying amount according to the financial position on 31 December 2017, which was taken as a basis for evaluation to two companies, so that Helwan Cement Company remains as an ongoing company.The establishment of a new company resulting from the division at an initial name of Cleopatra Building Materials Industries Company and taking the carrying amount of its assets mentioned in the assessment report, which represents the value of equity in the default financial statements of the divided company’s on 31 December 2017, which is the assessment’s principle date, which represents the shareholding amount of the ongoing company’s in the divided company.Transfer of ownership of all fixed and transferred assets (rights and liabilities) assigned to the Company’s factory in AlMinya Governorate and all that belongs to the factory, including lands, real estate, contracting, licenses, equipment, production lines, cars, and in general, all the material and immaterial components of the Company’s factory in AlMinya to the divided company at the carrying value, so that the divided company replaces the ongoing Company and legally owns these assets, and its rights and commitments.On 31 December 2018, AlMinya Factory (Cleopatra Building Materials Industries Company) was reclassified as discontinued activities.
The most significant assets and liabilities of AlMinya Factory (Cleopatra Building Materials Industries Company), which were classified as discontinued activities.
31 December 2018
AssetsFixed assets 205,422,089Fixed assets under construction 22,404,504Deferred tax assets 10,023,994 Inventory 153,987,977 Trade and notes receivable 3,168,950Prepaid expenses, different debtors and other debit balances 18,008,819Cash in hand and at banks 1,215,594Held for sale assets and related to discontinued activities 414,231,927
Liabilities
Other long term liabilities 8,178,844Suppliers, accrued expenses and other credit balances 31,768,327Due to related parties 5,403,184Due to tax authority 758,717Income tax for the year 7,075,306Advances to customers 8,939,287Performance bond 642,302Held for sale liabilities and related to discontinued activities 62,765,967Held for sale net assets and related to discontinued activities 351,465,960

101
AlMinya Factory results of the work of (Cleopatra Building Materials Industries Company) for the year ended 31 December 2018 for discontinued activities are as follows:
31 December 2018
Sales 323,498,285
Cost of sales (252,777,460)
Total sales 70,720,825
General and administration expenses (24,055,665)
Other revenues 367,129
Other expenses (20,927,944)
Profit before taxes for discontinued activities during the year 26,104,345
Income taxes for the year (7,075,306)
Deferred income tax for the year 9,605,944
Net profit of discontinued activities for the year 28,634,983
Net cash flows generated from AlMinya Factory (Cleopatra Building Materials Industries Company) for the year ended 31 December 2018 and are as follows:-
31 December 2018
Net cash flows from operating activities 7,088,500
Net cash flows from investing activities (5,876,710)
Net Cash flows from financing activities 3,804
Net cash flows 1,215,594
Assets and liabilities relating to a group held for sale and discontinued operationsThe Group’s management decided to sell its share in Cleopatra Building Materials Industries Company during 2018. In February 2019, the Group sold its investment in Cleopatra Building Materials Industries Company. The deal’s value amounted to EGP 742,902,871, and then the Suez Cement Group classified the operations results from it as discontinued operations on 31 December 2019.Cleopatra Building Materials Industries Company assets and liabilities are represented at the date of sale as shown below:
Assets:
1 February 2019
Fixed assets 203,347,986
Fixed assets under construction 22,404,504
Deferred tax assets 10,023,994
Inventory 168,542,470
Customers 2,079,799
Other debit balances 16,171,230
Cash on hand and at banks 3,708,950
Total 426,278,933

102
Suez Cement | Annual Report 2019
Liabilities:
1 February 2019
Creditors and other payables 20,201,027
Due to related parties 27,109,240
Income tax liabilities 8,546,542
Advances from customers 10,257,011
Other long term obligations 8,327,511
Performance bond 645,691
75,087,022
Net assets 351,191,911
The statement below shows the results of the discontinued operations for the period from 1 January 2019 to 31 January 2019, and the period from 1 January 2018 to 31 December 2018:
2019 2018
Revenues 13,986,168 323,865,414
Expenses (12,824,290) (295,230,431)
Profits of discontinued operations 1,161,878 28,634,983
Profits on sale from discontinued operations (d) 314,460,976 102,788,922
Profits of discontinued operations after tax 315,622,854 131,423,905
C. Cash flows from discontinued operations
2019 2018
Cash flow from operating activities 2,493,356 7,088,500
Cash flows from investing activities 685,892,258 (5,876,710)
Cash flows from financing activities - 3,804
Total cash flows 688,385,614 1,215,594
D. Profits from sale of discontinued operations are represented as follows:
2019
Sale consideration 685,892,258
The value of inventory held as part of the sale consideration 28,628,265
Collected amount 714,520,523
(Less): Carrying amount of net disposed assets (351,191,911)
(Less): Expenses related to sale (47,705,758)
Profits on sale from discontinued operations 315,622,854

103
8. Intangible assets (goodwill)
Goodwill is represented as follows
2019Restated
2018Helwan Cement Company 2,454,952,337 2,454,952,337
Impairment of goodwill (Helwan Cement) (1,540,470,000) (1,540,475,000)
Ready Mix Concrete Al Alami 44,284,201 44,284,201
Hilal Cement Company 227,978,024 307,881,712
Impairment of goodwill (Hilal Cement) (115,099,994) -
Balance at the end of the year 1,071,639,568 1,266,643,250
Goodwill’s recoverable amountThe Group performs an impairment test for the goodwill’s value annually. The recoverable amount is determined by calculating the value in use that requires the use of assumptions, and the value in use is calculated based on cash flow projections according to the financial budget for the 5-year period approved by the management.
1. Impairment test for goodwill related to Helwan Company:Cash flows for the periods beyond 5 years are estimated using the growth rate shown below which commensurate with the expectations related to the industry reports that the cash generating units operate in.The value in use of goodwill has been assessed using inputs within the third level of the fair value hierarchy. The management believes that no reasonable change in the used assumptions will lead to an impairment risks in goodwill.The Group used the following assumption when preparing the test of intangible assets impairment at 31 December 2019:
Average of gross profit 20%
Average sales growth rate 11%
Discount Rate 20%
Long-term growth rate 7.89%
Sales volume: Average annual growth rate over the financial budget period, based on past performance and management expectations.Growth rate: This represents the weighted average of growth rate used for forecasting the cash flows of the years following the financial budget period. Growth rates correspond with the reports of the industry where the CGU is adopted. Profit margins: The gross profit and operating profits are based on the budgets approved by the Board of directors. The principle assumptions used in the estimates, which include business volumes, changes, discounts and costs, are made on the basis of historical performance, current strategy, and market expectations.Discount rate before taxes: A weighted average of the capital cost for each cash-generating unit has been calculated to be used as the required return rate to discount cash flows. The discount rate reflects the current market assessments of the risks related to the cash-generating unit, taking into account the impact of the time value of cash, in addition to the risks not included in the cash flow estimates.

104
Suez Cement | Annual Report 2019
Changes in assumptions sensitivityWith regard to estimating the goodwill’s value in use, management believes that there is no reasonable change in any of the above key assumptions (growth rate, profit margins, and discount rate) that may result in exceeding the carrying amount of the cash-generating unit, which includes goodwill for recoverable amount. Recoverable amounts sensitivityThe growth rate in the assumption period is estimated at 7.89%. If all other assumptions remain the same, a 100% reduction in the growth rate will give a value in use that exceeds the carrying value. The discount rate for the assumption period was estimated at 20%. If all other assumptions remain the same, a 1% increase rate in the discount will give a value in use that exceeds the carrying amount.
2. Impairment test of goodwill related to Ready Mix Concrete Al alamia (RMC)Cash flows for the periods beyond 5 years are estimated using the growth rate shown below which commensurate with the expectations related to the industry reports that the cash generating units operate in.The value in use of goodwill has been assessed using inputs within the third level of the fair value hierarchy. The management believes that no reasonable change in the used assumptions will lead to an impairment risks in goodwill.The Group used the following assumption when preparing the test of intangible assets impairment at 31 December 2019:
Average of gross profit 20 %
Average sales growth rate 11%
Discount Rate 20%
Long-term growth rate 7.89%
Sales volume: Average annual growth rate over the financial budget period, based on past performance and management expectations.
Growth rate: This is represent in the weighted average of growth rate used for forecasting the cash flows of the years following the financial budget period. Growth rates correspond with the reports of the industry where the CGU is adopted.
Profit margins: The gross operating profit and profits are based on the budgets approved by the Board of Directors. The principle assumptions used in the estimates, which include business volumes, change, discounts and costs, are made on the basis of historical performance, current strategy, and market expectations.Discount rate before taxes: A weighted average of the capital cost for each cash-generating unit has been calculated to be used as the required return rate to discount cash flows. The discount rate reflects the current market assessments of the risks related to the cash-generating unit, taking into account the impact of the time value of cash, in addition to the risks not included in the cash flow estimates.Sensitivity of changes in assumptionsWith regard to estimating the goodwill’s value in use, management believes that there is no reasonable change in any of the above key assumptions (growth rate, profit margins, and discount rate) that may result in exceeding the carrying amount of the cash-generating unit, which includes goodwill for recoverable amount. Recoverable amounts sensitivity

105
The growth rate in the assumption period is estimated at 7.89%. If all other assumptions remain the same, a 100% reduction in the growth rate will give a value in use that exceeds the carrying value. The discount rate for the assumption period was estimated at 20%. If all other assumptions remain the same, a 1 % increase rate in the discount will give a value in use that exceeds the carrying value.
Impairment test for goodwill in Hilal Cement Company- Kuwait ( Kuwaiti Joint Stock Company)At a subsequent date for preparing the financial statements, the Company’s management decided on 6 January 2020 to sell its investments in Hilal Cement Company - Kuwait (Kuwaiti Joint Stock Company) at a realisable value of KWD 4,08 million, which is an indication of impairment of investments’ values as at 31 December 2019Therefore, the Company’s management has performed a test for impairment in value and the impairment losses have been recognised by the increase in the carrying amount of the investment over the recoverable amount, and the recoverable amount has been determined on the basis of the investments’ fair value, by referring to the stock-price quotations available in the inactive market available to the Company. Accordingly, the fair value has been identified of EGP 215,883,816 on the date of preparing the financial statements on 31 December 2019Accordingly, the impairment of goodwill has been recognised at EGP 115,099,994.
9. InvestmentsA. investment in associates and interests in joint ventures
Percentage
Shareholding
Nominalvalue
Per share
2019 2018
%
Investment in associates
Tecno Gravel Quarries - Egypt (SAE) 45 10
Investment balance - at the beginning of the year 37,100,681 38,078,643
Add:
Company’s share from profits for the year 4,076,281 5,285,534
Less:
Dividends (4,950,000) (6,263,496)
investment in associates balance - end of the year 36,226,962 37,100,681
Shares in joint ventures - entities subject to common control
Suez Lime Company - Egypt (SAE)* 49.66 100
Investment balance - at the beginning of the year 3,721,038 3,531,926
Add:
Company’s share from profits for the year 213,391 189,112
Less: - -
Shares in joint ventures balance - end of the year 3,934,429 3,721,038
Total Investment income in associates cost And Joint ventures 40,161,391 40,821,719
* Suez Cement Company SAE holds a share of 49.66% in Suez Lime Company SAE, entity subject to common control managed jointly with Unicalc Company (Italian company holds share of 50%) and Tourah Portland Cement Egyptian Company (SAE), which holds share of 1%.

106
Suez Cement | Annual Report 2019
Participants are associated with a contractual agreement to participate in controlling the economic activities of the project. The project requires unanimous approval on financial and operational resolutions among the participants. Suez Cement Company recognizes its share
The joint venture is accounted for in the separate financial statements at cost and in the consolidated financial statements using the equity method.
B. Available for sale financial investments
Percentage
Shareholding
Nominal value
Per share
2019 2018
% EGP EGP EGP
Available for sale financial investments - at fair value
Lafarge cement company (SAE) - listed in the stock exchange (inactive market)
0.137 10001,440,001 1,440,001
1,440,001 1,440,001Available for sale financial investments - at costEgyptian Iron & Steel Company (SAE) - listed in stock exchange 20,500 20,500ElTour Investment Company - listed in stock exchange 61 61
20,561 20,561Available for sale investments other companiesCleopatra Consulting Company 50,000 50,000Cleopatra Project Management Company 50,000 50,000
100,000 100,000
1,560,562 1,560,562
C. Financial Investments held to maturity
2019 2018
EGP EGP
Bonds 5% - Ahli Investment bank deposit 807,715 807,715Bonds 5% - Central Bank of Egypt deposit 2,453,620 2,453,620Bonds 3.5% - Central Bank of Egypt deposit 5,167,944 5,167,944
8,429,279 8,429,279
10. Inventories
2019 2018
Raw materials 187,733,390 108,958,645Spare parts and tasks 638,393,348 642,936,613Fuel 144,805,546 325,593,474Packaging requirements 39,300,597 23,446,272Unfinished goods 406,597,002 393,909,873Finished products 126,010,590 180,306,364Goods in transit 40,681,646 445,623Letters of credit 3,153,300 3,476,076
1,586,657,419 1,679,072,940Impairment of obsolete inventory spare parts (145,333,811) (144,880,319)Net 1,441,323,608 1,534,192,621

107
* The movement of impairment of inventories is as follows:
2019 2018
Balance at January 1 144,880,319 190,182,397
Reversal of impairment of inventories (18,246,983) (31,480,504)
formed during the year 20,944,148 (119,025)
Inventories related to discontinued activities - (13,813,241)
Currencies exchange rates translation differences (2,243,673) 110,692
Balance at 31 December 145,333,811 144,880,319
11. Customers and notes receivable
2019 2018
Customers 638,538,441 685,200,930
Notes receivable 119,065,824 77,585,828
757,604,265 762,786,758
*Impairment of customers (259,561,373) (238,903,178)
498,042,892 523,883,580
The movement in impairment of customers
2019 2018
Balance at the beginning of the year 238,903,178 220,081,341
Impairment during the year 68,599,040 17,702,825
Impairment reversal during the year (23,305,293) -
Exchange rates translation differences (24,635,552) 1,119,012
259,561,373 238,903,178
12. Prepaid expenses, different debtors and other debit balances
2019 2018
Different debtors - Tax Authority 115,078,111 90,325,334Deposits with others 293,602,203 293,968,687Prepaid expenses 73,700,257 119,396,121Accrued revenues 23,338,332 32,374,740Cheques under collection - 62,851,855Advance payments to suppliers 46,514,676 62,224,152Letter of guarantee cover 1,595,635 431,678Blocked balances under insurance and taxes 804,262 804,262sale of fixed assets debtors 32,360,102 52,281,289Scrap sale receivables 11,972,238 -Other debit balances 163,081,920 148,602,297
762,047,736 863,260,415
Less: Impairment of other receivables (52,817,749) (29,643,337) 709,229,987 833,617,078

108
Suez Cement | Annual Report 2019
13. Related parties
(A) Transactions with related partiesTransactions with related parties for the year ended 31 December 2019 in the transactions between Suez Cement Company (SAE) and its subsidiaries. The consolidated financial statements of balances arising from transactions between groups as well as Group transactions including sales, expenses and dividends. The total gains or losses on the Group’s transactions is derecognised which are recognised in the value of assets such as inventory and fixed assets.
Transactions with related parties are represented in transactions between Suez Cement Company (SAE) and certain shareholders in the Group companies.
Heidelberg Cement Company, which owns the Italcementi Company (the holding company of Simon France, the main shareholder of Suez Cement Company) (SAE)
The technical assistance fees provided by Heidelberg Cement Company to Suez Cement Company (SAE) for the year ended 31 December 2019 represent a percentage of the total revenues of the Group for the sale of cement products after derecognizing the transactions as follows:
% EGP
Suez Cement Company (SAE) 1.2 23,510,957
Portland Tourah Egypt Company (SAE) 1.2 3,477,920
Helwan Cement Company (SAE) 1.2 24,083,617
51,072,494
B. Due from related parties
2019 2018
Italcementi Company (parent company) 805,755 898,613
Inter bulk Trading Company (subsidiary to parent company) 672,597 1,667,580
Cleopatra Building Materials Industry Company - 5,403,183
Heidelberg Cement Trading Malta Limited (subsidiary to parent company) - 3,854,536
Tanzania Cement Company (subsidiary to parent company) 14,852 40,675
Tecno Gravel Quarries Egypt (under common control) 1,778,314 -
Cimenteries CBR Company (subsidiary to parent company) 42,372 42,372
Ciments du Maroc (subsidiary to parent company) - 57,074
Total 3,313,890 11,964,033

109
C. Due to related parties
2019 2018
Heidelberg Trading Malta (subsidiary to parent company) 84,656,543 47,332,874
Ciments Francais (major shareholder) (subsidiary to parent company) 83,471,618 100,936,018
Italcementi Company (parent company) 26,777,636 72,623,570
Heidelberg Cement Company (ultimate parent company) 69,180,966 77,475,002
Inter bulk Logano Company (subsidiary to parent company) 102,236,340 301,357,763
Heidelberg Cement France Company (subsidiary to parent company) - 1,939,057
FYM (subsidiary to parent company) - 62,262
HC Green Trading (subsidiary to parent company) 58,528 11,822,316
Tecno Gravel Quarries Egypt (under common control) 4,798,404 -
Ready Mix International Company (related company) 25,114,484 -
HC Trading International (subsidiary to parent company) - 343,468
396,294,519 613,892,330
D. Amounts paid to key managementKey management compensation and salaries during 2019 amounted to EGP 15,429,897 (2018: EGP 15,568,459).
14. Cash at banks
2019 2018
Local currency .A
Current accounts with banks 203,720,708 316,144,252
Cash in hand 1,444,746 1,711,715
(Term deposits (due within 3 months 17,434,623 75,729,898
222,600,077 393,585,865
Foreign currency .B
Current accounts with banks 62,781,200 92,909,411
Cash in hand 767,393 707,242
Term deposits (due within 3 months) 457,225,888 310,919,126
520,774,481 404,535,779
743,374,558 798,121,644
15. ProvisionsTotal
Other provi-sions
Provision forlawsuits
Employee redundancy
Provision2019 2018
Balance at the beginning of theyear 349,982,337 33,020,149 7,874,110 390,876,596 964,075,282
formed during the year 10,000,000 12,947,861 385,000,000 407,947,861 38,635,260
Utilised during the year (36,963,604) (3,882,274) (270,983,462) (311,829,340) (541,005,431)
Provisions no longer required (10,000,000) (5,393,479) - (15,393,479) (65,828,515)Provisions for discontinued activi-ties during the year - - - - (5,000,000)
313,018,733 36,692,257 121,890,648 471,601,638 390,876,596
* Tourah Portland Cement Company formed restructure provisions to pay the dues of employees subject to the voluntary retirement system, in accordance with the decision of the Extraordinary General Assembly held on 10 June 2019 to suspend cement activity and leave the employees in an orderly and legal manner.

110
Suez Cement | Annual Report 2019
Other provisionsOther provisions relate to claims expected to be made by other parties in connection with the company’s operations. The information usually required by accounting standards is not disclosed because the management believes that to do so would seriously prejudice the outcome of the negotiations with those other parties. These provisions are reviewed by management annually and the amount provided is adjusted based on latest developments, discussions and agreements with those other parties.
Employee redundancy Provision Employee redundancy provision has been formed against the expected cost of employees’ contracts termination costs and are recognised in the period in which the Company becomes legally or constructively committed to pay such amounts, with proper communication to employees.
16. Bank overdraftsA. Suez Cement Company obtained a total credit limit in the form of overdrafts from banks to finance working capital requirements and imported goods in Egyptian pound or its equivalent in foreign currencies at an average interest rate of 13.25% for the Egyptian pounds, and 5.46% for the foreign currencies.-The available total credit limits amounted to EGP 2,005,000,000 and the user value of these credit limits at 31 December 2019 amounted to EGP 1,146,960,189.
B. Helwan Cement Company obtained a total credit limit in the form of overdrafts from banks to finance working capital requirements and imported goods in Egyptian pound or its equivalent in foreign currencies at an average interest rate of 13.27% for the Egyptian pounds, and 5.44% for the foreign currencies.-The available total credit limits amounted to EGP 450,000 and the total user value of these credit limits at 31 December 2019 amounted to EGP 370,535,992.
17. Medium term loans
2019 2018
Hilal Cement Company ( Kuwaiti Joint Stock Company)
Loans from local banks and Kuwaiti partner * 83,755,514 93,407,880
83,755,514 93,407,880
Hilal Cement Company (SAK)Unsecured long term loans from local banks, and the Kuwaiti partner in Kuwaiti Dinars and the interest rate from 4.5% to 5% per annum.
18. Other long term liabilities
2019 2018
Long term employee benefits - Hilal Cement Company (SAK) 42,848,704 46,419,331
Total other long term obligations 42,848,704 46,419,331

111
19. Accrued expenses and other payables
2019 2018
suppliers 1,263,411,882 1,356,299,894
Advances for fixed assets sales and investments - 232,700,000
Accrued expenses 116,441,180 252,284,315
Accrued salaries 2,706,615 2,454,534
Other receivables 37,732,015 37,834,731
Social Security Authority 3,444,262 4,520,281
Retention 38,887,271 30,282,478
1,462,623,225 1,916,376,233
20. Due to tax authority
2019 2018
Tax Authority - Salary tax 4,123,944 7,581,756
Tax Authority - Withholding tax 12,576,215 11,069,269
Tax authority - value added tax 35,003,419 74,763,619
Tax authority - clay development fees 17,824,905 25,025,511
Tax authority - stamp duty fee 26,064 24,420
Tax authority - income tax 33,098,890 32,799,615
102,653,437 151,264,190
21. Settlement of right of sale liability
2019 2018
Balance at the beginning of the year 262,308,793 - The change in the liability’s value is recognised in the liability and financingexpenses (Note)
80,633,132 262,308,793
Balance at the end of the year 342,941,925 262,308,793
Settlement of right of sale liability reserve In accordance with the shareholders agreement related to the Global Ready Mix Concrete Company (subsidiary), shareholders of non-controlling interests have an unconditional right that allows them to sell their shares to the Group at a practice price determined in accordance with the shareholders agreement. The initial recognition of this right is recognised at the present value of the amount of the obligation settlement, in exchange for a reserve within the property rights, and non-controlling interest rights have not been written off against the right to sell option obligation since the non-controlling shares still retain the risks and benefits related to the subsidiary due to the correlation of the price of exercising the right with the affiliate’s profitability. A change in the value of the obligation is subsequently recognised within the financing expenses, and in the event the right expires without practice, the obligation is disposed in exchange for a settlement in the equity.

112
Suez Cement | Annual Report 2019
22. Issued and paid up capital
2019 2018
Authorized capital 3,600,000,000 3,600,000,000Issued and paid up Capital 909,282,535 909,282,535Number of shares 181856507 181856507
The authorized capital of the Company amounted to EGP 1 billion. The issued and paid up capital amounted to EGP 640 million distributed over 64000000 shares, the value of each share is EGP 10. On 30 June 2005, the Minister of Investment issued a decision approving the decision of the Extraordinary General Assembly held on 17 April 2005 to approve the division of each share of the Company into two. The issued and paid up capital becomes 128000000 shares with a value of EGP 5 per share. On 10 November 2005, the Extraordinary General Assembly of the Company decided to increase the authorized capital to one billion and three hundred million Egyptian pounds and to increase the issued and paid up capital to EGP 909,282,535 distributed on 181856507 shares with a value of EGP 5 for each. On 25 March 2013, the Extraordinary General Assembly of the Company decided to increase the authorized capital to three billion six hundred million Egyptian pounds.* Share capital structureThe following table shows a summary of the capital structure and the most significant shareholders (owners of 5% or more of the shareholders) on 31 December 2019.
Statement Number of shares Value Percentage %
Minaf Company 47,373,830 236,869,150 26.05%Simon France - Cement French Company 22,485,545 112,427,725 12.36%Ciments du Maroc 21,210,577 106,052,885 11.66%Remco Investments 21,423,531 107,117,655 11.78%Tarseem Company 9,100,000 45,500,000 5.00%Others 60,263,024 301,315,120 33.138%
23. Reserves23/A. Reserves
2019 2018
Legal reserve 454,641,267 454,641,267Special reserve - share premium reserve 2,013,865,903 2,013,865,903Special reserve 185,853,347 185,853,347Capital reserve 14,526,110 14,526,110Total other reserves 2,668,886,627 2,668,886,627Prior years adjustments right of sale option obligation (note 38-g) (262,308,793) (262,308,793) Total reserves 2,406,577,834 2,406,577,834
- Legal reserve: According to the Company’s Articles of Association, the company shall set aside 5% of the net profits of the year to form a statutory reserve until such reserve equals 50% of the issued capital of the company. The reserve shall be used on the basis of a decision of the general assemblies in accordance with board of director’s proposal. The statutory reserve has reached a maximum of 50% of the issued capital.- Share premium: The amount represents the outcome of collecting the issuance premium upon issuance of the latest increase in capital as of 10 November 2005 after the maximum statutory reserve has been met to reach 50% of the issued share capital.

113
- Special reserve: The special reserve consists of the profits transferred to the Special Reserve in accordance with the resolution of the general assemblies of the company for the period until 2004.- Capital reserve: Capital reserve is the capital gain resulting from the sale of certain fixed assets that are more than the net carrying value of these assets.
A/ Legal reserveIn accordance with the companies’ law number 159 for year 1981, 5 % of the net profit for the period is transferred to the legal reserve account. The transfer to legal reserve account stops once it reaches 20% of paid up capital. This reserve is not available for distribution to shareholders.
23/B Retained earningsRetained earnings movements are as follows
2019
Balance at 1 January 2019 (as previously issued) 1,267,452,954
Prior years settlements (Note 38) (1,522,885,820)
Balance at 1 January 2019 (restated) (255,432,866)
(Losses) for the year (977,683,108)
Actuarial profits (losses) (8,550,318)
Total comprehensive income for the year (986,233,426)
Dividends (38,250,758)
Balance at the end of the year (1,279,917,050)
24. Non-controlling interestsFirst: Change in (non-controlling) interests
2019 2018
Balance at the beginning of the year 623,318,894 483,412,133 Minority share in net profits/ (losses) for the year (200,901,802) 69,105,130 Change in minority interests balance - Hilal Cement Company (Kuwaiti Joint StockCompany) - 10,321,627 Share of minority interest in Foreign entity exchange rates translation differencesreserve (36,473,250) 81,727,950
Adjustments on retained earnings - (1,074,823)Dividends (65,876,775) (20,173,123) Balance at the end of the year 320,067,067 623,318,894
Second: Non-controlling interests balance in subsidiaries
Shareholding 2019 2018
%
Tourah Portland Cement Egyptian Company (SAE) 33.88 (276,693,528) (66,303,332)Helwan Cement Company (SAE) 0.45 5,343,739 4,855,825Global for ready mixed concrete production Company (SAE) 48 235,406,774 215,335,028 Hilal Cement group 49 60,464,654 137,327,699 total exchange rates translation differences 295,167,774 331,641,024Suez for transportation and trading Company (SAE) 3.63 377,115 461,488Suez for importation and exportation (SAE) 3.63 539 1,162
320,067,067 623,318,894

114
Suez Cement | Annual Report 2019
25. Pension retirement benefit liabilitiesEmployees of the Company are entitled upon their retirement, partial disability or to an end of service gratuity based on a defined benefit plan. The entitlement is based on the length of service and final remuneration package of the employee upon retirement. The defined benefit obligation is calculated using the projected additional unit method after taking into consideration the following assumptions:
2019 2018
Discount Rate 13.7% 15.25%
Average rate of salaries increase 7% 7%
Life schedule 45 45
2019 2018
Present value of liabilities 72,006,717 72,678,768
Liabilities at the financial position statement 72,006,717 72,678,768
Movement in the liability recognised in the statement of financial position
2019 2018
Balance at the beginning of the year 72,678,768 80,565,670
Cost of interests 6,978,000 12,392,400
Current service cost 1,932,996 17,112,474
Losses (profits) of retirement pension benefits settelment 46.759.682 (25.216.185)
Remeasurement of retirement benefits and pension liabilities 8,550,318 3.052.672 Recognised amounts in the statement of profit or loss and the statement ofcomprehensive income
64,220,996 7,341,361
Discontinued activities - (7,830,000)
Paid during the year (64,893,047) (7,398,263)
Balance at the end of the year 72,006,717 72,678,768
26. Deferred tax liabilities
2019 2018
Fixed assets depreciation (336,317,692) (326,203,654)Provisions 66,587,974 52,285,341Unrealized foreign currency valuation differences losses 7,893,847 17,924,956Net recognised deferred income tax (liability) (261,835,871) (255,993,357)
Un-recognised deferred tax assetsDeferred tax assets were not recognised due to the uncertainty of being useful in tax in the future.
2019 2018
Tax impact for retained tax losses 438,222,142 284,054,090

115
27. Sales
2019 2018
Cement and clinker sales 4,631,776,575 5,332,743,932Ready concrete sales 1,829,321,290 2,095,646,806
6,461,097,865 7,428,390,738
28.Other operating expenses
2019 2018
Rent of unused quarries 19,952,321 2,109,930Stamps and fees 13,250,109 2,380,533Penalties and compensations - Delay interests 7,208,217 12,686,868Site rehabilitation cost 5,135,580 -Impairment of debt balances and customers and notes receivables 69,149,935 19,586,340Reversed impairment of other debit balances 22,614,363 -Losses on sale of obsolete inventory 36,317,952 23,698,155Treatment fees for service abandoners 11,187,000 -Other expenses 57,710,560 8,233,388
242,526,037 68,695,214
29. Other operating income
2019 2018
Profits from scrap sales 12,702,320 16,144,852Governmental grants 2,445,464 11,571,816Rentals 2,026,478 1,918,044Penalties 2,320,867 3,052,058Profits on sale of fixed assets 68,787,413 106,351,648Reversed impairment of customers 47,940,845 -Service revenues - Suez Bags Company 5,833,333 1,971,247Other Income 40,584,839 36,287,529
182,641,559 177,297,194
30. Finance expenses (net)
2019 2018
Financing expenses
Interests on overdrafts (209,549,460) (32,082,182)
Interest on pension benefits plan (6,978,000) (12,392,400)
Other bank expenses (9,714,531) (8,755,583)
Change in right of sale liability (80,633,132) -
(306,875,123) (53,230,165)
Finance income
Interests from deposits 23,426,823 33,132,286
23,426,823 33,132,286
Profits/ (losses) on foreign currency revaluation 41,003,518 (8,055,000)
(242,444,782) (28,152,879)

116
Suez Cement | Annual Report 2019
31. Income taxes
2019 2018
Income taxes (33,098,890) (32,799,615)
Deferred income taxes (statement of profit or loss) (8,167,048) (84,913,152)
(41,265,938) (117,712,767)
32. Cost of sales
2019 2018
Fuel 1,537,532,980 2,084,050,194
Electricity 858,233,425 835,668,372
Raw materials and quarry leases 1,850,962,620 1,978,747,771
Packaging materials 331,466,101 343,097,046
Fixed assets depreciation 419,382,835 429,219,330
Wages and salaries 481,720,026 538,729,277
Freightages 158,512,909 244,103,215
Maintenance 394,445,273 395,670,194
Change in inventories 175,783,127 (243,108,726)
Impairment of inventory 3,015,700 (9,820,096)
Contractor’s services 162,781,789 64,115,447
Others 150,203,261 142,358,784
6,524,040,046 6,802,830,808
33. General and administrative expenses
2019 2018
Depreciation and amortisation expenses 28,994,066 32,771,073 Technical assistance fees 87,591,356 95,568,539Salaries 218,564,314 183,537,875 Pension benefits plan - current and prior service costs 1,932,996 17,112,474Reversal of retirement benefits plan expenses - (18,498,513)Public relations and promotion and advertisement expenses 14,111,544 7,643,059Restructuring expenses 50,497,580 48,344,822Board members attendance and transition allowances 1,690,686 1,349,372 Information technology service fees - Heilberg 16,093,775 17,628,273General and administration expenses 100,859,138 88,741,512Tax coupons 1,441,800 837,000
521,777,255 475,035,486
34. (Losses) per share Basic earnings per share on profit/ (loss) for the year is calculated by dividing the net profit/ (loss) of the year attributable to the parent company’s shareholders by the weighted average number of outstanding shares during the year, and considering the proposed future dividends for the employees as approved by the Board of Directors.

117
A. (Losses) per share from continued operations:
2019 2018
Net (loss) for the year (1,293,305,962) (1,518,840,353)Weighted average number of ordinary paid and issued shares 181856507 181856507Losses per share (7,11) (8.35)
B. Discontinued operations earnings per share:
2019 2018
Net profits from discontinued operations 315,622,854 131,423,905Weighted average number of ordinary paid and issued shares 181856507 181856507Earnings per share* 1,73 0,72
* The diluted earnings per share in profit (loss) is calculated by adjusting the weighted average number of ordinary shares outstanding to assume conversion of all dilutive potential ordinary shares. The Parent Company does not have dilutive potential shares as on 31 December 2019 and therefore, diluted profit (loss) per share equal to basic profit (loss) per share.
35. Financial instruments by category
Financial assets as per statement of financial position 2019 2018
Available-for-sale investments 1,560,562 1,560,562Customers, notes receivable and other debit balances * 1,025,652,606 1,187,844,418Cash on hand and at banks 743,374,558 798,121,644Due from related parties 3,313,890 11,964,033Total 1,773,901,616 1,999,490,657
* Debtors and other debit balances excludes prepaid expenses, suppliers and advances.
Financial liabilities as per statement of financial position 2019 2018
Medium term loans 83,755,514 93,407,880
Bank overdraft 1,517,496,181 427,416,695
Suppliers, accrued expenses and other credit balances * 1,341,674,141 1,679,155,952
Due to related parties 396,294,519 613,892,330
Settlement of right of sale liability 342,941,925 262,308,793
Total 3,682,162,280 3,076,181,650
* Other credit balances do not include customer credits and social security.
36. Tax positionDue to the nature of the tax assessment process in Egypt, the final outcome of the assessment by the Tax Authority cannot be realistically estimated. Therefore, additional liabilities are contingent upon the tax inspection and assessment of the Tax Authority.Tax positionFor the year ended 31 December 2019

118
Suez Cement | Annual Report 2019
1. Corporate taxesPeriod from incorporation to 2007: The payment of taxes due in accordance with the agreement of the Internal Committee - what has been paid within the limits of the provision.
The period from 2008 to 2011: The Company’s documents were inspected during this period and results differences have been agreed upon with the internal committee and complying with the final results from the seizure and collection department
The period from 2012 to 2014:The Company was inspected, and the Company objected to the claim of the errand, and the dispute is pending before the internal committees for re-examination.
The period from 2015 to 2019:The Company has not been tax tested for this period, and the Company submits the annual declaration regularly and pays the tax dues in accordance with a decision on legal deadlines.
2. General tax on sales/ value added tax (VAT)2/1. Sales general taxPeriod from incorporation to 2009: The tax inspection of the Company was conducted for this period, and there are some points that were not agreed upon with the Tax Authority and were referred to the court and the dispute is pending before the court.
Period from 2010 to 2013:The tax inspection of the Company for this period was completed and the examination differences were paid. Some items of examination were contested and the dispute was pending before the Supreme Grievance Committee.
Period from 2014 to 2015:The inspection of the period assessment was completed, and the results were objected and the internal committee was completed and the rest of the items were referred to the appeals committees Period from 1 January 2016 to 7 September 2016.The Company has not been tax-inspected for this period.The Company regularly submits the monthly returns within the legal deadlines.
2/2 Value Added Tax (VAT):Period from 8 September 2016 till 31 December 2019.The Company has not been tax-inspected for this period.The Company regularly submits the monthly returns within the legal deadlines.
3. Tax on earnings:Period from incorporation to 1998:The Company was tax inspected for this period, and the due tax was paid.
Period from 1999 to 2014:The Company’s documents are being examined for this period, and the Company deducts the tax from

119
employees and supplies it to the Tax Authority (monthly) on legal deadlines.Period from 2015 to 2019:The Company has not been tax inspected for this period. The Company pays the tax to the Tax Authority within the legal deadlines.
4. Stamp tax:Period from incorporation to 2014:The Company was tax inspected, the tax due settled and paid.Period from 2015 to 2017: The Company has not been tax-inspected for this period.
5. Real estate tax:The real estate tax of the Suez plant was paid up to 2019.We have not been provided yet with the return of Katameya factory since the law was issued.
6. Clay development fee:The period from the beginning of the implementation of the law on 5 May 2008 to 31 December 2017:The Company was tax inspected for this period, and the due tax was paid to the Tax Authority.Period 2018/ 2019: The Company was not inspected for this period.
37. Contingent liabilitiesLetters of guarantee issued according to the request of Suez Cement Company and its subsidiaries as follows:
Contingent liabilities
EGP
Suez Cement Company (S.A.E) 13,654,781
Tourah Portland Cement Egyptian Company (SAE) 18,465,705
Hilal Cement Company (SAK) 16,191,286
Helwan Cement Company (SAE) 37,055,570
85,367,342
The value of the documentary letters issued for the Company on 31 December 2019 amounted to EGP 60,304,972.
38. Prior Years’ settlementsSome of the comparative figures for 2018 have been reclassified to align with the presentation of the consolidated financial statements for this year. Some comparative figures have been modified and reclassified to align with the presentation for the fiscal year. The following is a summary of the amendments:A. Settlements of errors related to the impairment test of goodwillDuring the year ended 31 December 2019, the Group performed a detailed review of the impairment test in goodwill, which was performed as on 31 December 2018, and the management discovered that the assumptions used in the test were not in line with the economic indicators and cement industry forecasts according to the requirements of EAS (31) “Impairment in the value of assets “, which resulted in the failure to recognise impairment losses in goodwill of EGP 1,4 billion.

120
Suez Cement | Annual Report 2019
The error has been corrected by presenting the comparative figures as follows:
Financial position2018 As presented
Adjustments andreclassifications
Restated financialposition 2018
Financial position
Goodwill* 2,492,180,146 (1,398,528,973) 1,093,651,173
Retained earnings (accumulated losses) 1,260,403,296 (1,398,528,973) (138,125,677)
Statement of profit or loss
Impairment in goodwill* 197,249,076 1,398,528,973 1,595,778,049
Net profit (loss) for the year* 121,437,200 (1,398,528,973) (1,277,091,773)
B. Correcting errors in accounting for the fair value resulting from the acquisition of Tourah Portland Company (S.A.E)During the year ended 31 December 2019, the Group reviewed the fair value depreciation resulting from the reassessment of fixed assets as a result of the acquisition of Tourah Portland Company (S.A.E), and the management has discovered that the fair value depreciation expense for fixed assets has not been recognised in full during the previous years, which resulted in an increase in the fixed assets’ value by EGP 190 million.The error has been corrected by presenting the comparative figures as follows:
Financial position2018 As presented
Adjustments andreclassifications
Restated financialposition 2018
Financial position
Fixed assets 3,586,130,737 (190,429,794) 3,395,700,943
Retained earnings (accumulated losses) 1,260,403,296 (190,429,794) 1,069,973,502
Financial position
1 January 2018
As presented
Adjustments andreclassifications
Restated financialposition
1 January 2018
Financial position
Fixed assets 3,875,597,729 (190,429,794) 3,685,167,935
Retained earnings (accumulated losses) 1,420,835,448 (190,429,794) 1,230,405,654
C. Reclassification of actuarial profits in the statement of financial positionThe Group’s management discovered an error in the accounting treatment related to the cumulative effect of actuarial profits related to retirement benefits obligations, as the cumulative effect was recognised as a separate reserve in the statement of financial position as that cumulative effect shoul have been recognised within retained earnings,The errors have been corrected by presenting the comparative figures as follows:
Financial position2018 As presented
Adjustments andreclassifications
Restated financialposition 2018
Financial position
Actuarial profits (losses) 7,049,658 (7,049,658) -
Retained earnings (accumulated losses) 1,260,403,296 7,049,658 1,267,452,954

121
D. Treatment of the translation of goodwill related to Hilal Cement Company (foreign subsidiary)The Group’s management discovered an error in translating the goodwill of Al Hilal, as the goodwill of the company was translated at historical cost, while the goodwill had to be reassessed according to the Kuwaiti dinar exchange rate at the date of the financial position,
The errors have been corrected by presenting the comparative figures as follows:
Financial position2018
As presented
Adjustments andreclassifications
Restated financialposition
2.018Financial position
Goodwill 2,492,180,146 172,992,079 2,665,172,225
Foreign transactions translation differences reserve 256,951,432 88,225,961 345,177,393
Non-controlling interests 566,166,402 84,766,118 650,932,520
Financial position
1 January 2018
As presented
Adjustments andreclassifications
Restated financialposition
1 January 2018
Financial position
Goodwill 2,689,429,222 171,777,320 2,861,206,542
Exchange rates translation differences reserve 260,113,607 87,606,433 347,720,040
Retained earnings (accumulated losses) 566,166,402 84,170,887 650,337,289
E. Dividends income restatementManagement discovered that there is a mistake in dividends income treatment from one of its subsidiaries, the consolidation partially affected with those dividends in consolidated profit or loss statement, this should eliminated from consolidated financial statements:
Financial position2018 As presented
Adjustments andreclassifications
Restated financialposition 2018
Financial position
Investment Income 12,000,007 (12,000,007) -
Cumulative translation reserve 566,166,402 (12,000,007) 554,166,395
39. Segment reportingThe Group’s principle business sector is the production of cement of various types and other products branched from the cement industry and associated with it and the production of other building materials and construction requirements and trade in them and the exploitation of the mine and the quarries except for sand and gravel. The revenues, profits, and investments associated with other business sectors are currently not material.The report on the operating sectors was performed on the basis of the presence of two operating sectors according to the geographical location in Egypt and Kuwait, and there were no sales between the sectors during the year. They were disclosed in the periodic financial statements as follows:

122
Suez Cement | Annual Report 2019
Geographical sector (Egypt) Geographical sector (Kuwait) Total
Operating results 31 December 2019 31 December2018
31 December2019
31 December2018
31 December2019 31 December 2018
Net revenues 5,408,683,372 6,194,648,991 1,052,414,493 1,233,741,747 6,461,097,865 7,428,390,738
Cost of sales (5,591,830,663) (5,705,651,541) (932,209,383) (1,097,179,267) (6,524,040,046) (6,802,830,808)
Segment result “gross profits”(losses) (183,147,291) 488,997,450 120,205,110 136,562,480 (62,942,181) 625,559,930
Interests payable 14,718,345 33,132,286 8,708,478 - 23,426,823 33,132,286
Financing expenses (301,429,405) (48,335,368) (5,445,718) (4,894,797) (306,875,123) (53,230,165)
Profits/ (losses) on foreign curren-cy revaluation 40,358,282 (7,798,940) 645,236 (256,060) 41,003,518 (8,055,000)
Profits on sale from discontinuedoperations 315,622,854 102,788,922 - - 315,622,854 102,788,922
Profits from discontinued activities - 28,634,983 - - - 28,634,983
Other Income 147,005,169 235,690,077 63,499,056 13,024,425 210,504,225 248,714,502
Other expenses (1,096,236,504) (2,031,837,072) (261,822,584) (146,306,937) (1,358,059,088) (2,178,144,009)
Income taxes (41,265,938) (117,712,767) - - (41,265,938) (117,712,767)
Net (losses) for the year (1,104,374,488) (1,316,440,429) (74,210,422) (1,870,889) (1,178,584,910) (1,318,311,318)
Other information 31 December 2019 31 December2018
31 December2019
31 December2018
31 December2019 31 December 2018
Segment assets 7,116,022,926 7,885,064,458 1,036,000,296 1,320,655,335 8,152,023,222 9,205,719,793
Segment liabilities 4,989,248,908 4,742,234,719 384,121,495 434,234,283 5,373,370,403 5,176,469,002
Depreciation and amortisation 5,767,580,608 5,848,042,931 883,872,386 956,398,045 6,651,452,994 6,804,440,976
40. Going concernNet liabilities of Suez Cement Company and its subsidiaries (the Group) amounted to EGP 1,5 billion and the Group’s accumulated losses amounted to EGP 1,3 billion, mainly from the Tourah Portland Cement Company (subsidiary), where the extraordinary general assembly of Tourah Portland Company, held on 10 June 2019, decided to temporarily suspend cement activity until the market conditions improve.
The cement plant activity has been temporarily suspended to reduce the cash losses incurred by the plant, but the plant will remain preserved until the market conditions improve. The Company incurred an amount of EGP 257 million against the voluntary retirement program for the Company’s employees, which resulted in reducing the number of workers. The Company will continue the process of selling unutilised surplus assets and lands in accordance with the decision of the General Assembly at its meeting on 16 September 2018. Management has assessed the cash outflows arising from holding the plant in this temporarily dormant state and has considered the sufficiency of funds available to it, both from within its parent group and from the sale of surplus assets.
However, Heidelberg Cement, (the Holding Company) have committed to provide the Company with such financial support as is nece ssary to enable it to continue its operations and to meet its obligations until 31 July 2021, if required.

123
Also, after the budget date, the Group’s management signed an agreement with one of the investors to sell all its share in Hilal Kuwait Cement Company for EGP 216 million in order to finance the Group’s cash deficit.
41. Subsequent eventsAt a subsequent date for preparing the financial statements, the Company’s management decided on 6 January 2020 to sell its investments in Hilal Cement Company - Kuwait (Kuwaiti Joint Stock Company) at a realisable value of KWD 4,08 million, equivalent of EGP 215,883,816 at the date of preparing the financial statements on 31 December 2019 and it is expected that the sale will be completed during the second quarter of 2020.