Embed Size (px)
Citation preview
2019ANNUAL REPORT

MAURITANIA
SENEGAL
SURINAMEGHANA
CÔTE D’IVOIRE
SÃO TOMÉ & PRÍNCIPE
EQUATORIAL GUINEA
NAMIBIA
SOUTH AFRICA
U.S. GULF OF MEXICO
KOSMOS ENERGY IS A FULL-CYCLE EXPLORATION AND
PRODUCTION COMPANY WITH A DIVERSIFIED PRODUCTION
BASE, WORLD-CLASS DEVELOPMENT PROJECTS, AND VALUE
CREATION OPPORTUNITIES THROUGH INFRASTRUCTURE-
LED AND BASIN-OPENING EXPLORATION.
AS A RESPONSIBLE COMPANY, WE ARE WORKING TO SUPPLY
THE ENERGY THE WORLD NEEDS TODAY, FIND AND DEVELOP
CLEANER ENERGY TO ADVANCE THE ENERGY TRANSITION,
AND BE A FORCE FOR GOOD IN OUR HOST COUNTRIES.

2019 was another year of marked progress for Kosmos Energy, demonstrated by disciplined execution and strong performance across the business.
The company generated approximately $250 million of free cash flow, which enabled us to reduce our leverage in line with our strategy of protecting the balance sheet and generating free cash flow for our shareholders. We ended the year with approximately $825 million in liquidity, no near-term debt maturities, and a solid hedging position aimed at protecting the company from volatile oil prices.
CHALLENGING 2020
As I write this note, our company, our industry, the financial markets, and indeed the entire world are navigating unprecedented times. The restrictive measures required to deal with the spread of COVID-19 (coronavirus) have created a very challenging environment for both Kosmos and our industry.
As we plot our course through these challenges, Kosmos benefits from owning conventional assets that remain strong, with low cash costs and maintenance capital expenditures. Our reserve base is also strong with greater than 100% reserve replacement over the past seven years. We have a diverse portfolio of reliable producing assets in Ghana, Equatorial Guinea, and Gulf of Mexico, as well as expected future gas production in Mauritania and Senegal, all of which provides the company with a bright future despite the current difficulties in the market.
Nevertheless, we have a responsibility to take all practical measures to safeguard our people and see us through these testing times.
MAINTAIN LIQUIDITY AND REDUCING CASH COSTS
We have taken quick decisive action to protect the financial strength of our company and preserve our options for the future. At the 4Q 2019 results, we guided to a 2020 capital budget for our base production business of $325-$375 million. We have since identified capital reductions of about 40% from discretionary expenditure largely from exploration
activities in the Gulf of Mexico, our basin-opening exploration portfolio, and other non-critical work that does not impact safety and asset integrity. The company is now targeting capital expenditure of $200-$225 million in 2020, while keeping 2020 production within the range of previous guidance and with minimal expected impact on 2021 production. Kosmos also has significant flexibility in its 2021 capital program should current market conditions persist.
In Mauritania and Senegal, we are working with the operator to optimize Phase 1 of the Greater Tortue Ahmeyim (GTA) project. As the project has been delayed approximately 12 months due to COVID-19 mitigation measures around the world, we now expect first gas in the first half of 2023 and anticipate BP’s carry of our capital obligations to last through the end of this year. GTA Phases 2 and 3 are expected to take final investment decision (FID) shortly thereafter with minimal capital required ahead of FID with the objective to project finance both thereafter. In parallel, our priority remains to sell down our interests to support a self-funded growing gas business.
We also plan to implement cost reductions with over $100 million of savings expected in operating expenditures (Opex) and general and administrative costs (G&A) in 2020. While a significant portion of our Opex is fixed, we are targeting a reduction of $2-3 per barrel of oil equivalent without impacting asset integrity or near-term production. Through a 25% reduction in company headcount, no planned cash bonuses for employees in 2020, and other cost reductions, we plan to significantly reduce cash G&A in 2020. Further, we made the difficult decision in March to suspend our dividend, resulting in savings of approximately $57 million in 2020.
These actions were taken to put us in the best position possible to maintain balance sheet strength and preserve flexibility. We will continue to closely monitor and quickly respond to events as they develop, and will consider taking further measures if required.
NAVIGATING THROUGH A DIFFICULT TIME
I remain confident that Kosmos will navigate successfully through this difficult time. We have all the key ingredients required for differentiated performance, even in the current environment: our dedicated employees are committed to running the business safely and efficiently; a low cost portfolio of conventional oil and gas assets; and a strong balance sheet.
Thank you for your investment in our company.
Sincerely yours,
Fellow Shareholders,
ANDREW G. INGLIS
Chairman and Chief Executive Officer

FINANCIAL HIGHLIGHTS
Year Ended (in thousands, except volume data) 2019 2018 2017
Revenues and other income $ 1,509,909 $ 902,369 $ 636,836
Net income (loss) (55,777) (93,991) (222,792)
Net cash provided by operating activities 628,150 260,491 236,617
EBITDAX 989,638 752,039 540,117
Capital expenditures 440,736 385,434 57,432
Total Assets 4,317,232 4,088,189 3,192,603
Total long-term debt 2,008,063 2,120,547 1,282,797
Total shareholders’ equity 841,702 941,478 897,112
Sales volumes (million barrels of oil equivalent)2 24.9 18.5 11.2
Total proved reserves (million barrels of oil equivalent)3 169 167 110
Crude oil (million barrels)3 154 151 100
Natural gas (billion cubic feet)3 92 99 61
1. 2P Reserves as per Ryder Scott year end PRMS Reserve Reports 2. Includes our share of sales volumes from our Equatorial Guinea equity method investment.3. Includes our share of reserves from our Equatorial Guinea equity method investment.
Year Ended December 31,
2019 Year Ended December 31, 2018 Year Ended December 31, 2017
KOSMOS KOSMOSEQUATORIAL
GUINEA (Equity Method)2
TOTAL KOSMOSEQUATORIAL
GUINEA (Equity Method)2
TOTAL
Net income (loss) $ (55,777) $ (93,991) $ 72,881 $ (21,110) $ (222,792) $ 5,234 $ (217,558)
Exploration expenses 180,955 301,492 352 301,844 216,050 — 216,050
Facilities insurance modifications, net (24,254) 6,955 — 6,955 (820) — (820)
Depletion, depreciation and amortization 563,861 329,835 134,982 464,817 255,203 11,181 266,384
Equity-based compensation 32,370 35,230 — 35,230 39,913 — 39,913
Derivatives, net 71,885 (31,430) — (31,430) 59,968 — 59,968
Cash settlements on commodity derivatives (36,341) (137,053) — (137,053) 38,737 — 38,737
Inventory impairment and other 27,350 288 — 288 403 — 403
Disputed charges and related costs 4,149 (9,753) — (9,753) 4,962 — 4,962
Gain on sale of assets (10,528) (7,666) — (7,666) — — —
Loss on equity method investment - KBSL — — — — 11,486 — 11,486
Gain on equity method investment - KTIPI — (72,881) — (72,881) (5,234) — (5,234)
Interest and other financing costs, net 155,074 101,176 — 101,176 77,595 — 77,595
Income tax expense 80,894 43,131 78,491 121,622 44,937 3,294 48,231
EBITDAX $ 989,638 $ 465,333 $ 286,706 $ 752,039 $ 520,408 $ 19,709 $ 540,117
EBITDAX RECONCILIATION
1. For the three months and year ended December 31, 2018, we have presented separately our 50% share of the results from operations and amortization of our basis difference for the Equatorial Guinea investment, as we account for such investment under the equity method.
2. For the three months and year ended December 31, 2017, we have presented separately our 50% share of the results from operations and amortization of our basis difference for the Equatorial Guinea investment from the date of acquisition, November 28, 2017 through December 31, 2017 as we account for such investment under the equity method.
UNITED STATESSECURITIES AND EXCHANGE COMMISSION
Washington, D.C. 20549
FORM 10-K(Mark One)☒ ANNUAL REPORT PURSUANT TO SECTION 13 OR 15(d) OF THE SECURITIES EXCHANGE ACT OF 1934
For the fiscal year ended December 31, 2019☐ TRANSITION REPORT PURSUANT TO SECTION 13 OR 15(d) OF THE SECURITIES EXCHANGE ACT OF 1934
For the transition period from toCommission file number: 001-35167
Kosmos Energy Ltd.(Exact name of registrant as specified in its charter)
Delaware 98-0686001(State or other jurisdiction of
incorporation or organization)(I.R.S. Employer
Identification No.)
8176 Park LaneDallas, Texas
(Address of principal executive offices)
75231(Zip Code)
Registrant’s telephone number, including area code: +1 214 445 9600
Securities registered pursuant to Section 12(b) of the Act:Title of each class Trading Symbol Name of each exchange on which registered:
Common Stock $0.01 par value KOS New York Stock ExchangeLondon Stock Exchange
Securities registered pursuant to Section 12(g) of the Act: NoneIndicate by check mark if the registrant is a well-known seasoned issuer, as defined in Rule 405 of the Securities Act. Yes ☒ No ☐
Indicate by check mark if the registrant is not required to file reports pursuant to Section 13 or Section 15(d) of the Act. Yes ☐ No ☒
Indicate by check mark whether the registrant: (1) has filed all reports required to be filed by Section 13 or 15(d) of the SecuritiesExchange Act of 1934 during the preceding 12 months (or for such shorter period that the registrant was required to file such reports), and(2) has been subject to such filing requirements for the past 90 days. Yes ☒ No ☐
Indicate by check mark whether the registrant has submitted electronically and posted on its corporate Web site, if any, every InteractiveData File required to be submitted and posted pursuant to Rule 405 of Regulation S-T (§232.405 of this chapter) during the preceding 12 months(or for such shorter period that the registrant was required to submit and post such files). Yes ☒ No ☐
Indicate by check mark if disclosure of delinquent filers pursuant to Item 405 of Regulation S-K (§229.405 of this chapter) is notcontained herein, and will not be contained, to the best of registrant’s knowledge, in definitive proxy or information statements incorporatedby reference in Part III of this Form 10-K or any amendment to this Form 10-K. ☒
Indicate by check mark whether the registrant is a large accelerated filer, an accelerated filer, a non-accelerated filer, a smaller reportingcompany, or an emerging growth company. See the definitions of “large accelerated filer,” “accelerated filer,” “smaller reporting company” and“emerging growth company” in Rule 12b-2 of the Exchange Act.Large accelerated filer ☒ Accelerated filer ☐
Non-accelerated filer ☐ Smaller reporting company ☐
(Do not check if a smaller reporting company) Emerging growth company ☐
If an emerging growth company, indicate by check mark if the registrant has elected not to use the extended transition period forcomplying with any new or revised financial accounting standards provided pursuant to Section 13(a) of the Exchange Act. ☐
Indicate by check mark whether the registrant is a shell company (as defined in Rule 12b-2 of the Exchange Act). Yes ☐ No ☒
The aggregate market value of the voting and non-voting common stock held by non-affiliates, based on the per-share closing price ofthe registrant’s common stock as of the last business day of the registrant’s most recently completed second fiscal quarter was $2,220,129,484.
The number of the registrant’s Common Stock outstanding as of February 14, 2020 was 405,098,215.DOCUMENTS INCORPORATED BY REFERENCE
Part III, Items 10-14, is incorporated by reference from the Proxy Statement for the Annual Meeting of Shareholders which will be filedwith the Securities and Exchange Commission not later than 120 days subsequent to December 31, 2019.
Certain exhibits previously filed with the Securities and Exchange Commission are incorporated by reference into Part IV of this report.
TABLE OF CONTENTS
Unless otherwise stated in this report, references to “Kosmos,” “we,” “us” or “the company” refer toKosmos Energy Ltd. and its subsidiaries. On December 28, 2018, we changed our jurisdiction of incorporationfrom Bermuda to the State of Delaware, which we refer to herein as the Redomestication. All references to“Kosmos,” “we,” “us” or “the company” on or before December 28, 2018 refer to Kosmos Energy Ltd., anexempted company incorporated pursuant to the laws of Bermuda, and its subsidiaries. All such references afterDecember 28, 2018 refer to Kosmos Energy Ltd., a Delaware corporation, and its subsidiaries. In addition, allreferences to “common stock” on or before December 28, 2018 refer to the common shares of Kosmos EnergyLtd. prior to the Redomestication, and all such references after December 28, 2018 refer to the common stockof Kosmos Energy Ltd. after the Redomestication. For additional detail, please see “Item 1. Business—CorporateInformation.”
In addition, we have provided definitions for some of the industry terms used in this report in the “Glossaryand Selected Abbreviations” beginning on page 3.
Page
Glossary and Selected Abbreviations . . . . . . . . . . . . . . . . . . . . . . . . . . . . . . . . . 3Cautionary Statement Regarding Forward-Looking Statements . . . . . . . . . . . . . . 8
PART IItem 1. Business . . . . . . . . . . . . . . . . . . . . . . . . . . . . . . . . . . . . . . . . . . . . . . . . . . . . 10Item 1A. Risk Factors . . . . . . . . . . . . . . . . . . . . . . . . . . . . . . . . . . . . . . . . . . . . . . . . . 38Item 1B. Unresolved Staff Comments . . . . . . . . . . . . . . . . . . . . . . . . . . . . . . . . . . . . . . 62Item 2. Properties . . . . . . . . . . . . . . . . . . . . . . . . . . . . . . . . . . . . . . . . . . . . . . . . . . . 62Item 3. Legal Proceedings . . . . . . . . . . . . . . . . . . . . . . . . . . . . . . . . . . . . . . . . . . . . . . 63Item 4. Mine Safety Disclosures . . . . . . . . . . . . . . . . . . . . . . . . . . . . . . . . . . . . . . . . . 63
PART IIItem 5. Market for the Registrant’s Common Equity, Related Stockholder Matters and
Issuer Purchases of Equity Securities . . . . . . . . . . . . . . . . . . . . . . . . . . . . . . . . 64Item 6. Selected Financial Data . . . . . . . . . . . . . . . . . . . . . . . . . . . . . . . . . . . . . . . . . . 66Item 7. Management’s Discussion and Analysis of Financial Condition and Results of
Operations . . . . . . . . . . . . . . . . . . . . . . . . . . . . . . . . . . . . . . . . . . . . . . . . . . . 68Item 7A. Quantitative and Qualitative Disclosures About Market Risk . . . . . . . . . . . . . . . 88Item 8. Financial Statements and Supplementary Data . . . . . . . . . . . . . . . . . . . . . . . . . 90Item 9. Changes in and Disagreements With Accountants on Accounting and Financial
Disclosure . . . . . . . . . . . . . . . . . . . . . . . . . . . . . . . . . . . . . . . . . . . . . . . . . . . 148Item 9A. Controls and Procedures . . . . . . . . . . . . . . . . . . . . . . . . . . . . . . . . . . . . . . . . . 148Item 9B. Other Information . . . . . . . . . . . . . . . . . . . . . . . . . . . . . . . . . . . . . . . . . . . . . 149
PART IIIItem 10. Directors, Executive Officers and Corporate Governance . . . . . . . . . . . . . . . . . . 150Item 11. Executive Compensation . . . . . . . . . . . . . . . . . . . . . . . . . . . . . . . . . . . . . . . . . 150Item 12. Security Ownership of Certain Beneficial Owners and Management and Related
Stockholder Matters . . . . . . . . . . . . . . . . . . . . . . . . . . . . . . . . . . . . . . . . . . . . 150Item 13. Certain Relationships and Related Transactions, and Director Independence . . . . . 150Item 14. Principal Accounting Fees and Services . . . . . . . . . . . . . . . . . . . . . . . . . . . . . . . 150
PART IVItem 15. Exhibits, Financial Statement Schedules . . . . . . . . . . . . . . . . . . . . . . . . . . . . . . 151Item 16. Form 10-K Summary . . . . . . . . . . . . . . . . . . . . . . . . . . . . . . . . . . . . . . . . . . . 155
2
KOSMOS ENERGY LTD.GLOSSARY AND SELECTED ABBREVIATIONS
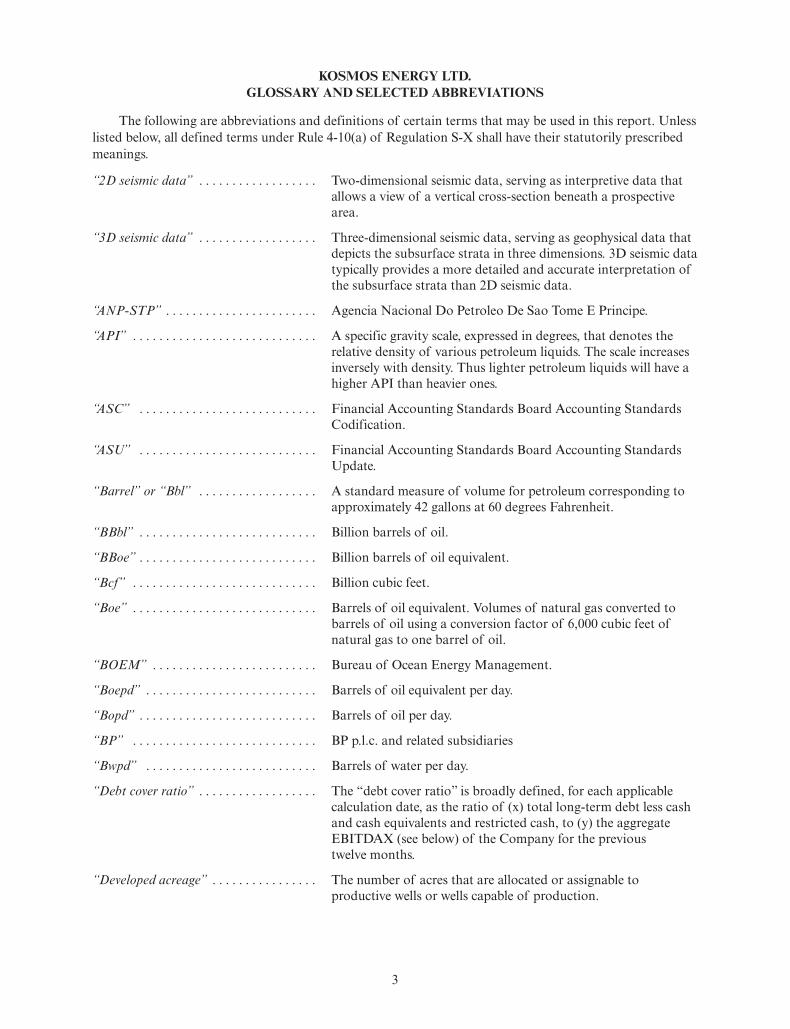
The following are abbreviations and definitions of certain terms that may be used in this report. Unlesslisted below, all defined terms under Rule 4-10(a) of Regulation S-X shall have their statutorily prescribedmeanings.
“2D seismic data” . . . . . . . . . . . . . . . . . . Two-dimensional seismic data, serving as interpretive data thatallows a view of a vertical cross-section beneath a prospectivearea.
“3D seismic data” . . . . . . . . . . . . . . . . . . Three-dimensional seismic data, serving as geophysical data thatdepicts the subsurface strata in three dimensions. 3D seismic datatypically provides a more detailed and accurate interpretation ofthe subsurface strata than 2D seismic data.
“ANP-STP” . . . . . . . . . . . . . . . . . . . . . . . Agencia Nacional Do Petroleo De Sao Tome E Principe.
“API” . . . . . . . . . . . . . . . . . . . . . . . . . . . . A specific gravity scale, expressed in degrees, that denotes therelative density of various petroleum liquids. The scale increasesinversely with density. Thus lighter petroleum liquids will have ahigher API than heavier ones.
“ASC” . . . . . . . . . . . . . . . . . . . . . . . . . . . Financial Accounting Standards Board Accounting StandardsCodification.
“ASU” . . . . . . . . . . . . . . . . . . . . . . . . . . . Financial Accounting Standards Board Accounting StandardsUpdate.
“Barrel” or “Bbl” . . . . . . . . . . . . . . . . . . A standard measure of volume for petroleum corresponding toapproximately 42 gallons at 60 degrees Fahrenheit.
“BBbl” . . . . . . . . . . . . . . . . . . . . . . . . . . . Billion barrels of oil.
“BBoe” . . . . . . . . . . . . . . . . . . . . . . . . . . . Billion barrels of oil equivalent.
“Bcf” . . . . . . . . . . . . . . . . . . . . . . . . . . . . Billion cubic feet.
“Boe” . . . . . . . . . . . . . . . . . . . . . . . . . . . . Barrels of oil equivalent. Volumes of natural gas converted tobarrels of oil using a conversion factor of 6,000 cubic feet ofnatural gas to one barrel of oil.
“BOEM” . . . . . . . . . . . . . . . . . . . . . . . . . Bureau of Ocean Energy Management.
“Boepd” . . . . . . . . . . . . . . . . . . . . . . . . . . Barrels of oil equivalent per day.
“Bopd” . . . . . . . . . . . . . . . . . . . . . . . . . . . Barrels of oil per day.
“BP” . . . . . . . . . . . . . . . . . . . . . . . . . . . . BP p.l.c. and related subsidiaries
“Bwpd” . . . . . . . . . . . . . . . . . . . . . . . . . . Barrels of water per day.
“Debt cover ratio” . . . . . . . . . . . . . . . . . . The “debt cover ratio” is broadly defined, for each applicablecalculation date, as the ratio of (x) total long-term debt less cashand cash equivalents and restricted cash, to (y) the aggregateEBITDAX (see below) of the Company for the previoustwelve months.
“Developed acreage” . . . . . . . . . . . . . . . . The number of acres that are allocated or assignable toproductive wells or wells capable of production.
3

“Development” . . . . . . . . . . . . . . . . . . . . The phase in which an oil or natural gas field is brought intoproduction by drilling development wells and installingappropriate production systems.
“DGE” . . . . . . . . . . . . . . . . . . . . . . . . . . . Deep Gulf Energy (together with its subsidiaries).
“DST” . . . . . . . . . . . . . . . . . . . . . . . . . . . Drill stem test.
“Dry hole” or “Unsuccessful well” . . . . . A well that has not encountered a hydrocarbon bearing reservoirexpected to produce in commercial quantities.
“DT” . . . . . . . . . . . . . . . . . . . . . . . . . . . . Deepwater Tano.
“EBITDAX” . . . . . . . . . . . . . . . . . . . . . . Net income (loss) plus (i) exploration expense, (ii) depletion,depreciation and amortization expense, (iii) equity-basedcompensation expense, (iv) unrealized (gain) loss on commodityderivatives (realized losses are deducted and realized gains areadded back), (v) (gain) loss on sale of oil and gas properties,(vi) interest (income) expense, (vii) income taxes, (viii) loss onextinguishment of debt, (ix) doubtful accounts expense and(x) similar other material items which management believes affectthe comparability of operating results. The Facility EBITDAXdefinition includes 50% of the EBITDAX adjustments ofKosmos-Trident International Petroleum Inc for the period itwas an equity method investment and includes Last TwelveMonths (“LTM”) EBITDAX for any acquisitions and excludesLTM EBITDAX for any divestitures.
“ESG” . . . . . . . . . . . . . . . . . . . . . . . . . . . Environmental, social, and governance.
“ESP” . . . . . . . . . . . . . . . . . . . . . . . . . . . Electric submersible pump.
“E&P” . . . . . . . . . . . . . . . . . . . . . . . . . . . Exploration and production.
“FASB” . . . . . . . . . . . . . . . . . . . . . . . . . . Financial Accounting Standards Board.
“Farm-in” . . . . . . . . . . . . . . . . . . . . . . . . . An agreement whereby a party acquires a portion of theparticipating interest in a block from the owner of such interest,usually in return for cash and/or for taking on a portion offuture costs or other performance by the assignee as a conditionof the assignment.
“Farm-out” . . . . . . . . . . . . . . . . . . . . . . . An agreement whereby the owner of the participating interestagrees to assign a portion of its participating interest in a blockto another party for cash and/or for the assignee taking on aportion of future costs and/or other work as a condition of theassignment.
“FEED” . . . . . . . . . . . . . . . . . . . . . . . . . . Front End Engineering Design.
“Field life cover ratio” . . . . . . . . . . . . . . . The “field life cover ratio” is broadly defined, for each applicableforecast period, as the ratio of (x) the forecasted net presentvalue of net cash flow through depletion plus the net presentvalue of the forecast of certain capital expenditures incurred inrelation to the Ghana and Equatorial Guinea assets, to (y) theaggregate loan amounts outstanding under the Facility.
“FLNG” . . . . . . . . . . . . . . . . . . . . . . . . . . Floating liquefied natural gas.
“FPS” . . . . . . . . . . . . . . . . . . . . . . . . . . . Floating production system.
4
“FPSO” . . . . . . . . . . . . . . . . . . . . . . . . . . Floating production, storage and offloading vessel.
“Galp” . . . . . . . . . . . . . . . . . . . . . . . . . . . Galp Energia Sao Tome E Principe, Unipessoal, LDA.
“GEPetrol” . . . . . . . . . . . . . . . . . . . . . . . Guinea Equatorial De Petroleos.
“GHG” . . . . . . . . . . . . . . . . . . . . . . . . . . . Greenhouse gas.
“GJFFDP” . . . . . . . . . . . . . . . . . . . . . . . Greater Jubilee Full Field Development Plan.
“GNPC” . . . . . . . . . . . . . . . . . . . . . . . . . Ghana National Petroleum Corporation.
“Greater Tortue Ahmeyim” . . . . . . . . . . Ahmeyim and Guembeul discoveries.
“GTA UUOA” . . . . . . . . . . . . . . . . . . . . . Unitization and Unit Operating Agreement covering the GreaterTortue Ahmeyim Unit.
“Hess” . . . . . . . . . . . . . . . . . . . . . . . . . . . Hess Corporation.
“HLS” . . . . . . . . . . . . . . . . . . . . . . . . . . . Heavy Louisiana Sweet.
“H&M” . . . . . . . . . . . . . . . . . . . . . . . . . . Hull and Machinery insurance.
“Jubilee UUOA” . . . . . . . . . . . . . . . . . . . Unitization and Unit Operating Agreement covering the JubileeUnit.
“KBSL” . . . . . . . . . . . . . . . . . . . . . . . . . . Kosmos BP Senegal Limited.
“KTEGI” . . . . . . . . . . . . . . . . . . . . . . . . . Kosmos-Trident Equatorial Guinea Inc.
“KTIPI” . . . . . . . . . . . . . . . . . . . . . . . . . Kosmos-Trident International Petroleum Inc.
“Interest cover ratio” . . . . . . . . . . . . . . . . The “interest cover ratio” is broadly defined, for each applicablecalculation date, as the ratio of (x) the aggregate EBITDAX (seeabove) of the Company for the previous twelve months, to(y) interest expense less interest income for the Company for theprevious twelve months.
“LNG” . . . . . . . . . . . . . . . . . . . . . . . . . . . Liquefied natural gas.
“Loan life cover ratio” . . . . . . . . . . . . . . The “loan life cover ratio” is broadly defined, for each applicableforecast period, as the ratio of (x) net present value of forecastednet cash flow through the final maturity date of the Facility plusthe net present value of forecasted capital expenditures incurredin relation to the Ghana and Equatorial Guinea assets, to (y) theaggregate loan amounts outstanding under the Facility.
“LOPI” . . . . . . . . . . . . . . . . . . . . . . . . . . Loss of Production Income.
“LSE” . . . . . . . . . . . . . . . . . . . . . . . . . . . London Stock Exchange.
“LTIP” . . . . . . . . . . . . . . . . . . . . . . . . . . Long Term Incentive Plan.
“MBbl” . . . . . . . . . . . . . . . . . . . . . . . . . . Thousand barrels of oil.
“MBoe” . . . . . . . . . . . . . . . . . . . . . . . . . . Thousand barrels of oil equivalent.
“Mcf” . . . . . . . . . . . . . . . . . . . . . . . . . . . Thousand cubic feet of natural gas.
“Mcfpd” . . . . . . . . . . . . . . . . . . . . . . . . . . Thousand cubic feet per day of natural gas.
“MMBbl” . . . . . . . . . . . . . . . . . . . . . . . . Million barrels of oil.
“MMBoe” . . . . . . . . . . . . . . . . . . . . . . . . Million barrels of oil equivalent.
“MMBtu” . . . . . . . . . . . . . . . . . . . . . . . . Million British thermal units.
5

“MMcf” . . . . . . . . . . . . . . . . . . . . . . . . . Million cubic feet of natural gas.
“MMcfd” . . . . . . . . . . . . . . . . . . . . . . . . . Million cubic feet per day of natural gas.
“MMTPA” . . . . . . . . . . . . . . . . . . . . . . . Million metric tonnes per annum.
“NAMCOR” . . . . . . . . . . . . . . . . . . . . . . National Petroleum Corporation of Namibia.
“Natural gas liquid” or “NGL” . . . . . . . Components of natural gas that are separated from the gas statein the form of liquids. These include propane, butane, andethane, among others.
“NYSE” . . . . . . . . . . . . . . . . . . . . . . . . . . New York Stock Exchange.
“Ophir” . . . . . . . . . . . . . . . . . . . . . . . . . . Ophir Energy plc.
“PETROCI” . . . . . . . . . . . . . . . . . . . . . . PETROCI Holding.
“Petroleum contract” . . . . . . . . . . . . . . . A contract in which the owner of hydrocarbons gives an E&Pcompany temporary and limited rights, including an exclusiveoption to explore for, develop, and produce hydrocarbons fromthe lease area.
“Petroleum system” . . . . . . . . . . . . . . . . . A petroleum system consists of organic material that has beenburied at a sufficient depth to allow adequate temperature andpressure to expel hydrocarbons and cause the movement of oiland natural gas from the area in which it was formed to areservoir rock where it can accumulate.
“Plan of development” or “PoD” . . . . . . A written document outlining the steps to be undertaken todevelop a field.
“Productive well” . . . . . . . . . . . . . . . . . . An exploratory or development well found to be capable ofproducing either oil or natural gas in sufficient quantities tojustify completion as an oil or natural gas well.
“Prospect(s)” . . . . . . . . . . . . . . . . . . . . . A potential trap that may contain hydrocarbons and is supportedby the necessary amount and quality of geologic and geophysicaldata to indicate a probability of oil and/or natural gasaccumulation ready to be drilled. The five required elements(generation, migration, reservoir, seal and trap) must be presentfor a prospect to work and if any of these fail neither oil nornatural gas may be present, at least not in commercial volumes.
“Proved reserves” . . . . . . . . . . . . . . . . . . Estimated quantities of crude oil, natural gas and natural gasliquids that geological and engineering data demonstrate withreasonable certainty to be economically recoverable infuture years from known reservoirs under existing economic andoperating conditions, as well as additional reserves expected to beobtained through confirmed improved recovery techniques, asdefined in SEC Regulation S-X 4-10(a)(2).
“Proved developed reserves” . . . . . . . . . . Those proved reserves that can be expected to be recoveredthrough existing wells and facilities and by existing operatingmethods.
“Proved undeveloped reserves” . . . . . . . . Those proved reserves that are expected to be recovered fromfuture wells and facilities, including future improved recoveryprojects which are anticipated with a high degree of certainty inreservoirs which have previously shown favorable response toimproved recovery projects.
6

“RSC” . . . . . . . . . . . . . . . . . . . . . . . . . . . Ryder Scott Company, L.P.
“SEC” . . . . . . . . . . . . . . . . . . . . . . . . . . . Securities and Exchange Commission.
“Senior Notes” . . . . . . . . . . . . . . . . . . . . 7.125% Senior Notes due 2026.
“Senior Secured Notes” . . . . . . . . . . . . . 7.875% Senior Secured Notes due 2021.
“Shelf margin” . . . . . . . . . . . . . . . . . . . . The path created by the change in direction of the shoreline inreaction to the filling of a sedimentary basin.
“Shell” . . . . . . . . . . . . . . . . . . . . . . . . . . . Royal Dutch Shell and related subsidiaries.
“SNPC” . . . . . . . . . . . . . . . . . . . . . . . . . . Société Nationale des Pétroles du Congo.
“Stratigraphy” . . . . . . . . . . . . . . . . . . . . . The study of the composition, relative ages and distribution oflayers of sedimentary rock.
“Stratigraphic trap” . . . . . . . . . . . . . . . . A stratigraphic trap is formed from a change in the character ofthe rock rather than faulting or folding of the rock and oil is heldin place by changes in the porosity and permeability of overlyingrocks.
“Structural trap” . . . . . . . . . . . . . . . . . . . A topographic feature in the earth’s subsurface that forms a highpoint in the rock strata. This facilitates the accumulation of oiland gas in the strata.
“Structural-stratigraphic trap” . . . . . . . . A structural-stratigraphic trap is a combination trap withstructural and stratigraphic features.
“Submarine fan” . . . . . . . . . . . . . . . . . . . A fan-shaped deposit of sediments occurring in a deep watersetting where sediments have been transported via mass flow,gravity induced, processes from the shallow to deep water. Thesesystems commonly develop at the bottom of sedimentary basinsor at the end of large rivers.
“TAG GSA” . . . . . . . . . . . . . . . . . . . . . . . TEN Associated Gas—Gas Sales Agreement.
“TEN” . . . . . . . . . . . . . . . . . . . . . . . . . . . Tweneboa, Enyenra and Ntomme.
“Three-way fault trap” . . . . . . . . . . . . . . A structural trap where at least one of the components of closureis formed by offset of rock layers across a fault.
“Tortue Phase 1 SPA” . . . . . . . . . . . . . . . Greater Tortue Ahmeyim Agreement for a Long Term Sale andPurchase of LNG.
“Trap” . . . . . . . . . . . . . . . . . . . . . . . . . . . A configuration of rocks suitable for containing hydrocarbonsand sealed by a relatively impermeable formation through whichhydrocarbons will not migrate.
“Trident” . . . . . . . . . . . . . . . . . . . . . . . . . Trident Energy.
“Undeveloped acreage” . . . . . . . . . . . . . . Lease acreage on which wells have not been drilled or completedto a point that would permit the production of commercialquantities of natural gas and oil regardless of whether suchacreage contains discovered resources.
“WCTP” . . . . . . . . . . . . . . . . . . . . . . . . . West Cape Three Points.
7

Cautionary Statement Regarding Forward-Looking Statements
This annual report on Form 10-K contains estimates and forward-looking statements, principally in“Item 1. Business,” “Item 1A. Risk Factors” and “Item 7. Management’s Discussion and Analysis ofFinancial Condition and Results of Operations.” Our estimates and forward-looking statements are mainlybased on our current expectations and estimates of future events and trends, which affect or may affectour businesses and operations. Although we believe that these estimates and forward-looking statements arebased upon reasonable assumptions, they are subject to several risks and uncertainties and are made inlight of information currently available to us. Many important factors, in addition to the factors describedin our annual report on Form 10-K, may adversely affect our results as indicated in forward-lookingstatements. You should read this annual report on Form 10-K and the documents that we have filed asexhibits hereto completely and with the understanding that our actual future results may be materiallydifferent from what we expect. Our estimates and forward-looking statements may be influenced by thefollowing factors, among others:
• our ability to find, acquire or gain access to other discoveries and prospects and to successfullydevelop and produce from our current discoveries and prospects;
• uncertainties inherent in making estimates of our oil and natural gas data;
• the successful implementation of our and our block partners’ prospect discovery and developmentand drilling plans;
• projected and targeted capital expenditures and other costs, commitments and revenues;
• termination of or intervention in concessions, rights or authorizations granted to us by thegovernments of the countries in which we operate (or their respective national oil companies) or anyother federal, state or local governments or authorities;
• our dependence on our key management personnel and our ability to attract and retain qualifiedtechnical personnel;
• the ability to obtain financing and to comply with the terms under which such financing may beavailable;
• the volatility of oil, natural gas and NGL prices;
• the availability, cost, function and reliability of developing appropriate infrastructure around andtransportation to our discoveries and prospects;
• the availability and cost of drilling rigs, production equipment, supplies, personnel and oilfieldservices;
• other competitive pressures;
• potential liabilities inherent in oil and natural gas operations, including drilling and production risksand other operational and environmental risks and hazards;
• current and future government regulation of the oil and gas industry or regulation of the investmentin or ability to do business with certain countries or regimes;
• cost of compliance with laws and regulations;
• changes in environmental, health and safety or climate change or GHG laws and regulations or theimplementation, or interpretation, of those laws and regulations;
• adverse effects of sovereign boundary disputes in the jurisdictions in which we operate;
• environmental liabilities;
• geological, geophysical and other technical and operations problems including drilling and oil andgas production and processing;
• military operations, civil unrest, outbreaks of disease, terrorist acts, wars or embargoes;
• the cost and availability of adequate insurance coverage and whether such coverage is enough tosufficiently mitigate potential losses and whether our insurers comply with their obligations underour coverage agreements;
8

• our vulnerability to severe weather events, including tropical storms and hurricanes in the Gulf ofMexico;
• our ability to meet our obligations under the agreements governing our indebtedness;
• the availability and cost of financing and refinancing our indebtedness;
• the amount of collateral required to be posted from time to time in our hedging transactions, lettersof credit, performance bonds and other secured debt;
• the result of any legal proceedings, arbitrations, or investigations we may be subject to or involved in;
• our success in risk management activities, including the use of derivative financial instruments tohedge commodity and interest rate risks; and
• other risk factors discussed in the “Item 1A. Risk Factors” section of this annual report on Form 10-K.
The words “believe,” “may,” “will,” “aim,” “estimate,” “continue,” “anticipate,” “intend,” “expect,” “plan”and similar words are intended to identify estimates and forward-looking statements. Estimates andforward-looking statements speak only as of the date they were made, and, except to the extent required bylaw, we undertake no obligation to update or to review any estimate and/or forward-looking statementbecause of new information, future events or other factors. Estimates and forward-looking statements involverisks and uncertainties and are not guarantees of future performance. As a result of the risks anduncertainties described above, the estimates and forward-looking statements discussed in this annual reporton Form 10-K might not occur, and our future results and our performance may differ materially fromthose expressed in these forward-looking statements due to, including, but not limited to, the factorsmentioned above. Because of these uncertainties, you should not place undue reliance on theseforward-looking statements.
9

PART I
Item 1. Business
General
Kosmos is a full-cycle deepwater independent oil and gas exploration and production company focusedalong the Atlantic Margins. Our key assets include production offshore Ghana, Equatorial Guinea and U.S.Gulf of Mexico, as well as a world-class gas development offshore Mauritania and Senegal. We alsomaintain a sustainable exploration program balanced between proven basin infrastructure-led exploration(Equatorial Guinea and U.S. Gulf of Mexico), emerging basins (Mauritania, Senegal and Suriname) andfrontier basins (Cote d’Ivoire, Namibia, Sao Tome and Principe, and South Africa). Kosmos is listed onthe NYSE and LSE and is traded under the ticker symbol KOS.
Kosmos was founded in 2003 to find oil in under-explored or overlooked parts of West Africa. In itsrelatively brief history, the Company has successfully opened two new hydrocarbon basins through thediscovery of the Jubilee field offshore Ghana in 2007 and the Greater Tortue Ahmeyim field in 2015 (whichincludes the Ahmeyim and Guembeul-1 discovery wells offshore Mauritania and Senegal in 2015 and2016, respectively). Jubilee was one of the largest oil discoveries worldwide in 2007 and is considered one ofthe largest finds offshore West Africa discovered during that decade. First oil production was deliveredjust 42 months after initial discovery, a record for a deepwater development in West Africa in this water depth.The Ahmeyim discovery was one of the largest natural gas discoveries worldwide in 2015 and is believed tobe the largest ever gas discovery offshore West Africa.
Over the last two years, our business strategy has evolved to include production-enhancing infilldrilling and well work as well as infrastructure-led exploration. This strategic evolution was initially enabledby our acquisition of the Ceiba Field and Okume Complex assets offshore Equatorial Guinea inOctober 2017 together with access to surrounding exploration licenses, and bolstered by the September 2018acquisition of DGE, a deepwater company operating in the U.S. Gulf of Mexico, which further enhancedour production, exploitation and infrastructure-led exploration capabilities.
Our Business Strategy
As a full-cycle E&P company, our mission is to safely deliver production and free cash flow from aportfolio rich in opportunities through a disciplined allocation of capital and optimal portfolio managementfor the benefit of our shareholders and stakeholders.
Our business strategy is designed to accomplish this mission by focusing on three key objectives:(1) maximize the value of our producing assets; (2) progress our discovered resources toward projectsanction and into proved reserves, production, and cash flow through efficient appraisal and development;and (3) add new resources through an efficient low cost exploration program. We are focused on increasingproduction, cash flows and reserves from our producing assets in Equatorial Guinea, Ghana, and the U.S.Gulf of Mexico. In Mauritania and Senegal, we are progressing our Greater Tortue Ahmeyim developmentwith the objective of reaching first gas in 2022, as well as advancing our other discoveries towards a finalinvestment decision. In addition, our exploration portfolio consists of a large inventory of leads and prospectsalong the Atlantic Margins, both infrastructure-led and basin opening opportunities, which we plan tocontinue to mature for future drilling, providing us access to additional growth potential in the coming years.We do not plan on accessing new basin opening oil positions.
Grow cash flow, proved reserves and production through exploitation, development, infrastructure-ledexploration and basin opening exploration activities
In the near term, we plan to grow cash flow, proved reserves and production by further exploiting ourfields offshore Ghana, U.S. Gulf of Mexico, and Equatorial Guinea. In Ghana, we plan to continue drillingadditional development and production wells at both the Jubilee and TEN fields in 2020. In the U.S. Gulfof Mexico, we plan to continue development drilling on existing fields and drilling multiple infrastructure-ledexploration targets. In Equatorial Guinea, our activity set is expanding beyond production optimizationprojects, such as utilizing electrical submersible pumps, to include infrastructure-led exploration which, if
10
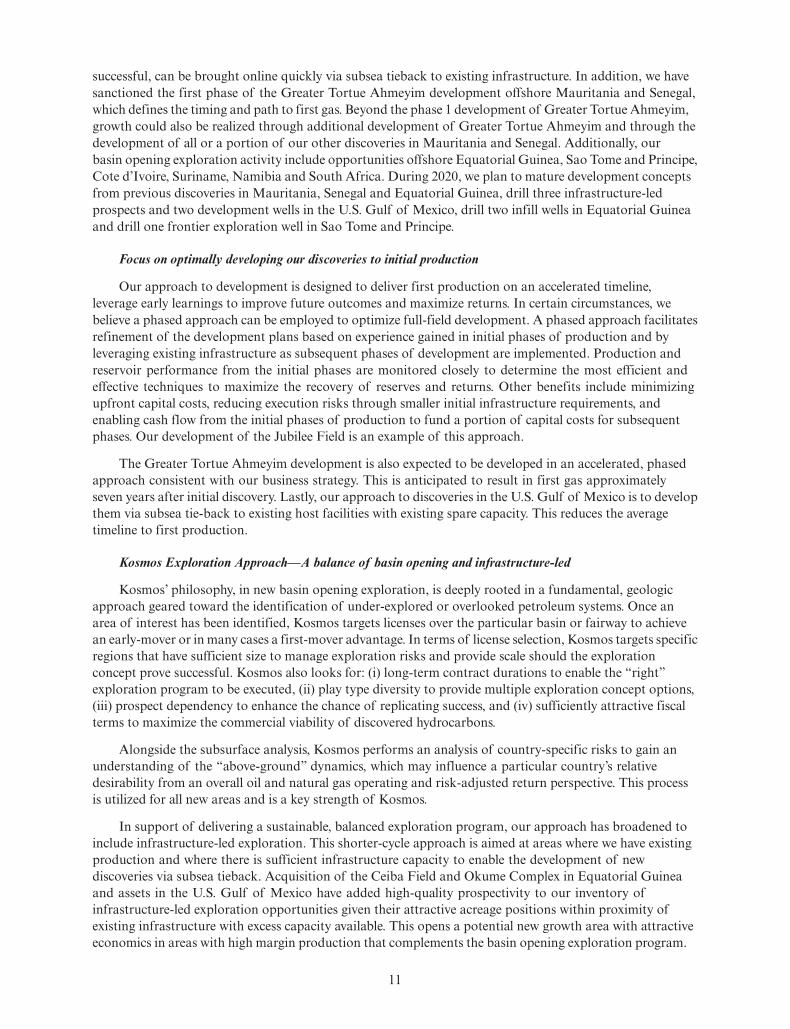
successful, can be brought online quickly via subsea tieback to existing infrastructure. In addition, we havesanctioned the first phase of the Greater Tortue Ahmeyim development offshore Mauritania and Senegal,which defines the timing and path to first gas. Beyond the phase 1 development of Greater Tortue Ahmeyim,growth could also be realized through additional development of Greater Tortue Ahmeyim and through thedevelopment of all or a portion of our other discoveries in Mauritania and Senegal. Additionally, ourbasin opening exploration activity include opportunities offshore Equatorial Guinea, Sao Tome and Principe,Cote d’Ivoire, Suriname, Namibia and South Africa. During 2020, we plan to mature development conceptsfrom previous discoveries in Mauritania, Senegal and Equatorial Guinea, drill three infrastructure-ledprospects and two development wells in the U.S. Gulf of Mexico, drill two infill wells in Equatorial Guineaand drill one frontier exploration well in Sao Tome and Principe.
Focus on optimally developing our discoveries to initial production
Our approach to development is designed to deliver first production on an accelerated timeline,leverage early learnings to improve future outcomes and maximize returns. In certain circumstances, webelieve a phased approach can be employed to optimize full-field development. A phased approach facilitatesrefinement of the development plans based on experience gained in initial phases of production and byleveraging existing infrastructure as subsequent phases of development are implemented. Production andreservoir performance from the initial phases are monitored closely to determine the most efficient andeffective techniques to maximize the recovery of reserves and returns. Other benefits include minimizingupfront capital costs, reducing execution risks through smaller initial infrastructure requirements, andenabling cash flow from the initial phases of production to fund a portion of capital costs for subsequentphases. Our development of the Jubilee Field is an example of this approach.
The Greater Tortue Ahmeyim development is also expected to be developed in an accelerated, phasedapproach consistent with our business strategy. This is anticipated to result in first gas approximatelyseven years after initial discovery. Lastly, our approach to discoveries in the U.S. Gulf of Mexico is to developthem via subsea tie-back to existing host facilities with existing spare capacity. This reduces the averagetimeline to first production.
Kosmos Exploration Approach—A balance of basin opening and infrastructure-led
Kosmos’ philosophy, in new basin opening exploration, is deeply rooted in a fundamental, geologicapproach geared toward the identification of under-explored or overlooked petroleum systems. Once anarea of interest has been identified, Kosmos targets licenses over the particular basin or fairway to achievean early-mover or in many cases a first-mover advantage. In terms of license selection, Kosmos targets specificregions that have sufficient size to manage exploration risks and provide scale should the explorationconcept prove successful. Kosmos also looks for: (i) long-term contract durations to enable the “right”exploration program to be executed, (ii) play type diversity to provide multiple exploration concept options,(iii) prospect dependency to enhance the chance of replicating success, and (iv) sufficiently attractive fiscalterms to maximize the commercial viability of discovered hydrocarbons.
Alongside the subsurface analysis, Kosmos performs an analysis of country-specific risks to gain anunderstanding of the “above-ground” dynamics, which may influence a particular country’s relativedesirability from an overall oil and natural gas operating and risk-adjusted return perspective. This processis utilized for all new areas and is a key strength of Kosmos.
In support of delivering a sustainable, balanced exploration program, our approach has broadened toinclude infrastructure-led exploration. This shorter-cycle approach is aimed at areas where we have existingproduction and where there is sufficient infrastructure capacity to enable the development of newdiscoveries via subsea tieback. Acquisition of the Ceiba Field and Okume Complex in Equatorial Guineaand assets in the U.S. Gulf of Mexico have added high-quality prospectivity to our inventory ofinfrastructure-led exploration opportunities given their attractive acreage positions within proximity ofexisting infrastructure with excess capacity available. This opens a potential new growth area with attractiveeconomics in areas with high margin production that complements the basin opening exploration program.
11
Build the right strategic partnerships with complementary capabilities
As a full-cycle E&P company, part of our strategy is to optimize our portfolio at appropriate times forour exploration and development projects. One way to accomplish this is to partner with high-quality industryplayers with world-class complementary capabilities. This strategy is designed to ensure the relative projectcan benefit from specific expertise provided by these partners, including exploration, development, productionand above-ground capabilities. We have proven we can execute this strategy by partnering with supermajors,including BP and Shell, across our exploration portfolio. In addition, bringing in the right strategicpartners early in our projects often comes with a financial carry on future expenditures, allowing us toreduce our costs and increase return on investment.
For example, the alliance formed in 2017 with a subsidiary of BP broadened our relationship to covernew venture opportunities in Mauritania, Senegal and The Gambia to create an Atlantic Margin explorer-developer partnership that leveraged Kosmos’ regional exploration knowledge and capability with BP’sdeepwater development expertise to execute a selective, basin opening exploration strategy in the AtlanticMargin.
Similarly, during the fourth quarter of 2018, Kosmos entered into an additional strategic explorationalliance with a subsidiary of Shell to jointly explore in Southern West Africa. The alliance initially focusedon Namibia where Kosmos had completed a farm-in to Shell’s acreage in PEL 39, and Kosmos’ Sao Tome &Principe acreage where Shell farmed into Blocks 6 and 11. In September 2019, Shell and Kosmos completeda farm-in agreement whereby Kosmos and Shell obtained interests in the Northern Cape Ultra Deepblock offshore the Republic of South Africa. As part of the alliance, the two companies are also jointlyevaluating opportunities in adjacent geographies. This alliance is consistent with Kosmos’ strategy ofpartnering with supermajors to leverage complementary skill sets.
During the first quarter of 2019, Kosmos farmed-into 18 BP-owned blocks in the Garden Banks areaof the deepwater U.S. Gulf of Mexico. In addition, Kosmos can earn an interest in three BP blocks in otherareas of the deepwater U.S. Gulf of Mexico. This should allow Kosmos to execute projects that can betied back to existing infrastructure. Kosmos is the designated operator.
Apply our entrepreneurial culture, which fosters innovation and creativity, to continue our successfulexploration and development program
Our employees are critical to the success of our business strategy, and we have created an environmentthat enables them to focus their knowledge, skills and experience on finding, developing and producing newfields and optimizing production from existing fields. Culturally, we have an open, team-oriented workenvironment that fosters entrepreneurial, creative and contrarian thinking. This approach enables us to fullyconsider and understand both risk and reward, as well as deliberately and collectively pursue ideas thatcreate and maximize value and free cash flow.
Secure a premium license to operate through industry-leading ESG performance
Kosmos recognizes that creating long-term shareholder returns can only be achieved by advancing thesocieties in which we work and operating in a manner that protects the environment. Kosmos focuses oncontinuously improving its ESG credentials by working with a range of stakeholders, including shareholders,partners, suppliers, host governments and civil society organizations.
The company looks upon the United Nations Sustainable Development Goals as a useful template forevaluating and understanding how our activities promote economic and social progress in host countries. In2013, we adopted the Kosmos Energy Business Principles to formalize our commitment to act as a forcefor good. Our Business Principles are supported by more detailed policies, procedures, and managementsystems. Each year, we report on our environmental, social, and governance practices and performance in ourSustainability Report and on our website.
Most recently, our ESG work has centered on evaluating the costs, benefits, risks, and opportunitiesthat climate change and the global energy transition may present to our business, and integrating them intoour business strategy. As part of this effort, we established governance structures to monitor and manageclimate-related risks and opportunities; developed a strategy to measure and reduce greenhouse gas emissions
12
from our own operations and mitigate remaining emissions through innovative nature-based solutions.Beginning in 2020, we plan to report on these issues in a manner aligned with the Task Force on Climate-relatedDisclosure (TCFD) and the Sustainability Accounting Standards Board (SASB) guidelines.
Maintain financial discipline
Execution of our strategy requires us to maintain a conservative financial approach with a strongbalance sheet, ample liquidity, a commitment to low leverage and the ability to maintain significantheadroom on our debt covenants. Typically, we fund exploration and development activities from acombination of operating cash flows, debt and partner carries.
As of December 31, 2019, our net leverage ratio was approximately 1.8 times as a result of utilizing ourfree cash flow generated in 2019 to reduce outstanding borrowings. Likewise, our liquidity increased toapproximately $0.8 billion.
Additionally, we use derivative instruments to partially limit our exposure to fluctuations in oil prices.We have an active commodity hedging program where we aim to hedge a portion of our anticipated salesvolumes on a two-to-three year rolling basis, with the goal to protect against the downside price scenario whilestill retaining partial exposure to the upside. As of December 31, 2019, we have hedged positions covering16.0 million barrels of oil production from 2020 through 2021. We also maintain insurance to partially protectagainst loss of production revenues from our producing assets.
During 2019, Kosmos generated approximately $628.2 million of cash flow from operating activities.
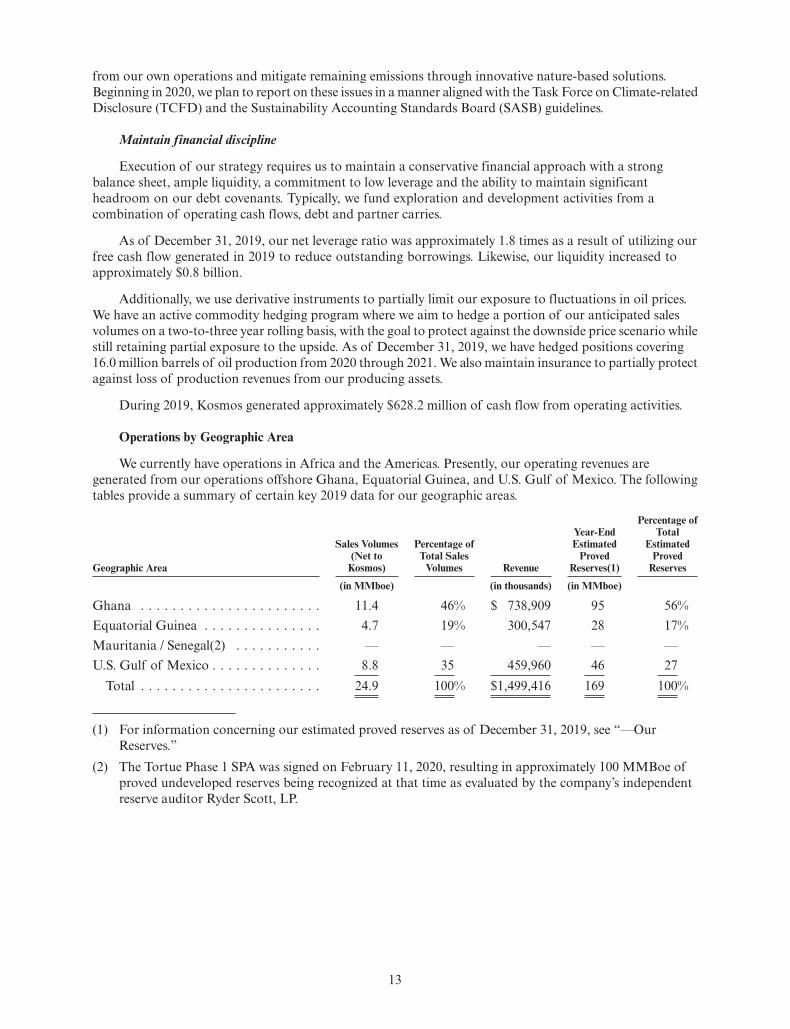
Operations by Geographic Area
We currently have operations in Africa and the Americas. Presently, our operating revenues aregenerated from our operations offshore Ghana, Equatorial Guinea, and U.S. Gulf of Mexico. The followingtables provide a summary of certain key 2019 data for our geographic areas.
Geographic Area
Sales Volumes(Net to
Kosmos)
Percentage ofTotal Sales
Volumes Revenue
Year-EndEstimated
ProvedReserves(1)
Percentage ofTotal
EstimatedProved
Reserves
(in MMboe) (in thousands) (in MMboe)
Ghana . . . . . . . . . . . . . . . . . . . . . . . 11.4 46% $ 738,909 95 56%Equatorial Guinea . . . . . . . . . . . . . . . 4.7 19% 300,547 28 17%Mauritania / Senegal(2) . . . . . . . . . . . — — — — —U.S. Gulf of Mexico . . . . . . . . . . . . . . 8.8 35 459,960 46 27
Total . . . . . . . . . . . . . . . . . . . . . . . 24.9 100% $1,499,416 169 100%
(1) For information concerning our estimated proved reserves as of December 31, 2019, see “—OurReserves.”
(2) The Tortue Phase 1 SPA was signed on February 11, 2020, resulting in approximately 100 MMBoe ofproved undeveloped reserves being recognized at that time as evaluated by the company’s independentreserve auditor Ryder Scott, LP.
13

Information about our deepwater fields is summarized in the following table.
Fields License
KosmosParticipating
Interest Operator StageLicense
Expiration
Ghana(1)Jubilee . . . . . . . . . . . . . . . . . . . . WCTP/DT(2) 24.1%(2) Tullow Production 2034TEN . . . . . . . . . . . . . . . . . . . . . DT 17.0%(4) Tullow Production 2036
U.S. Gulf of Mexico(1)Barataria . . . . . . . . . . . . . . . . . . MC 521 22.5% Kosmos Production (8)Big Bend . . . . . . . . . . . . . . . . . . MC 697 / 698 / 742 5.3% Fieldwood Production (8)Don Larsen . . . . . . . . . . . . . . . . . EB 598 20.0% Occidental Production (8)Gladden . . . . . . . . . . . . . . . . . . . MC 800 20.0% W&T Production (8)Kodiak . . . . . . . . . . . . . . . . . . . . MC 727 / 771 29.1% Kosmos Production (8)Marmalard . . . . . . . . . . . . . . . . . MC 255 / 300 11.4% Murphy Production (8)Nearly Headless Nick . . . . . . . . . . MC 387 21.9% Murphy Production (8)Danny Noonan . . . . . . . . . . . . . . EC 381 / GB 506 30.0% Talos Production (8)Odd Job . . . . . . . . . . . . . . . . . . . MC 214 / 215 Various(5) Kosmos Production (8)Sargent . . . . . . . . . . . . . . . . . . . GB 339 50.0% Kosmos Production (8)SOB II . . . . . . . . . . . . . . . . . . . . MC 431 11.4% Murphy Production (8)S. Santa Cruz . . . . . . . . . . . . . . . MC 563 40.5% Kosmos Production (8)Tornado . . . . . . . . . . . . . . . . . . . GC 281 35.0% Talos Production (8)
MauritaniaGreater Tortue Ahmeyim . . . . . . . . Block C8(3) 26.8% BP Development 2049(9)Marsouin . . . . . . . . . . . . . . . . . . Block C8 28.0%(6) BP Appraisal 2022Orca . . . . . . . . . . . . . . . . . . . . . Block C8 28.0%(6) BP Appraisal 2022
SenegalGreater Tortue Ahmeyim . . . . . . . . Saint Louis
Offshore Profond(3)26.7% BP Development 2044(10)
Teranga . . . . . . . . . . . . . . . . . . . Cayar OffshoreProfond
30.0%(7) BP Appraisal 2021
Yakaar . . . . . . . . . . . . . . . . . . . . Cayar OffshoreProfond
30.0%(7) BP Appraisal 2021
Equatorial Guinea(1)Ceiba Field and Okume Complex . . Block G 40.4% Trident Production 2034
(1) For information concerning our estimated proved reserves as of December 31, 2019, see “—Our Reserves.”
(2) The Jubilee Field straddles the boundary between the WCTP petroleum contract and the DT petroleumcontract offshore Ghana. To optimize resource recovery in this field, we entered into the Jubilee UUOA inJuly 2009 with the GNPC and the other block partners of each of these two blocks. The Jubilee UUOAgoverns the interests in and development of the Jubilee Field and created the Jubilee Unit from portions of theWCTP petroleum contract and the DT petroleum contract areas.
These interest percentages are subject to redetermination of the participating interests in the JubileeField pursuant to the terms of the Jubilee UUOA. Our current paying interest on development activitiesin the Jubilee Field is 26.9%.
(3) The Greater Tortue Ahmeyim Unit, which includes the Ahmeyim discovery in Mauritania Block C8 and theGuembeul discovery in the Senegal Saint Louis Offshore Profond Block, straddles the border betweenMauritania and Senegal. To optimize resource recovery in this field, we entered into the GTA UUOA inFebruary 2019 with the governments of Mauritania and Senegal. The GTA UUOA governs interests in anddevelopment of the Greater Tortue Ahmeyim Field and created the Greater Tortue Ahmeyim Unit fromportions of the Mauritania Block C8 and the Senegal Saint Louis Offshore Profond Block areas.
14

These interest percentages are subject to redetermination of the participating interests in the GreaterTortue Ahmeyim Field pursuant to the terms of the GTA UUOA. Our current payment interest ondevelopment activities in the Greater Tortue Ahmeyim Unit is 26.7%.
(4) Our paying interest on development activities in the TEN fields is 19%.(5) Our interests in blocks MC 214 and MC 215 are 61.1% and 54.9%, respectively.(6) SMHPM has the option to acquire up to an additional 4% participating interest in a commercial development
on Block C8. These interest percentages do not give effect to the exercise of such option.(7) PETROSEN has the option to acquire up to an additional 10% participating interest in a commercial
development on the Saint Louis Offshore Profond and Cayar Offshore Profond Blocks. The interest percentagedoes not give effect to the exercise of such option.
(8) Our U.S. Gulf of Mexico blocks are held by production/operations, and the lease periods extend as long asproduction/governmental approved operations continue on the relevant block.
(9) License expiration date can be extended by an additional ten years subject to certain conditions being met.(10) License expiration date can be extended by an additional twenty years subject to certain conditions being
met.
Exploration License and Lease Areas
CountryNumber of
Blocks
Kosmos AverageParticipating
Interest Operator(s)
Current PhaseLicense
Expiration Range
Cote d’Ivoire . . . . . . . . . . 5 45.0%(1) Kosmos 2020(9)Equatorial Guinea . . . . . . 4 50.0%(2) Kosmos 2020 - 2021(9)Mauritania . . . . . . . . . . . 4 28.0%(3) BP 2020 - 2022(9)Namibia . . . . . . . . . . . . . 1 45.0%(4) Shell 2022(9)Sao Tome and Principe . . . 6 39.0%(5) Kosmos, BP, Galp 2020 - 2022(9)Senegal . . . . . . . . . . . . . . 2 30.0%(6) BP 2021South Africa . . . . . . . . . . 1 45.0%(7) Shell 2021(9)Suriname . . . . . . . . . . . . . 2 41.5%(8) Kosmos 2020 - 2021(9)U.S. Gulf of Mexico . . . . . 79 53.0% Kosmos, Chevron, Murphy,
Talos, Fieldwood, Occidental,W&T Offshore
through 2029(10)
(1) PETROCI has the option to acquire up to an additional 2% paying interests in a commercialdevelopment. The interest percentage does not give effect to the exercise of such option.
(2) Should a commercial discovery be made, GEPetrol’s 20% carried interest will convert to a 20%participating interest for all development and production operations.
(3) Should a commercial discovery be made, SMHPM’s 10% carried interest is extinguished and SMHPMwill have an option to obtain a participating interest in the discovery area between 10% and 14%(blocks C8, C12 and C13) and 10% and 18% (Block C6). SMHPM will pay its portion of developmentand production costs in a commercial development on the blocks. The interest percentage does notgive effect to the exercise of such option.
(4) Should a commercial discovery be made, NAMCOR’s 10% carried interest during the explorationperiod may continue through first commercial production but must be reimbursed through production.
(5) ANP-STP’s carried interest may be converted to a full participating interest at any time. ANP-STP willreimburse any costs, expenses and any amount incurred on its behalf prior to the election. Formalwithdraw notice on STP Block 12 was communicated to partners on December 13, 2019 and was effectiveJanuary 31, 2020.
(6) PETROSEN has the option to obtain up to an additional 10% paying interest in a commercialdevelopment on the Saint Louis Offshore Profond and Cayar Offshore Profond Blocks. Theinterest percentage does not give effect to the exercise of such option.
15
(7) The Republic of South Africa has the option to obtain a percentage of the participating interest(“State Option”) in accordance with the provisions of the Applicable Laws prevailing at the time of thegranting of a Production Right governing State Option requirements.
(8) Should a commercial discovery be made, Staatsolie has the option to participate up to 10% in Block 42and up to 15% in Block 45 in each commercial discovery. Staatsolie will pay its portion of developmentand production costs in a commercial development in which it participates.
(9) License expiration date can be extended beyond the current exploration period upon completion ofrequired work program and subject to additional work obligations.
(10) Our U.S. Gulf of Mexico blocks can be held by continued operations, and the lease periods on blocksthat are held by continued operations extend as long as governmental approved operations continue onthe relevant block. This can extend the license expiration to a date later than 2029.
Ghana
The WCTP Block and DT Block are located within the Tano Basin, offshore Ghana. This basincontains a proven world-class petroleum system as evidenced by our discoveries. The following is a briefdiscussion of our discoveries on our license areas offshore Ghana.
Jubilee Field
The Jubilee Field was discovered by Kosmos in 2007, with first oil produced in November 2010.Appraisal activities confirmed that the Jubilee discovery straddled the WCTP and DT Blocks. Pursuant tothe terms of the Jubilee UUOA, the discovery area was unitized for purposes of joint development by theWCTP and DT Block partners.
The Jubilee Field is located approximately 60 kilometers offshore Ghana in water depths ofapproximately 1,000 to 1,800 meters, which led to the decision to implement an FPSO based development.The FPSO is designed to provide water and natural gas injection to support reservoir pressure, to process andstore oil and to export gas through a pipeline to the mainland. The Jubilee Field is being developed in aphased approach. The initial phase provided subsea infrastructure capacity for additional production andinjection wells to be drilled in future phases of development.
The GJFFDP was approved by the Government of Ghana in October 2017. This plan has beenoptimized to reduce overall capital expenditures to reflect the current oil price market. In November 2015,we signed the Jubilee Field Unit Expansion Agreement with our partners, which became effective uponapproval of the GJFFDP, to allow for the development of the Mahogany and Teak discoveries as part ofthe Jubilee Field Unit through the Jubilee FPSO and infrastructure, thus reducing their development cost.As a result of the approval of the GJFFDP by the Ministry of Energy in October 2017, operatorship for theMahogany and Teak discoveries transferred to Tullow. The WCTP partners transferred operatorship ofthe remaining portions of the WCTP Block, including the Akasa discovery, to Tullow effective February 1,2018.
The Government of Ghana completed the construction and connection of a gas pipeline in 2017 fromthe Jubilee Field to transport natural gas to the mainland for processing and sale. In the absence of continuousexport of large quantities of natural gas from the Jubilee Field, it is anticipated that we will need toreinject or flare such natural gas. Our inability to continuously export associated natural gas in large quantitiesfrom the Jubilee Field could impact our oil production.
In February 2016, the Jubilee Field operator identified an issue with the turret bearing of the FPSOKwame Nkrumah. Kosmos and its partners completed the lifting and locking of the main turret bearing,and the rotation of the vessel to its final heading in the second half of 2018. Permanent spread mooring ofthe vessel was completed in 2019. The final phase of the Turret Remediation Project, the installation andcommissioning of the catenary anchor leg mooring (“CALM”) Buoy, is expected to be completed aroundmid-year 2020. The financial impact of the additional expenditures associated with the damage to the turretbearing was mitigated through H&M insurance.
Oil production from the Jubilee Field averaged approximately 87,400 Bopd gross (20,000 Bopd net)during 2019.
16

TEN
The TEN fields are located in the western and central portions of the DT Block, approximately 48kilometers offshore Ghana in water depths of approximately 1,000 to 1,700 meters. The discoveries arebeing jointly developed with shared infrastructure and a single FPSO, with first oil produced in August 2016.
Similar to Jubilee, the TEN fields are being developed in a phased manner. The TEN PoD wasdesigned to include an expandable subsea system that would provide for multiple phases.
Oil production from TEN averaged approximately 61,100 Bopd gross (9,900 Bopd net) during 2019.
The construction and connection of a gas pipeline between the Jubilee and TEN fields to transportnatural gas to the mainland for processing and sale was completed in the first quarter of 2017. InDecember 2017, we signed the TAG GSA. Our inability to continuously export associated natural gas inlarge quantities from the TEN fields could impact our oil production.
U.S. Gulf of Mexico
In September 2018, as part of the DGE transaction, Kosmos acquired: (i) a portfolio of producingassets that Kosmos can continue to exploit, (ii) infrastructure-led exploration growth assets, and (iii) ahigh-quality inventory of exploration prospects across the East Breaks, Garden Banks, Green Canyon andMississippi Canyon areas. After the acquisition, we have expanded our inventory through the U.S. Gulf ofMexico Federal lease sales and farm-in transactions, including expansion into the Walker Ridge, De SotoCanyon and Keathley Canyon areas of the U.S. Gulf of Mexico. Our U.S. Gulf of Mexico assets averagedapproximately 24,100 Boepd (net) (~ 82% oil) from 13 fields during 2019.
The following is a brief discussion of our key producing fields in the U.S. Gulf of Mexico.
Odd Job
The Odd Job field is producing through the Delta House FPS, operated by Murphy. The technical teaminitially identified the Middle Miocene sands at the Odd Job prospect, and these sands are currently producing.The Odd Job 214 #2 well, the third well in the Odd Job field, was drilled in 2018, and came online in thefourth quarter of 2019. Net production during 2019 averaged approximately 7,200 Boepd.
Tornado
The Tornado field is producing from three Pliocene wells through the Helix Producer I, a ship-shaped,dynamically-positioned production platform in the deepwater U.S. Gulf of Mexico, which is operated byTalos Energy. A water injection well is expected to be drilled in 2020 to help enhance overall recoveries in theTornado field. Net production during 2019 averaged approximately 6,000 Boepd.
Marmalard
The Marmalard field produces from four wells, each completed in Middle Miocene sands. These wellsare flowing through the Delta House FPS, operated by Murphy. Net production during 2019 averagedapproximately 2,800 Boepd.
Kodiak
The Kodiak field is producing from one well, which is completed in the Middle Miocene sands. Thiswell is flowing through the Devils Tower Spar platform, which is operated by ENI. A second developmentwell is anticipated to be drilled and completed during 2020. Net production during 2019 averagedapproximately 3,400 Boepd.
South Santa Cruz / Barataria
The South Santa Cruz field is producing from one well in a Late Miocene sand. The Barataria field isalso producing from one well in a Late Miocene sand. Both fields produce through the Blind Faith tension-leg
17
platform, which is operated by Chevron. Net production from these two wells during 2019 averagedapproximately 2,400 Boepd.
Mauritania
The C6, C8, C12, and C13 blocks are located on the western margin of the Mauritania Salt Basinoffshore Mauritania and range in water depths from 100 to 3,000 meters. These blocks are located in aproven petroleum system, with our primary targets being Cretaceous sands in structural and stratigraphictraps.
These blocks cover an aggregate area of approximately 4.9 million acres (gross). We have acquiredapproximately 6,200 line-kilometers of 2D seismic data and 21,700 square kilometers of 3D seismic datacovering portions of our blocks in Mauritania. Based on these 2D and 3D seismic programs, we have drilledthree successful exploration wells and an appraisal well and have identified additional prospects in ourblocks. We continue to integrate the results of our drilling program in Mauritania.
In the second quarter of 2019, we withdrew from Block C18 offshore Mauritania.
Senegal
The Senegal Blocks are located in the Senegal River Cretaceous petroleum system and range in waterdepth from 300 to 3,100 meters. The area is an extension of the working petroleum system in the MauritaniaSalt Basin. We acquired approximately 7,500 square kilometers of 3D seismic data over the central andeastern portions of the Senegal Blocks in January 2015. In February 2016, we completed a 4,600 squarekilometer survey over the western portions of the Senegal Blocks to fully evaluate the prospectivity. We havedrilled three successful exploration wells and two appraisal wells.
The following is a brief discussion of our discoveries to date offshore Mauritania and Senegal.
Greater Tortue Ahmeyim Development
The Greater Tortue Ahmeyim discoveries are significant, play-opening gas discoveries for the outboardCretaceous petroleum system and are located approximately 120 kilometers offshore Mauritania and Senegal.The Greater Tortue Ahmeyim development straddles Block C8 offshore Mauritania and Saint LouisOffshore Profond Block offshore Senegal.
We have drilled four wells within the Greater Tortue Ahmeyim development, Tortue-1, Guembeul-1,Ahmeyim-2 and Greater Tortue Ahmeyim-1 (GTA-1). The wells penetrated multiple excellent quality gasreservoirs, including the Lower Cenomanian, Upper Cenomanian and underlying Albian. The wellssuccessfully delineated the Ahmeyim and Guembeul gas discoveries and demonstrated reservoir continuity,as well as static pressure communication between the three wells drilled within the Lower Cenomanianreservoir. The discovery ranges in water depths from approximately 2,700 meters to 2,800 meters, with totaldepths drilled ranging from approximately 5,100 meters to 5,250 meters.
The Tortue-1 discovery well, located in Block C8 offshore Mauritania, intersected approximately 117meters of net hydrocarbon pay. A single gas pool was encountered in the Lower Cenomanian objective,which is comprised of three reservoirs totaling 88 meters in thickness over a gross hydrocarbon interval of160 meters. A fourth reservoir totaling 19 meters was penetrated within the Upper Cenomanian target overa gross hydrocarbon interval of 150 meters. The exploration well also intersected an additional 10 meters ofnet hydrocarbon pay in the lower Albian section, which is interpreted to be gas.
The Guembeul-1 discovery well, located in the northern part of the Saint Louis Offshore Profond areain Senegal, is located approximately five kilometers south of the Tortue-1 exploration well in Mauritania.The well encountered 101 meters of net gas pay in two excellent quality reservoirs, including 56 meters in theLower Cenomanian and 45 meters in the underlying Albian, with no water encountered.
The Ahmeyim-2 appraisal well is located in Block C8 offshore Mauritania, approximately five kilometersnorthwest, and 200 meters down-dip of the basin-opening Tortue-1 discovery. The well confirmed significant
18

thickening of the gross reservoir sequences down-dip. The Ahmeyim-2 well encountered 78 meters of netgas pay in two excellent quality reservoirs, including 46 meters in the Lower Cenomanian and 32 meters inthe underlying Albian.
The Greater Tortue Ahmeyim-1 (GTA-1) appraisal well was drilled on the eastern anticline within theunit development area of Greater Tortue Ahmeyim field. The GTA-1 well encountered approximately 30meters of net gas pay in high quality Albian reservoir. The well was drilled in approximately 2,500 meters ofwater, approximately 10 kilometers inboard of the Guembeul-1A and Tortue-1 wells, to a total depth of4,884 meters.
In August 2017, we completed a DST on the Tortue-1 well, demonstrating that the Tortue field is aworld-class resource and confirming key development parameters including well deliverability, reservoirconnectivity, and fluid composition. The Tortue-1 well flowed at a sustained, equipment-constrained rate ofapproximately 60 MMcfd during the main extended flow period, with minimal pressure drawdown,providing confidence in well designs that are each capable of producing approximately 200 MMcfd. TheDST results confirmed a connected volume per well consistent with the current development scheme, whichtogether with the high well rate is expected to result in a low number of development wells compared toequivalent schemes. Initial analysis of fluid samples collected during the test indicate Tortue gas is well suitedfor liquefaction given low levels of liquids and minimal impurities. Data acquired from the DST was usedto further optimize field development and to refine process design parameters critical to the FEED process.
In December 2018, the partners agreed on a final investment decision for Phase 1 of the Greater TortueAhmeyim project. The Greater Tortue Ahmeyim project is designed to produce gas from a deepwater subseasystem to a mid-water FPSO and then to a FLNG facility at a nearshore hub located on the Mauritaniaand Senegal maritime border. The FLNG facility for Phase 1 is designed to produce approximately 2.5 milliontons per annum on average. The project will provide LNG for global export, as well as make gas availablefor domestic use in both Mauritania and Senegal. First gas for the project is expected in the first half of 2022.Following a competitive tender process involving all partners and subject to final documentation, BP GasMarketing has been selected as the buyer for the LNG offtake for Greater Tortue Ahmeyim Phase 1.Additionally, in February 2020 the Tortue Phase 1 SPA was executed.
Other Mauritania and Senegal Discoveries
BirAllah and Orca Discoveries
The BirAllah discovery (formally known as Marsouin), located in Block C8 offshore Mauritania, is asignificant, play-extending gas discovery, building on our successful exploration program in the outboardCretaceous petroleum system offshore Mauritania. The Marsouin-1 well is located approximately 60kilometers north of the Ahmeyim discovery and was drilled to a total depth of 5,150 meters in nearly 2,400meters of water. Based on analysis of drilling results and logging data, Marsouin-1 encountered at least70 meters of net gas pay in Upper and Lower Cenomanian intervals comprised of excellent quality reservoirsands.
The Orca-1 well, located in Block C8 offshore Mauritania, was drilled in October 2019 and delivered amajor gas discovery. The Orca-1 well, which targeted a previously untested Albian play, encountered 36meters of net gas pay in excellent quality reservoirs. In addition, the well extended the Cenomanian playfairway by confirming 11 meters of net gas pay in a down-structure position relative to the original Marsouin-1discovery well. The location of the Orca-1 well proved both the structural and stratigraphic components ofthe trap are working, thereby proving a significant volume. The Orca-1 well was drilled in approximately 2,510meters of water to a total measured depth of around 5,266 meters.
In total, we believe that Orca-1 and Marsouin-1 have de-risked more than sufficient resource tosupport a world-scale LNG project from the Cenomanian and Albian plays in the BirAllah area.
Yakaar and Teranga Discoveries
The Teranga discovery is located in the Cayar Offshore Profond block approximately 65 kilometersnorthwest of Dakar and was our second exploration well offshore Senegal. The Teranga-1 discovery well is
19

located in nearly 1,800 meters of water and was drilled to a total depth of approximately 4,850 meters. Thewell encountered 31 meters of net gas pay in good quality reservoir in the Lower Cenomanian objective. Wellresults confirm that a prolific inboard gas fairway extends approximately 200 kilometers south from theMarsouin-1 well in Mauritania through the Greater Tortue Ahmeyim area on the maritime boundary to theTeranga-1 well in Senegal.
The Yakaar discovery is located in the Cayar Offshore Profond block offshore Senegal, approximately95 kilometers northwest of Dakar in approximately 2,600 meters of water. The Yakaar-1 discovery well wasdrilled to a total depth of approximately 4,900 meters. The well intersected a gross hydrocarbon column of120 meters in three pools within the primary Lower Cenomanian objective and encountered 45 meters of netpay. In September 2019, we completed the Yakaar-2 appraisal well, which encountered approximately 30meters of net gas pay. The Yakaar-2 well was drilled approximately nine kilometers from the Yakaar-1exploration well and further delineated the southern extension of the field.
The results of the Yakaar-2 well underpin our view that the Yakaar-Teranga resource base is world-scaleand has the potential to support an LNG project that provides significant volumes of natural gas to bothdomestic and export markets. Development of Yakaar-Teranga is being considered in a phased approach withPhase 1 providing domestic gas and data to optimize the development of future phases. It could alsosupport the country’s “Plan Emergent Senegal” launched by the President of Senegal in 2014.
Equatorial Guinea
In October 2017, we entered into petroleum contracts covering Blocks EG-21, S, and W with theRepublic of Equatorial Guinea. The petroleum contracts cover approximately 6,000 square kilometers, witha first exploration period expiring in March 2023. The first exploration period consists of two sub-periodsof three and two years, respectively. The first exploration sub-period work program included an approximately6,000 square kilometer 3D seismic acquisition requirement across the blocks, which was completed inNovember 2018.
In June 2018, we closed a farm-in agreement with a subsidiary of Ophir for Block EG-24, offshoreEquatorial Guinea, whereby we acquired a 40% non-operated participating interest. The petroleum contractcovers approximately 3,500 square kilometers, with a first exploration period of three years from theeffective date (March 2018), which can be extended up to four additional years at our election subject tofulfilling specific work obligations. The first exploration period work program includes a 3,000 squarekilometer 3D seismic acquisition requirement, which was completed in November 2018. In the first quarterof 2019, we acquired Ophir’s remaining interest in and operatorship of the block, which results in Kosmosowning an 80% interest in Block EG-24. Should a commercial discovery be made, GEPetrol’s 20% carriedinterest will convert to a 20% participating interest for all development and production operations.
In November 2018, we completed a 3D seismic survey of approximately 9,500 square kilometers overblocks EG-21, EG-24, S and W offshore Equatorial Guinea, and approximately 200 square kilometers overBlock G. The seismic data is being interpreted with the objective of high grading prospects for futuredrilling as early as 2021.
Ceiba Field and Okume Complex
In the fourth quarter of 2017, through a joint venture with an affiliate of Trident, we acquired all ofthe equity interest of Hess International Petroleum Inc., a subsidiary of Hess, which held an 85% payinginterest (80.75% revenue interest) in the Ceiba Field and Okume Complex assets. Under the terms of theagreement, Kosmos and Trident each owned 50% of Hess International Petroleum Inc. Hess InternationalPetroleum Inc. was subsequently renamed KTIPI. Kosmos is primarily responsible for exploration andsubsurface evaluation while Trident is primarily responsible for production operations and optimization.The transaction expands our position in the Gulf of Guinea and provides immediate cash flow throughexisting production with potential to increase existing production through exploration opportunities withpotential low cost tie-backs through the existing infrastructure. The gross acquisition price was $650 millioneffective as of January 1, 2017. After post closing entries Kosmos paid net cash of approximately$231 million. The transaction was accounted for as an equity method investment.
20

Effective as of January 1, 2019, our outstanding shares in KTIPI were transferred to Trident inexchange for a 40.4% undivided participating interest in the Ceiba Field and Okume Complex. As a result,our interest in the Ceiba Field and Okume Complex is accounted for under the proportionate consolidationmethod of accounting going forward. Oil production from the Ceiba Field and Okume Complex averagedapproximately 38,300 Bopd gross (12,100 Bopd net) of oil per day during 2019.
In May 2018, we signed a farm-out agreement with a subsidiary of Trident covering blocks S, W andEG-21 offshore Equatorial Guinea, and completed the farm-out agreement in August of 2018. Under theterms of the agreement, Trident acquired a 40% non-operated participating interest in the blocks and Kosmosremains the operator.
Asam Discovery
In October 2019, the S-5 exploration well was drilled to a total depth of 4,400 meters offshore EquatorialGuinea, encountering 39 meters of net oil pay in good-quality Santonian reservoir. The well is located withintieback range of the Ceiba FPSO and work is currently ongoing to establish the scale of the discoveredresource and evaluate the optimum development solution.
Suriname
We are the operator for petroleum contracts covering Block 42 and Block 45 offshore Suriname, whichare located within the Guyana Suriname Basin, along the Atlantic transform margin of northern SouthAmerica. Suriname lies between Guyana to the west and French Guyana to the east. The Suriname basin isanalogous to the working petroleum systems of the West African transform margin. The emergingpetroleum system in Suriname has been proven by the presence of onshore producing fields and mostrecently by the nearby Maka Central-1 discovery offshore Suriname Block 58, as well as the discoveriesoffshore Guyana, including the Liza-1 well.
Suriname Block 42 and Block 45 are positioned centrally in the Suriname-Guyana Basin, and locatedto the east of the play opening Liza-1 oil discovery. Likewise, the blocks are also positioned to the northeastof the Maka Central-1 discovery offshore Suriname. Of note are the stratigraphically trapped UpperCretaceous plays similar to the discoveries in Guyana (Liza-1) and Suriname (Maka Central-1), and acarbonate reef play analagous to the Ranger-1 discovery in Guyana. These plays are located in the samegeologic basin providing positive points of calibration for the prospectivity in Suriname Block 42.
The Tambaredjo and Calcutta Fields onshore Suriname, as well as the Liza-1 well discovery offshoreGuyana, demonstrate that a working petroleum system exists, and geological and geochemical studies suggestthe hydrocarbons in these fields were generated from source rocks located in the offshore basin. The sourcerocks are believed to be analogous in age to those which have charged numerous fields in offshore West Africa.
In June 2018, the Anapai-1A exploration well was drilled in Block 45 to a total depth of approximately4,600 meters and was fully tested, encountering high quality reservoirs in the targeted zones, but did not findhydrocarbons. The well has been plugged and abandoned.
In July 2018, we entered into the second exploration phase in Blocks 42 and 45, which now expires inSeptember 2021. The second phase carried a one well commitment per block that has been met for bothblocks with the Anapai-1A and Pontoenoe-1 exploration wells.
In October 2018, the Pontoenoe-1 exploration well was drilled in Block 42 to a total depth ofapproximately 6,200 meters and was fully tested but did not discover commercial hydrocarbons. High-qualityreservoir was encountered, but the primary exploration objective proved to be water bearing. The well hasbeen plugged and abandoned.
Recent well results are being integrated into the ongoing evaluation of the remaining prospectivity inour Suriname acreage position, with the objective of high-grading a prospect for drilling in 2021.
Sao Tome and Principe
We are operator for petroleum contracts covering Blocks 5 and 11 and maintain a non-operatedposition in Blocks 6, 10 and 13 offshore Sao Tome and Principe in the Gulf of Guinea. Galp, a wholly-owned
21

subsidiary of Petrogal, S.A., is the operator of Block 6. BP is the operator of Blocks 10 and 13. Theseblocks cover an area of approximately 8.5 million acres (gross) in water depths ranging from 2,250 to 3,000meters and provide an opportunity to pursue the same core Cretaceous theme that was successful for us inGhana.
Our blocks are adjacent to, and represent an extension of, a proven and prolific petroleum systemoffshore Equatorial Guinea and northern Gabon comprising Early Cretaceous post-rift source rocks andLate Cretaceous reservoirs. Kosmos has established an extensive position in the Rio Muni Basin where thereis a proven source and reservoir inboard with the Ceiba and Okume discoveries in Equatorial Guinea,which appears to extend outboard into the deepwater in Sao Tome and Principe, where there are oil seepson both islands. Kosmos has identified large potential structural and stratigraphic traps on early seismic,which is currently being processed.
We believe that the southern extent of the West African transform margin in Sao Tome and Principecomprises a series of basins formed during the separation of Africa from South America, providing thenecessary conditions for the generation, migration and entrapment of hydrocarbons. Large deep-water slopechannels and basin floor fans draping over and around anticlinal highs adjacent to fracture zones constitutethe main play in the acreage.
In August 2017, we completed a 3D seismic survey of approximately 15,800 square kilometers offshoreSao Tome and Principe. Processing has been completed. We are compiling an inventory of prospects on thelicense areas in Sao Tome and Principe and will continue to refine and assess the prospectivity, integratingthis new 3D seismic data into our geological evaluation. We plan to drill an exploration well in Block 6offshore Sao Tome and Principe in late 2020.
In the fourth quarter of 2019, formal withdrawal notice from Block 12 offshore Sao Tome and Principewas communicated to partners with an effective date of January 31, 2020.
Cote d’Ivoire
In December 2017, as part of our Alliance with BP, we entered into petroleum contracts as operatorfor five Offshore Blocks, CI-526, CI-602, CI-603, CI-707 and CI-708, which are located approximately 150kilometers west of our TEN discoveries in Ghana in water depth from 450 to 4,500 meters. We believe the areahas multiple Cretaceous source rocks with Cenomanian through Maastrichtian reservoir sands providingthe potential for exploration targets. We are compiling an inventory of prospects on the license areas in Coted’Ivoire and will continue to refine and assess the prospectivity, integrating the 3D seismic data acquired inMay 2018 into our geological evaluation. Following evaluation, a decision will be made on future explorationplans prior to the expiry of the current exploration phase in December 2020.
Namibia
In September 2018, we acquired a 45% non-operated participating interest in PEL 39 offshore Namibia,which later became part of a larger strategic alliance with Shell to jointly explore in Southern West Africa.The block covers an area of approximately 3.1 million acres in water depth ranging from 250 to 3,000 meters.The blocks provide for multiple plays targeting Cretaceous deepwater systems with reservoir sands sourcedfrom the Orange River. In January 2019, we completed a 3D seismic survey covering approximately 7,400square kilometers. Processing of this data is complete. We are compiling an inventory of prospects on thelicense and continue to refine and assess the prospectivity and petroleum systems analysis while integratingthe new 3D seismic data in our geological evaluation with a view to drilling in early 2021.
Republic of South Africa
In September 2019, we completed a farm-in agreement with OK Energy to acquire a 45% non-operatedinterest in the Northern Cape Ultra Deep block offshore the Republic of South Africa. Shell owns 45% ofthe block and is the operator and OK Energy retained 10%. The petroleum contract covers approximately6,930 square kilometers at water depths ranging from 2,500 to 3,100 meters and has an initial explorationphase of two years. We believe this block contains Cretaceous deepwater sand systems and the same Aptian
22
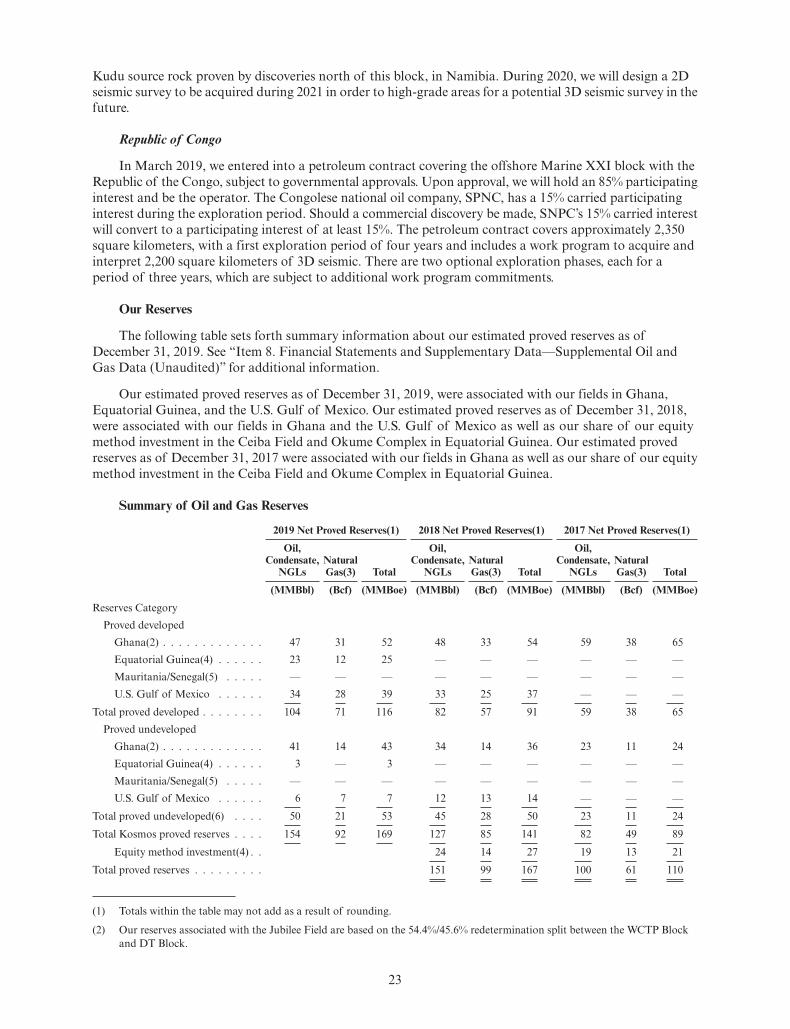
Kudu source rock proven by discoveries north of this block, in Namibia. During 2020, we will design a 2Dseismic survey to be acquired during 2021 in order to high-grade areas for a potential 3D seismic survey in thefuture.
Republic of Congo
In March 2019, we entered into a petroleum contract covering the offshore Marine XXI block with theRepublic of the Congo, subject to governmental approvals. Upon approval, we will hold an 85% participatinginterest and be the operator. The Congolese national oil company, SPNC, has a 15% carried participatinginterest during the exploration period. Should a commercial discovery be made, SNPC’s 15% carried interestwill convert to a participating interest of at least 15%. The petroleum contract covers approximately 2,350square kilometers, with a first exploration period of four years and includes a work program to acquire andinterpret 2,200 square kilometers of 3D seismic. There are two optional exploration phases, each for aperiod of three years, which are subject to additional work program commitments.
Our Reserves
The following table sets forth summary information about our estimated proved reserves as ofDecember 31, 2019. See “Item 8. Financial Statements and Supplementary Data—Supplemental Oil andGas Data (Unaudited)” for additional information.
Our estimated proved reserves as of December 31, 2019, were associated with our fields in Ghana,Equatorial Guinea, and the U.S. Gulf of Mexico. Our estimated proved reserves as of December 31, 2018,were associated with our fields in Ghana and the U.S. Gulf of Mexico as well as our share of our equitymethod investment in the Ceiba Field and Okume Complex in Equatorial Guinea. Our estimated provedreserves as of December 31, 2017 were associated with our fields in Ghana as well as our share of our equitymethod investment in the Ceiba Field and Okume Complex in Equatorial Guinea.
Summary of Oil and Gas Reserves
2019 Net Proved Reserves(1) 2018 Net Proved Reserves(1) 2017 Net Proved Reserves(1)
Oil,Condensate,
NGLsNaturalGas(3) Total
Oil,Condensate,
NGLsNaturalGas(3) Total
Oil,Condensate,
NGLsNaturalGas(3) Total
(MMBbl) (Bcf) (MMBoe) (MMBbl) (Bcf) (MMBoe) (MMBbl) (Bcf) (MMBoe)
Reserves CategoryProved developed
Ghana(2) . . . . . . . . . . . . . 47 31 52 48 33 54 59 38 65Equatorial Guinea(4) . . . . . . 23 12 25 — — — — — —Mauritania/Senegal(5) . . . . . — — — — — — — — —U.S. Gulf of Mexico . . . . . . 34 28 39 33 25 37 — — —
Total proved developed . . . . . . . . 104 71 116 82 57 91 59 38 65Proved undeveloped
Ghana(2) . . . . . . . . . . . . . 41 14 43 34 14 36 23 11 24Equatorial Guinea(4) . . . . . . 3 — 3 — — — — — —Mauritania/Senegal(5) . . . . . — — — — — — — — —U.S. Gulf of Mexico . . . . . . 6 7 7 12 13 14 — — —
Total proved undeveloped(6) . . . . 50 21 53 45 28 50 23 11 24Total Kosmos proved reserves . . . . 154 92 169 127 85 141 82 49 89
Equity method investment(4) . . 24 14 27 19 13 21Total proved reserves . . . . . . . . . 151 99 167 100 61 110
(1) Totals within the table may not add as a result of rounding.
(2) Our reserves associated with the Jubilee Field are based on the 54.4%/45.6% redetermination split between the WCTP Blockand DT Block.
23

(3) These reserves include the estimated quantities of fuel gas required to operate the Jubilee and TEN FPSOs during normalfield operations and the associated gas forecasted to be exported from TEN. This volume of associated gas is included as ofDecember 31, 2017 as a result of the finalization of the TAG GSA. If and when a subsequent gas sales agreement is executedfor Jubilee, a portion of the remaining Jubilee gas may be recognized as reserves. If and when a gas sales agreement and therelated infrastructure are in place for the TEN fields non-associated gas, a portion of the remaining gas may be recognized asreserves.
(4) We disclosed our share of reserves that were accounted for by the equity method. Effective of January 1, 2019, our outstandingshares in KTIPI were transferred to Trident in exchange for a 40.4% undivided participating interest in the Ceiba Field andOkume Complex. As a result, our interest in the Ceiba Field and Okume Complex is accounted for under the proportionateconsolidation method of accounting going forward.
(5) The Tortue Phase 1 SPA was signed on February 11, 2020, resulting in approximately 100 MMBoe of proved undevelopedreserves being recognized at that time as evaluated by the company’s independent reserve auditor Ryder Scott, LP.
(6) All of our proved undeveloped reserves are expected to be developed within six years or less. Proved undeveloped reservesexpected to be developed beyond five years are related to long-term projects which will be completed under a continuous drillingprogram.
Changes at Jubilee include a positive revision of 8.2 MMBbl related to positive drilling results andincreased original oil in place, and optimized development plan, partially offset by net Jubilee production of7.6 MMBbl. Changes at TEN include an increase of 8.8 MMBoe related to original oil in place adjustmentsbased on updated static modeling and development plan updates, partially offset by net TEN production of3.8 MMBoe. Changes at Equatorial Guinea include an increase of 6.3 MMBbl due to productionoptimization plans and plans for new drilling, which was offset by 4.7 MMBbl of net production. Changesat the U.S. Gulf of Mexico include an increase of 2.9 MMBoe related to strong performance of certain fieldsand the Gladden Deep discovery, offset by net U.S. Gulf of Mexico production of 8.8 MMBoe.
During the year ended December 31, 2019, we had an addition of 16.1 MMBoe of proved undevelopedreserves as a result of several factors, including updated original oil in place due to positive drilling resultsand improved static models in Jubilee and TEN, plans for one new well to be drilled in TEN and three newwells to be drilled in the Okume Complex.
We converted a total of 13.7 MMBoe of proved undeveloped reserves to proved developed due tocompletions of three new wells in Jubilee, two new wells in TEN, and three new wells in the U.S. Gulf ofMexico with a combined cost of $176.7 million. We spent $41.6 million to convert 4.0 MMBbl of provedundeveloped reserves in Jubilee and $12.8 million to convert 2.5 MMBoe proved undeveloped reserves inTEN; and $122.3 million spent to convert 7.2 MMBoe of proved undeveloped reserves in the U.S. Gulf ofMexico.
Changes for the year ended December 31, 2018, include an addition of 51.1 MMBoe as a result of theacquisition of DGE. Changes at Greater Jubilee include a revision of 9.4 MMBbl related to strong fieldperformance, positive drilling results and increased original oil in place, partially offset by 6.4 MMBbl of netJubilee production during 2018. Changes at TEN include a positive revision of 4.2 MMBbl due to originaloil in place adjustments, new drilling and development plan updates, and a negative revision of 3.1 MMBbldue to recovery factor adjustment from dynamic modeling, which in total were offset by 3.7 MMBoe ofnet production. Changes at Equatorial Guinea include an increase of 11.0 MMBbl, which comprises0.7 MMBbl of revision due to economic modeling, 3.9 MMBbl of revision due to strong field performanceat both Ceiba and Okume Complex, and 6.4 MMBbl of revision due to reservoir management strategies(re-opening shut-in wells, stimulations, surface/subsurface equipment installation), all of which was partiallyoffset by 5.4 MMBbl of net production. During the year ended December 31, 2018, we had an addition of13.9 MMBoe of proved undeveloped reserves as a result of the DGE acquisition. We converted 2.0 MMBblof proved undeveloped reserves to proved developed reserves in TEN incurring $9.7 million drilling a newwell. We added 12.9 MMBbl of proved undeveloped reserves in Jubilee as a result of several factors, includingadditional data from drilling two new wells, increased oil-in-place due to improved static model utilizingnew seismic and petrophysics data, and upgrading volumes associated with the Mahogany area that is nowpart of the Greater Jubilee Unit. We incurred $27.2 million in drilling the two Jubilee wells, however, we notethat we did not have a net migration of proved undeveloped reserves to proved developed reserves due tonegative revisions in Jubilee proved developed reserves, which more than offset the effects of drilling two wellsduring the year.
24
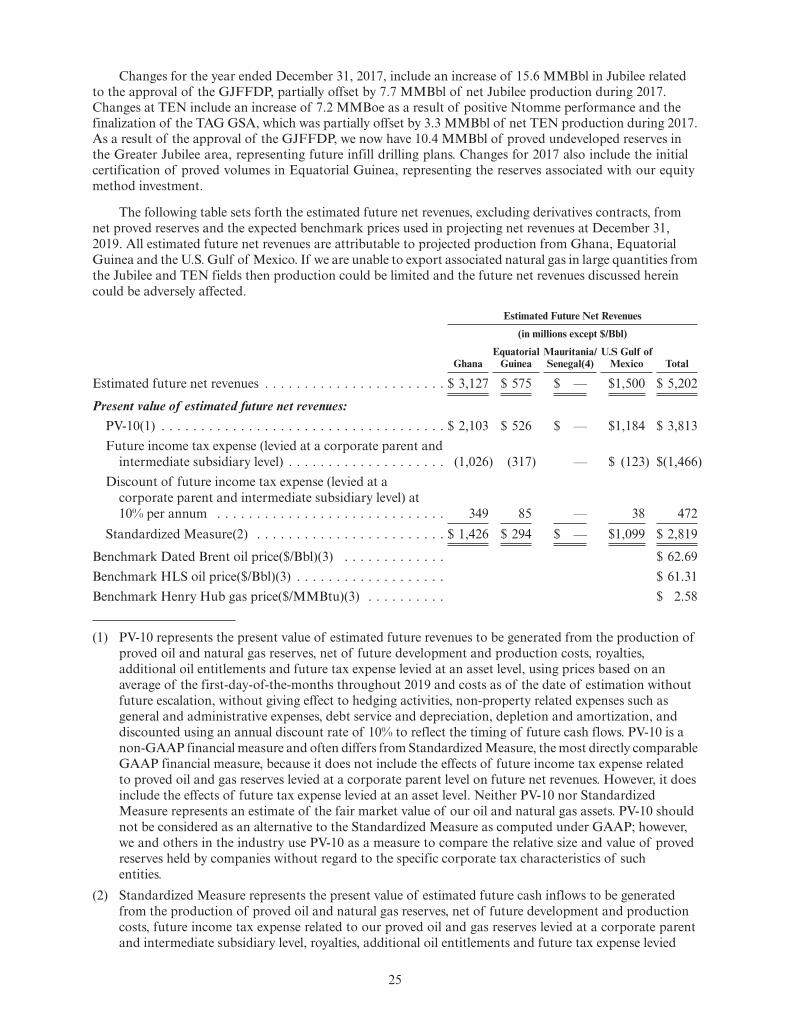
Changes for the year ended December 31, 2017, include an increase of 15.6 MMBbl in Jubilee relatedto the approval of the GJFFDP, partially offset by 7.7 MMBbl of net Jubilee production during 2017.Changes at TEN include an increase of 7.2 MMBoe as a result of positive Ntomme performance and thefinalization of the TAG GSA, which was partially offset by 3.3 MMBbl of net TEN production during 2017.As a result of the approval of the GJFFDP, we now have 10.4 MMBbl of proved undeveloped reserves inthe Greater Jubilee area, representing future infill drilling plans. Changes for 2017 also include the initialcertification of proved volumes in Equatorial Guinea, representing the reserves associated with our equitymethod investment.
The following table sets forth the estimated future net revenues, excluding derivatives contracts, fromnet proved reserves and the expected benchmark prices used in projecting net revenues at December 31,2019. All estimated future net revenues are attributable to projected production from Ghana, EquatorialGuinea and the U.S. Gulf of Mexico. If we are unable to export associated natural gas in large quantities fromthe Jubilee and TEN fields then production could be limited and the future net revenues discussed hereincould be adversely affected.
Estimated Future Net Revenues
(in millions except $/Bbl)
GhanaEquatorial
GuineaMauritania/Senegal(4)
U.S Gulf ofMexico Total
Estimated future net revenues . . . . . . . . . . . . . . . . . . . . . . . $ 3,127 $ 575 $ — $1,500 $ 5,202
Present value of estimated future net revenues:PV-10(1) . . . . . . . . . . . . . . . . . . . . . . . . . . . . . . . . . . . . $ 2,103 $ 526 $ — $1,184 $ 3,813Future income tax expense (levied at a corporate parent and
intermediate subsidiary level) . . . . . . . . . . . . . . . . . . . . (1,026) (317) — $ (123) $(1,466)Discount of future income tax expense (levied at a
corporate parent and intermediate subsidiary level) at10% per annum . . . . . . . . . . . . . . . . . . . . . . . . . . . . . 349 85 — 38 472
Standardized Measure(2) . . . . . . . . . . . . . . . . . . . . . . . . $ 1,426 $ 294 $ — $1,099 $ 2,819
Benchmark Dated Brent oil price($/Bbl)(3) . . . . . . . . . . . . . $ 62.69Benchmark HLS oil price($/Bbl)(3) . . . . . . . . . . . . . . . . . . . $ 61.31Benchmark Henry Hub gas price($/MMBtu)(3) . . . . . . . . . . $ 2.58
(1) PV-10 represents the present value of estimated future revenues to be generated from the production ofproved oil and natural gas reserves, net of future development and production costs, royalties,additional oil entitlements and future tax expense levied at an asset level, using prices based on anaverage of the first-day-of-the-months throughout 2019 and costs as of the date of estimation withoutfuture escalation, without giving effect to hedging activities, non-property related expenses such asgeneral and administrative expenses, debt service and depreciation, depletion and amortization, anddiscounted using an annual discount rate of 10% to reflect the timing of future cash flows. PV-10 is anon-GAAP financial measure and often differs from Standardized Measure, the most directly comparableGAAP financial measure, because it does not include the effects of future income tax expense relatedto proved oil and gas reserves levied at a corporate parent level on future net revenues. However, it doesinclude the effects of future tax expense levied at an asset level. Neither PV-10 nor StandardizedMeasure represents an estimate of the fair market value of our oil and natural gas assets. PV-10 shouldnot be considered as an alternative to the Standardized Measure as computed under GAAP; however,we and others in the industry use PV-10 as a measure to compare the relative size and value of provedreserves held by companies without regard to the specific corporate tax characteristics of suchentities.
(2) Standardized Measure represents the present value of estimated future cash inflows to be generatedfrom the production of proved oil and natural gas reserves, net of future development and productioncosts, future income tax expense related to our proved oil and gas reserves levied at a corporate parentand intermediate subsidiary level, royalties, additional oil entitlements and future tax expense levied
25

at an asset level, without giving effect to hedging activities, non-property related expenses such asgeneral and administrative expenses, debt service and depreciation, depletion and amortization, anddiscounted using an annual discount rate of 10% to reflect timing of future cash flows and using the samepricing assumptions as were used to calculate PV-10. Standardized Measure often differs from PV-10because Standardized Measure includes the effects of future income tax expense related to our proved oiland gas reserves levied at a corporate parent level on future net revenues.
(3) This amount represents the unweighted arithmetic average first-day-of-the-month prices for the prior12 months at December 31, 2019 for the respective benchmark. The benchmark price was adjusted forhandling fees, transportation fees, quality, and a regional price differential.
(4) The Tortue Phase 1 SPA was signed on February 11, 2020, resulting in approximately 100 MMBoe ofproved undeveloped reserves being recognized at that time as evaluated by the company’s independentreserve auditor Ryder Scott, LP.
Estimated proved reserves
Unless otherwise specifically identified in this report, the summary data with respect to our estimatednet proved reserves for the years ended December 31, 2019, 2018 and 2017 has been prepared by RSC, ourindependent reserve engineering firm for such years, in accordance with the rules and regulations of the SECapplicable to companies involved in oil and natural gas producing activities. These rules require SECreporting companies to prepare their reserve estimates using reserve definitions and pricing based on12-month historical unweighted first-day-of-the-month average prices, rather than year-end prices. For adefinition of proved reserves under the SEC rules, see the “Glossary and Selected Abbreviations.” For moreinformation regarding our independent reserve engineers, please see “—Independent petroleum engineers”below.
Our estimated proved reserves and related future net revenues, PV-10 and Standardized Measure weredetermined in accordance with SEC rules for proved reserves.
Future net revenues represent projected revenues from the sale of proved reserves net of productionand development costs (including operating expenses and production taxes). Such calculations atDecember 31, 2019 are based on costs in effect at December 31, 2019 and the 12-month unweightedarithmetic average of the first-day-of-the-month price for the year ended December 31, 2019, adjusted foranticipated market premium, without giving effect to derivative transactions, and are held constant throughoutthe life of the assets. There can be no assurance that the proved reserves will be produced within theperiods indicated or prices and costs will remain constant.
Independent petroleum engineers
Ryder Scott Company, L.P.
RSC, our independent reserve engineers for the years ended December 31, 2019, 2018 and 2017, wasestablished in 1937. For over 80 years, RSC has provided services to the worldwide petroleum industry thatinclude the issuance of reserves reports and audits, appraisal of oil and gas properties including fair marketvalue determination, reservoir simulation studies, enhanced recovery services, expert witness testimony,and management advisory services. RSC professionals subscribe to a code of professional conduct and RSCis a Registered Engineering Firm in the State of Texas.
For the years ended December 31, 2019, 2018 and 2017, we engaged RSC to prepare independentestimates of the extent and value of the proved reserves of certain of our oil and gas properties. Thesereports were prepared at our request to estimate our reserves and related future net revenues and PV-10 forthe periods indicated therein. Our estimated reserves at December 31, 2019, 2018 and 2017 and related futurenet revenues and PV-10 at December 31, 2019, 2018 and 2017 are taken from reports prepared by RSC, inaccordance with petroleum engineering and evaluation principles which RSC believes are commonly used inthe industry and definitions and current regulations established by the SEC. The December 31, 2019reserve report was completed on January 13, 2020, and a copy is included as an exhibit to this report.
In connection with the preparation of the December 31, 2019, 2018 and 2017 reserves report, RSCprepared its own estimates of our proved reserves. In the process of the reserves evaluation, RSC did not
26

independently verify the accuracy and completeness of information and data furnished by us with respectto ownership interests, oil and gas production, well test data, historical costs of operation and development,product prices or any agreements relating to current and future operations of the fields and sales ofproduction. However, if in the course of the examination something came to the attention of RSC whichbrought into question the validity or sufficiency of any such information or data, RSC did not rely on suchinformation or data until it had satisfactorily resolved its questions relating thereto or had independentlyverified such information or data. RSC independently prepared reserves estimates to conform to the guidelinesof the SEC, including the criteria of “reasonable certainty,” as it pertains to expectations about therecoverability of reserves in future years, under existing economic and operating conditions, consistent withthe definition in Rule 4-10(a)(2) of Regulation S-X. RSC issued a report on our proved reserves atDecember 31, 2019, based upon its evaluation. RSC’s primary economic assumptions in estimates includedan ability to sell hydrocarbons at their respective adjusted benchmark prices and certain levels of future capitalexpenditures. The assumptions, data, methods and precedents were appropriate for the purpose served bythese reports, and RSC used all methods and procedures as it considered necessary under the circumstancesto prepare the report.
Technology used to establish proved reserves
Under the SEC rules, proved reserves are those quantities of oil and natural gas, which, by analysis ofgeoscience and engineering data, can be estimated with reasonable certainty to be economically produciblefrom a given date forward, from known reservoirs, and under existing economic conditions, operatingmethods, and government regulations. The term “reasonable certainty” implies a high degree of confidencethat the quantities of oil and/or natural gas actually recovered will equal or exceed the estimate. Reasonablecertainty can be established using techniques that have proved effective by actual comparison of productionfrom projects in the same reservoir interval, an analogous reservoir or by other evidence using reliabletechnology that establishes reasonable certainty. Reliable technology is a grouping of one or more technologies(including computational methods) that have been field tested and have been demonstrated to providereasonably certain results with consistency and repeatability in the formation being evaluated or in ananalogous formation.
In order to establish reasonable certainty with respect to our estimated proved reserves, RSC employedtechnologies that have been demonstrated to yield results with consistency and repeatability. The technologiesand economic data used in the estimation of our proved reserves include, but are not limited to, productionand injection data, electrical logs, radioactivity logs, acoustic logs, whole core analysis, sidewall coreanalysis, downhole pressure and temperature measurements, reservoir fluid samples, geochemical information,geologic maps, seismic data, well test and interference pressure and rate data. Reserves attributable toundeveloped locations were estimated using performance from analogous wells with similar geologicdepositional environments, rock quality, appraisal plans and development plans to assess the estimatedultimate recoverable reserves as a function of the original oil in place. These qualitative measures arebenchmarked and validated against sound petroleum reservoir engineering principles and equations toestimate the ultimate recoverable reserves volume. These techniques include, but are not limited to, nodalanalysis, material balance, and numerical flow simulation.
Internal controls over reserves estimation process
In our Reservoir Engineering team, we maintain an internal staff of petroleum engineering andgeoscience professionals with significant international experience that contribute to our internal reserve andresource estimates. This team works closely with our independent petroleum engineers to ensure theintegrity, accuracy and timeliness of data furnished in their reserve and resource estimation process. OurReservoir Engineering team is responsible for overseeing the preparation of our reserves estimates and hasover 100 combined years of industry experience among them with positions of increasing responsibility inengineering and evaluations. Each member of our team holds a minimum of a Bachelor of Science degreein petroleum engineering or geology.
The RSC technical person primarily responsible for preparing the estimates set forth in the RSCreserves report incorporated herein is Mr. Tosin Famurewa. Mr. Famurewa has been practicing consultingpetroleum engineering at RSC since 2006. Mr. Famurewa is a Licensed Professional Engineer in the State of
27

Texas (No. 100569) and has over 18 years of practical experience in petroleum engineering. He graduatedfrom University of California at Berkeley in 2000 with Bachelor of Science Degrees in Chemical Engineeringand Material Science Engineering, and he received a Master of Science degree in Petroleum Engineeringfrom University of Southern California in 2007. Mr. Famurewa meets or exceeds the education, training, andexperience requirements set forth in the Standards Pertaining to the Estimating and Auditing of Oil andGas Reserves Information promulgated by the Society of Petroleum Engineers and is proficient in judiciouslyapplying industry standard practices to engineering and geoscience evaluations as well as applying SECand other industry reserves definitions and guidelines.
The Audit Committee provides oversight on the processes utilized in the development of our internalreserve and resource estimates on an annual basis. In addition, our Reservoir Engineering team meets withrepresentatives of our independent reserve engineers to review our assets and discuss methods andassumptions used in preparation of the reserve and resource estimates. Finally, our senior managementreviews reserve and resource estimates on an annual basis.
Gross and Net Undeveloped and Developed Acreage
The following table sets forth certain information regarding the developed and undeveloped portions ofour license and lease areas as of December 31, 2019 for the countries in which we currently operate.
Developed Area(Acres)
Undeveloped Area(Acres) Total Area (Acres)
Gross Net(1) Gross Net(1) Gross Net(1)
(In thousands)
Ghana(2) . . . . . . . . . . . . . . . . . . . . . . . . . . . . . . . . 163 32 34 7 197 39Cote d’Ivoire . . . . . . . . . . . . . . . . . . . . . . . . . . . . . — — 4,143 1,865 4,143 1,865Equatorial Guinea . . . . . . . . . . . . . . . . . . . . . . . . . 65 26 2,355 1,292 2,420 1,318Mauritania . . . . . . . . . . . . . . . . . . . . . . . . . . . . . . — — 4,944 1,383 4,944 1,383Namibia . . . . . . . . . . . . . . . . . . . . . . . . . . . . . . . . — — 3,039 1,368 3,039 1,368South Africa . . . . . . . . . . . . . . . . . . . . . . . . . . . . . — — 1,712 770 1,712 770Sao Tome and Principe(3) . . . . . . . . . . . . . . . . . . . . — — 8,524 3,159 8,524 3,159Senegal . . . . . . . . . . . . . . . . . . . . . . . . . . . . . . . . . — — 2,116 631 2,116 631Suriname . . . . . . . . . . . . . . . . . . . . . . . . . . . . . . . . — — 2,793 1,142 2,793 1,142U.S. Gulf of Mexico . . . . . . . . . . . . . . . . . . . . . . . . 92 26 338 211 430 237Total . . . . . . . . . . . . . . . . . . . . . . . . . . . . . . . . . . . 320 84 29,998 11,828 30,318 11,912
(1) Net acreage based on Kosmos’ participating interests, before the exercise of any options or back-inrights, except for our net acreage associated with the Jubilee, TEN, and Greater Tortue Ahmeyim fields,which are after the exercise of options or back-in rights. Our net acreage in Ghana may be affected byany redetermination of interests in the Jubilee Unit and our net acreage in Mauritania and Senegal maybe affected by any redetermination of interests in the Greater Tortue Ahmeyim Unit.
(2) The Exploration Period of the WCTP petroleum contract and DT petroleum contract has expired. Theundeveloped area reflected in the table above represents acreage within our discovery areas that werenot subject to relinquishment on the expiry of the Exploration Period.
(3) Formal withdrawal notice on STP Block 12 was communicated to partners on December 13, 2019 andwill be effective January 31, 2020.
28
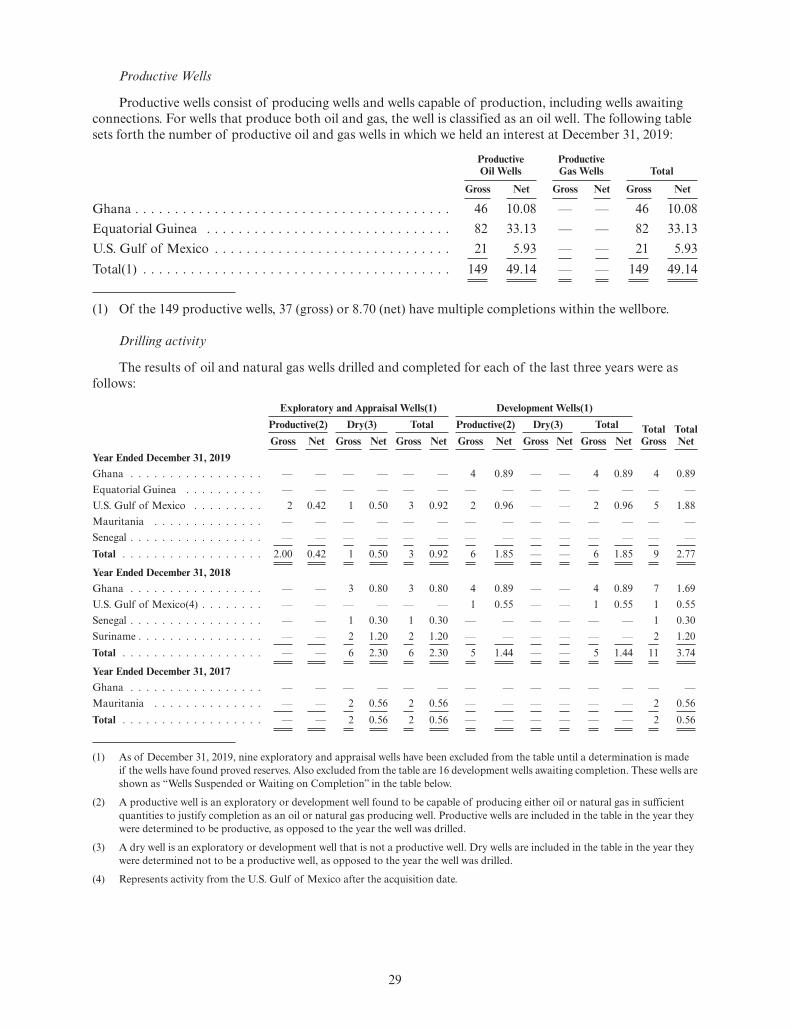
Productive Wells
Productive wells consist of producing wells and wells capable of production, including wells awaitingconnections. For wells that produce both oil and gas, the well is classified as an oil well. The following tablesets forth the number of productive oil and gas wells in which we held an interest at December 31, 2019:
ProductiveOil Wells
ProductiveGas Wells Total
Gross Net Gross Net Gross Net
Ghana . . . . . . . . . . . . . . . . . . . . . . . . . . . . . . . . . . . . . . . . 46 10.08 — — 46 10.08Equatorial Guinea . . . . . . . . . . . . . . . . . . . . . . . . . . . . . . . 82 33.13 — — 82 33.13U.S. Gulf of Mexico . . . . . . . . . . . . . . . . . . . . . . . . . . . . . . 21 5.93 — — 21 5.93Total(1) . . . . . . . . . . . . . . . . . . . . . . . . . . . . . . . . . . . . . . . 149 49.14 — — 149 49.14
(1) Of the 149 productive wells, 37 (gross) or 8.70 (net) have multiple completions within the wellbore.
Drilling activity
The results of oil and natural gas wells drilled and completed for each of the last three years were asfollows:
Exploratory and Appraisal Wells(1) Development Wells(1)Productive(2) Dry(3) Total Productive(2) Dry(3) Total Total
GrossTotalNetGross Net Gross Net Gross Net Gross Net Gross Net Gross Net
Year Ended December 31, 2019Ghana . . . . . . . . . . . . . . . . . — — — — — — 4 0.89 — — 4 0.89 4 0.89Equatorial Guinea . . . . . . . . . . — — — — — — — — — — — — — —U.S. Gulf of Mexico . . . . . . . . . 2 0.42 1 0.50 3 0.92 2 0.96 — — 2 0.96 5 1.88Mauritania . . . . . . . . . . . . . . — — — — — — — — — — — — — —Senegal . . . . . . . . . . . . . . . . . — — — — — — — — — — — — — —Total . . . . . . . . . . . . . . . . . . 2.00 0.42 1 0.50 3 0.92 6 1.85 — — 6 1.85 9 2.77
Year Ended December 31, 2018Ghana . . . . . . . . . . . . . . . . . — — 3 0.80 3 0.80 4 0.89 — — 4 0.89 7 1.69U.S. Gulf of Mexico(4) . . . . . . . . — — — — — — 1 0.55 — — 1 0.55 1 0.55Senegal . . . . . . . . . . . . . . . . . — — 1 0.30 1 0.30 — — — — — — 1 0.30Suriname . . . . . . . . . . . . . . . . — — 2 1.20 2 1.20 — — — — — — 2 1.20Total . . . . . . . . . . . . . . . . . . — — 6 2.30 6 2.30 5 1.44 — — 5 1.44 11 3.74
Year Ended December 31, 2017Ghana . . . . . . . . . . . . . . . . . — — — — — — — — — — — — — —Mauritania . . . . . . . . . . . . . . — — 2 0.56 2 0.56 — — — — — — 2 0.56Total . . . . . . . . . . . . . . . . . . — — 2 0.56 2 0.56 — — — — — — 2 0.56
(1) As of December 31, 2019, nine exploratory and appraisal wells have been excluded from the table until a determination is madeif the wells have found proved reserves. Also excluded from the table are 16 development wells awaiting completion. These wells areshown as “Wells Suspended or Waiting on Completion” in the table below.
(2) A productive well is an exploratory or development well found to be capable of producing either oil or natural gas in sufficientquantities to justify completion as an oil or natural gas producing well. Productive wells are included in the table in the year theywere determined to be productive, as opposed to the year the well was drilled.
(3) A dry well is an exploratory or development well that is not a productive well. Dry wells are included in the table in the year theywere determined not to be a productive well, as opposed to the year the well was drilled.
(4) Represents activity from the U.S. Gulf of Mexico after the acquisition date.
29

The following table shows the number of wells that are in the process of being drilled or are in activecompletion stages, and the number of wells suspended or waiting on completion as of December 31, 2019.
Actively Drilling orCompleting
Wells Suspended orWaiting on Completion
Exploration Development Exploration Development
Gross Net Gross Net Gross Net Gross Net
GhanaJubilee Unit . . . . . . . . . . . . . . . . . . . . . . . . . . — — — — — — 8 1.93TEN . . . . . . . . . . . . . . . . . . . . . . . . . . . . . . . — — — — — — 7 1.19
Equatorial GuineaBlock S . . . . . . . . . . . . . . . . . . . . . . . . . . . . . — — — — 1 0.40 — —
U.S. Gulf of MexicoOldfield . . . . . . . . . . . . . . . . . . . . . . . . . . . . . 1 0.40 — — — — — —
Mauritania / SenegalMauritania C8 . . . . . . . . . . . . . . . . . . . . . . . . — — — — 2 0.56 — —Greater Tortue Ahmeyim Unit . . . . . . . . . . . . . — — — — 3 0.80 1 0.27Senegal Cayar Profond . . . . . . . . . . . . . . . . . . — — — — 3 0.90 — —
Total . . . . . . . . . . . . . . . . . . . . . . . . . . . . . . . . 1 0.40 — — 9 2.66 16 3.39
Domestic Supply Requirements
Many of our petroleum contracts or, in some cases, the applicable law governing such agreements,grant a right to the respective host country to purchase certain amounts of oil/gas produced pursuant tosuch agreements at international market prices for domestic consumption. In addition, in connection withthe approval of the Jubilee Phase 1 PoD, the Jubilee Field partners agreed to provide the first 200 Bcf ofnatural gas produced from the Jubilee Field Phase 1 development to GNPC at no cost. As of December 31,2019, 105 Bcf of the 200 Bcf of natural gas has been provided.
Significant License Agreements
Below is a discussion concerning the petroleum contracts governing our current drilling and productionoperations.
Ghana West Cape Three Points Block
As a result of the approval of the GJFFDP by the Ghana Ministry of Energy in October 2017,operatorship for the West Cape Three Points Block, including the Mahogany and Teak discoveries,transferred to Tullow in February 2018 and are now included in the Jubilee Unit. Kosmos is required to payto the government of Ghana a fixed royalty of 5% and a potential sliding-scale royalty (“additional oilentitlement”), which comes into effect and escalates as the nominal project rate of return increases above acertain threshold. These royalties are to be paid in-kind or, at the election of the government of Ghana, incash. A corporate tax rate of 35% is applied to profits at a country level.
The WCTP petroleum contract has a duration of 30 years from its effective date (July 2004). However,in July 2011, at the end of the seven-year Exploration Period, parts of the WCTP Block on which we hadnot declared a discovery area, were not in a development and production area, or were not in the Jubilee Unit,were relinquished (“WCTP Relinquishment Area”). We maintain rights to the Akasa discovery within theWCTP Block as the WCTP petroleum contract remains in effect after the end of the Exploration Period. Weand our WCTP Block partners have certain rights to negotiate a new petroleum contract with respect tothe WCTP Relinquishment Area. We and our WCTP Block partners, the Ghana Ministry of Energy andGNPC have agreed such WCTP petroleum contract rights to negotiate extend from July 21, 2011 until suchtime as either a new petroleum contract is negotiated and entered into with us or we decline to match abona fide third party offer GNPC may receive for the WCTP Relinquishment Area.
30

Ghana Deepwater Tano Block
Tullow is the operator of the Deepwater Tano Block. Under the DT petroleum contract, GNPCexercised its option to acquire an additional paying interest of 5% in the commercial discovery with respectto the Jubilee Field development and the TEN Fields development. Kosmos is required to pay to thegovernment of Ghana a fixed royalty of 5% and a potential additional oil entitlement, which comes intoeffect and escalates as the nominal project rate of return increases above a certain threshold. These royaltiesare to be paid in-kind or, at the election of the government of Ghana, in cash. A corporate tax rate of35% is applied to profits at a country level.
The DT petroleum contract has a duration of 30 years from its effective date (July 2006). However, in2013, at the end of the seven-year Exploration Period, parts of the DT Block on which we had not declareda discovery area, were not in a development and production area, or were not in the Jubilee Unit, wererelinquished (“DT Relinquishment Area”). Our existing Wawa discovery within the DT Block was not subjectto relinquishment upon expiration of the Exploration Period of the DT petroleum contract, as the DTpetroleum contract remains in effect after the end of the Exploration Period while commerciality is beingdetermined. Pursuant to our DT petroleum contract, we and our DT Block partners have certain rights tonegotiate a new petroleum contract with respect to the DT Relinquishment Area until such time as either anew petroleum contract is negotiated and entered into with us or we decline to match a bona fide thirdparty offer GNPC may receive for the DT Relinquishment Area.
The Ghanaian Petroleum Exploration and Production Law of 1984 (PNDCL 84) (the “1984 GhanaianPetroleum Law”) and the WCTP and DT petroleum contracts form the basis of our exploration, developmentand production operations on the WCTP and DT blocks. Pursuant to these petroleum contracts, mostsignificant decisions, including PoDs and annual work programs, for operations other than exploration andappraisal, must be approved by a joint management committee, consisting of representatives of certainblock partners and GNPC. Certain decisions require unanimity.
Ghana Jubilee Field Unitization
The Jubilee Field, discovered by the Mahogany-1 well in June 2007, covers an area within both theWCTP and DT Blocks. To optimize resource recovery in the Jubilee Field, it was unitized and the JubileeUUOA was agreed to in 2009 which governs each party’s respective rights and duties in the Jubilee Unit andnamed Tullow as the Unit Operator. Although the Jubilee Field is unitized, Kosmos’ participating interestsin each block outside the boundary of the Jubilee Unit remain the same. Our Jubilee Unit interest is 24.1%subject to redetermination of the participating interests pursuant to the terms of the Jubilee UUOA. Ourpaying interest on development activities is 26.9%.
Greater Tortue Ahmeyim Unitization
The Greater Tortue Ahmeyim Field, discovered by the Tortue-1 well in May 2015, in Mauritania blockC8 and by the Guembuel-1 well in January 2016, in the Saint-Louis Offshore Profond Block in Senegal coversan area within both the C8 and Saint-Louis Offshore Profond Blocks. Mauritania and Senegal agreed thatthe Greater Tortue Ahmeyim Field would be unitized for optimal resource recovery in the Inter-StateCooperation Agreement (ICA) signed in February 2018. The GTA UUOA was agreed between the contractorgroups of the C8 and Saint-Louis Offshore Profond Blocks and approved by the appropriate Ministers inMauritania and Senegal in February 2019. BP Mauritania and BP Senegal are co-Unit Operator and willallocate responsibilities for the initial development of the Greater Tortue Ahmeyim Field. Although theGreater Tortue Ahmeyim Field is unitized, Kosmos’ participating interests in each block outside theboundary of the Greater Tortue Ahmeyim Unit remain the same. Our Unit interest is 26.7% and is subjectto redetermination of the participating interests pursuant to the terms of the GTA UUOA. In February 2019,Mauritania and Senegal each issued an exploitation authorization for the Greater Tortue Ahmeyim Unitarea covered by the GTA UUOA.
Mauritania Agreements
Effective June 2012, we entered into three petroleum contracts covering offshore Mauritania BlocksC8, C12 and C13 with the Islamic Republic of Mauritania. We provide technical exploration services to BP,
31

the operator. The Mauritanian national oil company, SMHPM, currently has a 10% carried interest duringthe exploration period only. Should a commercial discovery be made, SMHPM’s 10% carried interest isextinguished and SMHPM will have an option to obtain a participating interest between 10% and 14%.SMHPM will pay its portion of development and production costs in a commercial development. Costrecovery oil is apportioned to the contractor from up to 55% (62% for gas) of total production prior to profitoil being split between the government of Mauritania and the contractor. Profit oil is then apportionedbased upon “R-factor” tranches, where the R-factor is cumulative net revenues divided by the cumulativeinvestment. At the election of the government of Mauritania, the government may receive its share ofproduction in cash or in kind. A corporate tax rate of 27% is applied to profits at the license level. The termsof exploration periods of these Offshore Blocks are all ten years and initially included a first explorationperiod of four years followed by the second exploration period of three years and the third exploration periodof three years. Kosmos is currently in the third exploration period for Blocks C8 and C12, expiring inJune 2022. Kosmos is currently in the second exploration period for Block C13, having received a two yearextension, now expiring in June 2021. This extension also reduced the third exploration period for Block C13from three years to one year. In the event of commercial success, we have the right to develop and produceoil for 25 years and gas for 30 years from the grant of an exploitation authorization from the government,which may be extended for an additional period of 10 years under certain circumstances.
In October 2016, we entered into a petroleum contract covering Block C6 with the Islamic Republic ofMauritania. As a result of a subsequent farm-out, we have a 28% participating interest and provide technicalexploration services to BP, the operator. The Mauritanian national oil company, SMHPM, currently has a10% carried interest during the exploration period. We are currently in the first exploration period, whichextends four years from the effective date (October 28, 2016).
Senegal Agreements
In June 2018, we entered the final renewal of the exploration period for the Senegal Cayar OffshoreProfond and Saint Louis Offshore Profond Blocks, which lasts for approximately two and one-half years,ending in March 2021 for Cayar Offshore Profond and July 2021 for Saint Louis Offshore Profond. In theevent of commercial success, we have the right to develop and produce oil and/or gas for a period of 25 yearsfrom the grant of an exploitation authorization from the government, which may be extended on twoseparate occasions for a period of 10 years each under certain circumstances.
Equatorial Guinea Exploration Agreements
In March 2018, we entered into petroleum contracts covering Blocks EG-21, S, and W with theRepublic of Equatorial Guinea. We currently have a 40% interest in the blocks. The Equatorial Guineannational oil company, GEPetrol, currently has a 20% carried participating interest during the explorationperiod. Should a commercial discovery be made, GEPetrol’s 20% carried interest will convert to a 20%participating interest. The petroleum contracts cover approximately 6,000 square kilometers, with a firstexploration period of five years from the date of notification of ratification by the President of EquatorialGuinea. The first exploration period consists of two sub-periods of three and two years, respectively, whichcan be extended up to two additional years at our election, subject to fulfilling specific work obligations.The first exploration sub-period work program includes an approximately 6,000 square kilometer 3D seismicacquisition requirement across the three blocks.
In the first quarter of 2019, we acquired Ophir’s remaining interest in and operatorship of BlockEG-24 offshore Equatorial Guinea, which results in Kosmos owning an 80% interest in Block EG-24.GEPetrol, currently has a 20% carried interest during the exploration period. Should a commercial discoverybe made, GEPetrol’s 20% carried interest will convert to a 20% participating interest for all developmentand production operations. The petroleum contract covers approximately 3,500 square kilometers, with a firstexploration sub-period of three years from the effective date (March 2018), which can be extended up tofour additional years at our election, subject to fulfilling specific work obligations. The first explorationsub-period work program includes a 3,000 square kilometer 3D seismic acquisition requirement.
Sales and Marketing
As provided under the Jubilee UUOA and the WCTP and DT petroleum contracts, we are entitled tolift and sell our share of the Jubilee and TEN production as are the other Jubilee Unit and TEN partners.
32

We have entered into agreements with multiple oil marketing agents to market our share of the Jubilee andTEN fields oil, and we approve the terms of each sale proposed by such agent. We do not anticipate enteringinto any long term sales agreements at this time.
In December 2017, we signed the TAG GSA and we began exporting TEN associated gas to shore inthe fourth quarter of 2018. The TAG GSA provides for an inflation-adjusted sales price of $0.50 per mmbtu.
In Equatorial Guinea, as provided under the petroleum contract for Block G, we are entitled to lift andsell our share of the Ceiba Field production as are the other Ceiba Field partners. We have entered into anagreement with an oil marketing agent to market our share of the Ceiba Field oil, and we approve the termsof each sale proposed by such agent. We do not anticipate entering into any long term sales agreements atthis time.
In the U.S. Gulf of Mexico, we sell crude oil to purchasers typically through monthly contracts, withthe sale taking place at multiple points offshore, depending on the particular property. Natural gas is sold topurchasers through monthly contracts, with the sale taking place either offshore or at an onshore gasprocessing plant after the removal of NGLs. We actively market our crude oil and natural gas to purchasers,and sales prices for purchased oil and natural gas volumes are negotiated with purchasers and are based oncertain published indices. Since most of the oil and natural gas contracts are month-to-month, there are veryfew dedications of production to any one purchaser. We sell the NGLs entrained in the natural gas that weproduce. The arrangements to sell these products first requires natural gas to be processed at an onshore gasprocessing plant. Once the liquids are removed and fractionated (broken into the individual hydrocarbonchains for sale), the products are sold by the processing plant. The residue gas left over is sold to natural gaspurchasers as natural gas sales (referenced above). The contracts for NGL sales are with the processingplant. The prices received for the NGLs are either tied to indices or are based on what the processing plantcan receive from a third party purchaser. The gas processing and subsequent sales of NGLs are subject tocontracts with longer terms and dedications of lease production from the Company’s leases offshore.
There are a variety of factors which affect the market for oil, including the proximity and capacity oftransportation facilities, demand for oil both within the local market and beyond, the marketing of competitivefuels and the effects of government regulations on oil production and sales. Our revenue can be materiallyaffected by current economic conditions and the price of oil. However, based on the current demand for crudeoil and the fact that alternative purchasers are available, we believe that the loss of our marketing agentand/or any of the purchasers identified by our marketing agent would not have a long-term material adverseeffect on our financial position or results of operations.
Competition
The oil and gas industry is competitive. We encounter strong competition from other independentoperators and from major oil companies in acquiring licenses and leases. Many of these competitors havefinancial and technical resources and staff that are substantially larger than ours. As a result, our competitorsmay be able to pay more for desirable oil and natural gas assets, or to evaluate, bid for and purchase agreater number of licenses and leases than our financial or personnel resources will permit. Furthermore,these companies may also be better able to withstand the financial pressures of lower commodity prices,unsuccessful wells, volatility in financial markets and generally adverse global and industry-wide economicconditions. These companies may also be better able to absorb the burdens resulting from changes inrelevant laws and regulations, which may adversely affect our competitive position.
Historically, we have also been affected by competition for drilling rigs and the availability of relatedequipment. Higher commodity prices generally increase the demand for drilling rigs, supplies, services,equipment and crews. Shortages of, or increasing costs for, experienced drilling crews and equipment andservices may restrict our ability to drill wells and conduct our operations.
The oil and gas industry as a whole has experienced continued volatility. Dated Brent crude, thebenchmark for our international oil sales, ranged from approximately $53 to $75 per barrel during 2019.HLS crude, the benchmark for our U.S. Gulf of Mexico oil sales, which generally trades at a discount to DatedBrent, ranged from approximately $52 to $75 during 2019. Excluding the impact of hedges, our realized
33

price for 2019 was $63.25 per barrel. We believe lower prices will generally result in greater availability ofassets and necessary equipment. However, the impacts on the industry from a competitive perspective are notentirely known.
Title to Property
Other than as specified in this annual report on Form 10-K, we believe that we have satisfactory title toour oil and natural gas assets in accordance with standards generally accepted in the international oil andgas industry. Our licenses and leases are subject to customary royalty and other interests, liens under operatingagreements and other burdens, restrictions and encumbrances customary in the oil and gas industry thatwe believe do not materially interfere with the use of, or affect the carrying value of, our interests.
Environmental Matters
General
We are subject to various stringent and complex international, foreign, federal, state and localenvironmental, health and safety laws and regulations governing matters including the emission anddischarge of pollutants into the ground, air or water; the generation, storage, handling, use and transportationof regulated materials; and the health and safety of our employees. These laws and regulations may,among other things:
• require the acquisition of various permits before operations commence or for operations to continue;
• enjoin some or all of the operations or facilities deemed not in compliance with permits;
• restrict the types, quantities and concentration of various substances that can be released into theenvironment in connection with oil and natural gas drilling, production and transportation activities;
• limit, cap, tax or otherwise restrict emissions of GHG and other air pollutants or otherwise seek toaddress or minimize the effects of climate change;
• limit or prohibit drilling activities in certain locations lying within protected or otherwise sensitiveareas; and
• require measures to mitigate or remediate pollution, including pollution resulting from our blockpartners’ or our contractors’ operations.
These laws and regulations may also restrict the rate of oil and natural gas production below the ratethat would otherwise be possible. Compliance with these laws can be costly; the regulatory burden on the oiland natural gas industry increases the cost of doing business in the industry and consequently affectsprofitability. We cannot assure you that we have been or will be at all times in compliance with such laws, orthat environmental laws and regulations will not change or become more stringent in the future in amanner that could have a material adverse effect on our financial condition and results of operations.
Moreover, public interest in the protection of the environment continues to increase. Offshore drilling insome areas has been opposed by environmental groups and, in other areas, has been restricted. Our operationscould be adversely affected to the extent laws or regulations are enacted or other governmental action istaken that prohibits or restricts offshore drilling or imposes environmental requirements that increase coststo the oil and gas industry in general, such as more stringent or costly waste handling, disposal or cleanuprequirements or financial responsibility and assurance requirements.
Per common industry practice, under agreements governing the terms of use of the drilling rigscontracted by us or our block or lease partners, the drilling rig contractors typically indemnify us and ourblock partners in respect of pollution and environmental damage originating above the surface of the waterand from such drilling rig contractor’s property, including their drilling rig and other related equipment.Furthermore, pursuant to the terms of the operating agreements for our blocks and leases, except in certaincircumstances, each block or lease partner is responsible for its share of liabilities in proportion to itsparticipating interest incurred as a result of pollution and environmental damage, containment and clean-upactivities, loss or damage to any well, loss of oil or natural gas resulting from a blowout, crater, fire, oruncontrolled well, loss of stored oil and natural gas, as well as for plugging or bringing under control any
34

well. We maintain insurance coverage typical of the industry in the areas we operate in; these includeproperty damage insurance, loss of production insurance, wreck removal insurance, control of well insurance,general liability including pollution liability to cover pollution from wells and other operations. We alsoparticipate in an insurance coverage program for the FPSOs which we own. We believe our insurance iscarried in amounts typical for the industry relative to our size and operations and in accordance with ourcontractual and regulatory obligations.
Capping and Containment (Excluding the U.S. Gulf of Mexico)
We entered into an agreement with a third party service provider for it to supply subsea capping andcontainment equipment on a global basis (excluding the U.S. Gulf of Mexico). The equipment includescapping stacks, debris removal, subsea dispersant and auxiliary equipment. The equipment meets industryaccepted standards and can be deployed by air cargo and other conventional means to suit multiple applicationscenarios. We also developed an emergency response plan and response organization to prepare anddemonstrate our readiness to respond to a subsea well control incident. Capping and containment for theU.S. Gulf of Mexico is detailed in the U.S. Gulf of Mexico (Operated and Non-operated) section below.
Oil Spill Response
To complement our agreement discussed above for subsea capping and containment equipment, webecame a charter member of the Global Dispersant Stockpile (“GSD”). The dispersant stockpile, which ismanaged by Oil Spill Response Limited (“OSRL”) of Southampton, England, an oil spill response contractor,consists of 5,000 cubic meters of dispersant strategically located at OSRL bases around the world. Thetotal volume of the stockpile located at the OSRL bases is calculated to provide members with the ability torespond to a major spill incident. Dispersant from the GSD can be used in the U.S. Gulf of Mexico.
Mauritania and Senegal (Non-operated)
Kosmos transferred operatorship of Mauritania and Senegal operations to BP at the beginning of2018 and was not the operator for any operations during 2019.
Ghana (Non-operated)
Tullow, our partner and the operator of the Jubilee Unit and the TEN fields, maintains Oil SpillContingency Plans (“OSCP”) covering the Jubilee Field and Deepwater Tano Block. Under the OSCPs,emergency response teams may be activated to respond to oil spill incidents. Tullow has access to OSRL’soil spill response services comprising technical expertise and assistance, including access to response equipmentand dispersant spraying systems. Tullow maintains lease agreements with OSRL for Tier 1 and Tier 2packages of oil spill response equipment.
Equatorial Guinea (Operated and Non-operated)
Effective January 1, 2019, Trident became operator of the Ceiba Field and Okume Complex. Inaddition, Kosmos drilled an exploration well in 2019 after joining the Equatorial Guinea Oil and GasOperators Emergency Resource Allocation Agreement to share equipment with other in country operatorsin case of emergency. Our membership in OSRL provided access to Tier II and III equipment located inAccra, Ghana and Southampton, UK.
Sao Tome and Principe (Operated and Non-operated)
Kosmos plans on drilling an exploration well offshore Sao Tome and Principe and began the Oil SpillContingency Planning process in 2019. Kosmos is also supporting the government of Sao Tome and Principewith the development of their National Oil Spill Contingency Plan to enable them to access the InternationalOil Pollution Compensation Funds to respond to third party incidents.
U.S. Gulf of Mexico (Operated and Non-operated)
After the major well control incident and oil release in the U.S. Gulf of Mexico in 2010, the U.S.Department of Interior updated regulations which govern the type, amount and capabilities of response
35

equipment that needs to be available to operators to respond to similar incidents. These regulations alsodictate the type and frequency of training that operating personnel need to receive and demonstrate proficiencyin. Kosmos also has an Oil Spill Response Plan (“OSRP”) which is approved by the Bureau of Safety andEnvironmental Enforcement (“BSEE”). This OSRP would be activated if needed in the event of an oil spillor containment event in the U.S. Gulf of Mexico. Kosmos joined several cooperatives that were establishedto meet the requirements of the new regulations. For capping and containment, Kosmos joined the Helix WellContainment Group (“HWCG”) consortium whose capabilities include; (i) two dual ram capping stacksrated at 15,000 psi and 10,000 psi respectively, (ii) intervention equipment to cap and contain a well with themechanical and structural integrity to be shut in at depths up to 10,000 feet, and (iii) the ability to captureand process 130,000 barrels of fluid per day and 220 Mcf of gas per day. Kosmos is also a member of theClean Gulf Associate (“CGA”) Oil Spill Cooperative, which provides oil spill response capabilities to meetregulatory requirements. Equipment and services include a High Volume Open Sea Skimming System(“HOSS”), dedicated oil spill response vessels strategically positioned along the U.S. gulf coast, dispersantand dispersant delivery systems, various types of spill response booms and mobile wildlife rehabilitationequipment. Due to federal regulations, all of the HWCG and CGA equipment is dedicated to U.S.operations and cannot be utilized outside the country.
Employees
As of December 31, 2019, we had approximately 360 employees. None of these employees arerepresented by labor unions or covered by any collective bargaining agreement. We believe that relationswith our employees are satisfactory.
Corporate Information
On December 28, 2018, we changed our jurisdiction of incorporation from Bermuda to the State ofDelaware, USA. Kosmos Energy Ltd. discontinued as a Bermuda exempted company pursuant toSection 132G of the Companies Act 1981 of Bermuda and, pursuant to Section 265 of the GeneralCorporation Law of the State of Delaware (the “DGCL”), continued its existence under the DGCL as acorporation organized in the State of Delaware. This transaction is referred to as the “Redomestication”. Thebusiness, assets and liabilities of the Company and its subsidiaries on a consolidated basis, as well as itsprincipal locations and fiscal year, were the same immediately after the Redomestication as they wereimmediately prior to the Redomestication. In addition, the directors and executive officers of the Companyimmediately after the Redomestication were the same individuals who were directors and executive officers,respectively, of the Company immediately prior to the Redomestication.
The Company did not change its name in connection with the Redomestication. In the Redomestication,each of the outstanding common shares of Kosmos Energy Ltd., an exempted company incorporatedpursuant to the laws of Bermuda, were automatically converted by operation of law, on a one-for-one basis,into shares of common stock of Kosmos Energy Ltd., a company incorporated pursuant to the laws ofDelaware. Consequently, each holder of a Kosmos Energy Ltd. common share now holds a share of KosmosEnergy Ltd.’s common stock in each case representing the same proportional equity interest in the Companyas that shareholder held prior to the Redomestication. The number of shares of the Company’s commonstock outstanding immediately after the Redomestication was the same as the number of common shares ofKosmos Energy Ltd. outstanding immediately prior to the Redomestication. In connection with theRedomestication, the Company adopted a new certificate of incorporation, bylaws and form of commonstock certificate, copies of which are filed herewith as Exhibits 3.1, 3.2 and 4.1, respectively.
We maintain a registered office in Delaware at Corporation Trust Center, 1209 Orange Street,Wilmington, Delaware 19801. Our executive offices are maintained at 8176 Park Lane, Suite 500, Dallas,Texas 75231, and its telephone number is +1 (214) 445 9600.
Available Information
Kosmos is listed on the NYSE and LSE and our common stock is traded under the symbol KOS. Wefile or furnish annual, quarterly and current reports, proxy statements and other information with the SECas well as the London Stock Exchange’s Regulatory News Service (“LSE RNS”). The SEC maintains a website
36

at http://www.sec.gov that contains documents we file electronically with the SEC. The LSE RNS maintainsa website at http://www.londonstockexchange.com that contains documents we file electronically with the LSERNS.
The Company also maintains an internet website under the name www.kosmosenergy.com. Theinformation on our website is not incorporated by reference into this annual report on Form 10-K andshould not be considered a part of this annual report on Form 10-K. Our website is included as an inactivetechnical reference only. We make available, free of charge, on our website, our annual report on Form 10-K,quarterly reports on Form 10-Q, current reports on Form 8-K and, if applicable, amendments to thosereports filed or furnished pursuant to Section 13(a) of the Exchange Act as soon as reasonably practicableafter such reports are electronically filed with, or furnished to, the SEC.
37

Item 1A. Risk Factors
You should consider and read carefully all of the risks and uncertainties described below, together with allof the other information contained in this report, including the consolidated financial statements and the relatednotes included in “Item 8. Financial Statements and Supplementary Data.” If any of the following risksactually occurs, our business, business prospects, financial condition, results of operations or cash flows couldbe materially adversely affected. The risks below are not the only ones we face. Additional risks not currentlyknown to us or that we currently deem immaterial may also adversely affect us.
Risks Relating to the Oil and Natural Gas Industry and Our Business
We have limited proved reserves and areas that we decide to drill may not yield oil and natural gas in commercialquantities or quality, or at all.
We have limited proved reserves. A portion of our oil and natural gas assets consists of discoverieswithout approved PoDs and with limited well penetrations, as well as identified yet unproven prospectsbased on available seismic and geological information that indicates the potential presence of hydrocarbons.However, the areas we decide to drill may not yield oil or natural gas in commercial quantities or quality,or at all. Many of our current discoveries and all of our prospects are in various stages of evaluation that willrequire substantial additional analysis and interpretation. Even when properly used and interpreted, 2Dand 3D seismic data and visualization techniques are only tools used to assist geoscientists in identifyingsubsurface structures and hydrocarbon indicators and do not enable the interpreter to know whetherhydrocarbons are, in fact, present in those structures. Accordingly, we do not know if any of our discoveriesor prospects will contain oil or natural gas in sufficient quantities or quality to recover drilling andcompletion costs or to be economically viable. Even if oil or natural gas is found on our discoveries orprospects in commercial quantities, construction costs of gathering lines, subsea infrastructure, otherproduction facilities and floating production systems and transportation costs may prevent such discoveriesor prospects from being economically viable, and approval of PoDs by various regulatory authorities, anecessary step in order to develop a commercial discovery, may not be forthcoming. Additionally, theanalogies drawn by us using available data from other wells, more fully explored discoveries or producingfields may not prove valid with respect to our drilling prospects. We may terminate our drilling program fora discovery or prospect if data, information, studies and previous reports indicate that the possibledevelopment of a discovery or prospect is not commercially viable and, therefore, does not merit furtherinvestment. If a significant number of our discoveries or prospects do not prove to be successful, our business,financial condition and results of operations will be materially adversely affected.
The deepwater offshore Mauritania and Senegal, an area in which we currently focus a substantialamount of our development efforts, has only recently been considered economically viable for hydrocarbonproduction due to the costs and difficulties involved in drilling and development at such depths and therelatively recent discovery of commercial quantities of hydrocarbons in the region. Likewise, our deepwateroffshore Cote d’Ivoire, Namibia, Sao Tome and Principe, South Africa and Suriname licenses have notyet proved to be economically viable production areas. We have limited proved reserves, and we may not besuccessful in developing additional commercially viable production from our other discoveries and prospects.
We face substantial uncertainties in estimating the characteristics of our discoveries and our prospects.
In this report we provide numerical and other measures of the characteristics of our discoveries andprospects. These measures may be incorrect, as the accuracy of these measures is a function of availabledata, geological interpretation and judgment. To date, a limited number of our prospects have been drilled.Any analogies drawn by us from other wells, discoveries or producing fields may not prove to be accurateindicators of the success of developing proved reserves from our discoveries and prospects. Furthermore,we have no way of evaluating the accuracy of the data from analog wells or prospects produced by otherparties which we may use.
It is possible that few or none of our wells to be drilled will find accumulations of hydrocarbons incommercial quality or quantity. Any significant variance between actual results and our assumptions couldmaterially affect the quantities of hydrocarbons attributable to any particular prospect.
38

Drilling wells is speculative, often involving significant costs that may be more than we estimate, and may notresult in any discoveries or additions to our future production or reserves. Any material inaccuracies in drillingcosts, estimates or underlying assumptions will materially affect our business.
Exploring for and developing hydrocarbon reserves involves a high degree of technical, operational andfinancial risk, which precludes definitive statements as to the time required and costs involved in reachingcertain objectives. The budgeted costs of planning, drilling, completing and operating wells are often exceededand can increase significantly when drilling costs rise due to a tightening in the supply of various types ofoilfield equipment and related services or unanticipated geologic conditions.
Before a well is spud, we incur significant geological and geophysical (seismic) costs, which are incurredwhether or not a well eventually produces commercial quantities of hydrocarbons or is drilled at all. Drillingmay be unsuccessful for many reasons, including geologic conditions, weather, cost overruns, equipmentshortages and mechanical difficulties or force majeure events. Exploratory wells bear a much greater risk offailure than development wells. In the past we have experienced unsuccessful drilling efforts, havingdrilled dry holes. Furthermore, the successful drilling of a well does not necessarily result in the commerciallyviable development of a field or be indicative of the potential for the development of a commercially viablefield. A variety of factors, including geologic and market-related, can cause a field to become uneconomic oronly marginally economic. A lack of drilling opportunities or projects that cease production may cause usto incur significant costs associated with an idle rig and/or related services, particularly if we cannot contractout rig slots to other parties. Many of our prospects that may be developed require significant additionalexploration, appraisal and development, regulatory approval and commitments of resources prior tocommercial development. In addition, a successful discovery would require significant capital expenditurein order to develop and produce oil and natural gas, even if we deemed such discovery to be commerciallyviable. See “—Our business plan requires substantial additional capital, which we may be unable to raise onacceptable terms or at all in the future, which may in turn limit our ability to develop our exploration,appraisal, development and production activities.” In the areas in which we operate, we face higherabove-ground risks necessitating higher expected returns, the requirement for increased capital expendituresdue to a general lack of infrastructure and underdeveloped oil and gas industries, and increasedtransportation expenses due to geographic remoteness, which either require a single well to be exceptionallyproductive, or the existence of multiple successful wells, to allow for the development of a commerciallyviable field. See “—Our operations may be adversely affected by political and economic circumstances in thecountries in which we operate.” Furthermore, if our actual drilling and development costs are significantlymore than our estimated costs, we may not be able to continue our business operations as proposed and couldbe forced to modify our plan of operation.
Development drilling may not result in commercially productive quantities of oil and gas reserves.
Our exploration success has provided us with major development projects on which we are movingforward, and any future exploration discoveries will also require significant development efforts to bring toproduction. We must successfully execute our development projects, including development drilling, in orderto generate future production and cash flow. However, development drilling is not always successful andthe profitability of development projects may change over time.
For example, in new development projects available data may not allow us to completely know theextent of the reservoir or choose the best locations for drilling development wells. A development well wedrill may be a dry hole or result in noncommercial quantities of hydrocarbons. All costs of developmentdrilling and other development activities are capitalized, even if the activities do not result in commerciallyproductive quantities of hydrocarbon reserves. This puts a property at higher risk for future impairment ifcommodity prices decrease or operating or development costs increase.
Our identified drilling and infrastructure locations are scheduled out over time, making them susceptible touncertainties that could materially alter the occurrence or timing of their drilling or infrastructure installationor modification.
Our management team has identified and scheduled drilling locations and possible infrastructurelocations on our license and lease areas over a multi-year period. Our ability to drill and develop theselocations depends on a number of factors, including the availability of equipment and capital, approval by
39

block or lease partners and national and state regulators, seasonal conditions, oil prices, assessment of risks,costs and drilling results. For example, a shutdown of the U.S. federal government could delay the regulatoryreview and approval process associated with drilling or developmental activities within our license areas in theU.S. Gulf of Mexico. The final determination on whether to drill or develop any of these locations will bedependent upon the factors described elsewhere in this report as well as, to some degree, the results of ourdrilling and production activities with respect to our established wells and drilling locations. Because of theseuncertainties, we do not know if the drilling locations we have identified will be drilled or infrastructureinstalled or modified within our expected timeframe or at all or if we will be able to economically producehydrocarbons from these or any other potential drilling locations. As such, our actual drilling and developmentactivities may be materially different from our current expectations, which could adversely affect ourresults of operations and financial condition.
A substantial or extended decline in both global and local oil and natural gas prices may adversely affect ourbusiness, financial condition and results of operations.
The prices that we will receive for our oil and natural gas will significantly affect our revenue, profitability,access to capital and future growth rate. Historically, the oil and natural gas markets have been volatile andwill likely continue to be volatile in the future. Oil prices experienced significant and sustained declines in thepast few years and will likely continue to be volatile in the future. The prices that we will receive for ourproduction and the levels of our production depend on numerous factors. These factors include, but are notlimited to, the following:
• changes in supply and demand for oil and natural gas;
• the actions of the Organization of the Petroleum Exporting Countries;
• speculation as to the future price of oil and natural gas and the speculative trading of oil and naturalgas futures contracts;
• global economic conditions;
• political and economic conditions, including embargoes in oil-producing countries or affecting otheroil-producing activities, particularly in the Middle East, Africa, Russia and Central and SouthAmerica;
• the continued threat of terrorism and the impact of military and other action, including U.S.military operations in the Middle East;
• the level of global oil and natural gas exploration and production activity;
• the level of global oil inventories and oil refining capacities;
• weather conditions and natural or man-made disasters;
• technological advances affecting energy consumption;
• governmental regulations and taxation policies;
• proximity and capacity of transportation facilities;
• the development and exploitation of alternative fuels or energy sources;
• the price and availability of competitors’ supplies of oil and natural gas; and
• the price, availability or mandated use of alternative fuels or energy sources.
Lower oil prices may not only reduce our revenues but also may limit the amount of oil that we canproduce economically. A substantial or extended decline in oil and natural gas prices may materially andadversely affect our future business, financial condition, results of operations, liquidity or ability to financeplanned capital expenditures.
40

Under the terms of our various petroleum contracts, we are contractually obligated to drill wells and declareany discoveries in order to retain exploration and production rights. In the competitive market for our licenseareas, failure to drill these wells or declare any discoveries may result in substantial license renewal costs or lossof our interests in the undeveloped parts of our license areas, which may include certain of our prospects.
In order to protect our exploration and production rights in our license areas, we must meet variousdrilling and declaration requirements. In general, unless we make and declare discoveries within certain timeperiods specified in our various petroleum contracts and licenses, our interests in the undeveloped parts ofour license areas may lapse. Should the prospects yield discoveries, we cannot assure you that we will not facedelays in the appraisal and development of these prospects or otherwise have to relinquish these prospects.The costs to maintain petroleum contracts over such areas may fluctuate and may increase significantly sincethe original term, and we may not be able to renew or extend such petroleum contracts on commerciallyreasonable terms or at all. Our actual drilling activities may therefore materially differ from our currentexpectations, which could adversely affect our business.
Under these petroleum contracts, we have work commitments to perform exploration and other relatedactivities. Failure to do so may result in our loss of the licenses. As of December 31, 2019, we have unfulfilleddrilling obligations in one of our Mauritania petroleum contracts. In certain other petroleum contracts, weare in the initial exploration phase, some of which have certain obligations that have yet to be fulfilled. Overthe course of the next several years, we may choose to enter into the next phase of those petroleumcontracts which will likely include firm obligations to drill wells. Failure to execute our obligations mayresult in our loss of the licenses.
The Exploration Period of each of the WCTP and DT petroleum contracts has expired. Pursuant tothe terms of such petroleum contracts, while we and our respective block partners have certain rights tonegotiate new petroleum contracts with respect to the WCTP Relinquishment Area and DT RelinquishmentArea, we cannot assure you that we will determine to enter any such new petroleum contracts. For each ofour petroleum contracts, we cannot assure you that any renewals or extensions will be granted or whether anynew agreements will be available on commercially reasonable terms, or, in some cases, at all. For additionaldetail regarding the status of our operations with respect to our various petroleum contracts, please see“Item 1. Business—Operations by Geographic Area.”
The inability of one or more third parties who contract with us to meet their obligations to us may adverselyaffect our financial results.
We may be liable for certain costs if third parties who contract with us are unable to meet theircommitments under such agreements. We are currently exposed to credit risk through joint interestreceivables from our block and/or unit partners. If any of our partners in the blocks or unit in which wehold interests are unable to fund their share of the exploration and development expenses, we may be liablefor such costs. In the past, certain of our partners have not paid their share of block costs in the timeframe required by the joint operating agreements for these blocks. This has resulted in such party being indefault, which in return requires Kosmos and its non-defaulting block partners to pay their proportionateshare of the defaulting party’s costs during the default period. Should a default not be cured, Kosmos couldbe required to pay its share of the defaulting party’s costs going forward.
In addition, we contract with third parties to conduct drilling and related services on our developmentprojects and exploration prospects. Such third parties may not perform the services they provide us onschedule or within budget. Furthermore, the drilling equipment, facilities and infrastructure owned andoperated by the third parties we contract with is highly complex and subject to malfunction and breakdown.Any malfunctions or breakdowns may be outside our control and result in delays, which could be substantial.Any delays in our drilling campaign caused by equipment, facility or equipment malfunction or breakdowncould materially increase our costs of drilling and cause an adverse effect on our business, financialposition and results of operations.
Our principal exposure to credit risk will be through receivables resulting from the sale of our oil,which we currently sell to an oil marketing company, and to cover our commodity derivatives contracts. Theinability or failure of our significant customers or counterparties to meet their obligations to us or theirinsolvency or liquidation may adversely affect our financial results. In addition, our oil and natural gas
41

derivative arrangements expose us to credit risk in the event of nonperformance by counterparties. Jointinterest receivables arise from our block partners. The inability or failure of third parties we contract withto meet their obligations to us or their insolvency or liquidation may adversely affect our financial results. Weare unable to predict sudden changes in creditworthiness or ability to perform. Even if we do accuratelypredict sudden changes, our ability to negate the risk may be limited and we could incur significant financiallosses.
The unit partners’ respective interests in the Jubilee Unit and Greater Tortue Ahmeyim Unit are subject toredetermination and our interests in each such unit may decrease as a result.
The interests in and development of the Jubilee Field are governed by the terms of the Jubilee UUOA.The parties to the Jubilee UUOA, the collective interest holders in each of the WCTP and DT Blocks, initiallyagreed that interests in the Jubilee Unit will be shared equally, with each block deemed to contribute 50%of the area of such unit. The respective interests in the Jubilee Unit were therefore initially determined by therespective interests in such contributed block interests. Pursuant to the terms of the Jubilee UUOA,the percentage of such contributed interests is subject to a process of redetermination once sufficientdevelopment work has been completed in the unit. The initial redetermination process was completed onOctober 14, 2011. As a result of the initial redetermination process, the tract participation was determinedto be 54.4% for the WCTP Block and 45.6% for the DT Block. Our Unit Interest (participating interest in theJubilee Unit) was increased from 23.5% to 24.1%. An additional redetermination could occur sometime ifrequested by a party that holds greater than a 10% interest in the Jubilee Unit. We cannot assure you that anyredetermination pursuant to the terms of the Jubilee UUOA will not negatively affect our interests in theJubilee Unit or that such redetermination will be satisfactorily resolved.
The interests in and development of the Greater Tortue Ahmeyim Field are governed by the terms ofthe GTA UUOA. The parties to the GTA UUOA, the collective interest holders in each of the MauritaniaBlock C8 and Senegal Saint Louis Offshore Profond blocks, initially agreed that interests in the GreaterTortue Ahmeyim Unit will be shared equally, with each block deemed to contribute 50% of the area ofsuch unit. The respective interests in the Greater Tortue Ahmeyim Unit were therefore initially determinedby the respective interests in such contributed block interests. Pursuant to the terms of the GTA UUOA,the percentage of such contributed interests is subject to a process of redetermination once sufficientdevelopment work has been completed in the unit. We cannot assure you that any redetermination pursuantto the terms of the GTA UUOA will not negatively affect our interests in the Greater Tortue AhmeyimUnit or that such redetermination will be satisfactorily resolved.
We are not, and may not be in the future, the operator on all of our license areas and facilities and do not, andmay not in the future, hold all of the working interests in certain of our license areas. Therefore, we have reducedcontrol over the timing of exploration or development efforts, associated costs, and the rate of production ofany non-operated and to an extent, any non-wholly-owned, assets.
As we carry out our exploration and development programs, we have arrangements with respect toexisting license areas and may have agreements with respect to future license areas that result in a greaterproportion of our license areas being operated by others. Currently, we are not the operator of the JubileeUnit, the TEN fields, Ceiba and Okume, the Greater Tortue Ahmeyim Unit or certain producing fields in theU.S. Gulf of Mexico and do not hold operatorship in certain other offshore blocks. In addition, ouragreements with BP and Chevron contemplate that operatorship will be transitioned fully to these companiesin our Cote d’Ivoire (BP) and Suriname (Chevron) acreage upon a commercial discovery. As a result, wemay have limited ability to exercise influence over the operations of the discoveries or prospects operated byour block or unit partners, or which are not wholly-owned by us, as the case may be. Dependence on blockor unit partners could prevent us from realizing our target returns for those discoveries or prospects. Further,because we do not have majority ownership in all of our properties, we may not be able to control thetiming, or the scope, of exploration or development activities or the amount of capital expenditures and,therefore, may not be able to carry out one of our key business strategies of minimizing the cycle time betweendiscovery and initial production. The success and timing of exploration and development activities willdepend on a number of factors that will be largely outside of our control, including:
• the timing and amount of capital expenditures;
42

• if the activity is operated by one of our block partners, the operator’s expertise and financialresources;
• approval of other block partners in drilling wells;
• the scheduling, pre-design, planning, design and approvals of activities and processes;
• selection of technology;
• the available capacity of processing facilities and related pipelines; and
• the rate of production of reserves, if any.
This limited ability to exercise control over the operations on our license areas may cause a materialadverse effect on our financial condition and results of operations.
Our estimated proved reserves are based on many assumptions that may turn out to be inaccurate. Anysignificant inaccuracies in these reserve estimates or underlying assumptions will materially affect the quantitiesand present value of our reserves.
The process of estimating oil and natural gas reserves is technically complex. It requires interpretationsof available technical data and many assumptions, including those relating to current and future economicconditions and commodity prices. Any significant inaccuracies in these interpretations or assumptions couldmaterially affect the estimated quantities and present value of reserves shown in this report. See “Item 1.Business—Our Reserves” for information about our estimated oil and natural gas reserves and the presentvalue of our net revenues at a 10% discount rate (“PV-10”) and Standardized Measure of discounted futurenet revenues (as defined herein) as of December 31, 2019.
In order to prepare our estimates, we must project production rates and the timing of developmentexpenditures. We must also analyze available geological, geophysical, production and engineering data. Theprocess also requires economic assumptions about matters such as oil and natural gas prices, drilling andoperating expenses, capital expenditures, taxes and availability of funds.
Actual future production, oil and natural gas prices, revenues, taxes, development expenditures,operating expenses and quantities of recoverable oil and natural gas reserves will vary from our estimates.Any significant variance could materially affect the estimated quantities and present value of reserves shownin this report. In addition, we may adjust estimates of proved reserves to reflect production history, resultsof exploration and development, prevailing oil and natural gas prices and other factors, many of which arebeyond our control.
The present value of future net revenues from our proved reserves will not necessarily be the same as thecurrent market value of our estimated oil and natural gas reserves.
You should not assume that the present value of future net revenues from our proved reserves is thecurrent market value of our estimated oil and natural gas reserves. In accordance with the SEC requirements,we have based the estimated discounted future net revenues from our proved reserves on the 12-monthunweighted arithmetic average of the first-day-of-the-month price for the preceding twelve months, adjustedfor an anticipated market premium, without giving effect to derivative transactions. Actual future netrevenues from our oil and natural gas assets will be affected by factors such as:
• actual prices we receive for oil and natural gas;
• actual cost of development and production expenditures;
• derivative transactions;
• the amount and timing of actual production; and
• changes in governmental regulations or taxation.
The timing of both our production and our incurrence of expenses in connection with the developmentand production of oil and natural gas assets will affect the timing and amount of actual future net revenuesfrom proved reserves, and thus their actual present value. In addition, the 10% discount factor we use
43

when calculating discounted future net revenues may not be the most appropriate discount factor based oninterest rates in effect from time to time and risks associated with us or the oil and gas industry in general.Actual future prices and costs may differ materially from those used in the present value estimates includedin this report. Oil prices have recently experienced significant volatility. See “Item 1. Business—Our Reserves.”
We are dependent on certain members of our management and technical team.
Our performance and success largely depend on the ability, expertise, judgment and discretion of ourmanagement and the ability of our technical team to identify, discover, evaluate, develop, and producereserves. The loss or departure of one or more members of our management and technical team could bedetrimental to our future success. Additionally, a significant amount of shares in Kosmos held by membersof our management and technical team has vested. There can be no assurance that our management andtechnical team will remain in place. If any of these officers or other key personnel retires, resigns orbecomes unable to continue in their present roles and is not adequately replaced, our results of operationsand financial condition could be materially adversely affected. Our ability to manage our growth, if any, willrequire us to continue to train, motivate and manage our employees and to attract, motivate and retainadditional qualified personnel. Competition for these types of personnel is intense, and we may not besuccessful in attracting, assimilating and retaining the personnel required to grow and operate our businessprofitably.
Our business plan requires substantial additional capital, which we may be unable to raise on acceptable termsor at all in the future, which may in turn limit our ability to develop our exploration, appraisal, development andproduction activities.
We expect our capital outlays and operating expenditures to be substantial as we expand our operations.Obtaining seismic data, as well as exploration, appraisal, development and production activities entailconsiderable costs, and we may need to raise substantial additional capital through additional debt financing,strategic alliances or future private or public equity offerings if our cash flows from operations, or thetiming of, are not sufficient to cover such costs.
Our future capital requirements will depend on many factors, including:
• the scope, rate of progress and cost of our exploration, appraisal, development and productionactivities;
• the success of our exploration, appraisal, development and production activities;
• oil and natural gas prices;
• our ability to locate and acquire hydrocarbon reserves;
• our ability to produce oil or natural gas from those reserves;
• the terms and timing of any drilling and other production-related arrangements that we may enterinto;
• the cost and timing of governmental approvals and/or concessions; and
• the effects of competition by other companies operating in the oil and gas industry.
We do not currently have any commitments for future external funding beyond the capacity of ourcommercial debt facility and revolving credit facility. Additional financing may not be available on favorableterms, or at all. Even if we succeed in selling additional equity securities to raise funds, at such time theownership percentage of our existing shareholders would be diluted, and new investors may demand rights,preferences or privileges senior to those of existing shareholders. If we raise additional capital throughdebt financing, the financing may involve covenants that restrict our business activities. If we choose tofarm-out interests in our licenses, we would dilute our ownership interest subject to the farm-out and anypotential value resulting therefrom, and may lose operating control or influence over such license areas.
Assuming we are able to commence exploration, appraisal, development and production activities orsuccessfully exploit our licenses during the exploratory term, our interests in our licenses (or the development/production area of such licenses as they existed at that time, as applicable) could extend beyond the term
44

set for the exploratory phase of the license to a fixed period or life of production, depending on thejurisdiction. If we are unable to meet our well commitments and/or declare commerciality of the prospectiveareas of our licenses during this time, we may be subject to significant potential forfeiture of all or part ofthe relevant license interests. If we are not successful in raising additional capital, we may be unable tocontinue our exploration and production activities or successfully exploit our license areas, and we may losethe rights to develop these areas. See “—Under the terms of our various license agreements, we arecontractually obligated to drill wells and declare any discoveries in order to retain exploration and productionrights. In the competitive market for our license areas, failure to declare any discoveries and therebyestablish development areas may result in substantial license renewal costs or loss of our interests in theundeveloped parts of our license areas, which may include certain of our prospects.”
All of our proved reserves, oil production and cash flows from operations are currently associated withour licenses offshore Ghana, Equatorial Guinea, and U.S. Gulf of Mexico. Should any event occur whichadversely affects such proved reserves, oil production and cash flows from these licenses, including, withoutlimitation, any event resulting from the risks and uncertainties outlined in this “Risk Factors” section,our business, financial condition, results of operations, liquidity or ability to finance planned capitalexpenditures may be materially and adversely affected.
We may be required to take write-downs of the carrying values of our oil and natural gas assets as a result ofdecreases in oil and natural gas prices, and such decreases could result in reduced availability under our corporaterevolver and commercial debt facility.
We capitalize costs to acquire, find and develop our oil and natural gas properties under the successfulefforts accounting method. Under such method, we are required to perform impairment tests on our assetsperiodically and whenever events or changes in circumstances warrant a review of our assets. Based on specificmarket factors and circumstances at the time of prospective impairment reviews, and the continuingevaluation of appraisal and development plans, production data, oil and natural gas prices, economics andother factors, we may be required to write down the carrying value of our oil and natural gas assets. Awrite-down constitutes a non-cash charge to earnings. As a result of the recent drop in oil and natural gasprices, we may incur future write-downs and charges should prices remain at low levels.
In addition, our borrowing base under the commercial debt facility is subject to periodic redeterminations.We could be forced to repay a portion of our borrowings under the commercial debt facility due toredeterminations of our borrowing base. Redeterminations may occur as a result of a variety of factors,including oil and natural gas commodity price assumptions, assumptions regarding future production fromour oil and natural gas assets, operating costs and tax burdens or assumptions concerning our futureholdings of proved reserves. If we are forced to do so, we may not have sufficient funds to make suchrepayments. If we do not have sufficient funds and are otherwise unable to negotiate renewals of ourborrowings or arrange new financing, we may have to sell significant assets. Any such sale could have amaterial adverse effect on our business and financial results.
We may not be able to commercialize our interests in any natural gas produced from our license areas.
The development of the market for natural gas in our international license areas is in its early stages.Currently the infrastructure to transport and process natural gas on commercial terms is limited and theexpenses associated with constructing such infrastructure ourselves may not be commercially viable givenlocal prices currently paid for natural gas. Accordingly, there may be limited or no value derived from anynatural gas produced from our license areas.
In Ghana, we currently produce associated gas from the Jubilee and TEN fields. A gas pipeline fromthe Jubilee Field has been constructed to transport such natural gas for processing and sale. However, wegranted the Government of Ghana the first 200 Bcf of natural gas exported from the Jubilee Field to shoreat zero cost. Through December 31, 2019, the Jubilee partners have provided approximately 105 Bcf fromthe Jubilee Field to Ghana. Thus, in Ghana, it is forecasted to be a few years before we are able tocommercialize the Jubilee Field natural gas. We do not currently book proved gas reserves associated withnatural gas sales from the Jubilee Field in Ghana. However, we expect to book gas reserves upon finalizationand execution of a gas sales agreement for such Jubilee Field natural gas that will have a price associatedwith it. A gas pipeline from the TEN fields to the Jubilee Field was completed in the first quarter of 2017 to
45

transport associated natural gas as well as non-associated natural gas for processing and sale. We finalizedthe TAG GSA, and as a result, we booked proved gas reserves for the associated natural gas from the TENfields in Ghana. If and when a gas sales agreement and the related infrastructure are in place for the TENfields non-associated gas, a portion of the remaining gas may be recognized as reserves.
In Mauritania and Senegal, we plan to export the majority of our gas resource to the LNG market.However, that plan is contingent on making final investment decisions on our gas discoveries and constructingthe necessary infrastructure to produce, liquefy and transport the gas to the market as well as findingLNG purchasers. Additionally, such plans are contingent upon receipt of required partner and governmentapprovals.
Our inability to access appropriate equipment and infrastructure in a timely manner may hinder our access tooil and natural gas markets or delay our oil and natural gas production.
Our ability to market our oil and natural gas production will depend substantially on the availabilityand capacity of processing facilities, oil and LNG tankers and other infrastructure, including FPSOs, ownedand operated by third parties. Our failure to obtain such facilities on acceptable terms could materiallyharm our business. We also rely on continuing access to drilling rigs suitable for the environment in whichwe operate. The delivery of drilling rigs may be delayed or cancelled, and we may not be able to gain continuedaccess to suitable rigs in the future. We may be required to shut in oil and natural gas wells because of theabsence of a market or because access to processing facilities may be limited or unavailable. If that were tooccur, then we would be unable to realize revenue from those wells until arrangements were made to deliver theproduction to market, which could cause a material adverse effect on our financial condition and results ofoperations. In addition, the shutting in of wells can lead to mechanical problems upon bringing the productionback online, potentially resulting in decreased production and increased remediation costs.
Additionally, the future exploitation and sale of associated and non-associated natural gas and liquidsand LNG will be subject to timely commercial processing and marketing of these products, which dependson the contracting, financing, building and operating of infrastructure by third parties. The Government ofGhana completed the construction and connection of a gas pipeline from the Jubilee Field and thepipeline between the Jubilee and TEN fields to transport such natural gas to the mainland for processingand sale was completed in the first quarter of 2017. However, the uptime of the pipeline and processingfacilities in future periods is not known. In the absence of the continuous removal of large quantities ofnatural gas it is anticipated that we will either need to flare such natural gas in order to maintain crude oilproduction or reduce crude oil production. If we are unable to resolve potential issues related to thecontinuous removal of associated natural gas in large quantities, our oil production will be negativelyimpacted.
We are subject to numerous risks inherent to the exploration and production of oil and natural gas.
Oil and natural gas exploration and production activities involve many risks that a combination ofexperience, knowledge and interpretation may not be able to overcome. Our future will depend on thesuccess of our exploration and production activities and on the development of an infrastructure that willallow us to take advantage of our discoveries. Additionally, many of our license areas are located in deepwater,which generally increases the capital and operating costs, chances of delay, planning time, technicalchallenges and risks associated with oil and natural gas exploration and production activities. See “—Ouroffshore and deepwater operations involve special risks that could adversely affect our results of operation.”As a result, our oil and natural gas exploration and production activities are subject to numerous risks,including the risk that drilling will not result in commercially viable oil and natural gas production. Ourdecisions to purchase, explore or develop discoveries, prospects or licenses will depend in part on the evaluationof seismic data through geophysical and geological analyses, production data and engineering studies, theresults of which are often inconclusive or subject to varying interpretations.
Furthermore, the marketability of expected oil and natural gas production from our discoveries andprospects will also be affected by numerous factors. These factors include, but are not limited to, marketfluctuations of prices (such as recent significant declines in oil and natural gas prices), proximity, capacityand availability of drilling rigs and related equipment, qualified personnel and support vessels, processingfacilities, transportation vehicles and pipelines, equipment availability, access to markets and government
46

regulations (including, without limitation, regulations relating to prices, taxes, royalties, allowable production,domestic supply requirements, importing and exporting of oil and natural gas, the ability to flare or ventnatural gas, health and safety matters, environmental protection and climate change). The effect of thesefactors, individually or jointly, may result in us not receiving an adequate return on invested capital.
In the event that our currently undeveloped discoveries and prospects are developed and becomeoperational, they may not produce oil and natural gas in commercial quantities or at the costs anticipated,and our projects may cease production, in part or entirely, in certain circumstances. Discoveries may becomeuneconomic as a result of an increase in operating costs to produce oil and natural gas. Our actual operatingcosts and rates of production may differ materially from our current estimates. Moreover, it is possiblethat other developments, such as increasingly strict environmental, climate change, health and safety lawsand regulations and enforcement policies thereunder and claims for damages to property or persons resultingfrom our operations, could result in substantial costs and liabilities, delays, an inability to complete thedevelopment of our discoveries or the abandonment of such discoveries, which could cause a material adverseeffect on our financial condition and results of operations.
We are subject to drilling and other operational and environmental risks and hazards.
The oil and natural gas business involves a variety of risks, including, but not limited to:
• fires, blowouts, spills, cratering and explosions;
• mechanical and equipment problems, including unforeseen engineering complications;
• uncontrolled flows or leaks of oil, well fluids, natural gas, brine, toxic gas or other pollutants orhazardous materials;
• gas flaring operations;
• marine hazards with respect to offshore operations;
• formations with abnormal pressures;
• pollution, environmental risks, and geological problems; and
• weather conditions and natural or man-made disasters.
These risks are particularly acute in deepwater drilling and exploration. Any of these events couldresult in loss of human life, significant damage to property, environmental or natural resource damage,impairment, delay or cessation of our operations, lower production rates, adverse publicity, substantial lossesand civil or criminal liability. We expect to maintain insurance against some, but not all, of these risks andlosses. The occurrence of any of these events, whether or not covered by insurance, could have a materialadverse effect on our financial position and results of operations.
Our operations may be materially adversely affected by tropical storms and hurricanes.
Tropical storms, hurricanes and the threat of tropical storms and hurricanes often result in theshutdown of operations, particularly in the U.S. Gulf of Mexico, as well as operations within the path andthe projected path of the tropical storms or hurricanes. In addition, climate change could result in an increasein the frequency and severity of tropical storms, hurricanes or other extreme weather events. Weatherevents have caused significant disruption to the operations of offshore and coastal facilities in the U.S. Gulfof Mexico region. In the future, during a shutdown period, we may be unable to access well sites and ourservices may be shut down. Additionally, tropical storms or hurricanes may cause evacuation of personneland damage to our platforms and other equipment, which may result in suspension of our operations. Theshutdowns, related evacuations and damage can create unpredictability in activity and utilization rates, aswell as delays and cost overruns, which could have a material adverse effect on our business, financial conditionand results of operations.
The development schedule of oil and natural gas projects, including the availability and cost of drilling rigs,equipment, supplies, personnel and oilfield services, is subject to delays and cost overruns.
Historically, some oil and natural gas development projects have experienced delays and capital costincreases and overruns due to, among other factors, the unavailability or high cost of drilling rigs and other
47

essential equipment, supplies, personnel and oilfield services, as well as mechanical and technical issues. Thecost to develop our projects has not been fixed and remains dependent upon a number of factors, includingthe completion of detailed cost estimates and final engineering, contracting and procurement costs. Ourconstruction and operation schedules may not proceed as planned and may experience delays or costoverruns. Any delays may increase the costs of the projects, requiring additional capital, and such capitalmay not be available in a timely and cost-effective fashion.
Our offshore and deepwater operations involve special risks that could adversely affect our results of operations.
Offshore operations are subject to a variety of operating risks specific to the marine environment, suchas capsizing, sinking, collisions and damage or loss to pipeline, subsea or other facilities or from weatherconditions. We could incur substantial expenses that could reduce or eliminate the funds available forexploration, development or license acquisitions, or result in loss of equipment and license interests.
Deepwater exploration generally involves greater operational and financial risks than exploration inshallower waters. Deepwater drilling generally requires more time and more advanced drilling technologies,involving a higher risk of equipment failure and usually higher drilling costs. In addition, there may beproduction risks of which we are currently unaware. If we participate in the development of new subseainfrastructure and use floating production systems to transport oil from producing wells, these operationsmay require substantial time for installation or encounter mechanical difficulties and equipment failures thatcould result in loss of production, significant liabilities, cost overruns or delays. For example, we haveexperienced mechanical issues in the Jubilee Field, including failures of its gas and water injection facilitieson the FPSO, and the turret bearing issue on the FPSO. The equipment downtime caused by these mechanicalissues negatively impacted oil production during the year.
Furthermore, deepwater operations generally, and operations in Africa and South America, inparticular, lack the physical and oilfield service infrastructure present in other regions. As a result, asignificant amount of time may elapse between a deepwater discovery and the marketing of the associatedoil and natural gas, increasing both the financial and operational risks involved with these operations. Becauseof the lack and high cost of this infrastructure, further discoveries we may make in Africa and SouthAmerica may never be economically producible.
In addition, in the event of a well control incident, containment and, potentially, cleanup activities foroffshore drilling are costly. The resulting regulatory costs or penalties, and the results of third party lawsuits,as well as associated legal and support expenses, including costs to address negative publicity, could wellexceed the actual costs of containment and cleanup. As a result, a well control incident could result insubstantial liabilities, and have a significant negative impact on our earnings, cash flows, liquidity, financialposition, and stock price.
We have had disagreements with host governments regarding certain of our rights and responsibilities and mayhave future disagreements with our host governments.
There can be no assurance that future disagreements will not arise with any host government and/ornational oil companies that may have a material adverse effect on our exploration, development or productionactivities, our ability to operate, our rights under our licenses and local laws or our rights to monetize ourinterests.
As an example, multiple discovered fields and a significant portion of our proved reserves are locatedoffshore Ghana. The WCTP petroleum contract, the DT petroleum contract and the Jubilee UUOA coverthe two blocks and the Jubilee and TEN fields that form the basis of our current operations in Ghana.Pursuant to these petroleum contracts, most significant decisions, including our plans for developmentand annual work programs, must be approved by GNPC, the Ghanaian Revenue Authority (the “GRA”),the Petroleum Commission and/or Ghana’s Ministry of Energy. We have previously had disagreements withthe Ministry of Energy and GNPC regarding certain of our rights and responsibilities under thesepetroleum contracts, the 1984 Ghanaian Petroleum Law and the Internal Revenue Act, 2000 (Act 592) (the“Ghanaian Tax Law”). These included disagreements over sharing information with prospective purchasersof our interests, pledging our interests to finance our development activities, potential liabilities arisingfrom discharges of small quantities of drilling fluids into Ghanaian territorial waters, the failure to approve
48

the proposed sale of our Ghanaian assets, assertions that could be read to give rise to taxes or otherpayments payable under the Ghanaian Tax Law, failure to approve PoDs relating to certain discoveriesoffshore Ghana and the relinquishment of certain exploration areas on our licensed blocks offshore Ghana.The resolution of certain of these disagreements required us to pay agreed settlement costs to GNPCand/or the government of Ghana.
The geographic locations of our licenses in Africa and South America subject us to an increased risk of loss ofrevenue or curtailment of production from factors specifically affecting those areas.
A large portion of our current exploration licenses are located in Africa and South America. Some orall of these licenses could be affected should any region experience any of the following factors (amongothers):
• severe weather, natural or man-made disasters or acts of God;
• delays or decreases in production, the availability of equipment, facilities, personnel or services;
• delays or decreases in the availability of capacity to transport, gather or process production;
• military conflicts, civil unrest or political strife; and/or
• international border disputes.
For example, oil and natural gas operations in our license areas in Africa and South America may besubject to higher political and security risks than those operations under the sovereignty of the UnitedStates. We plan to maintain insurance coverage for only a portion of the risks we face from doing businessin these regions. There also may be certain risks covered by insurance where the policy does not reimburse usfor all of the costs related to a loss.
Further, as many of our licenses are concentrated in the same geographic area, a number of ourlicenses could experience the same conditions at the same time, resulting in a relatively greater impact onour results of operations than they might have on other companies that have a more diversified portfolio oflicenses.
Our operations may be adversely affected by political and economic circumstances in the countries and regionsin which we operate.
Oil and natural gas exploration, development and production activities are subject to political andeconomic uncertainties (including but not limited to the results of the 2020 U.S. presidential election,changes in energy policies or the personnel administering them), changes in laws and policies governingoperations of foreign-based companies, expropriation of property, cancellation or modification of contractrights, revocation of consents, approvals or royalty regimes, obtaining various approvals from regulators,foreign exchange restrictions, currency fluctuations, royalty increases and other risks arising out of foreigngovernmental sovereignty, as well as risks of loss due to civil strife, acts of war, guerrilla activities, terrorism,acts of sabotage, territorial disputes and insurrection. In addition, we are subject both to uncertainties inthe application of the tax laws in the countries in which we operate and to possible changes in such tax laws(or the application thereof), each of which could result in an increase in our tax liabilities. These risks maybe higher in the developing countries in which we conduct a majority of our activities, as it is the case inGhana, where the GRA previously disputed certain tax deductions we had claimed in prior fiscal years’Ghanaian tax returns as non-allowable under the terms of the Ghanaian Petroleum Income Tax Law, as wellas non-payment of certain transactional taxes and other payments. We have faced similar tax relateddisputes with the Senegal Tax Administration.
Additionally, monetary sector reform initiatives in the West African Monetary Union and the CentralAfrican Economic and Monetary Union, such as through the implementation of Regulation 02/18/ECMAC/UMAC/CM by the Bank of Central African States could restrict or prevent payments being made in aforeign currency; impose restrictions on offshore and onshore foreign currency accounts; and/or restrict orprevent the repatriation of revenues and debt proceeds. The implementation or realization of any of theforegoing could have an adverse impact on our financial condition and results of operations.
49

Our operations in these areas increase our exposure to risks of war, local economic conditions, politicaldisruption, civil disturbance, expropriation, piracy, tribal conflicts and governmental policies that may:
• disrupt our operations;
• require us to incur greater costs for security;
• restrict the movement of funds or limit repatriation of profits;
• lead to U.S. government or international sanctions; or
• limit access to markets for periods of time.
Some countries in the geographic areas where we operate have experienced political instability in thepast or are currently experiencing instability. Disruptions may occur in the future, and losses caused bythese disruptions may occur that will not be covered by insurance. Consequently, our exploration, developmentand production activities may be substantially affected by factors which could have a material adverseeffect on our results of operations and financial condition. Furthermore, in the event of a dispute arisingfrom non-U.S. operations, we may be subject to the exclusive jurisdiction of courts outside the United Statesor may not be successful in subjecting non-U.S. persons to the jurisdiction of courts in the United Statesor international arbitration, which could adversely affect the outcome of such dispute.
Our operations may also be adversely affected by laws and policies of the jurisdictions, including thejurisdictions where our oil and gas operating activities are located as well as the United Kingdom and theCayman Islands and other jurisdictions in which we do business, that affect foreign trade and taxation.Changes in any of these laws or policies or the implementation thereof could materially and adversely affectour financial position, results of operations and cash flows.
More comprehensive and stringent regulation in the U.S. Gulf of Mexico has significantly increased costs anddelays in offshore oil and natural gas exploration and production operations.
In the U.S. Gulf of Mexico, there have been a series of regulatory initiatives developed and implementedat the federal level to address the direct impact of the incident and to prevent similar incidents in the future.Beginning in 2010 and continuing through the present, the Department of Interior (“DOI”) through theBOEM and the Bureau of Safety and Environmental Enforcement (“BSEE”), has issued a variety ofregulations and Notices to Lessees and Operators (“NTLs”), intended to impose additional safety, permittingand certification requirements applicable to exploration, development and production activities in the U.S.Gulf of Mexico. These regulatory initiatives effectively slowed down the pace of drilling and productionoperations in the U.S. Gulf of Mexico as adjustments were being made in operating procedures, certificationrequirements and lead times for inspections, drilling applications and permits, and exploration and productionplan reviews, and as the federal agencies evolved into their present day bureaus. On April 17, 2015, BSEEpublished a proposed rule that would impose more stringent standards on blowout preventers (“BOP”). InApril 2016, BSEE issued a final version of this rule effective July 2016, though some requirements of the rulehave delayed compliance deadlines. The final rule addresses the full range of systems and equipmentassociated with well control operations, focusing on requirements for BOPs, well design, well control casing,cementing, real-time monitoring and subsea containment. Key features of the well control regulationsinclude requirements for BOPs, double shear rams, third-party reviews of equipment, real time monitoringdata, safe drilling margins, centralizers, inspections and other reforms related to well design and control,casing, cementing and subsea containment. On March 28, 2017, President Trump signed an executiveorder (the “March 2017 Executive Order”) directing federal agencies to initiate rulemakings to suspend,revise or rescind certain regulations relating to the energy industry as necessary to ensure consistency withthe goals of energy independence, economic growth and cost-effective environmental regulation. In responseto the March 2017 Executive Order and a subsequent executive order issued by President Trump inApril 2017 focusing on offshore energy development, in May 2018, BSEE published a proposal to relaxcertain requirements of the July 2016 rule. The proposed rule’s comment period expired on August 6, 2018,but a final rule has not yet been published; this rule is likely to be subject to legal challenges.
In addition to the array of new or revised safety, permitting and certification requirements developedand implemented by the DOI in the past few years, there have been a variety of proposals to change existinglaws and regulations that could affect offshore development and production, such as, for example, a
50

proposal to significantly increase the minimum financial responsibility demonstration required under theOil Pollution Act of 1990. To the extent the existing regulatory initiatives implemented and pursued over thepast few years or any future restrictions, whether through legislative or regulatory means or increased orbroadened permitting and enforcement programs, foster uncertainties or delays in our offshore oil and naturalgas development or exploration activities, then such conditions may have a material adverse effect on ourbusiness, financial condition and results of operations.
The oil and gas industry, including the acquisition of exploratory licenses, is intensely competitive and many ofour competitors possess and employ substantially greater resources than us.
The international oil and gas industry is highly competitive in all aspects, including the exploration for,and the development of, new license areas. We operate in a highly competitive environment for acquiringexploratory licenses and hiring and retaining trained personnel. Many of our competitors possess and employfinancial, technical and personnel resources substantially greater than us, which can be particularlyimportant in the areas in which we operate. These companies may be better able to withstand the financialpressures of unsuccessful drilling efforts, sustained periods of volatility in financial markets and generallyadverse global and industry-wide economic conditions, and may be better able to absorb the burdensresulting from changes in relevant laws and regulations, which could adversely affect our competitive position.Our ability to acquire additional prospects and to find and develop reserves in the future will depend onour ability to evaluate and select suitable licenses and to consummate transactions in a highly competitiveenvironment. Also, there is substantial competition for available capital for investment in the oil and gasindustry. As a result of these and other factors, we may not be able to compete successfully in an intenselycompetitive industry, which could cause a material adverse effect on our results of operations and financialcondition.
Participants in the oil and gas industry are subject to numerous laws, regulations, and other legislativeinstruments that can affect the cost, manner or feasibility of doing business.
Exploration and production activities in the oil and gas industry are subject to local laws and regulations.We may be required to make large expenditures to comply with governmental laws and regulations, particularlyin respect of the following matters:
• licenses for drilling operations;
• tax increases, including retroactive claims;
• unitization of oil accumulations;
• local content requirements (including the mandatory use of local partners and vendors); and
• safety, health and environmental requirements, liabilities and obligations, including those related toremediation, investigation or permitting.
Under these and other laws and regulations, we could be liable for personal injuries, property damageand other types of damages. Failure to comply with these laws and regulations also may result in thesuspension or termination of our operations and subject us to administrative, civil and criminal penalties.Moreover, these laws and regulations could change, or their interpretations could change, in ways that couldsubstantially increase our costs. These risks may be higher in the developing countries in which we conducta majority of our operations, where there could be a lack of clarity or lack of consistency in the application ofthese laws and regulations. Any resulting liabilities, penalties, suspensions or terminations could have amaterial adverse effect on our financial condition and results of operations.
For example, Ghana’s Parliament has enacted the Petroleum Revenue Management Act, the PetroleumCommission Act of 2011, and the 2016 Ghanaian Petroleum Law. There can be no assurance that these lawswill not seek to retroactively, either on their face or as interpreted, modify the terms of the agreementsgoverning our license interests in Ghana, including the WCTP and DT petroleum contracts and the JubileeUUOA, require governmental approval for transactions that effect a direct or indirect change of controlof our license interests or otherwise affect our current and future operations in Ghana. Any such changes
51

may have a material adverse effect on our business. We also cannot assure you that government approvalwill not be needed for direct or indirect transfers of our petroleum agreements or interests thereunder basedon existing legislation.
We are subject to numerous health, safety and environmental laws and regulations which may result in materialliabilities and costs.
We are subject to various international, foreign, federal, state and local health, safety and environmentallaws and regulations governing, among other things, the emission and discharge of pollutants into theground, air or water, the generation, storage, handling, use, transportation and disposal of regulated materialsand the health and safety of our employees, contractors and communities in which our assets are located.We are required to obtain environmental permits from governmental authorities for our operations, includingdrilling permits for our wells. We have not been or may not be at all times in complete compliance withthese permits and laws and regulations to which we are subject, and there is a risk such requirements couldchange in the future or become more stringent. If we violate or fail to comply with such requirements, wecould be fined or otherwise sanctioned by regulators, including through the revocation of our permits orthe suspension or termination of our operations. If we fail to obtain, maintain or renew permits in a timelymanner or at all (due to opposition from partners, community or environmental interest groups,governmental delays or other reasons), or if we face additional requirements imposed as a result of changesin or enactment of laws or regulations, such failure to obtain, maintain or renew permits or such changesin or enactment of laws or regulations could impede or affect our operations, which could have a materialadverse effect on our results of operations and financial condition.
We, as an interest owner or as the designated operator of certain of our past, current and futureinterests, discoveries and prospects, could be held liable for some or all health, safety and environmentalcosts and liabilities arising out of our actions and omissions as well as those of our block partners, third-party contractors, predecessors or other operators. To the extent we do not address these costs and liabilitiesor if we do not otherwise satisfy our obligations, our operations could be suspended or terminated. Wehave contracted with and intend to continue to hire third parties to perform services related to our operations.There is a risk that we may contract with third parties with unsatisfactory health, safety and environmentalrecords or that our contractors may be unwilling or unable to cover any losses associated with their acts andomissions. Accordingly, we could be held liable for all costs and liabilities arising out of their acts oromissions, which could have a material adverse effect on our results of operations and financial condition.
We are not fully insured against all risks and our insurance may not cover any or all health, safety orenvironmental claims that might arise from our operations or at any of our license areas. If a significantaccident or other event occurs and is not covered by insurance, such accident or event could have a materialadverse effect on our results of operations and financial condition.
Releases of regulated substances may occur and can be significant. Under certain environmental laws,we could be held responsible for all of the costs relating to any contamination at our current or formerfacilities and at any third party waste disposal sites used by us or on our behalf. In addition, offshore oil andnatural gas exploration and production involves various hazards, including human exposure to regulatedsubstances, which include naturally occurring radioactive, and other materials. As such, we could be heldliable for any and all consequences arising out of human exposure to such substances or for other damageresulting from the release of any regulated or otherwise hazardous substances to the environment, propertyor to natural resources, or affecting endangered species.
In addition, we expect continued and increasing attention to climate change issues and emissions ofGHGs, including methane (a primary component of natural gas) and carbon dioxide (a byproduct of oiland natural gas combustion). For example, in April 2016, 195 nations, including Ghana, Mauritania, SaoTome and Principe, Senegal, Suriname and the U.S., signed and officially entered into an international climatechange accord (the “Paris Agreement”). The Paris Agreement calls for signatory countries to set their ownGHG emissions targets, make these emissions targets more stringent over time and be transparent about theGHG emissions reporting and the measures each country will use to achieve its GHG targets. A long-termgoal of the Paris Agreement is to limit global temperature increase to well below two degrees Celsius fromtemperatures in the pre-industrial era. The Paris Agreement is in effect a successor to the Kyoto Protocol,an international treaty aimed at reducing emissions of GHGs, to which various countries and regions,
52

including Ghana, Mauritania, Sao Tome and Principe, Senegal and Suriname, are parties. In 2012, theKyoto Protocol was extended by amendment through 2020 in the so-called Doha Amendment (although, asof early January 2020, the Doha Amendment had still not entered into force because it had not yet beenratified by the requisite number of parties). It cannot be determined at this time what effect the ParisAgreement, and any related GHG emissions targets, regulations or other requirements, will have on ourbusiness, results of operations and financial condition. It also cannot be determined what impact the U.S.’sannounced withdrawal from the Paris Agreement will have on international climate change regulation.This regulatory uncertainty, however, could result in a disruption to our business or operations. The physicalimpacts of climate change in the areas in which our assets are located or in which we otherwise operate,including through increased severity and frequency of storms, floods and other weather events, couldadversely impact our operations or disrupt transportation or other process-related services provided by ourthird-party contractors.
Health, safety and environmental laws are complex, change frequently and have tended to becomeincreasingly stringent over time. Our costs of complying with current and future climate change, health,safety and environmental laws, the actions or omissions of our block partners and third party contractorsand our liabilities arising from releases of, or exposure to, regulated substances may adversely affect ourresults of operations and financial condition. See “Item 1. Business—Environmental Matters” for moreinformation.
We face various risks associated with increased activism against oil and gas exploration and developmentactivities.
Opposition toward oil and gas drilling and development activity has been growing globally. Companiesin the oil and gas industry are often the target of activist efforts from both individuals and non-governmentalorganizations regarding safety, human rights, climate change, environmental matters, sustainability, andbusiness practices. Anti-development activists are working to, among other things, delay or cancel certainoperations such as offshore drilling and development.
Future activist efforts could result in the following:
• delay or denial of drilling permits;
• shortening of lease terms or reduction in lease size;
• restrictions or delays on our ability to obtain additional seismic data;
• restrictions on installation or operation of gathering or processing facilities;
• restrictions on the use of certain operating practices;
• legal challenges or lawsuits;
• individuals requesting more analysis and disclosure of environmental and climate change-relatedrisks;
• damaging publicity about us;
• increased regulation;
• increased costs of doing business;
• reduction in demand for our products; and
• other adverse effects on our ability to develop our properties and/or undertake production operations.
Activism worldwide may continue to increase if the Trump administration in the U.S. is perceived to befollowing, or actually follows, through on President Trump’s campaign commitments to promote increasedfossil fuel exploration and production in the U.S. Our need to incur costs associated with responding to theseinitiatives or complying with any resulting new legal or regulatory requirements resulting from theseactivities that are substantial and not adequately provided for, could have a material adverse effect on ourbusiness, financial condition and results of operations.
53

We may be exposed to assertions concerning or liabilities under the U.S. Foreign Corrupt Practices Act andother anti-corruption laws, and any such assertions or determination that we violated the U.S. Foreign CorruptPractices Act or other such laws could result in significant costs to Kosmos and have a material adverseeffect on our business.
We are subject to the U.S. Foreign Corrupt Practices Act (“FCPA”) and other laws that prohibitimproper payments or offers of payments to foreign government officials and political parties for thepurpose of obtaining or retaining business or otherwise securing an improper business advantage. Inaddition, the United Kingdom has enacted the Bribery Act of 2010, and we may be subject to that legislationunder certain circumstances. We do business and may do additional business in the future in countries andregions in which we may face, directly or indirectly, corrupt demands by officials. We face the risk ofunauthorized payments or offers of payments by one of our employees, contractors or consultants. Ourexisting safeguards and any future improvements may prove to be less than effective in preventing suchunauthorized payments, and our employees and consultants may engage in conduct for which we might beheld responsible. Violations of the FCPA or other anti-corruption laws may result in severe criminal or civilsanctions, and we may be subject to other liabilities, which could negatively affect our business, operatingresults and financial condition. In addition, the U.S. government may seek to hold us liable for successorliability for FCPA violations committed by companies in which we invest in (for example, by way of acquiringequity interests in, participating as a joint venture partner with, acquiring the assets of, or entering intocertain commercial transactions with) or that we acquire.
While we believe we maintain a robust compliance program (including policies, procedures, andcontrols) and corresponding compliance culture, from time-to-time assertions may be raised, including bymedia outlets or competitors, related to our operations or assets which, notwithstanding the lack of veracityof such assertions, may attract the interest of regulators or affect the market perception of Kosmos. OnJune 3, 2019, the BBC Panorama broadcast a television program, which included various assertions concerningthe Cayar Offshore Profond and Saint Louis Offshore Profond Blocks offshore Senegal in which theCompany holds interests, which we believe are inaccurate and misleading. We, BP (block operator) and theGovernment of Senegal all promptly issued independent statements strongly refuting these assertions. Asnoted in our statement, Kosmos conducted extensive pre-transaction due diligence, and we believe weacquired our interests in the blocks in compliance with applicable laws. After the program aired, the SECrequested that Kosmos voluntarily provide certain documents related to the blocks. We are cooperating withthe SEC’s voluntary request for documents to ensure that the SEC has an accurate and completeunderstanding concerning the history of the blocks.
Deterioration in the credit or equity markets could adversely affect us.
We have exposure to different counterparties. For example, we have entered or may enter intotransactions with counterparties in the financial services industry, including commercial banks, investmentbanks, insurance companies, investment funds, and other institutions. These transactions expose us to creditrisk in the event of default by our counterparty. Deterioration in the credit markets may impact the creditratings of our current and potential counterparties and affect their ability to fulfill existing obligations to usand their willingness to enter into future transactions with us. We may have exposure to these financialinstitutions through any derivative transactions we have or may enter into. Moreover, to the extent thatpurchasers of our future production, if any, rely on access to the credit or equity markets to fund theiroperations, there is a risk that those purchasers could default in their contractual obligations to us if suchpurchasers were unable to access the credit or equity markets for an extended period of time.
We may incur substantial losses and become subject to liability claims as a result of future oil and natural gasoperations, for which we may not have adequate insurance coverage.
We intend to maintain insurance against certain risks in the operation of the business we plan todevelop and in amounts in which we believe to be reasonable. Such insurance, however, may containexclusions and limitations on coverage or may not be available at a reasonable cost or at all. For example,we are not insured against political or terrorism risks. We may elect not to obtain insurance if we believe thatthe cost of available insurance is excessive relative to the risks presented. Losses and liabilities arising fromuninsured and underinsured events could materially and adversely affect our business, financial condition and
54

results of operations. Further, even in instances where we maintain adequate insurance coverage, potentialdelays related to receipt of insurance proceeds as well as delays associated with the repair or rebuilding ofdamaged facilities could also materially and adversely affect our business, financial condition and resultsof operations.
We operate in a litigious environment.
Some of the jurisdictions within which we operate have proven to be litigious environments. Oil andgas companies, such as us, can be involved in various legal proceedings, such as title or contractual disputes,in the ordinary course of business.
From time to time, we may become involved in various legal and regulatory proceedings arising in thenormal course of business. We cannot predict the occurrence or outcome of these proceedings with certainty,and if we are unsuccessful in these disputes and any loss exceeds our available insurance, this could have amaterial adverse effect on our results of operations.
Because we maintain a diversified portfolio of assets overseas, the complexity and types of legalprocedures with which we may become involved may vary, and we could incur significant legal and supportexpenses in different jurisdictions. If we are not able to successfully defend ourselves, there could be adelay or even halt in our exploration, development or production activities or other business plans, resultingin a reduction in reserves, loss of production and reduced cash flows. Legal proceedings could result in asubstantial liability and/or negative publicity about us and adversely affect the price of our common stock.In addition, legal proceedings distract management and other personnel from their primary responsibilities.
We face various risks associated with global populism.
Globally, certain individuals and organizations are attempting to focus public attention on incomedistribution, wealth distribution, and corporate taxation levels, and implement income and wealthredistribution policies. These efforts, if they gain political traction, could result in increased taxation onindividuals and/or corporations, as well as, potentially, increased regulation on companies and financialinstitutions. Our need to incur costs associated with responding to these developments or complying with anyresulting new legal or regulatory requirements, as well as any potential increased tax expense, couldincrease our costs of doing business, reduce our financial flexibility and otherwise have a material adverseeffect on our business, financial condition and results of our operations.
Slower global economic growth rates may materially adversely impact our operating results and financialposition.
Market volatility and reduced consumer demand may increase economic uncertainty. Many developedcountries are constrained by long term structural government budget deficits and international financialmarkets and credit rating agencies are pressing for budgetary reform and discipline. This need for fiscaldiscipline is balanced by calls for continuing government stimulus and social spending as a result of theimpacts of the global economic crisis. As major countries implement government fiscal reform, such measures,if they are undertaken too rapidly, could further undermine economic recovery, reducing demand andslowing growth. Impacts of the crisis have spread to China and other emerging markets, which have fueledglobal economic development in recent years, slowing their growth rates, reducing demand, and resulting infurther drag on the global economy.
Global economic growth drives demand for energy from all sources, including hydrocarbons. A lowerfuture economic growth rate is likely to result in decreased demand growth for our crude oil and natural gasproduction. A decrease in demand, notwithstanding impacts from other factors, could potentially result inlower commodity prices, which would reduce our cash flows from operations, our profitability and ourliquidity and financial position.
Increased costs of capital could adversely affect our business.
Our business and operating results can be harmed by factors such as the availability, terms and cost ofcapital, increases in interest rates or a reduction in credit rating. Changes in any one or more of these factors
55

could cause our cost of doing business to increase, limit our access to capital, limit our ability to pursueacquisition opportunities, reduce our cash flows available for drilling and place us at a competitivedisadvantage. Recent and continuing disruptions and volatility in the global financial markets may lead toan increase in interest rates or a contraction in credit availability impacting our ability to finance ouroperations. We require continued access to capital. A significant reduction in the availability of credit couldmaterially and adversely affect our ability to achieve our planned growth and operating results.
Our derivative activities could result in financial losses or could reduce our income.
To achieve more predictable cash flows and to reduce our exposure to adverse fluctuations in the pricesof oil and natural gas, we have and may in the future enter into derivative arrangements for a portion of ouroil and natural gas production, including, but not limited to, puts, collars and fixed-price swaps. In addition,we may in the future, hold swaps designed to hedge our interest rate risk. We do not currently designate any ofour derivative instruments as hedges for accounting purposes and record all derivative instruments on ourbalance sheet at fair value. Changes in the fair value of our derivative instruments are recognized in earnings.Accordingly, our earnings may fluctuate significantly as a result of changes in the fair value of our derivativeinstruments.
Derivative arrangements also expose us to the risk of financial loss in some circumstances, includingwhen:
• production is less than the volume covered by the derivative instruments;
• the counter-party to the derivative instrument defaults on its contract obligations; or
• there is an increase in the differential between the underlying price and actual prices received in thederivative instrument.
In addition, these types of derivative arrangements may limit the benefit we could receive fromincreases in the prices for oil and natural gas or beneficial interest rate fluctuations and may expose us tocash margin requirements.
Our commercial debt facility, revolving credit facility and indenture governing the Senior Notes contain certaincovenants that may inhibit our ability to make certain investments, incur additional indebtedness and engagein certain other transactions, which could adversely affect our ability to meet our future goals.
Our commercial debt facility, revolving credit facility and indenture governing the Senior Notes includecertain covenants that, among other things, restrict:
• our investments, loans and advances and certain of our subsidiaries’ payment of dividends and otherrestricted payments;
• our incurrence of additional indebtedness;
• the granting of liens, other than liens created pursuant to the commercial debt facility, revolvingcredit facility or the indenture governing the Senior Notes and certain permitted liens;
• mergers, consolidations and sales of all or a substantial part of our business or licenses;
• the hedging, forward sale or swap of our production of crude oil or natural gas or other commodities;
• the sale of assets (other than production sold in the ordinary course of business); and
• in the case of the commercial debt facility and the revolving credit facility, our capital expendituresthat we can fund with the proceeds of our commercial debt facility, and revolving credit facility.
Our commercial debt facility and revolving credit facility require us to maintain certain financial ratios,such as debt service coverage ratios and cash flow coverage ratios. All of these restrictive covenants may limitour ability to expand or pursue our business strategies. Our ability to comply with these and other provisionsof our commercial debt facility, revolving credit facility and indenture governing the Senior Notes may beimpacted by changes in economic or business conditions, our results of operations or events beyond ourcontrol. The breach of any of these covenants could result in a default under our commercial debt facility,revolving credit facility and indenture governing the Senior Notes, in which case, depending on the actions
56
taken by the lenders thereunder or their successors or assignees, such lenders could elect to declare allamounts borrowed under our commercial debt facility, revolving credit facility and indenture governing theSenior Notes, together with accrued interest, to be due and payable. If we were unable to repay suchborrowings or interest, our lenders, successors or assignees could proceed against their collateral. If theindebtedness under our commercial debt facility, revolving credit facility and indenture governing the SeniorNotes were to be accelerated, our assets may not be sufficient to repay in full such indebtedness. In addition,the limitations imposed by the commercial debt facility, the revolving credit facility and the indenturegoverning the Senior Notes on our ability to incur additional debt and to take other actions mightsignificantly impair our ability to obtain other financing.
Provisions of our Senior Notes could discourage an acquisition of us by a third party.
Certain provisions of the indenture governing the Senior Notes could make it more difficult or moreexpensive for a third party to acquire us, or may even prevent a third party from acquiring us. For example,upon the occurrence of a “change of control triggering event” (as defined in the indenture governing theSenior Notes), holders of the notes will have the right, at their option, to require us to repurchase all of theirnotes or any portion of the principal amount of such notes. By discouraging an acquisition of us by athird party, these provisions could have the effect of depriving the holders of our common stock of anopportunity to sell their common stock at a premium over prevailing market prices.
Our level of indebtedness may increase and thereby reduce our financial flexibility.
At December 31, 2019, we had $1.4 billion outstanding and $200.0 million of committed undrawncapacity under our commercial debt facility, subject to borrowing base availability. As of December 31,2019, we had zero outstanding under the Corporate Revolver and the undrawn availability was $400.0 million.As of December 31, 2019, there were five outstanding letters of credit totaling $3.1 million under the letterof credit facility agreement and $650.0 million principal amount of Senior Notes outstanding. We alsocurrently have, and may in the future incur, significant off balance sheet obligations. In the future, we mayincur significant indebtedness in order to make investments or acquisitions or to explore, appraise or developour oil and natural gas assets.
Our level of indebtedness could affect our operations in several ways, including the following:
• a significant portion or all of our cash flows, when generated, could be used to service ourindebtedness;
• a high level of indebtedness could increase our vulnerability to general adverse economic andindustry conditions;
• the covenants contained in the agreements governing our outstanding indebtedness will limit ourability to borrow additional funds, dispose of assets, pay dividends and make certain investments;
• a high level of indebtedness may place us at a competitive disadvantage compared to our competitorsthat are less leveraged and therefore, may be able to take advantage of opportunities that ourindebtedness could prevent us from pursuing;
• our debt covenants may also affect our flexibility in planning for, and reacting to, changes in theeconomy and in our industry;
• additional hedging instruments may be required as a result of our indebtedness;
• a high level of indebtedness may make it more likely that a reduction in our borrowing base followinga periodic redetermination could require us to repay a portion of our then-outstanding bankborrowings; and
• a high level of indebtedness may impair our ability to obtain additional financing in the future forworking capital, capital expenditures, acquisitions, general corporate or other purposes.
A high level of indebtedness increases the risk that we may default on our debt obligations. Our abilityto meet our debt obligations and to reduce our level of indebtedness depends on our future performance.General economic conditions, risks associated with exploring for and producing oil and natural gas, oil and
57

natural gas prices and financial, business and other factors affect our operations and our future performance.Many of these factors are beyond our control. We may not be able to generate sufficient cash flows to paythe interest on our indebtedness and future working capital, borrowings or equity financing may not beavailable to pay or refinance such indebtedness. Factors that will affect our ability to raise cash throughan offering of our equity securities or a refinancing of our indebtedness include financial market conditions,the value of our assets and our performance at the time we need capital.
We are a holding company and our ability to make payments on our outstanding indebtedness, including ourSenior Notes and our commercial debt facility, is dependent upon the receipt of funds from our subsidiaries byway of dividends, fees, interest, loans or otherwise.
We are a holding company, and our subsidiaries own all of our assets and conduct all of our operations.Accordingly, our ability to make payments of interest and principal on the Senior Notes and commercial debtfacility will be dependent on the generation of cash flow by our subsidiaries and their ability to make suchcash available to us, by dividend, debt repayment or otherwise. Unless they are guarantors, our subsidiarieswill not have any obligation to pay amounts due on the notes or to make funds available for that purpose.Our subsidiaries may not be able to, or may not be permitted to, make distributions to enable us to makepayments in respect of the Senior Notes or the commercial debt facility. Each subsidiary is a distinct legalentity and, under certain circumstances, legal and contractual restrictions may limit our ability to obtaincash from our subsidiaries. The indenture governing the Senior Notes limits the ability of our subsidiariesto incur consensual encumbrances or restrictions on their ability to pay dividends or make other intercompanypayments to us, with significant qualifications and exceptions. In addition, the terms of the commercialdebt facility limit the ability of the obligors thereunder, including our material operating subsidiaries thathold interests in our assets located offshore Ghana and Equatorial Guinea and their intermediate parentcompanies to provide cash to us through dividend, debt repayment or intercompany lending. In the event thatwe do not receive distributions from our subsidiaries, we may be unable to make required principal andinterest payments on our indebtedness, including the Senior Notes and commercial debt facility.
We may be subject to risks in connection with acquisitions and the integration of significant acquisitions maybe difficult.
We periodically evaluate acquisitions of prospects and licenses, reserves and other strategic transactionsthat appear to fit within our overall business strategy. The successful acquisition of these assets or businessesrequires an assessment of several factors, including:
• recoverable reserves;
• future oil and natural gas prices and their appropriate differentials;
• development and operating costs; and
• potential environmental and other liabilities.
The accuracy of these assessments is inherently uncertain. In connection with these assessments, weperform a review of the subject assets that we believe to be generally consistent with industry practices. Ourreview will not reveal all existing or potential problems nor will it permit us to become sufficiently familiarwith the assets to fully assess their deficiencies and potential recoverable reserves. Inspections may not alwaysbe performed on every well, and environmental problems are not necessarily observable even when aninspection is undertaken. Even when problems are identified, the seller may be unwilling or unable to provideeffective contractual protection against all or part of the problems. We may not be entitled to contractualindemnification for environmental liabilities and could acquire assets on an “as is” basis. Significantacquisitions and other strategic transactions may involve other risks, including:
• diversion of our management’s attention to evaluating, negotiating and integrating significantacquisitions and strategic transactions;
• the challenge and cost of integrating acquired operations, information management and othertechnology systems and business cultures with those of ours while carrying on our ongoing business;
58

• difficulty associated with coordinating geographically separate organizations; and
• the challenge of attracting and retaining personnel associated with acquired operations.
The process of integrating operations could cause an interruption of, or loss of momentum in, theactivities of our business. Members of our senior management may be required to devote considerableamounts of time to this integration process, which will decrease the time they will have to manage ourbusiness. If our senior management is not able to effectively manage the integration process, or if anysignificant business activities are interrupted as a result of the integration process, our business could suffer.
If we fail to realize the anticipated benefits of a significant acquisition, our results of operations may beadversely affected.
The success of a significant acquisition (e.g., our acquisition of DGE) will depend, in part, on ourability to realize anticipated growth opportunities from combining the acquired assets or operations withthose of ours. Even if a combination is successful, it may not be possible to realize the full benefits we mayexpect in estimated proved reserves, production volume, cost savings from operating synergies or other benefitsanticipated from an acquisition or realize these benefits within the expected time frame. Anticipatedbenefits of an acquisition may be offset by operating losses relating to changes in commodity prices, increasedinterest expense associated with debt incurred or assumed in connection with the transaction, adversechanges in oil and gas industry conditions, or by risks and uncertainties relating to the exploratory prospectsof the combined assets or operations, or an increase in operating or other costs or other difficulties,including the assumption of health, safety, and environmental or other liabilities in connection with theacquisition. If we fail to realize the benefits we anticipate from an acquisition, our results of operations maybe adversely affected.
Federal regulatory law could have an adverse effect on our ability to use derivative instruments to reduce theeffect of commodity price and other risks associated with our business.
We use derivative instruments to manage our commodity price and interest rate risk. The CommodityFutures Trading Commission (“CFTC”) has jurisdiction over derivatives instruments including commodityfutures and “swaps” under the Commodity Exchange Act; the SEC has jurisdiction over “security-basedswaps” under the federal securities laws. The CFTC’s regime is largely in effect, while the SEC’s regime for“security-based swaps” largely has not yet come into effect.
Of particular importance to us, the CFTC has the authority to, under certain findings, establishposition limits for certain futures, options on futures and swap contracts. Certain bona fide hedgingtransactions or positions would be exempt from these position limits. The CFTC has proposed rules thatwould place limits on positions in certain core futures and equivalent swaps contracts for or linked to certainenergy, metal, and agricultural physical commodities, subject to exceptions for certain bona fide hedgingtransactions. The CFTC has not yet finalized these regulations; therefore, the impact of those provisions onus is uncertain at this time.
The CFTC has designated certain interest-rate swaps and index credit default swaps for mandatoryclearing and exchange trading. The CFTC has not yet proposed rules designating any other classes ofswaps, including physical commodity swaps, for mandatory clearing. The application of the mandatoryclearing and trade execution requirements to other market participants, such as swap dealers, may changethe cost and availability of the swaps that the Company uses for hedging.
Derivatives dealers that we transact with will need to comply with new margin and segregationrequirements for uncleared swaps and security-based swaps. While it is expected that our unclearedderivatives transactions will not directly be subject to those margin requirements, due to the increased coststo dealers for transacting uncleared derivatives in general, our costs for these transactions may increase.
Federal law may also require the counterparties to our derivative instruments to register with theCFTC and become subject to substantial regulation or even spin off some of their derivatives activities to aseparate entity, which may not be as creditworthy as the current counterparty. These requirements andothers could significantly increase the cost of derivatives contracts (including through requirements to clear
59

swaps and to post collateral, each of which could adversely affect our available liquidity), materially alterthe terms of derivatives contracts, reduce the availability of derivatives to protect against risks we encounter,reduce our ability to monetize or restructure our existing derivative contracts, and increase our exposure toless creditworthy counterparties. If we reduce our use of derivatives as a result of the legislation andregulations, our results of operations may become more volatile and our cash flows may be less predictable,which could adversely affect our ability to plan for and fund capital expenditures. Our revenues could alsobe adversely affected if a consequence of the legislation and regulations is to lower commodity prices.
The European Union and other non-U.S. jurisdictions are also implementing regulations with respect tothe derivatives market. To the extent we transact with counterparties in foreign jurisdictions, we or ourtransactions may become subject to such regulations. At this time, the impact of such regulations is not clear.
Any of these consequences could have a material adverse effect on our consolidated financial position,results of operations, or cash flows.
A cyber incident could result in information theft, data corruption, operational disruption, and/or financialloss.
The oil and gas industry has become increasingly dependent on digital technologies to conduct day-to-day operations including certain exploration, development and production activities. For example, softwareprograms are used to interpret seismic data, manage drilling rigs, conduct reservoir modeling and reservesestimation, and to process and record financial and operating data.
We depend on digital technology, including information systems and related infrastructure as well ascloud application and services, to process and record financial and operating data, communicate with ouremployees and business partners, analyze seismic and drilling information, estimate quantities of oil and gasreserves and for many other activities related to our business. Our business partners, including vendors,service providers, co-venturers, purchasers of our production, and financial institutions, are also dependenton digital technology. The complexity of the technologies needed to explore for and develop oil and gas inincreasingly difficult physical environments, such as deepwater, and global competition for oil and gasresources make certain information more attractive to thieves.
As dependence on digital technologies has increased, cyber incidents, including deliberate attacks orunintentional events, have also increased. A cyber-attack could include gaining unauthorized access todigital systems for purposes of misappropriating assets or sensitive information, corrupting data, or causingoperational disruption, or result in denial-of-service on websites. For example, in 2012, a wave of networkattacks impacted Saudi Arabia’s oil industry and breached financial institutions in the U.S. A number of U.S.companies have also been subject to cyber-attacks in recent years resulting in unauthorized access tosensitive information. Certain countries are believed to possess cyber warfare capabilities and are creditedwith attacks on American companies and government agencies.
Our technologies, systems, networks, and those of our business partners may become the target of cyber-attacks or information security breaches that could result in the unauthorized release, gathering, monitoring,misuse, loss or destruction of proprietary and other information, or other disruption of our businessoperations. In addition, certain cyber incidents, such as surveillance, may remain undetected for an extendedperiod. A cyber incident involving our information systems and related infrastructure, or that of ourbusiness partners, could disrupt our business plans and negatively impact our operations. Although to datewe have not experienced any significant cyber-attacks, there can be no assurance that we will not be the targetof cyber-attacks in the future or suffer such losses related to any cyber-incident. As cyber threats continueto evolve, we may be required to expend significant additional resources to continue to modify or enhance ourprotective measures or to investigate and remediate any information security vulnerabilities.
Outbreaks of disease may adversely affect our business operations and financial condition.
Significant outbreaks of contagious diseases, and other adverse public health developments, could havea material impact on our business operations and financial condition. Many of our operations are currently,and will likely remain in the near future, in developing countries which are susceptible to outbreaks ofdisease and may lack the resources to effectively contain such an outbreak quickly. Such outbreaks may
60

impact our ability to explore for oil and gas, develop or produce our license areas by limiting access toqualified personnel, increasing costs associated with ensuring the safety and health of our personnel,restricting transportation of personnel, equipment, supplies and oil and gas production to and from our areasof operation and diverting the time, attention and resources of government agencies which are necessaryto conduct our operations. In addition, any losses we experience as a result of such outbreaks of disease whichimpact sales or delay production may not be covered by our insurance policies.
An epidemic of the Ebola virus disease occurred in parts of West Africa in 2014 and continuedthrough 2015. A substantial number of deaths were reported by the World Health Organization (“WHO”)in West Africa, and the WHO declared it a global health emergency. It is impossible to predict the effect andpotential spread of new outbreaks of the Ebola virus in West Africa and surrounding areas. Shouldanother Ebola virus outbreak occur, including to the countries in which we operate, or not be satisfactorilycontained, our exploration, development and production plans for our operations could be delayed, orinterrupted after commencement. Any changes to these operations could significantly increase costs ofoperations. Our operations require contractors and personnel to travel to and from Africa as well as theunhindered transportation of equipment and oil and gas production (in the case of our producing fields).Such operations also rely on infrastructure, contractors and personnel in Africa. If travel bans are implementedor extended to the countries in which we operate, or contractors or personnel refuse to travel there, wecould be adversely affected. If services are obtained, costs associated with those services could be significantlyhigher than planned which could have a material adverse effect on our business, results of operations, andfuture cash flow. In addition, should an Ebola virus outbreak spread to the countries in which we operate,access to the FPSOs could be restricted and/or terminated. The FPSOs are potentially able to operate for ashort period of time without access to the mainland, but if restrictions extended for a longer period weand the operator of the impacted fields would likely be required to cease production and other operationsuntil such restrictions were lifted.
The ongoing coronavirus outbreak emanating from China at the beginning of 2020 has resulted inincreased travel restrictions and extended shutdown of certain businesses in the region. These or any furtherpolitical or governmental developments or health concerns in China or other countries could result insocial, economic and labor instability. These uncertainties could have a material impact on our businessoperations and financial condition.
Changes in the method of determining London Interbank Offered Rate (“LIBOR”), or the replacement ofLIBOR with an alternative reference rate, may adversely affect interest expense related to outstanding debt.
On July 27, 2017, the Financial Conduct Authority in the United Kingdom announced that it wouldno longer persuade or compel panel banks to submit the rates required to calculate LIBOR after the end of2021. The announcement indicates that the continuation of LIBOR on the current basis cannot and willnot be guaranteed after 2021. The continued existence of LIBOR after 2021, therefore, remains highlyuncertain. While various governmental working groups are pursuing replacement rates, if LIBOR ceases toexist, we may need to renegotiate our Facility and Corporate Revolver and may not be able to do so onterms that are favorable to us.
Risks Relating to Our Common Stock
Our share price may be volatile, and purchasers of our common stock could incur substantial losses.
Our share price may be volatile. The stock market in general has experienced extreme volatility that hasoften been unrelated to the operating performance of particular companies. The market price for ourcommon stock may be influenced by many factors, including, but not limited to:
• the price of oil and natural gas;
• the success of our exploration and development operations, and the marketing of any oil and naturalgas we produce;
• operational incidents;
• regulatory developments in the United States and foreign countries where we operate;
61

• the recruitment or departure of key personnel;
• quarterly or annual variations in our financial results or those of companies that are perceived to besimilar to us;
• market conditions in the industries in which we compete and issuance of new or changed securities;
• analysts’ reports or recommendations;
• the failure of securities analysts to cover our common stock or changes in financial estimates byanalysts;
• the inability to meet the financial estimates of analysts who follow our common stock;
• the issuance or sale of any additional securities of ours;
• investor perception of our company and of the industry in which we compete; and
• general economic, political and market conditions.
A substantial portion of our total issued and outstanding common stock may be sold into the market at anytime. This could cause the market price of our common stock to drop significantly, even if our business is doingwell.
All of the shares sold in our initial public offering are freely tradable without restrictions or furtherregistration under the federal securities laws, unless purchased by our “affiliates” as that term is defined inRule 144 under the Securities Act of 1933, as amended (the “Securities Act”). Substantially all of the remainingshares of common stock are restricted securities as defined in Rule 144 under the Securities Act (unlessthey have been sold pursuant to Rule 144 to date). Restricted securities may be sold in the U.S. public marketonly if registered or if they qualify for an exemption from registration, including by reason of Rule 144 orRule 701 under the Securities Act. All of our restricted shares are eligible for sale in the public market, subjectin certain circumstances to the volume, manner of sale limitations with respect to shares held by ouraffiliates and other limitations under Rule 144. Additionally, we have registered all our shares of commonstock that we may issue under our employee benefit plans. These shares can be freely sold in the public marketupon issuance, unless pursuant to their terms these share awards have transfer restrictions attached tothem. Sales of a substantial number of shares of our common stock, or the perception in the market thatthe holders of a large number of shares intend to sell common stock, could reduce the market price of ourcommon stock.
Holders of our common stock will be diluted if additional shares are issued.
We may issue additional shares of common stock, preferred shares, warrants, rights, units and debtsecurities for general corporate purposes, including, but not limited to, repayment or refinancing ofborrowings, working capital, capital expenditures, investments and acquisitions. We continue to activelyseek to expand our business through complementary or strategic acquisitions, and we may issue additionalshares of common stock in connection with those acquisitions. We also issue restricted shares to our executiveofficers, employees and independent directors as part of their compensation. If we issue additional sharesof common stock in the future, it may have a dilutive effect on our current outstanding shareholders.
Item 1B. Unresolved Staff Comments
Not applicable.
Item 2. Properties
See “Item 1. Business.” We also have various operating leases for rental of office space, office and fieldequipment, and vehicles. See “Item 8. Financial Statements and Supplementary Data—Note 15—Commitments and Contingencies” for the future minimum rental payments. Such information is incorporatedherein by reference.
62

Item 3. Legal Proceedings
From time to time, we may be involved in various legal and regulatory proceedings arising in thenormal course of business. While we cannot predict the occurrence or outcome of these proceedings withcertainty, we do not believe that an adverse result in any pending legal or regulatory proceeding, individuallyor in the aggregate, would be material to our consolidated financial condition or cash flows; however, anunfavorable outcome could have a material adverse effect on our results of operations for a specific interimperiod or year.
Item 4. Mine Safety Disclosures
Not applicable.
63

PART II
Item 5. Market for Registrant’s Common Equity, Related Stockholder Matters and Issuer Purchases ofEquity Securities
Common Stock Trading Summary
Our common stock is traded on the NYSE and LSE under the symbol KOS.
As of February 19, 2020, based on information from the Company’s transfer agent, ComputershareTrust Company, N.A., the number of holders of record of Kosmos’ common stock was 55. On February 19,2020, the last reported sale price of Kosmos’ common stock, as reported on the NYSE, was $5.22 pershare.
We began paying quarterly cash dividends of $0.0452 per common share in March 2019. Certain ofour subsidiaries are currently restricted in their ability to pay dividends to us pursuant to the terms of theSenior Notes, the Facility and the Corporate Revolver unless we meet certain conditions, financial andotherwise. Any decision to pay dividends in the future is at the discretion of our board of directors anddepends on our financial condition, results of operations, capital requirements and other factors that ourboard of directors deems relevant.
Issuer Purchases of Equity Securities
Under the terms of our LTIP, we have issued restricted shares to our employees. On the date that theserestricted shares vest, we provide such employees the option to sell shares to cover their tax liability, via anet exercise provision pursuant to our applicable restricted share award agreements and the LTIP, at eitherthe number of vested shares (based on the closing price of our common stock on such vesting date) equal tothe minimum statutory tax liability owed by such grantee or up to the maximum statutory tax liability forsuch grantee. The Company may repurchase the restricted shares sold by the grantees to settle their taxliability. The repurchased shares are reallocated to the number of shares available for issuance under the LTIP.During 2019, there were no shares purchased.
64

Share Performance Graph
The following Performance Graph and related information shall not be deemed “soliciting material” or tobe “filed” with the SEC, nor shall such information be incorporated by reference into any future filings underthe Securities Act of 1933 or Securities Exchange Act of 1934, each as amended, except to the extent that theCompany specifically incorporates it by reference into such filings.
The following graph illustrates changes over the five-year period ended December 31, 2019, in cumulativetotal stockholder return on our common stock as measured against the cumulative total return of the S&P500 Index and the Dow Jones U.S. Exploration & Production Index. The graph tracks the performance of a$100 investment in our common stock and in each index (with the reinvestment of all dividends).
2014 2015 2019201820172016
Kosmos Energy Ltd. (KOS)
250
200
150
100
50
0
Dow Jones U.S. Exploration & Production Index (DWCEXP)
S&P 500 (SPX)
December 31,
2014 2015 2016 2017 2018 2019
Kosmos Energy Ltd. (KOS) . . . . . . . . . . . $100.00 $ 61.98 $ 83.55 $ 81.64 $ 48.51 $ 70.01S&P 500 (SPX) . . . . . . . . . . . . . . . . . . . . 100.00 101.37 113.49 138.26 132.19 173.80Dow Jones U.S. Exploration & Production
Index (DWCEXP) . . . . . . . . . . . . . . . . 100.00 75.80 95.28 95.55 77.11 85.05
65

Item 6. Selected Financial Data
The following selected consolidated financial information set forth below as of and for the five yearsended, December 31, 2019, should be read in conjunction with “Item 7. Management’s Discussion andAnalysis of Financial Condition and Results of Operations” and “Item 8. Financial Statements andSupplementary Data.”
Consolidated Statements of Operations Information:
Years Ended December 31,
2019 2018 2017 2016 2015
(In thousands, except per share data)
Revenues and other income:Oil and gas revenue . . . . . . . . . . . . . . . . $1,499,416 $886,666 $ 578,139 $ 310,377 $ 446,696Gain on sale of assets . . . . . . . . . . . . . . 10,528 7,666 — — 24,651Other income, net . . . . . . . . . . . . . . . . . (35) 8,037 58,697 74,978 209
Total revenues and other income . . . . . 1,509,909 902,369 636,836 385,355 471,556Costs and expenses:
Oil and gas production . . . . . . . . . . . . . 402,613 224,727 126,850 119,367 105,336Facilities insurance modifications, net . . . (24,254) 6,955 (820) 14,961 —Exploration expenses . . . . . . . . . . . . . . . 180,955 301,492 216,050 202,280 156,203General and administrative . . . . . . . . . . 110,010 99,856 68,302 87,623 136,809Depletion, depreciation and amortization 563,861 329,835 255,203 140,404 155,966Interest and other financing costs, net . . . 155,074 101,176 77,595 44,147 37,209Derivatives, net . . . . . . . . . . . . . . . . . . . 71,885 (31,430) 59,968 48,021 (210,649)(Gain) loss on equity method investments,
net . . . . . . . . . . . . . . . . . . . . . . . . . . — (72,881) 6,252 — —Other expenses, net . . . . . . . . . . . . . . . . 24,648 (6,501) 5,291 23,116 5,246
Total costs and expenses . . . . . . . . . . . 1,484,792 953,229 814,691 679,919 386,120Income (loss) before income taxes . . . . . . . 25,117 (50,860) (177,855) (294,564) 85,436
Income tax expense (benefit) . . . . . . . . . 80,894 43,131 44,937 (10,784) 155,272Net loss . . . . . . . . . . . . . . . . . . . . . . . . . . $ (55,777) $ (93,991) $(222,792) $(283,780) $ (69,836)
Net loss per share:Basic . . . . . . . . . . . . . . . . . . . . . . . . $ (0.14) $ (0.23) $ (0.57) $ (0.74) $ (0.18)
Diluted . . . . . . . . . . . . . . . . . . . . . . . $ (0.14) $ (0.23) $ (0.57) $ (0.74) $ (0.18)
Weighted average number of shares used tocompute net loss per share:
Basic . . . . . . . . . . . . . . . . . . . . . . . . 401,368 404,585 388,375 385,402 382,610
Diluted . . . . . . . . . . . . . . . . . . . . . . . 401,368 404,585 388,375 385,402 382,610
Dividends declared per common share . . . . $ 0.1808 $ — $ — $ — $ —
66

Consolidated Balance Sheets Information:
December 31,
2019 2018 2017 2016 2015
(In thousands)
Cash and cash equivalents . . . . . . . . . $ 224,502 $ 173,515 $ 233,412 $ 194,057 $ 275,004Total current assets . . . . . . . . . . . . . . 566,557 509,700 533,602 475,187 734,148Total property and equipment, net . . . . 3,642,332 3,459,701 2,317,828 2,708,892 2,322,839Total other assets . . . . . . . . . . . . . . . . 108,343 118,788 341,173 157,386 146,063Total assets . . . . . . . . . . . . . . . . . . . . 4,317,232 4,088,189 3,192,603 3,341,465 3,203,050Total current liabilities . . . . . . . . . . . . 539,101 384,308 428,730 370,025 456,741Total long-term liabilities . . . . . . . . . . 2,936,429 2,762,403 1,866,761 1,890,241 1,420,796Total shareholders’ equity . . . . . . . . . . 841,702 941,478 897,112 1,081,199 1,325,513Total liabilities and shareholders’ equity 4,317,232 4,088,189 3,192,603 3,341,465 3,203,050
Consolidated Statements of Cash Flows Information:
Years Ended December 31,
2019 2018 2017 2016 2015
(In thousands)
Net cash provided by (used in):Operating activities . . . . . . . . . . . . . . $ 628,150 $ 260,491 $ 236,617 $ 52,077 $ 440,779Investing activities . . . . . . . . . . . . . . . (363,931) (985,138) (152,565) (537,763) (796,433)Financing activities . . . . . . . . . . . . . . (220,489) 605,277 (52,261) 448,019 79,634
67

Item 7. Management’s Discussion and Analysis of Financial Condition and Results of Operations
The following discussion and analysis contains forward-looking statements that involve risks anduncertainties. Our actual results may differ materially from those discussed in the forward-looking statementsas a result of various factors, including, without limitation, those set forth in “Cautionary Statement RegardingForward-Looking Statements” and “Item 1A. Risk Factors.” The following discussion of our financialcondition and results of operations should be read in conjunction with our consolidated financial statements andthe notes thereto included elsewhere in this annual report on Form 10-K.
Overview
Kosmos is a full-cycle deepwater independent oil and gas exploration and production company focusedalong the Atlantic Margins. Our key assets include production offshore Ghana, Equatorial Guinea and U.S.Gulf of Mexico, as well as a world-class gas development offshore Mauritania and Senegal. We alsomaintain a sustainable exploration program balanced between proven basin infrastructure-led exploration(Equatorial Guinea and U.S. Gulf of Mexico), emerging basins (Mauritania, Senegal and Suriname) andfrontier basins (Cote d’Ivoire, Namibia, Sao Tome and Principe, and South Africa).
Recent Developments
Corporate
During April 2019, the Company issued $650 million of 7.125% Senior Notes due 2026 and receivednet proceeds of approximately $640.0 million after deducting commission and deferred financing costs. Weused the net proceeds to fund the redemption of our 7.875% Senior Secured Notes due 2021, of which therewas a $525 million aggregate principal amount outstanding, to repay a portion of the outstandingindebtedness under our Corporate Revolver and to pay fees and expenses related to the redemption,repayment and the offering.
Ghana
Jubilee
During the year ended December 31, 2019, Jubilee production averaged approximately 87,400 Bopd(gross), as one new producer well came online. During the first quarter of 2019, gas reliability issues wereworked on by the operator with the reliability of the gas system enhanced by having a spare high-pressurecompressor made available. However, oil production rates remain constrained by gas handling capabilities.Work to enhance gas handling capacity has been deferred by the operator to first quarter of 2020.
TEN
During the year ended December 31, 2019, TEN production averaged approximately 61,100 Bopd(gross) as one new producer well at Enyenra came online. During the second quarter of 2019, the completionof the Enyenra-14 production well was deferred due to operational issues. As a result, the accompanyingEnyenra-16 water injection well was also deferred.
U.S. Gulf of Mexico
During the year ended December 31, 2019, U.S. Gulf of Mexico production averaged approximately24,100 Boepd (net) (~82% oil).
During the first quarter of 2019, the Helix Producer I, the facility that supports production from theCompany’s Tornado field, completed its planned, regulatory-required dry-dock period. After approximatelytwo months of downtime, production from the Tornado wells re-commenced as scheduled. Early in thesecond quarter of 2019, the Tornado-3 development well located in Green Canyon block 281 (35.0% workinginterest) came online.
During the first quarter of 2019, Kosmos farmed-into 18 BP-owned blocks in the Garden Banks areaof the deepwater U.S. Gulf of Mexico. In addition, Kosmos can earn an interest in three BP blocks in other
68

areas of the deepwater U.S. Gulf of Mexico. This should allow Kosmos to execute projects that can be tiedback to existing infrastructure. Kosmos is the designated operator and drilled the first well in Garden Banksblock 492 (Kosmos 50%, BP 50%), the Resolution exploration well, in November 2019. The wellencountered reservoir quality sands; however, the primary exploration objective proved to be water bearing.The well was plugged and abandoned and the well results are being integrated into the ongoing evaluationof the surrounding area.
During the first quarter of 2019, Kosmos executed a farm-in agreement with Chevron covering theright to earn an interest in Mississippi Canyon block 728 in the deepwater U.S. Gulf of Mexico. Thisagreement allows Kosmos another opportunity to execute its deepwater U.S. Gulf of Mexico strategy ofinfrastructure-led exploration. In the fourth quarter of 2019, Kosmos then entered into a cross assignmentof our interest in Mississippi Canyon block 728 with Hess Corporation on their interest in an adjacent block,Mississippi Canyon block 684, after which Kosmos now has a 40% interest in the two blocks, and HessCorporation has a 60% interest. Kosmos is the designated operator and drilled the first well in MississippiCanyon block 728, the Oldfield exploration well, in December 2019. The well did not encounter commercialquantities of hydrocarbons and was plugged and abandoned in the first quarter of 2020.
In the second quarter of 2019, we announced the Gladden Deep exploration well located in MississippiCanyon Block 800 (20.0% working interest) made an oil discovery. Gladden Deep is a subsea tieback thatwas brought online in September 2019 through the existing Gladden pipeline to the Medusa SPAR.
In October 2019, we drilled the Moneypenny prospect, which was unsuccessful. The well was designedas an inexpensive exploration tail of an Odd Job development well.
Kosmos participated in the U.S. Gulf of Mexico Federal Lease Sales 252 and 253 and was ultimatelyawarded 13 deepwater blocks during 2019. As part of the Company’s strategy to expand its position in theU.S. Gulf of Mexico, these new leases have added significant infrastructure-led exploration prospects to ourportfolio.
Equatorial Guinea
Effective January 1, 2019, our outstanding shares in KTIPI were transferred to Trident in exchange fora 40.4% undivided interest in the Ceiba Field and Okume Complex. As a result, our interest in the CeibaField and Okume Complex will be accounted for under the proportionate consolidation method of accountinggoing forward. Pre-tax income from our interests in our Ceiba Field and Okume Complex are taxable inEquatorial Guinea at a 35% statutory tax rate, which will impact our overall effective tax rate.
Production in Equatorial Guinea averaged approximately 38,300 Bopd (gross) for the year endedDecember 31, 2019. Our ESP program is supporting field production with five ESPs completed during theyear ended December 31, 2019.
In March 2019, we acquired Ophir’s remaining interest in Block EG-24 offshore Equatorial Guinea,which resulted in Kosmos owning an 80% participating interest and operatorship in the block.
In October 2019, the S-5 exploration well was drilled to a total depth of 4,400 meters offshore EquatorialGuinea, encountering 39 meters of net oil pay in good-quality Santonian reservoir. The well is located withintieback range of the Ceiba FPSO and work is currently ongoing to establish the scale of the discoveredresource and evaluate the optimum development solution.
Mauritania and Senegal
Greater Tortue Ahmeyim Unit
In February 2019, to optimize resource recovery in this field, we entered into the GTA UUOA with thegovernments of Mauritania and Senegal. The GTA UUOA governs interests in and development of theGreater Tortue Ahmeyim Field and created the Greater Tortue Ahmeyim Unit from portions of theMauritania Block C8 and the Senegal Saint Louis Offshore Profond Block areas. Mauritania and Senegaleach issued an exploitation authorization for the Greater Tortue Ahmeyim Unit area covered by the GTAUUOA. Kosmos and BP signed Carry Advance Agreements with the national oil companies of Mauritania
69

and Senegal, which obligate us separately to finance the respective national oil company’s share of certaindevelopment costs incurred through first gas for Phase 1, currently projected in the first half of 2022. Kosmos’total share for the two agreements combined is up to $239.7 million, which is to be repaid with interestthrough the national oil companies’ share of future revenues.
In April 2019, KBR was awarded the Pre-FEED services contract for Phases 2 and 3 of the GreaterTortue Ahmeyim project. These next phases are expected to expand capacity of this hub to approximately10 MMTPA of LNG for export.
During the second quarter of 2019, the national oil companies in Mauritania and Senegal elected toincrease their respective interest in their portion of the Greater Tortue Ahmeyim Unit to the maximumallowed percentages under the respective petroleum contracts. After the election, our interest in the explorationareas of Block C8 offshore Mauritania and in Saint Louis Offshore Profound offshore Senegal areunchanged, however, our interest in the Greater Tortue Ahmeyim Unit is now 26.7%.
In the second quarter of 2019, we withdrew from Block C18 offshore Mauritania and we entered intothe second exploration phase on blocks C8 and C12 offshore Mauritania, each of which expire in June 2022.Block C12 contains a one well drilling commitment.
In July 2019, we announced the Greater Tortue Ahmeyim-1 (GTA-1) appraisal well was drilled on theeastern anticline within the unit development area of the Greater Tortue Ahmeyim field. The GTA-1 wellencountered approximately 30 meters of net gas pay in high quality Albian reservoir. The well was drilled inapproximately 2,500 meters of water, approximately 10 kilometers inboard of the Guembeul-1A andTortue-1 wells, to a total depth of 4,884 meters.
Senegal
In September 2019, we announced the Yakaar-2 appraisal well was drilled approximately nine kilometersfrom the Yakaar-1 exploration well and further delineated the southern extension of the field. The Yakaar-2well encountered approximately 30 meters of net gas pay in similar high-quality Cenomanian reservoir tothe Yakaar-1 exploration well. The Yakaar-2 well was drilled in approximately 2,500 meters of water to a totaldepth of approximately 4,800 meters. The Yakaar and Teranga discoveries are being analyzed as a jointdevelopment.
Mauritania
In October 2019, we announced the Orca-1 exploration well, located in Block C-8 offshore Mauritania,made a major gas discovery. The Orca-1 well, which targeted a previously untested Albian play, encountered36 meters of net gas pay in excellent quality reservoirs. In addition, the well extended the Cenomanian playfairway by confirming 11 meters of net gas pay in a down-structure position relative to the original Marsouin-1discovery well. The location of the Orca-1 proved the structural and stratigraphic trap. The Orca-1 wellwas drilled in approximately 2,510 meters of water to a total measured depth of around 5,266 meters. TheBir Allah and Orca discoveries are being analyzed as a joint development.
Sao Tome and Principe
In May 2019, we entered into the second exploration phase on Block 5 offshore Sao Tome andPrincipe, which contains a one well drilling commitment and expires in May 2021. Galp provided notice ofwithdrawal at the same time, resulting in an increase in Kosmos participating interest from 45% to 58.8%.
In July 2019, the petroleum contract for Block 11 offshore Sao Tome and Principe was amended toremove any well commitment from the second exploration phase and add a contingent well to the thirdexploration phase in addition to the existing firm well. We also entered the second exploration phase, whichwill expire in July 2021.
In November 2019, we entered the second exploration phase of Block 6 offshore Sao Tome andPrincipe, which will expire in November 2021. We plan to drill an exploration well on Block 6 offshore SaoTome and Principle, as technical operator of the well, in late 2020.
70

In November 2019, we completed a farm-out agreement with Shell Sao Tome and Principe B.V. tofarmout a 20% participating interest in Block 6 and a 30% participating interest in Block 11, offshore SaoTome and Principe resulting in our participating interests in Block 6 and 11 being 25% and 35%, respectively.A gain of $10.5 million was recognized as a result of the farm-out.
In December 2019, a formal withdrawal notice from Block 12 offshore Sao Tome and Principe wascommunicated to partners with and effective date of January 31, 2020.
Namibia
In the second quarter of 2019, we received government approval to enter the second renewal period onBlock PEL039 offshore Namibia, which contains a one well drilling commitment. We also received a oneyear extension to the phase, resulting in a three year period ending in August 2022.
Republic of the Congo
In March 2019, we entered into a petroleum contract covering the offshore Marine XXI block with theRepublic of the Congo, subject to governmental approvals. Upon approval, we will hold an 85% participatinginterest and be the operator. The Congolese national oil company, SPNC, has a 15% carried participatinginterest during the exploration period. Should a commercial discovery be made, SNPC’s 15% carried interestwill convert to a participating interest of at least 15%. The petroleum contract covers approximately 2,350square kilometers, with a first exploration period of four years and includes a work program to acquire andinterpret 2,200 square kilometers of 3D seismic. There are two optional exploration phases, each for aperiod of three years, which are subject to additional work program commitments.
Republic of South Africa
In September 2019, we completed a farm-in agreement with OK Energy to acquire a 45% non-operated interest in the Northern Cape Ultra Deep Block offshore the Republic of South Africa. Shell owns45% of the Block and is the operator and OK Energy retained 10%. The petroleum contract coversapproximately 6,930 square kilometers at water depths ranging from 2,500 to 3,100 meters. The currentexploration phase began in January 2019 and lasts for two years.
71

Results of Operations
All of our results, as presented in the table below, represent operations from the Jubilee and TEN fieldsin Ghana, the U.S. Gulf of Mexico (commencing September 14, 2018, the DGE acquisition date), andEquatorial Guinea, which was accounted for as an equity method investment during 2018 and 2017. Certainoperating results and statistics for the years ended December 31, 2019 and 2018 are included in the followingtables. For a discussion of the year ended December 31, 2018 compared to the year ended December 31,2017, please refer to Part II, Item 7 “Management’s Discussion and Analysis of Financial Condition andResults of Operations” in our Annual Report on Form 10-K for the year ended December 31, 2018.
Year EndedDecember 31,
2019
(In thousands,except per
volume data)
Sales volumes:Oil (MBbl) . . . . . . . . . . . . . . . . . . . . . . . . . . . . . . . . . . . . . . . . . . . . . . . . . . 23,331Gas (MMcf) . . . . . . . . . . . . . . . . . . . . . . . . . . . . . . . . . . . . . . . . . . . . . . . . . 6,323NGL (MBbl) . . . . . . . . . . . . . . . . . . . . . . . . . . . . . . . . . . . . . . . . . . . . . . . . 548
Total (MBoe) . . . . . . . . . . . . . . . . . . . . . . . . . . . . . . . . . . . . . . . . . . . . . . 24,933
Revenues:Oil sales . . . . . . . . . . . . . . . . . . . . . . . . . . . . . . . . . . . . . . . . . . . . . . . . . . . . $1,475,706Gas sales . . . . . . . . . . . . . . . . . . . . . . . . . . . . . . . . . . . . . . . . . . . . . . . . . . . 15,599NGL sales . . . . . . . . . . . . . . . . . . . . . . . . . . . . . . . . . . . . . . . . . . . . . . . . . . 8,111
Total revenues . . . . . . . . . . . . . . . . . . . . . . . . . . . . . . . . . . . . . . . . . . . . . . $1,499,416Average oil sales price per Bbl . . . . . . . . . . . . . . . . . . . . . . . . . . . . . . . . . . . . . . $ 63.25Average gas sales price per Mcf . . . . . . . . . . . . . . . . . . . . . . . . . . . . . . . . . . . . . 2.47Average NGL sales price per Bbl . . . . . . . . . . . . . . . . . . . . . . . . . . . . . . . . . . . . 14.80Average total sales price per Boe . . . . . . . . . . . . . . . . . . . . . . . . . . . . . . . . . . . . 60.14
Costs:Oil and gas production, excluding workovers . . . . . . . . . . . . . . . . . . . . . . . . . . $ 370,962Oil and gas production, workovers . . . . . . . . . . . . . . . . . . . . . . . . . . . . . . . . . 31,651
Total oil and gas production costs . . . . . . . . . . . . . . . . . . . . . . . . . . . . . . . . $ 402,613Depletion, depreciation and amortization . . . . . . . . . . . . . . . . . . . . . . . . . . . . $ 563,861
Average cost per Boe:Oil and gas production, excluding workovers . . . . . . . . . . . . . . . . . . . . . . . . . . $ 14.88Oil and gas production, workovers . . . . . . . . . . . . . . . . . . . . . . . . . . . . . . . . . 1.27
Total oil and gas production costs . . . . . . . . . . . . . . . . . . . . . . . . . . . . . . . . 16.15Depletion, depreciation and amortization . . . . . . . . . . . . . . . . . . . . . . . . . . . . 22.62Total oil and gas production costs, depletion, depreciation and amortization . . . . $ 38.77
72

Year Ended December 31, 2018
Kosmos
Equity MethodInvestment-Equatorial
Guinea(1) Total
(In thousands, except per volume data)
Sales volumes:Oil (MBbl) . . . . . . . . . . . . . . . . . . . . . . . . . . . 12,673 5,228 17,901Gas (MMcf) . . . . . . . . . . . . . . . . . . . . . . . . . . 2,268 — 2,268NGL (MBbl) . . . . . . . . . . . . . . . . . . . . . . . . . . 179 — 179
Total (MBoe) . . . . . . . . . . . . . . . . . . . . . . . . 13,230 5,228 18,458
Revenues:Oil sales . . . . . . . . . . . . . . . . . . . . . . . . . . . . . $874,382 $360,649 $1,235,031Gas sales . . . . . . . . . . . . . . . . . . . . . . . . . . . . . 7,101 — 7,101NGL sales . . . . . . . . . . . . . . . . . . . . . . . . . . . . 5,183 — 5,183
Total revenues . . . . . . . . . . . . . . . . . . . . . . . $886,666 $360,649 $1,247,315
Average oil sales price per Bbl . . . . . . . . . . . . . . . . $ 69.00 $ 68.98 $ 68.99Average gas sales price per Mcf . . . . . . . . . . . . . . . 3.13 — 3.13Average NGL sales price per Bbl . . . . . . . . . . . . . . 28.96 — 28.96Average total sales price per Boe . . . . . . . . . . . . . . 67.02 68.98 67.58
Costs:Oil and gas production, excluding workovers . . . . $217,818 $ 73,843 $ 291,661Oil and gas production, workovers . . . . . . . . . . . 6,909 — 6,909
Total oil and gas production costs . . . . . . . . . . $224,727 $ 73,843 $ 298,570Depletion, depreciation and amortization . . . . . . $329,835 $134,983 $ 464,818
Average cost per Boe:Oil and gas production, excluding workovers . . . . $ 16.46 $ 14.12 $ 15.80Oil and gas production, workovers . . . . . . . . . . . 0.52 — 0.38
Total oil and gas production costs . . . . . . . . . . 16.98 14.12 16.18Depletion, depreciation and amortization . . . . . . 24.93 25.82 25.18Total oil and gas production costs, depletion,
depreciation and amortization . . . . . . . . . . . . $ 41.91 $ 39.94 $ 41.36
(1) For the year ended December 31, 2018, we have presented our 50% share of the results ofoperations, including our basis difference which is reflected in depletion, depreciation andamortization. Under the equity method of accounting, we only recognize our share of the netincome of KTIPI as adjusted for our basis differential, which is recorded in (Gain) loss on equitymethod investments, net in the consolidated statement of operations.
73
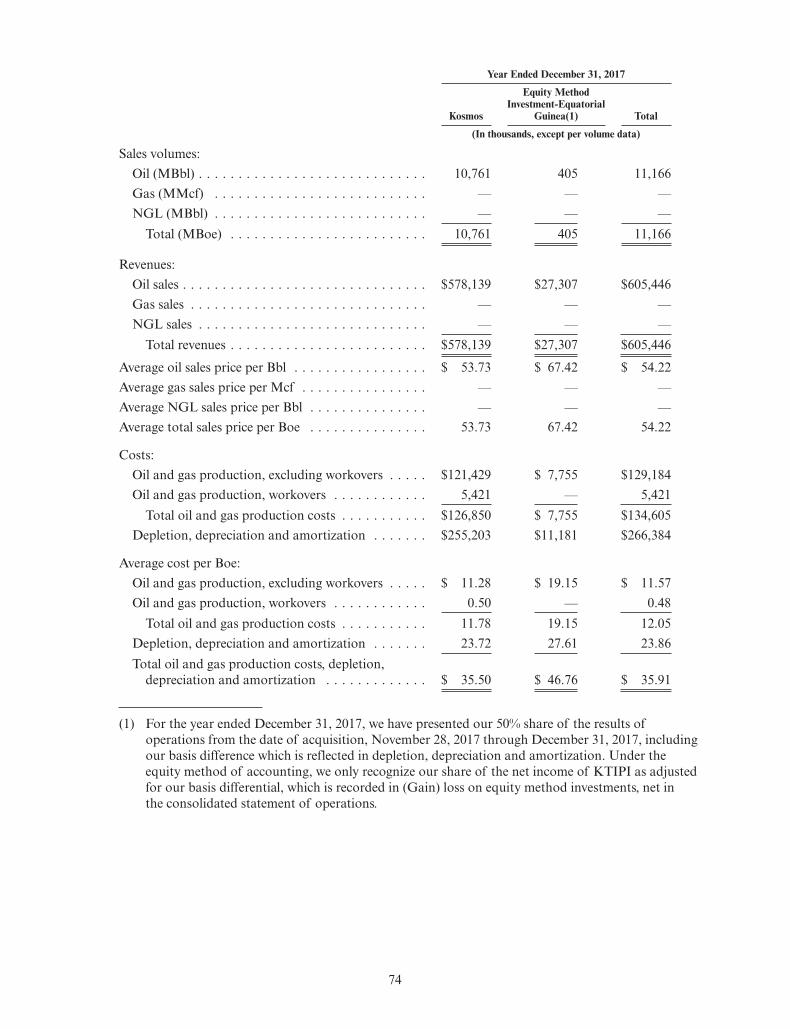
Year Ended December 31, 2017
Kosmos
Equity MethodInvestment-Equatorial
Guinea(1) Total
(In thousands, except per volume data)
Sales volumes:Oil (MBbl) . . . . . . . . . . . . . . . . . . . . . . . . . . . . . 10,761 405 11,166Gas (MMcf) . . . . . . . . . . . . . . . . . . . . . . . . . . . — — —NGL (MBbl) . . . . . . . . . . . . . . . . . . . . . . . . . . . — — —
Total (MBoe) . . . . . . . . . . . . . . . . . . . . . . . . . 10,761 405 11,166
Revenues:Oil sales . . . . . . . . . . . . . . . . . . . . . . . . . . . . . . . $578,139 $27,307 $605,446Gas sales . . . . . . . . . . . . . . . . . . . . . . . . . . . . . . — — —NGL sales . . . . . . . . . . . . . . . . . . . . . . . . . . . . . — — —
Total revenues . . . . . . . . . . . . . . . . . . . . . . . . . $578,139 $27,307 $605,446
Average oil sales price per Bbl . . . . . . . . . . . . . . . . . $ 53.73 $ 67.42 $ 54.22Average gas sales price per Mcf . . . . . . . . . . . . . . . . — — —Average NGL sales price per Bbl . . . . . . . . . . . . . . . — — —Average total sales price per Boe . . . . . . . . . . . . . . . 53.73 67.42 54.22
Costs:Oil and gas production, excluding workovers . . . . . $121,429 $ 7,755 $129,184Oil and gas production, workovers . . . . . . . . . . . . 5,421 — 5,421
Total oil and gas production costs . . . . . . . . . . . $126,850 $ 7,755 $134,605Depletion, depreciation and amortization . . . . . . . $255,203 $11,181 $266,384
Average cost per Boe:Oil and gas production, excluding workovers . . . . . $ 11.28 $ 19.15 $ 11.57Oil and gas production, workovers . . . . . . . . . . . . 0.50 — 0.48
Total oil and gas production costs . . . . . . . . . . . 11.78 19.15 12.05Depletion, depreciation and amortization . . . . . . . 23.72 27.61 23.86Total oil and gas production costs, depletion,
depreciation and amortization . . . . . . . . . . . . . $ 35.50 $ 46.76 $ 35.91
(1) For the year ended December 31, 2017, we have presented our 50% share of the results ofoperations from the date of acquisition, November 28, 2017 through December 31, 2017, includingour basis difference which is reflected in depletion, depreciation and amortization. Under theequity method of accounting, we only recognize our share of the net income of KTIPI as adjustedfor our basis differential, which is recorded in (Gain) loss on equity method investments, net inthe consolidated statement of operations.
74

The discussion of the results of operations and the period-to-period comparisons presented belowanalyze our historical results. The following discussion may not be indicative of future results.
Year Ended December 31, 2019 vs. 2018
Years EndedDecember 31, Increase
(Decrease)2019 2018
(In thousands)
Revenues and other income:Oil and gas revenue . . . . . . . . . . . . . . . . . . . . . . . . . . . . . . . . . $1,499,416 $886,666 $ 612,750Gain on sale of assets . . . . . . . . . . . . . . . . . . . . . . . . . . . . . . . . 10,528 7,666 2,862Other income, net . . . . . . . . . . . . . . . . . . . . . . . . . . . . . . . . . . . (35) 8,037 (8,072)
Total revenues and other income . . . . . . . . . . . . . . . . . . . . . . . 1,509,909 902,369 607,540Costs and expenses:
Oil and gas production . . . . . . . . . . . . . . . . . . . . . . . . . . . . . . . 402,613 224,727 177,886Facilities insurance modifications, net . . . . . . . . . . . . . . . . . . . . . (24,254) 6,955 (31,209)Exploration expenses . . . . . . . . . . . . . . . . . . . . . . . . . . . . . . . . 180,955 301,492 (120,537)General and administrative . . . . . . . . . . . . . . . . . . . . . . . . . . . . 110,010 99,856 10,154Depletion, depreciation and amortization . . . . . . . . . . . . . . . . . . 563,861 329,835 234,026Interest and other financing costs, net . . . . . . . . . . . . . . . . . . . . . 155,074 101,176 53,898Derivatives, net . . . . . . . . . . . . . . . . . . . . . . . . . . . . . . . . . . . . 71,885 (31,430) 103,315Gain on equity method investments, net . . . . . . . . . . . . . . . . . . . — (72,881) 72,881Other expenses, net . . . . . . . . . . . . . . . . . . . . . . . . . . . . . . . . . . 24,648 (6,501) 31,149
Total costs and expenses . . . . . . . . . . . . . . . . . . . . . . . . . . . . 1,484,792 953,229 531,563Income (loss) before income taxes . . . . . . . . . . . . . . . . . . . . . . . . . 25,117 (50,860) 75,977
Income tax expense . . . . . . . . . . . . . . . . . . . . . . . . . . . . . . . . . 80,894 43,131 37,763Net loss . . . . . . . . . . . . . . . . . . . . . . . . . . . . . . . . . . . . . . . . . . . $ (55,777) $ (93,991) $ 38,214
The results of operations for our equity method investments are presented in “Gain on equity methodinvestments, net.” See “Item 8. Financial Statements and Supplementary Data—Note 7—Equity MethodInvestments” for additional information regarding our equity method investments.
Oil and gas revenue. Oil and gas revenue increased by $612.8 million as a result of the inclusion of afull year of revenue from our U.S. Gulf of Mexico business unit for the period ended December 31, 2019related to the DGE acquisition, versus 108 days of revenue in the previous year’s period. The current yearperiod also benefited from the inclusion of revenue from Equatorial Guinea on a consolidated basis for theyear ended December 31, 2019, which was previously accounted for as an equity method investment. Therevenue increase from higher sales volumes was impacted by lower oil prices during the year endedDecember 31, 2019. We sold 23,331 MBbl at an average realized price per barrel of $63.25 in 2019 and12,673 MBbl at an average realized price per barrel of $69.00 in 2018.
Gain on sale of assets. In November 2019, we closed a farm-out agreement with Shell for Blocks 6and 11 offshore Sao Tome and Principe. As part of the transaction, we received proceeds in excess of ourbook basis resulting in a gain of $10.5 million. In August 2018, we closed a farm-out agreement with Tridentcovering blocks S, W and EG-21 offshore Equatorial Guinea. As part of the transaction, we receivedproceeds in excess of our book basis resulting in a gain of $7.7 million.
Other income. Other income, net decreased by $8.1 million as we recognized a gain of $8.0 million in2018 on the exit of the Essaouira Offshore block, located offshore Morocco.
Oil and gas production. Oil and gas production costs increased by $177.9 million during the yearended December 31, 2019 as compared to the year ended December 31, 2018. This is a result of the
75

inclusion of a full year of oil and gas production costs from our U.S. Gulf of Mexico business unit for theperiod ended December 31, 2019 related to the DGE acquisition, versus 108 days of costs in the previousyear’s period. The current year was also impacted by the inclusion of production costs from EquatorialGuinea on a consolidated basis for the year ended December 31, 2019, which was previously accounted foras an equity method investment.
Facilities insurance modifications, net. During the year ended December 31, 2019, we incurred$47.2 million of facilities insurance modification costs associated with the long-term solution to the Jubileeturret bearing issue versus $50.2 million during the year ended December 31, 2018. During the year endedDecember 31, 2019 and 2018, these costs were offset by $71.5 million of hull and machinery insurance proceedsin 2019 as a result of final settlement of the insurance claim and $43.2 million in 2018.
Exploration expenses. Exploration expenses decreased by $120.5 million during the year endedDecember 31, 2019, as compared to the year ended December 31, 2018. During the year ended December 31,2019 we recorded lower unsuccessful well costs of $81.3 million primarily related to U.S. Gulf of Mexicodrilling versus the 2018 period costs of $123.2 million primarily related to Suriname drilling and the Wawa-1and Akasa-1 exploration wells in Ghana, which were previously capitalized as suspended well costs.Additionally, seismic acquisition costs decreased $89.1 million versus the prior period primarily related toactivity in the U.S. Gulf of Mexico.
General and administrative. General and administrative costs increased by $10.2 million during theyear ended December 31, 2019, as compared to the year ended December 31, 2018. This is primarily a resultof having a full year of general and administrative costs from our U.S. Gulf of Mexico business unitduring the year ended December 31, 2019 related to the DGE acquisition, versus 108 days of costs in theprevious year’s period.
Depletion, depreciation and amortization. Depletion, depreciation and amortization increased$234.0 million during the year ended December 31, 2019, as compared with the year ended December 31,2018. The increase is primarily a result of a full year of depletion and amortization costs associated with theacquired U.S. Gulf of Mexico business unit and the inclusion of the Equatorial Guinea business unit,which was previously accounted for as an equity method investment.
Interest and other financing costs, net. Interest and other financing costs, net increased by $53.9 millionprimarily a result of an increase in interest expense from an increased outstanding debt balance, the resultof the DGE acquisition during the third quarter of 2018, and a $24.8 million loss on extinguishment of debtprimarily associated with the refinancing of our senior secured notes recorded during the second quarterof 2019.
Derivatives, net. During the years ended December 31, 2019 and 2018, we recorded a loss of$71.9 million and a gain of $31.4 million, respectively, on our outstanding hedge positions. The gain andloss recorded were a result of changes in the forward curve of oil prices during the respective periods.
Gain on equity method investments, net. During the year ended December 31, 2018 we recognized a$72.9 million gain on our equity method investment in KTIPI. Effective January 1, 2019, our equity methodinvestment in KTIPI was exchanged for a direct interest in the Ceiba Field and Okume Complex, whichwas accounted for under the proportionate consolidation method of accounting during the year endedDecember 31, 2019.
Other expenses, net. Other expenses, net increased $31.1 million primarily related to $11.5 million inrestructuring charges for employee severance and related benefit costs incurred as part of a corporatereorganization and an $8.7 million indirect tax settlement with tax authorities in Senegal during the yearended December 31, 2019, versus a credit resulting from the recovery of disputed charges of $12.9 millionrelated to the arbitration against Tullow Ghana during 2018.
Income tax expense (benefit). For the year ended December 31, 2019, our overall effective tax ratewas impacted by the difference in our 21% U.S. income tax reporting rate and the 35% statutory tax ratesapplicable to our Ghanaian and Equatorial Guinean operations, non-deductible and non-taxable itemsassociated with our U.S., Ghanaian, and Equatorial Guinean operations, and other losses and expenses,primarily related to exploration operations in tax-exempt jurisdictions or in taxable jurisdictions where we
76

have valuation allowances against our deferred tax assets, and therefore, we do not realize any tax benefit onsuch losses or expenses. For the year ended December 31, 2018, our overall effective tax rate was impactedby non-deductible and non-taxable items associated with our U.S. and Ghanaian operations and other lossesand expenses, primarily related to exploration operations in tax-exempt jurisdictions or in taxablejurisdictions where we have valuation allowances against our deferred tax assets, and therefore, we do notrealize any tax benefit on such expenses or losses.
Liquidity and Capital Resources
We are actively engaged in an ongoing process of anticipating and meeting our funding requirementsrelated to our strategy as a full-cycle exploration and production company. We have historically met ourfunding requirements through cash flows generated from our operating activities and obtained additionalfunding from issuances of equity and debt, as well as partner carries.
While we are presently in a strong financial position, commodity prices remain volatile and couldnegatively impact our ability to generate sufficient operating cash flows to meet our funding requirements.To partially mitigate this price volatility, we maintain a hedging program. Our investment decisions are basedon longer-term commodity prices based on the nature of our projects and development plans. Also, BPhas agreed to partially carry our exploration, appraisal and development program in Mauritania and Senegalup to a contractually agreed cap. Current commodity prices, combined with our hedging program, partnercarries and our current liquidity position support our dividend and capital program for 2020.
As such, our 2020 capital budget is based on our exploitation and production plans for Ghana,Equatorial Guinea and the U.S. Gulf of Mexico, our infrastructure-led exploration program in EquatorialGuinea and the U.S. Gulf of Mexico, our appraisal and development activities in our emerging basins and ourbasin opening exploration across the portfolio.
Our future financial condition and liquidity can be impacted by, among other factors, the success ofour exploitation, exploration and appraisal drilling programs, the number of commercially viable oil andnatural gas discoveries made and the quantities of oil and natural gas discovered, the speed with which wecan bring such discoveries to production, the reliability of our oil and gas production facilities, our ability tocontinuously export oil and gas, our ability to secure and maintain partners and their alignment withrespect to capital plans, the actual cost of exploitation, exploration, appraisal and development of our oiland natural gas assets, and coverage of any claims under our insurance policies.
As part of the Facility amendment and restatement process in 2018, the lenders approved aredetermination, setting the total commitments under our Facility at $1.5 billion (effective February 22,2018) which was increased to $1.7 billion (effective January 31, 2019) after the election to exercise $0.2 billionof additional commitments in the fourth quarter of 2018. The commitments were reduced by $100.0 millionto $1.6 billion following the Senior Notes issuance in April 2019. The borrowing base calculation includesvalue related to the Jubilee, TEN, Ceiba and Okume fields.
77

Sources and Uses of Cash
The following table presents the sources and uses of our cash and cash equivalents for the years endedDecember 31, 2019, 2018 and 2017:
Years Ended December 31,
2019 2018 2017
(In thousands)
Sources of cash, cash equivalents and restricted cash:Net cash provided by operating activities . . . . . . . . . . . . . . . . . . $ 628,150 $ 260,491 $236,617Net proceeds from issuance of senior notes . . . . . . . . . . . . . . . . 641,875 — —Return of investment from KTIPI . . . . . . . . . . . . . . . . . . . . . . — 184,664 —Borrowings under long-term debt . . . . . . . . . . . . . . . . . . . . . . . 175,000 1,175,000 200,000Proceeds on sale of assets . . . . . . . . . . . . . . . . . . . . . . . . . . . . . 15,000 13,703 222,068
1,460,025 1,633,858 658,685Uses of cash, cash equivalents and restricted cash:
Oil and gas assets . . . . . . . . . . . . . . . . . . . . . . . . . . . . . . . . . . 340,217 213,806 140,495Other property . . . . . . . . . . . . . . . . . . . . . . . . . . . . . . . . . . . . 11,796 7,935 2,858Acquisition of oil and gas properties . . . . . . . . . . . . . . . . . . . . . — 961,764 —Equity method investment . . . . . . . . . . . . . . . . . . . . . . . . . . . . — — 231,280Notes receivable from partners . . . . . . . . . . . . . . . . . . . . . . . . . 26,918 — —Payments on long-term debt . . . . . . . . . . . . . . . . . . . . . . . . . . . 425,000 325,000 250,000Redemption of senior secured notes . . . . . . . . . . . . . . . . . . . . . 535,338 — —Purchase of treasury stock . . . . . . . . . . . . . . . . . . . . . . . . . . . . 1,983 206,051 2,194Dividends . . . . . . . . . . . . . . . . . . . . . . . . . . . . . . . . . . . . . . . 72,599 — —Deferred financing costs . . . . . . . . . . . . . . . . . . . . . . . . . . . . . 2,444 38,672 67
1,416,295 1,753,228 626,894Increase (decrease) in cash, cash equivalents and restricted cash . . . . $ 43,730 $ (119,370) $ 31,791
Net cash provided by operating activities. Net cash provided by operating activities in 2019 was$628.2 million compared with net cash provided by operating activities of $260.5 million in 2018 and$236.6 million in 2017, respectively. The increase in cash provided by operating activities in the year endedDecember 31, 2019 when compared to the same period in 2018 is primarily a result of the inclusion of a fullyear of our U.S. Gulf of Mexico business unit during the year ended December 31, 2019 related to theDGE acquisition, which was completed during the third quarter of 2018. It is also the result of the inclusionof operations from Equatorial Guinea on a consolidated basis for the year ended December 31, 2019,which was previously accounted for as an equity method investment. The increase in cash provided byoperating activities in the year ended December 31, 2018 when compared to the same period in 2017 isprimarily a result of an increase in oil and gas revenue and a decrease in exploration expenses related to thestacked rig costs and rig option cancellation payment, both recorded during the year ended December 31,2017. These changes were offset by a lack of LOPI proceeds, an increase in unsuccessful well costs and anincrease in payments related to derivative cash settlements.
78

The following table presents our liquidity and financial position as of December 31, 2019:
December 31,2019
(In thousands)
Cash and cash equivalents . . . . . . . . . . . . . . . . . . . . . . . . . . . . . . . . . . . . . . . . . . . . . . . $ 224,502Restricted cash . . . . . . . . . . . . . . . . . . . . . . . . . . . . . . . . . . . . . . . . . . . . . . . . . . . . . . . 4,844Senior Notes at par . . . . . . . . . . . . . . . . . . . . . . . . . . . . . . . . . . . . . . . . . . . . . . . . . . . . 650,000Borrowings under the Facility . . . . . . . . . . . . . . . . . . . . . . . . . . . . . . . . . . . . . . . . . . . . . 1,400,000Drawings under the Corporate Revolver . . . . . . . . . . . . . . . . . . . . . . . . . . . . . . . . . . . . . —
Net debt . . . . . . . . . . . . . . . . . . . . . . . . . . . . . . . . . . . . . . . . . . . . . . . . . . . . . . . . . . $1,820,654
Availability under the Facility . . . . . . . . . . . . . . . . . . . . . . . . . . . . . . . . . . . . . . . . . . . . . $ 200,000Availability under the Corporate Revolver . . . . . . . . . . . . . . . . . . . . . . . . . . . . . . . . . . . . $ 400,000Available borrowings plus cash and cash equivalents . . . . . . . . . . . . . . . . . . . . . . . . . . . . . $ 824,502
Capital Expenditures and Investments
We expect to incur capital costs as we:
• drill additional wells and execute exploitation activities in Ghana, Equatorial Guinea and in the U.S.Gulf of Mexico;
• execute infrastructure-led exploration efforts in the U.S. Gulf of Mexico and Equatorial Guinea;
• execute appraisal and exploration activities in a number of our exploration license areas; and
• acquire and analyze seismic on existing licenses and purchase seismic over new prospective areas.
We have relied on a number of assumptions in budgeting for our future activities. These include thenumber of wells we plan to drill, our participating, paying and carried interests in our prospects includingdisproportionate payment amounts, the costs involved in developing or participating in the development ofa prospect, the timing of third-party projects, the availability of suitable equipment and qualified personneland our cash flows from operations. We also evaluate potential corporate and asset acquisition opportunitiesto support and expand our asset portfolio which may impact our budget assumptions. These assumptions areinherently subject to significant business, political, economic, regulatory, environmental and competitiveuncertainties, contingencies and risks, all of which are difficult to predict and many of which are beyond ourcontrol. We may need to raise additional funds more quickly if market conditions deteriorate; or one ormore of our assumptions proves to be incorrect or if we choose to expand our acquisition, exploration,appraisal, development efforts or any other activity more rapidly than we presently anticipate. We may decideto raise additional funds before we need them if the conditions for raising capital are favorable. We mayseek to sell equity or debt securities or obtain additional bank credit facilities. The sale of equity securitiescould result in dilution to our shareholders. The incurrence of additional indebtedness could result in increasedfixed obligations and additional covenants that could restrict our operations.
2020 Capital Program
We estimate we will spend approximately $325 – $375 million of capital, excluding amounts related toMauritania and Senegal, for the year ending December 31, 2020. This capital expenditure budget consistsof:
• Approximately 40% related to exploitation and production optimization activities across our Ghana,Equatorial Guinea and U.S. Gulf of Mexico assets
• Approximately 50% related to our infrastructure-led exploration and development activities acrossEquatorial Guinea and the U.S. Gulf of Mexico
• Approximately 10% related to basin opening exploration efforts across our portfolio
79

In Mauritania and Senegal we estimate capital expenditures of $250 million based on our currentownership interest, net of any remaining BP carry amounts. We expect to fund this expenditure usingproceeds and/or carries received from our farm-down process.
The ultimate amount of capital we will spend may fluctuate materially based on market conditions andthe success of our exploitation and drilling results among other factors. Our future financial condition andliquidity will be impacted by, among other factors, our level of production of oil and the prices we receivefrom the sale of oil, our ability to effectively hedge future production volumes, the success of ourmulti-faceted exploration and appraisal drilling programs, the number of commercially viable oil andnatural gas discoveries made and the quantities of oil and natural gas discovered, the speed with which wecan bring such discoveries to production, our partners’ alignment with respect to capital plans, and the actualcost of exploitation, exploration, appraisal and development of our oil and natural gas assets, and coverageof any claims under our insurance policies.
Significant Sources of Capital
Facility
In February 2018, the Company amended and restated the Facility with a total commitment of$1.5 billion from a number of financial institutions with additional commitments up to $0.5 billion beingavailable if the existing financial institutions increase their commitments or if commitments from new financialinstitutions are added. In November 2018, the Company exercised its option with existing financialinstitutions to provide the Company with an additional commitment of $100 million in the aggregate underthe Facility. The borrowing base calculation includes value related to the Jubilee, TEN, Ceiba and Okumefields. The Facility supports our oil and gas exploration, appraisal and development programs and corporateactivities. As part of the debt refinancing in February 2018, the repayment of borrowings under theexisting facility attributable to financial institutions that did not participate in the amended Facility wasaccounted for as an extinguishment of debt, and $4.1 million of existing unamortized debt issuance costsand deferred interest attributable to those participants was expensed in interest and other financing costs, net.As of December 31, 2019, we have $32.8 million of unamortized issuance costs related to the Facility,which will be amortized over the remaining term of the Facility. In December 2018, the Company enteredinto letter agreements with existing financial institutions, which provided the Company with an additionalcommitment of $100 million in the aggregate under the Facility effective January 31, 2019. This took the totalcommitments to $1.7 billion as of January 31, 2019. The commitments were reduced by $100.0 million to$1.6 billion following the Senior Notes issuance in April 2019 and remain at $1.6 billion as of December 31,2019.
As of December 31, 2019, borrowings under the Facility totaled $1.4 billion and the undrawn availabilityunder the Facility was $200.0 million, which includes the additional commitments as referenced above.
Interest is the aggregate of the applicable margin (3.25% to 4.50%, depending on the length of timethat has passed from the date the Facility was entered into) and LIBOR. Interest is payable on the last dayof each interest period (and, if the interest period is longer than six months, on the dates falling at six-monthintervals after the first day of the interest period). We pay commitment fees on the undrawn and unavailableportion of the total commitments, if any. Commitment fees are equal to 30% per annum of thethen-applicable respective margin when a commitment is available for utilization and, equal to 20% perannum of the then-applicable respective margin when a commitment is not available for utilization. Werecognize interest expense in accordance with ASC 835—Interest, which requires interest expense to berecognized using the effective interest method. We determined the effective interest rate based on the estimatedlevel of borrowings under the Facility.
The Facility provides a revolving credit and letter of credit facility. The availability period for therevolving credit facility expires one month prior to the final maturity date. The letter of credit facilityexpires on the final maturity date. The available facility amount is subject to borrowing base constraintsand, beginning on March 31, 2022, outstanding borrowings will be constrained by an amortization schedule.The Facility has a final maturity date of March 31, 2025. As of December 31, 2019, we had no letters ofcredit issued under the Facility.
80
We have the right to cancel all the undrawn commitments under the amended and restated Facility. Theamount of funds available to be borrowed under the Facility, also known as the borrowing base amount, isdetermined each year on March 31. The borrowing base amount is based on the sum of the net present valuesof net cash flows and relevant capital expenditures reduced by certain percentages as well as valueattributable to certain assets’ reserves and/or resources in Ghana and Equatorial Guinea.
If an event of default exists under the Facility, the lenders can accelerate the maturity and exerciseother rights and remedies, including the enforcement of security granted pursuant to the Facility overcertain assets held by our subsidiaries. The Facility contains customary cross default provisions.
We were in compliance with the financial covenants contained in the Facility as of September 30, 2019(the most recent assessment date), which requires the maintenance of:
• the field life cover ratio (as defined in the glossary), not less than 1.30x; and
• the loan life cover ratio (as defined in the glossary), not less than 1.10x; and
• the debt cover ratio (as defined in the glossary), not more than 3.5x; and
• the interest cover ratio (as defined in the glossary), not less than 2.25x.
Corporate Revolver
In August 2018, we amended and restated the Corporate Revolver maintaining the borrowing capacityat $400.0 million, extending the maturity date from November 2018 to May 2022 and lowering the margin100 basis points to 5%. This results in lower commitment fees on the undrawn portion of the totalcommitments, which is 30% per annum of the respective margin. The Corporate Revolver is available forgeneral corporate purposes and for oil and gas exploration, appraisal and development programs.
As of December 31, 2019, there were no borrowings outstanding under the Corporate Revolver andthe undrawn availability under the Corporate Revolver was $400.0 million.
Interest is the aggregate of the applicable margin (5.0%), LIBOR and mandatory cost (if any, asdefined in the Corporate Revolver). Interest is payable on the last day of each interest period (and, if theinterest period is longer than six months, on the dates falling at six-month intervals after the first day of theinterest period). We pay commitment fees on the undrawn portion of the total commitments. Commitmentfees for the lenders are equal to 30% per annum of the respective margin when a commitment is available forutilization.
The Corporate Revolver expires on May 31, 2022. The available amount is not subject to borrowingbase constraints. We have the right to cancel all the undrawn commitments under the Corporate Revolver.We are required to repay certain amounts due under the Corporate Revolver with sales of certain subsidiariesor sales of certain assets. If an event of default exists under the Corporate Revolver, the lenders canaccelerate the maturity and exercise other rights and remedies, including the enforcement of security grantedpursuant to the Corporate Revolver over certain assets held by us. The Corporate Revolver containscustomary cross default provisions.
We were in compliance with the financial covenants contained in the Corporate Revolver as ofSeptember 30, 2019 (the most recent assessment date), which requires the maintenance of:
• the debt cover ratio (as defined in the glossary), not more than 3.5x; and
• the interest cover ratio (as defined in the glossary), not less than 2.25x.
The U.S. and many foreign economies continue to experience uncertainty driven by varyingmacroeconomic conditions. Although some of these economies have shown signs of improvement,macroeconomic recovery remains uneven. Uncertainty in the macroeconomic environment and associatedglobal economic conditions have resulted in extreme volatility in credit, equity, and foreign currency markets,including the European sovereign debt markets and volatility in various other markets. If any of thefinancial institutions within our Facility or Corporate Revolver are unable to perform on their commitments,our liquidity could be impacted. We actively monitor all of the financial institutions participating in ourFacility and Corporate Revolver. None of the financial institutions have indicated to us that they may be
81

unable to perform on their commitments. In addition, we periodically review our banking and financingrelationships, considering the stability of the institutions and other aspects of the relationships. Based on ourmonitoring activities, we currently believe our banks will be able to perform on their commitments.
Revolving Letter of Credit Facility
In July 2013, we entered into a revolving letter of credit facility agreement (“LC Facility”). The size ofthe LC Facility was $75.0 million, as amended in July 2015, with additional commitments up to $50.0 millionbeing available if the existing lender increased its commitments or if commitments from new financialinstitutions were added. The LC Facility provides that we shall maintain cash collateral in an amount equalto at least 75% of all outstanding letters of credit under the LC Facility, provided that during the periodof any breach of certain financial covenants, the required cash collateral amount shall increase to 100%.
In July 2016, we amended and restated the LC Facility, extending the maturity date to July 2019.Other amendments included increasing the margin from 0.5% to 0.8% per annum on amounts outstanding,adding a commitment fee payable quarterly in arrears at an annual rate equal to 0.65% on the availablecommitment amount and providing for issuance fees to be payable to the lender per new issuance of a letterof credit. We may voluntarily cancel any commitments available under the LC Facility at any time. Duringthe first quarter of 2017, the LC Facility size was increased to $115.0 million and in April 2017, we reduced thesize of our LC Facility to $70 million. In February 2018, the LC Facility was increased to $73 million tofacilitate the issuance of additional letters of credit. In July 2018 and December 2018, the LC Facility sizewas voluntarily reduced to $40.0 million and$20.0 million, respectively, based on the expiration of severallarge outstanding letters of credit. The LC Facility expired in July 2019, however, as of December 31, 2019,there were five outstanding letters of credit totaling $3.1 million under the LC Facility, which will remainoutstanding until the respective letters of credit expire. The LC Facility contains customary cross defaultprovisions.
In 2019, we issued two letters of credit totaling $20.4 million under a new letter of credit arrangement,which does not currently require cash collateral.
7.875% Senior Secured Notes due 2021
In April 2019, all of the Senior Secured Notes were redeemed for $543.8 million, including accruedinterest and the early redemption premium. The redemption resulted in a $22.9 million loss on extinguishmentof debt, which is included in Interest and other financing costs, net on the Consolidated Statement ofOperations.
7.125% Senior Notes due 2026
In April 2019, the Company issued $650.0 million of 7.125% Senior Notes (the “Senior Notes”) andreceived net proceeds of approximately $640.0 million after deducting commissions and other expenses. Weused the net proceeds to redeem all of the Senior Secured Notes, repay a portion of the outstandingindebtedness under the Corporate Revolver and pay fees and expenses related to the redemption, repaymentand the issuance of the Senior Notes.
The Senior Notes mature on April 4, 2026. We will pay interest in arrears on the Senior Notes eachApril 4 and October 4, commencing on October 4, 2019. The Senior Notes are senior, unsecured obligationsof Kosmos Energy Ltd. and rank equal in right of payment with all of its existing and future seniorindebtedness (including all borrowings under the Corporate Revolver) and rank effectively junior in right ofpayment to all of its existing and future secured indebtedness (including all borrowings under the Facility).The Senior Notes are guaranteed on a senior, unsecured basis by certain subsidiaries owning the Company’sGulf of Mexico assets, and on a subordinated, unsecured basis by certain subsidiaries that guarantee theFacility.
At any time prior to April 4, 2022, and subject to certain conditions, the Company may, on one ormore occasions, redeem up to 40% of the original principal amount of the Senior Notes with an amountnot to exceed the net cash proceeds of certain equity offerings at a redemption price of 107.1% of theoutstanding principal amount of the Senior Notes, together with accrued and unpaid interest and premium,
82

if any, to, but excluding, the date of redemption. Additionally, at any time prior to April 4, 2022 theCompany may, on any one or more occasions, redeem all or a part of the Senior Notes at a redemptionprice equal to 100%, plus any accrued and unpaid interest, and plus a “make-whole” premium. On or afterApril 4, 2022, the Company may redeem all or a part of the Senior Notes at the redemption prices (expressedas percentages of principal amount) set forth below plus accrued and unpaid interest:
Year Percentage
On or after April 4, 2022, but before April 4, 2023 . . . . . . . . . . . . . . . . . . . 103.6%On or after April 4, 2023, but before April 4, 2024 . . . . . . . . . . . . . . . . . . . 101.8%On or after April 4, 2024 and thereafter . . . . . . . . . . . . . . . . . . . . . . . . . . 100.0%
We may also redeem the Senior Notes in whole, but not in part, at any time if changes in tax lawsimpose certain withholding taxes on amounts payable on the Senior Notes at a price equal to the principalamount of the Senior Notes plus accrued interest and additional amounts, if any, as may be necessary so thatthe net amount received by each holder after any withholding or deduction on payments of the SeniorNotes will not be less than the amount such holder would have received if such taxes had not been withheldor deducted.
Upon the occurrence of a change of control triggering event as defined under the Senior Notesindenture, the Company will be required to make an offer to repurchase the Senior Notes at a repurchaseprice equal to 101% of the principal amount, plus accrued and unpaid interest to, but excluding, the date ofrepurchase.
If we sell assets, under certain circumstances outlined in the Senior Notes indenture, we will berequired to use the net proceeds to make an offer to purchase the Senior Notes at an offer price in cash inan amount equal to 100% of the principal amount of the Senior Notes, plus accrued and unpaid interest to,but excluding, the repurchase date.
The Senior Notes indenture restricts our ability and the ability of our restricted subsidiaries to, amongother things: incur or guarantee additional indebtedness, create liens, pay dividends or make distributions inrespect of capital stock, purchase or redeem capital stock, make investments or certain other restrictedpayments, sell assets, enter into agreements that restrict the ability of our subsidiaries to make dividends orother payments to us, enter into transactions with affiliates, or effect certain consolidations, mergers oramalgamations. These covenants are subject to a number of important qualifications and exceptions.Certain of these covenants will be terminated if the Senior Notes are assigned an investment grade ratingby both Standard & Poor’s Rating Services and Fitch Ratings Inc. and no default or event of default hasoccurred and is continuing.
Contractual Obligations
The following table summarizes by period the payments due for our estimated contractual obligationsas of December 31, 2019:
Payments Due By Year(4)
Total 2020 2021 2022 2023 2024 Thereafter
(In thousands)
Principal debt repayments(1) . . . $2,050,000 $ — $174,800 $284,200 $271,600 $440,829 $878,571Interest payments on long-term
debt(2) . . . . . . . . . . . . . . . . 580,098 125,028 116,426 105,812 88,372 71,370 73,090Operating leases(3) . . . . . . . . . 35,774 3,379 4,201 4,264 4,327 3,491 16,112
(1) Includes the scheduled maturities for the $650.0 million aggregate principal amount of Senior Notes issuedin April 2019 and borrowings under the Facility. The scheduled maturities of debt related to the Facility arebased on, as of December 31, 2019, our level of borrowings and our estimated future available borrowingbase commitment levels in future periods. Any increases or decreases in the level of borrowings or increases
83

or decreases in the available borrowing base would impact the scheduled maturities of debt during the nextfive years and thereafter.
(2) Based on outstanding borrowings as noted in (1) above and the LIBOR yield curves at the reporting dateand commitment fees related to the Facility and Corporate Revolver and interest on the Senior Notes.
(3) Primarily relates to corporate office and foreign office leases.(4) Does not include purchase commitments for jointly owned fields and facilities where we are not the operator
and excludes commitments for exploration activities, including well commitments and seismic obligations,in our petroleum contracts. The Company’s liabilities for asset retirement obligations associated with thedismantlement, abandonment and restoration costs of oil and gas properties are not included. See Note 11 ofNotes to the Consolidated Financial Statements included in “Item 8. Financial Statements and SupplementaryData” for additional information regarding these liabilities.
We currently have a commitment to drill one exploration well in each of Sao Tome and Principe andNamibia and two exploration wells in Mauritania. In Sao Tome and Principe, we also have 3D seismicacquisition requirements of approximately 13,500 square kilometers. In South Africa, we have 2D seismicacquisition requirements of approximately 500 line kilometers.
In February 2019, Kosmos and BP signed Carry Advance Agreements with the national oil companiesof Mauritania and Senegal, which obligate us separately to finance the respective national oil company’sshare of certain development costs. Kosmos’ total share for the two agreements combined is up to$239.7 million, which is to be repaid through the national oil companies’ share of future revenues.
The following table presents maturities by expected debt maturity dates, the weighted-average interestrates expected to be paid on the Facility given current contractual terms and market conditions, and thedebt’s estimated fair value. Weighted-average interest rates are based on implied forward rates in the yieldcurve at the reporting date. This table does not take into account amortization of deferred financing costs.
Years Ending December 31,
Asset(Liability)
Fair Value atDecember 31,
2020 2021 2022 2023 2024 Thereafter 2019
(In thousands, except percentages)
Fixed rate debt:Senior Notes . . . . . $ — $ — $ — $ — $ — $650,000 $ (664,957)Fixed interest rate . . 7.13% 7.13% 7.13% 7.13% 7.13% 7.13%
Variable rate debt:Facility(1) . . . . . . . $ — $174,800 $284,200 $271,600 $440,829 $228,571 $(1,400,000)Weighted average
interest rate(2) . . 4.94% 4.75% 5.19% 5.33% 5.88% 6.28
(1) The amounts included in the table represent principal maturities only. The scheduled maturities of debt arebased on the level of borrowings and the available borrowing base as of December 31, 2019. Any increases ordecreases in the level of borrowings or increases or decreases in the available borrowing base would impactthe scheduled maturities of debt during the next five years and thereafter.
(2) Based on outstanding borrowings as noted in (1) above and the LIBOR yield curves plus applicablemargin at the reporting date. Excludes commitment fees related to the Facility and Corporate Revolver.
84

Off-Balance Sheet Arrangements
We may enter into off-balance sheet arrangements and transactions that can give rise to materialoff-balance sheet obligations. As of December 31, 2019, our material off-balance sheet arrangements andtransactions include short-term operating leases and undrawn letters of credit. There are no other transactions,arrangements, or other relationships with unconsolidated entities or other persons that are reasonablylikely to materially affect Kosmos’ liquidity or availability of or requirements for capital resources.
Critical Accounting Policies
This discussion of financial condition and results of operations is based upon the information reportedin our consolidated financial statements, which have been prepared in accordance with generally acceptedaccounting principles in the United States. The preparation of our financial statements requires us to makeassumptions and estimates that affect the reported amounts of assets, liabilities, revenues and expenses, as wellas the disclosure of contingent assets and liabilities as of the date the financial statements are available tobe issued. We base our assumptions and estimates on historical experience and other sources that we believeto be reasonable at the time. Actual results may vary from our estimates. Our significant accountingpolicies are detailed in “Item 8. Financial Statements and Supplementary Data—Note 2—AccountingPolicies.” We have outlined below certain accounting policies that are of particular importance to thepresentation of our financial position and results of operations and require the application of significantjudgment or estimates by our management.
Revenue Recognition. We recognize revenues on the volumes sold of hydrocarbons sold to a purchaser.The volumes sold may be more or less than the volumes to which we are entitled based on our ownershipinterest in the property. These differences result in a condition known in the industry as a productionimbalance. A receivable or liability is recognized only to the extent that we have an imbalance on a specificproperty greater than the expected remaining proved reserves on such property. As of December 31, 2019 and2018, we had no oil and gas imbalances recorded in our consolidated financial statements.
Our oil and gas revenues are recognized when production has been sold to a purchaser at a fixed ordeterminable price, title has transferred and collectability is probable. Certain revenues are based onprovisional price contracts which contain an embedded derivative that is required to be separated from thehost contract for accounting purposes. The host contract is the receivable from oil sales at the spot price on thedate of sale. The embedded derivative, which is not designated as a hedge, is marked to market through oiland gas revenue each period until the final settlement occurs, which generally is limited to the month after thesale.
Exploration and Development Costs. We follow the successful efforts method of accounting for our oiland gas properties. Acquisition costs for proved and unproved properties are capitalized when incurred. Costsof unproved properties are transferred to proved properties when a determination that proved reserveshave been found. Exploration costs, including geological and geophysical costs and costs of carryingunproved properties, are charged to expense as incurred. Exploratory drilling costs are capitalized whenincurred. If exploratory wells are determined to be commercially unsuccessful or dry holes, the applicablecosts are expensed. Costs incurred to drill and equip development wells, including unsuccessful developmentwells, are capitalized. Costs incurred to operate and maintain wells and equipment and to lift crude oil andnatural gas to the surface are expensed.
Receivables. Our receivables consist of joint interest billings, oil sales and other receivables. For ourGhana oil sales receivable, we require a letter of credit to be posted to secure the outstanding receivable.Receivables from joint interest owners are stated at amounts due, net of any allowances for doubtful accounts.We determine our allowance by considering the length of time past due, future net revenues of the debtor’sownership interest in oil and natural gas properties we operate, and the owner’s ability to pay its obligation,among other things.
Income Taxes. We account for income taxes as required by the ASC 740—Income Taxes (“ASC 740”).We make certain estimates and judgments in determining our income tax expense for financial reportingpurposes. These estimates and judgments occur in the calculation of certain tax assets and liabilities that arisefrom differences in the timing and recognition of revenue and expense for tax and financial reporting
85

purposes. Our federal, state and international tax returns are generally not prepared or filed before theconsolidated financial statements are prepared; therefore, we estimate the tax basis of our assets and liabilitiesat the end of each period as well as the effects of changes in tax laws or tax rates, tax credits, and netoperating loss carryforwards. Adjustments related to these estimates are recorded in our tax provision in theperiod in which we file our income tax returns. Further, we must assess the likelihood that we will be ableto realize or utilize our deferred tax assets. If realization is not more likely than not, we must record a valuationallowance against such deferred tax assets for the amount we would not expect to recover, which wouldresult in no benefit for the deferred tax amounts. As of December 31, 2019 and 2018, we have a valuationallowance to reduce certain deferred tax assets to amounts that are more likely than not to be realized. If ourestimates and judgments regarding our ability to realize our deferred tax assets change, the benefitsassociated with those deferred tax assets may increase or decrease in the period our estimates and judgmentschange. On a quarterly basis, management evaluates the need for and adequacy of valuation allowancesbased on the expected realizability of the deferred tax assets and adjusts the amount of such allowances, ifnecessary.
ASC 740 provides a more-likely-than-not standard in evaluating whether a valuation allowance isnecessary after weighing all of the available evidence. When evaluating the need for a valuation allowance,we consider all available positive and negative evidence, including the following:
• the status of our operations in the particular taxing jurisdiction, including whether we havecommenced production from a commercial discovery;
• whether a commercial discovery has resulted in significant proved reserves that have beenindependently verified;
• the amounts and history of taxable income or losses in a particular jurisdiction;
• projections of future income, including the sensitivity of such projections to changes in productionvolumes and prices;
• the existence, or lack thereof, of statutory limitations on the period that net operating losses may becarried forward in a jurisdiction; and
• the creation and timing of future income associated with the reversal of deferred tax liabilities inexcess of deferred tax assets.
Derivative Instruments and Hedging Activities. We utilize oil derivative contracts to mitigate ourexposure to commodity price risk associated with our anticipated future oil production. These derivativecontracts consist of collars, put options, call options and swaps. We have also previously used interest ratederivative contracts to mitigate our exposure to interest rate fluctuations related to our long-term debt. Ourderivative financial instruments are recorded on the balance sheet as either assets or a liabilities measuredat fair value. We do not apply hedge accounting to our oil derivative contracts.
Estimates of Proved Oil and Natural Gas Reserves. Reserve quantities and the related estimates offuture net cash flows affect our periodic calculations of depletion and assessment of impairment of our oiland natural gas properties. Proved oil and natural gas reserves are the estimated quantities of crude oil, naturalgas and natural gas liquids which geological and engineering data demonstrate with reasonable certainty tobe recoverable in future periods from known reservoirs under existing economic and operating conditions. Asadditional proved reserves are discovered, reserve quantities and future cash flows will be estimated byindependent petroleum consultants and prepared in accordance with guidelines established by the SEC andthe FASB. The accuracy of these reserve estimates is a function of:
• the engineering and geological interpretation of available data;
• estimates of the amount and timing of future operating cost, production taxes, development costand workover cost;
• the accuracy of various mandated economic assumptions; and
• the judgments of the persons preparing the estimates.
Asset Retirement Obligations. We account for asset retirement obligations as required by the ASC 410—Asset Retirement and Environmental Obligations. Under these standards, the fair value of a liability for an
86

asset retirement obligation is recognized in the period in which it is incurred if a reasonable estimate of fairvalue can be made. If a reasonable estimate of fair value cannot be made in the period the asset retirementobligation is incurred, the liability is recognized when a reasonable estimate of fair value can be made. If atangible long-lived asset with an existing asset retirement obligation is acquired, a liability for thatobligation shall be recognized at the asset’s acquisition date as if that obligation were incurred on that date.In addition, a liability for the fair value of a conditional asset retirement obligation is recorded if the fairvalue of the liability can be reasonably estimated. We capitalize the asset retirement costs by increasing thecarrying amount of the related long-lived asset by the same amount as the liability. We record increases in thediscounted abandonment liability resulting from the passage of time in depletion, depreciation andamortization in the consolidated statement of operations. Estimating the future restoration and removalcosts requires management to make estimates and judgments because most of the removal obligations aremany years in the future and contracts and regulations often have vague descriptions of what constitutesremoval. Additionally, asset removal technologies and costs are constantly changing, as are regulatory,political, environmental, safety and public relations considerations.
Inherent in the present value calculation are numerous assumptions and judgments including theultimate settlement amounts, inflation factors, credit adjusted discount rates, timing of settlement andchanges in the legal, regulatory, environmental and political environments. To the extent future revisions tothese assumptions impact the present value of the existing asset retirement obligations, a correspondingadjustment is made to the oil and gas property balance.
Impairment of Long-Lived Assets. We review our long-lived assets for impairment when changes incircumstances indicate that the carrying amount of an asset may not be recoverable. ASC 360—Property,Plant and Equipment requires an impairment loss to be recognized if the carrying amount of a long-livedasset is not recoverable and exceeds its fair value. The carrying amount of a long-lived asset is not recoverableif it exceeds the sum of the undiscounted cash flows expected to result from the use and eventual dispositionof the asset. That assessment shall be based on the carrying amount of the asset at the date it is tested forrecoverability, whether in use or under development. An impairment loss shall be measured as the amount bywhich the carrying amount of a long-lived asset exceeds its fair value. Assets to be disposed of and assetsnot expected to provide any future service potential to us are recorded at the lower of carrying amount or fairvalue less cost to sell.
We believe the assumptions used in our undiscounted cash flow analysis to test for impairment areappropriate and result in a reasonable estimate of future cash flows. The undiscounted cash flows from theanalysis exceeded the carrying amount of our long-lived assets. The most significant assumptions are thepricing and production estimates used in undiscounted cash flow analysis. Where unproved reserves exist,an appropriately risk-adjusted amount of these reserves may be included in the evaluation. In order toevaluate the sensitivity of the assumptions, we assumed a hypothetical reduction in our production profile andlower pricing during the early years which still showed no impairment. If we experience further declines inoil pricing, increases in our estimated future expenditures or a decrease in our estimated production profileour long-lived assets could be at risk for impairment.
Consolidations / Equity Method of Accounting. The Consolidated Financial Statements include theaccounts of our wholly-owned subsidiaries. They also include Kosmos’ share of the undivided interest incertain assets, liabilities, revenues and expenses. Investments in corporate joint ventures, which we exercisesignificant influence over, are accounted for using the equity method of accounting.
Equity method investments are integral to our operations. The other parties, who also have an equityinterest in these companies, are independent third parties. Kosmos does not invest in these companies inorder to remove liabilities from its balance sheet.
New Accounting Pronouncements
See “Item 8. Financial Statements and Supplementary Data—Note 2—Accounting Policies” for adiscussion of recent accounting pronouncements.
87

Item 7A. Qualitative and Quantitative Disclosures About Market Risk
The primary objective of the following information is to provide forward-looking quantitative andqualitative information about our potential exposure to market risks. The term “market risks” as it relatesto our currently anticipated transactions refers to the risk of loss arising from changes in commodity pricesand interest rates. These disclosures are not meant to be precise indicators of expected future losses, butrather indicators of reasonably possible losses. This forward-looking information provides indicators of howwe view and manage ongoing market risk exposures. We enter into market-risk sensitive instruments forpurposes other than to speculate.
We manage market and counterparty credit risk in accordance with our policies. In accordance withthese policies and guidelines, our management determines the appropriate timing and extent of derivativetransactions. See “Item 8. Financial Statements and Supplementary Data—Note 2—Accounting Policies,Note 9—Derivative Financial Instruments and Note 10—Fair Value Measurements” for a description of theaccounting procedures we follow relative to our derivative financial instruments.
The following table reconciles the changes that occurred in fair values of our open derivative contractsduring the year ended December 31, 2019:
Derivative ContractsAssets (Liabilities)
Commodities
(In thousands)
Fair value of contracts outstanding as of December 31, 2018 . . . . . . . . . . . . . $ 30,744Changes in contract fair value . . . . . . . . . . . . . . . . . . . . . . . . . . . . . . . . . . (70,724)Contract maturities . . . . . . . . . . . . . . . . . . . . . . . . . . . . . . . . . . . . . . . . . . 31,458Fair value of contracts outstanding as of December 31, 2019 . . . . . . . . . . . . . $ (8,522)
Commodity Price Risk
The Company’s revenues, earnings, cash flows, capital investments and, ultimately, future rate ofgrowth are highly dependent on the prices we receive for our crude oil, which have historically been veryvolatile. Substantially all of our oil sales are indexed against Dated Brent, Eugene Island, Heavy LouisianaSweet and Mars crude.
Commodity Derivative Instruments
We enter into various oil derivative contracts to mitigate our exposure to commodity price riskassociated with anticipated future oil production. These contracts currently consist of collars, put options,call options and swaps. In regards to our obligations under our various commodity derivative instruments, ifour production does not exceed our existing hedged positions, our exposure to our commodity derivativeinstruments would increase.
88

Commodity Price Sensitivity
The following table provides information about our oil derivative financial instruments that weresensitive to changes in oil prices as of December 31, 2019:
Weighted Average Price per BblAsset
(Liability)Fair Value atDecember 31,
2019(2)Term Type of Contract Index MBbl
NetDeferredPremiumPayable/
(Receivable) Swap Sold Put Floor Ceiling
2020January—December . . . . . Three-way collars Dated Brent 6,000 $0.45 $ — $45.00 $57.50 $80.18 $ 5,888January—December . . . . . Swaps with sold puts Dated Brent 2,000 — 60.53 48.75 — — (6,038)January—December . . . . . Put spread Dated Brent 6,000 0.75 — 50.00 59.17 — 6,678January—December . . . . . Sold calls(1) Dated Brent 8,000 1.17 — — — 85.00 (782)
2021January—December . . . . . Swaps with sold puts Dated Brent 2,000 — 60.56 47.50 — — (1,311)January—December . . . . . Sold calls(1) Dated Brent 6,000 — — — — 71.67 (9,669)
(1) Represents call option contracts sold to counterparties to enhance other derivative positions.
(2) Fair values are based on the average forward oil prices on December 31, 2019.
In February 2020, we entered into put option contracts for 3,700.0 MMBbl from February 2020through December 2020 to move the previous three-way collar sold puts at a weighted average price of$42.50 per barrel to $50.00 per barrel. We used part of the proceeds from the trades to enter into swap andsold put contracts for 2,000.0 MMBbl from January 2021 through December 2021 with a fixed price of $60.00per barrel and a sold put price of $50.00 per barrel. The contracts are indexed to Dated Brent prices.
At December 31, 2019, our open commodity derivative instruments were in a net liability position of$5.2 million. As of December 31, 2019, a hypothetical 10% price increase in the commodity futures pricecurves would decrease future pre-tax earnings by approximately $54.6 million. Similarly, a hypothetical 10%price decrease would increase future pre-tax earnings by approximately $49.2 million.
Interest Rate Sensitivity
At December 31, 2019, we had indebtedness outstanding under the Facility of $1.4 billion, which boreinterest at a floating rate. The interest rate on this indebtedness as of December 31, 2019 was approximately5.3%. If LIBOR increased 10% at this level of floating rate debt, we would pay an additional $2.9 millionin interest expense per year. We pay commitment fees on the $200.0 million of undrawn availability under theFacility and on the $400.0 million of undrawn availability under the Corporate Revolver at December 31,2019, which are not subject to changes in interest rates.
89

Item 8. Financial Statements and Supplementary Data
INDEX TO CONSOLIDATED FINANCIAL STATEMENTS
Page
Consolidated Financial Statements of Kosmos Energy Ltd.:
Reports of Independent Registered Public Accounting Firm . . . . . . . . . . . . . . . . . . . . . . . . 91
Consolidated Balance Sheets . . . . . . . . . . . . . . . . . . . . . . . . . . . . . . . . . . . . . . . . . . . . . . 95
Consolidated Statements of Operations . . . . . . . . . . . . . . . . . . . . . . . . . . . . . . . . . . . . . . 96
Consolidated Statements of Shareholders’ Equity . . . . . . . . . . . . . . . . . . . . . . . . . . . . . . . 97
Consolidated Statements of Cash Flows . . . . . . . . . . . . . . . . . . . . . . . . . . . . . . . . . . . . . . 98
Notes to Consolidated Financial Statements . . . . . . . . . . . . . . . . . . . . . . . . . . . . . . . . . . . 99
Supplemental Oil and Gas Data (Unaudited) . . . . . . . . . . . . . . . . . . . . . . . . . . . . . . . . . . 140
Supplemental Quarterly Financial Information (Unaudited) . . . . . . . . . . . . . . . . . . . . . . . . 147
90

Report of Independent Registered Public Accounting Firm
To the Shareholders and the Board of Directors of Kosmos Energy Ltd.
Opinion on the Financial Statements
We have audited the accompanying consolidated balance sheets of Kosmos Energy Ltd. (the Company)as of December 31, 2019 and 2018, the related consolidated statements of operations, shareholders’ equityand cash flows for each of the three years in the period ended December 31, 2019, and the related notes andfinancial statement schedules listed in the Index at Item 15(a) (collectively referred to as the “consolidatedfinancial statements”). In our opinion, the consolidated financial statements present fairly, in all materialrespects, the financial position of the Company as of December 31, 2019 and 2018, and the results of itsoperations and its cash flows for each of the three years in the period ended December 31, 2019, inconformity with US generally accepted accounting principles.
We also have audited, in accordance with the standards of the Public Company Accounting OversightBoard (United States) (PCAOB), the Company’s internal control over financial reporting as of December 31,2019, based on criteria established in Internal Control-Integrated Framework issued by the Committee ofSponsoring Organizations of the Treadway Commission (2013 framework) and our report dated February 24,2020 expressed an unqualified opinion thereon.
Basis for Opinion
These consolidated financial statements are the responsibility of the Company’s management. Ourresponsibility is to express an opinion on the Company’s consolidated financial statements based on ouraudits. We are a public accounting firm registered with the PCAOB and are required to be independent withrespect to the Company in accordance with the US federal securities laws and the applicable rules andregulations of the Securities and Exchange Commission and the PCAOB.
We conducted our audits in accordance with the standards of the PCAOB. Those standards requirethat we plan and perform the audit to obtain reasonable assurance about whether the financial statementsare free of material misstatement, whether due to error or fraud. Our audits included performing proceduresto assess the risks of material misstatement of the consolidated financial statements, whether due to erroror fraud, and performing procedures that respond to those risks. Such procedures include examining, on a testbasis, evidence regarding the amounts and disclosures in the consolidated financial statements. Our auditsalso included evaluating the accounting principles used and significant estimates made by management, aswell as evaluating the overall presentation of the consolidated financial statements. We believe that ouraudits provide a reasonable basis for our opinion.
Critical Audit Matters
The critical audit matters communicated below are matters arising from the current period audit of thefinancial statements that were communicated or required to be communicated to the audit committee andthat: (1) relate to accounts or disclosures that are material to the financial statements and (2) involved ourespecially challenging, subjective, or complex judgments. The communication of critical audit matters doesnot alter in any way our opinion on the consolidated financial statements, taken as a whole, and we arenot, by communicating the critical audit matters below, providing separate opinions on the critical auditmatters or on the accounts or disclosures to which they relate.
91

Depletion of Proved Oil and Natural Gas PropertiesDescription of theMatter
At December 31, 2019, the net book value of the Company’s proved oil and naturalgas properties was $2.811 billion, and depletion expense was $542.9 million for theyear then ended. As described in Note 2, the Company follows the successful effortsmethod of accounting for its oil and natural gas properties. Proved properties andsupport equipment and facilities are depleted using the unit of production methodbased on estimated proved oil and natural gas reserves. Capitalized exploratorydrilling costs that result in a discovery of proved reserves and development costs aredepleted using the unit of production method based on estimated proved developedoil and natural gas reserves for the related field. The Company’s oil and natural gasreserves are estimated by independent reserve engineers. Proved oil and natural gasreserves are the estimated quantities of crude oil, natural gas and natural gas liquidsthat geological and engineering data demonstrate with reasonable certainty to berecoverable in future periods from known reservoirs under existing economic andoperating conditions. Significant judgment is required by the Company’sindependent reserve engineers in evaluating geological and engineering data whenestimating proved oil and natural gas reserves. Estimating reserves also requires theselection of inputs, including oil and natural gas price assumptions and futureoperating and capital cost assumptions, among others. Because of the complexityinvolved in estimating oil and natural gas reserves, management used independentreserve engineers to prepare the estimate of reserve quantities as of December 31,2019.
Auditing the Company’s depletion calculation is complex because of the use of thework of independent reserve engineers and the evaluation of management’sdetermination of the inputs described above used by the independent reserveengineers in estimating proved oil and natural gas reserves.
How We Addressedthe Matter in OurAudit
We obtained an understanding, evaluated the design and tested the operatingeffectiveness of the controls over the Company’s process to calculate depletion,including management’s controls over the completeness and accuracy of the financialdata and inputs provided to the independent reserve engineers for use in estimatingthe proved oil and natural gas reserves.
Our audit procedures included, among others, evaluating the professionalqualifications and objectivity of the independent reserve engineers used to preparethe estimate of proved oil and natural gas reserves. Additionally, in assessing whetherwe can use the work of the independent reserve engineers we evaluated thecompleteness and accuracy of the financial data and inputs described above used bythe independent reserve engineers in estimating proved oil and natural gas reservesby agreeing them to source documentation and we identified and evaluatedcorroborative and contrary evidence. For proved undeveloped reserves, we evaluatedmanagement’s development plan for compliance with the Securities and ExchangeCommission rule that undrilled locations are scheduled to be drilled withinfive years, unless specific circumstances justify a longer time, by assessing consistencyof the development projections with the Company’s drill plan and the availability ofcapital relative to the drill plan. We also tested the mathematical accuracy of thedepletion calculations, including comparing the estimated proved oil and natural gasreserve amounts used to the Company’s reserve report.
92

Asset Retirement ObligationsDescription of theMatter
At December 31, 2019, the Company’s asset retirement obligations totaled$235.1 million. As described in Note 2, the fair value of a liability for an assetretirement obligation is recognized in the period in which it is incurred if areasonable estimate of fair value can be made. If a tangible long-lived asset with anexisting asset retirement obligation is acquired, a liability for that obligation isrecognized at the asset’s acquisition or in-service date.
Auditing the Company’s asset retirement obligations was complex and highlyjudgmental due to the significant estimation required by management to determinethe estimated present value of the amount of dismantlement, removal, sitereclamation and similar activities associated with the Company’s oil and natural gasproperties. In particular, the estimate was sensitive to significant assumptions such asthe expected cash outflows for retirement obligations and the ultimate productive lifeof the properties.
How We Addressedthe Matter in OurAudit
We obtained an understanding, evaluated the design and tested the operatingeffectiveness of the controls over the Company’s process to estimate asset retirementobligations, including controls over management’s review of the significantassumptions described above.
Our audit procedures included, among others, testing the significant assumptionsdiscussed above and the underlying data used by the Company. For example, weevaluated expected cash outflows for asset retirement obligations by comparing torecent offshore activities and costs. We also compared the ultimate productive life ofthe properties to forecasts of production based on estimates of proved oil andnatural gas reserves, as estimated by independent reserve engineers. We involved ourspecialists to assist in our evaluation of the expected cash flows for retirementobligations.
/s/ Ernst & Young LLP
We have served as the Company’s auditor since 2004.
Dallas, TexasFebruary 24, 2020
93

Report of Independent Registered Public Accounting Firm
To the Shareholders and the Board of Directors of Kosmos Energy Ltd.
Opinion on Internal Control over Financial Reporting
We have audited Kosmos Energy Ltd.’s internal control over financial reporting as of December 31,2019, based on criteria established in Internal Control—Integrated Framework issued by the Committee ofSponsoring Organizations of the Treadway Commission (2013 framework) (the COSO criteria). In ouropinion, Kosmos Energy Ltd. (the Company) maintained, in all material respects, effective internal controlover financial reporting as of December 31, 2019, based on the COSO criteria.
We also have audited, in accordance with the standards of the Public Company Accounting OversightBoard (United States) (PCAOB), the consolidated balance sheets of the Company as of December 31, 2019and 2018, the related consolidated statements of operations, shareholders’ equity, and cash flows for eachof the three years in the period ended December 31, 2019, and the related notes and financial statementschedules listed in the Index at Item 15(a) and our report dated February 24, 2020 expressed an unqualifiedopinion thereon.
Basis for Opinion
The Company’s management is responsible for maintaining effective internal control over financialreporting and for its assessment of the effectiveness of internal control over financial reporting included inthe accompanying Management’s Annual Report on Internal Control over Financial Reporting appearing inItem 9A. Our responsibility is to express an opinion on the Company’s internal control over financialreporting based on our audit. We are a public accounting firm registered with the PCAOB and are requiredto be independent with respect to the Company in accordance with the US federal securities laws and theapplicable rules and regulations of the Securities and Exchange Commission and the PCAOB.
We conducted our audit in accordance with the standards of the PCAOB. Those standards require thatwe plan and perform the audit to obtain reasonable assurance about whether effective internal control overfinancial reporting was maintained in all material respects.
Our audit included obtaining an understanding of internal control over financial reporting, assessingthe risk that a material weakness exists, testing and evaluating the design and operating effectiveness ofinternal control based on the assessed risk, and performing such other procedures as we considered necessaryin the circumstances. We believe that our audit provides a reasonable basis for our opinion.
Definition and Limitations of Internal Control Over Financial Reporting
A company’s internal control over financial reporting is a process designed to provide reasonableassurance regarding the reliability of financial reporting and the preparation of financial statements forexternal purposes in accordance with generally accepted accounting principles. A company’s internal controlover financial reporting includes those policies and procedures that (1) pertain to the maintenance ofrecords that, in reasonable detail, accurately and fairly reflect the transactions and dispositions of the assetsof the company; (2) provide reasonable assurance that transactions are recorded as necessary to permitpreparation of financial statements in accordance with generally accepted accounting principles, and thatreceipts and expenditures of the company are being made only in accordance with authorizations ofmanagement and directors of the company; and (3) provide reasonable assurance regarding prevention ortimely detection of unauthorized acquisition, use, or disposition of the company’s assets that could have amaterial effect on the financial statements.
Because of its inherent limitations, internal control over financial reporting may not prevent or detectmisstatements. Also, projections of any evaluation of effectiveness to future periods are subject to the riskthat controls may become inadequate because of changes in conditions, or that the degree of compliance withthe policies or procedures may deteriorate.
/s/ Ernst & Young LLP
Dallas, TexasFebruary 24, 2020
94

KOSMOS ENERGY LTD.
CONSOLIDATED BALANCE SHEETS
(In thousands, except share data)
December 31,2019 2018
AssetsCurrent assets:
Cash and cash equivalents . . . . . . . . . . . . . . . . . . . . . . . . . . . . . . . . . . . . . . . . $ 224,502 $ 173,515Restricted cash . . . . . . . . . . . . . . . . . . . . . . . . . . . . . . . . . . . . . . . . . . . . . . . 4,302 4,527Receivables:
Joint interest billings, net . . . . . . . . . . . . . . . . . . . . . . . . . . . . . . . . . . . . . . . 81,424 64,572Oil sales . . . . . . . . . . . . . . . . . . . . . . . . . . . . . . . . . . . . . . . . . . . . . . . . . . 64,142 48,164Related party . . . . . . . . . . . . . . . . . . . . . . . . . . . . . . . . . . . . . . . . . . . . . . — 5,580Other . . . . . . . . . . . . . . . . . . . . . . . . . . . . . . . . . . . . . . . . . . . . . . . . . . . 28,727 21,690
Inventories . . . . . . . . . . . . . . . . . . . . . . . . . . . . . . . . . . . . . . . . . . . . . . . . . 114,412 84,827Prepaid expenses and other . . . . . . . . . . . . . . . . . . . . . . . . . . . . . . . . . . . . . . . 36,192 68,040Derivatives . . . . . . . . . . . . . . . . . . . . . . . . . . . . . . . . . . . . . . . . . . . . . . . . . 12,856 38,785
Total current assets . . . . . . . . . . . . . . . . . . . . . . . . . . . . . . . . . . . . . . . . . . . . . . 566,557 509,700
Property and equipment:Oil and gas properties, net . . . . . . . . . . . . . . . . . . . . . . . . . . . . . . . . . . . . . . . . 3,624,751 3,444,864Other property, net . . . . . . . . . . . . . . . . . . . . . . . . . . . . . . . . . . . . . . . . . . . . 17,581 14,837
Property and equipment, net . . . . . . . . . . . . . . . . . . . . . . . . . . . . . . . . . . . . . . . . 3,642,332 3,459,701
Other assets:Equity method investment . . . . . . . . . . . . . . . . . . . . . . . . . . . . . . . . . . . . . . . — 51,896Restricted cash . . . . . . . . . . . . . . . . . . . . . . . . . . . . . . . . . . . . . . . . . . . . . . . 542 7,574Long-term receivables . . . . . . . . . . . . . . . . . . . . . . . . . . . . . . . . . . . . . . . . . . 43,430 19,002Deferred financing costs, net of accumulated amortization of $14,681 and $12,065 at
December 31, 2019 and December 31, 2018, respectively . . . . . . . . . . . . . . . . . . . 6,321 8,937Deferred tax assets . . . . . . . . . . . . . . . . . . . . . . . . . . . . . . . . . . . . . . . . . . . . 32,779 14,004Derivatives . . . . . . . . . . . . . . . . . . . . . . . . . . . . . . . . . . . . . . . . . . . . . . . . . 2,302 14,312Other . . . . . . . . . . . . . . . . . . . . . . . . . . . . . . . . . . . . . . . . . . . . . . . . . . . . . 22,969 3,063
Total assets . . . . . . . . . . . . . . . . . . . . . . . . . . . . . . . . . . . . . . . . . . . . . . . . . . $ 4,317,232 $ 4,088,189
Liabilities and stockholders’ equityCurrent liabilities:
Accounts payable . . . . . . . . . . . . . . . . . . . . . . . . . . . . . . . . . . . . . . . . . . . . . $ 149,483 $ 176,540Accrued liabilities . . . . . . . . . . . . . . . . . . . . . . . . . . . . . . . . . . . . . . . . . . . . . 380,704 195,596Derivatives . . . . . . . . . . . . . . . . . . . . . . . . . . . . . . . . . . . . . . . . . . . . . . . . . 8,914 12,172
Total current liabilities . . . . . . . . . . . . . . . . . . . . . . . . . . . . . . . . . . . . . . . . . . . 539,101 384,308
Long-term liabilities:Long-term debt, net . . . . . . . . . . . . . . . . . . . . . . . . . . . . . . . . . . . . . . . . . . . 2,008,063 2,120,547Derivatives . . . . . . . . . . . . . . . . . . . . . . . . . . . . . . . . . . . . . . . . . . . . . . . . . 11,478 10,181Asset retirement obligations . . . . . . . . . . . . . . . . . . . . . . . . . . . . . . . . . . . . . . 230,526 145,336Deferred tax liabilities . . . . . . . . . . . . . . . . . . . . . . . . . . . . . . . . . . . . . . . . . . 653,221 477,179Other long-term liabilities . . . . . . . . . . . . . . . . . . . . . . . . . . . . . . . . . . . . . . . . 33,141 9,160
Total long-term liabilities . . . . . . . . . . . . . . . . . . . . . . . . . . . . . . . . . . . . . . . . . . 2,936,429 2,762,403
Stockholders’ equity:Preference shares, $0.01 par value; 200,000,000 authorized shares; zero issued at
December 31, 2019 and December 31, 2018 . . . . . . . . . . . . . . . . . . . . . . . . . . . — —Common stock, $0.01 par value; 2,000,000,000 authorized shares; 445,779,367 and
442,914,675 issued at December 31, 2019 and December 31, 2018, respectively . . . . . 4,458 4,429Additional paid-in capital . . . . . . . . . . . . . . . . . . . . . . . . . . . . . . . . . . . . . . . . 2,297,221 2,341,249Accumulated deficit . . . . . . . . . . . . . . . . . . . . . . . . . . . . . . . . . . . . . . . . . . . (1,222,970) (1,167,193)Treasury stock, at cost, 44,263,269 shares at December 31, 2019 and 2018, respectively . . (237,007) (237,007)
Total stockholders’ equity . . . . . . . . . . . . . . . . . . . . . . . . . . . . . . . . . . . . . . . . . 841,702 941,478Total liabilities and stockholders’ equity . . . . . . . . . . . . . . . . . . . . . . . . . . . . . . . . . $ 4,317,232 $ 4,088,189
See accompanying notes.95
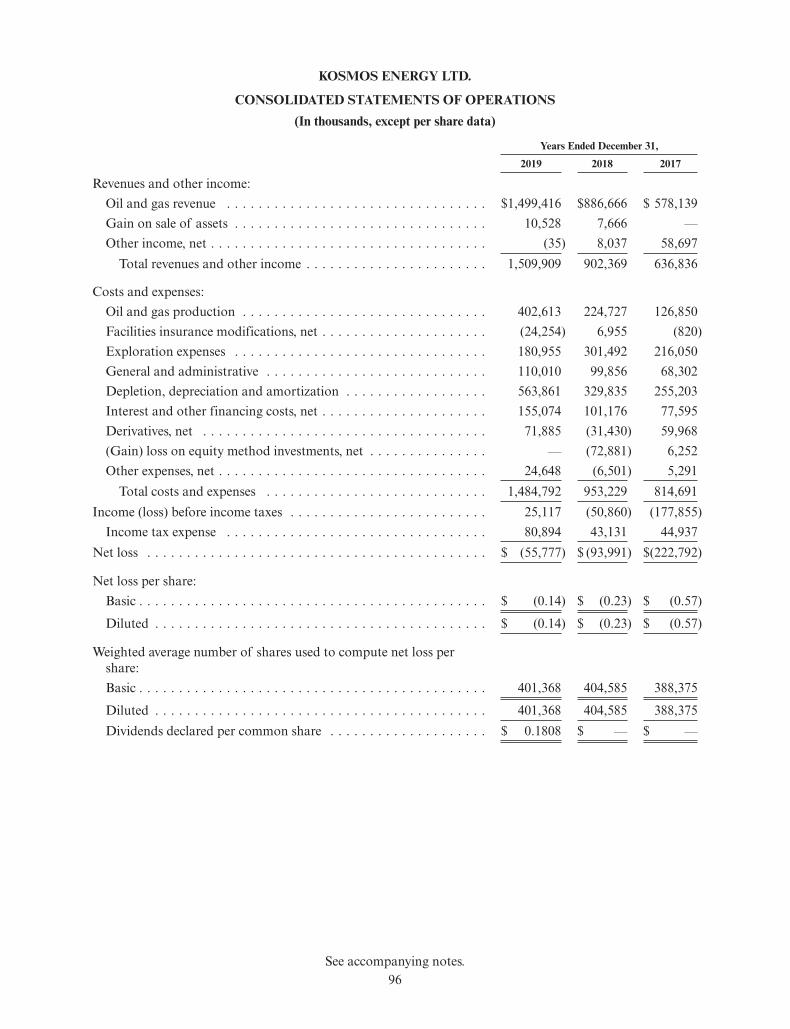
KOSMOS ENERGY LTD.
CONSOLIDATED STATEMENTS OF OPERATIONS
(In thousands, except per share data)
Years Ended December 31,
2019 2018 2017
Revenues and other income:Oil and gas revenue . . . . . . . . . . . . . . . . . . . . . . . . . . . . . . . . . $1,499,416 $886,666 $ 578,139Gain on sale of assets . . . . . . . . . . . . . . . . . . . . . . . . . . . . . . . . 10,528 7,666 —Other income, net . . . . . . . . . . . . . . . . . . . . . . . . . . . . . . . . . . . (35) 8,037 58,697
Total revenues and other income . . . . . . . . . . . . . . . . . . . . . . . 1,509,909 902,369 636,836
Costs and expenses:Oil and gas production . . . . . . . . . . . . . . . . . . . . . . . . . . . . . . . 402,613 224,727 126,850Facilities insurance modifications, net . . . . . . . . . . . . . . . . . . . . . (24,254) 6,955 (820)Exploration expenses . . . . . . . . . . . . . . . . . . . . . . . . . . . . . . . . 180,955 301,492 216,050General and administrative . . . . . . . . . . . . . . . . . . . . . . . . . . . . 110,010 99,856 68,302Depletion, depreciation and amortization . . . . . . . . . . . . . . . . . . 563,861 329,835 255,203Interest and other financing costs, net . . . . . . . . . . . . . . . . . . . . . 155,074 101,176 77,595Derivatives, net . . . . . . . . . . . . . . . . . . . . . . . . . . . . . . . . . . . . 71,885 (31,430) 59,968(Gain) loss on equity method investments, net . . . . . . . . . . . . . . . — (72,881) 6,252Other expenses, net . . . . . . . . . . . . . . . . . . . . . . . . . . . . . . . . . . 24,648 (6,501) 5,291
Total costs and expenses . . . . . . . . . . . . . . . . . . . . . . . . . . . . 1,484,792 953,229 814,691Income (loss) before income taxes . . . . . . . . . . . . . . . . . . . . . . . . . 25,117 (50,860) (177,855)
Income tax expense . . . . . . . . . . . . . . . . . . . . . . . . . . . . . . . . . 80,894 43,131 44,937Net loss . . . . . . . . . . . . . . . . . . . . . . . . . . . . . . . . . . . . . . . . . . . $ (55,777) $ (93,991) $(222,792)
Net loss per share:Basic . . . . . . . . . . . . . . . . . . . . . . . . . . . . . . . . . . . . . . . . . . . . $ (0.14) $ (0.23) $ (0.57)
Diluted . . . . . . . . . . . . . . . . . . . . . . . . . . . . . . . . . . . . . . . . . . $ (0.14) $ (0.23) $ (0.57)
Weighted average number of shares used to compute net loss pershare:Basic . . . . . . . . . . . . . . . . . . . . . . . . . . . . . . . . . . . . . . . . . . . . 401,368 404,585 388,375
Diluted . . . . . . . . . . . . . . . . . . . . . . . . . . . . . . . . . . . . . . . . . . 401,368 404,585 388,375Dividends declared per common share . . . . . . . . . . . . . . . . . . . . $ 0.1808 $ — $ —
See accompanying notes.96

KOSMOS ENERGY LTD.
CONSOLIDATED STATEMENTS OF SHAREHOLDERS’ EQUITY
(In thousands)
Common Stock Additional Paid-inCapital
AccumulatedDeficit
TreasuryStock TotalShares Amount
Balance as of December 31, 2016 . . . . . . . . 395,859 $3,959 $1,975,247 $ (850,410) $ (47,597) $1,081,199Equity-based compensation . . . . . . . . . . — — 40,899 — — 40,899Restricted stock awards and units . . . . . . 2,740 27 (27) — — —Purchase of treasury stock / tax
withholdings . . . . . . . . . . . . . . . . . . . — — (1,594) — (600) (2,194)Net loss . . . . . . . . . . . . . . . . . . . . . . . — — — (222,792) — (222,792)
Balance as of December 31, 2017 . . . . . . . . 398,599 3,986 2,014,525 (1,073,202) (48,197) 897,112Acquisition of oil and gas properties . . . . 34,994 350 307,594 — — 307,944Equity-based compensation . . . . . . . . . . — — 36,464 — — 36,464Restricted stock awards and units . . . . . . 9,322 93 (93) — — —Purchase of treasury stock / tax
withholdings . . . . . . . . . . . . . . . . . . . — — (17,241) — (188,810) (206,051)Net loss . . . . . . . . . . . . . . . . . . . . . . . — — — (93,991) — (93,991)
Balance as of December 31, 2018 . . . . . . . . 442,915 4,429 2,341,249 (1,167,193) (237,007) 941,478Dividends ($0.1808 per share) . . . . . . . . . — — (74,813) — — (74,813)Equity-based compensation . . . . . . . . . . — — 32,797 — — 32,797Restricted stock awards and units . . . . . . 2,864 29 (29) — — —Purchase of treasury stock / tax
withholdings . . . . . . . . . . . . . . . . . . . — — (1,983) — — (1,983)Net loss . . . . . . . . . . . . . . . . . . . . . . . — — — (55,777) — (55,777)
Balance as of December 31, 2019 . . . . . . . . 445,779 $4,458 $2,297,221 $(1,222,970) $(237,007) $ 841,702
See accompanying notes.97

KOSMOS ENERGY LTD.
CONSOLIDATED STATEMENTS OF CASH FLOWS
(In thousands)
Years Ended December 31,2019 2018 2017
Operating activitiesNet loss . . . . . . . . . . . . . . . . . . . . . . . . . . . . . . . . . . . . . . . . . . . . . . . $ (55,777) $ (93,991) $(222,792)Adjustments to reconcile net loss to net cash provided by operating activities:
Depletion, depreciation and amortization (including deferred financing costs) . . . 573,118 339,214 265,407Deferred income taxes . . . . . . . . . . . . . . . . . . . . . . . . . . . . . . . . . . . . (90,370) 9,145 9,505Unsuccessful well costs and leasehold impairments . . . . . . . . . . . . . . . . . . . 87,813 123,199 43,201Change in fair value of derivatives . . . . . . . . . . . . . . . . . . . . . . . . . . . . . 67,436 (29,960) 71,822Cash settlements on derivatives, net (including $(36.3) million and $(137.1) million
and $38.7 million on commodity hedges during 2019, 2018, and 2017) . . . . . . (31,458) (137,942) 25,888Equity-based compensation . . . . . . . . . . . . . . . . . . . . . . . . . . . . . . . . . 32,370 35,230 39,913Gain on sale of assets . . . . . . . . . . . . . . . . . . . . . . . . . . . . . . . . . . . . (10,528) (7,666) —Loss on extinguishment of debt . . . . . . . . . . . . . . . . . . . . . . . . . . . . . . 24,794 4,324 —Distributions in excess of equity in earnings / (Undistributed equity in earnings) . . — (45) 6,252Other . . . . . . . . . . . . . . . . . . . . . . . . . . . . . . . . . . . . . . . . . . . . . . 9,069 2,865 5,952
Changes in assets and liabilities:(Increase) decrease in receivables . . . . . . . . . . . . . . . . . . . . . . . . . . . . (29,735) 175,954 29,365(Increase) decrease in inventories . . . . . . . . . . . . . . . . . . . . . . . . . . . . (28,970) 8,848 1,653(Increase) decrease in prepaid expenses and other . . . . . . . . . . . . . . . . . . 34,586 (18,731) (31,710)Increase (decrease) in accounts payable . . . . . . . . . . . . . . . . . . . . . . . . . (83,921) 7,440 (94,434)Increase (decrease) in accrued liabilities . . . . . . . . . . . . . . . . . . . . . . . . 129,723 (157,393) 86,595
Net cash provided by operating activities . . . . . . . . . . . . . . . . . . . . . . . . . . . . 628,150 260,491 236,617
Investing activitiesOil and gas assets . . . . . . . . . . . . . . . . . . . . . . . . . . . . . . . . . . . . . . . . . . (340,217) (213,806) (140,495)Other property . . . . . . . . . . . . . . . . . . . . . . . . . . . . . . . . . . . . . . . . . . . (11,796) (7,935) (2,858)Acquisition of oil and gas properties, net of cash acquired . . . . . . . . . . . . . . . . . — (961,764) —Equity method investment . . . . . . . . . . . . . . . . . . . . . . . . . . . . . . . . . . . . — — (231,280)Return of investment from KTIPI . . . . . . . . . . . . . . . . . . . . . . . . . . . . . . . . — 184,664 —Proceeds on sale of assets . . . . . . . . . . . . . . . . . . . . . . . . . . . . . . . . . . . . . 15,000 13,703 222,068Notes receivable from partners . . . . . . . . . . . . . . . . . . . . . . . . . . . . . . . . . . (26,918) — —Net cash used in investing activities . . . . . . . . . . . . . . . . . . . . . . . . . . . . . . . (363,931) (985,138) (152,565)
Financing activitiesBorrowings under long-term debt . . . . . . . . . . . . . . . . . . . . . . . . . . . . . . . . 175,000 1,175,000 200,000Payments on long-term debt . . . . . . . . . . . . . . . . . . . . . . . . . . . . . . . . . . . (425,000) (325,000) (250,000)Net proceeds from issuance of senior notes . . . . . . . . . . . . . . . . . . . . . . . . . . 641,875 — —Redemption of senior secured notes . . . . . . . . . . . . . . . . . . . . . . . . . . . . . . . (535,338) — —Purchase of treasury stock / tax withholdings . . . . . . . . . . . . . . . . . . . . . . . . . (1,983) (206,051) (2,194)Dividends . . . . . . . . . . . . . . . . . . . . . . . . . . . . . . . . . . . . . . . . . . . . . . (72,599) — —Deferred financing costs . . . . . . . . . . . . . . . . . . . . . . . . . . . . . . . . . . . . . . (2,444) (38,672) (67)Net cash provided by (used in) financing activities . . . . . . . . . . . . . . . . . . . . . . (220,489) 605,277 (52,261)Net increase (decrease) in cash, cash equivalents and restricted cash . . . . . . . . . . . . 43,730 (119,370) 31,791Cash, cash equivalents and restricted cash at beginning of period . . . . . . . . . . . . . 185,616 304,986 273,195Cash, cash equivalents and restricted cash at end of period . . . . . . . . . . . . . . . . . $ 229,346 $ 185,616 $ 304,986
Supplemental cash flow informationCash paid for:
Interest, net of capitalized interest . . . . . . . . . . . . . . . . . . . . . . . . . . . . . . $ 99,928 $ 83,831 $ 55,381Income taxes . . . . . . . . . . . . . . . . . . . . . . . . . . . . . . . . . . . . . . . . . . . $ 43,909 $ 45,984 $ 48,815
Non-cash activity:Contribution to equity method investment . . . . . . . . . . . . . . . . . . . . . . . . . $ — $ — $ 133,893Dissolution of equity method investment . . . . . . . . . . . . . . . . . . . . . . . . . . $ — $ — $(122,407)Common stock issued for acquisition of oil and gas properties . . . . . . . . . . . . . $ — $ 307,944 $ —
See accompanying notes.98
KOSMOS ENERGY LTD.
Notes to Consolidated Financial Statements
1. Organization
Kosmos Energy Ltd. changed its jurisdiction of incorporation from Bermuda to the State of Delaware(the “Redomestication”) in December 2018. All outstanding common shares of Kosmos Energy Ltd., anexempted company incorporated pursuant to the laws of Bermuda, were automatically converted by operationof law, on a one-for-one basis, into shares of common stock of Kosmos Energy Ltd., a companyincorporated pursuant to the laws of Delaware. The number of shares of the Company’s common stockoutstanding immediately after the Redomestication was the same as the number of common shares ofKosmos Energy Ltd. outstanding immediately prior to the Redomestication. Kosmos Energy Ltd. wasoriginally incorporated pursuant to the laws of Bermuda in January 2011 to become a holding company forKosmos Energy Holdings. As part of the Redomestication, we transferred all of our equity interests inKosmos Energy Holdings to a new, wholly-owned subsidiary, Kosmos Energy Delaware Holdings, LLC, aDelaware limited liability company. As a holding company, Kosmos Energy Ltd.’s management operationsare conducted through a wholly-owned subsidiary, Kosmos Energy, LLC. The terms “Kosmos,” the“Company,” “we,” “us,” “our,” “ours,” and similar terms refer to Kosmos Energy Ltd. and its wholly-ownedsubsidiaries, unless the context indicates otherwise.
Kosmos is a full-cycle deepwater independent oil and gas exploration and production company focusedalong the Atlantic Margins. Our key assets include production offshore Ghana, Equatorial Guinea and U.S.Gulf of Mexico, as well as a world-class gas development offshore Mauritania and Senegal. We alsomaintain a sustainable exploration program balanced between proven basin infrastructure-led exploration(Equatorial Guinea and U.S. Gulf of Mexico), emerging basins (Mauritania, Senegal and Suriname) andfrontier basins (Cote d’Ivoire, Namibia, Sao Tome and Principe, and South Africa). Kosmos is listed onthe NYSE and LSE and is traded under the ticker symbol KOS.
Kosmos is engaged in a single line of business, which is the exploration and production of oil andnatural gas. We have operations in four geographic areas: Ghana, Equatorial Guinea, Mauritania/Senegaland the United States of America.
2. Accounting Policies
Principles of Consolidation
The accompanying consolidated financial statements include the accounts of Kosmos Energy Ltd. andits wholly-owned subsidiaries. They also include the Company’s share of the undivided interest in certainassets, liabilities, revenues and expenses. Investments in corporate joint ventures, which we exercise significantinfluence over, are accounted for using the equity method of accounting. All intercompany transactionshave been eliminated.
Investments in companies that are partially owned by the Company are integral to the Company’soperations. The other parties, who also have an equity interest in these companies, are independent thirdparties that share in the business results according to their ownership. Kosmos does not invest in thesecompanies in order to remove liabilities from its balance sheet.
Use of Estimates
The preparation of financial statements in conformity with accounting principles generally accepted inthe United States requires management to make estimates and assumptions that affect the reported amountsof assets, liabilities, revenues and expenses, and the disclosures of contingent assets and liabilities. Actualresults could differ from these estimates.
Reclassifications
Certain prior period amounts have been reclassified to conform with the current year presentation.Such reclassifications had no material impact on our reported net income (loss), current assets, total assets,
99

KOSMOS ENERGY LTD.
Notes to Consolidated Financial Statements (Continued)
2. Accounting Policies (Continued)
current liabilities, total liabilities, shareholders’ equity or cash flows, except as disclosed related to theadoption of recent accounting pronouncements.
Cash, Cash Equivalents and Restricted Cash
December 31,
2019 2018 2017
(In thousands)
Cash and cash equivalents . . . . . . . . . . . . . . . . . . . . . . . . . . $224,502 $173,515 $233,412Restricted cash—current . . . . . . . . . . . . . . . . . . . . . . . . . . . 4,302 4,527 56,380Restricted cash—long-term . . . . . . . . . . . . . . . . . . . . . . . . . 542 7,574 15,194
Total cash, cash equivalents and restricted cash shown in theconsolidated statements of cash flows . . . . . . . . . . . . . . $229,346 $185,616 $304,986
Cash and cash equivalents includes demand deposits and funds invested in highly liquid instrumentswith original maturities of three months or less at the date of purchase.
In accordance with certain of our petroleum contracts, we have posted letters of credit related toperformance guarantees for our minimum work obligations. Certain of these letters of credit are cashcollateralized in accounts held by us and as such are classified as restricted cash. Upon completion of theminimum work obligations and/or entering into the next phase of the petroleum contract, the requirementto post the existing letters of credit will be satisfied and the cash collateral will be released. However, additionalletters of credit may be required should we choose to move into the next phase of certain of our petroleumcontracts. As of December 31, 2019 and 2018, we had $4.3 million and $4.5 million, respectively, of currentrestricted cash and $0.3 million and $7.4 million, respectively, of long-term restricted cash used to cashcollateralize performance guarantees related to our petroleum contracts. As of December 31, 2019 and 2018,we also had $0.2 million in other long-term restricted cash.
Receivables
Our receivables consist of joint interest billings, oil and gas sales, related party and other receivables.For our oil sales receivable in Ghana, we require a letter of credit to be posted to secure the outstandingreceivable. Receivables from joint interest owners are stated at amounts due, net of any allowances fordoubtful accounts. We determine our allowance by considering the length of time past due, future net revenuesof the debtor’s ownership interest in oil and natural gas properties we operate, and the owner’s ability topay its obligation, among other things. We had an allowance for doubtful accounts of $2.7 million and$1.2 million in current joint interest billings receivables as of December 31, 2019 and 2018, respectively.
Inventories
Inventories consisted of $112.3 million and $83.4 million (including $22.1 million acquired through theDGE acquisition) of materials and supplies and $2.1 million and $1.4 million of hydrocarbons as ofDecember 31, 2019 and 2018, respectively. The Company’s materials and supplies inventory primarily consistsof casing and wellheads and is stated at the lower of cost, using the weighted average cost method, or netrealizable value. We recorded write downs of $4.6 million, $0.3 million and $0.9 million during the years endedDecember 31, 2019, 2018 and 2017 for materials and supplies inventories as other expenses, net in theconsolidated statements of operations and other in the consolidated statements of cash flows.
Hydrocarbon inventory is carried at the lower of cost, using the weighted average cost method, or netrealizable value. Hydrocarbon inventory costs include expenditures and other charges incurred in bringing
100

KOSMOS ENERGY LTD.
Notes to Consolidated Financial Statements (Continued)
2. Accounting Policies (Continued)
the inventory to its existing condition. Selling expenses and general and administrative expenses arereported as period costs and excluded from inventory costs.
Leases (Policy applicable beginning January 1, 2019)
In February 2016, the FASB issued ASU 2016-02, “Leases (Topic 842).” ASU 2016-02 was issued toincrease transparency and comparability across organizations by recognizing substantially all leases on thebalance sheet through the concept of right-of-use lease assets and liabilities. Under prior accounting guidance,lessees did not recognize lease assets or liabilities for leases classified as operating leases. The ASU waseffective for fiscal years beginning after December 15, 2018, including interim periods within those fiscal yearswith early adoption permitted. In July 2018, the FASB issued ASU 2018-11, which added a transitionoption permitting entities to apply the provisions of the new standard at its adoption date instead of theearliest comparative period presented in the consolidated financial statements. Under this transition option,comparative reporting would not be required, and the provisions of the standard would be appliedprospectively to leases in effect at the date of adoption. The Company adopted the guidance prospectivelyduring the first quarter of 2019. As part of our adoption, we elected not to reassess historical leaseclassification, recognize short-term leases on our balance sheet, nor separate lease and non-lease componentsfor our real estate leases. The adoption and implementation of this ASU resulted in a $21.7 millionincrease in assets and liabilities related to our leasing activities, which primarily consists of office leases. Ouradoption of ASU 2016-02 did not impact retained earnings or other components of equity as ofDecember 31, 2018.
We account for leases in accordance with ASC Topic 842, Leases, (“ASC 842”). We determine if anarrangement is a lease at contract inception. A lease exists when a contract conveys to the customer theright to control the use of identified property, plant, or equipment for a period of time in exchange forconsideration. The definition of a lease embodies two conditions: (1) there is an identified asset in the contractthat is land or a depreciable asset (i.e., property, plant, and equipment), and (2) the customer has the rightto control the use of the identified asset.
In the normal course of business, the Company enters into various lease agreements for real estate andequipment related to its exploration, development and production activities that are currently accounted foras operating leases. Operating leases are included in Other assets, Accrued liabilities, and Other long-termliabilities on our consolidated balance sheets. The lease liabilities are initially and subsequently measured atthe present value of the unpaid lease payments at the lease commencement date.
Key estimates and judgments include how we determined: (1) the discount rate we use to discount theunpaid lease payments to present value; (2) lease term; and (3) lease payments.
1. ASC 842 requires a lessee to discount its unpaid lease payments using the interest rate implicit inthe lease or, if that rate cannot be readily determined, its incremental borrowing rate. As most of ourleases where we are the lessee do not provide an implicit rate, we use our incremental borrowingrate based on the information available at commencement date in determining the present value oflease payments. Our incremental borrowing rate for a lease is the rate of interest we would haveto pay on a collateralized basis to borrow an amount equal to the lease payments under similarterms.
2. The lease term for all of our leases includes the non-cancellable period of the lease plus anyadditional periods covered by either an option to extend (or not to terminate) the lease that we arereasonably certain to exercise, or an option to extend (or not to terminate) the lease controlledby the lessor.
3. Lease payments included in the measurement of the lease asset or liability comprise the following:fixed payments (including in-substance fixed payments), variable payments that depend on index
101
KOSMOS ENERGY LTD.
Notes to Consolidated Financial Statements (Continued)
2. Accounting Policies (Continued)
or rate, and the exercise price of a lessee option to purchase the underlying asset if we arereasonably certain to exercise. Amounts expected to be payable under residual value guarantee arealso lease payments included in the measurement of the lease liability.
The Right-of-use (“ROU”) asset is initially measured at cost, which comprises the initial amount of thelease liability adjusted for lease payments made at or before the lease commencement date, plus any initialdirect costs incurred less any lease incentives received.
For operating leases, the ROU asset is subsequently measured throughout the lease term at thecarrying amount of the lease liability, plus initial direct costs, plus (minus) any prepaid (accrued) leasepayments, less the unamortized balance of lease incentives received. Lease expense for lease payments isrecognized on a straight-line basis over the lease term.
We monitor for events or changes in circumstances that require a reassessment of a lease. When areassessment results in the re-measurement of a lease liability, a corresponding adjustment is made to thecarrying amount of the corresponding ROU asset unless doing so would reduce the carrying amount of theROU asset to an amount less than zero. In that case, the amount of the adjustment that would result in anegative ROU asset balance is recorded in profit or loss.
We have lease agreements which include lease and non-lease components. We have elected to combinelease and non-lease components for all lease contracts.
We have elected not to recognize ROU assets and lease liabilities for all short-term leases that have alease term of 12 months or less. We recognize the lease payments associated with our short-term leases asan expense on a straight-line basis over the lease term.
We adopted ASU 2016-02 using a modified retrospective transition approach as of the effective date aspermitted by the amendments in ASU 2018-11, which provides an alternative modified retrospective transitionmethod. As a result, we were not required to adjust our comparative period financial information foreffects of the standard or make the new required lease disclosures for periods before the date of adoption(i.e. January 1, 2019). We have elected to adopt the package of transition practical expedients and, therefore,have not reassessed (1) whether existing or expired contracts contain a lease, (2) lease classification forexisting or expired leases or (3) the accounting for initial direct costs that were previously capitalized. Wedid not elect the practical expedient to use hindsight for leases existing at the adoption date.
Exploration and Development Costs
The Company follows the successful efforts method of accounting for its oil and gas properties.Acquisition costs for proved and unproved properties are capitalized when incurred. Costs of unprovedproperties are transferred to proved properties when a determination that proved reserves have been found.Exploration costs, including geological and geophysical costs and costs of carrying unproved properties, areexpensed as incurred. Exploratory drilling costs are capitalized when incurred. If exploratory wells aredetermined to be commercially unsuccessful or dry holes, the applicable costs are expensed and recorded inexploration expense on the consolidated statement of operations. Costs incurred to drill and equipdevelopment wells, including unsuccessful development wells, are capitalized. Costs incurred to operate andmaintain wells and equipment and to lift oil and natural gas to the surface are expensed as oil and gasproduction expense.
The Company evaluates unproved property periodically for impairment. The impairment assessmentconsiders results of exploration activities, commodity price outlooks, planned future sales or expiration ofall or a portion of such projects. If it is determined that future appraisal drilling or development activities areunlikely to occur, the associated capitalized costs are recorded as exploration expense in the consolidatedstatement of operations.
102

KOSMOS ENERGY LTD.
Notes to Consolidated Financial Statements (Continued)
2. Accounting Policies (Continued)
Depletion, Depreciation and Amortization
Proved properties and support equipment and facilities are depleted using the unit-of-productionmethod based on estimated proved oil and natural gas reserves. Capitalized exploratory drilling costs thatresult in a discovery of proved reserves and development costs are depleted using the unit-of-productionmethod based on estimated proved developed oil and natural gas reserves for the related field.
Depreciation and amortization of other property is computed using the straight-line method over theassets’ estimated useful lives (not to exceed the lease term for leasehold improvements), ranging from one toeight years.
YearsDepreciated
Leasehold improvements . . . . . . . . . . . . . . . . . . . . . . . . . . . . . . . . . . . . 1 to 8Office furniture, fixtures and computer equipment . . . . . . . . . . . . . . . . . . 3 to 7Vehicles . . . . . . . . . . . . . . . . . . . . . . . . . . . . . . . . . . . . . . . . . . . . . . . . 5
Amortization of deferred financing costs is computed using the straight-line method over the life ofthe related debt.
Capitalized Interest
Interest costs from external borrowings are capitalized on major projects with an expected constructionperiod of one year or longer. Capitalized interest is added to the cost of the underlying asset and is depletedon the unit-of-production method in the same manner as the underlying assets.
Asset Retirement Obligations
The Company accounts for asset retirement obligations as required by ASC 410—Asset Retirementand Environmental Obligations. Under these standards, the fair value of a liability for an asset retirementobligation is recognized in the period in which it is incurred if a reasonable estimate of fair value can be made.If a reasonable estimate of fair value cannot be made in the period the asset retirement obligation isincurred, the liability is recognized when a reasonable estimate of fair value can be made. If a tangible long-lived asset with an existing asset retirement obligation is acquired, a liability for that obligation is recognizedat the asset’s acquisition or in service date. In addition, a liability for the fair value of a conditional assetretirement obligation is recorded if the fair value of the liability can be reasonably estimated. We capitalizethe asset retirement costs by increasing the carrying amount of the related long-lived asset by the same amountas the liability. We record increases in the discounted abandonment liability resulting from the passage oftime in depletion, depreciation and amortization in the consolidated statement of operations.
Impairment of Long-lived Assets
The Company reviews its long-lived assets for impairment when changes in circumstances indicate thatthe carrying amount of an asset may not be recoverable. ASC 360—Property, Plant and Equipment requiresan impairment loss to be recognized if the carrying amount of a long-lived asset is not recoverable andexceeds its fair value. The carrying amount of a long-lived asset is not recoverable if it exceeds the sum ofthe undiscounted cash flows expected to result from the use and eventual disposition of the asset. Thatassessment shall be based on the carrying amount of the asset at the date it is tested for recoverability, whetherin use or under development. An impairment loss shall be measured as the amount by which the carryingamount of a long-lived asset exceeds its fair value. Assets to be disposed of and assets not expected to provideany future service potential to the Company are recorded at the lower of carrying amount or fair value lesscost to sell.
103

KOSMOS ENERGY LTD.
Notes to Consolidated Financial Statements (Continued)
2. Accounting Policies (Continued)
We believe the assumptions used in our undiscounted cash flow analysis to test for impairmentindicators are appropriate and result in a reasonable estimate of future cash flows. The undiscounted cashflows from the analysis exceeded the carrying amount of our long-lived assets. The most significantassumptions are the pricing and production estimates used in undiscounted cash flow analysis. Whereunproved reserves exist, an appropriately risk-adjusted amount of these reserves may be included in theevaluation. In order to evaluate the sensitivity of the assumptions, we assumed a hypothetical reduction inour production profile which still showed no impairment. If we experience declines in oil pricing, increases inour estimated future expenditures or a decrease in our estimated production profile our long-lived assetscould be at risk for impairment.
Derivative Instruments and Hedging Activities
We utilize oil derivative contracts to mitigate our exposure to commodity price risk associated with ouranticipated future oil production. These derivative contracts consist of collars, put options, call options andswaps. We also have used interest rate derivative contracts to mitigate our exposure to interest ratefluctuations related to our long-term debt. Our derivative financial instruments are recorded on the balancesheet as either assets or liabilities and are measured at fair value. We do not apply hedge accounting toour derivative contracts. See Note 9—Derivative Financial Instruments.
Estimates of Proved Oil and Natural Gas Reserves
Reserve quantities and the related estimates of future net cash flows affect our periodic calculations ofdepletion and assessment of impairment of our oil and natural gas properties. Proved oil and natural gasreserves are the estimated quantities of crude oil, natural gas and natural gas liquids that geological andengineering data demonstrate with reasonable certainty to be recoverable in future periods from knownreservoirs under existing economic and operating conditions. As additional proved reserves are discovered,reserve quantities and future cash flows will be estimated by independent petroleum consultants and preparedin accordance with guidelines established by the Securities and Exchange Commission (“SEC”) and theFinancial Accounting Standards Board (“FASB”). The accuracy of these reserve estimates is a function of:
• the engineering and geological interpretation of available data;
• estimates of the amount and timing of future operating cost, production taxes, development costand workover cost;
• the accuracy of various mandated economic assumptions; and
• the judgments of the persons preparing the estimates.
Revenue Recognition
We recognize revenues on the volumes sold of hydrocarbons sold to a purchaser. The volumes sold maybe more or less than the volumes to which we are entitled based on our ownership interest in the property.These differences result in a condition known in the industry as a production imbalance. A receivable orliability is recognized only to the extent that we have an imbalance on a specific property greater than theexpected remaining proved reserves on such property. As of December 31, 2019 and 2018, we had no oil andgas imbalances recorded in our consolidated financial statements.
Our oil and gas revenues are recognized when hydrocarbons have been sold to a purchaser at a fixed ordeterminable price, title has transferred and collection is probable. Certain revenues are based on provisionalprice contracts which contain an embedded derivative that is required to be separated from the hostcontract for accounting purposes. The host contract is the receivable from oil sales at the spot price on the
104

KOSMOS ENERGY LTD.
Notes to Consolidated Financial Statements (Continued)
2. Accounting Policies (Continued)
date of sale. The embedded derivative, which is not designated as a hedge, is marked to market through oiland gas revenue each period until the final settlement occurs, which generally is limited to the month after thesale.
Oil and gas revenue is composed of the following:
Years Ended December 31,
2019 2018 2017
Revenues from contract with customer—Equatorial Guinea . . . . . . . $ 297,831 $ — $ —Revenues from contract with customer—Ghana . . . . . . . . . . . . . . . . 740,464 741,033 590,642Revenues from contract with customers—U.S. Gulf of Mexico . . . . . 459,960 147,596 —Provisional oil sales contracts . . . . . . . . . . . . . . . . . . . . . . . . . . . . . 1,161 (1,963) (12,503)
Oil and gas revenue . . . . . . . . . . . . . . . . . . . . . . . . . . . . . . . . . . $1,499,416 $886,666 $578,139
Equity-based Compensation
For equity-based compensation awards, compensation expense is recognized in the Company’sfinancial statements over the awards’ vesting periods based on their grant date fair value. The Companyutilizes (i) the closing stock price on the date of grant to determine the fair value of service vesting restrictedstock awards and restricted stock units and (ii) a Monte Carlo simulation to determine the fair value ofrestricted stock awards and restricted stock units with a combination of market and service vesting criteria.Forfeitures are recognized in the period in which they occur.
Restructuring Charges
The Company accounts for restructuring charges and related termination benefits in accordance withASC 712-Compensation-Nonretirement Postemployment Benefits. Under these standards, the costsassociated with termination benefits are recorded during the period in which the liability is incurred. Duringthe year ended December 31, 2019, we recognized $11.5 million in restructuring charges for employeeseverance and related benefit costs incurred as part of a corporate reorganization in Other expenses, net inthe consolidated statement of operations.
Treasury Stock
We record treasury stock purchases at cost. Our treasury stock purchases are from our employees thatsurrendered shares to the Company to satisfy their statutory tax withholding requirements and are not partof a formal stock repurchase plan. In November 2018, Kosmos repurchased 35 million shares of ourcommon stock from funds affiliated with Warburg Pincus LLC in a privately negotiated transaction at aprice per share of $5.38. The total aggregate purchase price for the share repurchase was approximately$188 million. The remainder of our treasury stock is forfeited restricted stock awards granted under ourlong-term incentive plan.
Income Taxes
The Company accounts for income taxes as required by ASC 740—Income Taxes. Under this method,deferred income taxes are determined based on the difference between the financial statement and tax basisof assets and liabilities using enacted tax rates in effect for the year in which the differences are expectedto reverse. Valuation allowances are established when necessary to reduce deferred tax assets to the amountsexpected to be realized. On a quarterly basis, management evaluates the need for and adequacy of valuationallowances based on the expected realizability of the deferred tax assets and adjusts the amount of suchallowances, if necessary.
105
KOSMOS ENERGY LTD.
Notes to Consolidated Financial Statements (Continued)
2. Accounting Policies (Continued)
We recognize tax benefits from uncertain tax positions only if it is more likely than not that the taxposition will be sustained upon examination by the tax authorities, based on the technical merits of theposition. Accordingly, we measure tax benefits from such positions based on the most likely outcome to berealized.
Foreign Currency Translation
The U.S. dollar is the functional currency for all of the Company’s material foreign operations. Foreigncurrency transaction gains and losses and adjustments resulting from translating monetary assets andliabilities denominated in foreign currencies are included in other expenses. Cash balances held in foreigncurrencies are not significant, and as such, the effect of exchange rate changes is not material to any reportingperiod.
Concentration of Credit Risk
Our revenue can be materially affected by current economic conditions and the price of oil. However,based on the current demand for crude oil and the fact that alternative purchasers are readily available, webelieve that the loss of our marketing agent and/or any of the purchasers identified by our marketing agentwould not have a long-term material adverse effect on our financial position or results of internationaloperations. For our U.S. Gulf of Mexico operations, crude oil and natural gas are transported to customersusing third-party pipelines. For the years ended December 31, 2019 and 2018, revenue from Phillips 66Company made up approximately 20% and 11%, respectively, of our total consolidated revenue and wasincluded in our U.S. Gulf of Mexico segment.
Recent Accounting Standards
Recently Adopted
In February 2016, the FASB issued ASU 2016-02, “Leases (Topic 842).” ASU 2016-02 was issued toincrease transparency and comparability across organizations by recognizing substantially all leases on thebalance sheet through the concept of right-of-use lease assets and liabilities. Under current accountingguidance, lessees do not recognize lease assets or liabilities for leases classified as operating leases. The ASUis effective for fiscal years beginning after December 15, 2018, including interim periods within thosefiscal years with early adoption permitted. In July 2018, the FASB issued ASU 2018-11, which added atransition option permitting entities to apply the provisions of the new standard at its adoption date insteadof the earliest comparative period presented in the consolidated financial statements. Under this transitionoption, comparative reporting would not be required, and the provisions of the standard would be appliedprospectively to leases in effect at the date of adoption. The Company adopted the guidance prospectivelyduring the first quarter of 2019. As part of our adoption, we elected not to reassess historical leaseclassification, recognize short-term leases on our balance sheet, nor separate lease and non-lease componentsfor our real estate leases. The adoption and implementation of this ASU resulted in a $21.7 millionincrease in assets and liabilities related to our leasing activities which primarily consists of office leases. Ouradoption of ASU 2016-02 did not impact retained earnings or other components of equity as ofDecember 31, 2018.
Not Yet Adopted
In June 2016, ASU 2016-13, “Measurement of Credit Losses on Financial Instruments,” was issuedrequiring measurement of all expected credit losses for certain types of financial instruments, includingtrade receivables, held at the reporting date based on historical experience, current conditions and reasonableand supportable forecasts. This standard is effective January 1, 2020, and we do not expect it to have asignificant impact on our consolidated financial statements.
106

KOSMOS ENERGY LTD.
Notes to Consolidated Financial Statements (Continued)
2. Accounting Policies (Continued)
In December 2019, the FASB issued ASU 2019-12, “Simplifying the Accounting for Income Taxes”.The amendments in the ASU are effective for fiscal years, and interim periods within those fiscal years,beginning after December 15, 2020. Early adoption is permitted. The Company is evaluating the impact ofthis standard.
3. Acquisitions and Divestitures
2019 Transactions
During the first quarter of 2019, we entered into a petroleum contract covering offshore Marine XXIblock with the Republic of the Congo, subject to governmental approvals. Upon approval, we will hold an85% participating interest and be the operator. The Congolese national oil company, SNPC, has a 15% carriedinterest during the exploration period. Should a commercial discovery be made, SNPC’s 15% carriedinterest will convert to a participating interest of at least 15%. The petroleum contract covers approximately2,350 square kilometers, with a first exploration period of four years and includes a work program toacquire and interpret 2,200 square kilometers of 3D seismic. There are two optional exploration phases,each for a period of three years, which are subject to additional work program commitments.
In March 2019, we completed an agreement with a subsidiary of Ophir Energy plc (“Ophir”) toacquire the remaining interest in Block EG-24, offshore Equatorial Guinea, which increased our participatinginterest to 80% and named Kosmos as operator. The Equatorial Guinean national oil company, GEPetrol,has a 20% carried interest during the exploration period. Should a commercial discovery be made, GEPetrol’s20% carried interest will convert to a 20% participating interest.
In September 2019, we completed a farm-in agreement with OK Energy to acquire a 45% non-operatedinterest in the Northern Cape Ultra Deep block offshore the Republic of South Africa. The petroleumcontract covers approximately 6,930 square kilometers at water depths ranging from 2,500 to 3,100 metersand has an initial exploration phase of two years.
In November 2019, we completed a farm-out agreement with Shell Sao Tome and Principe B.V. tofarm-out a 20% participating interest in Block 6 and a 30% participating interest in Block 11, offshore SaoTome and Principe, resulting in our participating interests in Blocks 6 and 11 being 25% and 35%, respectively.During the year ended December 31, 2019, we recognized a $10.5 million gain related to the farm-out ofBlocks 6 and 11 offshore Sao Tome and Principe.
2018 Transactions
In March 2018, as part of our alliance with BP, we entered into petroleum contracts covering Blocks 10and 13 with the Democratic Republic of Sao Tome and Principe. We presently have a 35% participatinginterest in the blocks and the operator, BP, holds a 50% participating interest. The national petroleum agency,Agencia Nacional Do Petroleo De Sao Tome E Principe (“ANP-STP”) has a 15% carried interest in theblocks through exploration. The petroleum contracts cover approximately 13,600 square kilometers, with afirst exploration period of four years from the effective date (March 2018). The exploration periods can beextended an additional four years at our election subject to fulfilling specific work obligations. The firstexploration period work programs include a 13,500 square kilometer 3D seismic acquisition requirementacross the two blocks.
In June 2018, we completed a farm-in agreement with a subsidiary of Ophir for Block EG-24, offshoreEquatorial Guinea, whereby we acquired our initial non-operated participating interest of 40%. As part ofthe agreement, we reimbursed a portion of Ophir’s previously incurred exploration costs and agreed to carryOphir’s share of the costs. The petroleum contract covers approximately 3,500 square kilometers, with afirst exploration period of three years from the effective date (March 2018) which can be extended up to fouradditional years at our election subject to fulfilling specific work obligations. The first exploration period
107

KOSMOS ENERGY LTD.
Notes to Consolidated Financial Statements (Continued)
3. Acquisitions and Divestitures (Continued)
work program includes a 3,000 square kilometer 3D seismic acquisition requirement which was completedin November 2018. The Equatorial Guinean national oil company, GEPetrol, has a 20% carried interestduring the exploration period. Should a commercial discovery be made, GEPetrol’s 20% carried interestwill convert to a 20% participating interest.
In September 2018, we completed the acquisition of DGE, a deepwater company operating in the U.S.Gulf of Mexico, from First Reserve Corporation and other shareholders for a total consideration of$1.275 billion, comprised of $952.6 million in cash, $307.9 million in Kosmos common stock and $14.9 millionof transaction related costs. We funded the cash portion of the purchase price using cash on hand anddrawings under our existing credit facilities. We also received $200.0 million of additional firm commitmentsunder the Facility, which provided further liquidity to the Company. The DGE acquisition was accountedfor under the asset acquisition method and the purchase price allocation is shown below. The purchase priceallocation was based on the estimated relative fair value of identifiable assets acquired and liabilitiesassumed.
The estimated fair value measurements of oil and gas assets acquired and asset retirement obligationsliabilities assumed are based on inputs that are not observable in the market and therefore represent Level 3inputs. The fair value of oil and gas properties and asset retirement obligations were measured using thediscounted cash flow technique of valuation. Significant inputs to the valuation of oil and gas propertiesinclude estimates of: (i) reserves, (ii) future operating and development costs, (iii) future commodity prices,(iv) future plugging and abandonment costs, (v) estimated future cash flows, and (vi) a market-based weightedaverage cost of capital rate.
Purchase PriceAllocation
(in thousands)
Fair value of assets acquired:Proved oil and gas properties . . . . . . . . . . . . . . . . . . . . . . . . . . . . . . . . . . . . $1,037,511Unproved oil and gas properties . . . . . . . . . . . . . . . . . . . . . . . . . . . . . . . . . . 298,159Accounts receivable and other . . . . . . . . . . . . . . . . . . . . . . . . . . . . . . . . . . . . 180,989
Total assets acquired . . . . . . . . . . . . . . . . . . . . . . . . . . . . . . . . . . . . . . . . . $1,516,659
Fair value of liabilities assumed:Accrued liabilities and other . . . . . . . . . . . . . . . . . . . . . . . . . . . . . . . . . . . . . $ 126,530Asset retirement obligations . . . . . . . . . . . . . . . . . . . . . . . . . . . . . . . . . . . . . 74,482Derivative liabilities . . . . . . . . . . . . . . . . . . . . . . . . . . . . . . . . . . . . . . . . . . . 40,265
Total liabilities assumed . . . . . . . . . . . . . . . . . . . . . . . . . . . . . . . . . . . . . . $ 241,277
Purchase price:Cash consideration paid . . . . . . . . . . . . . . . . . . . . . . . . . . . . . . . . . . . . . . . . $ 952,586Fair value of common stock(1) . . . . . . . . . . . . . . . . . . . . . . . . . . . . . . . . . . . 307,944Transaction related costs . . . . . . . . . . . . . . . . . . . . . . . . . . . . . . . . . . . . . . . 14,852
Total purchase price . . . . . . . . . . . . . . . . . . . . . . . . . . . . . . . . . . . . . . . . . $1,275,382
(1) Based on 34,993,585 shares of common stock issued at a price of $8.80 per share, which was theopening Kosmos common stock price on September 14, 2018, the closing date of the acquisition.
108

KOSMOS ENERGY LTD.
Notes to Consolidated Financial Statements (Continued)
3. Acquisitions and Divestitures (Continued)
As a result of the DGE acquisition, we included $147.6 million of revenues and $30.5 million of directoperating expenses in our consolidated statements of operations for the period from September 14, 2018 toDecember 31, 2018.
In October 2018, Kosmos entered into a strategic exploration alliance with Shell Exploration CompanyB.V. (“Shell”) to jointly explore in Southern West Africa. Initially the alliance will focus on Namibia whereKosmos has completed a farm-in to Shell’s acreage in PEL 39, and Sao Tome and Principe where we haveentered into exclusive negotiations for Shell to take an interest in Kosmos’ acreage in Blocks 5, 6, 11, and12. As part of the alliance, our two companies intend to jointly evaluate opportunities in adjacent geographies.This alliance is consistent with Kosmos’ strategy of partnering with supermajors to leverage complementaryskill sets. Shell has deep expertise in carbonate plays, while Kosmos brings significant knowledge of theCretaceous in West Africa. Furthermore, by working with Shell, Kosmos has a partner with the expertise toefficiently move exploration successes through the development stage.
2017 Transactions
In December 2016, we announced transactions with affiliates of BP in Mauritania and Senegalfollowing a competitive farm-out process for our interests in our blocks offshore Mauritania and Senegal.The Mauritania and Senegal transactions closed in January 2017 and February 2017, respectively. InMauritania, BP acquired a 62% participating interest in our four Mauritania licenses (C6, C8, C12 andC13). In Senegal, BP acquired a 49.99% interest in KBSL, our majority owned affiliate company which helda 60% participating interest in the Cayar Offshore Profond and Saint Louis Offshore Profond blocks (the“Senegal Blocks”) offshore Senegal. Previously we indicated that KBSL would hold a 65% participatinginterest upon the completion of our exercise in December 2016 of an option to increase our equity in eachcontract area by 5% in exchange for carrying Timis Corporation Limited’s (“Timis”) paying interest shareof a third well in either contract area, subject to a maximum gross well cost of $120.0 million. However, weagreed to withdraw the exercise of this call option upon completion of an agreement between BP andTimis by which BP acquired Timis’ entire 30% participating interest in the Senegal Blocks. The transactionbetween BP and Timis was completed and KBSL’s participating interest in these blocks remained at 60%. Inconsideration for these transactions, Kosmos received $162 million in cash up front during the first quarterof 2017 and will receive $228 million exploration and appraisal carry (increased from $221 million uponcompletion of the transfer of a 30% working interest to BP Senegal Investments Limited), up to $533 millionin a development carry and variable consideration up to $2 per barrel for up to 1 billion barrels of liquids,structured as a production royalty, subject to future liquids discovery and prevailing oil prices. The effectivedate of these transactions was July 1, 2016, with BP paying interim costs from the effective date to the closingdates. We reduced our unproved property balance by $221.9 million for the consideration received as aresult of these transactions including the upfront cash and interim costs from the transaction date to theeffective date. See Note 7—Equity Method Investments for further discussion of our investment in KBSL.
In November 2015, we entered into a line of credit agreement with Timis, whereby Timis had the rightto draw up to $30.0 million on the line of credit to offset its joint interest billings arising from costs underthe Senegal Blocks petroleum agreements. The line of credit agreement was terminated in April 2017 whenTimis entered into an agreement with BP to acquire Timis’ 30% participating interest in the Senegal Blocks.As a result of the termination of this credit agreement, Kosmos received $16 million in August 2017representing payment in full of outstanding amounts drawn on the line of credit.
In September 2017, we closed a farm-in agreement with Tullow Mauritania Limited, a subsidiary ofTullow Oil plc (“Tullow”), to acquire a 15% non-operated participating interest in Block C18 offshoreMauritania. Based on the terms of the agreement, we reimbursed Tullow a portion of past and interim periodcosts and will partially carry future costs.
In the fourth quarter of 2017, through a joint venture with an affiliate of Trident Energy (“Trident”),we acquired all of the equity interest of Hess International Petroleum Inc., a subsidiary of Hess Corporation
109

KOSMOS ENERGY LTD.
Notes to Consolidated Financial Statements (Continued)
3. Acquisitions and Divestitures (Continued)
(“Hess”), which holds an 85% paying interest (80.75% revenue interest) in the Ceiba Field and OkumeComplex assets. Under the terms of the agreement, Kosmos and Trident each own 50% of Hess InternationalPetroleum Inc. Hess International Petroleum Inc. was subsequently renamed Kosmos-Trident InternationalPetroleum Inc. (“KTIPI”). Kosmos is primarily responsible for exploration and subsurface evaluationwhile Trident is primarily responsible for production operations and optimization. The gross acquisitionprice was $650 million effective as of January 1, 2017. After post closing entries Kosmos paid net cash ofapproximately $231 million, with a combination of cash on hand and availability under the Facility. Thetransaction was accounted for as an equity method investment. See Note 7—Equity Method Investments forfurther discussion of our investment in KTIPI.
In October 2017, we entered into petroleum contracts covering Blocks EG-21, S, and W with theRepublic of Equatorial Guinea. We had an 80% participating interest and were the operator in all threeblocks. In August 2018, we closed a farm-out agreement with Trident, whereby they acquired a 40%participating interest in blocks EG-21, S, and W, resulting in a $7.7 million gain. After giving effect to the farm-out agreement, we hold a 40% participating interest and remain the operator in all three blocks. TheEquatorial Guinean national oil company, Guinea Equatorial De Petroleos (“GEPetrol”), has a 20% carriedparticipating interest during the exploration period. Should a commercial discovery be made, GEPetrol’s20% carried interest will convert to a 20% participating interest. The petroleum contracts cover approximately6,000 square kilometers, with a first exploration period of five years from the effective date (March 2018).The first exploration period consists of two sub-periods of three and two years, respectively. The firstexploration sub-period work program includes a 6,000 square kilometer 3D seismic acquisition requirementacross the three blocks.
In December 2017, as part of our Alliance with BP, we entered into petroleum contracts coveringBlocks CI-526, CI-602, CI-603, CI-707 and CI-708 with the Government of Cote d’Ivoire. We have a 45%participating interest and are the operator in all five blocks. BP has a 45% participating interest in the blocksand the Cote d’Ivoire national oil company, PETROCI Holding (“PETROCI”), currently has a 10%carried interest. The petroleum contracts cover approximately 17,000 square kilometers, with a firstexploration period of three years. The first exploration period work program includes a 12,000 squarekilometer 3D seismic acquisition across the five blocks.
4. Joint Interest Billings, Related Party Receivables and Notes Receivables
Joint Interest Billings
The Company’s joint interest billings consist of receivables from partners with interests in common oiland gas properties operated by the Company for shared costs. Joint interest billings are classified on theface of the consolidated balance sheets as current and long-term receivables based on when collection isexpected to occur.
In Ghana, the contractor group funded GNPC’s 5% share of the Tweneboa, Enyenra and Ntomme(“TEN”) development costs. The block partners are being reimbursed for such costs plus interest out of aportion of GNPC’s TEN production revenues. As of December 31, 2019 and 2018, the current portion of thejoint interest billing receivables due from GNPC for the TEN fields development costs were $14.0 millionand $14.0 million, respectively, and the long-term portion were $16.0 million and $14.0 million.
Related Party Receivables
The Company’s related party receivables consists primarily of receivables from Trident who, untilJanuary 2019, we shared a 50% interest in KTIPI. As of December 31, 2019 and 2018 the balance due fromTrident consists of zero and $5.6 million related to joint interest billings for the exploration blocks andKosmos’ support of KTIPI operations. Subsequent to the unwind of KTIPI, Trident is no longer considereda related party.
110

KOSMOS ENERGY LTD.
Notes to Consolidated Financial Statements (Continued)
4. Joint Interest Billings, Related Party Receivables and Notes Receivables (Continued)
Notes Receivables
In February 2019, Kosmos and BP signed Carry Advance Agreements with the national oil companiesof Mauritania and Senegal which obligate us separately to finance the respective national oil company’s shareof certain development costs incurred through first gas production for Greater Tortue Ahmeyim Phase 1,currently projected in 2022. Kosmos’ share for the two agreements combined is up to $239.7 million, whichis to be repaid with interest through the national oil companies’ share of future revenues. As of December 31,2019, the balance due from the national oil companies was $27.4 million, which is classified as Long-termreceivables in our consolidated balance sheets.
5. Property and Equipment
Property and equipment is stated at cost and consisted of the following:
December 31,
2019 2018
(In thousands)
Oil and gas properties:Proved properties . . . . . . . . . . . . . . . . . . . . . . . . . . . . . . . . . . . $ 4,904,648 $ 4,236,489Unproved properties . . . . . . . . . . . . . . . . . . . . . . . . . . . . . . . . 814,065 759,472
Total oil and gas properties . . . . . . . . . . . . . . . . . . . . . . . . . . 5,718,713 4,995,961Accumulated depletion . . . . . . . . . . . . . . . . . . . . . . . . . . . . . . . (2,093,962) (1,551,097)
Oil and gas properties, net . . . . . . . . . . . . . . . . . . . . . . . . . . . . . . 3,624,751 3,444,864Other property . . . . . . . . . . . . . . . . . . . . . . . . . . . . . . . . . . . . 61,598 51,987Accumulated depreciation . . . . . . . . . . . . . . . . . . . . . . . . . . . . . (44,017) (37,150)
Other property, net . . . . . . . . . . . . . . . . . . . . . . . . . . . . . . . . . . . 17,581 14,837Property and equipment, net . . . . . . . . . . . . . . . . . . . . . . . . . . . . $ 3,642,332 $ 3,459,701
We recorded depletion expense of $542.9 million, $316.3 million and $244.9 million and depreciationexpense of $6.9 million, $4.6 million and $3.4 million for the years ended December 31, 2019, 2018 and2017, respectively. The increase to oil and gas properties from 2018 to 2019 primarily relates to proportionateconsolidation resulting from the unwind of our equity method investment in KTIPI. See Note 7—EquityMethod Investments for additional information.
6. Suspended Well Costs
The Company capitalizes exploratory well costs as unproved properties within oil and gas propertiesuntil a determination is made that the well has either found proved reserves or is impaired. If proved reservesare found, the capitalized exploratory well costs are reclassified to proved properties. Well costs are chargedto exploration expense if the exploratory well is determined to be impaired.
The following table reflects the Company’s capitalized exploratory well costs on completed wells as ofand during the years ended December 31, 2019, 2018 and 2017. The table excludes $3.0 million, $65.6 millionand $43.2 million in costs that were capitalized and subsequently expensed during the same year forthe years ended December 31, 2019, 2018 and 2017, respectively. During 2017, the exploratory well costs
111

KOSMOS ENERGY LTD.
Notes to Consolidated Financial Statements (Continued)
6. Suspended Well Costs (Continued)
associated with the Mahogany and Teak fields were reclassified to proved property as they were unitizedinto the Jubilee Unit as part of the Greater Jubilee Full Field Development Plan.
Years Ended December 31,
2019 2018 2017
(In thousands)
Beginning balance . . . . . . . . . . . . . . . . . . . . . . . . . . . . . . . . . . . . . $367,665 $410,113 $ 734,463Additions to capitalized exploratory well costs pending the
determination of proved reserves . . . . . . . . . . . . . . . . . . . . . . . . . 78,125 10,518 69,567Additions associated with the acquisition of DGE . . . . . . . . . . . . . . . — 26,224 —Reclassification due to determination of proved reserves(1) . . . . . . . . . — (26,224) (176,881)Divestitures(2) . . . . . . . . . . . . . . . . . . . . . . . . . . . . . . . . . . . . . . . . — — (206,400)Contribution of oil and gas property to equity method
investment – KBSL . . . . . . . . . . . . . . . . . . . . . . . . . . . . . . . . . . . — — (131,764)Dissolution of equity method investment – KBSL . . . . . . . . . . . . . . . — — 121,128Capitalized exploratory well costs charged to expense(3) . . . . . . . . . . . — (52,966) —Ending balance . . . . . . . . . . . . . . . . . . . . . . . . . . . . . . . . . . . . . . . $445,790 $367,665 $ 410,113
(1) Represents the reclassification of Nearly Headless Nick well costs associated with the DGE acquisitionin 2018 and inclusion of the Mahogany and Teak discoveries in the Jubilee Unit in 2017.
(2) Represents the reduction in basis of suspended well costs associated with the Mauritania and Senegaltransactions with BP
(3) Primarily related to Akasa and Wawa wells as we wrote off $38.1 million and $13.6 million, respectively,of previously capitalized costs exploratory well costs to exploration expense during the third quarterof 2018. These impairments are included in our Ghana segment.
The following table provides aging of capitalized exploratory well costs based on the date drilling wascompleted and the number of projects for which exploratory well costs have been capitalized for more thanone year since the completion of drilling:
Years Ended December 31,
2019 2018 2017
(In thousands, except well counts)
Exploratory well costs capitalized for a period of one year or less . . . . . $ 29,121 $ — $ 67,159Exploratory well costs capitalized for a period of one to two years . . . . 78,245 299,253 291,252Exploratory well costs capitalized for a period of three years or longer . . 338,424 68,412 51,702Ending balance . . . . . . . . . . . . . . . . . . . . . . . . . . . . . . . . . . . . . . . . $445,790 $367,665 $410,113
Number of projects that have exploratory well costs that have beencapitalized for a period greater than one year . . . . . . . . . . . . . . . . . 3 3 5
As of December 31, 2019, the projects with exploratory well costs capitalized for more than one yearsince the completion of drilling are related to the Greater Tortue Ahmeyim Unit, which crosses theMauritania and Senegal maritime border, BirAllah discovery (formerly known as the Marsouin discovery)in Block C8 offshore Mauritania, and the Yakaar and Teranga discoveries in the Cayar Offshore Profondblock offshore Senegal.
112

KOSMOS ENERGY LTD.
Notes to Consolidated Financial Statements (Continued)
6. Suspended Well Costs (Continued)
Greater Tortue Ahmeyim Unit—In May 2015, we completed the Tortue-1 exploration well in Block C8offshore Mauritania, which encountered hydrocarbon pay. Three additional wells have been drilled in theunit development area of the Greater Tortue Ahmeyim field, Ahmeyim-2 in Mauritania and Guembeul-1 andGreater Tortue Ahmeyim-1 in Senegal. We completed a drill stem test on the Tortue-1 well in August 2017,which confirmed the production capabilities of the Greater Tortue Ahmeyim unit. In December 2018, wemade a final investment decision to develop Phase 1 of the Greater Tortue Ahmeyim unit, with first gasproduction currently estimated in 2022. Additionally, in February 2020 the Tortue Phase 1 SPA was executed.
BirAllah Discovery—In November 2015, we completed the Marsouin-1 exploration well in thenorthern part of Block C8 offshore Mauritania, which encountered hydrocarbon pay. Following additionalevaluation, a decision regarding commerciality is expected be made. During the fourth quarter of 2019,we completed the nearby Orca-1 exploration well which encountered hydrocarbon pay. Following additionalevaluation, a decision regarding commerciality is expected to be made. The Bir Allah and Orca discoveriesare being analyzed as a joint development.
Yakaar and Teranga Discoveries—In May 2016, we completed the Teranga-1 exploration well in theCayar Offshore Profond Block offshore Senegal, which encountered hydrocarbon pay. In June 2017, wecompleted the Yakaar-1 exploration well in the Cayar Offshore Profond Block offshore Senegal, whichencountered hydrocarbon pay. In November 2017, an integrated Yakaar-Teranga appraisal plan was submittedto the government of Senegal. In September 2019, we completed the Yakaar-2 appraisal well whichencountered hydrocarbon pay. The Yakaar-2 well was drilled approximately nine kilometers from theYakaar-1 exploration well. Following additional evaluation, a decision regarding commerciality is expectedto be made. The Yakaar and Teranga discoveries are being analyzed as a joint development.
7. Equity Method Investments
Kosmos BP Senegal Limited
As part of our transaction in Senegal with BP in February 2017, our participating interests in theCayar Offshore Profond and Saint Louis Offshore Profond Blocks (“Senegal Blocks”) were contributed toKBSL, a corporate joint venture in which we owned a 50.01% interest which was accounted for under theequity method of accounting.
In October 2017, KBSL transferred a 30% participating interest in the Senegal Blocks to BP SenegalInvestments Limited in exchange for its outstanding shares of KBSL. As a result, KBSL became a wholly-owned subsidiary of Kosmos, and no longer is accounted for under the equity method of accounting. Afterthe transfer, KBSL has a 30% working interest in the Senegal Blocks.
Our initial contribution to KBSL was $133.9 million, which was recorded at our carrying costs. Ourshare of losses in KBSL during the period it was accounted for as an equity method investment is reflectedin our consolidated statements of operations as (Gain) loss on equity method investments, net. During theyear ended December 31, 2017, we recognized $11.5 million related to our share of losses in KBSL.
113
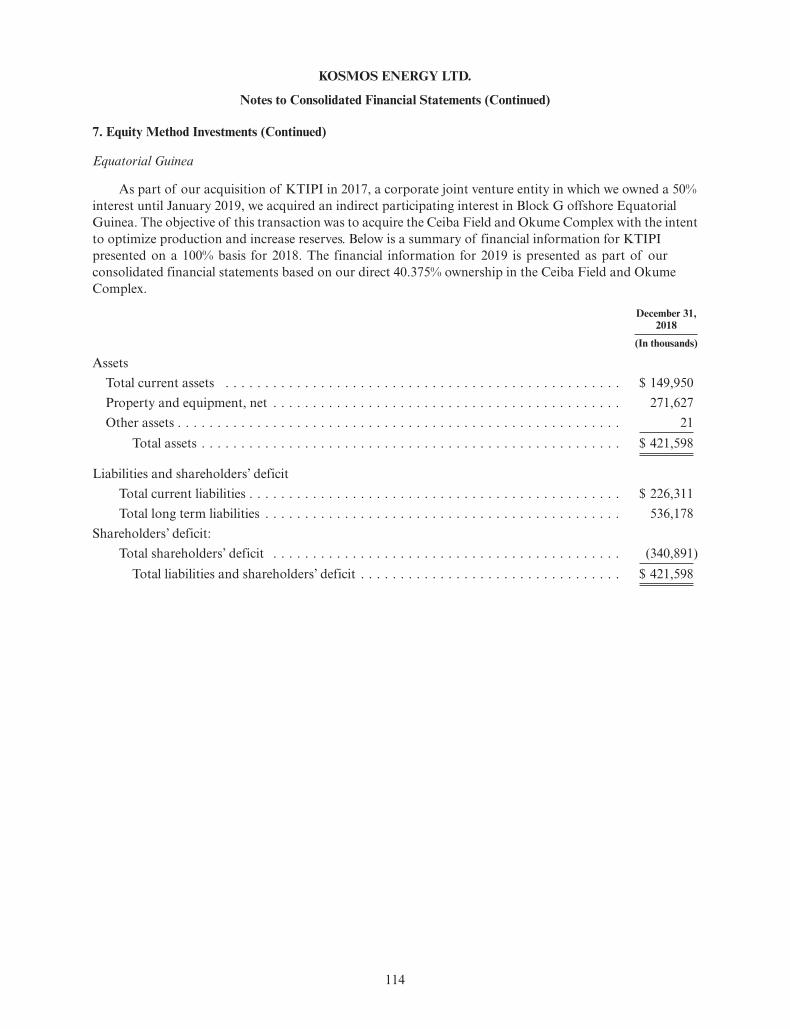
KOSMOS ENERGY LTD.
Notes to Consolidated Financial Statements (Continued)
7. Equity Method Investments (Continued)
Equatorial Guinea
As part of our acquisition of KTIPI in 2017, a corporate joint venture entity in which we owned a 50%interest until January 2019, we acquired an indirect participating interest in Block G offshore EquatorialGuinea. The objective of this transaction was to acquire the Ceiba Field and Okume Complex with the intentto optimize production and increase reserves. Below is a summary of financial information for KTIPIpresented on a 100% basis for 2018. The financial information for 2019 is presented as part of ourconsolidated financial statements based on our direct 40.375% ownership in the Ceiba Field and OkumeComplex.
December 31,2018
(In thousands)
AssetsTotal current assets . . . . . . . . . . . . . . . . . . . . . . . . . . . . . . . . . . . . . . . . . . . . . . . . . . $ 149,950Property and equipment, net . . . . . . . . . . . . . . . . . . . . . . . . . . . . . . . . . . . . . . . . . . . . 271,627Other assets . . . . . . . . . . . . . . . . . . . . . . . . . . . . . . . . . . . . . . . . . . . . . . . . . . . . . . . . 21
Total assets . . . . . . . . . . . . . . . . . . . . . . . . . . . . . . . . . . . . . . . . . . . . . . . . . . . . . $ 421,598
Liabilities and shareholders’ deficitTotal current liabilities . . . . . . . . . . . . . . . . . . . . . . . . . . . . . . . . . . . . . . . . . . . . . . . $ 226,311Total long term liabilities . . . . . . . . . . . . . . . . . . . . . . . . . . . . . . . . . . . . . . . . . . . . . 536,178
Shareholders’ deficit:Total shareholders’ deficit . . . . . . . . . . . . . . . . . . . . . . . . . . . . . . . . . . . . . . . . . . . . (340,891)
Total liabilities and shareholders’ deficit . . . . . . . . . . . . . . . . . . . . . . . . . . . . . . . . . $ 421,598
114

KOSMOS ENERGY LTD.
Notes to Consolidated Financial Statements (Continued)
7. Equity Method Investments (Continued)
Year EndedDecember 31,
2018
PeriodNovember 28,2017 throughDecember 31,
2017
(In thousands)
Revenues and other income:Oil and gas revenue . . . . . . . . . . . . . . . . . . . . . . . . . . . . . . . . . . . . . . . . . $721,299 $54,615Other income . . . . . . . . . . . . . . . . . . . . . . . . . . . . . . . . . . . . . . . . . . . . . (477) 294
Total revenues and other income . . . . . . . . . . . . . . . . . . . . . . . . . . . . . . 720,822 54,909
Costs and expenses:Oil and gas production . . . . . . . . . . . . . . . . . . . . . . . . . . . . . . . . . . . . . . 147,685 15,509Depletion and depreciation . . . . . . . . . . . . . . . . . . . . . . . . . . . . . . . . . . . 126,983 10,738Other expenses, net . . . . . . . . . . . . . . . . . . . . . . . . . . . . . . . . . . . . . . . . . 429 (19)
Total costs and expenses . . . . . . . . . . . . . . . . . . . . . . . . . . . . . . . . . . . . 275,097 26,228
Income before income taxes . . . . . . . . . . . . . . . . . . . . . . . . . . . . . . . . . . . . . 445,725 28,681Income tax expense . . . . . . . . . . . . . . . . . . . . . . . . . . . . . . . . . . . . . . . . . 156,981 6,588
Net income . . . . . . . . . . . . . . . . . . . . . . . . . . . . . . . . . . . . . . . . . . . . . . . . $288,744 $22,093
Kosmos’ share of net income . . . . . . . . . . . . . . . . . . . . . . . . . . . . . . . . . . . . $144,372 $11,046Basis difference amortization(1) . . . . . . . . . . . . . . . . . . . . . . . . . . . . . . . . . . 71,491 5,812Equity in earnings—KTIPI . . . . . . . . . . . . . . . . . . . . . . . . . . . . . . . . . . . . . $ 72,881 $ 5,234
(1) The basis difference, which is associated with oil and gas properties and subject to amortization, hasbeen allocated to the Ceiba Field and Okume Complex. We amortize the basis difference using theunit-of-production method.
115

KOSMOS ENERGY LTD.
Notes to Consolidated Financial Statements (Continued)
7. Equity Method Investments (Continued)
When evaluating our equity method investments for impairment, we review our ability to recover thecarrying amount of such investments or the entity’s ability to sustain earnings that justify its carrying amount.As of December 31, 2018, we determined that we had the ability to recover the carrying amount of ourequity method investment in KTIPI. As such, no impairment has been recorded. Our initial investment hasbeen increased for our net share of equity in earnings as adjusted for our basis differential and reduced bycash dividends received. During the year ended December 31, 2018, we received $257.5 million of cashdividends from KTIPI.
Effective as of January 1, 2019, our outstanding shares in KTIPI were transferred to Trident inexchange for a 40.375% undivided interest in the Ceiba Field and Okume Complex. As a result, our interestin the Ceiba Field and Okume Complex is accounted for under the proportionate consolidation methodof accounting going forward. This transaction was accounted for as an asset acquisition. The carrying valueof the equity method investment was allocated to the undivided interest acquired and net working capitalbased on the estimated relative fair value of the acquired assets.
The estimated fair value measurements of oil and gas assets acquired and liabilities assumed are basedon inputs that are not observable in the market and therefore represent Level 3 inputs. The fair value of oiland gas properties and asset retirement obligations were measured using the discounted cash flow techniqueof valuation. Significant inputs to the valuation of oil and gas properties include estimates of: (i) reserves,(ii) future operating and development costs, (iii) future commodity prices, (iv) future plugging andabandonment costs, (v) estimated future cash flows, and (vi) a market-based weighted average cost ofcapital rate.
Carrying ValueAllocation
(in thousands)
Assets acquired:Proved oil and gas properties . . . . . . . . . . . . . . . . . . . . . . . . . . . . . . . . . . . . $372,144Unproved oil and gas properties . . . . . . . . . . . . . . . . . . . . . . . . . . . . . . . . . . 103,909Prepaids and other . . . . . . . . . . . . . . . . . . . . . . . . . . . . . . . . . . . . . . . . . . . 7,273
Total assets acquired . . . . . . . . . . . . . . . . . . . . . . . . . . . . . . . . . . . . . . . . . $483,326
Liabilities assumed:Asset retirement obligations . . . . . . . . . . . . . . . . . . . . . . . . . . . . . . . . . . . . . $114,395Deferred tax liabilities . . . . . . . . . . . . . . . . . . . . . . . . . . . . . . . . . . . . . . . . . 247,636Accrued liabilities and other . . . . . . . . . . . . . . . . . . . . . . . . . . . . . . . . . . . . . 69,399
Total liabilities assumed . . . . . . . . . . . . . . . . . . . . . . . . . . . . . . . . . . . . . . $431,430
Carrying value:Equity method investment carrying value at December 31, 2018 . . . . . . . . . . . . $ 51,896
116

KOSMOS ENERGY LTD.
Notes to Consolidated Financial Statements (Continued)
8. Debt
December 31,
2019 2018
(In thousands)
Outstanding debt principal balances:Facility . . . . . . . . . . . . . . . . . . . . . . . . . . . . . . . . . . . . . . . . . . . . . $1,400,000 $1,325,000Corporate Revolver . . . . . . . . . . . . . . . . . . . . . . . . . . . . . . . . . . . . — 325,000Senior Notes . . . . . . . . . . . . . . . . . . . . . . . . . . . . . . . . . . . . . . . . . 650,000 —Senior Secured Notes . . . . . . . . . . . . . . . . . . . . . . . . . . . . . . . . . . . — 525,000
Total . . . . . . . . . . . . . . . . . . . . . . . . . . . . . . . . . . . . . . . . . . . . . 2,050,000 2,175,000Unamortized deferred financing costs and discounts(1) . . . . . . . . . . . (41,937) (54,453)Long-term debt, net . . . . . . . . . . . . . . . . . . . . . . . . . . . . . . . . . . . . $2,008,063 $2,120,547
(1) Includes $32.8 million and $40.5 million of unamortized deferred financing costs related to theFacility and $9.1 million and $14.0 million of unamortized deferred financing costs and discountsrelated to the Senior Notes as of December 31, 2019 and December 31, 2018, respectively.
Facility
In February 2018, the Company amended and restated the Facility with a total commitment of$1.5 billion from a number of financial institutions with additional commitments up to $0.5 billion beingavailable if the existing financial institutions increase their commitments or if commitments from new financialinstitutions are added. In November 2018, the Company exercised its option with existing financialinstitutions to provide the Company with an additional commitment of $100 million in the aggregate underthe Facility. The borrowing base calculation includes value related to the Jubilee, TEN, Ceiba and Okumefields. The Facility supports our oil and gas exploration, appraisal and development programs and corporateactivities. As part of the debt refinancing in February 2018, the repayment of borrowings under theexisting facility attributable to financial institutions that did not participate in the amended Facility wasaccounted for as an extinguishment of debt, and $4.1 million of existing unamortized debt issuance costsand deferred interest attributable to those participants was expensed in interest and other financing costs, netin the first quarter of 2018. As of December 31, 2019, we have $32.8 million of unamortized issuance costsrelated to the Facility, which will be amortized over the remaining term of the Facility. In December 2018, theCompany entered into letter agreements with existing financial institutions, which provided the Companywith an additional commitment of $100 million in the aggregate under the Facility effective January 31, 2019.This took the total commitments to $1.7 billion as of January 31, 2019. In March 2019, following thelender’s annual redetermination, the available borrowing base under our Facility was limited to the Facilitysize of $1.7 billion. The commitments were reduced by $100.0 million to $1.6 billion following the SeniorNotes issuance in April 2019.
As of December 31, 2019, borrowings under the Facility totaled $1.4 billion and the undrawn availabilityunder the Facility was $200.0 million, which includes the additional commitments as referenced above.Interest is the aggregate of the applicable margin (3.25% to 4.50%, depending on the length of time that haspassed from the date the Facility was entered into) and LIBOR. Interest is payable on the last day of eachinterest period (and, if the interest period is longer than six months, on the dates falling at six-month intervalsafter the first day of the interest period). We pay commitment fees on the undrawn and unavailableportion of the total commitments, if any. As part of the amendment and restatement process in February 2018,commitment fees were lowered from 40% to 30% per annum of the then-applicable respective margin whena commitment is available for utilization and, equal to 20% per annum of the then-applicable respective marginwhen a commitment is not available for utilization. We recognize interest expense in accordance with
117

KOSMOS ENERGY LTD.
Notes to Consolidated Financial Statements (Continued)
8. Debt (Continued)
ASC 835—Interest, which requires interest expense to be recognized using the effective interest method. Wedetermined the effective interest rate based on the estimated level of borrowings under the Facility.
The Facility provides a revolving credit and letter of credit facility. The availability period for therevolving credit facility expires one month prior to the final maturity date. The letter of credit facilityexpires on the final maturity date. The available facility amount is subject to borrowing base constraintsand, beginning on March 31, 2022, outstanding borrowings will be constrained by an amortization schedule.The Facility has a final maturity date of March 31, 2025. As of December 31, 2019, we had no letters ofcredit issued under the Facility.
Kosmos has the right to cancel all the undrawn commitments under the amended and restated Facility.The amount of funds available to be borrowed under the Facility, also known as the borrowing base amount,is determined each year on March 31, as amended. The borrowing base amount is based on the sum of thenet present value of net cash flows and relevant capital expenditures reduced by certain percentages as well asvalue attributable to certain assets’ reserves and/or resources in Ghana and Equatorial Guinea.
If an event of default exists under the Facility, the lenders can accelerate the maturity and exerciseother rights and remedies, including the enforcement of security granted pursuant to the Facility overcertain assets held by our subsidiaries. The Facility contains customary cross default provisions.
We were in compliance with the financial covenants contained in the Facility as of the September 30,2019 (the most recent assessment date).
Corporate Revolver
In August 2018, we amended and restated the Corporate Revolver maintaining the borrowing capacityat $400.0 million, extending the maturity date from November 2018 to May 2022 and lowering the margin100 basis points to 5%. This results in lower commitment fees on the undrawn portion of the totalcommitments, which is 30% per annum of the respective margin. The Corporate Revolver is available forgeneral corporate purposes and for oil and gas exploration, appraisal and development programs. As ofDecember 31, 2019, we have $6.3 million of net deferred financing costs related to the Corporate Revolver,which will be amortized over the remaining term. These deferred financing costs are included in the Otherassets section of our consolidated balance sheets.
As of December 31, 2019, there were no borrowings outstanding under the Corporate Revolver andthe undrawn availability under the Corporate Revolver was $400.0 million.
Interest is the aggregate of the applicable margin (5.0%); LIBOR; and mandatory cost (if any, asdefined in the Corporate Revolver). Interest is payable on the last day of each interest period (and, if theinterest period is longer than six months, on the dates falling at six-month intervals after the first day of theinterest period). We pay commitment fees on the undrawn portion of the total commitments. Commitmentfees for the lenders are equal to 30% per annum of the respective margin when a commitment is available forutilization.
The Corporate Revolver expires on May 31, 2022. The available amount is not subject to borrowingbase constraints. Kosmos has the right to cancel all the undrawn commitments under the Corporate Revolver.The Company is required to repay certain amounts due under the Corporate Revolver with sales of certainsubsidiaries or sales of certain assets. If an event of default exists under the Corporate Revolver, the lenderscan accelerate the maturity and exercise other rights and remedies, including the enforcement of securitygranted pursuant to the Corporate Revolver over certain assets held by us.
We were in compliance with the financial covenants contained in the Corporate Revolver as ofSeptember 30, 2019 (the most recent assessment date). The Corporate Revolver contains customary crossdefault provisions.
118

KOSMOS ENERGY LTD.
Notes to Consolidated Financial Statements (Continued)
8. Debt (Continued)
Revolving Letter of Credit Facility
In July 2013, we entered into a revolving letter of credit facility agreement (“LC Facility”). The size ofthe LC Facility was $75.0 million, as amended in July 2015, with additional commitments up to $50.0 millionbeing available if the existing lender increases its commitment or if commitments from new financialinstitutions are added.
In July 2016, we amended and restated the LC Facility, extending the maturity date to July 2019. Otheramendments included increasing the margin from 0.5% to 0.8% per annum on amounts outstanding, addinga commitment fee payable quarterly in arrears at an annual rate equal to 0.65% on the available commitmentamount and providing for issuance fees to be payable to the lender per new issuance of a letter of credit.We may voluntarily cancel any commitments available under the LC Facility at any time. During the firstquarter of 2017, the LC Facility size was increased to $115.0 million and in April 2017, we reduced the sizeof our LC Facility to $70 million. In February 2018, the LC Facility was increased to $73 million to facilitatethe issuance of additional letters of credit. In July 2018 and December 2018, the LC Facility size wasvoluntarily reduced to $40.0 million and $20.0 million, respectively, based on the expiration of several largeoutstanding letters of credit. The LC Facility expired in July 2019, however, as of December 31, 2019,there were five outstanding letters of credit totaling $3.1 million under the LC Facility, which will remainoutstanding until the respective letters of credit expire. The LC Facility contains customary cross defaultprovisions.
In 2019, we issued two letters of credit totaling $20.4 million under a new letter of credit arrangement,which does not currently require cash collateral.
7.875% Senior Secured Notes due 2021
During August 2014, the Company issued $300.0 million of Senior Secured Notes and received netproceeds of approximately $292.5 million after deducting discounts, commissions and deferred financingcosts. The Company used the net proceeds to repay a portion of the outstanding indebtedness under theFacility and for general corporate purposes.
During April 2015, we issued an additional $225.0 million of Senior Secured Notes and received netproceeds of $206.8 million after deducting discounts, commissions and other expenses. We used the netproceeds to repay a portion of the outstanding indebtedness under the Facility and for general corporatepurposes. The additional $225.0 million of Senior Secured Notes have identical terms to the initial$300.0 million Senior Secured Notes, other than the date of issue, the initial price, the first interest paymentdate and the first date from which interest accrued.
In April 2019, all of the Senior Secured Notes were redeemed for $543.8 million, including accruedinterest and the early redemption premium. The redemption resulted in a $22.9 million loss on extinguishmentof debt, which is included in Interest and other financing costs, net on the consolidated statement ofoperations.
7.125% Senior Notes due 2026
In April 2019, the Company issued $650.0 million of 7.125% Senior Notes and received net proceeds ofapproximately $640.0 million after deducting commissions and other expenses. We used the net proceeds toredeem all of the Senior Secured Notes, repay a portion of the outstanding indebtedness under theCorporate Revolver and pay fees and expenses related to the redemption, repayment and the issuance of theSenior Notes.
The Senior Notes mature on April 4, 2026. We will pay interest in arrears on the Senior Notes eachApril 4 and October 4, commencing on October 4, 2019. The Senior Notes are senior, unsecured obligations
119

KOSMOS ENERGY LTD.
Notes to Consolidated Financial Statements (Continued)
8. Debt (Continued)
of Kosmos Energy Ltd. and rank equal in right of payment with all of its existing and future seniorindebtedness (including all borrowings under the Corporate Revolver) and rank effectively junior in right ofpayment to all of its existing and future secured indebtedness (including all borrowings under the Facility).The Senior Notes are guaranteed on a senior, unsecured basis by certain subsidiaries owning the Company’sGulf of Mexico assets, and on a subordinated, unsecured basis by certain subsidiaries that guarantee theFacility.
At any time prior to April 4, 2022, and subject to certain conditions, the Company may, on one ormore occasions, redeem up to 40% of the original principal amount of the Senior Notes with an amountnot to exceed the net cash proceeds of certain equity offerings at a redemption price of 107.1% of theoutstanding principal amount of the Senior Notes, together with accrued and unpaid interest and premium,if any, to, but excluding, the date of redemption. Additionally, at any time prior to April 4, 2022 theCompany may, on any one or more occasions, redeem all or a part of the Senior Notes at a redemptionprice equal to 100%, plus any accrued and unpaid interest, and plus a “make-whole” premium. On or afterApril 4, 2022, the Company may redeem all or a part of the Senior Notes at the redemption prices (expressedas percentages of principal amount) set forth below plus accrued and unpaid interest:
Year Percentage
On or after April 4, 2022, but before April 4, 2023 . . . . . . . . . . . . . . . . . . . 103.6%On or after April 4, 2023, but before April 4, 2024 . . . . . . . . . . . . . . . . . . . 101.8%On or after April 4, 2024 and thereafter . . . . . . . . . . . . . . . . . . . . . . . . . . 100.0%
We may also redeem the Senior Notes in whole, but not in part, at any time if changes in tax lawsimpose certain withholding taxes on amounts payable on the Senior Notes at a price equal to the principalamount of the Senior Notes plus accrued interest and additional amounts, if any, as may be necessary so thatthe net amount received by each holder after any withholding or deduction on payments of the SeniorNotes will not be less than the amount such holder would have received if such taxes had not been withheldor deducted.
Upon the occurrence of a change of control triggering event as defined under the Senior Notesindenture, the Company will be required to make an offer to repurchase the Senior Notes at a repurchaseprice equal to 101% of the principal amount, plus accrued and unpaid interest to, but excluding, the date ofrepurchase.
If we sell assets, under certain circumstances outlined in the Senior Notes indenture, we will berequired to use the net proceeds to make an offer to purchase the Senior Notes at an offer price in cash inan amount equal to 100% of the principal amount of the Senior Notes, plus accrued and unpaid interest to,but excluding, the repurchase date.
The Senior Notes indenture restricts our ability and the ability of our restricted subsidiaries to, amongother things: incur or guarantee additional indebtedness, create liens, pay dividends or make distributions inrespect of capital stock, purchase or redeem capital stock, make investments or certain other restrictedpayments, sell assets, enter into agreements that restrict the ability of our subsidiaries to make dividends orother payments to us, enter into transactions with affiliates, or effect certain consolidations, mergers oramalgamations. These covenants are subject to a number of important qualifications and exceptions.Certain of these covenants will be terminated if the Senior Notes are assigned an investment grade ratingby both Standard & Poor’s Rating Services and Fitch Ratings Inc. and no default or event of default hasoccurred and is continuing.
120

KOSMOS ENERGY LTD.
Notes to Consolidated Financial Statements (Continued)
8. Debt (Continued)
At December 31, 2019, the estimated repayments of debt during the five years and thereafter are asfollows:
Payments Due by Year
Total 2020 2021 2022 2023 2024 Thereafter
(In thousands)
Principal debt repayments(1) . . . $2,050,000 $ — $174,800 $284,200 $271,600 $440,829 $878,571
(1) Includes the scheduled maturities for the $650.0 million aggregate principal amount of Senior Notesissued in April 2019 and borrowings under the Facility. The scheduled maturities of debt related to theFacility are based on, as of December 31, 2019, our level of borrowings and our estimated futureavailable borrowing base commitment levels in future periods. Any increases or decreases in the level ofborrowings or increases or decreases in the available borrowing base would impact the scheduledmaturities of debt during the next five years and thereafter.
Interest and other financing costs, net
Interest and other financing costs, net incurred during the period comprised of the following:
Years Ended December 31,
2019 2018 2017
(In thousands)
Interest expense . . . . . . . . . . . . . . . . . . . . . . . . . . . . . . . . . . . . . . . . $145,507 $114,134 $ 92,687Amortization—deferred financing costs . . . . . . . . . . . . . . . . . . . . . . . 9,257 9,379 10,204Loss on extinguishment of debt . . . . . . . . . . . . . . . . . . . . . . . . . . . . . 24,794 4,324 —Capitalized interest . . . . . . . . . . . . . . . . . . . . . . . . . . . . . . . . . . . . . (28,077) (28,331) (30,282)Deferred interest . . . . . . . . . . . . . . . . . . . . . . . . . . . . . . . . . . . . . . . 1,919 (1,138) 2,577Interest income . . . . . . . . . . . . . . . . . . . . . . . . . . . . . . . . . . . . . . . . (3,692) (3,455) (3,422)Other, net . . . . . . . . . . . . . . . . . . . . . . . . . . . . . . . . . . . . . . . . . . . . 5,366 6,263 5,831
Interest and other financing costs, net . . . . . . . . . . . . . . . . . . . . . . . $155,074 $101,176 $ 77,595
9. Derivative Financial Instruments
We use financial derivative contracts to manage exposures to commodity price and interest ratefluctuations. We do not hold or issue derivative financial instruments for trading purposes.
We manage market and counterparty credit risk in accordance with our policies and guidelines. Inaccordance with these policies and guidelines, our management determines the appropriate timing andextent of derivative transactions. We have included an estimate of non-performance risk in the fair valuemeasurement of our derivative contracts as required by ASC 820—Fair Value Measurements and Disclosures.
121
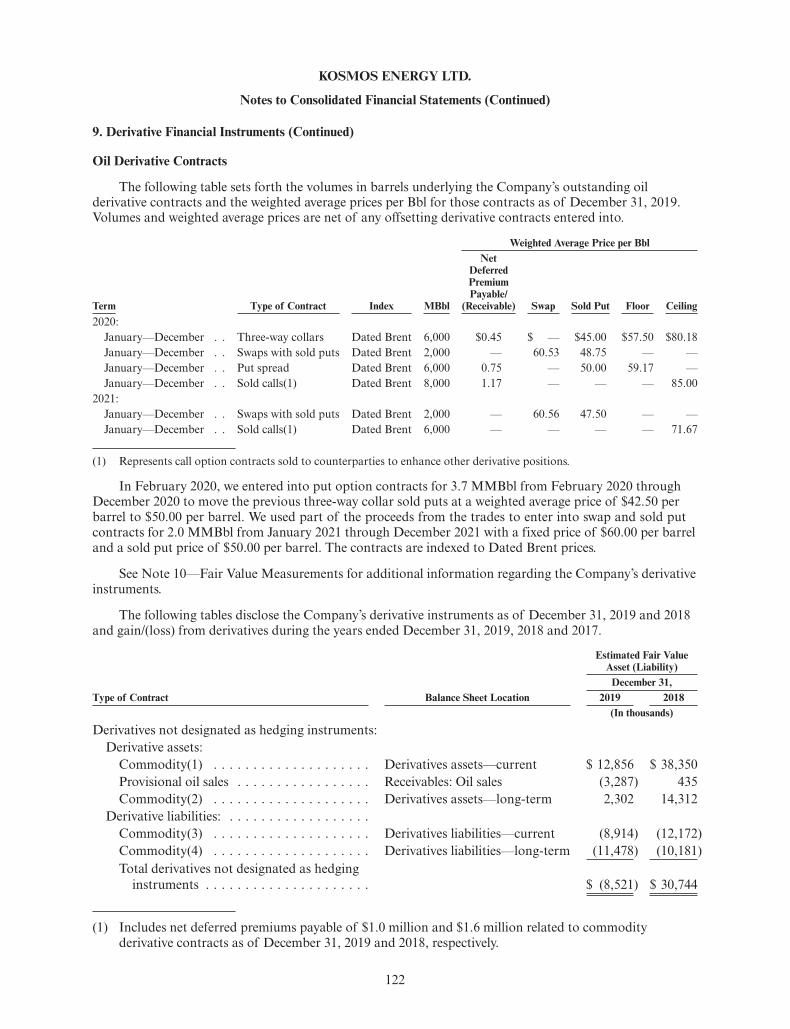
KOSMOS ENERGY LTD.
Notes to Consolidated Financial Statements (Continued)
9. Derivative Financial Instruments (Continued)
Oil Derivative Contracts
The following table sets forth the volumes in barrels underlying the Company’s outstanding oilderivative contracts and the weighted average prices per Bbl for those contracts as of December 31, 2019.Volumes and weighted average prices are net of any offsetting derivative contracts entered into.
Weighted Average Price per Bbl
Term Type of Contract Index MBbl
NetDeferredPremiumPayable/
(Receivable) Swap Sold Put Floor Ceiling2020:
January—December . . Three-way collars Dated Brent 6,000 $0.45 $ — $45.00 $57.50 $80.18January—December . . Swaps with sold puts Dated Brent 2,000 — 60.53 48.75 — —January—December . . Put spread Dated Brent 6,000 0.75 — 50.00 59.17 —January—December . . Sold calls(1) Dated Brent 8,000 1.17 — — — 85.00
2021:January—December . . Swaps with sold puts Dated Brent 2,000 — 60.56 47.50 — —January—December . . Sold calls(1) Dated Brent 6,000 — — — — 71.67
(1) Represents call option contracts sold to counterparties to enhance other derivative positions.
In February 2020, we entered into put option contracts for 3.7 MMBbl from February 2020 throughDecember 2020 to move the previous three-way collar sold puts at a weighted average price of $42.50 perbarrel to $50.00 per barrel. We used part of the proceeds from the trades to enter into swap and sold putcontracts for 2.0 MMBbl from January 2021 through December 2021 with a fixed price of $60.00 per barreland a sold put price of $50.00 per barrel. The contracts are indexed to Dated Brent prices.
See Note 10—Fair Value Measurements for additional information regarding the Company’s derivativeinstruments.
The following tables disclose the Company’s derivative instruments as of December 31, 2019 and 2018and gain/(loss) from derivatives during the years ended December 31, 2019, 2018 and 2017.
Estimated Fair ValueAsset (Liability)
December 31,Type of Contract Balance Sheet Location 2019 2018
(In thousands)
Derivatives not designated as hedging instruments:Derivative assets:
Commodity(1) . . . . . . . . . . . . . . . . . . . . Derivatives assets—current $ 12,856 $ 38,350Provisional oil sales . . . . . . . . . . . . . . . . . Receivables: Oil sales (3,287) 435Commodity(2) . . . . . . . . . . . . . . . . . . . . Derivatives assets—long-term 2,302 14,312
Derivative liabilities: . . . . . . . . . . . . . . . . . .Commodity(3) . . . . . . . . . . . . . . . . . . . . Derivatives liabilities—current (8,914) (12,172)Commodity(4) . . . . . . . . . . . . . . . . . . . . Derivatives liabilities—long-term (11,478) (10,181)Total derivatives not designated as hedging
instruments . . . . . . . . . . . . . . . . . . . . . $ (8,521) $ 30,744
(1) Includes net deferred premiums payable of $1.0 million and $1.6 million related to commodityderivative contracts as of December 31, 2019 and 2018, respectively.
122

KOSMOS ENERGY LTD.
Notes to Consolidated Financial Statements (Continued)
9. Derivative Financial Instruments (Continued)
(2) Includes net deferred premiums payable of $0.3 million and $1.3 million related to commodityderivative contracts as of December 31, 2019 and 2018, respectively.
(3) Includes net deferred premiums payable of $5.5 million and $18.0 million related to commodityderivative contracts as of December 31, 2019 and 2018, respectively.
(4) Includes net deferred premiums payable of $0.3 million and $0.5 million related to commodityderivative contracts as of December 31, 2019 and 2018, respectively.
Amount of Gain/(Loss)Years Ended December 31,
Type of Contract Location of Gain/(Loss) 2019 2018 2017(In thousands)
Derivatives not designated as hedging instruments:Commodity(1). . . . . . . . . . . . . . . . . . . . . . . . . Oil and gas revenue $ 1,161 $ (1,963) $(12,502)Commodity . . . . . . . . . . . . . . . . . . . . . . . . . . Derivatives, net (71,885) 31,430 (59,968)Interest rate . . . . . . . . . . . . . . . . . . . . . . . . . . Interest expense — 493 648
Total derivatives not designated as hedginginstruments . . . . . . . . . . . . . . . . . . . . . . . $(70,724) $29,960 $(71,822)
(1) Amounts represent the change in fair value of our provisional oil sales contracts.
Offsetting of Derivative Assets and Derivative Liabilities
Our derivative instruments which are subject to master netting arrangements with our counterpartiesonly have the right of offset when there is an event of default. As of December 31, 2019 and 2018, there wasnot an event of default and, therefore, the associated gross asset or gross liability amounts related to thesearrangements are presented on the consolidated balance sheets.
10. Fair Value Measurements
In accordance with ASC 820—Fair Value Measurements and Disclosures, fair value measurements arebased upon inputs that market participants use in pricing an asset or liability, which are classified into twocategories: observable inputs and unobservable inputs. Observable inputs represent market data obtainedfrom independent sources, whereas unobservable inputs reflect a company’s own market assumptions,which are used if observable inputs are not reasonably available without undue cost and effort. We prioritizethe inputs used in measuring fair value into the following fair value hierarchy:
• Level 1—quoted prices for identical assets or liabilities in active markets.
• Level 2—quoted prices for similar assets or liabilities in active markets, quoted prices for identical orsimilar assets or liabilities in markets that are not active, inputs other than quoted prices that areobservable for the asset or liability and inputs derived principally from or corroborated by observablemarket data by correlation or other means.
• Level 3—unobservable inputs for the asset or liability. The fair value input hierarchy level to whichan asset or liability measurement in its entirety falls is determined based on the lowest level input thatis significant to the measurement in its entirety.
123

KOSMOS ENERGY LTD.
Notes to Consolidated Financial Statements (Continued)
10. Fair Value Measurements (Continued)
The following tables present the Company’s assets and liabilities that are measured at fair value on arecurring basis as of December 31, 2019 and 2018, for each fair value hierarchy level:
Fair Value Measurements Using:
Quoted Prices inActive Markets
for IdenticalAssets
(Level 1)
Significant OtherObservable
Inputs(Level 2)
SignificantUnobservable
Inputs(Level 3) Total
(In thousands)
December 31, 2019Assets:
Commodity derivatives . . . . . . . . . . $ — $ 15,158 $ — $ 15,158Provisional oil sales . . . . . . . . . . . . — (3,287) — (3,287)
Liabilities:Commodity derivatives . . . . . . . . . . — (20,392) — (20,392)
Total . . . . . . . . . . . . . . . . . . . . . $ — $ (8,521) $ — $ (8,521)
December 31, 2018Assets:
Commodity derivatives . . . . . . . . . . $ — $ 52,662 $ — $ 52,662Provisional oil sales . . . . . . . . . . . . — 435 — 435
Liabilities:Commodity derivatives . . . . . . . . . . — (22,353) — (22,353)
Total . . . . . . . . . . . . . . . . . . . . . $ — $ 30,744 $ — $ 30,744
The book values of cash and cash equivalents and restricted cash approximate fair value based onLevel 1 inputs. Joint interest billings, oil sales and other receivables, and accounts payable and accruedliabilities approximate fair value due to the short-term nature of these instruments. Our long-term receivables,after any allowances for doubtful accounts, and other long-term assets approximate fair value. The estimatesof fair value of these items are based on Level 2 inputs.
Commodity Derivatives
Our commodity derivatives represent crude oil collars, put options, call options and swaps for notionalbarrels of oil at fixed Dated Brent, NYMEX WTI or Argus LLS oil prices. The values attributable to ouroil derivatives are based on (i) the contracted notional volumes, (ii) independent active futures price quotesfor the respective index, (iii) a credit-adjusted yield curve applicable to each counterparty by reference to thecredit default swap (“CDS”) market and (iv) an independently sourced estimate of volatility for therespective index. The volatility estimate was provided by certain independent brokers who are active inbuying and selling oil options and was corroborated by market-quoted volatility factors. The deferredpremium is included in the fair market value of the commodity derivatives. See Note 9—Derivative FinancialInstruments for additional information regarding the Company’s derivative instruments.
Provisional Oil Sales
The value attributable to the provisional oil sales derivative is based on (i) the sales volumes and (ii) thedifference in the independent active futures price quotes for the respective index over the term of the pricingperiod designated in the sales contract and the spot price on the lifting date.
124

KOSMOS ENERGY LTD.
Notes to Consolidated Financial Statements (Continued)
10. Fair Value Measurements (Continued)
Debt
The following table presents the carrying values and fair values at December 31, 2019 and 2018:
December 31, 2019 December 31, 2018
Carrying Value Fair Value Carrying Value Fair Value
(In thousands)
Senior Notes . . . . . . . . . . . . . . . . . . . . . . . . . . $ 642,550 $ 664,957 $ — $ —Senior Secured Notes . . . . . . . . . . . . . . . . . . . . — — 511,873 525,026Corporate Revolver . . . . . . . . . . . . . . . . . . . . . . — — 325,000 325,000Facility . . . . . . . . . . . . . . . . . . . . . . . . . . . . . . 1,400,000 1,400,000 1,325,000 1,325,000
Total . . . . . . . . . . . . . . . . . . . . . . . . . . . . . . $2,042,550 $2,064,957 $2,161,873 $2,175,026
The carrying value of our Senior Notes and Senior Secured Notes represents the principal amountsoutstanding less unamortized discounts. The fair value of our Senior Notes is based on quoted marketprices, which results in a Level 1 fair value measurement. The carrying value of the Facility approximatesfair value since it is subject to short-term floating interest rates that approximate the rates available to us forthose periods.
11. Asset Retirement Obligations
The following table summarizes the changes in the Company’s asset retirement obligations:
December 31,
2019 2018
(In thousands)
Asset retirement obligations:Beginning asset retirement obligations . . . . . . . . . . . . . . . . . . . . . . . . . . . . . . $151,953 $ 66,595Additions associated with Equatorial Guinea – Ceiba Field and Okume
Complex . . . . . . . . . . . . . . . . . . . . . . . . . . . . . . . . . . . . . . . . . . . . . . . . . 114,395 —Additions associated with the acquisition of DGE . . . . . . . . . . . . . . . . . . . . . . — 74,482Liabilities incurred during period . . . . . . . . . . . . . . . . . . . . . . . . . . . . . . . . . . 11,218 5,311Liabilities settled during period . . . . . . . . . . . . . . . . . . . . . . . . . . . . . . . . . . . (7,156) (3,345)Revisions in estimated retirement obligations . . . . . . . . . . . . . . . . . . . . . . . . . . (49,471) —Accretion expense . . . . . . . . . . . . . . . . . . . . . . . . . . . . . . . . . . . . . . . . . . . . . 14,114 8,910Ending asset retirement obligations . . . . . . . . . . . . . . . . . . . . . . . . . . . . . . . . $235,053 $151,953
The asset retirement obligations reflect the estimated present value of the amount of dismantlement,removal, site reclamation, and similar activities associated with our oil and gas properties. The Companyutilizes current cost experience to estimate the expected cash outflows for retirement obligations. The Companyestimates the ultimate productive life of the properties, a risk-adjusted discount rate, and an inflationfactor in order to determine the current present value of this obligation. To the extent future revisions tothese assumptions impact the present value of the existing asset retirement obligation, a correspondingadjustment is made to the oil and gas property balance. The revisions in estimated retirement obligationsduring 2019 are related to changes in the estimated abandonment date in certain of our fields.
Effective as of January 1, 2019, our outstanding shares in KTIPI were transferred to Trident inexchange for a 40.375% undivided interest in the Ceiba Field and Okume Complex. As a result, our interest
125

KOSMOS ENERGY LTD.
Notes to Consolidated Financial Statements (Continued)
11. Asset Retirement Obligations (Continued)
in the Ceiba Field and Okume Complex going forward is accounted for under the proportionateconsolidation method of accounting, which includes additions to our asset retirement obligations.
12. Equity-based Compensation
Restricted Stock Awards and Restricted Stock Units
Our Long-Term Incentive Plan (“LTIP”) provides for the granting of incentive awards in the form ofstock options, stock appreciation rights, restricted stock awards, restricted stock units, among other awardtypes. In January 2018 and January 2015, the board of directors approved amendments to the plan whichadded 11.0 million and 15.0 million shares, respectively, to the plan which were approved at thecorresponding Annual General Meeting. The LTIP as amended provides for the issuance of 50.5 millionshares pursuant to awards under the plan. As of December 31, 2019, the Company had approximately10.6 million shares that remain available for issuance under the LTIP.
We record equity-based compensation expense equal to the fair value of share-based payments over thevesting periods of the LTIP awards. We recorded compensation expense from awards granted under our LTIPof $32.4 million, $35.2 million and $40.0 million during the years ended December 31, 2019, 2018 and2017, respectively. The total tax benefit for the years ended December 31, 2019, 2018 and 2017 was $4.9 million,$6.6 million and $13.2 million, respectively. Additionally, we expensed a net tax shortfall (windfall) relatedto equity-based compensation of $1.2 million, $(0.4) million and $3.1 million for the years ended December 31,2019, 2018 and 2017, respectively. The fair value of awards vested during 2019, 2018 and 2017 wasapproximately $20.3 million, $85.1 million, and $21.2 million, respectively. The Company granted bothrestricted stock awards and restricted stock units with service vesting criteria and granted both restrictedstock awards and restricted stock units with a combination of market and service vesting criteria under theLTIP. Substantially, all of these awards vest over a three year period. Restricted stock awards are issued andincluded in the number of outstanding shares upon the date of grant and, if such awards are forfeited,they become treasury stock. Upon vesting, restricted stock units become issued and outstanding stock.
The following table reflects the outstanding restricted stock awards as of December 31, 2019:
Service VestingRestricted
Stock Awards
Weighted-Average
Grant-DateFair Value
Market/ServiceVesting
RestrictedStock Awards
Weighted-Average
Grant-DateFair Value
(In thousands) (In thousands)
Outstanding at December 31, 2016: 488 $8.83 — $ —Granted . . . . . . . . . . . . . . . . . . . . . . . . — — — —Forfeited . . . . . . . . . . . . . . . . . . . . . . . — — — —Vested . . . . . . . . . . . . . . . . . . . . . . . . . (268) 8.97 — —
Outstanding at December 31, 2017: 220 8.64 — —Granted . . . . . . . . . . . . . . . . . . . . . . . . — — — —Forfeited . . . . . . . . . . . . . . . . . . . . . . . — — — —Vested . . . . . . . . . . . . . . . . . . . . . . . . . (220) 8.64 — —
Outstanding at December 31, 2018: . . . . . . . — — — —
There has been no additional restricted stock activity subsequent to December 31, 2018.
126
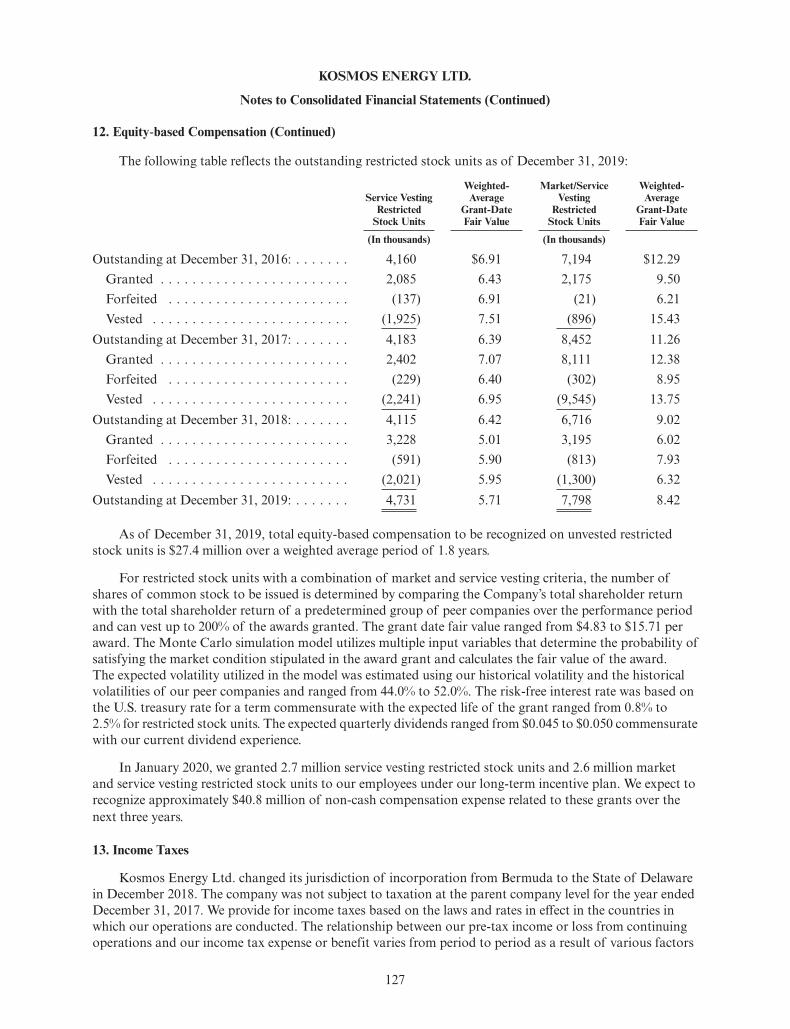
KOSMOS ENERGY LTD.
Notes to Consolidated Financial Statements (Continued)
12. Equity-based Compensation (Continued)
The following table reflects the outstanding restricted stock units as of December 31, 2019:
Service VestingRestricted
Stock Units
Weighted-Average
Grant-DateFair Value
Market/ServiceVesting
RestrictedStock Units
Weighted-Average
Grant-DateFair Value
(In thousands) (In thousands)
Outstanding at December 31, 2016: . . . . . . . 4,160 $6.91 7,194 $12.29Granted . . . . . . . . . . . . . . . . . . . . . . . . 2,085 6.43 2,175 9.50Forfeited . . . . . . . . . . . . . . . . . . . . . . . (137) 6.91 (21) 6.21Vested . . . . . . . . . . . . . . . . . . . . . . . . . (1,925) 7.51 (896) 15.43
Outstanding at December 31, 2017: . . . . . . . 4,183 6.39 8,452 11.26Granted . . . . . . . . . . . . . . . . . . . . . . . . 2,402 7.07 8,111 12.38Forfeited . . . . . . . . . . . . . . . . . . . . . . . (229) 6.40 (302) 8.95Vested . . . . . . . . . . . . . . . . . . . . . . . . . (2,241) 6.95 (9,545) 13.75
Outstanding at December 31, 2018: . . . . . . . 4,115 6.42 6,716 9.02Granted . . . . . . . . . . . . . . . . . . . . . . . . 3,228 5.01 3,195 6.02Forfeited . . . . . . . . . . . . . . . . . . . . . . . (591) 5.90 (813) 7.93Vested . . . . . . . . . . . . . . . . . . . . . . . . . (2,021) 5.95 (1,300) 6.32
Outstanding at December 31, 2019: . . . . . . . 4,731 5.71 7,798 8.42
As of December 31, 2019, total equity-based compensation to be recognized on unvested restrictedstock units is $27.4 million over a weighted average period of 1.8 years.
For restricted stock units with a combination of market and service vesting criteria, the number ofshares of common stock to be issued is determined by comparing the Company’s total shareholder returnwith the total shareholder return of a predetermined group of peer companies over the performance periodand can vest up to 200% of the awards granted. The grant date fair value ranged from $4.83 to $15.71 peraward. The Monte Carlo simulation model utilizes multiple input variables that determine the probability ofsatisfying the market condition stipulated in the award grant and calculates the fair value of the award.The expected volatility utilized in the model was estimated using our historical volatility and the historicalvolatilities of our peer companies and ranged from 44.0% to 52.0%. The risk-free interest rate was based onthe U.S. treasury rate for a term commensurate with the expected life of the grant ranged from 0.8% to2.5% for restricted stock units. The expected quarterly dividends ranged from $0.045 to $0.050 commensuratewith our current dividend experience.
In January 2020, we granted 2.7 million service vesting restricted stock units and 2.6 million marketand service vesting restricted stock units to our employees under our long-term incentive plan. We expect torecognize approximately $40.8 million of non-cash compensation expense related to these grants over thenext three years.
13. Income Taxes
Kosmos Energy Ltd. changed its jurisdiction of incorporation from Bermuda to the State of Delawarein December 2018. The company was not subject to taxation at the parent company level for the year endedDecember 31, 2017. We provide for income taxes based on the laws and rates in effect in the countries inwhich our operations are conducted. The relationship between our pre-tax income or loss from continuingoperations and our income tax expense or benefit varies from period to period as a result of various factors
127

KOSMOS ENERGY LTD.
Notes to Consolidated Financial Statements (Continued)
13. Income Taxes (Continued)
which include changes in total pre-tax income or loss, the jurisdictions in which our income (loss) is earnedand the tax laws in those jurisdictions.
On December 22, 2017, the President of the United States signed P.L. 115-97, the Tax Cut and JobsAct (the Tax Reform Act), into law. Many of the provisions of the Tax Reform Act are effective beginningJanuary 1, 2018, most notable of which is the reduction in the U.S. corporate income tax rate from 35% to21%. Accounting Standards Codification Topic 740 requires deferred tax assets and liabilities be adjustedfor the effect of changes in tax laws or tax rates during the period that includes the date of enactment.Accordingly, we have recorded a $16.7 million charge to deferred tax expense in December 2017 as a result ofreducing our net deferred tax assets.
Effective January 1, 2019, our outstanding shares in KTIPI were transferred to Trident in exchange fora 40.375% undivided interest in the Ceiba Field and Okume Complex and Trident became the operator. Asa result, our interest in the Ceiba Field and Okume Complex will be accounted for under the proportionateconsolidation method of accounting going forward. The following discussion reflects the proportionateconsolidation of our Equatorial Guinean operations related to the Ceiba Field and Okume Complex for theyear ended December 31, 2019. For years ended prior to 2019 KTIPI was accounted for as an EquityMethod Investment.
The components of loss before income taxes were as follows:Years Ended December 31,
2019 2018 2017
(In thousands)
United States . . . . . . . . . . . . . . . . . . . . . . . . . . . . . . . . $(149,919) $ 41,026 $ 6,068Bermuda . . . . . . . . . . . . . . . . . . . . . . . . . . . . . . . . . . . — (73,979) (66,914)Foreign—other . . . . . . . . . . . . . . . . . . . . . . . . . . . . . . . 175,036 (17,907) (117,009)Income (loss) before income taxes . . . . . . . . . . . . . . . . . . $ 25,117 $(50,860) $(177,855)
The components of the provision for income taxes attributable to our income (loss) before incometaxes consist of the following:
Years Ended December 31,
2019 2018 2017
(In thousands)
Current:United States . . . . . . . . . . . . . . . . . . . . . . . . . . . . . . . $ 185 $ 122 $10,976Bermuda . . . . . . . . . . . . . . . . . . . . . . . . . . . . . . . . . . — — —Foreign—other . . . . . . . . . . . . . . . . . . . . . . . . . . . . . 171,079 33,864 24,456
Total current . . . . . . . . . . . . . . . . . . . . . . . . . . . . . . . . . 171,264 33,986 35,432Deferred:
United States . . . . . . . . . . . . . . . . . . . . . . . . . . . . . . . (18,776) 8,514 15,310Bermuda . . . . . . . . . . . . . . . . . . . . . . . . . . . . . . . . . . — — —Foreign—other . . . . . . . . . . . . . . . . . . . . . . . . . . . . . (71,594) 631 (5,805)
Total deferred . . . . . . . . . . . . . . . . . . . . . . . . . . . . . . . . (90,370) 9,145 9,505Income tax expense . . . . . . . . . . . . . . . . . . . . . . . . . . . . $ 80,894 $43,131 $44,937
128

KOSMOS ENERGY LTD.
Notes to Consolidated Financial Statements (Continued)
13. Income Taxes (Continued)
Our reconciliation of income tax expense (benefit) computed by applying our statutory rate and thereported effective tax rate on income or (loss) from continuing operations is as follows:
Years Ended December 31,
2019 2018 2017
(In thousands)
Tax at statutory rate(1) . . . . . . . . . . . . . . . . . . . . . . . . . . . . . . . . . . $ 5,275 $(10,681) $ —Foreign income (loss) taxed at different rates . . . . . . . . . . . . . . . . . . . 32,690 5,013 9,381Net non-taxable expense/insurance recoveries . . . . . . . . . . . . . . . . . . . (13,352) 3,256 (30)West Leo arbitration settlement . . . . . . . . . . . . . . . . . . . . . . . . . . . . — (2,834) 1,736Non-deductible insurance premiums . . . . . . . . . . . . . . . . . . . . . . . . . 2,625 — —Non-deductible compensation . . . . . . . . . . . . . . . . . . . . . . . . . . . . . 3,545 2,643 1,680Deferred tax liability—undistributed earnings . . . . . . . . . . . . . . . . . . — (2,565) 2,565Non-deductible and other items . . . . . . . . . . . . . . . . . . . . . . . . . . . . 3,998 656 3,790Equity earnings—net of tax . . . . . . . . . . . . . . . . . . . . . . . . . . . . . . . — (15,305) —Tax shortfall (windfall) on equity-based compensation, net . . . . . . . . . 1,224 (387) 3,086Change in valuation allowance . . . . . . . . . . . . . . . . . . . . . . . . . . . . . 44,889 63,335 6,008Change in U.S. tax rate . . . . . . . . . . . . . . . . . . . . . . . . . . . . . . . . . . — — 16,721
Total tax expense . . . . . . . . . . . . . . . . . . . . . . . . . . . . . . . . . . . . . . . . $ 80,894 $ 43,131 $44,937
Effective tax rate(2) . . . . . . . . . . . . . . . . . . . . . . . . . . . . . . . . . . . . . . 322% 85% 25%
(1) On December 28, 2018, we changed our jurisdiction of incorporation from Bermuda to the State ofDelaware. Kosmos Energy Ltd. discontinued as a Bermuda exempted company pursuant to Section 132Gof the Companies Act 1981 of Bermuda and, pursuant to Section 265 of the General CorporationLaw of the State of Delaware (the “DGCL”), continued its existence under the DGCL as a corporationorganized in the State of Delaware. As a result, the statutory tax rate for the 2019 and 2018reconciliation of income tax expense is the U.S. statutory tax rate of 21%. Our 2017 reconciliation ofincome tax expense is based on the Bermuda statutory tax rate of 0%.
(2) The effective tax rate during the years ended December 31, 2019, 2018 and 2017, were impacted bylosses of $132.1 million, $261.2 million and $164.4 million, respectively, incurred in jurisdictions in whichwe are not subject to taxes and therefore do not generate any income tax benefits or where there arevaluation allowances offsetting the corresponding deferred tax assets.
The effective tax rate for the United States is approximately 12%, 84% and 433% for the years endedDecember 31, 2019, 2018 and 2017, respectively. The effective tax rate in the United States is impacted bythe effect the sum of non-deductible expenditures and equity-based compensation tax shortfalls and taxwindfalls equal to the difference between the income tax benefit recognized for financial statement reportingpurposes compared to the income tax benefit realized for tax return purposes.
The effective tax rate for Ghana is approximately 29%, 36% and 49% for the years ended December 31,2019, 2018 and 2017, respectively. The effective tax rate in Ghana is impacted by non-deductible expenditures,including amounts associated with damage to the turret bearing, which we expect to recover from insuranceproceeds. Any such insurance recoveries would not be subject to income tax.
The effective tax rate for Equatorial Guinea is approximately 37% for the year ended December 31,2019 and is impacted by non-deductible expenditures.
129

KOSMOS ENERGY LTD.
Notes to Consolidated Financial Statements (Continued)
13. Income Taxes (Continued)
Our operations in other foreign jurisdictions have a 0% effective tax rate because they reside incountries with a 0% statutory rate or we have incurred losses in those countries and have full valuationallowances against the corresponding net deferred tax assets.
Deferred tax assets and liabilities, which are computed on the estimated income tax effect of temporarydifferences between financial and tax bases in assets and liabilities, are determined using the tax rates expectedto be in effect when taxes are actually paid or recovered. In assessing the realizability of deferred tax assets,management considers whether it is more likely than not that some portion or all of the deferred tax assets willnot be realized. The ultimate realization of deferred tax assets is dependent upon the generation of futuretaxable income during the periods in which those temporary differences become deductible. The tax effectsof significant temporary differences giving rise to deferred tax assets and liabilities are as follows:
December 31,
2019 2018
(In thousands)
Deferred tax assets:Foreign capitalized operating expenses . . . . . . . . . . . . . . . . . . . . . . . . . . . . . $ 175,330 $ 128,809Foreign net operating losses . . . . . . . . . . . . . . . . . . . . . . . . . . . . . . . . . . . . . 19,576 28,050United States net operating losses . . . . . . . . . . . . . . . . . . . . . . . . . . . . . . . . . 58,903 59,336United States deferred interest expense . . . . . . . . . . . . . . . . . . . . . . . . . . . . . 15,426 —Equity compensation . . . . . . . . . . . . . . . . . . . . . . . . . . . . . . . . . . . . . . . . . 13,700 11,408Unrealized derivative losses . . . . . . . . . . . . . . . . . . . . . . . . . . . . . . . . . . . . . 1,471 —Asset retirement obligation and other . . . . . . . . . . . . . . . . . . . . . . . . . . . . . . 43,159 29,450
Total deferred tax assets . . . . . . . . . . . . . . . . . . . . . . . . . . . . . . . . . . . . . . . . . 327,565 257,053Valuation allowance . . . . . . . . . . . . . . . . . . . . . . . . . . . . . . . . . . . . . . . . . . (201,749) (156,860)
Total deferred tax assets, net . . . . . . . . . . . . . . . . . . . . . . . . . . . . . . . . . . . . . . 125,816 100,193Deferred tax liabilities:
Depletion, depreciation and amortization related to property and equipment . . (746,258) (547,389)Unrealized derivative gains . . . . . . . . . . . . . . . . . . . . . . . . . . . . . . . . . . . . . — (15,979)
Total deferred tax liabilities . . . . . . . . . . . . . . . . . . . . . . . . . . . . . . . . . . . . . . . (746,258) (563,368)Net deferred tax liability . . . . . . . . . . . . . . . . . . . . . . . . . . . . . . . . . . . . . . . . . $(620,442) $(463,175)
The Company has foreign net operating loss carryforwards of $68.8 million. Of these losses, we expect$0.6 million, $0.5 million, $15.6 million, $0.7 million, and $1.4 million to expire in 2020, 2021, 2022, 2023,and 2024, respectively, and $50.0 million do not expire. All of these losses currently have offsetting valuationallowances. The Company has $280.5 million of United States net operating loss that will not expire.
The Company is open to tax examinations in the United States for federal income tax return years 2016through 2018 and in Ghana to federal income tax return years 2014 through 2018.
As of December 31, 2019, the Company had no material uncertain tax positions. The Company’spolicy is to recognize potential interest and penalties related to income tax matters in income tax expense.
130

KOSMOS ENERGY LTD.
Notes to Consolidated Financial Statements (Continued)
14. Net Income (Loss) Per Share
In the calculation of basic net income per share, participating securities are allocated earnings based onactual dividend distributions received plus a proportionate share of undistributed net income, if any. Wecalculate basic net income per share under the two-class method. Diluted net income (loss) per share iscalculated under both the two-class method and the treasury stock method and the more dilutive of the twocalculations is presented. The computation of diluted net income (loss) per share reflects the potentialdilution that could occur if all outstanding awards under our LTIP were converted into shares of commonstock or resulted in the issuance of shares of common stock that would then share in the earnings of theCompany. During periods in which the Company realizes a loss from continuing operations securitieswould not be dilutive to net loss per share and conversion into shares of common stock is assumed not tooccur.
Basic net income (loss) per share is computed as (i) net income (loss), (ii) less income allocable toparticipating securities (iii) divided by weighted average basic shares outstanding. The Company’s dilutednet income (loss) per share is computed as (i) basic net income (loss), (ii) plus diluted adjustments to incomeallocable to participating securities (iii) divided by weighted average diluted shares outstanding.
Years Ended December 31,
2019 2018 2017
(In thousands, except per share data)
Numerator:Net loss allocable to common stockholders . . . . . . . . . . . . . . . . . . $ (55,777) $ (93,991) $(222,792)
Denominator:Weighted average number of shares outstanding:
Basic . . . . . . . . . . . . . . . . . . . . . . . . . . . . . . . . . . . . . . . . . . . . . 401,368 404,585 388,375Restricted stock awards and units(1)(2) . . . . . . . . . . . . . . . . . . . . . — — —Diluted . . . . . . . . . . . . . . . . . . . . . . . . . . . . . . . . . . . . . . . . . . . 401,368 404,585 388,375
Net loss per share:Basic . . . . . . . . . . . . . . . . . . . . . . . . . . . . . . . . . . . . . . . . . . . . . $ (0.14) $ (0.23) $ (0.57)Diluted . . . . . . . . . . . . . . . . . . . . . . . . . . . . . . . . . . . . . . . . . . . $ (0.14) $ (0.23) $ (0.57)
(1) Our service vesting restricted stock awards represent participating securities because they participate innon-forfeitable dividends with common equity owners. Income allocable to participating securitiesrepresents the distributed and undistributed earnings attributable to the participating securities. Ourrestricted stock awards with market and service vesting criteria and all restricted stock units are notconsidered to be participating securities and, therefore, are excluded from the basic net income (loss) pershare calculation. Our service vesting restricted stock awards do not participate in undistributed netlosses because they are not contractually obligated to do so and, therefore, are excluded from the basicnet income (loss) per share calculation in periods we are in a net loss position. All restricted stockawards were fully vested in January 2018.
(2) For the years ended December 31, 2019, 2018 and 2017, we excluded 15.3 million, 10.6 million and12.9 million outstanding restricted stock awards and restricted stock units, respectively, from thecomputations of diluted net income per share because the effect would have been anti-dilutive. Allrestricted stock awards were fully vested in January 2018.
131
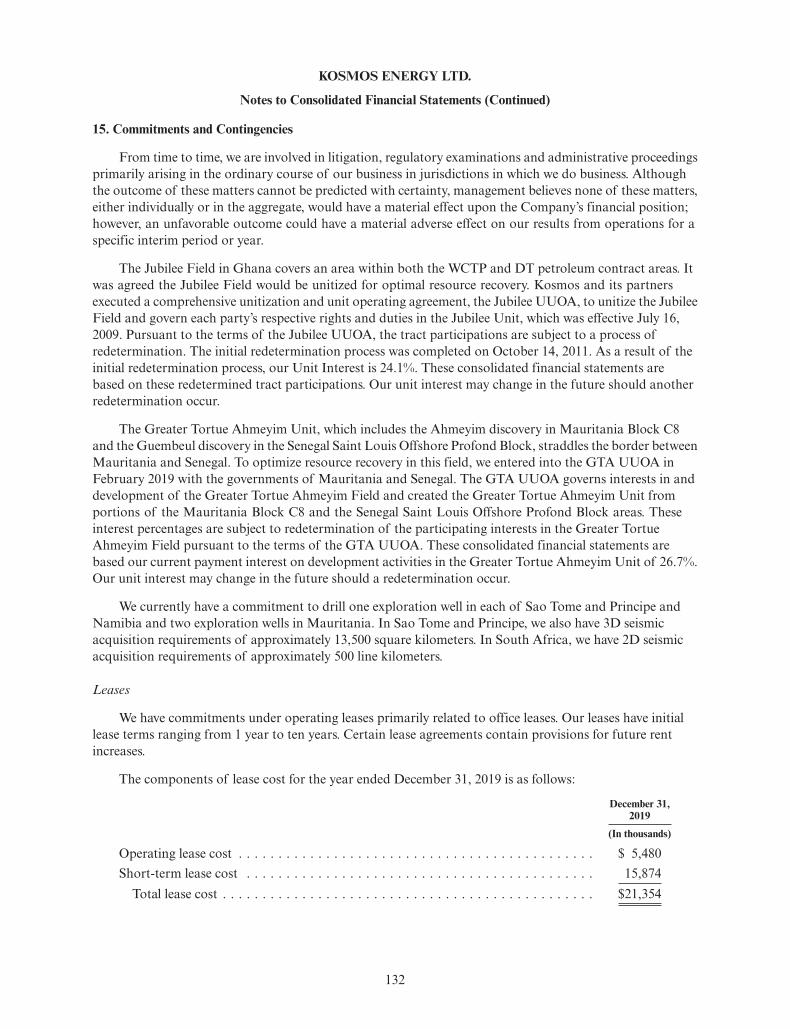
KOSMOS ENERGY LTD.
Notes to Consolidated Financial Statements (Continued)
15. Commitments and Contingencies
From time to time, we are involved in litigation, regulatory examinations and administrative proceedingsprimarily arising in the ordinary course of our business in jurisdictions in which we do business. Althoughthe outcome of these matters cannot be predicted with certainty, management believes none of these matters,either individually or in the aggregate, would have a material effect upon the Company’s financial position;however, an unfavorable outcome could have a material adverse effect on our results from operations for aspecific interim period or year.
The Jubilee Field in Ghana covers an area within both the WCTP and DT petroleum contract areas. Itwas agreed the Jubilee Field would be unitized for optimal resource recovery. Kosmos and its partnersexecuted a comprehensive unitization and unit operating agreement, the Jubilee UUOA, to unitize the JubileeField and govern each party’s respective rights and duties in the Jubilee Unit, which was effective July 16,2009. Pursuant to the terms of the Jubilee UUOA, the tract participations are subject to a process ofredetermination. The initial redetermination process was completed on October 14, 2011. As a result of theinitial redetermination process, our Unit Interest is 24.1%. These consolidated financial statements arebased on these redetermined tract participations. Our unit interest may change in the future should anotherredetermination occur.
The Greater Tortue Ahmeyim Unit, which includes the Ahmeyim discovery in Mauritania Block C8and the Guembeul discovery in the Senegal Saint Louis Offshore Profond Block, straddles the border betweenMauritania and Senegal. To optimize resource recovery in this field, we entered into the GTA UUOA inFebruary 2019 with the governments of Mauritania and Senegal. The GTA UUOA governs interests in anddevelopment of the Greater Tortue Ahmeyim Field and created the Greater Tortue Ahmeyim Unit fromportions of the Mauritania Block C8 and the Senegal Saint Louis Offshore Profond Block areas. Theseinterest percentages are subject to redetermination of the participating interests in the Greater TortueAhmeyim Field pursuant to the terms of the GTA UUOA. These consolidated financial statements arebased our current payment interest on development activities in the Greater Tortue Ahmeyim Unit of 26.7%.Our unit interest may change in the future should a redetermination occur.
We currently have a commitment to drill one exploration well in each of Sao Tome and Principe andNamibia and two exploration wells in Mauritania. In Sao Tome and Principe, we also have 3D seismicacquisition requirements of approximately 13,500 square kilometers. In South Africa, we have 2D seismicacquisition requirements of approximately 500 line kilometers.
Leases
We have commitments under operating leases primarily related to office leases. Our leases have initiallease terms ranging from 1 year to ten years. Certain lease agreements contain provisions for future rentincreases.
The components of lease cost for the year ended December 31, 2019 is as follows:
December 31,2019
(In thousands)
Operating lease cost . . . . . . . . . . . . . . . . . . . . . . . . . . . . . . . . . . . . . . . . . . . . . $ 5,480Short-term lease cost . . . . . . . . . . . . . . . . . . . . . . . . . . . . . . . . . . . . . . . . . . . . 15,874
Total lease cost . . . . . . . . . . . . . . . . . . . . . . . . . . . . . . . . . . . . . . . . . . . . . . . $21,354
132
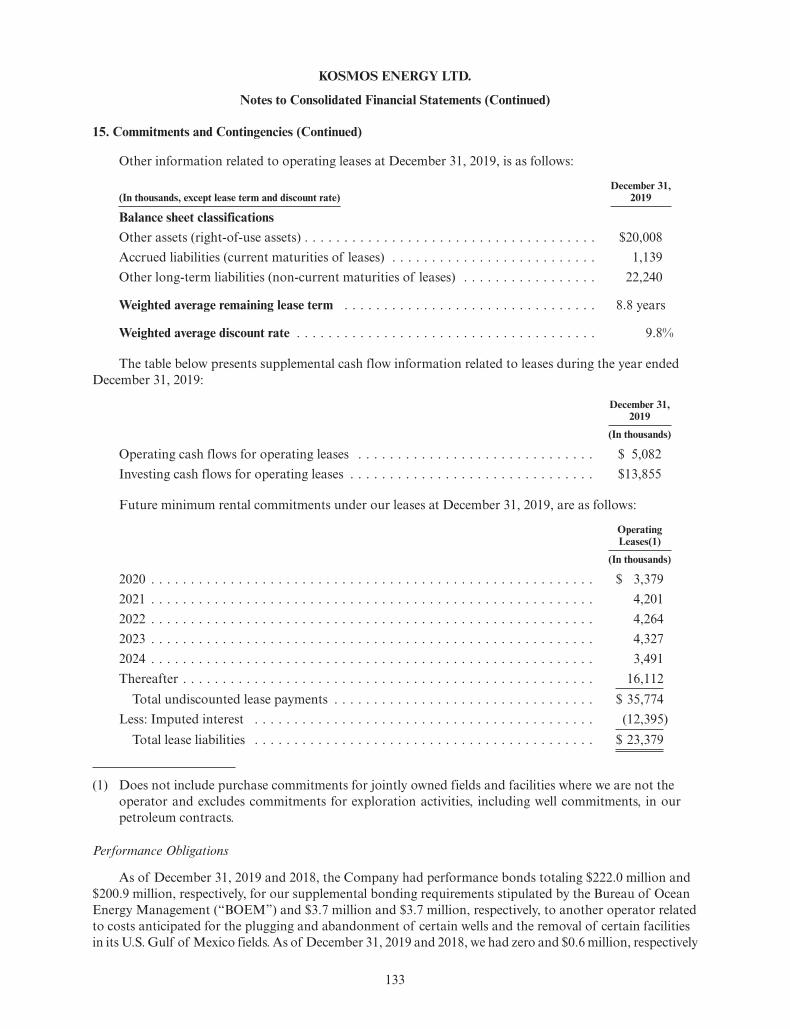
KOSMOS ENERGY LTD.
Notes to Consolidated Financial Statements (Continued)
15. Commitments and Contingencies (Continued)
Other information related to operating leases at December 31, 2019, is as follows:
(In thousands, except lease term and discount rate)December 31,
2019
Balance sheet classificationsOther assets (right-of-use assets) . . . . . . . . . . . . . . . . . . . . . . . . . . . . . . . . . . . . . $20,008Accrued liabilities (current maturities of leases) . . . . . . . . . . . . . . . . . . . . . . . . . . 1,139Other long-term liabilities (non-current maturities of leases) . . . . . . . . . . . . . . . . . 22,240
Weighted average remaining lease term . . . . . . . . . . . . . . . . . . . . . . . . . . . . . . . . 8.8 years
Weighted average discount rate . . . . . . . . . . . . . . . . . . . . . . . . . . . . . . . . . . . . . . 9.8%
The table below presents supplemental cash flow information related to leases during the year endedDecember 31, 2019:
December 31,2019
(In thousands)
Operating cash flows for operating leases . . . . . . . . . . . . . . . . . . . . . . . . . . . . . . $ 5,082Investing cash flows for operating leases . . . . . . . . . . . . . . . . . . . . . . . . . . . . . . . $13,855
Future minimum rental commitments under our leases at December 31, 2019, are as follows:
OperatingLeases(1)
(In thousands)
2020 . . . . . . . . . . . . . . . . . . . . . . . . . . . . . . . . . . . . . . . . . . . . . . . . . . . . . . . . $ 3,3792021 . . . . . . . . . . . . . . . . . . . . . . . . . . . . . . . . . . . . . . . . . . . . . . . . . . . . . . . . 4,2012022 . . . . . . . . . . . . . . . . . . . . . . . . . . . . . . . . . . . . . . . . . . . . . . . . . . . . . . . . 4,2642023 . . . . . . . . . . . . . . . . . . . . . . . . . . . . . . . . . . . . . . . . . . . . . . . . . . . . . . . . 4,3272024 . . . . . . . . . . . . . . . . . . . . . . . . . . . . . . . . . . . . . . . . . . . . . . . . . . . . . . . . 3,491Thereafter . . . . . . . . . . . . . . . . . . . . . . . . . . . . . . . . . . . . . . . . . . . . . . . . . . . . 16,112
Total undiscounted lease payments . . . . . . . . . . . . . . . . . . . . . . . . . . . . . . . . . $ 35,774Less: Imputed interest . . . . . . . . . . . . . . . . . . . . . . . . . . . . . . . . . . . . . . . . . . . (12,395)
Total lease liabilities . . . . . . . . . . . . . . . . . . . . . . . . . . . . . . . . . . . . . . . . . . . $ 23,379
(1) Does not include purchase commitments for jointly owned fields and facilities where we are not theoperator and excludes commitments for exploration activities, including well commitments, in ourpetroleum contracts.
Performance Obligations
As of December 31, 2019 and 2018, the Company had performance bonds totaling $222.0 million and$200.9 million, respectively, for our supplemental bonding requirements stipulated by the Bureau of OceanEnergy Management (“BOEM”) and $3.7 million and $3.7 million, respectively, to another operator relatedto costs anticipated for the plugging and abandonment of certain wells and the removal of certain facilitiesin its U.S. Gulf of Mexico fields. As of December 31, 2019 and 2018, we had zero and $0.6 million, respectively
133
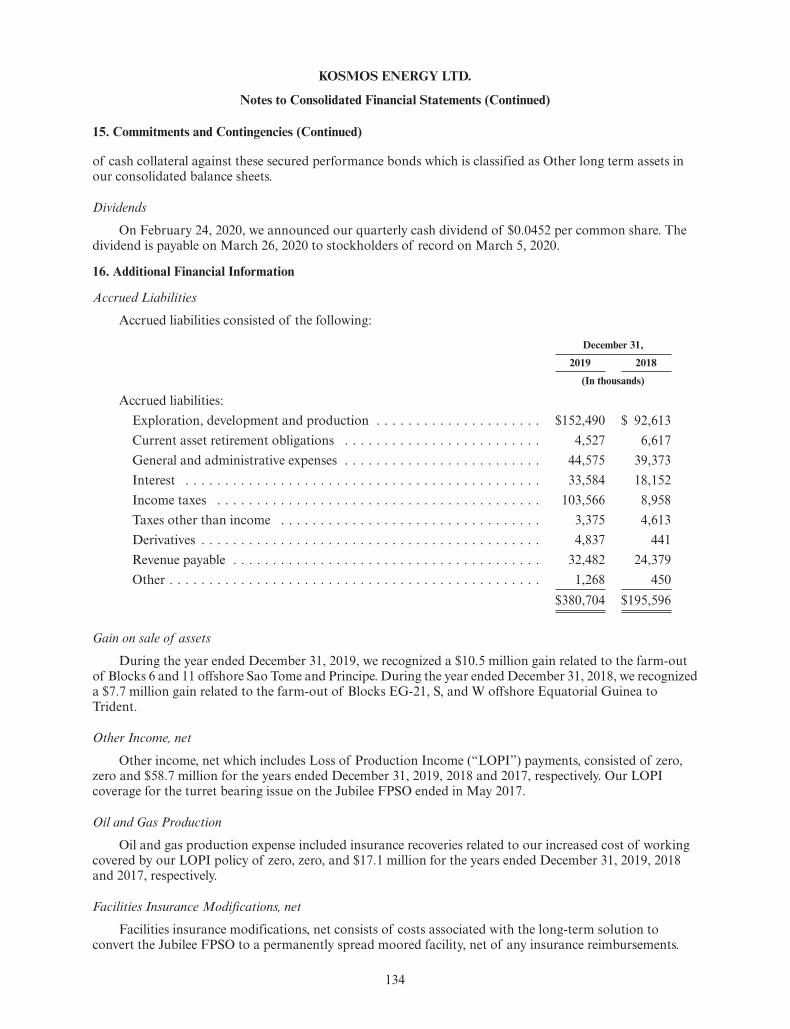
KOSMOS ENERGY LTD.
Notes to Consolidated Financial Statements (Continued)
15. Commitments and Contingencies (Continued)
of cash collateral against these secured performance bonds which is classified as Other long term assets inour consolidated balance sheets.
Dividends
On February 24, 2020, we announced our quarterly cash dividend of $0.0452 per common share. Thedividend is payable on March 26, 2020 to stockholders of record on March 5, 2020.
16. Additional Financial Information
Accrued Liabilities
Accrued liabilities consisted of the following:
December 31,
2019 2018
(In thousands)
Accrued liabilities:Exploration, development and production . . . . . . . . . . . . . . . . . . . . . $152,490 $ 92,613Current asset retirement obligations . . . . . . . . . . . . . . . . . . . . . . . . . 4,527 6,617General and administrative expenses . . . . . . . . . . . . . . . . . . . . . . . . . 44,575 39,373Interest . . . . . . . . . . . . . . . . . . . . . . . . . . . . . . . . . . . . . . . . . . . . . 33,584 18,152Income taxes . . . . . . . . . . . . . . . . . . . . . . . . . . . . . . . . . . . . . . . . . 103,566 8,958Taxes other than income . . . . . . . . . . . . . . . . . . . . . . . . . . . . . . . . . 3,375 4,613Derivatives . . . . . . . . . . . . . . . . . . . . . . . . . . . . . . . . . . . . . . . . . . . 4,837 441Revenue payable . . . . . . . . . . . . . . . . . . . . . . . . . . . . . . . . . . . . . . . 32,482 24,379Other . . . . . . . . . . . . . . . . . . . . . . . . . . . . . . . . . . . . . . . . . . . . . . . 1,268 450
$380,704 $195,596
Gain on sale of assets
During the year ended December 31, 2019, we recognized a $10.5 million gain related to the farm-outof Blocks 6 and 11 offshore Sao Tome and Principe. During the year ended December 31, 2018, we recognizeda $7.7 million gain related to the farm-out of Blocks EG-21, S, and W offshore Equatorial Guinea toTrident.
Other Income, net
Other income, net which includes Loss of Production Income (“LOPI”) payments, consisted of zero,zero and $58.7 million for the years ended December 31, 2019, 2018 and 2017, respectively. Our LOPIcoverage for the turret bearing issue on the Jubilee FPSO ended in May 2017.
Oil and Gas Production
Oil and gas production expense included insurance recoveries related to our increased cost of workingcovered by our LOPI policy of zero, zero, and $17.1 million for the years ended December 31, 2019, 2018and 2017, respectively.
Facilities Insurance Modifications, net
Facilities insurance modifications, net consists of costs associated with the long-term solution toconvert the Jubilee FPSO to a permanently spread moored facility, net of any insurance reimbursements.
134

KOSMOS ENERGY LTD.
Notes to Consolidated Financial Statements (Continued)
16. Additional Financial Information (Continued)
Other Expenses, net
Other expenses, net incurred during the period is comprised of the following:
Years Ended December 31,
2019 2018 2017
(In thousands)
Loss on disposal of inventory . . . . . . . . . . . . . . . . . . . . . . . . . . . . . . . . . . $ 4,590 $ 280 $ 866Gain on insurance settlements . . . . . . . . . . . . . . . . . . . . . . . . . . . . . . . . . (3,509) — (461)Loss on ARO liability settlements . . . . . . . . . . . . . . . . . . . . . . . . . . . . . . . 193 — —Disputed charges and related costs, net of recoveries . . . . . . . . . . . . . . . . . . 4,149 (9,753) 4,962Restructuring charges . . . . . . . . . . . . . . . . . . . . . . . . . . . . . . . . . . . . . . . 11,528 — —Other, net . . . . . . . . . . . . . . . . . . . . . . . . . . . . . . . . . . . . . . . . . . . . . . . 7,697 2,972 (76)
Other expenses, net . . . . . . . . . . . . . . . . . . . . . . . . . . . . . . . . . . . . . . . $24,648 $(6,501) $5,291
The disputed charges and related costs are expenditures arising from Tullow Ghana Limited’s contractwith Seadrill for use of the West Leo drilling rig once partner-approved 2016 work program objectives wereconcluded. Tullow charged such expenditures to the Deepwater Tano (“DT”) joint account. Kosmosdisputed through arbitration that these expenditures were chargeable to the DT joint account on the basisthat the Seadrill West Leo drilling rig contract was not approved by the DT operating committee pursuant tothe DT Joint Operating Agreement. In July 2018, the International Chamber of Commerce (“ICC”) issuedits Final Award in the arbitration in favor of Kosmos. As a result, we recovered from Tullow Ghana Limiteddisputed charges in the amount of $12.9 million in the form of cash payments and offsets against otherunrelated joint venture costs, which include amounts previously paid under protest as well as certain costsand fees incurred pursuing the arbitration.
The restructuring charges are for employee severance and related benefit costs incurred as part of acorporate reorganization.
135

KOSMOS ENERGY LTD.
Notes to Consolidated Financial Statements (Continued)
17. Business Segment Information
Kosmos is engaged in a single line of business, which is the exploration and development of oil andgas. At December 31, 2019, the Company had operations in four geographic reporting segments: Ghana,Equatorial Guinea, Mauritania/Senegal and the U.S. Gulf of Mexico. To assess performance of the reportingsegments, the Chief Operating Decision Maker (“CODM”) reviews capital expenditures. Capitalexpenditures, as defined by the Company, may not be comparable to similarly titled measures used by othercompanies and should be considered in conjunction with our consolidated financial statements and notesthereto. Financial information for each area is presented below:
GhanaEquatorial
GuineaMauritania/
SenegalU.S. Gulfof Mexico
Corporate& Other Eliminations Total
(in thousands)Year ended December 31, 2019Revenues and other income:
Oil and gas revenue . . . . . . . . . $ 738,909 $300,547 $ — $ 459,960 $ — $ — $1,499,416Gain on sale of assets . . . . . . . . — — — — 10,528 — 10,528Other income, net . . . . . . . . . . 5 — — 1,194 155,866 (157,100) (35)
Total revenues and otherincome . . . . . . . . . . . . . 738,914 300,547 — 461,154 166,394 (157,100) 1,509,909
Costs and expenses:Oil and gas production . . . . . . . 188,207 90,607 — 123,799 — — 402,613Facilities insurance modifications,
net . . . . . . . . . . . . . . . . . (24,254) — — — — — (24,254)Exploration expenses . . . . . . . . 204 13,350 11,181 115,765 40,455 — 180,955General and administrative . . . . 18,618 6,643 8,222 25,456 159,539 (108,468) 110,010Depletion, depreciation and
amortization . . . . . . . . . . . . 268,866 75,565 62 214,592 4,776 — 563,861Interest and other financing costs,
net(1) . . . . . . . . . . . . . . . . 72,226 (634) (26,537) 21,266 95,887 (7,134) 155,074Derivatives, net . . . . . . . . . . . — — — 30,387 41,498 — 71,885Other expenses, net . . . . . . . . . 40,382 (563) 12,056 2,691 11,580 (41,498) 24,648
Total costs and expenses . . . . . 564,249 184,968 4,984 533,956 353,735 (157,100) 1,484,792Income (loss) before income taxes . . 174,665 115,579 (4,984) (72,802) (187,341) — 25,117
Income tax expense . . . . . . . . . 50,293 49,192 — (8,419) (10,172) — 80,894Net income (loss) . . . . . . . . . . . . $ 124,372 $ 66,387 $ (4,984) $ (64,383) $ (177,169) $ — $ (55,777)
Consolidated capital expenditures . . $ 98,285 $ 63,798 $ 12,556 $ 232,891 $ 33,206 $ — $ 440,736
As of December 31, 2019Property and equipment, net . . . . . $1,487,114 $464,420 $438,800 $1,216,453 $ 35,545 $ — $3,642,332Total assets . . . . . . . . . . . . . . . $1,654,266 $650,607 $581,317 $3,251,420 $12,144,312 $(13,964,690) $4,317,232
(1) Interest expense is recorded based on actual third-party and intercompany debt agreements. Capitalized interest isrecorded on the business unit where the assets reside.
136

KOSMOS ENERGY LTD.
Notes to Consolidated Financial Statements (Continued)
17. Business Segment Information (Continued)
GhanaEquatorialGuinea(1)
Mauritania/Senegal
U.S. Gulfof Mexico(2)
Corporate& Other Eliminations(3) Total
(in thousands)Year ended December 31, 2018Revenues and other income:
Oil and gas revenue . . . . . . . $ 739,070 $360,649 $ — $ 147,596 $ — $ (360,649) $ 886,666Gain on sale of assets . . . . . . — 7,666 — — — — 7,666Other income, net . . . . . . . . (17) (238) — 11 $ 150,635 (142,354) 8,037
Total revenues and otherincome . . . . . . . . . . . . 739,053 368,077 — 147,607 150,635 (503,003) 902,369
Costs and expenses:Oil and gas production . . . . . 189,104 73,843 — 30,470 5,153 (73,843) 224,727Facilities insurance
modifications, net . . . . . . . 6,955 — — — — — 6,955Exploration expenses . . . . . . 58,276 38,164 7,262 66,962 131,180 (352) 301,492General and administrative . . . 19,342 5,351 5,220 10,534 168,542 (109,133) 99,856Depletion, depreciation and
amortization . . . . . . . . . . 265,805 134,983 61 59,835 4,134 (134,983) 329,835Interest and other financing
costs, net(3) . . . . . . . . . . 86,738 (12) (25,386) 7,487 39,483 (7,134) 101,176Derivatives, net . . . . . . . . . . — — — (57,615) 26,185 — (31,430)Loss on equity method
investments,net . . . . . . . . . . . . . . . . — — — — — (72,881) (72,881)
Other expenses, net . . . . . . . 16,414 (814) (23) 598 3,510 (26,186) (6,501)Total costs and expenses . . . 642,634 251,515 (12,866) 118,271 378,187 (424,512) 953,229
Income (loss) before incometaxes . . . . . . . . . . . . . . . . 96,419 116,562 12,866 29,336 (227,552) (78,491) (50,860)Income tax expense (benefit) . . 34,494 78,491 — 6,163 2,474 (78,491) 43,131
Net income (loss) . . . . . . . . . . $ 61,925 $ 38,071 $ 12,866 $ 23,173 $ (230,026) $ — $ (93,991)
Consolidated capitalexpenditures . . . . . . . . . . . $ 105,942 $ 32,156 $ 11,962 $ 95,993 $ 139,381 $ — $ 385,434
As of December 31, 2018Property and equipment, net . . . $1,698,194 $ 3,919 $411,448 $1,308,670 $ 37,470 $ — $3,459,701Total assets . . . . . . . . . . . . . $1,930,071 $ 55,302 $536,620 $3,512,989 $10,349,488 $(12,296,281) $4,088,189
(1) Includes our proportionate share of our equity method investment in KTIPI, including our basis difference which isreflected in depletion, depreciation and amortization for the year ended December 31, 2018, except for capital expenditures.See Note 7—Equity Method Investments for additional information regarding our equity method investments.
(2) Represents activity commencing September 14, 2018, the DGE acquisition date.
(3) Includes elimination of proportionate consolidation amounts recorded for KTIPI to reconcile to (Gain) loss on equitymethod investments, net as reported in the consolidated statements of operations.
(4) Interest expense is recorded based on actual third-party and intercompany debt agreements. Capitalized interest isrecorded on the business unit where the assets reside.
137
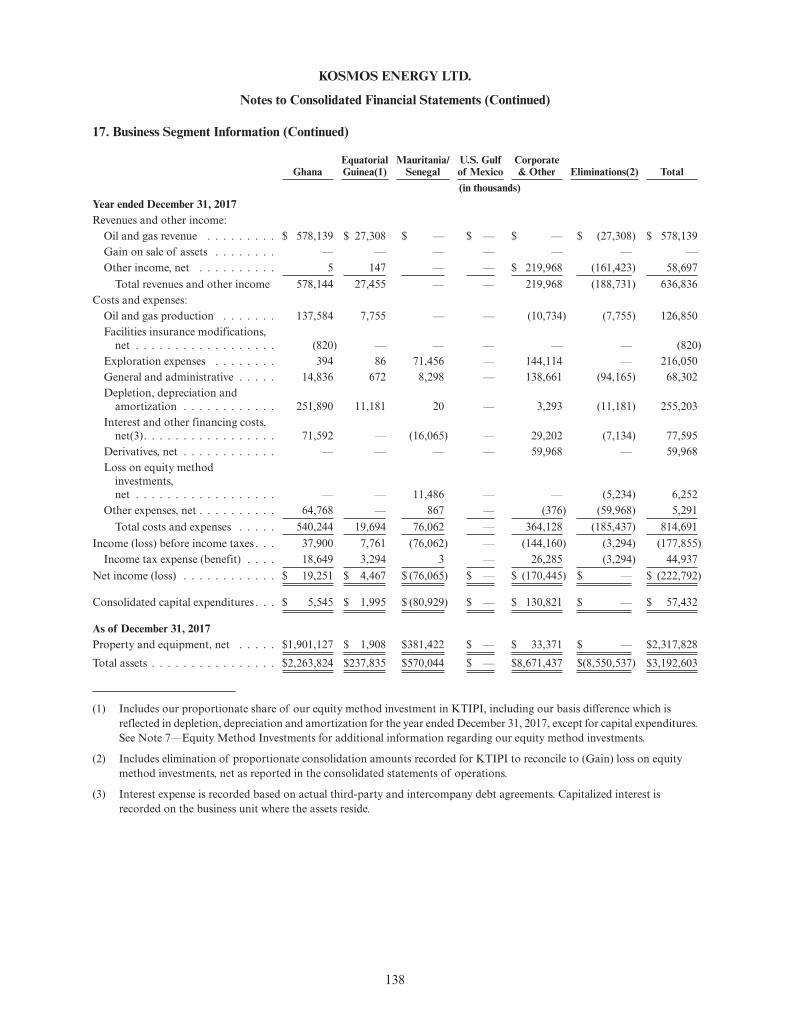
KOSMOS ENERGY LTD.
Notes to Consolidated Financial Statements (Continued)
17. Business Segment Information (Continued)
GhanaEquatorialGuinea(1)
Mauritania/Senegal
U.S. Gulfof Mexico
Corporate& Other Eliminations(2) Total
(in thousands)Year ended December 31, 2017Revenues and other income:
Oil and gas revenue . . . . . . . . . $ 578,139 $ 27,308 $ — $ — $ — $ (27,308) $ 578,139Gain on sale of assets . . . . . . . . — — — — — — —Other income, net . . . . . . . . . . 5 147 — — $ 219,968 (161,423) 58,697
Total revenues and other income 578,144 27,455 — — 219,968 (188,731) 636,836Costs and expenses:
Oil and gas production . . . . . . . 137,584 7,755 — — (10,734) (7,755) 126,850Facilities insurance modifications,
net . . . . . . . . . . . . . . . . . . (820) — — — — — (820)Exploration expenses . . . . . . . . 394 86 71,456 — 144,114 — 216,050General and administrative . . . . . 14,836 672 8,298 — 138,661 (94,165) 68,302Depletion, depreciation and
amortization . . . . . . . . . . . . 251,890 11,181 20 — 3,293 (11,181) 255,203Interest and other financing costs,
net(3). . . . . . . . . . . . . . . . . 71,592 — (16,065) — 29,202 (7,134) 77,595Derivatives, net . . . . . . . . . . . . — — — — 59,968 — 59,968Loss on equity method
investments,net . . . . . . . . . . . . . . . . . . — — 11,486 — — (5,234) 6,252
Other expenses, net . . . . . . . . . . 64,768 — 867 — (376) (59,968) 5,291Total costs and expenses . . . . . 540,244 19,694 76,062 — 364,128 (185,437) 814,691
Income (loss) before income taxes . . . 37,900 7,761 (76,062) — (144,160) (3,294) (177,855)Income tax expense (benefit) . . . . 18,649 3,294 3 — 26,285 (3,294) 44,937
Net income (loss) . . . . . . . . . . . . $ 19,251 $ 4,467 $ (76,065) $ — $ (170,445) $ — $ (222,792)
Consolidated capital expenditures . . . $ 5,545 $ 1,995 $ (80,929) $ — $ 130,821 $ — $ 57,432
As of December 31, 2017Property and equipment, net . . . . . $1,901,127 $ 1,908 $381,422 $ — $ 33,371 $ — $2,317,828Total assets . . . . . . . . . . . . . . . . $2,263,824 $237,835 $570,044 $ — $8,671,437 $(8,550,537) $3,192,603
(1) Includes our proportionate share of our equity method investment in KTIPI, including our basis difference which isreflected in depletion, depreciation and amortization for the year ended December 31, 2017, except for capital expenditures.See Note 7—Equity Method Investments for additional information regarding our equity method investments.
(2) Includes elimination of proportionate consolidation amounts recorded for KTIPI to reconcile to (Gain) loss on equitymethod investments, net as reported in the consolidated statements of operations.
(3) Interest expense is recorded based on actual third-party and intercompany debt agreements. Capitalized interest isrecorded on the business unit where the assets reside.
138

KOSMOS ENERGY LTD.
Notes to Consolidated Financial Statements (Continued)
17. Business Segment Information (Continued)
Years Ended December 31,
2019 2018 2017
(In thousands)
Consolidated capital expenditures:Consolidated Statements of Cash Flows—Investing activities:
Oil and gas assets . . . . . . . . . . . . . . . . . . . . . . . . . . . . . . . . . . . . $340,217 $213,806 $ 140,495Other property . . . . . . . . . . . . . . . . . . . . . . . . . . . . . . . . . . . . . . 11,796 7,935 2,858
Adjustments:Changes in capital accruals . . . . . . . . . . . . . . . . . . . . . . . . . . . . . 33,717 26,669 (6,337)Exploration expense, excluding unsuccessful well costs and leasehold
impairments(1) . . . . . . . . . . . . . . . . . . . . . . . . . . . . . . . . . . . . 93,142 178,293 172,849Capitalized interest . . . . . . . . . . . . . . . . . . . . . . . . . . . . . . . . . . . (28,077) (28,331) (30,282)Proceeds on sale of assets . . . . . . . . . . . . . . . . . . . . . . . . . . . . . . . (16,713) (13,703) (222,068)Other . . . . . . . . . . . . . . . . . . . . . . . . . . . . . . . . . . . . . . . . . . . . 6,654 765 (83)
Total consolidated capital expenditures . . . . . . . . . . . . . . . . . . . . . . . $440,736 $385,434 $ 57,432
(1) Unsuccessful well costs are included in oil and gas assets when incurred.
139

KOSMOS ENERGY LTD.
Supplemental Oil and Gas Data (Unaudited)
Net proved oil and gas reserve estimates presented were prepared by Ryder Scott Company, L.P.(“RSC”) for the years ended December 31, 2019, 2018 and 2017. RSC are independent petroleum engineerslocated in Houston, Texas. RSC has prepared the reserve estimates presented herein and meet therequirements regarding qualifications, independence, objectivity and confidentiality set forth in the StandardsPertaining to the Estimating and Auditing of Oil and Gas Reserves Information promulgated by theSociety of Petroleum Engineers. We maintain an internal staff of petroleum engineers and geoscienceprofessionals who work closely with our independent reserve engineers to ensure the integrity, accuracy andtimeliness of data furnished to independent reserve engineers for their reserves estimation process.
Net Proved Developed and Undeveloped Reserves
The following table is a summary of net proved developed and undeveloped oil and gas reserves toKosmos’ interest in the Jubilee and TEN fields in Ghana, the U.S. Gulf of Mexico (commencingSeptember 14, 2018, the DGE acquisition date), and our equity method investment offshore EquatorialGuinea.
GhanaEquatorial
GuineaMauritania/Senegal(7)
U.S.Gulf ofMexico
TotalOil Ghana
EquatorialGuinea
Mauritania/Senegal(7)
U.S.Gulf ofMexico
TotalGas
KosmosTotal
EquityMethod
Investment—Equatorial
Guinea Total
Oil, Condensate, NGLs (MMBbls) Natural Gas (Bcf) (MMBoe)
Net proved developed andundeveloped reserves atDecember 31, 2016(1) . . . . . . . . 74 — — — 74 15 — — — 15 77 — 77Extensions and discoveries . . . . . 1 — — — 1 — — — — — 1 — 1Production . . . . . . . . . . . . . . (11) — — — (11) (1) — — — (1) (11) (1) (12)Revision in estimate(2) . . . . . . . . 18 — — — 18 35 — — — 35 24 — 24Purchases of minerals-in-place(3) . . — — — — — — — — — — — 21 21
Net proved developed andundeveloped reserves atDecember 31, 2017(1) . . . . . . . . 82 — — — 82 49 — — — 49 89 21 110Extensions and discoveries . . . . . — — — — — — — — — — — — —Production . . . . . . . . . . . . . . (11) — — (2) (13) (1) — — (2) (3) (14) (5) (19)Revision in estimate . . . . . . . . . 11 — — — 11 (1) — — — (1) 11 10 21Purchases of minerals-in-place(5) . . — — — 47 47 — — — 40 40 54 — 54
Net proved developed andundeveloped reserves atDecember 31, 2018(1) . . . . . . . . 82 — — 45 127 47 — — 38 85 141 26 167Extensions and discoveries . . . . . — — — — — — — — —Production . . . . . . . . . . . . . . (11) (4) — (8) (23) (1) — — (6) (7) (24) — (24)Revision in estimate(4) . . . . . . . . 17 6 — 3 26 (1) (2) — 3 — 26 — 26Purchases of minerals-in-place(6) . . 24 — 24 14 — 14 26 (26) —
Net proved developed andundeveloped reserves atDecember 31, 2019(1) . . . . . . . . 88 26 — 40 154 45 12 — 35 92 169 — 169
Proved developed reserves(1)December 31, 2016 . . . . . . . . . . 64 — — — 64 13 — — — 13 66 — 66December 31, 2017 . . . . . . . . . . 59 — — — 59 38 — — — 38 65 20 85December 31, 2018 . . . . . . . . . . 48 — — 33 81 33 — — 24 57 91 25 116December 31, 2019 . . . . . . . . . . 47 23 — 34 104 31 12 — 28 71 116 — 116
140

GhanaEquatorial
GuineaMauritania/Senegal(7)
U.S.Gulf ofMexico
TotalOil Ghana
EquatorialGuinea
Mauritania/Senegal(7)
U.S.Gulf ofMexico
TotalGas
KosmosTotal
EquityMethod
Investment—Equatorial
Guinea Total
Oil, Condensate, NGLs (MMBbls) Natural Gas (Bcf) (MMBoe)
Proved undeveloped reserves(1)December 31, 2016 . . . . . . . . . . 10 — — — 10 2 — — — 2 11 — 11December 31, 2017 . . . . . . . . . . 23 — — — 23 11 — — — 11 24 1 25December 31, 2018 . . . . . . . . . . 33 — — 12 45 14 — — 13 28 50 1 51December 31, 2019 . . . . . . . . . . 41 3 — 6 50 14 — — 7 21 53 — 53
(1) The sum of proved developed reserves and proved undeveloped reserves may not add to net proved developed andundeveloped reserves as a result of rounding.
(2) The increase in proved reserves is a result of a 16 MMBbl increase associated in Jubilee related to the approval of theGreater Jubilee Full Field Development Plan (GJFFDP) and an 8 MMBoe increase associated with positive revisions to theTEN fields.
(3) The increase in purchase of minerals in place is related to Equatorial Guinea, representing the reserves associated with ourequity method investment.
(4) The increase in proved reserves is a result of an increase of 8.2 MMBbl in Greater Jubilee related to positive drilling resultsand subsequent increased original oil in place, and optimized development plan. Changes at TEN include a positive revision of8.8 MMBoe related to original oil in place adjustments based on the latest static modeling, and development plan updates.Changes at Equatorial Guinea include an increase of 6.3 MMBbl due to production optimization and plans for new drilling.Changes at the Gulf of Mexico (GoM) include an increase of 2.9 MMBoe related to strong performance of certain fieldsand the Gladden Deep discovery.
(5) The increase in purchase of minerals in place is related to the DGE acquisition completed in September 2018.
(6) We disclosed our share of reserves that were accounted for by the equity method. Effective of January 1, 2019, our outstandingshares in KTIPI were transferred to Trident in exchange for a 40.4% undivided participating interest in the Ceiba Field andOkume Complex. As a result, our interest in the Ceiba Field and Okume Complex is accounted for under the proportionateconsolidation method of accounting going forward.
(7) The Tortue Phase 1 SPA was signed on February 11, 2020, resulting in approximately 100 MMBoe of proved undevelopedreserves being recognized at that time as evaluated by the company’s independent reserve auditor Ryder Scott, LP.
Net proved reserves were calculated utilizing the twelve month unweighted arithmetic average of the first-day-of-the-month oil price for each month based on the respective benchmark price in the period Januarythrough December 2019. The average price is adjusted for crude handling, transportation fees, quality, and aregional price differential.
Proved oil and gas reserves are defined by the SEC Rule 4.10(a) of Regulation S-X as those quantitiesof oil and gas, which, by analysis of geoscience and engineering data, can be estimated with reasonablecertainty to be commercially recovered under current economic conditions, operating methods, andgovernment regulations. Inherent uncertainties exist in estimating proved reserve quantities, projectingfuture production rates and timing of development expenditures.
141

Capitalized Costs Related to Oil and Gas Activities
The following table presents aggregate capitalized costs related to oil and gas activities:
GhanaEquatorial
GuineaMauritania/
SenegalU.S. Gulfof Mexico Other(1)
KosmosTotal
EquityMethod
Investment—EquatorialGuinea(2) Total
(In millions)
As of December 31, 2019Unproved properties . . . . . . . . — 119 439 233 23 814 — 814Proved properties . . . . . . . . . . 3,250 411 — 1,244 — 4,905 — 4,905
3,250 530 439 1,477 23 5,719 — 5,719Accumulated depletion . . . . . . . . (1,763) (66) — (265) — (2,094) — (2,094)Net capitalized costs . . . . . . . . . . 1,487 464 439 1,212 23 3,625 — 3,625
As of December 31, 2018Unproved properties . . . . . . . . — 4 411 319 26 760 — 760Proved properties . . . . . . . . . . 3,191 — — 1,045 — 4,236 2,850 7,086
3,191 4 411 1,364 26 4,996 2,850 7,846Accumulated depletion . . . . . . . . (1,493) — — (58) — (1,551) (2,717) (4,268)Net capitalized costs . . . . . . . . . . 1,698 4 411 1,306 26 3,445 133 3,578
(1) Includes Africa (excluding Ghana, Equatorial Guinea, Mauritania and Senegal) and South America.(2) Represents 50% interest in KTIPI’s capitalized costs related to oil and gas activities.
142

Costs Incurred in Oil and Gas Activities
The following tables reflects total costs incurred, both capitalized and expensed, for oil and gasproperty acquisition, exploration, and development activities for the year.
GhanaEquatorial
GuineaMauritania/
SenegalU.S. Gulfof Mexico Other(1)
KosmosTotal
EquityMethod
Investment—EquatorialGuinea(2) Total
(In millions)
Year ended December 31, 2019Property acquisition:
Unproved . . . . . . . . . . . . . $ — $ 11 $ 2 $ 15 $ — $ 28 $— $ 28Proved . . . . . . . . . . . . . . . — — — — — — — —
Exploration . . . . . . . . . . . . . — 41 26 122 38 227 — 227Development . . . . . . . . . . . . 59 126 11 91 — 287 — 287Total costs incurred . . . . . . . . $ 59 $178 $ 39 $ 228 $ 38 $ 542 $— $ 542
Year ended December 31, 2018Property acquisition:
Unproved . . . . . . . . . . . . . $ — $ 2 $ — $ 303 $ 1 $ 306 $— $ 306Proved(3) . . . . . . . . . . . . . — — — 1,038 — 1,038 — 1,038
Exploration . . . . . . . . . . . . . 3 30 33 69 137 272 — 272Development . . . . . . . . . . . . 111 — 4 21 — 136 — 136Total costs incurred . . . . . . . . $114 $ 32 $ 37 $1,431 $138 $1,752 $— $1,752
Year ended December 31, 2017Property acquisition:
Unproved . . . . . . . . . . . . . $ — $ 1 $ 3 $ — $ 6 $ 10 $— $ 10Proved . . . . . . . . . . . . . . . — — — — 231 231 — 231
Exploration(4) . . . . . . . . . . . 15 — (69) — 125 71 — 71Development . . . . . . . . . . . . 1 — — — — 1 — 1Total costs incurred . . . . . . . . $ 16 $ 1 $(66) $ — $362 $ 313 $— $ 313
(1) Includes Africa (excluding Ghana, Equatorial Guinea, Mauritania and Senegal), Europe and SouthAmerica.
(2) For year ended December 31, 2017, represents 50% interest in KTIPI costs incurred from the date ofacquisition through December 31, 2017.
(3) Represents cash paid to acquire 50% interest in KTIPI.(4) Mauritania/Senegal is net of the farm-out to BP in 2017.
Standardized Measure for Discounted Future Net Cash Flows
The following table provides projected future net cash flows based on the twelve month unweightedarithmetic average of the first-day-of-the-month oil price for Brent crude in the period January throughDecember 2019. The average price is adjusted for crude handling, transportation fees, quality, and a regionalprice differential.
Because prices used in the calculation are average prices for that year, the standardized measure couldvary significantly from year to year based on market conditions that occur.
The projection should not be interpreted as representing the current value to Kosmos. Materialrevisions to estimates of proved reserves may occur in the future; development and production of the
143

reserves may not occur in the periods assumed; actual prices realized are expected to vary significantly fromthose used; and actual costs may vary. Kosmos’ investment and operating decisions are not based on theinformation presented, but on a wide range of reserve estimates that include probable as well as provedreserves and on a wide range of different price and cost assumptions.
The standardized measure is intended to provide a better means to compare the value of Kosmos’proved reserves at a given time with those of other oil producing companies than is provided by comparingraw proved reserve quantities.
GhanaEquatorial
GuineaMauritania/Senegal(2)
U.S. Gulfof Mexico
EquityMethod
Investment—Equatorial
Guinea Total
(In millions)
At December 31, 2019Future cash inflows . . . . . . . . . . . . . . . . $ 5,546 $1,650 $ — $2,205 $ — $ 9,401Future production costs . . . . . . . . . . . . . (1,683) (675) — (312) — $ (2,670)Future development costs . . . . . . . . . . . . (736) (400) — (393) — $ (1,529)Future tax expenses . . . . . . . . . . . . . . . . (1,026) (317) — (123) — (1,466)Future net cash flows . . . . . . . . . . . . . . . 2,101 258 — 1,377 — 3,73610% annual discount for estimated timing
of cash flows . . . . . . . . . . . . . . . . . . . (675) 36 — (278) — (917)Standardized measure of discounted future
net cash flows . . . . . . . . . . . . . . . . . . . $ 1,426 $ 294 $ — $1,099 $ — $ 2,819
At December 31, 2018Future cash inflows . . . . . . . . . . . . . . . . $ 5,882 $ — $ — $2,951 $1,735 $10,568Future production costs . . . . . . . . . . . . . (1,613) — — (338) (583) (2,534)Future development costs . . . . . . . . . . . . (928) — — (467) (378) (1,773)Future tax expenses . . . . . . . . . . . . . . . . (1,052) — — (379) (416) (1,847)Future net cash flows . . . . . . . . . . . . . . . 2,289 — — 1,767 358 4,41410% annual discount for estimated timing
of cash flows . . . . . . . . . . . . . . . . . . . (749) — — (397) 33 (1,113)Standardized measure of discounted future
net cash flows . . . . . . . . . . . . . . . . . . . $ 1,540 $ — $ — $1,370 $ 391 $ 3,301
At December 31, 2017Future cash inflows . . . . . . . . . . . . . . . . $ 4,473 $ — $ — $ — $1,003 $ 5,476Future production costs . . . . . . . . . . . . . (1,925) — — — (473) (2,398)Future development costs . . . . . . . . . . . . (1,059) — — — (296) (1,355)Future Ghanaian tax expenses(1) . . . . . . . (203) — — — (225) (428)Future net cash flows . . . . . . . . . . . . . . . 1,286 — — — 9 1,29510% annual discount for estimated timing
of cash flows . . . . . . . . . . . . . . . . . . . (315) 121 (194)Standardized measure of discounted future
net cash flows . . . . . . . . . . . . . . . . . . . $ 971 $ — $ — $ — $ 130 $ 1,101
(1) The Company was a tax exempt company incorporated pursuant to the laws of Bermuda atDecember 31, 2017. The Company was not subject to future income tax expense related to its proved
144

oil and gas reserves levied at a corporate parent level. Accordingly, the Company’s StandardizedMeasure for the years ended December 31, 2018 and 2017, respectively, only reflect the effects of futuretax expense levied at an asset level.
(2) The Tortue Phase 1 SPA was signed on February 11, 2020, resulting in approximately 100 MMBoe ofproved undeveloped reserves being recognized at that time as evaluated by the company’s independentreserve auditor Ryder Scott, LP.
Changes in the Standardized Measure for Discounted Cash Flows
GhanaEquatorial
GuineaMauritania/Senegal(3)
U.S. Gulfof Mexico
EquityMethod
Investment—Equatorial
Guinea Total
(In millions)
Balance at December 31, 2016 . . . . . . . . . . . $ 846 $— $— $ — $ — $ 846Purchase of minerals in place . . . . . . . . . . . — — — — 146 146Sales and transfers 2017 . . . . . . . . . . . . . . . (451) — — — (16) (467)Extensions and discoveries . . . . . . . . . . . . . 21 — — — — 21Net changes in prices and costs . . . . . . . . . . 485 — — — — 485Previously estimated development costs
incurred during the period . . . . . . . . . . . 6 — — — — 6Net changes in development costs . . . . . . . . (388) — — — — (388)Revisions of previous quantity estimates . . . 415 — — — — 415Net changes in tax expenses(1) . . . . . . . . . . (8) — — — — (8)Accretion of discount . . . . . . . . . . . . . . . . 98 — — — — 98Changes in timing and other . . . . . . . . . . . . (53) — — — — (53)Balance at December 31, 2017 . . . . . . . . . . . $ 971 $— $— $ — $ 130 $1,101Purchase of minerals in place . . . . . . . . . . . — — — 1,487 — 1,487Sales and transfers 2018 . . . . . . . . . . . . . . . (545) — — (117) (287) (949)Extensions and discoveries . . . . . . . . . . . . . — — — — — —Net changes in prices and costs . . . . . . . . . . 1,137 — — — 271 1,408Previously estimated development costs
incurred during the period . . . . . . . . . . . 105 — — — — 105Net changes in development costs . . . . . . . . 15 — — — (29) (14)Revisions of previous quantity estimates . . . 398 — — — 385 783Net changes in tax expenses . . . . . . . . . . . . (565) — — — (136) (701)Accretion of discount . . . . . . . . . . . . . . . . 112 — — — 30 142Changes in timing and other . . . . . . . . . . . . (88) — — — 27 (61)Balance at December 31, 2018 . . . . . . . . . . . $1,540 $— $— $1,370 $ 391 $3,301
145

GhanaEquatorial
GuineaMauritania/Senegal(3)
U.S. Gulfof Mexico
EquityMethod
Investment—Equatorial
Guinea Total
(In millions)
Purchase of minerals in place(2) . . . . . . . . . — 391 — — (391) —Sales and transfers 2019 . . . . . . . . . . . . . . . (568) (210) — (336) — (1,114)Extensions and discoveries . . . . . . . . . . . . . — — — (14) — (14)Net changes in prices and costs . . . . . . . . . . (352) (151) — (401) — (904)Previously estimated development costs
incurred during the period . . . . . . . . . . . 97 11 — 109 — 217Net changes in development costs . . . . . . . . 44 (57) — (43) — (56)Revisions of previous quantity estimates . . . 474 187 — 109 — 770Net changes in tax expenses . . . . . . . . . . . . (23) 11 — 231 — 219Accretion of discount . . . . . . . . . . . . . . . . 224 69 — 167 — 460Changes in timing and other . . . . . . . . . . . . (10) 43 — (93) — (60)Balance at December 31, 2019 . . . . . . . . . . . $1,426 $ 294 $— $1,099 $ — $ 2,819
(1) The Company was a tax exempt company incorporated pursuant to the laws of Bermuda atDecember 31, 2017 and 2016. The Company was not subject to future income tax expense related to itsproved oil and gas reserves levied at a corporate parent level. Accordingly, the Company’s StandardizedMeasure for the years ended December 31, 2018 and 2017, respectively, only reflect the effects of futuretax expense levied at an asset level.
(2) We disclosed our share of reserves that were accounted for by the equity method. Effective of January 1,2019, our outstanding shares in KTIPI were transferred to Trident in exchange for a 40.4% undividedparticipating interest in the Ceiba Field and Okume Complex. As a result, our interest in the Ceiba Fieldand Okume Complex is accounted for under the proportionate consolidation method of accountinggoing forward.
(3) The Tortue Phase 1 SPA was signed on February 11, 2020, resulting in approximately 100 MMBoe ofproved undeveloped reserves being recognized at that time as evaluated by the company’s independentreserve auditor Ryder Scott, LP.
146

KOSMOS ENERGY LTD.
Supplemental Quarterly Financial Information (Unaudited)
Quarter Ended
March 31, June 30, September 30, December 31,
(In thousands, except per share data)
2019Revenues and other income . . . . . . . . . . . . . . . . . . . . $296,790 $ 395,934 $ 356,970 $460,215Costs and expenses . . . . . . . . . . . . . . . . . . . . . . . . . 358,370 346,495 317,435 462,492Net income (loss) . . . . . . . . . . . . . . . . . . . . . . . . . . . (52,906) 16,837 16,065 (35,773)Net income (loss) per share:
Basic(1) . . . . . . . . . . . . . . . . . . . . . . . . . . . . . . . . (0.13) 0.04 0.04 (0.09)Diluted(1) . . . . . . . . . . . . . . . . . . . . . . . . . . . . . . (0.13) 0.04 0.04 (0.09)
2018Revenues and other income . . . . . . . . . . . . . . . . . . . . $127,177 $ 215,473 $ 250,219 $309,500Costs and expenses . . . . . . . . . . . . . . . . . . . . . . . . . 201,751 364,091 364,912 22,475Net income (loss) . . . . . . . . . . . . . . . . . . . . . . . . . . . (50,226) (103,273) (126,057) 185,565Net income (loss) per share:
Basic(1) . . . . . . . . . . . . . . . . . . . . . . . . . . . . . . . . (0.13) (0.26) (0.31) 0.44Diluted(1) . . . . . . . . . . . . . . . . . . . . . . . . . . . . . . (0.13) (0.26) (0.31) 0.43
(1) The sum of the quarterly earnings per share information may not add to the annual earnings per shareinformation as a result of rounding.
147

Item 9. Changes in and Disagreements with Accountants on Accounting and Financial Disclosure
None.
Item 9A. Controls and Procedures
Evaluation of Disclosure Controls and Procedures
As of the end of the period covered by this report, an evaluation of the effectiveness of the design andoperation of the Company’s disclosure controls and procedures (as defined in Rule 13a-15(e) under theSecurities Exchange Act of 1934, as amended (the “Exchange Act”)) was performed under the supervisionand with the participation of the Company’s management, including our Chief Executive Officer and ChiefFinancial Officer. This evaluation considered the various processes carried out under the direction of ourdisclosure committee in an effort to ensure that information required to be disclosed in the SEC reports wefile or submit under the Exchange Act is accurate, complete and timely. However, a control system, no matterhow well conceived and operated, can provide only reasonable, not absolute, assurance that the objectivesof the control system are met. The design of a control system must reflect the fact that there are resourceconstraints, and the benefit of controls must be considered relative to their costs. Consequently, no evaluationof controls can provide absolute assurance that all control issues and instances of fraud, if any, within ourcompany have been detected. Based upon this evaluation, our Chief Executive Officer and our Chief FinancialOfficer concluded that the Company’s disclosure controls and procedures were effective as of December 31,2019, in ensuring that information required to be disclosed by the Company in the reports that it files orsubmits under the Exchange Act is recorded, processed, summarized and reported within the time periodsspecified in the SEC’s rules and forms, including that such information is accumulated and communicated tothe Company’s management, including our Chief Executive Officer and our Chief Financial Officer, toallow timely decisions regarding required disclosure.
Evaluation of Changes in Internal Control over Financial Reporting
There were no changes in our internal control over financial reporting that occurred during our mostrecent fiscal quarter that materially affected, or are reasonably likely to materially affect, our internal controlover financial reporting.
Management’s Annual Report on Internal Control over Financial Reporting
Our management is responsible for establishing and maintaining adequate internal control overfinancial reporting. Our internal control has been designed to provide reasonable assurance regarding thereliability of financial reporting and the preparation of our financial statements for external purposes inaccordance with U.S. generally accepted accounting principles. All internal control systems have inherentlimitations, including the possibility of human error and the possible circumvention of or overriding ofcontrols. The design of an internal control system is also based in part upon assumptions and judgmentsmade by management. As a result, even an effective system of internal controls can provide no more thanreasonable assurance with respect to the fair presentation of financial statements and the processes underwhich they were prepared. Also, projections of any evaluation of effectiveness to future periods are subject tothe risk that internal control may become inadequate because of changes in conditions, or that the degreeof compliance with the policies or procedures may deteriorate.
Under the supervision and with the participation of management, including our Chief ExecutiveOfficer and our Chief Financial Officer, we assessed the effectiveness of our internal control over financialreporting as of the end of the period covered by this report based on the framework in “Internal Control—Integrated Framework (2013)” issued by the Committee of Sponsoring Organizations of the TreadwayCommission. Based on the assessment, our Chief Executive Officer and our Chief Financial Officerconcluded that our internal control over financial reporting was effective to provide reasonable assuranceregarding the reliability of our financial reporting and the preparation of our financial statements for externalpurposes in accordance with U.S. generally accepted accounting principles.
148

Ernst & Young LLP, the independent registered public accounting firm that audited our consolidatedfinancial statements included in this annual report on Form 10-K, has issued an attestation report on theeffectiveness of internal control over financial reporting as of December 31, 2019 which is included in “Item 8.Financial Statements and Supplementary Data.”
Item 9B. Other Information
Disclosures Required Pursuant to Section 13(r) of the Securities Exchange Act of 1934
Not applicable.
149

PART III
Item 10. Directors, Executive Officers and Corporate Governance
The information required by this item is incorporated herein by reference to the 2020 Proxy Statement,which will be filed with the SEC not later than 120 days subsequent to December 31, 2019.
Item 11. Executive Compensation
The information required by this item is incorporated herein by reference to the 2020 Proxy Statement,which will be filed with the SEC not later than 120 days subsequent to December 31, 2019.
Item 12. Security Ownership of Certain Beneficial Owners and Management and Related StockholderMatters
The information required by this item is incorporated herein by reference to the 2020 Proxy Statement,which will be filed with the SEC not later than 120 days subsequent to December 31, 2019.
Item 13. Certain Relationships and Related Transactions, and Director Independence
The information required by this item is incorporated herein by reference to the 2020 Proxy Statement,which will be filed with the SEC not later than 120 days subsequent to December 31, 2019.
Item 14. Principal Accounting Fees and Services
The information required by this item is incorporated herein by reference to the 2020 Proxy Statement,which will be filed with the SEC not later than 120 days subsequent to December 31, 2019.
150
PART IV
Item 15. Exhibits, Financial Statement Schedules
(a) The following documents are filed as part of this report:
(1) Financial statements
The financial statements filed as part of the Annual Report on Form 10-K are listed in the accompanyingindex to consolidated financial statements in Item 8, Financial Statements and Supplementary Data.
(2) Financial statement schedules
Schedule I—Condensed Parent Company Financial Statements
Under the terms of agreements governing the indebtedness of subsidiaries of Kosmos Energy Ltd. for2019, 2018 and 2017 (collectively “KEL,” the “Parent Company”), such subsidiaries may be restricted frommaking dividend payments, loans or advances to KEL. Schedule I of Article 5-04 of Regulation S-Xrequires the condensed financial information of the Parent Company to be filed when the restricted netassets of consolidated subsidiaries exceed 25 percent of consolidated net assets as of the end of the mostrecently completed fiscal year.
The following condensed parent-only financial statements of KEL have been prepared in accordancewith Rule 12-04, Schedule I of Regulation S-X and included herein. The Parent Company’s 100% investmentin its subsidiaries has been recorded using the equity basis of accounting in the accompanying condensedparent-only financial statements. The condensed financial statements should be read in conjunction with theconsolidated financial statements of Kosmos Energy Ltd. and subsidiaries and notes thereto.
The terms “Kosmos,” the “Company,” and similar terms refer to Kosmos Energy Ltd. and itswholly-owned subsidiaries, unless the context indicates otherwise. Certain prior period amounts have beenreclassified to conform with the current year presentation. Such reclassifications had no impact on ourreported net income, current assets, total assets, current liabilities, total liabilities or shareholders equity.
151

KOSMOS ENERGY LTD.
CONDENSED PARENT COMPANY BALANCE SHEETS
(In thousands, except share data)
December 31,
2019 2018
AssetsCurrent assets:
Cash and cash equivalents . . . . . . . . . . . . . . . . . . . . . . . . . . . . . . . . . . . $ 6,422 $ 6,776Receivables from subsidiaries . . . . . . . . . . . . . . . . . . . . . . . . . . . . . . . . . 3,819 2,890Note receivable from subsidiary . . . . . . . . . . . . . . . . . . . . . . . . . . . . . . . — 7,941Prepaid expenses and other . . . . . . . . . . . . . . . . . . . . . . . . . . . . . . . . . . 428 313
Total current assets . . . . . . . . . . . . . . . . . . . . . . . . . . . . . . . . . . . . . . . . . . 10,669 17,920Investment in subsidiaries at equity . . . . . . . . . . . . . . . . . . . . . . . . . . . . . . . 1,159,560 1,432,468Long-term note receivable from subsidiary . . . . . . . . . . . . . . . . . . . . . . . . . 518,844 607,943Deferred financing costs, net of accumulated amortization of $14,681 and
$12,065 at December 31, 2019 and December 31, 2018, respectively . . . . . . . 6,321 8,937Restricted cash . . . . . . . . . . . . . . . . . . . . . . . . . . . . . . . . . . . . . . . . . . . . . 305 305Long-term deferred tax asset . . . . . . . . . . . . . . . . . . . . . . . . . . . . . . . . . . . 17,265 (1,132)Total assets . . . . . . . . . . . . . . . . . . . . . . . . . . . . . . . . . . . . . . . . . . . . . . . $ 1,712,964 $ 2,066,441
Liabilities and shareholders’ equityCurrent liabilities:
Accounts payable . . . . . . . . . . . . . . . . . . . . . . . . . . . . . . . . . . . . . . . . . $ — $ 975Accrued liabilities . . . . . . . . . . . . . . . . . . . . . . . . . . . . . . . . . . . . . . . . . 11,942 18,972
Total current liabilities . . . . . . . . . . . . . . . . . . . . . . . . . . . . . . . . . . . . . . . 11,942 19,947Long-term debt . . . . . . . . . . . . . . . . . . . . . . . . . . . . . . . . . . . . . . . . . . . . 640,856 836,016Long-term note payable to subsidiary . . . . . . . . . . . . . . . . . . . . . . . . . . . . . 217,000 269,000Other long-term liabilities . . . . . . . . . . . . . . . . . . . . . . . . . . . . . . . . . . . . . 1,464 —Shareholders’ equity:
Preference shares, $0.01 par value; 200,000,000 authorized shares; zeroissued at December 31, 2019 and December 31, 2018 . . . . . . . . . . . . . . . — —
Common stock, $0.01 par value; 2,000,000,000 authorized shares;445,779,367 and 442,914,675 issued at December 31, 2019 andDecember 31, 2018, respectively . . . . . . . . . . . . . . . . . . . . . . . . . . . . . . 4,458 4,429
Additional paid-in capital . . . . . . . . . . . . . . . . . . . . . . . . . . . . . . . . . . . . 2,297,221 2,341,249Accumulated deficit . . . . . . . . . . . . . . . . . . . . . . . . . . . . . . . . . . . . . . . . (1,222,970) (1,167,193)Treasury stock, at cost, 44,263,269 shares at December 31, 2019 and 2018,
respectively . . . . . . . . . . . . . . . . . . . . . . . . . . . . . . . . . . . . . . . . . . . . (237,007) (237,007)Total shareholders’ equity . . . . . . . . . . . . . . . . . . . . . . . . . . . . . . . . . . . . . 841,702 941,478Total liabilities and shareholders’ equity . . . . . . . . . . . . . . . . . . . . . . . . . . . . $ 1,712,964 $ 2,066,441
152
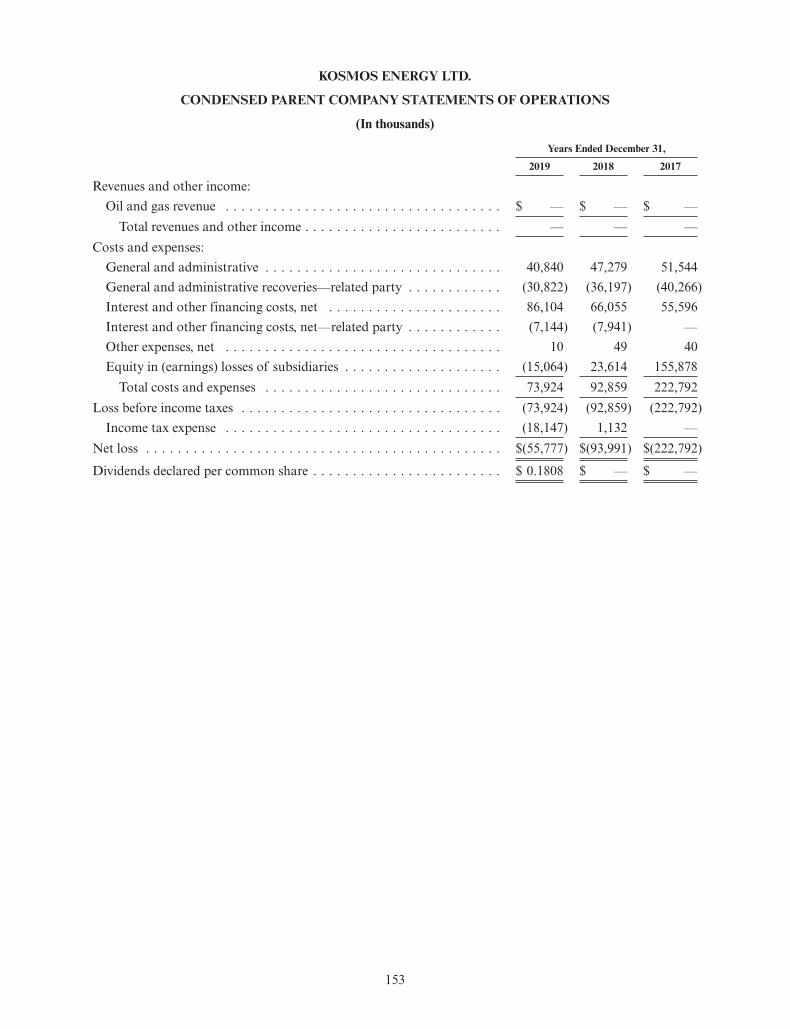
KOSMOS ENERGY LTD.
CONDENSED PARENT COMPANY STATEMENTS OF OPERATIONS
(In thousands)
Years Ended December 31,
2019 2018 2017
Revenues and other income:Oil and gas revenue . . . . . . . . . . . . . . . . . . . . . . . . . . . . . . . . . . . $ — $ — $ —
Total revenues and other income . . . . . . . . . . . . . . . . . . . . . . . . . — — —Costs and expenses:
General and administrative . . . . . . . . . . . . . . . . . . . . . . . . . . . . . . 40,840 47,279 51,544General and administrative recoveries—related party . . . . . . . . . . . . (30,822) (36,197) (40,266)Interest and other financing costs, net . . . . . . . . . . . . . . . . . . . . . . 86,104 66,055 55,596Interest and other financing costs, net—related party . . . . . . . . . . . . (7,144) (7,941) —Other expenses, net . . . . . . . . . . . . . . . . . . . . . . . . . . . . . . . . . . . 10 49 40Equity in (earnings) losses of subsidiaries . . . . . . . . . . . . . . . . . . . . (15,064) 23,614 155,878
Total costs and expenses . . . . . . . . . . . . . . . . . . . . . . . . . . . . . . 73,924 92,859 222,792Loss before income taxes . . . . . . . . . . . . . . . . . . . . . . . . . . . . . . . . . (73,924) (92,859) (222,792)
Income tax expense . . . . . . . . . . . . . . . . . . . . . . . . . . . . . . . . . . . (18,147) 1,132 —Net loss . . . . . . . . . . . . . . . . . . . . . . . . . . . . . . . . . . . . . . . . . . . . . $(55,777) $(93,991) $(222,792)
Dividends declared per common share . . . . . . . . . . . . . . . . . . . . . . . . $ 0.1808 $ — $ —
153

KOSMOS ENERGY LTD.
CONDENSED PARENT COMPANY STATEMENTS OF CASH FLOWS
(In thousands)
Years Ended December 31,
2019 2018 2017
Operating activitiesNet loss . . . . . . . . . . . . . . . . . . . . . . . . . . . . . . . . . . . . . . . . . . . $ (55,777) $ (93,991) $(222,792)Adjustments to reconcile net income (loss) to net cash provided by
(used in) operating activities:Equity in (earnings) losses of subsidiaries . . . . . . . . . . . . . . . . . . (15,064) 23,614 155,878Equity-based compensation . . . . . . . . . . . . . . . . . . . . . . . . . . . . 32,370 35,230 39,913Depreciation and amortization . . . . . . . . . . . . . . . . . . . . . . . . . . 5,039 7,292 3,070Deferred income taxes . . . . . . . . . . . . . . . . . . . . . . . . . . . . . . . . (18,397) 1,132 —Loss on extinguishment of debt . . . . . . . . . . . . . . . . . . . . . . . . . 22,913 — —Other . . . . . . . . . . . . . . . . . . . . . . . . . . . . . . . . . . . . . . . . . . . — 268 3,884Changes in assets and liabilities:
Decrease in receivables . . . . . . . . . . . . . . . . . . . . . . . . . . . . . . 427 1,234 986(Increase) decrease in prepaid expenses and other . . . . . . . . . . . (115) (23) 127(Increase) decrease due to/from related party . . . . . . . . . . . . . . 43,974 (42,163) 14,463Increase (decrease) in accounts payable and accrued liabilities . . . (8,754) 816 1,179
Net cash provided by (used in) operating activities . . . . . . . . . . . . . . 6,616 (66,591) (3,292)Investing activitiesInvestment in subsidiaries . . . . . . . . . . . . . . . . . . . . . . . . . . . . . . . 287,972 (36,192) 4,691Net cash provided by (used in) investing activities . . . . . . . . . . . . . . 287,972 (36,192) 4,691Financing activitiesBorrowings under long-term debt . . . . . . . . . . . . . . . . . . . . . . . . . — 400,000 —Payments on long-term debt . . . . . . . . . . . . . . . . . . . . . . . . . . . . . (325,000) (75,000) —Net proceeds from issuance of senior notes . . . . . . . . . . . . . . . . . . . 641,875 — —Redemption of senior secured notes . . . . . . . . . . . . . . . . . . . . . . . . (535,338) — —Purchase of treasury stock / tax withholdings . . . . . . . . . . . . . . . . . (1,983) (206,051) (2,194)Dividends . . . . . . . . . . . . . . . . . . . . . . . . . . . . . . . . . . . . . . . . . . (72,599) — —Deferred financing costs . . . . . . . . . . . . . . . . . . . . . . . . . . . . . . . . (1,897) (9,382) —Net cash provided by (used in) financing activities . . . . . . . . . . . . . . (294,942) 109,567 (2,194)Net increase (decrease) in cash and cash equivalents . . . . . . . . . . . . . (354) 6,784 (795)Cash, cash equivalents and restricted cash at beginning of period . . . 7,081 297 1,092Cash, cash equivalents and restricted cash at end of period . . . . . . . . $ 6,727 $ 7,081 $ 297
Non-cash activity:Issuance of common stock for related party receivable . . . . . . . . . $ — $ 307,944 $ —
154
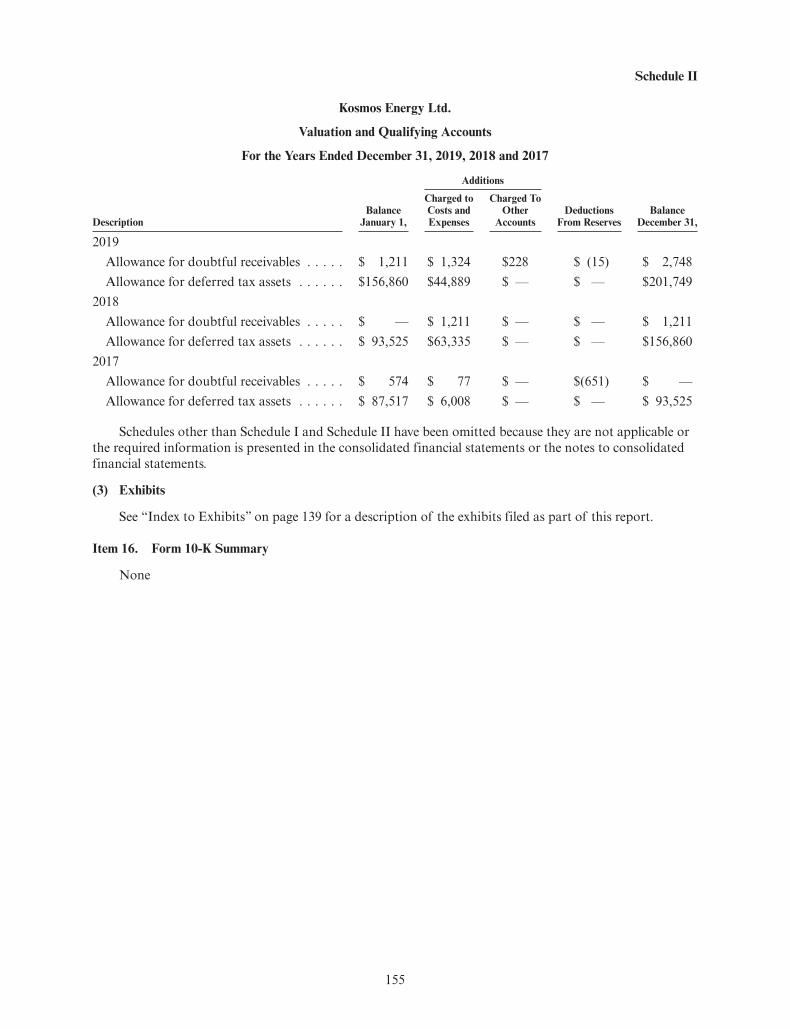
Schedule II
Kosmos Energy Ltd.
Valuation and Qualifying Accounts
For the Years Ended December 31, 2019, 2018 and 2017
Additions
DescriptionBalance
January 1,
Charged toCosts andExpenses
Charged ToOther
AccountsDeductions
From ReservesBalance
December 31,
2019Allowance for doubtful receivables . . . . . $ 1,211 $ 1,324 $228 $ (15) $ 2,748Allowance for deferred tax assets . . . . . . $156,860 $44,889 $ — $ — $201,749
2018Allowance for doubtful receivables . . . . . $ — $ 1,211 $ — $ — $ 1,211Allowance for deferred tax assets . . . . . . $ 93,525 $63,335 $ — $ — $156,860
2017Allowance for doubtful receivables . . . . . $ 574 $ 77 $ — $(651) $ —Allowance for deferred tax assets . . . . . . $ 87,517 $ 6,008 $ — $ — $ 93,525
Schedules other than Schedule I and Schedule II have been omitted because they are not applicable orthe required information is presented in the consolidated financial statements or the notes to consolidatedfinancial statements.
(3) Exhibits
See “Index to Exhibits” on page 139 for a description of the exhibits filed as part of this report.
Item 16. Form 10-K Summary
None
155

SIGNATURES
Pursuant to the requirements of Section 13 or 15(d) of the Securities Act of 1934, the Registrant hasduly caused this report to be signed on its behalf by the undersigned, thereunto duly authorized.
KOSMOS ENERGY LTD.
Date: February 24, 2020 By: /s/ THOMAS P. CHAMBERS
Thomas P. ChambersSenior Vice President and Chief Financial Officer
Pursuant to the requirements of the Securities Exchange Act of 1934, this report has been signedbelow by the following persons on behalf of the Registrant and in the capacities and on the dates indicated.
Signature Title Date
/s/ ANDREW G. INGLIS
Andrew G. Inglis
Chairman of the Board of Directors andChief Executive Officer (PrincipalExecutive Officer)
February 24, 2020
/s/ THOMAS P. CHAMBERS
Thomas P. ChambersSenior Vice President and Chief FinancialOfficer (Principal Financial Officer) February 24, 2020
/s/ RONALD GLASS
Ronald Glass
Vice President and Chief AccountingOfficer(Principal Accounting Officer)
February 24, 2020
/s/ LISA DAVIS
Lisa DavisDirector February 24, 2020
/s/ SIR RICHARD B. DEARLOVE
Sir Richard B. DearloveDirector February 24, 2020
/s/ DEANNA L. GOODWIN
Deanna L. GoodwinDirector February 24, 2020
/s/ ADEBAYO O. OGUNLESI
Adebayo O. OgunlesiDirector February 24, 2020
/s/ STEVEN M. STERIN
Stevin M. SterinDirector February 24, 2020
156

INDEX OF EXHIBITS
ExhibitNumber Description of Document
Governing Documents3.1 Certificate of Incorporation of the Company (filed as Exhibit 3.1 to the Company’s
Form 8-K12g-3 filed December 28, 2018 (File No. 000-56014), and incorporated herein byreference).
3.2 Bylaws of the Company (filed as Exhibit 3.2 to the Company’s Form 8-K12g-3 filedDecember 31, 2018 (File No. 000-56014), and incorporated herein by reference).
4.1 Form of Common Stock Certificate (filed as Exhibit 4.1 to the Company’s Form 8-K12g-3filed December 28, 2018 (File No. 000-56014), and incorporated herein by reference).
4.2* Description of the Company’s Capital StockOperating AgreementsCertain of the agreements listed below have been filed pursuant to the Company’s voluntarycompliance with international transparency standards and are not material contracts as suchterm is used in Item 601(b)(10) of Regulation S-K.Ghana
10.1 Petroleum Agreement in respect of West Cape Three Points Block Offshore Ghana datedJuly 22, 2004 among the GNPC, Kosmos Ghana and the E.O. Group (filed as Exhibit 10.1to the Company’s Registration Statement on Form S-1/A filed March 3, 2011 (FileNo. 333-171700), and incorporated herein by reference).
10.2 Joint Operating Agreement in respect of West Cape Three Points Block Offshore Ghanadated July 27, 2004 between Kosmos Ghana and E.O. Group (filed as Exhibit 10.2 to theCompany’s Registration Statement on Form S-1/A filed March 3, 2011 (FileNo. 333-171700), and incorporated herein by reference).
10.3 Petroleum Agreement in respect of the Deepwater Tano Contract Area dated March 10,2006 among GNPC, Tullow Ghana, Sabre and Kosmos Ghana (filed as Exhibit 10.3 to theCompany’s Registration Statement on Form S-1/A filed March 3, 2011 (FileNo. 333-171700), and incorporated herein by reference).
10.4 Joint Operating Agreement in respect of the Deepwater Tano Contract Area, OffshoreGhana dated August 14, 2006, among Tullow Ghana, Sabre Oil and Gas Limited, andKosmos Ghana (filed as Exhibit 10.4 to the Company’s Registration Statement onForm S-1/A filed March 3, 2011 (File No. 333-171700), and incorporated herein byreference).
10.5 Unitization and Unit Operating Agreement covering the Jubilee Field Unit located offshorethe Republic of Ghana dated July 13, 2009, among GNPC, Tullow, Kosmos Ghana,Anadarko WCTP, Sabre and E.O. Group (filed as Exhibit 10.6 to the Company’sRegistration Statement on Form S-1/A filed March 3, 2011 (File No. 333-171700), andincorporated herein by reference).
10.6 Settlement Agreement, dated December 18, 2010 among Kosmos Ghana, Ghana NationalPetroleum Corporation and the Government of the Republic of Ghana (filed asExhibit 10.32 to the Company’s Registration Statement on Form S-1/A filed April 14, 2011(File No. 333-171700), and incorporated herein by reference).Sao Tome and Principe
10.7 Production Sharing Contract relating to Block 5 Offshore Sao Tome between theDemocratic Republic of Sao Tome and Principe and Equator Exploration STP Block 5Limited dated April 18, 2012 (filed as Exhibit 10.1 to the Company’s Quarterly Report onForm 10-Q for the quarter ended March 31, 2016, and incorporated herein by reference).
157
ExhibitNumber Description of Document
10.8 Amendment No. 1, dated November 24, 2014, to the Production Sharing Contract relatingto Block 5 Offshore Sao Tome between the Democratic Republic of Sao Tome and Principeand Equator Exploration STP Block 5 Limited dated April 18, 2012 (filed as Exhibit 10.2 tothe Company’s Quarterly Report on Form 10-Q for the quarter ended March 31, 2016, andincorporated herein by reference).
10.9 Amendment No. 2, dated September 15, 2015, to the Production Sharing Contract relatingto Block 5 Offshore Sao Tome between the Democratic Republic of Sao Tome and Principeand Equator Exploration STP Block 5 Limited dated April 18, 2012 (filed as Exhibit 10.3 tothe Company’s Quarterly Report on Form 10-Q for the quarter ended March 31, 2016, andincorporated herein by reference).
10.10 Amendment No. 3, dated February 19, 2016, to the Production Sharing Contract relating toBlock 5 Offshore Sao Tome between the Democratic Republic of Sao Tome and Principe,Equator Exploration STP Block 5 Limited and Kosmos Energy Sao Tome and Principedated April 18, 2012 (filed as Exhibit 10.5 to the Company’s Quarterly Report on Form10-Q for the quarter ended March 31, 2016, and incorporated herein by reference).
10.11 Production Sharing Contract relating to Block 6 Offshore Sao Tome between theDemocratic Republic of Sao Tome and Principe and Galp Energia São Tomé e Príncipe,Unipessoal, LDA dated October 26, 2015 (filed as Exhibit 10.6 to the Company’s QuarterlyReport on Form 10-Q for the quarter ended March 31, 2016, and incorporated herein byreference).
10.12 Addendum, dated November 9, 2015, to the Production Sharing Contract relating to Block6 Offshore Sao Tome between the Democratic Republic of Sao Tome and Principe and GalpEnergia São Tomé e Príncipe, Unipessoal, LDA dated October 26, 2015 (filed asExhibit 10.7 to the Company’s Quarterly Report on Form 10-Q for the quarter endedMarch 31, 2016, and incorporated herein by reference).
10.13 Production Sharing Contract relating to Block 10 Offshore Sao Tome between theDemocratic Republic of Sao Tome and Principe, BP Exploration (STP) Limited andKosmos Energy Sao Tome and Principe dated March 9, 2018 (filed as Exhibit 10.8 to theCompany’s Quarterly Report on Form 10-Q for the quarter ended March 31, 2018, andincorporated herein by reference).
10.14 First Addendum, dated December 17, 2015, to the Production Sharing Contract relating toBlock 11 Offshore Sao Tome between the Democratic Republic of Sao Tome and KosmosEnergy Sao Tome and Principe dated July 23, 2014 (filed as Exhibit 10.11 to the Company’sQuarterly Report on Form 10-Q for the quarter ended March 31, 2016, and incorporatedherein by reference).
10.15 Production Sharing Contract relating to Block 12 Offshore Sao Tome between theDemocratic Republic of Sao Tome and Principe and Equator Exploration STP Block 12Limited dated February 19, 2016 (filed as Exhibit 10.12 to the Company’s Quarterly Reporton Form 10-Q for the quarter ended March 31, 2016, and incorporated herein by reference).
10.16 First Amendment, dated March 31, 2016, to the Production Sharing Contract between theDemocratic Republic of Sao Tome and Principe, Equator Exploration STP Block 12Limited and Kosmos Energy Sao Tome and Principe dated February 19, 2016 (filed asExhibit 10.14 to the Company’s Quarterly Report on Form 10-Q for the quarter endedMarch 31, 2016, and incorporated herein by reference).
10.17 Production Sharing Contract relating to Block 13 Offshore Sao Tome between theDemocratic Republic of Sao Tome and Principe, BP Exploration (STP) Limited andKosmos Energy Sao Tome and Principe dated March 9, 2018 (filed as Exhibit 10.9 to theCompany’s Quarterly Report on Form 10-Q for the quarter ended March 31, 2018, andincorporated herein by reference).
158

ExhibitNumber Description of Document
Senegal10.18 Hydrocarbon Exploration and Production Sharing Contract for the Cayar Offshore Profond
between the Republic of Senegal and Petro-Tim Limited and Societe des Petroles du Senegaldated January 17, 2012 (filed as Exhibit 10.1 to the Company’s Quarterly Report onForm 10-Q for the quarter ended September 30, 2014, and incorporated herein byreference).
10.19 Hydrocarbon Exploration and Production Sharing Contract for the Saint Louis OffshoreProfond between the Republic of Senegal and Petro-Tim Limited and Societe des Petrolesdu Senegal dated January 17, 2012 (filed as Exhibit 10.2 to the Company’s Quarterly Reporton Form 10-Q for the quarter ended September 30, 2014, and incorporated herein byreference).
10.20 Sale and Purchase Agreement relating to the sale and purchase of shares in Kosmos BPSenegal Limited (formerly Normandy Ventures Limited) between BP Indonesia OilTerminal Investment Limited and Kosmos Energy Senegal dated December 15, 2016 (filedas Exhibit 10.31 to the Company’s Annual Report on Form 10-K of the year endedDecember 31, 2016, and incorporated herein by reference).Suriname
10.21 Production Sharing Contract for Petroleum Exploration, Development and Productionrelating to Block 42 Offshore Suriname between Staatsolie Maatshappij Suriname N.V. andKosmos Energy Suriname dated December 13, 2011 (filed as Exhibit 10.20 to theCompany’s Quarterly Report on Form 10-Q for the quarter ended September 30, 2013, andincorporated herein by reference).
10.22 Production Sharing Contract for Petroleum Exploration, Development and Productionrelating to Block 45 Offshore Suriname between Staatsolie Maatshappij Suriname N.V. andKosmos Energy Suriname dated December 13, 2011 (filed as Exhibit 10.21 to theCompany’s Quarterly Report on Form 10-Q for the quarter ended September 30, 2013, andincorporated herein by reference).Mauritania
10.23 Exploration and Production Contract between The Islamic Republic of Mauritania andKosmos Energy Mauritania (Bloc C8) dated April 5, 2012 (filed as Exhibit 10.17 to theCompany’s Quarterly Report on Form 10-Q for the quarter ended September 30, 2013, andincorporated herein by reference).
10.24 Exploration and Production Contract between The Islamic Republic of Mauritania andKosmos Energy Mauritania (Bloc C12) dated April 5, 2012 (filed as Exhibit 10.18 to theCompany’s Quarterly Report on Form 10-Q for the quarter ended September 30, 2013, andincorporated herein by reference).
10.25 Exploration and Production Contract between The Islamic Republic of Mauritania andKosmos Energy Mauritania (Bloc C13) dated April 5, 2012 (filed as Exhibit 10.19 to theCompany’s Quarterly Report on Form 10-Q for the quarter ended September 30, 2013, andincorporated herein by reference).
10.26 Exploration and Production Contract between The Islamic Republic of Mauritania andKosmos Energy Mauritania (Bloc C6) dated October 11, 2016 (filed as Exhibit 10.41 to theCompany’s Annual Report on Form 10-K of the year ended December 31, 2016, andincorporated herein by reference).
10.27 Exploration and Production Contract between The Islamic Republic of Mauritania andTullow Mauritania Limited (Bloc C18) dated May 17, 2012 (filed as Exhibit 10.42 to theCompany’s Annual Report on Form 10-K of the year ended December 31, 2017, andincorporated herein by reference).
159

ExhibitNumber Description of Document
Equatorial Guinea10.28 Share Sale and Purchase Agreement relating to the sale and purchase of shares in Hess
International Petroleum, Inc. between Hess Equatorial Guinea Investments Limited, HessCorporation, Kosmos Energy Equatorial Guinea, Kosmos Energy Operating and TridentEnergy E.G. Operations, Ltd. dated October 23, 2017 (filed as Exhibit 10.43 to theCompany’s Annual Report on Form 10-K of the year ended December 31, 2017, andincorporated herein by reference).
10.29 Production Sharing Contract relating to Block G Offshore Republic of Equatorial Guineabetween the Republic of Equatorial Guinea and Triton Equatorial Guinea, Inc. datedMarch 26, 1997 (filed as Exhibit 10.1 to the Company’s Quarterly Report on Form 10-Q forthe quarter ended March 31, 2018, and incorporated herein by reference).
10.30 Amendment No. 1, dated January 1, 2000, to the Production Sharing Contract relating toBlock G Offshore Republic of Equatorial Guinea between Triton Equatorial Guinea, Inc.,Energy Africa Equatorial Guinea Limited, and the Republic of Equatorial Guinearepresented by the Ministry of Mines and Energy (filed as Exhibit 10.2 to the Company’sQuarterly Report on Form 10-Q for the quarter ended March 31, 2018, and incorporatedherein by reference).
10.31 Amendment No. 2, dated December 15, 2005, to the Production Sharing Contract relatingto Block G Offshore Republic of Equatorial Guinea between Amerada Hess EquatorialGuinea, Energy Africa Equatorial Guinea Limited, and the Republic of Equatorial Guinearepresented by the Ministry of Mines, Industry and Energy (filed as Exhibit 10.3 to theCompany’s Quarterly Report on Form 10-Q for the quarter ended March 31, 2018, andincorporated herein by reference).
10.32 Amendment No. 3, dated October 22, 2017, to the Production Sharing Contract relating toBlock G Offshore Republic of Equatorial Guinea between Hess Equatorial Guinea, TullowEquatorial Guinea Limited, and the Republic of Equatorial Guinea represented by theMinistry of Mines and Hydrocarbons (filed as Exhibit10.4 to the Company’s QuarterlyReport on Form 10-Q for the quarter ended March 31, 2018, and incorporated herein byreference).
10.33 Production Sharing Contract relating to Block EG-21 Offshore Republic of EquatorialGuinea between the Republic of Equatorial Guinea, Guinea Ecuatorial de Petroleos andKosmos Energy Equatorial Guinea dated October 10, 2017 (filed as Exhibit 10.5 to theCompany’s Quarterly Report on Form 10-Q for the quarter ended March 31, 2018, andincorporated herein by reference).
10.34 Production Sharing Contract relating to Block S Offshore Republic of Equatorial Guineabetween the Republic of Equatorial Guinea, Guinea Ecuatorial de Petroleos and KosmosEnergy Equatorial Guinea dated October 10, 2017 (filed as Exhibit 10.6 to the Company’sQuarterly Report on Form 10-Q for the quarter ended March 31, 2018, and incorporatedherein by reference).
10.35 Production Sharing Contract relating to Block W Offshore Republic of Equatorial Guineabetween the Republic of Equatorial Guinea, Guinea Ecuatorial de Petroleos and KosmosEnergy Equatorial Guinea dated October 10, 2017 (filed as Exhibit 10.7 to the Company’sQuarterly Report on Form 10-Q for the quarter ended March 31, 2018, and incorporatedherein by reference).
10.36 Production Sharing Contract relating to Block EG-24 Offshore Equatorial Guinea betweenthe Republic of Equatorial Guinea, Guinea Ecuatorial de Petroleos and Ophir EquatorialGuinea (EG-24) Limited dated October 2017 (filed as Exhibit 10.1 to the Company’sQuarterly Report on Form 10-Q for the quarter ended June 30, 2018, and incorporatedherein by reference).
160
ExhibitNumber Description of Document
Cote d’Ivoire10.37 Hydrocarbons Production Sharing Agreement between The Republic of Cote d’Ivoire, BP
Exploration Operating Company Limited and Kosmos Energy Cote d’Ivoire (Block CI-526)dated December 21, 2017 (filed as Exhibit 10.44 to the Company’s Annual Report onForm 10-K of the year ended December 31, 2017, and incorporated herein by reference).
10.38 Hydrocarbons Production Sharing Agreement between The Republic of Cote d’Ivoire, BPExploration Operating Company Limited and Kosmos Energy Cote d’Ivoire (Block CI-602)dated December 21, 2017 (filed as Exhibit 10.45 to the Company’s Annual Report onForm 10-K of the year ended December 31, 2017, and incorporated herein by reference).
10.39 Hydrocarbons Production Sharing Agreement between The Republic of Cote d’Ivoire, BPExploration Operating Company Limited and Kosmos Energy Cote d’Ivoire (Block CI-603)dated December 21, 2017 (filed as Exhibit 10.46 to the Company’s Annual Report onForm 10-K of the year ended December 31, 2017, and incorporated herein by reference).
10.40 Hydrocarbons Production Sharing Agreement between The Republic of Cote d’Ivoire, BPExploration Operating Company Limited and Kosmos Energy Cote d’Ivoire (Block CI-707)dated December 21, 2017 (filed as Exhibit 10.47 to the Company’s Annual Report onForm 10-K of the year ended December 31, 2017, and incorporated herein by reference).
10.41 Hydrocarbons Production Sharing Agreement between The Republic of Cote d’Ivoire, BPExploration Operating Company Limited and Kosmos Energy Cote d’Ivoire (Block CI-708)dated December 21, 2017 (filed as Exhibit 10.48 to the Company’s Annual Report onForm 10-K of the year ended December 31, 2017, and incorporated herein by reference).Namibia
10.42 Petroleum Agreement between the Government of the Republic of Namibia and SignetPetroleum Limited Cricket Investments (PTY) LTD National Petroleum Corporation ofNamibia (Block 2914B) dated June 2011 (filed as Exhibit 10.42 to the Company’s AnnualReport on Form 10-K of the year ended December 31, 2018, and incorporated herein byreference).
10.43 Addendum to Petroleum Agreement between The Government of the Republic of Namibiaand Shell Namibia Upstream B.V. and National Petroleum Corporation of Namibia datedJune 17, 2011 (filed as Exhibit 10.43 to the Company’s Annual Report on Form 10-K of theyear ended December 31, 2018, and incorporated herein by reference).
10.44 Addendum II to Petroleum Agreement between The Government of the Republic ofNamibia and Shell Namibia Upstream B.V. and National Petroleum Corporation ofNamibia dated June 17, 2011 (filed as Exhibit 10.44 to the Company’s Annual Report onForm 10-K of the year ended December 31, 2018, and incorporated herein by reference).South Africa
10.45 Exploration Right Contract relating to the Northern Cape Ultra Deep Block OffshoreSouth Africa between the Republic of South Africa and OK Energy Limited datedJanuary 10, 2019 (filed as Exhibit 10.1 to the Company’s Quarterly Report on Form 10-Qfor the quarter ended September 30, 2019, and incorporated herein by reference).Greater Tortue Ahmeyim
10.46*†† Agreement for a Long Term Sale and Purchase of LNG, dated February 11, 2020, betweenLA Societe Mauritanienne des Hydrocarbures et de Patrimoine Minier, BP MauritaniaInvestments Limited, Kosmos Energy Investments Limited, La Societe des Petroles duSenegal, BP Senegal Investments Limited, Kosmos Energy Investments Senegal Limited andBP Gas Marketing Limited
161

ExhibitNumber Description of Document
Financing Agreements10.47 Indenture, dated as of April 4, 2019, among the Company, the guarantors names therein,
Wilmington Trust, National Association, as trustee, transfer agent, registrar and payingagent and Banque Internationale à Luxembourg S.A., as Luxembourg listing agent, transferagent and paying agent (including the Form of Notes) (filed as Exhibit 4.1 to the Company’sCurrent Report on Form 8-K filed April 4, 2019 (File No. 001-35167), and incorporatedherein by reference).
10.48 Deed of Amendment and Restatement relating to the Facility Agreement, dated February 5,2018 among Kosmos Energy Finance International, Kosmos Energy Operating, KosmosEnergy International, Kosmos Energy Development, Kosmos Energy Ghana HC, KosmosEnergy Senegal, Kosmos Energy Mauritania, Kosmos Energy Equatorial Guinea, KosmosEnergy Investments Senegal Limited, BNP Paribas and Standard Chartered Bank (filed asExhibit 10.10 to the Company’s Quarterly Report on Form 10-Q for the quarter endedMarch 31, 2018, and incorporated herein by reference).
10.49 Amended and Restated Revolving Credit Facility Agreement, dated August 6, 2018, amongKosmos Energy Ltd., as Original Borrower, certain of its subsidiaries listed therein, asGuarantors, ING Bank N.V., as Facility Agent, Crédit Agricole Corporate and InvestmentBank, as Security and Intercreditor Agent, and the financial institutions listed therein, asLenders (filed as Exhibit 1.1 to the Company’s Current Report on Form 8-K filed August 7,2018 (File No. 001-35167), and incorporated herein by reference).Agreements with Shareholders and Directors
10.50 Form of Director Indemnification Agreement (filed as Exhibit 10.27 to the Company’sRegistration Statement on Form S-1/A filed April 14, 2011 (File No. 333-171700), andincorporated herein by reference).
10.51 Shareholders Agreement, dated as of May 10, 2011, among Kosmos Energy Ltd. and theother parties signatory thereto (filed as Exhibit 9.1 to the Company’s Annual Report onForm 10-K for the year ended December 31, 2012, and incorporated herein by reference)(the “Shareholders Agreement”).
10.52 Amended and Restated Registration Rights Agreement, dated as of October 7, 2009, amongKosmos Energy Holdings and the other parties signatory thereto (filed as Exhibit 10.32 tothe Company’s Annual Report on Form 10-K for the year ended December 31, 2012, andincorporated herein by reference).
10.53 Joinder Agreement to the Registration Rights Agreement, dated as of May 10, 2011, amongKosmos Energy Ltd. and the other parties signatory thereto (filed as Exhibit 10.33 to theCompany’s Annual Report on Form 10-K for the year ended December 31, 2012, andincorporated herein by reference).
10.54 Amendment No. 1 to the Registration Rights Agreement, dated as of February 8, 2013,among Kosmos Energy Ltd. and the other parties signatory thereto (filed as Exhibit 10.34to the Company’s Annual Report on Form 10-K for the year ended December 31, 2012, andincorporated herein by reference).Management Contracts/Compensatory Plans or Arrangements
10.55† Long Term Incentive Plan (filed as Exhibit 99.1 to the Company’s Registration Statement onForm S-8 filed May 16, 2011 (File No. 333-174234), and incorporated herein by reference).
10.56† Long Term Incentive Plan (amended and restated as of January 23, 2015) (filed asExhibit 99 to the Company’s Registration Statement on Form S-8 filed October 2, 2015 (FileNo. 333-207259), and incorporated herein by reference).
162

ExhibitNumber Description of Document
10.57† Long Term Incentive Plan (amended and restated as of January 23, 2017) (filed asExhibit 10.64 to the Company’s Annual Report on Form 10-K for the year endedDecember 31, 2016, and incorporated herein by reference).
10.58† Long Term Incentive Plan (amended and restated as of March 27, 2018) (filed as Exhibit 99to the Company’s Registration Statement on Form S-8 filed November 15, 2018 (FileNo. 333-207259), and incorporated herein by reference).
10.59† Annual Incentive Plan (filed as Exhibit 10.22 to the Company’s Registration Statement onForm S-1/A filed March 30, 2011 (File No. 333-171700), and incorporated herein byreference).
10.60† Form of Restricted Stock Award Agreement (Service-Vesting) (filed as Exhibit 10.50 to theCompany’s Annual Report on Form 10-K for the year ended December 31, 2014, andincorporated herein by reference).
10.61† Form of Restricted Stock Award Agreement (Performance-Vesting) (filed as Exhibit 10.51to the Company’s Annual Report on Form 10-K for the year ended December 31, 2014, andincorporated herein by reference).
10.62† Form of RSU Award Agreement (Service-Vesting) (filed as Exhibit 10.52 to the Company’sAnnual Report on Form 10-K for the year ended December 31, 2014, and incorporatedherein by reference).
10.63† Form of RSU Award Agreement (Performance-Vesting) (filed as Exhibit 10.13 to theCompany’s Quarterly Report on Form 10-Q for the quarter ended March 31, 2015, andincorporated herein by reference).
10.64† Form of Directors RSU Award Agreement (Service-Vesting) (filed as Exhibit 10.54 to theCompany’s Annual Report on Form 10-K for the year ended December 31, 2014, andincorporated herein by reference).
10.65† Offer Letter, dated September 1, 2011, between Kosmos Energy, LLC and Jason Doughty(filed as Exhibit 10.1 to the Company’s Quarterly Report on Form 10-Q for the quarterended June 30, 2014, and incorporated herein by reference).
10.66† Offer Letter, dated May 22, 2013, between Kosmos Energy, LLC and Christopher Ball (filedas Exhibit 10.2 to the Company’s Quarterly Report on Form 10-Q for the quarter endedJune 30, 2014, and incorporated herein by reference).
10.67† Offer Letter, dated January 10, 2014, between Kosmos Energy, LLC and Andrew Inglis(filed as Exhibit 10.58 to the Company’s Annual Report on Form 10-K for the year endedDecember 31, 2013, and incorporated herein by reference).
10.68† Assignment Agreement, dated April 16, 2014, between Kosmos Energy, LLC and Brian F.Maxted (filed as Exhibit 10.3 to the Company’s Quarterly Report on Form 10-Q for thequarter ended June 30, 2014, and incorporated herein by reference).
10.69† Exit Agreement between Kosmos Energy, LLC and Brian F. Maxted dated March 1, 2019(filed as Exhibit 10.1 to the Company’s Quarterly Report on Form 10-Q for the quarterended March 31, 2019, and incorporated herein by reference).
10.70† Offer Letter between Kosmos Energy Gulf of Mexico, LLC and Richard R. Clark datedAugust 3, 2018 (filed as Exhibit 10.3 to the Company’s Quarterly Report on Form 10-Q forthe quarter ended March 31, 2019, and incorporated herein by reference).
10.71† Offer Letter, dated October 16, 2014, between Kosmos Energy, LLC and Thomas P.Chambers (filed as Exhibit 10.60 to the Company’s Annual Report on Form 10-K for theyear ended December 31, 2014, and incorporated herein by reference).
163

ExhibitNumber Description of Document
10.72† Kosmos Energy Ltd. Change in Control Severance Policy for U.S. Employees, datedDecember 19, 2013 (filed as Exhibit 10.66 to the Company’s Annual Report on Form 10-Kfor the year ended December 31, 2013, and incorporated herein by reference).
10.73†* Offer Letter, dated November 12, 2019, between Kosmos Energy, LLC and Ronald GlassDGE Acquisition
10.74 Securities Purchase Agreement by and among DGE Group Series Holdco, LLC, and each ofits three designated series, DGE Group Series Holdco, LLC, Series I, DGE GroupSeries Holdco, LLC, Series, II, DGE Group Series Holdco, LLC, Series III, and KosmosEnergy Gulf of Mexico, LLC dated August 3, 2018 (filed as Exhibit 10.1 to the Company’sQuarterly Report on Form 10-Q filed November 5, 2018 (File No. 001-35167), andincorporated herein by reference).Other Exhibits
14.1 Code of Business Conduct and Ethics (filed as Exhibit 14.1 to the Company’s AnnualReport on Form 10-K for the year ended December 31, 2011, and incorporated herein byreference).
21.1* List of Subsidiaries.23.1* Consent of Ernst & Young LLP.23.2* Consent of Ryder Scott Company, L.P.31.1* Certification of Chief Executive Officer Pursuant to Section 302 of the Sarbanes-Oxley Act
of 2002.31.2* Certification of Chief Financial Officer Pursuant to Section 302 of the Sarbanes-Oxley Act
of 2002.32.1** Certification of Chief Executive Officer Pursuant to Section 906 of the Sarbanes-Oxley Act
of 2002.32.2** Certification of Chief Financial Officer Pursuant to Section 906 of the Sarbanes-Oxley Act
of 2002.99.1* Report of Ryder Scott Company, L.P.—Ghana, Equatorial Guinea, U.S. Gulf of Mexico
12-31-1999.2* Report of Ryder Scott Company, L.P.—GTA 1-31-2020
101.INS* XBRL Instance Document.101.SCH* XBRL Taxonomy Extension Schema Document.101.CAL* XBRL Taxonomy Extension Calculation Linkbase Document.101.LAB* XBRL Taxonomy Extension Label Linkbase Document.101.PRE* XBRL Taxonomy Extension Presentation Linkbase Document.101.DEF* XBRL Taxonomy Extension Definition Linkbase Document.
* Filed herewith.** Furnished herewith.† Management contract or compensatory plan or arrangement.† † Certain confidential portions of this Exhibit have been omitted pursuant to Item 601(b) of
Regulation S-K because the identified confidential portions (i) are not material and (ii) would becompetitively harmful if publicly disclosed.
164

CORPORATE LEADERSHIP
CORPORATE INFORMATION
BOARD OF DIRECTORS
ANDREW G. INGLIS
Chairman of the Board of Directors
Chief Executive Officer
SIR RICHARD B. DEARLOVE
Retired Head of the British Secret Intelligence
Service (MI6)
ADEBAYO O. OGUNLESI
Chairman and Managing Partner,
Global Infrastructure Partners
DEANNA L. GOODWIN
Director, Arcadis NV
Director, Oceaneering International Inc.
LISA DAVIS Director, Penske Automotive Group, Inc.
Director, Air Products and Chemicals, Inc.
STEVEN M. STERIN Director, DuPont de Nemours, Inc.
Senior External Advisor, McKinsey & Company
SENIOR LEADERSHIP
ANDREW G. INGLIS
Chairman of the Board of Directors
Chief Executive Officer
CHRISTOPHER J. BALL
Senior Vice President and Chief Commercial Officer
THOMAS P. CHAMBERS
Senior Vice President and Chief Financial Officer
RICHARD R. CLARK
Senior Vice President and Head of Gulf of
Mexico Business Unit
JASON E. DOUGHTY Senior Vice President, General Counsel and
Corporate Secretary
RONALD GLASS Vice President and Chief Accounting Officer
PRIMARY OFFICE
Kosmos Energy Ltd.
c/o Kosmos Energy LLC
8176 Park Lane
Suite 500
Dallas, TX 75231
REGISTERED OFFICE
Kosmos Energy Ltd.
Corporation Trust Center
1209 Orange Street
Wilmington, DE 19801
WEBSITE
www.kosmosenergy.com
STOCK EXCHANGE LISTING
New York Stock Exchange
London Stock Exchange
Symbol: KOS
ANNUAL MEETING*
June 10, 2020
8:00 a.m. Eastern Daylight Time
Four Seasons Hotel
57 East 57th Street
New York, NY 10022
FORM 10-K
Copies of the corporation’s 10-K
are available on our website at
www.kosmosenergy.com
AUDITORS
Ernst & Young
Dallas, TX
SHAREHOLDER SERVICES
Computershare
250 Royall Street
Canton, MA 02021
1-800-962-4284 (Toll-Free)
1-781-575-3120 (International)
INVESTOR RELATIONS
Additional corporate information
is available on our website at
www.kosmosenergy.com
* We are actively monitoring the public health and travel concerns relating to the coronavirus (COVID-19) and the protocols that federal, state
and local governments may impose. In the event that it is not possible or advisable to hold the annual stockholders meeting in person, we will
announce alternative arrangements, which may include holding the meeting solely by means of remote communication. Any such change,
including details on how to participate in a remote meeting, would be announced in advance via press release, a copy of which would be filed
with the SEC as additional proxy solicitation materials and posted on our website at www.kosmosenergy.com.

FORWARD-LOOKING STATEMENTS
This annual report contains forward-looking
statements within the meaning of Section
27A of the Securities Act of 1933 and
Section 21E of the Securities Exchange
Act of 1934. All statements, other than
statements of historical facts, included in
this report that address activities, events
or developments that Kosmos Energy Ltd.
(“Kosmos” or the “Company”) expects,
believes or anticipates will or may occur in
the future are forward-looking statements.
Without limiting the generality of the
foregoing, forward-looking statements
contained in this report specifically include
the expectations of management regarding
plans, strategies, objectives, anticipated
financial and operating results of the
Company, including as to estimated oil and
gas in place and recoverability of the oil
and gas, estimated reserves and drilling
locations, capital expenditures, typical well
results and well profiles and production
and operating expenses guidance included
in the report. The Company’s estimates
and forward-looking statements are mainly
based on its current expectations and
estimates of future events and trends, which
affect or may affect its businesses and
operations. Although the Company believes
that these estimates and forward-looking
statements are based upon reasonable
assumptions, they are subject to several
risks and uncertainties and are made in
light of information currently available to
the Company. When used in this report,
the words “anticipate,” “believe,” “intend,”
“expect,” “plan,” “will” or other similar words
are intended to identify forward-looking
statements. Such statements are subject
to a number of assumptions, risks and
uncertainties, many of which are beyond
the control of the Company, which may
cause actual results to differ materially from
those implied or expressed by the forward-
looking statements. Further information on
such assumptions, risks and uncertainties is
available in the Company’s Securities and
Exchange Commission (“SEC”) filings. The
Company’s SEC filings are available on the
Company’s website at www.kosmosenergy.
com. Kosmos undertakes no obligation
and does not intend to update or correct
these forward-looking statements to reflect
events or circumstances occurring after
the date of this presentation, whether as a
result of new information, future events or
otherwise, except as required by applicable
law. You are cautioned not to place
undue reliance on these forward-looking
statements, which speak only as of the date
of this presentation. All forward-looking
statements are qualified in their entirety by
this cautionary statement.
CAUTIONARY STATEMENTS REGARDING OIL AND GAS QUANTITIES
The SEC permits oil and gas companies,
in their filings with the SEC, to disclose
only proved, probable and possible reserves
that meet the SEC’s definitions for such
terms, and price and cost sensitivities for
such reserves, and prohibits disclosure
of resources that do not constitute such
reserves. The Company uses terms in this
report, such as “discovered resources,”
“potential,” “significant resource upside,”
“resource,” “net resources,” “recoverable
resources,” “discovered resource,” “world-
class discovered resource,” “significant
defined resource,” “gross unrisked resource
potential,” “defined growth resources,”
“recovery potential” and similar terms or
other descriptions of volumes of reserves
potentially recoverable that the SEC’s
guidelines strictly prohibit the Company
from including in filings with the SEC.
These estimates are by their nature more
speculative than estimates of proved,
probable and possible reserves and
accordingly are subject to substantially
greater risk of being actually realized.
Investors are urged to consider closely
the disclosures and risk factors in the
Company’s SEC filings, available on the
Company’s website at www.kosmosenergy.
com. Potential drilling locations and
resource potential estimates have not been
risked by the Company. Actual locations
drilled and quantities that may be ultimately
recovered from the Company’s interest may
differ substantially from these estimates.
There is no commitment by the Company
to drill all of the drilling locations that have
been attributed these quantities. Factors
affecting ultimate recovery include the
scope of the Company’s ongoing drilling
program, which will be directly affected
by the availability of capital, drilling and
production costs, availability of drilling and
completion services and equipment, drilling
results, agreement terminations, regulatory
approval and actual drilling results, including
geological and mechanical factors affecting
recovery rates. Estimates of reserves and
resource potential may change significantly
as development of the Company’s oil and
gas assets provides additional data.
NON-GAAP FINANCIAL
MEASURES
EBITDAX, Adjusted net income (loss) and
Adjusted net income (loss) per share are
supplemental non-GAAP financial measures
used by management and external users
of the Company’s consolidated financial
statements, such as industry analysts,
investors, lenders and rating agencies.
The Company defines EBITDAX as net
income (loss) plus (i) exploration expense,
(ii) depletion, depreciation and amortization
expense, (iii) equity based compensation
expense, (iv) unrealized (gain) loss on
commodity derivatives (realized losses
are deducted and realized gains are
added back), (v) (gain) loss on sale of oil
and gas properties, (vi) interest (income)
expense, (vii) income taxes, (viii) loss
on extinguishment of debt, (ix) doubtful
accounts expense and (x) similar other
material items which management believes
affect the comparability of operating results.
The Facility EBITDAX definition includes
50% of the EBITDAX adjustments of
Kosmos-Trident International Petroleum Inc.
The Company defines adjusted net income
(loss) as net income (loss) after adjusting
for the impact of certain non-cash and non-
recurring items, including non-cash changes
in the fair value of derivative instruments,
cash settlements on commodity derivatives,
gain on sale of assets, and other similar non-
cash and non-recurring charges, and then
the non-cash and related tax impacts in the
same period.
We believe that EBITDAX, Adjusted net
income (loss), and Adjusted net income
(loss) per share and other similar measures
are useful to investors because they are
frequently used by securities analysts,
investors and other interested parties in
the evaluation of companies in the oil and
gas sector and will provide investors with a
useful tool for assessing the comparability
between periods, among securities analysts,
as well as company by company. Because
EBITDAX, Adjusted net income (loss),
and Adjusted net income (loss) per share
excludes some, but not all, items that affect
net income, these measures as presented by
us may not be comparable to similarly titled
measures of other companies.


KO
SM
OS
EN
ER
GY
20
19 A
NN
UA
L R
EP
OR
T


![Kosmos Ppt[1]](https://img.pdfslide.us/doc/110x75/54693d9daf7959637e8b4838/kosmos-ppt1.jpg)