Embed Size (px)
Citation preview

Bayside City Council
2019 Annual Community Satisfaction Survey
April 2019
Prepared for:
Bayside City Council
Prepared by:
Metropolis Research ABN 39 083 090 993

Bayside City Council – 2019 Annual Community Satisfaction Survey
Page 2 of 152
© Bayside City Council, 2019 This work is copyright. Apart from any use permitted under the Copyright Act 1968, no part may be reproduced by any process without written permission from the Communications, Customer and Cultural Services, Bayside City Council.
© Metropolis Research Pty Ltd, 2019 The survey form utilised in the commission of this project and the Governing Melbourne results are copyright. Apart from any use permitted under the Copyright Act 1968, no part may be reproduced by any process without written permission from the Managing Director Metropolis Research Pty Ltd.
Disclaimer Any representation, statement, opinion or advice, expressed or implied in this publication is made in good faith but on the basis that Metropolis Research Pty Ltd, its agents and employees are not liable (whatever by reason of negligence, lack of care or otherwise) to any person for any damages or loss whatsoever which has occurred or may occur in relation to that person taking action in respect of any representation, statement, or advice referred to above.
Contact Details This report was prepared by Metropolis Research Pty Ltd on behalf of the Bayside City Council. For more information, please contact:
Dale Hubner Managing Director Metropolis Research Pty Ltd P O Box 1357 CARLTON VIC 3053 (03) 9272 4600 [email protected]
Jenny Grogan
Research Officer Communications, Customer & Cultural Services Bayside City Council 76 Royal Avenue SANDRINGHAM VIC 3191 (03) 9599 4452 [email protected]

Bayside City Council – 2019 Annual Community Satisfaction Survey
Page 3 of 152
Table of contents
INTRODUCTION............................................................................................................................................ 6
RATIONALE ............................................................................................................................................................ 6 METHODOLOGY ...................................................................................................................................................... 7 RESPONSE RATE AND STATISTICAL STRENGTH ................................................................................................................ 7 GOVERNING MELBOURNE ........................................................................................................................................ 8 SURVEY CONTENT ................................................................................................................................................... 8 GLOSSARY OF TERMS ............................................................................................................................................... 8
EXECUTIVE SUMMARY ............................................................................................................................... 10
COUNCIL’S OVERALL PERFORMANCE .......................................................................................................... 14
OVERALL PERFORMANCE BY RESPONDENT PROFILE ....................................................................................................... 16 REASONS FOR LEVEL OF SATISFACTION WITH COUNCIL’S OVERALL PERFORMANCE .............................................................. 20
LEADERSHIP AND GOVERNANCE ................................................................................................................ 25
COMMUNITY CONSULTATION AND ENGAGEMENT ........................................................................................................ 27 RESPONSIVENESS OF COUNCIL ................................................................................................................................. 29 REPRESENTATION, LOBBYING AND ADVOCACY ............................................................................................................. 30
Examples of Council advocacy ..................................................................................................................... 31 MAINTAINING TRUST AND CONFIDENCE OF LOCAL COMMUNITY ...................................................................................... 32 MAKING DECISIONS IN THE INTERESTS OF THE COMMUNITY ........................................................................................... 33
COUNCIL’S ADVOCACY TO OTHER LEVELS OF GOVERNMENT ...................................................................... 34
BAYSIDE COUNCIL AS AN ORGANISATION .................................................................................................. 39
CURRENT ISSUES FOR THE CITY OF BAYSIDE ............................................................................................... 42
ISSUES BY PRECINCT ............................................................................................................................................... 46 ISSUES BY RESPONDENT PROFILE ............................................................................................................................... 49 CORRELATION BETWEEN ISSUES AND SATISFACTION WITH COUNCIL’S OVERALL PERFORMANCE ............................................. 52
PLANNING AND POPULATION .................................................................................................................... 53
PLANNING FOR POPULATION GROWTH ...................................................................................................................... 53 Concerns you most about population growth in the municipality .............................................................. 58
PLANNING AND HOUSING DEVELOPMENT ................................................................................................................... 61 Appearance and quality of new developments ........................................................................................... 63 Examples of and comments about specific developments .......................................................................... 65 Reasons for dissatisfaction with aspects of planning and housing development ....................................... 66
TRANSPORT ............................................................................................................................................... 69
TRAFFIC AND PARKING ........................................................................................................................................... 69 VOLUME OF TRAFFIC .............................................................................................................................................. 71 SPEED OF TRAFFIC ................................................................................................................................................. 72
Reasons for dissatisfaction with the speed of traffic .................................................................................. 74 AVAILABILITY OF PARKING ....................................................................................................................................... 74 YOUR SAFETY WHILST TRAVELLING ............................................................................................................................ 75
Reasons for feeling unsafe whilst travelling on residential streets ............................................................. 77 Reasons for feeling unsafe whilst travelling on main roads ........................................................................ 77
METHOD OF TRAVEL TO THE DESTINATIONS ................................................................................................................ 78 Reasons for driving to the destinations ....................................................................................................... 79 Aspects encouraging you to walk or cycle ................................................................................................... 80
COMMUNITY ............................................................................................................................................. 82
VOLUNTEERING .................................................................................................................................................... 82 SENSE OF COMMUNITY / HEALTH AND WELLBEING ....................................................................................................... 84
Active community participation .................................................................................................................. 85 Alcohol consumption ................................................................................................................................... 87 Strong sense of belonging to a community ................................................................................................. 89 Adequate community services available in the local area .......................................................................... 91

Bayside City Council – 2019 Annual Community Satisfaction Survey
Page 4 of 152
Online safety ............................................................................................................................................... 93 PERCEPTION OF GENERAL HEALTH ............................................................................................................................ 94 COPING WITH EXTREME WEATHER ............................................................................................................................ 98 COMMUNITY ENGAGEMENT .................................................................................................................................. 100
Active member of club or community group ............................................................................................. 100 Sit on a community group board or committee ........................................................................................ 101 Satisfaction with community connections ................................................................................................. 103
ENGAGEMENT AND CONTACT WITH COUNCIL ........................................................................................... 106
ENGAGING WITH COUNCIL IN THE LAST TWELVE MONTHS ............................................................................................ 106 PREFERRED METHOD OF CONTACTING COUNCIL ........................................................................................................ 107 SATISFACTION WITH COUNCIL’S CUSTOMER SERVICE .................................................................................................. 108 OBTAINED REQUIRED INFORMATION VIA DIGITAL OR ONLINE ........................................................................................ 111
IMPORTANCE OF AND SATISFACTION WITH COUNCIL SERVICES ................................................................. 112
IMPORTANCE OF COUNCIL SERVICES AND FACILITIES ................................................................................................... 112 SATISFACTION WITH COUNCIL SERVICES AND FACILITIES .............................................................................................. 114 IMPORTANCE AND SATISFACTION CROSS TABULATION ................................................................................................. 117 CORRELATION BETWEEN SATISFACTION WITH SERVICES AND FACILITIES AND OVERALL SATISFACTION .................................... 118 SATISFACTION BY BROAD SERVICE AREAS .................................................................................................................. 120 RECREATION SERVICES AND FACILITIES ..................................................................................................................... 122
Local library ............................................................................................................................................... 122 On and off-road bike paths ....................................................................................................................... 123 Art Centres ................................................................................................................................................ 123 Sports grounds and ovals .......................................................................................................................... 124 Recreation and Aquatic facilities ............................................................................................................... 124
COMMUNITY ...................................................................................................................................................... 125 Services for children from birth to 5 years of age ..................................................................................... 125 Services for youth ...................................................................................................................................... 126 Services for older people ........................................................................................................................... 127 Services for people with a disability .......................................................................................................... 128
WASTE ............................................................................................................................................................. 129 Maintenance and cleaning of strips shopping areas ................................................................................. 129 Weekly garbage collection ........................................................................................................................ 130 Regular recycling ....................................................................................................................................... 130 Green waste collection .............................................................................................................................. 131 Hard rubbish booking / pick up service ..................................................................................................... 131 Council meeting its environmental responsibilities ................................................................................... 132
COMMUNICATIONS ............................................................................................................................................. 134 Council’s website ....................................................................................................................................... 134
INFRASTRUCTURE ................................................................................................................................................ 135 Maintenance and repairs of sealed local roads ........................................................................................ 136 Maintenance and repair of drains ............................................................................................................. 136 Maintenance and repair of footpaths ....................................................................................................... 137 Maintenance and cleaning of public areas ............................................................................................... 137 Public toilets .............................................................................................................................................. 138 Provision and maintenance of street trees................................................................................................ 138 Provision and maintenance of parks, gardens and reserves ..................................................................... 139 Appearance of beach and foreshore and bushland................................................................................... 140
LOCAL LAWS ...................................................................................................................................................... 140 Animal management ................................................................................................................................. 141 Parking enforcement ................................................................................................................................. 141
RESPONDENT PROFILE .............................................................................................................................. 143
AGE STRUCTURE ................................................................................................................................................. 143 GENDER ............................................................................................................................................................ 143 LANGUAGE SPOKEN AT HOME ................................................................................................................................ 144 HOUSEHOLD STRUCTURE ...................................................................................................................................... 145

Bayside City Council – 2019 Annual Community Satisfaction Survey
Page 5 of 152
HOUSEHOLD MEMBER WITH A DISABILITY ................................................................................................................. 145 DOG OR CAT OWNERS .......................................................................................................................................... 146 CURRENT HOUSING SITUATION .............................................................................................................................. 146 DWELLING TYPE .................................................................................................................................................. 147 PERIOD OF RESIDENCE IN THE CITY OF BAYSIDE ......................................................................................................... 147
GENERAL COMMENTS ............................................................................................................................... 148
APPENDIX ONE: SURVEY FORM ................................................................................................................. 152

Bayside City Council – 2019 Annual Community Satisfaction Survey
Page 6 of 152
Introduction
Metropolis Research Pty Ltd was commissioned by Bayside City Council to undertake this, its second Annual Community Satisfaction Survey.
The survey has been designed to measure community satisfaction with a range of Council services and facilities as well as to measure community sentiment on a range of additional issues of concern in the municipality. The 2019 survey comprises the following:
• Satisfaction with Council’s overall performance and change in performance
• Satisfaction with aspects of leadership and governance
• Importance of and satisfaction with twenty-six Council services and facilities
• Issues of importance to address in Bayside in the coming year
• Satisfaction with Council’s advocacy to other levels of government
• Agreement with statements about Bayside Council as an organisation
• Satisfaction with planning for population growth by all levels of government
• Satisfaction with aspects of planning and development
• Satisfaction with aspects of traffic and parking, and use of sustainable transport
• Engagement with Council, and satisfaction with aspects of Council’s customer service
• Questions around the sense of community, community connections, and volunteering
• A number of questions around health and wellbeing
• Question about resources and a plan for coping with extreme weather events
• Respondent profile.
Rationale
The Annual Community Satisfaction Survey has been designed to provide Council with a wide range of information covering community satisfaction, community sentiment and community feel and involvement. The survey meets the requirements of the Local Government Victoria (LGV) annual satisfaction survey by providing importance and satisfaction ratings for the major Council services and facilities as well as scores for satisfaction with Council overall.
The Annual Community Satisfaction Survey provides an in-depth coverage of Council services and facilities as well as additional community issues and expectations. This information is critical to informing Council of the attitudes, levels of satisfaction and issues facing the community in the City of Bayside.
In addition, the Annual Community Satisfaction Survey includes a range of demographic and socio-economic variables against which the results can be analysed. For example, the Annual Community Satisfaction Survey includes data on age structure, gender, language spoken at home, disability, dwelling type, period of residence, and household structure. By including these variables, satisfaction scores can be analysed against these variables and individual sub-groups in the community that have issues with Council’s performance or services can be identified.

Bayside City Council – 2019 Annual Community Satisfaction Survey
Page 7 of 152
Methodology
The Bayside City Council – 2019 Annual Community Satisfaction Survey was conducted as a door-to-door interview style survey of 700 households drawn randomly from across the municipality during the months of February and March 2019. The results have been weighted by precinct to ensure that each precinct within Bayside contributes proportionally to the municipal result. The precinct weightings have been conducted using the enumerated population figures from the Australian Bureau of Statistics – 2016 Census of Population and Housing. Trained Metropolis Research survey staff conducted face-to-face interviews of approximately twenty minutes duration with householders. This methodology has produced highly consistent results in terms of the demographics of those surveyed, although it should be noted that voluntary surveys will tend to slightly over represent families, in particular parents with younger children, and can at times slightly under-represent residents who speak a language other than English. Additional steps are taken to maximise the participation of residents who speak a language other than English at home, including Metropolis Research staff conducting the interviews in other languages where appropriate and staff have the relevant language skills. The Metropolis Research fieldwork team typically speaks in the order of fifteen to twenty languages. Despite the inherent limitations of any voluntary data collection or consultation process where individual residents are not obliged to participate; the methodology developed by Metropolis Research over almost two decades provides the most effective means of including respondents from across the broad spectrum of the Bayside community.
Response rate and statistical strength
The 95% confidence interval (margin of error) of these results is plus or minus 3.7% at the fifty percent level. In other words, if a yes / no question obtains a result of fifty percent yes, it is 95% certain that the true value of this result is within the range of 46% and 54%. This is based on a total sample size of 700 respondents, and an underlying population of the City of Bayside of 104,030. A total of approximately 3,621 households were approached to participate in the Bayside City Council – 2019 Annual Community Satisfaction Survey. Of these 2,042 were unattended at the time, 876 refused to participate in the research and 703 completed surveys.
This provides a response rate of 44.5%, which is somewhat higher than the 35.9% recorded in 2018. The solid response rate reflects the strength of the door-to-door methodology in engaging effectively with the Bayside community.

Bayside City Council – 2019 Annual Community Satisfaction Survey
Page 8 of 152
Governing Melbourne
Governing Melbourne is a service provided by Metropolis Research since 2010. Governing Melbourne is a survey of 1,200 respondents drawn in equal numbers from each of the thirty-one municipalities across metropolitan Melbourne. Governing Melbourne provides an objective, consistent and reliable basis on which to compare the results of the Bayside City Council – 2019 Annual Community Satisfaction Survey. It is not intended to provide a “league table” for individual councils, rather to provide a context within which to understand the results. This report provides some comparisons against the metropolitan Melbourne average, which includes all municipalities located within the Melbourne Greater Capital City Statistical Area as well as the inner east region (Bayside, Glen Eira, Stonnington, Melbourne, Port Phillip, and Yarra).
Survey content
The survey includes a set of core questions that are included every year to provide on-going measurement of the performance of Council across an extensive list of services and facilities, aspects of governance and leadership, aspects of customer service, aspects of planning and housing development, and the performance of Council across all areas of responsibility. A core question is also included which identifies the top issues in the municipality to address at the moment. In addition to these core questions, the survey also has capacity to include a wide range of non-core questions, some of which have been included every year, such as Council’s advocacy to other levels of government, Bayside Council as an organisation, planning for population growth, and satisfaction with aspects of traffic and parking. In addition to these, the survey has also included other questions designed to meet the information requirements of Council from year to year. These questions result from extensive consultation within Council. In 2018 this includes questions around health and wellbeing, sense of community, community connections and volunteering, and resources and plan for coping with extreme weather events. Except for the very small number of questions required to the ensure the survey meets the LGPRF requirements of the state government (DELWP), the content of the survey can be customised to meet the current information requirements of Council.
Glossary of terms
Precinct
The term precinct is used by Metropolis Research to describe the small areas and in this instance reflects the official suburbs within Bayside. Readers seeking to use precinct results should seek clarification of specific precinct boundaries if necessary.

Bayside City Council – 2019 Annual Community Satisfaction Survey
Page 9 of 152
Measurable and statistically significant
A measurable difference is one where the difference between or change in results is sufficiently large to ensure that they are in fact different results, i.e. the difference is statistically significant. This is because survey results are subject to a margin of error or an area of uncertainty.
Significant result
Metropolis Research uses the term significant result to describe a change or difference between results that Metropolis Research believes to be of sufficient magnitude that they may impact on relevant aspects of policy development, service delivery and the evaluation of performance and are therefore identified and noted as significant or important.
Somewhat / notable / marginal
Metropolis Research will describe some results or changes in results as being marginally, somewhat, or notably higher or lower. These are not statistical terms rather they are interpretive. They are used to draw attention to results that may be of interest or relevant to policy development and service delivery. These terms are often used for results that may not be statistically significant due to sample size or other factors but may nonetheless provide some insight.
95% confidence interval
Average satisfaction results are presented in this report with a 95% confidence interval included. These figures reflect the range of values within which it is 95% certain that the true average satisfaction falls.
The 95% confidence interval based on a one-sample t-test is used for the mean scores presented in this report. The margin of error around the other results in this report at the municipal level is plus or minus 3.7%.
Satisfaction categories
Metropolis Research typically categorises satisfaction results to assist in the understanding and interpretation of the results. These categories have been developed over many years as a guide to the scores presented in the report and are designed to give a general context, and are defined as follows:
Excellent - scores of 7.75 and above are categorised as excellent
Very good - scores of 7.25 to less than 7.75 are categorised as very good
Good - scores of 6.5 to less than 7.25 are categorised as good
Solid - scores of 6 to less than 6.5 are categorised as solid
Poor - scores of 5.5 to less than 6 are categorised as poor
Very Poor - scores of 5 to less than 5.5 are categorised as very poor
Extremely Poor – scores of less than 5 are categorised as extremely poor.

Bayside City Council – 2019 Annual Community Satisfaction Survey
Page 10 of 152
Executive summary
Metropolis Research conducted this, Council’s second Annual Community Satisfaction Survey as a door-to-door, interview style survey of 702 respondents in March 2019. The aim of the research was to measure community satisfaction with the broad range of Council provided services and facilities, aspects of leadership and governance, aspects of planning and development, aspects of customer service, and the performance of Council across all areas of responsibility. The survey also measured the importance to the community of the twenty-six individual services and facilities, explored the top issues the community feel should be addressed in the City of Bayside at the moment, and their satisfaction with aspects of traffic and parking. In addition to these core survey components, the survey also provides an opportunity to explore a range of one-off questions to address the current information requirements of Council. In 2019 the survey included additional questions on sustainable transport, volunteering, sense of community, coping with extreme weather events, and some questions around health and wellbeing. Satisfaction with the overall performance of Bayside City Council increased measurably and significantly this year, up 5.8% from 6.92 to 7.32, and is now at a level of satisfaction categorised as “very good”. This result is measurably higher than the average for the six inner eastern region councils (7.03) and the metropolitan Melbourne average of 6.93, both as recorded in the 2019 Governing Melbourne research conducted independently by Metropolis Research. Metropolis Research notes that this is a very good level of satisfaction and is the second highest result recorded by Metropolis Research since it began measuring community satisfaction with local government in 2001. Half (50.0% up from 37.1%) of respondents were very satisfied with Council’s overall performance (rating satisfaction at eight or more out of ten), whilst just 4.8% (down from 5.8%) were dissatisfied (rating zero to four). There was some variation in this result observed across the municipality, as follows:
• Higher than average satisfaction – respondents from Hampton East, young adults (aged 20 to 34 years), senior citizens, private rental households, and new residents (less than five years in Bayside).
• Lower than average satisfaction – respondents from Brighton East, older adults (aged 60 to 74 years), long-term residents (ten years or more in Bayside), and male respondents.
Underpinning this measurable increase in satisfaction with Council’s overall performance was the increase in satisfaction with aspects of leadership and governance. There was also a significant decline this year in community concern around planning and development, and a corresponding increase in satisfaction with aspects of planning and development.

Bayside City Council – 2019 Annual Community Satisfaction Survey
Page 11 of 152
Metropolis Research does suggest that the large increase in satisfaction with planning this year may well be something of an outlier result, given the fact that concern around planning and development was such a significant factor in the community last year. Consequently a small realignment in satisfaction next year could well eventuate.
The most common reasons why the small number of respondents were dissatisfied include Council’s responsiveness to local community needs, concerns around planning and development, concern by a few respondents around the level of rates, and concern by a small number of respondents around a perceived lack of communication and consultation.
When asked their level of agreement with six statements about the Bayside City Council as an organisation, respondents agreed as follows:
• Strong Agreement – that Council provides important services that meet community needs (7.53 out of ten) and is trustworthy and reliable (7.34).
• Solid Agreement – that Council is progressive and “up-to-date” (6.88), has a sound direction for the future (6.82), is a responsible financial manager (6.68), and offers value for rates (6.28).
• Neutral – that Bayside Council is bureaucratic and ineffective (5.10).
Consistent with the increased satisfaction with Council’s overall performance and the generally positive view about Bayside City Council as an organisation, satisfaction with the six included aspects of leadership and governance also increased this year, by an average of 7.1%, up from 6.66 to 7.13, although it remains at a “good” level. Metropolis Research notes that satisfaction leadership and governance tends to be a little lower than overall satisfaction with Council, and this is the case for the City of Bayside.
Satisfaction with Council’s customer service delivery remains strong, with an average satisfaction with the six included aspects of customer service of 7.84, an increase of 2.2% on the 2018 result. This is an “excellent” level of satisfaction, up from the “very good” recorded last year. Although a direct comparison cannot be made to Governing Melbourne given slightly different wording for the customer service section, satisfaction with Council’s customer service appears to be a little higher than the metropolitan Melbourne average.
Satisfaction with the twenty-six included services and facilities provided by the Bayside City Council remains very high at 7.86 out of ten, up less than one percent this year. This is an “excellent” level of satisfaction. This result is measurably higher than the 2019 metropolitan Melbourne average satisfaction with the similar group of services and facilities of 7.48 (rated as “very good”).
Satisfaction with all the waste and recycling services, all the health and human services and the recreation and leisure services and facilities were categorised as “excellent”. Satisfaction with none of the twenty-six services or facilities were rated as “solid”, “poor” or lower.
This high level of satisfaction with Council provided services and facilities is a significant factor underpinning the high overall satisfaction with Council. That said, given the consistency of satisfaction with Council’s services and facilities, the increased overall satisfaction this year is related more to increases in satisfaction with leadership and governance and the unusually large decline in community concern around planning and development issues this year.

Bayside City Council – 2019 Annual Community Satisfaction Survey
Page 12 of 152
Despite declining substantially this year from the very high levels of concern reported in 2018, planning and development remain very significant issues in the City of Bayside. “Building, housing, planning and development” issues were the second most commonly identified issues to address in the municipality, with 20.9% identifying these issues this year, down from the extremely high 39.1% recorded last year. Despite this decline, this result is measurably higher than the metropolitan average of 7.3%. Planning and development issues were particularly prominent in Hampton East (29.3%), Hampton (28.4%), and Highett (27.6%). The decline in importance of planning and development issues is reflected in the fact that satisfaction with the seven included aspects of planning and development increased by an average of thirteen percent this year. Attention is however still drawn to satisfaction with the size, height and set-back distances of buildings (6.11) and the number of new developments (6.44) both of which were rated as “solid” this year, up from the “very poor” recorded in 2018. Community concern around planning issues, which focus in large measure on the size and number of higher density residential developments occurring in Bayside do appear to exert a mildly negative influence on these respondents’ satisfaction with Council. The fact that planning and development issues are not exerting a more negative influence on satisfaction speaks to the likely solid level of community knowledge of planning issues and the limited capacity of Council to dictate the rate and nature of development. Satisfaction with the availability of parking on both residential streets and main roads was “poor” but was consistent with the metropolitan Melbourne average. The importance of car parking issues is reinforced by the fact that car parking was the most commonly nominated issue to address in the municipality at the moment, with 21.5% up from 18.0% raising these issues. This result is higher than the metropolitan Melbourne average of 14.6%. Respondents that raised car parking as an issue to address at the moment were on average mildly less satisfied with Council’s overall performance than the average, suggesting that the issue exerts a mildly negative influence on community satisfaction with Council’s overall performance. Unlike many other variables in the survey this year, there was no increase in satisfaction with the availability of car parking recorded. Traffic management issues remain significant in the City of Bayside, with 14.8% (14.3% in 2018) identifying these as issues to address in the municipality at the moment. These results are consistent with the relatively modest levels of satisfaction with the volume and speed of traffic on both main roads and residential streets. There were however measurable increases this year in satisfaction with the volume of traffic on both main roads and residential streets. Metropolis Research notes however that respondents raising traffic management as an issue in the City of Bayside were on average no less satisfied with Council’s overall performance than the average, which implies that traffic management is not exerting a significant negative influence on satisfaction with Council. This may reflect the fact that the community is aware of the limitations of Council in addressing the volume of traffic on main roads.

Bayside City Council – 2019 Annual Community Satisfaction Survey
Page 13 of 152
It is also noted that most respondents felt very safe whilst travelling on both residential streets and main roads, with average satisfaction scores with safety whilst travelling of 7.55 for residential streets and 7.64 for main roads. This implies that community concern over traffic is not generally safety related. The survey this year included a number of questions around community engagement and the sense of community, and volunteering. A little less than half (43.3%) were active members of a club or community group, a little more than one-fifth (21.1% down from 30.4%) of respondents were volunteers, and 13.4% sat on a community group board or committee. The overwhelming majority of respondents were satisfied with their own “community connections”, with an average satisfaction of 7.47 out of ten. There was strong agreement that “there are adequate community services available in the local area” (7.46) and moderate agreement that “I feel a strong sense of belonging to a community” (6.88). A little more than one-third (37.0%) of respondents agreed that they “play an active role in my community”. Four-fifths (80.2%) of respondents agree that they feel safe online using the internet, although it is noted that this result declines substantially for older adults and senior citizens. Almost ninety percent (87.7%) of respondents believe that their household “has its own resources and a plan to cope with extreme weather events”. Whilst this result was high across the municipality, it is noted that approximately one-fifth of the one-parent family respondents did not have the resources and a plan in place to cope with extreme weather events. The perception of physical (8.25) and mental (8.75) health was very high, with just 2.3% of respondents rating their physical health and 0.6% rating their mental health as poor or very poor. In summary the Annual Community Satisfaction Survey has found that the Bayside community is measurably more satisfied with Council’s overall performance this year than last, and at a historically high level, despite community concern around planning and development, car parking, and traffic congestion in the municipality. The decline in community focus and dissatisfaction with planning and development outcomes this year is somewhat unexpected and is a significant factor underpinning many results in this report this year. The very high levels of satisfaction with Council provided services and facilities is a strong positive influence on overall satisfaction, as is the high level of satisfaction with customer service.

Bayside City Council – 2019 Annual Community Satisfaction Survey
Page 14 of 152
Council’s overall performance
Respondents were asked:
“On a scale of 0 (lowest) to 10 (highest), can you please rate your personal level of satisfaction with the performance of Council across all areas of responsibility?”
Satisfaction with the performance of Council across all areas of responsibility (overall satisfaction) increased measurably and significantly this year, up 5.8% to 7.32.
This level of satisfaction is best categorised as “very good”, an improvement on the “good” level recorded last year.
This is a significant increase this year, reflected not only in relation to overall performance, but also in relation to most aspects of leadership and governance, as well as stronger levels of agreement with the positively-worded statements about Council. Satisfaction with the core issue of planning and development increased substantially this year, coupled with a halving in the proportion of respondents raising planning issues as the most important to address in the municipality.
By way of comparison, the 2019 Governing Melbourne research conducted independently by Metropolis Research recorded overall satisfaction with local government in metropolitan Melbourne at 6.93, and the overall satisfaction with the inner eastern region councils was 7.03. These results were both measurably lower than the City of Bayside 2019 result of 7.32.
Consistent with the statistically significant increase in average satisfaction with Council, the proportion of respondents “very satisfied” (i.e. rating satisfaction at eight or more out of ten), increased substantially from a little more than one-third (37.1%) of respondents, to half (50.0%) this year.
6.927.32
0
1
2
3
4
5
6
7
8
9
10
2018 2019
Satisfaction with Council's overall performanceBayside City Council - 2019 Annual Community Satisfaction Survey
scale from 0 (very dissatisfied) to 10 (very satisfied)

Bayside City Council – 2019 Annual Community Satisfaction Survey
Page 15 of 152
It is interesting to note that the proportion of respondents dissatisfied (rating zero to four) with Council’s overall performance declined only marginally, down from 5.8% to 4.8%.
Bearing in mind the small precinct sample size of approximately 78 respondents per precinct, there was no statistically significant measurable variation in satisfaction with Council’s overall performance observed across the municipality.
5.8% 4.8%
57.1%45.2%
37.1%50.0%
-40%
-20%
0%
20%
40%
60%
80%
100%
2018 2019
Satisfaction with Council's overall performanceBayside City Council - 2019 Annual Community Satisfaction Survey
(Percent of respondents providing a response)
Very satisfied
Neutral to somewhat satisfied
Dissatisfied
7.60 7.51 7.42 7.40 7.39 7.34 7.32 7.22 7.13 7.03 7.03 6.93
0
1
2
3
4
5
6
7
8
9
10
Satisfaction with Council's overall performance by precinctBayside City Council - 2019 Annual Community Satisfaction Survey
scale from 0 (very dissatisfied) to 10 (very satisfied)
Bayside City Council – 2019 Annual Community Satisfaction Survey
Page 16 of 152
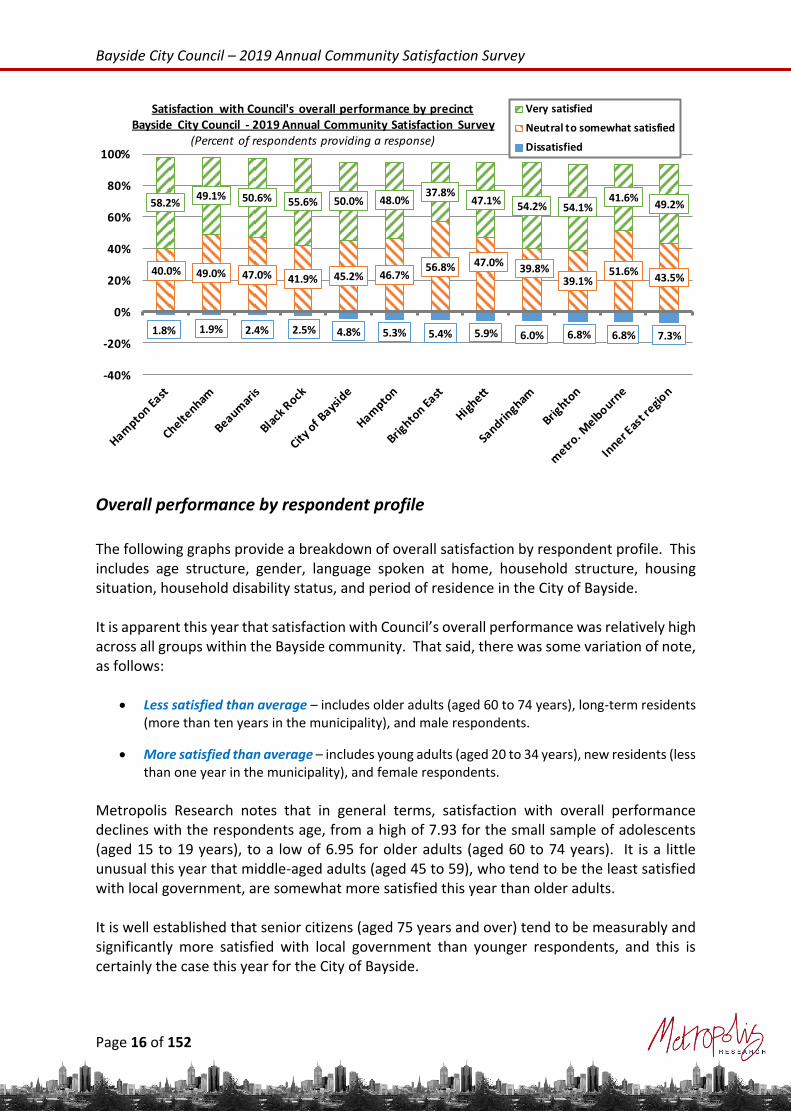
Overall performance by respondent profile
The following graphs provide a breakdown of overall satisfaction by respondent profile. This includes age structure, gender, language spoken at home, household structure, housing situation, household disability status, and period of residence in the City of Bayside. It is apparent this year that satisfaction with Council’s overall performance was relatively high across all groups within the Bayside community. That said, there was some variation of note, as follows:
• Less satisfied than average – includes older adults (aged 60 to 74 years), long-term residents (more than ten years in the municipality), and male respondents.
• More satisfied than average – includes young adults (aged 20 to 34 years), new residents (less than one year in the municipality), and female respondents.
Metropolis Research notes that in general terms, satisfaction with overall performance declines with the respondents age, from a high of 7.93 for the small sample of adolescents (aged 15 to 19 years), to a low of 6.95 for older adults (aged 60 to 74 years). It is a little unusual this year that middle-aged adults (aged 45 to 59), who tend to be the least satisfied with local government, are somewhat more satisfied this year than older adults. It is well established that senior citizens (aged 75 years and over) tend to be measurably and significantly more satisfied with local government than younger respondents, and this is certainly the case this year for the City of Bayside.
1.8% 1.9% 2.4% 2.5% 4.8% 5.3% 5.4% 5.9% 6.0% 6.8% 6.8% 7.3%
40.0% 49.0% 47.0% 41.9% 45.2% 46.7%56.8% 47.0%
39.8%39.1%
51.6%43.5%
58.2%49.1% 50.6% 55.6% 50.0% 48.0%
37.8%47.1% 54.2% 54.1%
41.6%49.2%
-40%
-20%
0%
20%
40%
60%
80%
100%
Satisfaction with Council's overall performance by precinctBayside City Council - 2019 Annual Community Satisfaction Survey
(Percent of respondents providing a response)
Very satisfied
Neutral to somewhat satisfied
Dissatisfied

Bayside City Council – 2019 Annual Community Satisfaction Survey
Page 17 of 152
Related to this general age-based variation in satisfaction, it is noted that home owners tend to be less satisfied than rental household respondents, and that long-term residents of Bayside (ten years or more in the municipality), tend to be less satisfied than newer residents (less than five years in the municipality).
7.93 7.737.49
7.206.95
7.767.22 7.41 7.31 7.39 7.32
0
1
2
3
4
5
6
7
8
9
10
Adol'escents
Youngadults
Adults Middle-aged
adults
Olderadults
Seniorcitizens
Male Female Englishspeakingh'sehold
Multi-lingual
h'sehold
City ofBayside
Satisfaction with Council's overall performance by respondent profileBayside City Council - 2019 Annual Community Satisfaction Survey
scale from 0 (very dissatisfied) to 10 (very satisfied)
1.4% 2.2% 4.6%9.5%
3.4% 5.7% 4.1% 4.8% 5.4% 4.8%
39.2% 38.7% 43.9%51.6% 46.2%
32.4%45.1% 45.3% 45.5% 43.5%
45.2%
60.8% 59.9% 53.9% 43.8%44.3%
64.2%49.2% 50.6% 49.7%
43.5%50.0%
-40%
-20%
0%
20%
40%
60%
80%
100%
Adol'escents
Youngadults
Adults Middle-aged
adults
Olderadults
Seniorcitizens
Male Female Englishspeakingh'sehold
Multi-lingual
h'sehold
City ofBayside
Satisfaction with Council's overall performance by respondent profileBayside City Council - 2019 Annual Community Satisfaction Survey
(Percent of respondents providing a response)
Very satisfied
Neutral to somewhat satisfied
Dissatisfied

Bayside City Council – 2019 Annual Community Satisfaction Survey
Page 18 of 152
7.31 7.27 7.30 7.267.60
7.09
7.757.51 7.32
0
1
2
3
4
5
6
7
8
9
10
Two parent(youngest0 - 4 yrs)
Two parent(youngest5 - 12 yrs)
Two parent(youngest13 - 18 yrs)
Two parent(adults only)
One parentfamily
Couple onlyhousehold
Grouphousehold
Sole personhousehold
City ofBayside
Satisfaction with Council's overall performance by household structureBayside City Council - 2019 Annual Community Satisfaction Survey
scale from 0 (very dissatisfied) to 10 (very satisfied)
3.4% 4.8%7.6%
3.4% 6.3% 2.3%6.5% 4.8%
48.1% 47.1% 42.4%52.1%
3.2%
45.9% 43.3% 36.9%45.2%
48.5% 48.1%50.0%
44.5%
96.8%
47.8% 54.4%56.6%
50.0%
-40%
-20%
0%
20%
40%
60%
80%
100%
Two parent(youngest0 - 4 yrs)
Two parent(youngest5 - 12 yrs)
Two parent(youngest13 - 18 yrs)
Two parent(adultsonly)
One parentfamily
Couple onlyhousehold
Grouphousehold
Sole personhousehold
City ofBayside
Satisfaction with Council's overall performance by household structureBayside City Council - 2019 Annual Community Satisfaction Survey
(Percent of respondents providing a response)
Very satisfied
Neutral to somewhat satisfied
Dissatisfied

Bayside City Council – 2019 Annual Community Satisfaction Survey
Page 19 of 152
7.30 7.247.63 7.80
7.53 7.527.19 7.36 7.31 7.32
0
1
2
3
4
5
6
7
8
9
10
Own thishome
Mortgage Privaterental
Less thanone year
One to lessthan five
years
Five to lessthan ten
years
Ten yearsor more
Householdwith a
disability
Householdwithout adisability
City ofBayside
Satisfaction with Council's overall performance by housing situation, period of residence and disability
Bayside City Council - 2019 Annual Community Satisfaction Survey
scale from 0 (very dissatisfied) to 10 (very satisfied)
4.5% 4.9% 5.8% 3.5% 2.5%6.6% 7.2% 4.7% 4.8%
47.6% 45.5%29.9% 27.4%
40.9%50.3% 46.3%
38.5%45.7%
45.2%
47.9% 49.6%
64.3% 69.1%56.6%
49.7%47.1%
54.3%49.6% 50.0%
-40%
-20%
0%
20%
40%
60%
80%
100%
Own thishome
Mortgage Rentingthis home
Less thanone year
One to lessthan five
years
Five to lessthan ten
years
Ten yearsor more
Householdwith a
disability
Householdwithout adisability
City ofBayside
Satisfaction with Council's overall performance by housing situation, period of residence and disability
Bayside City Council - 2019 Annual Community Satisfaction Survey
(Percent of respondents providing a response)
Very satisfied
Neutral to somewhat satisfied
Dissatisfied

Bayside City Council – 2019 Annual Community Satisfaction Survey
Page 20 of 152
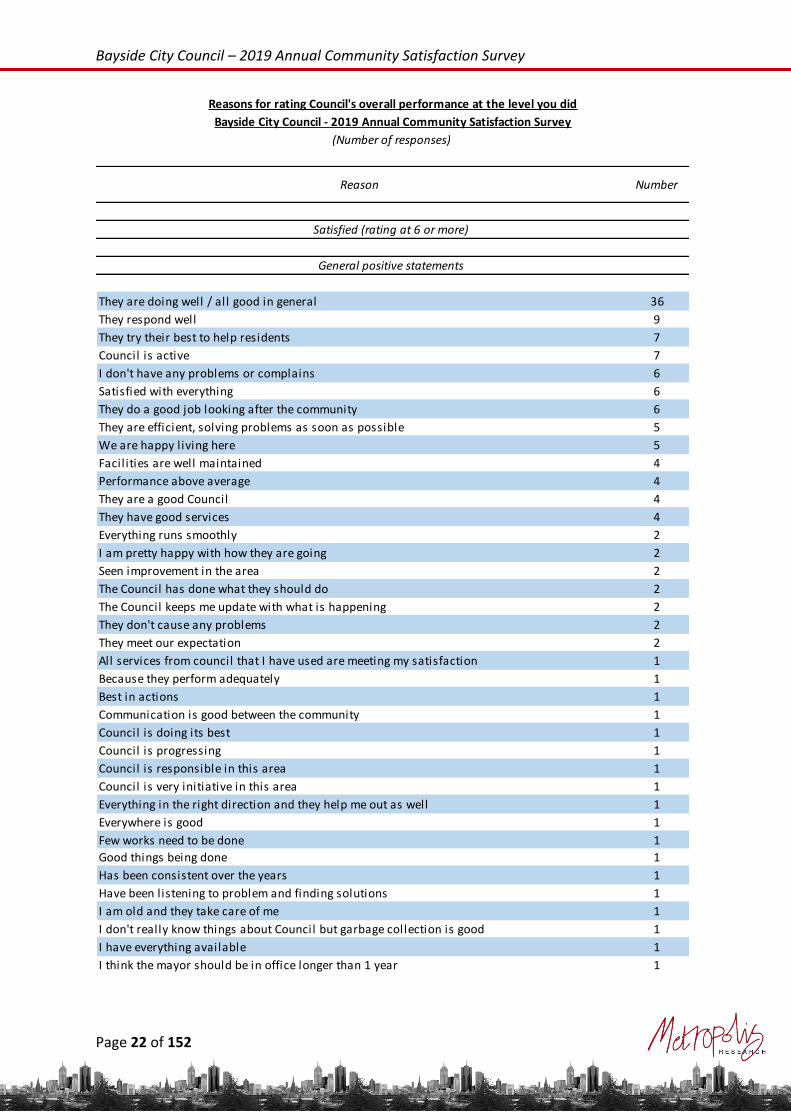
Reasons for level of satisfaction with Council’s overall performance
Respondents were asked:
“Why did you rate Council’s overall performance at the level you did?
Respondents were provided an open-ended opportunity to explain why they rated Council’s overall performance the way they did. A total of 270 responses were received from the 702 survey respondents.
• Satisfied respondents – 226 responses, of which 155 were generally positive in nature, 21 were neutral in nature, and 50 were generally negative in nature.
• Neutral respondents – 19 responses.
• Dissatisfied respondents – 25 responses.
There were a wide range of comments received from respondents as to why they were satisfied with Council’s overall performance. The most common responses related to a perception that Council was doing a good job, respondents had no negative feedback, they were satisfied with everything, and similar types of responses. Those who were satisfied with Council’s overall performance, but who provided generally negative responses referred to a general need for Council to improve, there is room for improvement, and similar types of responses. There were also a number of specific issues raised, such as roads. Other responses related to perception of Council responsiveness, effectiveness, and community consultation and listening to the community. The respondents who were neutral in relation to satisfaction with Council’s overall performance tended to make statements about room for improvement and similar types of responses. Some of these respondents also referred to planning issues, issues with rates, and a number of specific issues raised by a handful of respondents. The respondents who were dissatisfied with Council’s overall performance referred to governance and leadership related concerns, perceived lack of responsiveness and a perceived lack of listening to the community. There were also a handful of respondents raising specific issues such as car parking, development, and public toilets.

Bayside City Council – 2019 Annual Community Satisfaction Survey
Page 21 of 152
Get nothing done for the community 5
Council making decision in the interest of Council not the community 2
Not enough car parking 2
Not very happy about buildings, overcrowded 2
We don't hear anything from the Council 2
Been dealing with an issue for more than 18 years 1
Broken promises 1
I have contacted them about the trees in front of my house, they are not helping with it 1
Inappropriate planning in Bay St and New St (telecommunication tower) 1
It could work more collaboratively with City of Kingston 1
Lack of sincerity 1
Old people home (people who own the house but no parking for their workers) 1
Overpriced 1
Parking is not being monitored properly, blocking the entrance to our streets 1
Public toilets are dirty 1
They are not good now 1
They are not proactive 1
Total 25
Not doing enough for things should be, take a long time to get things done 2
They never l isten to residents 2
Average performance 1
Don't get a lot of information on what they are doing 1
Don't l ike the redevelopment that have been happening 1
High rates, not enough value for the rate we pay 1
High rise and overdevelopment 1
I have done sewage and made suggestions, but no responses for my efforts 1
It's hard to get an answer from the Council 1
Not too happy, the beach is the main thing 1
Providing pedestrian crossing in Park Rd 1
They discriminate against dog owners 1
They don't engage enough 1
They don't seem to do anything 1
Tree removal 1
Trying to get building permit is difficult 1
With own experience 1
Total 19
Dissatisfied (rating less than 5)
Reasons for rating Council's overall performance at the level you did
Bayside City Council - 2019 Annual Community Satisfaction Survey
(Number of responses)
Reason Number
Neutral (rating at 5)
Bayside City Council – 2019 Annual Community Satisfaction Survey
Page 22 of 152
They are doing well / all good in general 36
They respond well 9
They try their best to help residents 7
Council is active 7
I don't have any problems or complains 6
Satisfied with everything 6
They do a good job looking after the community 6
They are efficient, solving problems as soon as possible 5
We are happy living here 5
Facilities are well maintained 4
Performance above average 4
They are a good Council 4
They have good services 4
Everything runs smoothly 2
I am pretty happy with how they are going 2
Seen improvement in the area 2
The Council has done what they should do 2
The Council keeps me update with what is happening 2
They don't cause any problems 2
They meet our expectation 2
All services from council that I have used are meeting my satisfaction 1
Because they perform adequately 1
Best in actions 1
Communication is good between the community 1
Council is doing its best 1
Council is progressing 1
Council is responsible in this area 1
Council is very initiative in this area 1
Everything in the right direction and they help me out as well 1
Everywhere is good 1
Few works need to be done 1
Good things being done 1
Has been consistent over the years 1
Have been listening to problem and finding solutions 1
I am old and they take care of me 1
I don't really know things about Council but garbage collection is good 1
I have everything available 1
I think the mayor should be in office longer than 1 year 1
Satisfied (rating at 6 or more)
Reasons for rating Council's overall performance at the level you did
Bayside City Council - 2019 Annual Community Satisfaction Survey
(Number of responses)
Reason Number
General positive statements

Bayside City Council – 2019 Annual Community Satisfaction Survey
Page 23 of 152
In terms of function facil ities we use there is no problem 1
It is better than other areas 1
It is not bad, but can stil l improve 1
It is one of the best areas of Melbourne 1
Never had any disappointment 1
Nice area to l ive in 1
Nothing bad has appeared 1
Overall good job but not familiar with details of services 1
Overall they got community expectation in mind, it does a pretty good job to achieve it 1
Relatively new but doing a good job 1
Some places need attention 1
Taking care of this area 1
There haven't been any issues in the area as of date. Can see some developments taking place in
the area1
They are a very caring council, spend money wisely 1
They are quite proactive and attempt to contact residents 1
They are trying to make it a better place to l ive 1
They consider all aspects of the surrounding 1
They did some work e.g. extend the parking areas 1
They seem to be doing a fair job right now. There is room for improvement though 1
They work on the drainages 1
Total 155
There is room for improvement / could be better 14
Nothing outstanding 2
50-50, assume they are doing ok but no idea really 1
Balanced things 1
I have lived here long enough 1
Not have lived here for a long time 1
What read in local people and website 1
Total 21
Neutral statements
Reasons for rating Council's overall performance at the level you did
Bayside City Council - 2019 Annual Community Satisfaction Survey
(Number of responses)
Reason Number
Satisfied (rating at 6 or more)
General positive statements

Bayside City Council – 2019 Annual Community Satisfaction Survey
Page 24 of 152
Need to improve 9
Roads could be improved 3
I don't really hear much from the Council 2
Need more attention to the community 2
Apart from green bin, no problem 1
Because they are ineffective 1
Better response 1
Can do better improvements in services 1
Could involve the community better 1
Council people are kind and friendly, but sometimes they can't solve my problems - not
professional1
Cromer Rd residential building wasn't appropriate for the area but they went ahead with it 1
Despite the parking issues in the area, they seem to be doing a good enough job 1
Employed people are not trained well enough 1
I am not happy with the Council performance (need to improve) 1
I think the important thing is good, worry about some less important areas (e.g. spend too much
money on it)1
In general it is ok but over crowded 1
Knock down houses, Council is on the side of the developers 1
Maintenance can be better 1
No speed bumps in the street, cars/ trucks driving very fast, it is dangerous 1
Not a big fan of the management 1
Not all issues are resolved 1
Not do many for the old people 1
Not enough parking 1
Not sure of their decisions sometimes 1
Over regulation regarding the tree maintenance 1
Overdevelopment 1
Poor planning, permit processes, poor use of funds 1
Recycling could be better 1
Road maintenance needed 1
Selling off area for development 1
Some of the beach areas and the beach roads are not well maintained 1
The cleaning needs to be improved 1
The council decision making is not visible 1
They are good in general but make some stupid decisions 1
They can be a l ittle slow or haven't l istened 1
They didn't respond when I wanted them. They don't take concerns about speeding cars and
parking1
They probably spend a lot of money generally. It would be used wisely for more quality
improvements1
Too strict on fining 1
Total 50
Reasons for rating Council's overall performance at the level you did
NumberReason
(Number of responses)
Bayside City Council - 2019 Annual Community Satisfaction Survey
General negative statements
Bayside City Council – 2019 Annual Community Satisfaction Survey
Page 25 of 152
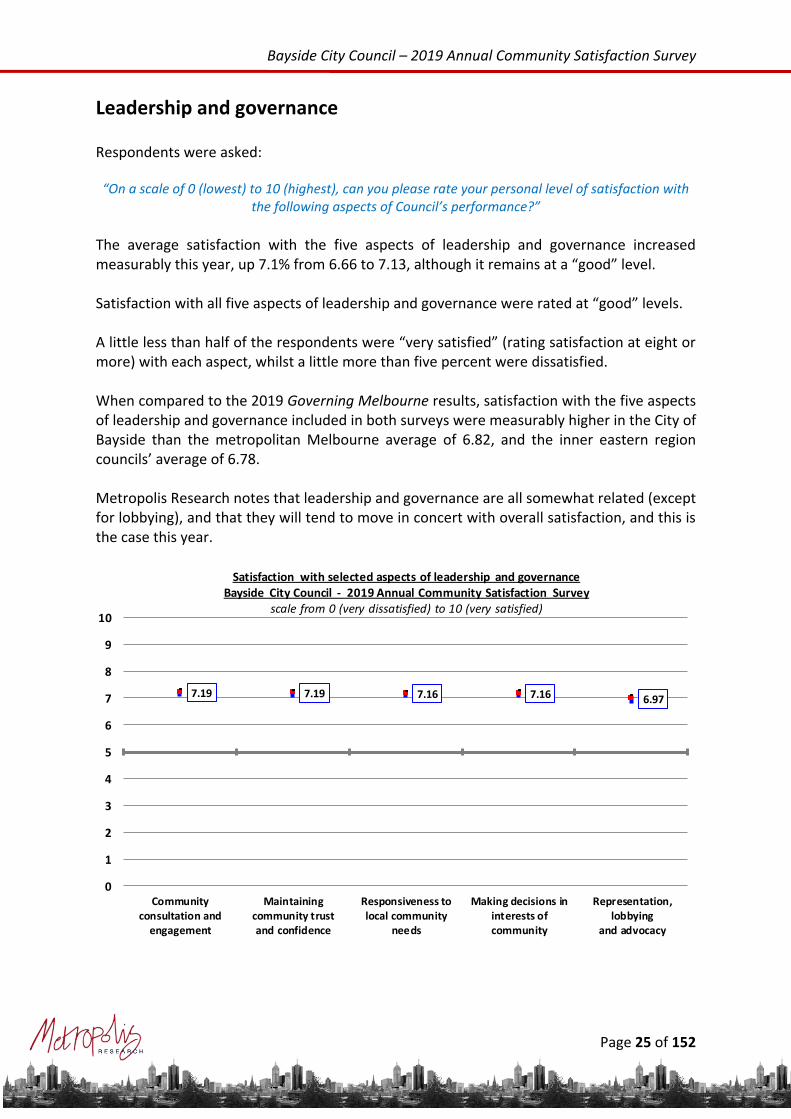
Leadership and governance
Respondents were asked: “On a scale of 0 (lowest) to 10 (highest), can you please rate your personal level of satisfaction with
the following aspects of Council’s performance?”
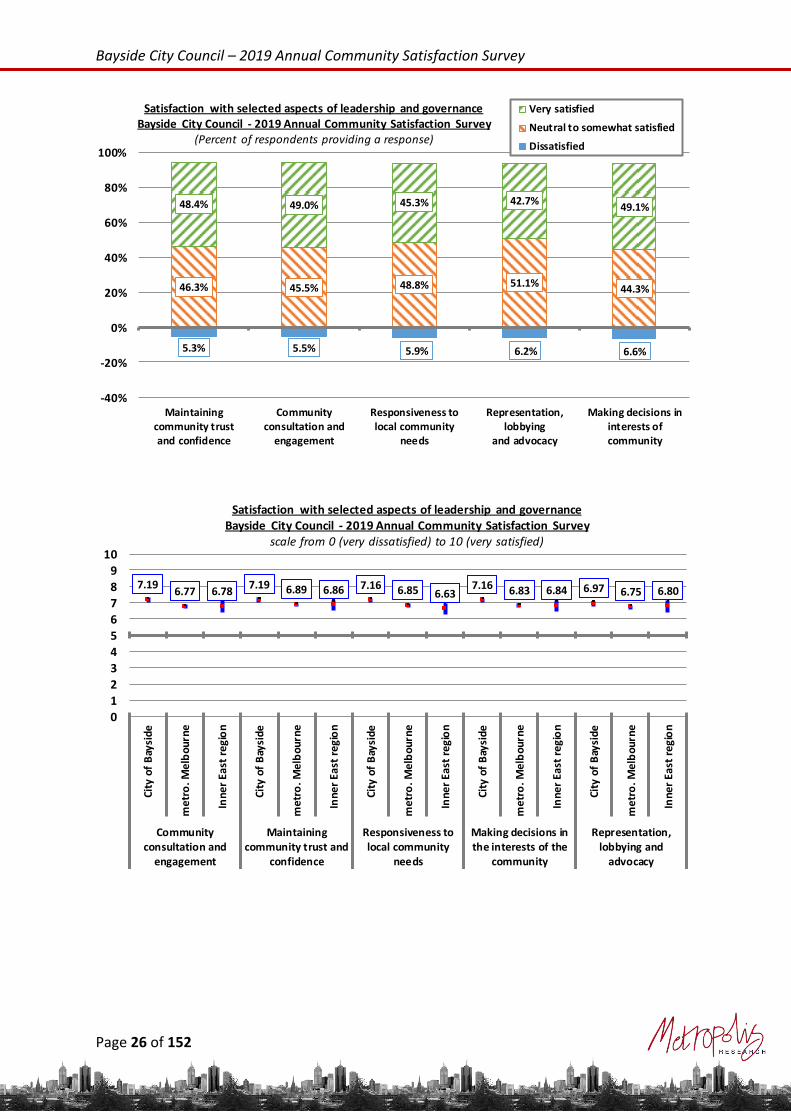
The average satisfaction with the five aspects of leadership and governance increased measurably this year, up 7.1% from 6.66 to 7.13, although it remains at a “good” level. Satisfaction with all five aspects of leadership and governance were rated at “good” levels. A little less than half of the respondents were “very satisfied” (rating satisfaction at eight or more) with each aspect, whilst a little more than five percent were dissatisfied. When compared to the 2019 Governing Melbourne results, satisfaction with the five aspects of leadership and governance included in both surveys were measurably higher in the City of Bayside than the metropolitan Melbourne average of 6.82, and the inner eastern region councils’ average of 6.78. Metropolis Research notes that leadership and governance are all somewhat related (except for lobbying), and that they will tend to move in concert with overall satisfaction, and this is the case this year.
7.19 7.19 7.16 7.16 6.97
0
1
2
3
4
5
6
7
8
9
10
Communityconsultation and
engagement
Maintainingcommunity trustand confidence
Responsiveness tolocal community
needs
Making decisions ininterests ofcommunity
Representation,lobbying
and advocacy
Satisfaction with selected aspects of leadership and governanceBayside City Council - 2019 Annual Community Satisfaction Survey
scale from 0 (very dissatisfied) to 10 (very satisfied)
Bayside City Council – 2019 Annual Community Satisfaction Survey
Page 26 of 152
5.3% 5.5% 5.9% 6.2% 6.6%
46.3% 45.5% 48.8% 51.1%44.3%
48.4% 49.0% 45.3% 42.7%49.1%
-40%
-20%
0%
20%
40%
60%
80%
100%
Maintainingcommunity trustand confidence
Communityconsultation and
engagement
Responsiveness tolocal community
needs
Representation,lobbying
and advocacy
Making decisions ininterests ofcommunity
Satisfaction with selected aspects of leadership and governanceBayside City Council - 2019 Annual Community Satisfaction Survey
(Percent of respondents providing a response)
Very satisfied
Neutral to somewhat satisfied
Dissatisfied
7.196.77 6.78
7.19 6.89 6.86 7.16 6.85 6.637.16 6.83 6.84 6.97 6.75 6.80
0
1
2
3
4
5
6
7
8
9
10
City
of
Bay
side
me
tro
. Me
lbo
urn
e
Inn
er
Ea
st r
eg
ion
City
of
Bay
side
me
tro
. Me
lbo
urn
e
Inn
er
East
re
gio
n
City
of
Bay
side
me
tro
. Me
lbo
urn
e
Inn
er
East
re
gio
n
City
of
Bay
side
me
tro
. Me
lbo
urn
e
Inn
er
Ea
st r
eg
ion
City
of
Bay
side
me
tro
. Me
lbo
urn
e
Inn
er
East
re
gio
n
Communityconsultation and
engagement
Maintainingcommunity trust and
confidence
Responsiveness tolocal community
needs
Making decisions inthe interests of the
community
Representation,lobbying and
advocacy
Satisfaction with selected aspects of leadership and governance Bayside City Council - 2019 Annual Community Satisfaction Survey
scale from 0 (very dissatisfied) to 10 (very satisfied)

Bayside City Council – 2019 Annual Community Satisfaction Survey
Page 27 of 152
The following pages provide a breakdown of these results over time and by precinct. Attention is drawn to the fact that respondents from Cheltenham, Beaumaris, and Black Rock tended to be more satisfied than average. There were no precincts from which respondents were measurably less satisfied with most aspects of leadership and governance than the municipal average. Ideally, Council is seeking to obtain consistent levels of satisfaction with all aspects of Council performance across the municipality, particularly geographically, as this reflects uniform service delivery and infrastructure provision.
Community consultation and engagement
Satisfaction with Council’s community consultation and engagement performance increased somewhat, albeit not measurably this year, up 5.6% to 7.19, and remains at a “good” level.
There was measurable variation in satisfaction with this aspect of leadership and governance observed across the municipality, as follows:
• Cheltenham and Beaumaris – respondents were measurably more satisfied than average and at “very good” levels.
• Brighton East – respondents were measurably less satisfied than average.
6.817.19
0
1
2
3
4
5
6
7
8
9
10
2018 2019
Satisfaction with performance in community consultation and engagementBayside City Council - 2019 Annual Community Satisfaction Survey
scale from 0 (very dissatisfied) to 10 (very satisfied)

Bayside City Council – 2019 Annual Community Satisfaction Survey
Page 28 of 152
7.85 7.63 7.61 7.34 7.30 7.19 7.04 6.92 6.84 6.78 6.77 6.70
0
1
2
3
4
5
6
7
8
9
10
Council's community consultation and engagement by precinctBayside City Council - 2019 Annual Community Satisfaction Survey
scale from 0 (very dissatisfied) to 10 (very satisfied)
No consultation / never heard anything from Council 16
Not enough consultation 6
Lack of action 2
Problems of planning development 2
A man from council was rude, I am not happy with him 1
All are only for long term projects 1
All the fences are fall ing down around beach on the foreshore 1
Councillors not usable 1
Don't seem to be clear with the process 1
I don't think they consult very well 1
Interaction levels 1
Lack of sincerity 1
Parking 1
Railway Precinct development - communication from officer was not satisfactory 1
The heritage study 1
There absolutely no consultation on sports club, they do things on their own 1
They aren't on our side, not on behalf of the residents 1
They didn't meet residents' expectations, only do what they think it's right 1
This survey seems truly useless 1
Total 41
Reason for dissatisfaction with Council's community consultation and engagement
Bayside City Council - 2019 Annual Community Satisfaction Survey
(Number of responses)
Reason Number

Bayside City Council – 2019 Annual Community Satisfaction Survey
Page 29 of 152
Responsiveness of Council
Satisfaction with the responsiveness of Council increased measurably this year, up 6.5% to 7.16, although it remains at a “good” level.
There was no statistically significant variation in satisfaction with this aspect of leadership and governance observed across the City of Bayside.
6.727.16
0
1
2
3
4
5
6
7
8
9
10
2018 2019
Satisfaction with the responsiveness of Council to local community needsBayside City Council - 2019 Annual Community Satisfaction Survey
scale from 0 (very dissatisfied) to 10 (very satisfied)
7.41 7.26 7.26 7.22 7.21 7.16 7.16 7.14 6.98 6.86 6.85 6.63
0
1
2
3
4
5
6
7
8
9
10
Responsiveness of Council to local community needs by precinctBayside City Council - 2019 Annual Community Satisfaction Survey
scale from 0 (very dissatisfied) to 10 (very satisfied)

Bayside City Council – 2019 Annual Community Satisfaction Survey
Page 30 of 152
Representation, lobbying and advocacy
Satisfaction with Council’s representation, lobbying and advocacy increased measurably this year, up 6.3% to 6.97, although it remains at a “good” level.
There was measurable and significant variation in satisfaction with this aspect of leadership and governance observed across the municipality, with respondents from Cheltenham, Beaumaris, and Black Rock measurably more satisfied than average and at “very good” levels.
6.566.97
0
1
2
3
4
5
6
7
8
9
10
2018 2019
Satisfaction with Council's representation, lobbying and advocacyBayside City Council - 2019 Annual Community Satisfaction Survey
scale from 0 (very dissatisfied) to 10 (very satisfied)
7.64 7.60 7.467.00 6.97 6.84 6.81 6.80 6.75 6.73 6.62 6.42
0
1
2
3
4
5
6
7
8
9
10
Representation, lobbying and advocacy by precinctBayside City Council - 2019 Annual Community Satisfaction Survey
scale from 0 (very dissatisfied) to 10 (very satisfied)

Bayside City Council – 2019 Annual Community Satisfaction Survey
Page 31 of 152
Examples of Council advocacy
Respondents were asked:
“Can you list any Council advocacy of which you are aware?”
The following table outlines the forty-six responses received from respondents outlining Council advocacy efforts of which they were aware. The most common issues appear to relate to programs and support for the older people (8 responses), programs and services for the disabled people (5 responses), land rezoning (3 responses) and netball courts (3 responses).
Programs / support for the older people 8
Programs and services for the disabled people 5
Land rezoning 3
Netball courts 3
Building and development 2
Don't support local high schools 2
Elsternwick Park 2
Planning permits 2
They don't care a lot for the citizens, just getting money 2
Bus routes 1
Bus stops (increasing) 1
Frankston rail l ine level crossing 1
Funding on street maintenance 1
Hampton Road development 1
Investment for community is too low (comparison to others) for the Council 1
Management overall 1
Not given bin for green waste 1
Only listen to "squeaky" wheels 1
People support 1
Recycling (reduce the bin size) 1
Southland parking precinct 1
Structure plans 1
Support for the backward community people 1
Upgrade the sport facil ity 1
VCAT 1
Very involved with local things 1
Total 46
Awareness of Council advocacy
Bayside City Council - 2019 Annual Community Satisfaction Survey
(Number of responses)
Response Number

Bayside City Council – 2019 Annual Community Satisfaction Survey
Page 32 of 152
Maintaining trust and confidence of local community
Satisfaction with Council’s performance maintaining the trust and confidence of the local community increased measurably this year, up 8.3% to 7.19, although it remains “good”.
There was measurable and significant variation in satisfaction with this aspect of leadership and governance observed across the municipality, with Cheltenham, Beaumaris, and Black Rock respondents measurably more satisfied than average and at “very good” levels.
6.64
7.19
0
1
2
3
4
5
6
7
8
9
10
2018 2019
Satisfaction with Council maintaining community trust and confidenceBayside City Council - 2019 Annual Community Satisfaction Survey
scale from 0 (very dissatisfied) to 10 (very satisfied)
7.72 7.69 7.597.19 7.16 7.14 7.09 7.03 6.97 6.89 6.86 6.77
0
1
2
3
4
5
6
7
8
9
10
Maintaining trust and confidence of local community by precinctBayside City Council - 2019 Annual Community Satisfaction Survey
scale from 0 (very dissatisfied) to 10 (very satisfied)

Bayside City Council – 2019 Annual Community Satisfaction Survey
Page 33 of 152
Making decisions in the interests of the community
Satisfaction with Council’s performance making decisions in the interests of the community increased measurably this year, up 8.6% to 7.16, although it remains at a “good” level.
There was meaurable variation in this aspect of leadership and governance observed across the municipality, with respondents from Beaumaris measurably more satisfied, and at a “very good” level.
6.59
7.16
0
1
2
3
4
5
6
7
8
9
10
2018 2019
Satisfaction with Council making decisions in the best interest of the communityBayside City Council - 2019 Annual Community Satisfaction Survey
scale from 0 (very dissatisfied) to 10 (very satisfied)
7.71 7.48 7.44 7.23 7.16 7.13 7.12 6.93 6.86 6.84 6.83 6.81
0
1
2
3
4
5
6
7
8
9
10
Making decisions in the best interests of the community by precinctBayside City Council - 2019 Annual Community Satisfaction Survey
scale from 0 (very dissatisfied) to 10 (very satisfied)

Bayside City Council – 2019 Annual Community Satisfaction Survey
Page 34 of 152
Council’s advocacy to other levels of government Respondents were asked: “On a scale of zero (lowest) to ten (highest), please rate your satisfaction with Council’s advocacy to
other levels of government in relation to the following.”
In addition to asking respondents to rate their satisfaction with “Council’s representation, lobbing and advocacy” discussed in the previous section, respondents were also asked to rate their satisfaction with Council’s advocacy around five issues. Consistent with the 6.3% increase in satisfaction with Council’s representation, lobbying and advocacy, there was an increase in satisfaction with each of these five specific lobbying activities. It is worth noting that whilst satisfaction with all five of these lobbying activities increased this year, the order of satisfaction with each remains the same as was reported last year. This does reinforce the view that these increases are likely to be reflecting, at least in part, the general increase in satisfaction with the performance of Council, which has flowed through into increased satisfaction with many variables recorded in the survey this year. Satisfaction with these five lobbying activities can best be summarised as follows:
• Very Good – for continued access to high quality support services for the elderly and persons with a disability and the protection of Port Phillip Bay and limiting coastal erosion.
• Good – for improvements to public transport, certainty in planning, and increasing the supply of social and affordable housing in Bayside.
Metropolis Research notes that whilst there has been a substantial increase in the proportion of respondents “very satisfied” (i.e. rating satisfaction at eight or more out of ten) with these lobbying activities, there remains a significant proportion of respondents dissatisfied with planning certainty, public transport improvements, and increasing the supply of social housing. There was some variation in these results observed across the municipality, as discussed over the following pages. Attention is drawn to the fact that respondents from Beaumaris and Black Rock tended to be measurably more satisfied with Council’s lobbying activities than the municipal average. Particular attention is drawn to the significant variation in satisfaction with Council’s lobbying in relation to social housing observed across the municipality, with Hampton, Brighton and Brighton East respondents reporting satisfaction at “poor” to “very poor” levels.

Bayside City Council – 2019 Annual Community Satisfaction Survey
Page 35 of 152
Respondents from Beaumaris were measurably more satisfied than average with Council’s lobbying for better bus routes, sufficient commuter parking and development around train stations, and at a “very good” level.
7.237.72
7.18 7.42
6.377.03
6.13
6.90
5.76
6.62
0
1
2
3
4
5
6
7
8
9
10
2018 2019 2018 2019 2018 2019 2018 2019 2018 2019
To ensure that theelderly, and people
with a disability,continue to have
access to high qualitysupport services
To protect Port PhillipBay and limitingcoastal erosion
For better bus routes,sufficient commuter
parking, developmentaround train stations
For a planning systemthat provides more
certainty for Baysideresidents
For increasing thesupply of social and
affordable housing inBayside
Satisfaction with Council's advocacy to other levels of governmentBayside City Council - 2019 Annual Community Satisfaction Survey
scale from 0 (very dissatisfied) to 10 (very satisfied)
6.6%2.3%
5.1% 6.4%15.6%
9.7%19.3%
9.5%
22.9%14.1%
45.8%30.6%
50.8%35.1%
55.8%41.0%
54.0% 47.4%57.1%
42.8%
47.6%67.1%
44.1%58.5%
28.6% 49.3% 26.7% 43.1% 20.0% 43.1%
-60%
-40%
-20%
0%
20%
40%
60%
80%
100%
2018 2019 2018 2019 2018 2019 2018 2019 2018 2019
To ensure that theelderly, and people
with a disability,continue to have
access to high qualitysupport services
To protect Port PhillipBay and limitingcoastal erosion
For better bus routes,sufficient commuter
parking, developmentaround train stations
For a planning systemthat provides more
certainty for Baysideresidents
For increasing thesupply of social and
affordable housing inBayside
Satisfaction with Council's advocacy to other levels of governmentBayside City Council - 2019 Annual Community Satisfaction Survey
(Percent of respondents providing a response)
Very satisfied
Neutral to somewhat satisfied
Dissatisfied

Bayside City Council – 2019 Annual Community Satisfaction Survey
Page 36 of 152
Respondents from Beaumaris were measurably more satisfied than average with Council’s lobbying for a planning system that provides more certainty for Bayside residents, and at a “very good” level.
There was measurable and significant variation in satisfaction with Council’s lobbying for increasing the supply of social and affordable housing in Bayside observed across the municipality, as follows:
7.727.42 7.34 7.34
7.03 7.03 6.82 6.77 6.76 6.57
0
1
2
3
4
5
6
7
8
9
10
For better bus routes, sufficient commuter parking, development around train stations Bayside City Council - 2019 Annual Community Satisfaction Survey
scale from 0 (very dissatisfied) to 10 (very satisfied)
7.677.41 7.18 6.98 6.90 6.75 6.74 6.68 6.49
5.84
0
1
2
3
4
5
6
7
8
9
10
For a planning system that provides more certainty for Bayside residentsBayside City Council - 2019 Annual Community Satisfaction Survey
scale from 0 (very dissatisfied) to 10 (very satisfied)

Bayside City Council – 2019 Annual Community Satisfaction Survey
Page 37 of 152
• Beaumaris, Black Rock, and Highett – respondents were measurably more satisfied than average with this lobbying activity, with Beaumaris respondents rating it “excellent” and Black Rock respondents rating it “very good”.
• Hampton East – respondents were somewhat, albeit not measurably less satisfied than average and at a “poor” level.
• Brighton East and Brighton – respondents were measurably and significantly less satisfied than average, and rated satisfaction at “poor” and very “poor” levels respectively.
There was no statistically significant variation in satisfaction with Council’s lobbying to protect Port Phillip Bay and limit coastal erosion, although it is noted that:
• Black Rock - respondents were significantly, albeit not measurably more satisfied than the average and at almost an “excellent” level.
8.037.47
7.13 6.98 6.976.62 6.37
5.79 5.735.43
0
1
2
3
4
5
6
7
8
9
10
For increasing the supply of social and affordable housing in BaysideBayside City Council - 2019 Annual Community Satisfaction Survey
scale from 0 (very dissatisfied) to 10 (very satisfied)

Bayside City Council – 2019 Annual Community Satisfaction Survey
Page 38 of 152
There was no statistically significant variation in satisfaction with Council’s lobbying to ensure that the elderly and people with a disability continue to have access to high quality support services.
7.74 7.70 7.67 7.63 7.54 7.42 7.29 7.28 7.18 6.95
0
1
2
3
4
5
6
7
8
9
10
To protect Port Phillip Bay and limiting coastal erosionBayside City Council - 2019 Annual Community Satisfaction Survey
scale from 0 (very dissatisfied) to 10 (very satisfied)
8.06 7.88 7.82 7.80 7.72 7.71 7.71 7.57 7.41 7.39
0
1
2
3
4
5
6
7
8
9
10
To ensure that the elderly, and people with a disability, continue to have access to high quality support services
Bayside City Council - 2019 Annual Community Satisfaction Survey
scale from 0 (very dissatisfied) to 10 (very satisfied)

Bayside City Council – 2019 Annual Community Satisfaction Survey
Page 39 of 152
Bayside Council as an organisation Respondents were asked:
“On a scale of zero (strongly disagree) to ten (strongly agree), please rate your agreement with the following statements regarding Bayside City Council as an organisation.”
Respondents were again this year asked to rate their agreement with seven statements about Bayside City Council as an organisation. There was a measurable increase in average agreement with four of the seven statements, those around Council is being progressive and up-to-date (up 6.2%), offers value for rates (up 6.1%), is trustworthy and reliable (up 5.2%), and provides important services (up 3.9%). There was no movement in the average agreement that Council is a responsible financial manager, and there was a marginal (but not significant) increase in agreement that Council is bureaucratic and ineffective. Metropolis Research notes that the increases in agreement with these statements reflect the substantial increases in satisfaction with aspects of leadership and governance discussed in the previous section of this report. These results do reinforce the view that the community has a more positive opinion of Bayside City Council this year compared to last year.
More than half of the respondents strongly agreed (rating agreement at eight or more out of ten) that Council provides important services (55.9%) and is trustworthy and reliable (52.2%). Less than five percent of respondents disagree with these two statements.
7.257.53
6.987.34
6.486.88
6.436.82 6.68 6.68
5.926.28
4.925.10
0
1
2
3
4
5
6
7
8
9
10
2018 2019 2018 2019 2018 2019 2018 2019 2018 2019 2018 2019 2018 2019
Providesimportant
services thatmeet needs
Is trustworthyand reliable
Is progressiveand "up to
date"
Has a sounddirection for
the future
Is a responsiblefinancialmanager
Offers valuefor rates
Is bureaucraticand ineffective
Agreement with selected statements about Bayside City CouncilBayside City Council - 2019 Annual Community Satisfaction Survey
scale from 0 (strongly disagree) to 10 (strongly agree)

Bayside City Council – 2019 Annual Community Satisfaction Survey
Page 40 of 152
Consistent with the results recorded last year, particular attention is drawn to the fact that a significant proportion of respondents believe that Council is bureaucratic and ineffective, with a little more than forty percent disagreeing with this view.
Exploring in more detail the average agreement that Council offers value for rates, it is noted that there was measurable and significant variation observed across the municipality, as follows:
• Beaumaris and Black Rock – respondents were measurably more in agreement than the municipal average, and at “strong” levels of agreement.
• Brighton East and Brighton – respondents were measurably and significantly less in agreement, and at “mild” levels of agreement.
• Age structure – there was no meaningful variation observed by the respondents’ age structure.
• Gender – there was no meaningful variation observed by respondents’ gender.
Metropolis Research notes that respondents from Beaumaris and Black Rock tended to be measurably more satisfied with most aspects of leadership and governance, as well as satisfaction with Council’s overall performance. This pattern of results is clearly evident in relation to their agreement that Council offers value for rates. The reflects the fact that these aspects are all highly correlated and related.
By contrast, attention is drawn to the fact that respondents from Brighton and Brighton East in particular were less in agreement that Council offers value for rates, which reflects lower levels of satisfaction by respondents from these two precincts with many of the other leadership and governance measures covered in the survey. This is most evident in relation to respondents from Brighton East.
5.3% 2.4%7.9% 4.4%
11.3% 7.8% 10.7% 8.5% 9.5% 8.9%
20.9% 18.6%41.4% 42.1%
44.1% 41.7% 47.3% 43.4%58.8% 51.2%
61.9%51.9% 54.5% 50.6% 55.4% 50.3% 43.2%
32.5%
50.6% 55.9% 44.8% 52.2% 29.9% 41.0% 27.4% 39.6% 36.0% 40.5% 23.7% 31.1%
15.4%25.4%
-60%
-40%
-20%
0%
20%
40%
60%
80%
100%
2018 2019 2018 2019 2018 2019 2018 2019 2018 2019 2018 2019 2018 2019
Providesimportant
services thatmeet needs
Is trustworthyand reliable
Is progressiveand "up to
date"
Has a sounddirection for
the future
Is a responsiblefinancialmanager
Offers valuefor rates
Is bureaucraticand ineffective
Agreement with selected statements about Bayside City CouncilBayside City Council - 2019 Annual Community Satisfaction Survey
(Percent of respondents providing a response)
Strongly agree
Neutral to somewhat agree
Disagree

Bayside City Council – 2019 Annual Community Satisfaction Survey
Page 41 of 152
7.577.16
6.81 6.706.34 6.28 6.05
5.77 5.71 5.62
0
1
2
3
4
5
6
7
8
9
10
Agreement that Council offers value for rates by precinctBayside City Council - 2019 Annual Community Satisfaction Survey
scale from 0 (strongly disagree) to 10 (strongly agree)
5.866.15
6.44 6.22 6.25 6.526.23 6.34 6.28
0
1
2
3
4
5
6
7
8
9
10
Agreement that Council offers value for rates by respondent profileBayside City Council - 2019 Annual Community Satisfaction Survey
scale from 0 (strongly disagree) to 10 (strongly agree)
Bayside City Council – 2019 Annual Community Satisfaction Survey
Page 42 of 152
Current issues for the City of Bayside
Respondents were asked:
“Can you please list what you consider to be the top three issues for the City of Bayside at the moment?”
Respondents were asked what they consider to be the top three issues for the City of Bayside at the moment. This question was asked as an open-ended question and the results have been broadly categorised into a list of approximately seventy different issues to allow for analysis of the results and comparison to the metropolitan results from Governing Melbourne.
It is important to bear in mind that these results are not to be read as a list of complaints about the performance of Council, nor do they reflect only services, facilities and issues that lie within the general remit of the Bayside City Council. Many of the issues raised by respondents are within the remit of other levels of government, most often the State Government.
These results are a very useful guide to the range of issues of importance to the Bayside community at the moment, and also allow for some insight into how much these issues affect community satisfaction with the performance of Council.
A little more than three-quarters (76.1% down from 83.3%) of respondents provided a total of 1,063 responses, at an average of approximately two issues per respondent.
When compared to the 2019 metropolitan Melbourne results, some variations are noted. It is important to bear in mind however that for some of these issues, whilst they are more or less commonly identified in Bayside than the metropolitan average, they are only identified by a relatively small proportion of respondents and may not be significant issues.
• More commonly identified in the City of Bayside – car parking, planning and development, street trees, sports and recreation facilities, and services for the elderly.
• Less commonly identified in the City of Bayside – traffic management, footpaths and road maintenance and repairs, and safety, policing and crime.
The three most commonly raised issues to address in the City of Bayside in 2019 remain the same as nominated in 2018, that being car parking, planning and development, and traffic management.
Metropolis Research notes that with the exception of a significant decline in the proportion of respondents nominating planning and development issues this year (20.9% down from 39.1%), there was relatively little significant movement in the proportion of respondents nominating most issues.
Apart from the decline in planning and development issues this year, there was also a small decline in the proportion of respondents nominating road maintenance and repairs (5.1% down from 8.9%), services and facilities for the elderly (2.0% down from 5.1%), and Council governance and leadership (1.4% down from 3.4%).

Bayside City Council – 2019 Annual Community Satisfaction Survey
Page 43 of 152
There were no issues to report a significant increase this year. Car parking In 2019, a little more than one-fifth (21.5% up from 18.0%) of the respondents identified car parking as an issue to address in Bayside. This result is somewhat higher than the 2019 metropolitan Melbourne average of 14.6%.
Metropolis Research notes that car parking issues are prominent in many of the inner region municipalities, including for example in the City of Yarra (20.3%).
Respondents that identified car parking as an issue were on average mildly less satisfied with Council’s overall performance than the municipal average. This does suggest that this issue exerts a mildly negative influence on community satisfaction with Council’s performance. Building, housing, planning and development
There was a significant decline this year in the proportion of respondents nominating building, housing, planning and development issues, down from a very high 39.1% last year to 20.9% this year. The result of 39.1% recorded last year was far and away the highest proportion recorded in any municipality surveyed by Metropolis Research since it commenced conducting community satisfaction surveys in 2001. By way of comparison, the 2019 metropolitan Melbourne average for this issue was 7.3%. There does appear to have been a decline in a number of other municipalities this year in the proportion of respondents nominating these issues, with the result for the City of Yarra declining from 24.3% in 2018 to 11.8% this year. Metropolis Research is not yet in a position to comment on whether this is a longer term trend or an unusually low result this year.
Metropolis Research notes that respondents who nominated planning and development issues as one of the top three issues to address in the municipality at the moment were, on average, measurably less satisfied with Council’s overall performance than the municipal average. This result strongly implies that planning and development issues exert a negative influence on the overall satisfaction with Council of the respondents who nominate the issue. In other words, for the respondents who nominate this issue, it is an important factor underpinning their overall satisfaction with Council. Metropolis Research also draws attention to the fact that there was a significant increase in satisfaction with many aspects of planning and housing development recorded in the survey this year, with increases of approximately thirteen percent recorded. This is an unusually large one-year change, and is clearly related to the fact that half as many respondents consider planning and development as an issue this year compared to last year. Metropolis Research is of the view that this is likely to be something of an outlier result this year, and there is a reasonable expectation that satisfaction with planning and development may decline somewhat next year to more historic norms.

Bayside City Council – 2019 Annual Community Satisfaction Survey
Page 44 of 152
Traffic management
In 2019, 14.8% of respondents identified issues with traffic management, almost identical to the 2018 result of 14.3%. This category includes primarily issues with traffic congestion and commuting times. It also includes issues with the speed and volume of traffic. Issues specific to the condition of roads such as potholes are separated categorised as “road maintenance and repairs”.
As discussed last year, respondents that identified traffic management as an issue on average reported a satisfaction with Council’s overall performance marginally higher than the municipal average. This does suggest that for many of these respondents, they are sufficiently aware of the State Government responsibility for main road issues and are not negatively disposed towards Bayside City Council because of their concern around traffic management. Road maintenance and repairs The associated issue of road maintenance and repairs declined marginally this year, down from 8.9% to 5.1%. The small sample of 36 respondents that nominated road maintenance and repair related issues, were on average somewhat, but not measurably less satisfied with Council’s overall performance than the municipal average. Beach, foreshore, environment and sustainability Metropolis Research notes that a slightly higher proportion of respondents in the City of Bayside nominated environment and sustainability issues than the metropolitan Melbourne average (4.6% compared to 3.0%). In addition, a further five percent of respondents nominated issues with the beach and foreshore, including cleaning, maintenance and protection related issues. Council governance and leadership There was a small decline this year in the proportion of respondents who nominated Council governance and leadership issues, down from 3.4% to 1.4%. This decline is consistent with the 7.1% increase in satisfaction with aspects of leadership and governance recorded this year. Along with the decline in planning and development issues and its related increase in satisfaction with planning and development process and outcomes, the increase in satisfaction with leadership and governance is one of the key results from the survey this year. Metropolis Research does note that the very small sample of just eight respondents who nominated Council governance and leadership issues remain measurably less satisfied with Council’s overall performance than the municipal average, at 6.23 compared to the municipal average of 7.32.

Bayside City Council – 2019 Annual Community Satisfaction Survey
Page 45 of 152
Top three issues for the City of Bayside at the moment
Bayside City Council - 2019 Annual Community Satisfaction Survey
(Number and percent of total respondents)
Number Percent
Car parking 151 21.5% 18.0% 14.6%
Planning, building and development 147 20.9% 39.1% 7.3%
Traffic management 104 14.8% 14.3% 20.3%
Street trees 58 8.3% 6.7% 6.5%
Footpath maintenance and repairs 37 5.3% 6.1% 6.5%
Roads maintenance and repairs 36 5.1% 8.9% 7.0%
Beach and foreshore cleaning and maintenance 35 5.0% 8.9% n.a.
Parks, gardens and open space 35 5.0% 7.0% 6.0%
Safety, policing and crime 33 4.7% 4.7% 6.3%
Environment, sustainability, climate change 32 4.6% 6.9% 3.0%
Public transport 28 4.0% 5.3% 5.1%
Sports and recreation facil ities 26 3.7% 4.0% 1.5%
Cleanliness and maintenance of the area 23 3.3% 2.1% 3.1%
Recycling collection 22 3.1% 2.6% 3.6%
Drains maintenance and repairs 21 3.0% 3.6% 1.9%
Rubbish and waste issues including garbage 21 3.0% 3.3% 3.9%
Council rates 21 3.0% 2.4% 3.2%
Cycling / walking paths and tracks 20 2.8% 2.0% 2.5%
Elderly services and facil ities 14 2.0% 5.1% 0.7%
Animal management 13 1.9% 3.3% 3.0%
Communication and provision of information 11 1.6% 3.1% 1.5%
General infrastructure (e.g. internet, electricity) 11 1.6% 2.1% 1.3%
Council governance and performance 10 1.4% 3.4% 0.3%
Community services quality and provision 10 1.4% 2.4% 0.2%
Public toilets 10 1.4% 0.9% 1.1%
Financial issues and priorities for Council 8 1.1% 2.6% 0.3%
Hard rubbish collection 8 1.1% 1.1% 1.9%
Children activities and facil ities 8 1.1% 0.9% 0.7%
Shops, restaurants, bars and entertainment 7 1.0% 1.0% 1.0%
Heritage / character 6 0.9% 1.9% 0.3%
Community facil ities provision and maintenance 6 0.9% 1.1% 0.3%
Youth activities, services, and facil ities 5 0.7% 2.0% 0.3%
Disability services, facil ities, and activities 5 0.7% 1.3% 0.2%
Green waste collection 9 1.3% 0.3% 2.0%
Street cleaning and maintenance 8 1.1% 0.7% 2.9%
Local laws enforcement and updating 8 1.1% 0.1% 0.6%
Lighting 7 1.0% 0.4% 6.6%
All other issues (27 separately identified) 49 7.0% 8.6% 9.9%
Total responses 1,364 1,682
Respondents identifying at least one aspect587
(83.3%)
849
(69.4%)
(*) 2019 metropolitan Melbourne average from Governing Melbourne
Response2019 2019
Metro.*
1,063
534
(76.1%)
2018

Bayside City Council – 2019 Annual Community Satisfaction Survey
Page 46 of 152
Issues by precinct
There was some variation in the top issues to address in the City of Bayside at the moment observed across the nine precincts comprising the municipality. Metropolis Research notes that the total sample for each precinct is only approximately seventy-eight respondents, and that as a result there is a relatively large confidence interval around these results. Attention is however drawn to the following precinct-level variation in the top issues to address:
• Hampton East – respondents were somewhat more likely than average to identify planning and development, rubbish and waste issues including garbage, and the quality and provision of community services.
• Sandringham – respondents were somewhat more likely than average to identify the cleaning and maintenance of beach and foreshore.
• Hampton – respondents were somewhat more likely than average to identify planning and development related issues.
• Cheltenham – respondents were somewhat more likely than average to identify traffic management, public transport, safety, policing and crime related issues, environment and sustainability, and elderly person services and facilities.
• Brighton East – respondents were no more likely than average to identify any specific issues.
• Brighton – respondents were somewhat more likely than average to identify car parking, and cleanliness and maintenance of the area.
• Beaumaris – respondents were somewhat more likely than average to identify the provision and maintenance of street trees.
• Black Rock – respondents were somewhat more likely than average to identify traffic management, and footpath maintenance and repairs.
• Highett – respondents were somewhat more likely than average to identify planning and development, public transport, environment and sustainability, elderly person services and facilities, and communication and consultation related issues.

Bayside City Council – 2019 Annual Community Satisfaction Survey
Page 47 of 152
Top three issues for the City of Bayside at the moment by precinct
Bayside City Council - 2019 Annual Community Satisfaction Survey
(Number and percent of total respondents)
Car parking 20.5% Car parking 31.4%
Planning and development 17.0% Planning and development 19.8%
Traffic management 12.5% Traffic management 14.0%
Safety, policing and crime 8.0% Parks, gardens and open spaces 8.1%
Beach and foreshore 8.0% Cleanliness and maintenance of area 8.1%
Parks, gardens and open spaces 6.8% Road maintenance and repairs 8.1%
Street trees 6.8% Footpath maintenance and repairs 8.1%
Public transport 5.7% Drains maintenance and repairs 4.7%
Road maintenance and repairs 5.7% Environment and sustainability 4.7%
Recycling collection 4.5% Street trees 4.7%
All other issues 61.4% All other issues 57.0%
Respondents identifying an issue64
(72.7%)Respondents identifying an issue
70
(81.4%)
Planning and development 19.3% Traffic management 23.3%
Street trees 13.6% Car parking 22.1%
Traffic management 12.5% Footpath maintenance and repairs 10.5%
Car parking 8.0% Street trees 10.5%
Safety, policing and crime 8.0% Planning and development 5.8%
Environment and sustainability 6.8% Drains maintenance and repairs 4.7%
Footpath maintenance and repairs 6.8% Rubbish and waste issues 4.7%
Sports and recreation facil ities 5.7% Beach and foreshore 4.7%
Council rates 4.5% Sports and recreation facil ities 4.7%
Cycling / walking paths and tracks 4.5% Road maintenance and repairs 3.5%
All other issues 42.0% All other issues 33.7%
Respondents identifying an issue64
(72.7%)Respondents identifying an issue
63
(73.3%)
Planning and development 27.6% Traffic management 39.7%
Traffic management 15.5% Planning and development 20.7%
Car parking 13.8% Car parking 19.0%
Public transport 10.3% Public transport 12.1%
Street trees 10.3% Safety, policing and crime 10.3%
Environment and sustainability 8.6% Environment and sustainability 8.6%
Parks, gardens and open spaces 6.9% Street trees 8.6%
Elderly person services and facil ities 5.2% Elderly person services and facil ities 5.2%
Communication and consultation 5.2% Cleanliness and maintenance of area 3.4%
Footpath maintenance and repairs 5.2% Local laws enforcement and updating 3.4%
All other issues 53.4% All other issues 36.2%
Respondents identifying an issue43
(74.1%)Respondents identifying an issue
47
(81.0%)
Cheltenham
Brighton East Brighton
Beaumaris Black Rock
Highett

Bayside City Council – 2019 Annual Community Satisfaction Survey
Page 48 of 152
Top three issues for the City of Bayside at the moment by precinct
Bayside City Council - 2019 Annual Community Satisfaction Survey
(Number and percent of total respondents)
Planning and development 29.3% Planning and development 23.7%
Car parking 25.9% Car parking 23.7%
Traffic management 17.2% Traffic management 15.1%
Road maintenance and repairs 6.9% Street trees 10.8%
Footpath maintenance and repairs 6.9% Beach and foreshore 9.7%
Rubbish and waste issues inc garbage 6.9% Parks, gardens and open spaces 6.5%
Public transport 5.2% Environment and sustainability 5.4%
Environment and sustainability 5.2% Road maintenance and repairs 4.3%
Community services 5.2% Sports and recreation facil ities 4.3%
Street trees 5.2% Communication and consultation 4.3%
All other issues 51.7% All other issues 46.2%
Respondents identifying an issue47
(81.0%)Respondents identifying an issue
64
(68.8%)
Planning and development 28.4% Car parking 21.5%
Car parking 26.1% Planning and development 20.9%
Traffic management 12.5% Traffic management 14.8%
Street trees 9.1% Street trees 8.3%
Road maintenance and repairs 6.8% Footpath maintenance and repairs 5.3%
Council rates 4.5% Road maintenance and repairs 5.1%
Recycling collection 4.5% Beach and foreshore 5.0%
Rubbish and waste 4.5% Parks, gardens and open space 5.0%
Drains maintenance and repairs 3.4% Safety, policing and crime 4.7%
Green waste collection 3.4% Environment and sustainability 4.6%
All other issues 40.9% All other issues 56.3%
Respondents identifying an issue69
(78.4%)Respondents identifying an issue
534
(76.1%)
Parking 24.7% Traffic management 20.3%
Traffic management 15.5% Car parking 14.6%
Building, housing, planning, development 12.8% Building, housing, planning, development 7.3%
Lighting 9.6% Roads maintenance and repairs 7.0%
Street cleaning and maintenance 9.1% Lighting 6.6%
Roads maintenance and repairs 7.8% Street trees / nature strips 6.5%
Safety, policing and crime 7.8% Footpath maintenance and repairs 6.5%
Recycling collection 7.3% Safety, policing and crime 6.3%
Parks, gardens and open spaces 6.8% Parks, gardens and open space 6.0%
Public transport 6.8% Public transport 5.1%
All other issues 69.9% All other issues 51.1%
Respondents identifying an issue183
(83.6%)Respondents identifying an issue
849
(69.4%)
Inner-eastern region Metropolitan Melbourne
City of Bayside
Hampton East Sandringham
Hampton

Bayside City Council – 2019 Annual Community Satisfaction Survey
Page 49 of 152
Issues by respondent profile
The following tables provide a breakdown of the top issues to address in the City of Bayside at the moment by respondent age structure, gender and language spoken at home. Metropolis Research notes the relatively small sample size for some age groups, and that should be borne in mind when interpreting these results. Attention is drawn to the following:
• Male – respondents were somewhat more likely than female respondents to identify parks, gardens and open spaces.
• Female – respondents were somewhat more likely than male respondents to identify car parking, and footpath maintenance and repairs.
• English speaking households – respondents were somewhat more likely than respondents from multi-lingual households to identify planning and development related issues.
• Multi-lingual households – respondents were somewhat more likely than respondents from English speaking households to identify street trees, and safety, policing and crime related issues.
• Adolescents (aged 15 to 19 years) – respondents were no more likely than average to identify any specific issues, based on a sample of just eighteen respondents.
• Young adults (aged 20 to 34 years) – respondents were somewhat more likely than average to identify public transport, and parks, gardens and open spaces.
• Adults (aged 35 to 44 years) – respondents were somewhat more likely than average to identify animal management.
• Middle-aged and older adults (aged 45 to 74 years) – respondents were somewhat more likely than average to identify planning and development, recycling collection, and the provision and maintenance of sports and recreation facilities.
• Older adults (aged 60 to 74 years) – respondents were somewhat more likely than average to identify car parking, and planning and development related issues.
• Senior citizens (aged 75 years and over) – respondents were somewhat more likely than average to identify footpath maintenance and repairs, elderly person services and facilities, and the cleanliness and maintenance of the area.

Bayside City Council – 2019 Annual Community Satisfaction Survey
Page 50 of 152
Top three issues for the City of Bayside at the moment by respondent profile
Bayside City Council - 2019 Annual Community Satisfaction Survey
(Number and percent of total respondents)
Planning and development 21.8% Car parking 23.7%
Car parking 19.2% Planning and development 20.1%
Traffic management 15.3% Traffic management 14.3%
Street trees 7.4% Street trees 9.1%
Parks, gardens and open spaces 7.1% Footpath maintenance and repairs 6.6%
Road maintenance and repairs 5.0% Environment and sustainability 6.1%
Safety, policing and crime 5.0% Road maintenance and repairs 5.2%
Beach and foreshore 4.7% Beach and foreshore 5.2%
Public transport 4.4% Safety, policing and crime 4.7%
Cleanliness and maintenance of area 4.1% Drains maintenance and repairs 4.4%
All other issues 54.3% All other issues 55.1%
Respondents identifying an issue257
(75.9%)Respondents identifying an issue
276
(76.2%)
Planning and development 23.7% Car parking 21.8%
Car parking 21.2% Traffic management 12.0%
Traffic management 15.3% Street trees 10.5%
Street trees 7.7% Planning and development 10.5%
Footpath maintenance and repairs 5.5% Safety, policing and crime 9.8%
Parks, gardens and open spaces 5.3% Beach and foreshore 5.3%
Road maintenance and repairs 5.2% Footpath maintenance and repairs 4.5%
Beach and foreshore 4.8% Road maintenance and repairs 3.8%
Environment and sustainability 4.8% Parks, gardens and open spaces 3.8%
Public transport 4.1% Council rates 3.8%
All other issues 55.8% All other issues 57.9%
Respondents identifying an issue432
(76.9%)Respondents identifying an issue
96
(72.3%)
Male Female
English speaking Multi-lingual
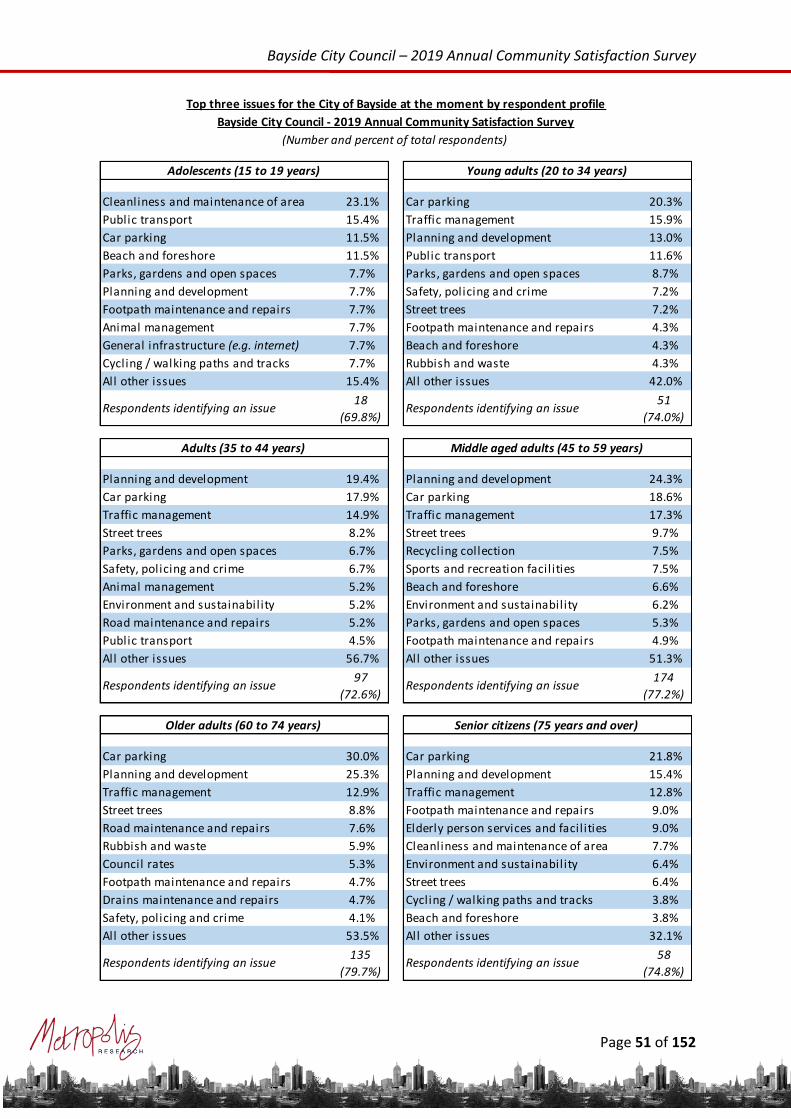
Bayside City Council – 2019 Annual Community Satisfaction Survey
Page 51 of 152
Top three issues for the City of Bayside at the moment by respondent profile
Bayside City Council - 2019 Annual Community Satisfaction Survey
(Number and percent of total respondents)
Cleanliness and maintenance of area 23.1% Car parking 20.3%
Public transport 15.4% Traffic management 15.9%
Car parking 11.5% Planning and development 13.0%
Beach and foreshore 11.5% Public transport 11.6%
Parks, gardens and open spaces 7.7% Parks, gardens and open spaces 8.7%
Planning and development 7.7% Safety, policing and crime 7.2%
Footpath maintenance and repairs 7.7% Street trees 7.2%
Animal management 7.7% Footpath maintenance and repairs 4.3%
General infrastructure (e.g. internet) 7.7% Beach and foreshore 4.3%
Cycling / walking paths and tracks 7.7% Rubbish and waste 4.3%
All other issues 15.4% All other issues 42.0%
Respondents identifying an issue18
(69.8%)Respondents identifying an issue
51
(74.0%)
Planning and development 19.4% Planning and development 24.3%
Car parking 17.9% Car parking 18.6%
Traffic management 14.9% Traffic management 17.3%
Street trees 8.2% Street trees 9.7%
Parks, gardens and open spaces 6.7% Recycling collection 7.5%
Safety, policing and crime 6.7% Sports and recreation facil ities 7.5%
Animal management 5.2% Beach and foreshore 6.6%
Environment and sustainability 5.2% Environment and sustainability 6.2%
Road maintenance and repairs 5.2% Parks, gardens and open spaces 5.3%
Public transport 4.5% Footpath maintenance and repairs 4.9%
All other issues 56.7% All other issues 51.3%
Respondents identifying an issue97
(72.6%)Respondents identifying an issue
174
(77.2%)
Car parking 30.0% Car parking 21.8%
Planning and development 25.3% Planning and development 15.4%
Traffic management 12.9% Traffic management 12.8%
Street trees 8.8% Footpath maintenance and repairs 9.0%
Road maintenance and repairs 7.6% Elderly person services and facil ities 9.0%
Rubbish and waste 5.9% Cleanliness and maintenance of area 7.7%
Council rates 5.3% Environment and sustainability 6.4%
Footpath maintenance and repairs 4.7% Street trees 6.4%
Drains maintenance and repairs 4.7% Cycling / walking paths and tracks 3.8%
Safety, policing and crime 4.1% Beach and foreshore 3.8%
All other issues 53.5% All other issues 32.1%
Respondents identifying an issue135
(79.7%)Respondents identifying an issue
58
(74.8%)
Adolescents (15 to 19 years) Young adults (20 to 34 years)
Adults (35 to 44 years) Middle aged adults (45 to 59 years)
Older adults (60 to 74 years) Senior citizens (75 years and over)

Bayside City Council – 2019 Annual Community Satisfaction Survey
Page 52 of 152
Correlation between issues and satisfaction with Council’s overall performance
The following graph provides a comparison of satisfaction with Council’s overall performance for respondents that identified the eleven most commonly identified issues in the City of Bayside at the moment compared to the municipal average overall satisfaction. For example, the overall satisfaction with Council was rated at 7.32 out of ten, whilst respondents that identified issues with parks and gardens rated satisfaction somewhat higher than this at 7.50.
There were no significant issues this year nominated by respondents who were also measurably more satisfied with Council’s overall performance. There were however a number of issues that were identified by respondents who were also on average less satisfied with Council’s overall performance. This implies that these issues were a negative influence on the respondents’ satisfaction with Council’s overall performance.
• Building, housing, planning and development issues – respondents nominating these issues were on average measurably less satisfied with Council’s overall performance than the municipal average, with an average satisfaction score of 6.85 compared to the municipal average of 7.32. This is a significantly smaller difference in satisfaction than was observed last year, which again suggests that the sample of respondents this year were significantly less dissatisfied with planning and development issues and outcomes than last year. Metropolis Research does offer a note of caution however, as this does appear to be an overly large change to occur in a single year. It could well be the case that the overly positive results in relation to planning and development recorded this year may well be somewhat of an outlier, and that a realignment could well occur next year.
7.65 7.50 7.40 7.34 7.32 7.18 7.01 6.93 6.86 6.85 6.73
0
1
2
3
4
5
6
7
8
9
10
Satisfaction with Council's overall performance by top issuesBayside City Council - 2019 Annual Community Satisfaction Survey
scale from 0 (very dissatisfied) to 10 (very satisfied)

Bayside City Council – 2019 Annual Community Satisfaction Survey
Page 53 of 152
• Car parking, street trees, and road maintenance and repairs – respondents nominating these issues were on average mildly less satisfied with Council’s overall performance than the municipal average. Whilst this variation was not statistically significant at the 95% confidence level, Metropolis Research is of the view that these issues may exert a mildly negative influence on these respondents’ satisfaction with Council.
• Environment and sustainability - attention is drawn to the fact that the small sample of 32 respondents that nominated environment and sustainability related issues were on average somewhat less satisfied with Council’s overall performance than the municipal average. This result is not statistically significant, and may well be a one-off unusual result this year. In 2018, respondents who identified these issues were on average mildly, but not measurably more satisfied with Council’s overall performance. A closer look at the verbatim comments for this issue may be a worthwhile exercise.
Planning and population
Planning for population growth
Respondents were read the following preamble:
The State Government has planned for the population of Bayside to continue growing by
approximately 13,000 over the next 20 years. The responsibility for providing services, transport infrastructure, and facilities rests with both Council and the State Government.
Respondents were then asked:
“On a scale of 0 (lowest) to 10 (highest), can you please rate your satisfaction with planning for population growth?”
Satisfaction with “planning for population growth” by all levels of government increased measurably and significantly this year, up 14.8% to 6.43 and is now at a “solid” rather than a “poor” level. By way of comparison, satisfaction with planning for population growth in the City of Bayside was measurably higher than the 2019 metropolitan Melbourne average of 6.22 and the inner eastern region councils' average of 6.01. Metropolis Research notes that in other sections of this report it is reported that satisfaction with planning and housing development has increased in the City of Bayside this year, and that the proportion of respondents nominating planning and housing development issues as one of the top three issues to address in the municipality has decreased substantially this year. There was also a measurable increase in respondents’ satisfaction with Council’s advocacy in relation to planning and housing development. These results are all internally consistent, reflecting a diminished level of concern around planning issues in the municipality this year.

Bayside City Council – 2019 Annual Community Satisfaction Survey
Page 54 of 152
Metropolis Research however inserts a note of caution in relation to these results, suggesting that they may well be something of an outlier result this year, over-estimating the increase in community satisfaction with planning and housing development outcomes in the municipality.
Consistent with the measurable increase in average satisfaction with planning for population growth by all levels of government this year, there was a significant increase in the proportion of respondents “very satisfied” (i.e. rating satisfaction at eight or more), and a significant decrease in the proportion of respondents dissatisfied (i.e. rating satisfaction at zero to four). Metropolis Research draws attention to the fact that, despite the significant increase in average satisfaction this year, approximately one-sixth (16.3%) of respondents remain dissatisfied with planning for population growth in Bayside by all levels of government.
5.60
6.43
0
1
2
3
4
5
6
7
8
9
10
2018 2019
Satisfaction with planning for population growthBayside City Council - 2019 Annual Community Satisfaction Survey
scale from 0 (very dissatisfied) to 10 (very satisfied)

Bayside City Council – 2019 Annual Community Satisfaction Survey
Page 55 of 152
There was measurable and significant variation in satisfaction with planning for population growth by all levels of government observed across the municipality, as follows:
• Beaumaris – respondents were measurably more satisfied than average and at a “very good” level.
• Highett – respondents were measurably less satisfied than average and at a “very poor” level.
28.2%16.3%
49.5% 45.7%
22.3%38.0%
-40%
-20%
0%
20%
40%
60%
80%
100%
2018 2019
Satisfaction with planning for population growthBayside City Council - 2019 Annual Community Satisfaction Survey
(Percent of respondents providing a response)
Very satisfied
Neutral to somewhat satisfied
Dissatisfied
7.266.91 6.72 6.70 6.65 6.43 6.31 6.23 6.22 6.01 6.00
5.10
0
1
2
3
4
5
6
7
8
9
10
Satisfaction with planning for population growthBayside City Council - 2019 Annual Community Satisfaction Survey
scale from 0 (very dissatisfied) to 10 (very satisfied)

Bayside City Council – 2019 Annual Community Satisfaction Survey
Page 56 of 152
The following graphs provide a breakdown of satisfaction with planning for population growth by all levels of government by respondent profile, including age structure, gender, language spoken at home, housing situation, household disability status, period of residence in the City of Bayside, and household structure. As discussed in the 2018 report, there was some variation in satisfaction observed, as follows:
• More satisfied than average – young respondents (aged 15 to 34 years), group households, rental households, and new residents (less than one year in Bayside).
• Less satisfied than average – middle-aged and older respondents (aged 45 to 74 years), home owners, and long-term residents (ten years or more in Bayside).
7.1%12.8% 13.3% 15.8% 16.1% 16.2% 16.3% 16.9% 18.6% 21.0% 21.9%
32.7%
40.5% 46.8%56.0%
24.6%
55.9%
33.8%45.7%
37.3%46.5% 48.2% 53.4% 50.0%
52.4% 40.4%30.7%
59.6%
28.0%
50.0%38.0%
45.8% 34.9% 30.8% 24.7%17.3%
-40%
-20%
0%
20%
40%
60%
80%
100%
Satisfaction with planning for population growthBayside City Council - 2019 Annual Community Satisfaction Survey
(Percent of respondents providing a response)
Very satisfied
Neutral to somewhat satisfied
Dissatisfied

Bayside City Council – 2019 Annual Community Satisfaction Survey
Page 57 of 152
7.04 6.92 6.76
6.16 6.26 6.41 6.38 6.48 6.41 6.48 6.43
0
1
2
3
4
5
6
7
8
9
10
Adol'escents
Youngadults
Adults Middle-aged
adults
Olderadults
Seniorcitizens
Male Female Englishspeakingh'sehold
Multi-lingual
h'sehold
City ofBayside
Satisfaction with planning for population growth by respondent profileBayside City Council - 2019 Annual Community Satisfaction Survey
scale from 0 (very dissatisfied) to 10 (very satisfied)
6.716.20 5.98
6.295.92
6.52
7.70
6.60 6.43
0
1
2
3
4
5
6
7
8
9
10
Two parent(youngest0 - 4 yrs)
Two parent(youngest5 - 12 yrs)
Two parent(youngest13 - 18 yrs)
Two parent(adults only)
One parentfamily
Couple onlyhousehold
Grouphousehold
Sole personhousehold
City ofBayside
Satisfaction with planning for population growth by household structureBayside City Council - 2019 Annual Community Satisfaction Survey
scale from 0 (very dissatisfied) to 10 (very satisfied)

Bayside City Council – 2019 Annual Community Satisfaction Survey
Page 58 of 152
Concerns you most about population growth in the municipality
Respondents were then asked:
“If you rated satisfaction less than 5, what concerns you most about population growth in the municipality?”
A total of 84 responses were received from respondents in relation to what concerns them most about population growth in the municipality. These open-ended responses have been broadly categorised as outlined in the following tables.
Consistent with the result obtained last year, more than one-third (40.5% up from 38.6%) of responses related in general terms to concerns about the planning and development outcomes such as the number, and size of developments, as well as the number of people moving into new developments. One-quarter of responses related to perceived impacts on parking, traffic and roads, approximately one-sixth of responses related to perceived impacts on physical infrastructure, and almost ten percent were concerned about the perceived impact on the availability of services and facilities.
6.36 6.416.85
7.49
6.596.85
6.22 6.44 6.43 6.43
0
1
2
3
4
5
6
7
8
9
10
Own thishome
Mortgage Privaterental
Less thanone year
One to lessthan five
years
Five to lessthan ten
years
Ten yearsor more
Householdwith a
disability
Householdwithout adisability
City ofBayside
Satisfaction with planning for population growth by housing situation, period of residence and disability
Bayside City Council - 2019 Annual Community Satisfaction Survey
scale from 0 (very dissatisfied) to 10 (very satisfied)

Bayside City Council – 2019 Annual Community Satisfaction Survey
Page 59 of 152
Most concerns regarding population growth in the municipality
Bayside City Council - 2019 Annual Community Satisfaction Survey
(Number of total responses)
Number Percent
Planning and development 34 40.5% 38.6%
Parking, traffic and roads 21 25.0% 19.3%
Infrastructure 14 16.7% 19.3%
Services and facilities 8 9.5% 5.0%
Other 7 8.3% 17.8%
Total 84 100% 202
2018Response2019
Over population and overcrowding 10
Too much development / high density 8
I am not aware of what the plans are for population growth 5
All the high rise buildings are being built without consideration of population 2
Population grows too fast 2
Closely bound houses like units 1
Crowded linked to development issue and beaches will be busy 1
Don't believe this is the area to be expanding 1
Don't want sub-divisions 1
High density housing is damaging the character of the area 1
No space for housing, I don't want to see high rise apartments 1
Too many buildings have been built without planning 1
Lack of infrastructure 6
Don't want more people here. Should improve infrastructure and rail for this area 1
Inadequate infrastructure 1
Infrastructure - sewerage, power, water 1
Need to make sure all the infrastructure before population growth 1
State government is spending more on infrastructure but cannot see the result 1
There is no good basis for understanding population, it will happen without required
infrastructure1
They are not planning road infrastructure 1
Too fast to cope with the current infrastructure 1
Most concerns regarding population growth in the municipality
Bayside City Council - 2019 Annual Community Satisfaction Survey
(Number of responses)
Response Number
Planning and development
Infrastructure

Bayside City Council – 2019 Annual Community Satisfaction Survey
Page 60 of 152
Parking issue 7
Traffic problem due to high density buildings 3
More traffic - not enough infrastructure 2
Need to improve traffic management 2
Increase in number of cars, decrease in safety 1
Lack of planning in traffic, parking, infrastructure overcrowded 1
More population makes more noise disturbance through traffic 1
No traffic management 1
Road traffic levels 1
They can do the roads and the infrastructure better 1
Too many cars around and not enough spaces 1
Schools all overcrowded 2
Demand for the facil ity 1
Need more facil ities 1
Need more services to accommodate more people 1
No investment in the vil lage and business facil ities 1
Services and infrastructure will not be able to keep up - especially need better schools /
hospitals / public transport for increased population1
Very poor, too much development without supporting services and facil ities 1
Enough people in the area 3
Can't ever imagine the Council tending to the needs of more people coming in, as they don't even
solve our current issues1
I don't want crowding, it l imits my enjoyment 1
It couldn't be quiet 1
It should be the job of Government more than the Council. They should do better in their core
than try to cover everything1
Total 84
Other
Parking, traffic and roads
Services and facilities
Most concerns regarding population growth in the municipality
Bayside City Council - 2019 Annual Community Satisfaction Survey
(Number of responses)
Response Number

Bayside City Council – 2019 Annual Community Satisfaction Survey
Page 61 of 152
Planning and housing development
Respondents were asked:
“On a scale of 0 (lowest) to 10 (highest), can you please rate your satisfaction with the following aspects of planning and housing development in your local area? If any aspect rated less than 5, why
do you say that?”
Respondents were again in 2019, asked to rate satisfaction with seven aspects of planning and housing development in their local area, as outlined in the following graph. Satisfaction with these seven aspects can best be summarised as follows:
• Good – for opportunities to participate in consultations on planning, and guidance available from Council policies and controls.
• Solid – for the protection of local heritage, the appearance and quality of new developments, planning decisions respecting neighbourhood character, and the size, height and set-back distance of buildings.
• Poor – for the number of new developments. Whilst one-quarter of respondents were very satisfied with this aspect, one-fifth were dissatisfied.
As discussed in the following pages, satisfaction with all these aspects of planning and housing development increased measurably this year. The average increase in satisfaction with these seven aspects of planning and housing development was thirteen percent. Metropolis Research notes that satisfaction with many aspects of Council performance increased measurably this year, including planning and housing development. There was also a significant decrease in the proportion of respondents nominating planning and housing development issues as one of the top three issues to address in the municipality. These results do suggest that the diminished levels of concern around planning and housing development may well be a significant factor underpinning the increase in satisfaction with the performance of Bayside City Council this year. That said, Metropolis Research suggests that the scale of the increase in satisfaction recorded this year may be something of an outlier, and it would not be unreasonable to expect a small realignment of satisfaction next year. There were only two of these seven aspects included in the Governing Melbourne research conducted independently by Metropolis Research. Both of these aspects; “the protection of local heritage” and “the appearance and quality of new developments” were measurably and significantly lower in the City of Bayside than the averages of 2019 metropolitan Melbourne and the inner eastern region councils.
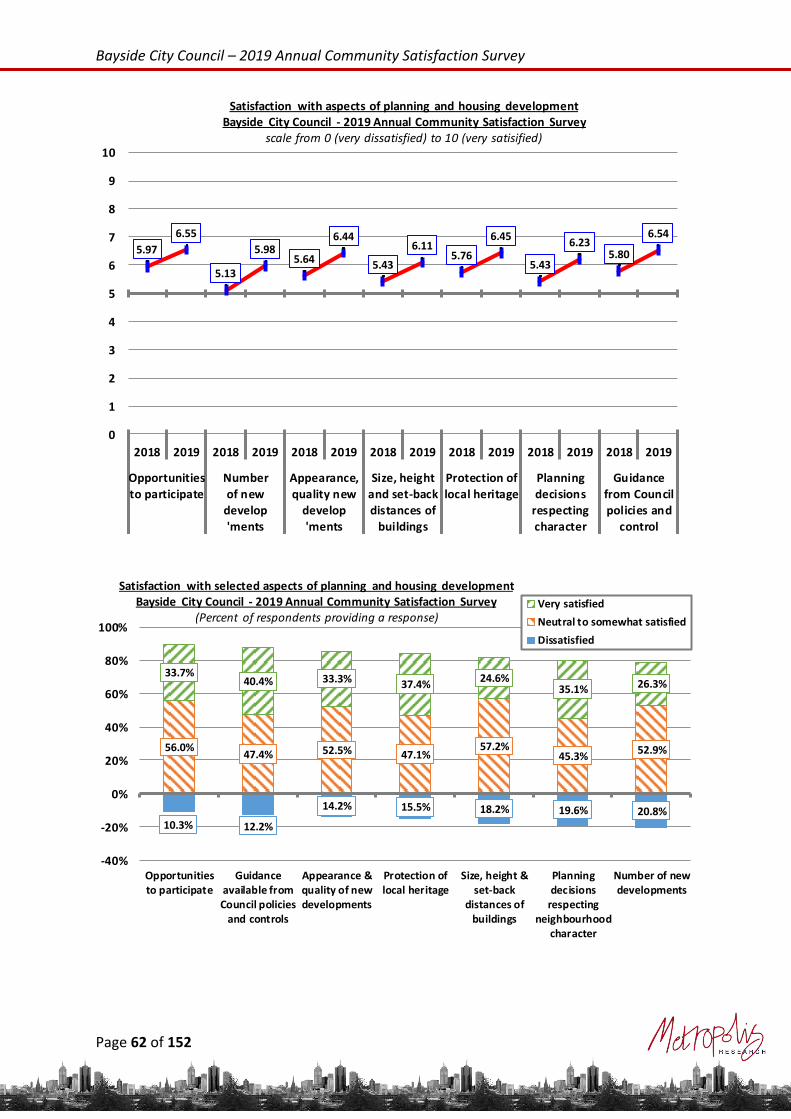
Bayside City Council – 2019 Annual Community Satisfaction Survey
Page 62 of 152
5.97
6.55
5.13
5.985.64
6.44
5.43
6.115.76
6.45
5.43
6.235.80
6.54
0
1
2
3
4
5
6
7
8
9
10
2018 2019 2018 2019 2018 2019 2018 2019 2018 2019 2018 2019 2018 2019
Opportunities
to participate
Number
of new
develop
'ments
Appearance,
quality new
develop
'ments
Size, height
and set-back
distances of
buildings
Protection of
local heritage
Planning
decisions
respecting
character
Guidance
from Council
policies and
control
Satisfaction with aspects of planning and housing developmentBayside City Council - 2019 Annual Community Satisfaction Survey
scale from 0 (very dissatisfied) to 10 (very satisified)
10.3% 12.2%
14.2% 15.5% 18.2% 19.6% 20.8%
56.0%47.4% 52.5% 47.1%
57.2%45.3%
52.9%
33.7%40.4% 33.3% 37.4%
24.6%35.1% 26.3%
-40%
-20%
0%
20%
40%
60%
80%
100%
Opportunitiesto participate
Guidanceavailable fromCouncil policies
and controls
Appearance &quality of newdevelopments
Protection oflocal heritage
Size, height &set-back
distances ofbuildings
Planningdecisions
respectingneighbourhood
character
Number of newdevelopments
Satisfaction with selected aspects of planning and housing developmentBayside City Council - 2019 Annual Community Satisfaction Survey
(Percent of respondents providing a response)Very satisfied
Neutral to somewhat satisfied
Dissatisfied

Bayside City Council – 2019 Annual Community Satisfaction Survey
Page 63 of 152
Appearance and quality of new developments
Satisfaction with the appearance and quality of new developments in the City of Bayside increased measurably and significantly this year, up 14.2% to 6.44, and is now at a “solid” rather than a “poor” level. There was measurable variation in satisfaction with the appearance and quality of new developments observed across the municipality, as follows:
• Black Rock and Beaumaris – respondents were measurably and significantly more satisfied than average, with respondents from Black Rock rating satisfaction at a “very good” level.
Satisfaction was notably, albeit not measurably lower in Highett, Hampton East, Sandringham, Brighton, and Hampton.
6.457.00 6.90
6.446.78 6.85
0
1
2
3
4
5
6
7
8
9
10
City of Bayside Inner East region metro. Melbourne City of Bayside Inner East region metro. Melbourne
Protection oflocal heritage
Appearance and qualitynew developments
Satisfaction with selected aspects of planning and housing developmentBayside City Council - 2019 Annual Community Satisfaction Survey
scale from 0 (very dissatisfied) to 10 (very satisfied)

Bayside City Council – 2019 Annual Community Satisfaction Survey
Page 64 of 152
There was also measurable variation in satisfaction with the appearance and quality of new developments observed by respondent profile, as follows:
• Age structure – satisfaction with the appearance and quality of new developments declined substantially with the respondents age.
• Gender – male respondents were somewhat, albeit not measurably more satisfied than female respondents.
• Housing situation – home owners and mortgagee households were measurably and significantly less satisfied than rental household respondents.
• Period of residence in the City of Bayside – satisfaction tended to decline with the period of residence in the municipality, with new residents (less than one year in Bayside) measurably and significantly more satisfied, whilst long-term residents (ten years or more) were measurably and significantly less satisfied.
• Dwelling type – respondents living in higher density housing were measurably and significantly more satisfied than respondents living in separate detached houses or semi-detached row or terrace housing.
7.32 7.146.85 6.78 6.60 6.49 6.44 6.25 6.20 6.17 6.15 6.10
0
1
2
3
4
5
6
7
8
9
10
Appearance and quality of new developments by precinctBayside City Council - 2019 Annual Community Satisfaction Survey
scale from 0 (very dissatisfied) to 10 (very satisfied)

Bayside City Council – 2019 Annual Community Satisfaction Survey
Page 65 of 152
Examples of and comments about specific developments
A total of 41 responses were received from respondents as to examples and comments about specific developments in the City of Bayside.
7.387.01
6.706.30 6.21 6.13
6.55 6.33 6.44
0
1
2
3
4
5
6
7
8
9
10
Adol'escents
Youngadults
Adults Middle-aged
adults
Olderadults
Seniorcitizens
Male Female City ofBayside
Appearance and quality of new developments by respondent profileBayside City Council - 2019 Annual Community Satisfaction Survey
scale from 0 (very dissatisfied) to 10 (very satisfied)
6.41 6.28
6.877.15
6.70 6.93
6.21 6.406.02
7.24
6.44
0
1
2
3
4
5
6
7
8
9
10
Own thishome
Mortgage Rentingthis
home
Less thanone year
One to lessthan five
years
Five to lessthan ten
years
Ten yearsor more
Separatehouse
Semi-detached,
row orterrace
Flat, unit,or
apartment
City ofBayside
Appearance and quality of new developments by housing profileBayside City Council - 2019 Annual Community Satisfaction Survey
scale from 0 (very dissatisfied) to 10 (very satisfied)
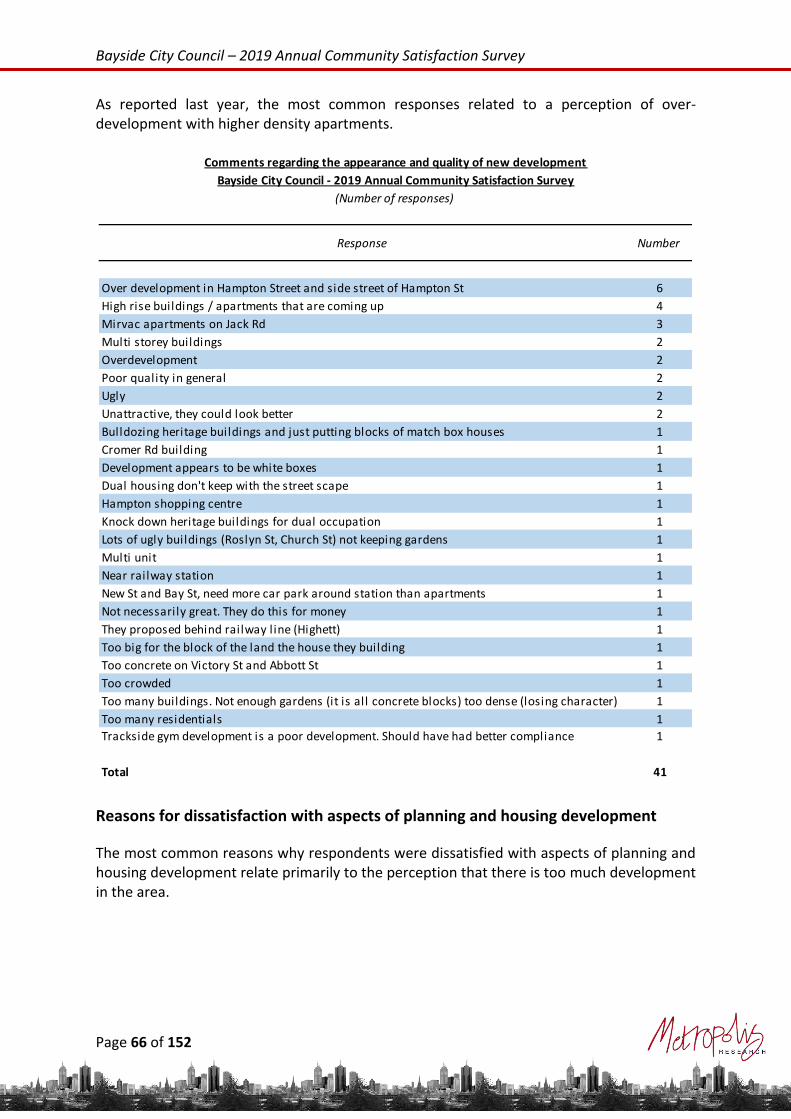
Bayside City Council – 2019 Annual Community Satisfaction Survey
Page 66 of 152
As reported last year, the most common responses related to a perception of over-development with higher density apartments.
Reasons for dissatisfaction with aspects of planning and housing development
The most common reasons why respondents were dissatisfied with aspects of planning and housing development relate primarily to the perception that there is too much development in the area.
Over development in Hampton Street and side street of Hampton St 6
High rise buildings / apartments that are coming up 4
Mirvac apartments on Jack Rd 3
Multi storey buildings 2
Overdevelopment 2
Poor quality in general 2
Ugly 2
Unattractive, they could look better 2
Bulldozing heritage buildings and just putting blocks of match box houses 1
Cromer Rd building 1
Development appears to be white boxes 1
Dual housing don't keep with the street scape 1
Hampton shopping centre 1
Knock down heritage buildings for dual occupation 1
Lots of ugly buildings (Roslyn St, Church St) not keeping gardens 1
Multi unit 1
Near railway station 1
New St and Bay St, need more car park around station than apartments 1
Not necessarily great. They do this for money 1
They proposed behind railway line (Highett) 1
Too big for the block of the land the house they building 1
Too concrete on Victory St and Abbott St 1
Too crowded 1
Too many buildings. Not enough gardens (it is all concrete blocks) too dense (losing character) 1
Too many residentials 1
Trackside gym development is a poor development. Should have had better compliance 1
Total 41
Comments regarding the appearance and quality of new development
Bayside City Council - 2019 Annual Community Satisfaction Survey
(Number of responses)
Response Number

Bayside City Council – 2019 Annual Community Satisfaction Survey
Page 67 of 152
Overdevelopment in the area 21
Too much high rise development 10
Heritage buildings are being demonised to build tall buildings 8
No consultation for development 7
New developments don't keep the neighbourhood character 5
Parking is going to be a big problem in the area 5
Inappropriate development 4
Not enough communication 3
The buildings are too big, not enough sunlight 3
They don't l isten to the community 3
Too crowded 3
Too much development being built, increased traffic due to increased residents l iving here 3
Buildings don't have enough setback 2
New developments don't seem to fit 2
They are creating environmentally unsustainable housing, loss of large trees 2
Too many units 2
All large apartment blocks, no consistent quality 1
Allowing too many exceptions 1
Change the entire suburb 1
Don't get informed unless Iook for it 1
Don't l ike the high rise in streets 1
Hard to find policies 1
I am worried there is a lot of modern buildings and replacing them with package houses 1
I don't l ike 4 stories, Council should have more say about size of the buildings (inside
structure)1
I don't think they have done enough to communicate with community about policies 1
I think blocks of lands are being over-built upon, also concerned of new developments that
don't involve any vegetation - why not make green rooves compulsory1
It is not what it used to be because of buildings and units 1
Lack of understanding 1
Length of time taken to build, number of houses / flats built into one street at the same time 1
Low quality of these developments 1
More consultation of historical heritage required 1
Need more infrastructure 1
New development are double storey and dual occupancy sites 1
No apartment consistency, even within the same street 1
Not enough trees 1
Not happy with house sizes going smaller 1
Not happy with the decision at all of my surrounding suburbs 1
Not responsive to enquiring 1
Reason for dissatisfaction with selected aspects of planning and housing development
Bayside City Council - 2019 Annual Community Satisfaction Survey
(Number of responses)
Reason Number

Bayside City Council – 2019 Annual Community Satisfaction Survey
Page 68 of 152
Parking should be completely complied with - i .e. no dispensation should be allowed 1
Phoned many times in terms of property development, not useful 1
Poorly designed buildings gaining approval 1
Railway precinct development that went to VCAT is very high 1
Renewal of the traditional bushland character 1
Repetitive unimaginative development is unacceptable, too greedy development 1
Rules don't apply to everybody 1
Seems poorly planned and controlled 1
Shouldn't have gone too high 1
The buildings are unattractive, not suit the local streets styles 1
The distance should not be able to look over in other window, they don't plan well 1
They are inviting too many problems, and won't be able to deal with them 1
They should do more in protecting the local heritage 1
Too much high density development, no room for open space 1
Too restrictive on regulation 1
A lot of buildings, just building-to-building and fence-to-fence. They build from the start of
Reserve Rd, old houses were knocked down1
Along Church St, no protection 1
Congesting local roads, apartments clustered too tightly, too much pressure on Charman Rd 1
Hampton is a beachside community, with council policy decision making it's now turning into
wind tunnel1
High density development significantly changing Hampton character 1
Mayflower and Halcyon development with poor parking issue 1
Multiple examples of high rise buildings with inefficient parking allocation, Hampton St
becomes a bottleneck1
Over development in Hampton Street and side street of Hampton St 1
The buildings on Stanley Road 1
Total 129
Specific sites identified by respondents
Reason for dissatisfaction with selected aspects of planning and housing development
Bayside City Council - 2019 Annual Community Satisfaction Survey
(Number of responses)
Reason Number

Bayside City Council – 2019 Annual Community Satisfaction Survey
Page 69 of 152
Transport
Traffic and parking
Respondents were asked:
“On a scale of 0 (lowest) to 10 (highest), please rate your satisfaction with the following aspects of traffic and parking in the City of Bayside.”
Respondents were asked to rate their satisfaction with the speed and volume of traffic and safety whilst travelling on both main roads and residential streets, and the availability of parking on residential streets, main roads, and in and around shopping strips. Satisfaction with these aspects of traffic and parking can best be summarised as follows:
• Very Good – for the perception of safety whilst travelling on both residential streets and main roads. More than half of the respondents were very satisfied with these two aspects (rating eight or more), whilst less than five percent were dissatisfied.
• Good – for the speed of traffic on both residential streets and main roads. More than one-third of respondents were very satisfied with these two aspects, whilst one-sixth were dissatisfied with the speed of traffic on residential streets, and a little more than eight percent were dissatisfied with the speed of traffic on main roads.
• Solid – for the volume of traffic on both residential streets and main roads, and the availability of parking on main roads. Whilst a little less than one third of respondents were very satisfied with the volume of traffic on both residential streets and main roads, and approximately one-quarter of respondents were very satisfied with the availability of parking on main roads, more than one-sixth were dissatisfied with these three aspects.
• Poor – for the availability of parking on residential streets and in and around shopping strips. More than one-fifth of respondents were very satisfied with these two aspects, whilst approximately one-quarter were dissatisfied.
These results clearly indicate that there remains significant community concern with the volume of traffic on residential streets and main roads, and the availability of parking on residential streets, main roads, and in and around shopping areas. These results reflect the fact that car parking (21.5%) was the most commonly nominated issue as one of the top three issues to address in the municipality at the moment, and traffic management (14.8%) was the third most commonly nominated issue. These results in relation to the volume of traffic on residential streets and the availability of parking on both residential streets and main roads were marginally lower than the 2019 metropolitan Melbourne results from Governing Melbourne. They were however slightly higher than those recorded for the inner eastern region councils. Satisfaction with the speed of traffic was somewhat higher in the City of Bayside than both the inner eastern councils and the metropolitan Melbourne averages.
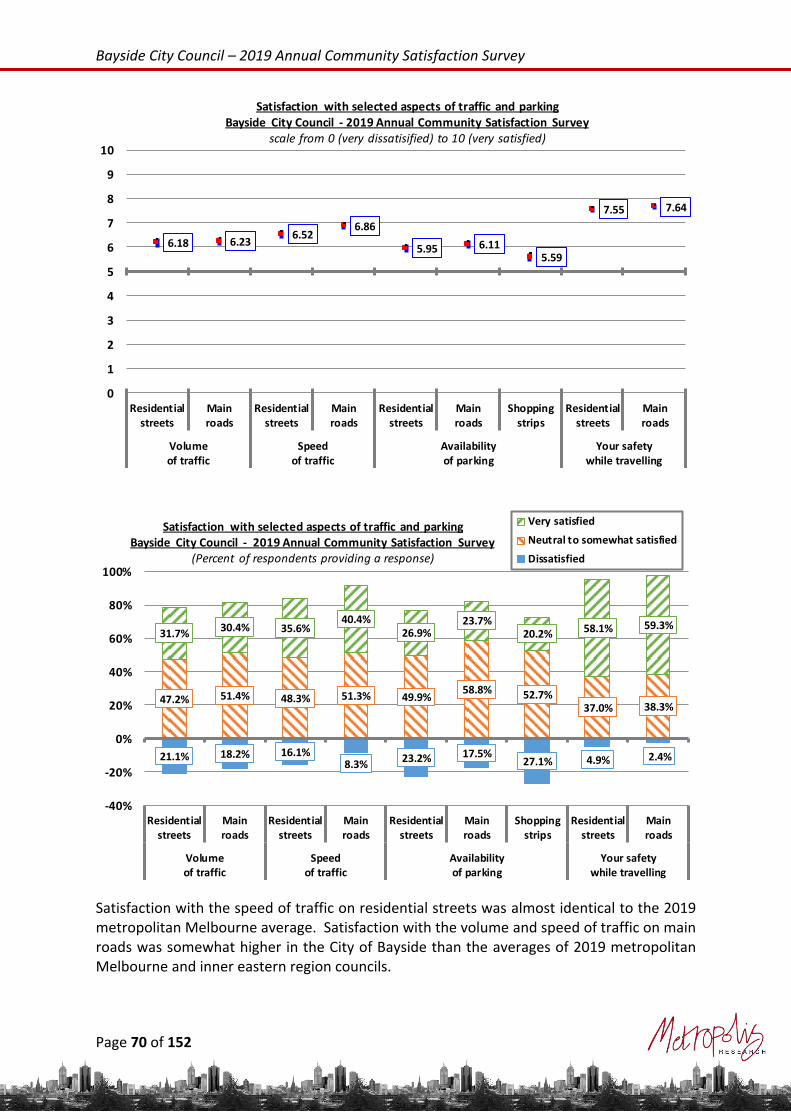
Bayside City Council – 2019 Annual Community Satisfaction Survey
Page 70 of 152
Satisfaction with the speed of traffic on residential streets was almost identical to the 2019 metropolitan Melbourne average. Satisfaction with the volume and speed of traffic on main roads was somewhat higher in the City of Bayside than the averages of 2019 metropolitan Melbourne and inner eastern region councils.
6.18 6.236.52
6.86
5.95 6.115.59
7.55 7.64
0
1
2
3
4
5
6
7
8
9
10
Residentialstreets
Mainroads
Residentialstreets
Mainroads
Residentialstreets
Mainroads
Shoppingstrips
Residentialstreets
Mainroads
Volumeof traffic
Speedof traffic
Availabilityof parking
Your safetywhile travelling
Satisfaction with selected aspects of traffic and parkingBayside City Council - 2019 Annual Community Satisfaction Survey
scale from 0 (very dissatisified) to 10 (very satisfied)
21.1% 18.2% 16.1%8.3%
23.2% 17.5%27.1% 4.9% 2.4%
47.2% 51.4% 48.3% 51.3% 49.9%58.8% 52.7%
37.0% 38.3%
31.7%30.4% 35.6%
40.4%26.9%
23.7%20.2% 58.1% 59.3%
-40%
-20%
0%
20%
40%
60%
80%
100%
Residentialstreets
Mainroads
Residentialstreets
Mainroads
Residentialstreets
Mainroads
Shoppingstrips
Residentialstreets
Mainroads
Volumeof traffic
Speedof traffic
Availabilityof parking
Your safetywhile travelling
Satisfaction with selected aspects of traffic and parkingBayside City Council - 2019 Annual Community Satisfaction Survey
(Percent of respondents providing a response)
Very satisfied
Neutral to somewhat satisfied
Dissatisfied

Bayside City Council – 2019 Annual Community Satisfaction Survey
Page 71 of 152
Volume of traffic
Satisfaction with the volume of traffic on both residential streets and main roads increased significantly in 2019. The level of satisfaction is now categorised as “solid”, which is an improvement on the “poor” recorded last year.
6.18 6.12 6.33 6.235.64 5.99
6.52 6.48 6.56 6.86 6.50 6.665.95 5.53
6.32 6.115.25
6.18
0
1
2
3
4
5
6
7
8
9
10Ci
ty o
f B
aysi
de
Inne
r Ea
st r
egio
n
met
ro. M
elb
.
City
of
Bay
side
Inne
r Ea
st r
egio
n
met
ro. M
elb
.
City
of
Bay
side
Inne
r Ea
st r
egio
n
met
ro. M
elb
.
City
of
Bay
side
Inne
r Ea
st r
egio
n
met
ro. M
elb
.
City
of
Bay
side
Inne
r Ea
st r
egio
n
met
ro. M
elb
.
City
of
Bay
side
Inne
r Ea
st r
egio
n
met
ro. M
elb
.
Residential streets
Mainroads
Residential streets
Mainroads
Residential streets
Mainroads
Volume of traffic Speed of traffic Availability of parking
Satisfaction with selected aspects of traffic and parkingBayside City Council - 2019 Annual Community Satisfaction Survey
scale from 0 (very dissatisfied) to 10 (very satisfied)
5.726.18
5.34
6.23
0
1
2
3
4
5
6
7
8
9
10
2018 2019 2018 2019
Residential streets Main roads
Satisfaction with the volume of trafficBayside City Council - 2019 Annual Community Satisfaction Survey
scale from 0 (very dissatisfied) to 10 (very satisfied)

Bayside City Council – 2019 Annual Community Satisfaction Survey
Page 72 of 152
There was measurable variation in satisfaction with the volume of traffic on residential streets observed across the municipality, with attention drawn to the following:
• Black Rock and Beaumaris – respondents rated satisfaction somewhat, albeit not measurably higher than the municipal average and at “good” levels.
• Highett – respondents rated satisfaction significantly lower than the municipal average and at a “very poor” level.
Speed of traffic
Satisfaction with the speed of traffic on both residential streets and main roads increased marginally but not measurably in 2019 and both remain at “good” levels. There was no statistically significant variation observed across the municipality, although attention is drawn to the following:
• Beaumaris – respondents rated satisfaction somewhat, albeit not measurably higher than the municipal average although still at a “good” level.
• Highett – respondents rated satisfaction measurably lower than the municipal average and at a “poor” level.
6.65 6.58 6.36 6.33 6.24 6.18 6.12 6.07 6.02 6.02 5.885.38
0
1
2
3
4
5
6
7
8
9
10
Volume of traffic on residential streets in your local area by precinctBayside City Council - 2019 Annual Community Satisfaction Survey
scale from 0 (very dissatisifed) to 10 (very satisfied)

Bayside City Council – 2019 Annual Community Satisfaction Survey
Page 73 of 152
6.40 6.52 6.616.86
0
1
2
3
4
5
6
7
8
9
10
2018 2019 2018 2019
Residential streets Main roads
Satisfaction with the speed of trafficBayside City Council - 2019 Annual Community Satisfaction Survey
scale from 0 (very dissatisfied) to 10 (very satisfied)
6.93 6.70 6.57 6.56 6.55 6.52 6.52 6.48 6.46 6.436.16
5.74
0
1
2
3
4
5
6
7
8
9
10
Speed of traffic on residential streets in your local area by precinctBayside City Council - 2019 Annual Community Satisfaction Survey
scale from 0 (very dissatisfied) to 10 (very satisfied)

Bayside City Council – 2019 Annual Community Satisfaction Survey
Page 74 of 152
Reasons for dissatisfaction with the speed of traffic
Consistent with the result obtained last year, almost ninety percent (87.2%) of respondents dissatisfied with the speed of traffic on residential streets considered the speed to be too fast. Respondents dissatisfied with the speed of traffic on main roads were more split in their view, with two-thirds considering the speed to be too fast, and one-third considering it too slow.
Availability of parking
Satisfaction with the availability of parking on main roads increased marginally but not measurably in 2019, and is now at a “solid” level. Satisfaction with the availability of parking on both residential streets and around busy shopping strips or major commercial areas declined very marginally this year, and both are now at a “poor” level.
Reasons for dissatisfaction with speed of traffic
Bayside City Council - 2019 Annual Community Satisfaction Survey
(Number and percent of respondents dissatisfied with speed of traffic)
Number Percent Number Percent
Too fast 95 87.2% 39 68.4%
Too slow 14 12.8% 18 31.6%
Not stated 1 1
Total 110 100% 58 100%
ResponseResidential streets Main roads
6.04 5.95 5.93 6.115.69 5.59
0
1
2
3
4
5
6
7
8
9
10
2018 2019 2018 2019 2018 2019
Residential streets Main roads Shopping strips / major
commercial areas
Satisfaction with the availability of parkingBayside City Council - 2019 Annual Community Satisfaction Survey
scale from 0 (very dissatisfied) to 10 (very satisified)

Bayside City Council – 2019 Annual Community Satisfaction Survey
Page 75 of 152
Satisfaction with the availability of parking on residential streets was relatively consistent across the municipality, although respondents from Hampton were notably, albeit not measurably less satisfied than average, although still at a “poor” level.
Your safety whilst travelling
Satisfaction with the perception of safety whilst travelling on residential streets and main roads remains at levels categorised as “very good”. Satisfaction with the perception of safety whilst travelling on residential streets increased marginally this year, whilst satisfaction with safety on main roads increased measurably, but not significantly this year. There was some variation in the perception of safety travelling on residential streets observed by precinct, as follows:
• Cheltenham – respondents were measurably less satisfied than average, and at a “good” level.
6.45 6.32 6.10 6.06 5.96 5.96 5.95 5.93 5.76 5.66 5.53 5.52
0
1
2
3
4
5
6
7
8
9
10
Availability of parking on residential streets in your local area by precinctBayside City Council - 2019 Annual Community Satisfaction Survey
scale from 0 (very dissatisfied) to 10 (very satisfied)

Bayside City Council – 2019 Annual Community Satisfaction Survey
Page 76 of 152
7.45 7.55 7.407.64
0
1
2
3
4
5
6
7
8
9
10
2018 2019 2018 2019
Residential streets Main roads
Satisfaction with your safety while travellingBayside City Council - 2019 Annual Community Satisfaction Survey
scale from 0 (very dissatisfied) to 10 (very satisified)
7.72 7.72 7.70 7.64 7.54 7.45 7.38 7.35 7.306.95
0
1
2
3
4
5
6
7
8
9
10
Your safety travelling on residential streets in your local area by precinctBayside City Council - 2019 Annual Community Satisfaction Survey
scale from 0 (very dissatisfied) to 10 (very satisfied)

Bayside City Council – 2019 Annual Community Satisfaction Survey
Page 77 of 152
Reasons for feeling unsafe whilst travelling on residential streets
Reasons for feeling unsafe whilst travelling on main roads
Cars go too fast 7
More street l ights needed 2
Too many cars parking on the streets 2
Too much traffic 2
Been assaulted by drug addicts, pretty disappointing 1
Car accident 1
Dangerous for cyclists (more driver behaviour on road) 1
High bins that make blind spots 1
Many developments that impact parking availability 1
Need more visible places 1
Not enough parking lots 1
Riding bikes - worried about cars opening doors 1
Speeding cars cut across from main roads and also blind spot at the end, they don't stop at the
stop sign1
Strange people 1
Streets are too narrow 1
Too crowded 1
Unused parking spots on corners 1
Wrong way traffic on Southey St 1
Total 27
Reason for feeling unsafe travelling on residential streets in your local area
Bayside City Council - 2019 Annual Community Satisfaction Survey
(Number of responses)
Reason Number
Too much traffic 4
Cars go too fast 3
As a pedestrian - intersection of Nepean Hwy and Chesterville Road is terrible 1
Congestion and over crowded 1
Lack of pedestrian protection on Beach Road 1
Streets are too narrow 1
Speed of traffic - dangerous for cyclists and pedestrian 1
Total 12
Reason for feeling unsafe travelling on main roads
Bayside City Council - 2019 Annual Community Satisfaction Survey
(Number of responses)
Reason Number

Bayside City Council – 2019 Annual Community Satisfaction Survey
Page 78 of 152
Method of travel to the destinations
Respondents were asked:
“How do you usually get to the local shops or other destinations up to approximately 1km from home?”
The two most common methods by which respondents usually travel to their local shops or other destinations up to approximately one kilometre from their home were by car (46.9%) and by walking (45.6%).
There was some variation in this result observed across the municipality, both by precinct and by respondent profile, as follows:
• Black Rock – respondents were measurably and significantly more likely than average to walk to these destinations and less likely than average to travel by car.
• Beaumaris – respondents were measurably less likely than average to travel by car to these destinations and measurably more likely than average to travel by public transport.
• Brighton and Brighton East – respondents were measurably more likely than average to travel to these destinations by car.
• Adolescents (aged 15 to 19 years) – the small sample of 25 adolescents were more likely than average to travel to these destinations by bicycle or public transport, and less likely to travel by car.
• Senior citizens (aged 75 years and over) – respondents were measurably more likely than average to travel to these destinations by car.
• Gender – female respondents were somewhat more likely than average than male to walk to these destinations and less likely than males to travel by car.
Method of travel to get to the local shops or other destinations within 1km from home
Bayside City Council - 2019 Annual Community Satisfaction Survey
(Number and percent of respondents providing a response)
Number Percent
Drive / passenger in a car 327 46.9%
Walk 318 45.6%
Bicycle 34 4.9%
Public transport 18 2.6%
Not stated 5
Total 702 100%
Response2019

Bayside City Council – 2019 Annual Community Satisfaction Survey
Page 79 of 152
Reasons for driving to the destinations
Respondents who drove to the destinations were asked:
“If drive, why is that?”
Respondents who reported that they typically drive to the local shops and other destinations with approximately one kilometre of home were asked the reason why they did so.
26%
31%42% 44% 45% 47% 47% 47%
57% 58%
69%48% 47% 52% 46% 48% 46% 44% 40% 37%
4%
9% 7% 2%4% 5% 5% 9%
4% 3%
1%
12% 4% 1%5% 3%
2%
-80%
-60%
-40%
-20%
0%
20%
40%
60%
80%
100%
Method of travel to local shops / destinations within 1km of home by precinctBayside City Council - 2019 Annual Community Satisfaction Survey
(Percent of respondents providing a response)Public transport
Bicycle
Walk
Car
27%
52% 44% 45% 47%61%
50% 44% 47%
33% 40%48% 51% 46%
35% 43% 49% 46%
28%7%
6% 3%3%
1%
6%4% 5%
13%
2%2% 1%
4%
3%
1% 4% 6%
-80%
-60%
-40%
-20%
0%
20%
40%
60%
80%
100%
Adol'escents
Youngadults
Adults Middle-aged
adults
Olderadults
Seniorcitizens
Male Female City ofBayside
Method of travel to local shops / destinations within 1km of home by profileBayside City Council - 2019 Annual Community Satisfaction Survey
(Percent of respondents providing a response)Public transport
Bicycle
Walk
Car

Bayside City Council – 2019 Annual Community Satisfaction Survey
Page 80 of 152
These open-ended comments have been broadly categories, as outlined in the following table. The most common reasons why respondents drive to these local destinations were to carry things such as groceries and children (30.3%) and for convenience and practicality (22.7%). A number of respondents also drove to these local destinations for health and fitness related reasons (12.2%), due to time constraints or a need to travel faster (11.4%), and because they believe it is too far to walk (10.9%). There was some interesting variation in these results observed by the respondents’ age, with the results presented for three age groups. The most common reason for younger respondents (aged under 35 years) was for convenience and practicality (34.8%), for middle-aged respondents (aged 35 to 59 years) it was in order to carry things (38.7%), and for older respondents (aged 60 years and over) the most common reason was for health and fitness related reasons (31.6%).
Aspects encouraging you to walk or cycle
Respondents who drove to the destinations were asked:
“If drive, is there anything that would encourage you to walk or cycle instead?”
The following table outlines the responses received from respondents outlining if there was anything that would encourage them to walk or cycle instead of driving.
Reason for driving to local shops / other destinations (1km from home)
Bayside City Council - 2019 Annual Community Satisfaction Survey
(Number and percent of respondents who drove)
Number Percent
Carry things (shopping, groceries, children) 82 30.3% 29.9% 38.7% 19.0%
Convenience / practicality 62 22.7% 34.8% 25.3% 15.0%
Health and fitness 33 12.2% 0.0% 1.0% 31.6%
Faster / time constraints 31 11.4% 14.5% 12.4% 9.1%
Distance 30 10.9% 5.3% 10.9% 12.8%
Laziness 10 3.8% 0.0% 4.6% 4.0%
Prefer driving 8 2.9% 3.1% 2.5% 3.3%
Public transport is not available 6 2.1% 11.2% 0.4% 1.3%
Safety 4 1.5% 0.0% 1.2% 2.4%
Weather 2 0.6% 0.0% 0.0% 1.6%
Other 4 1.6% 1.3% 2.9% 0.0%
Not stated 56 7 24 25
Total 327 100% 42 160 125
Bayside 2019Response
Younger
(15-34 yrs)
Middle
(35-59 yrs)
Older
(60 yrs +)

Bayside City Council – 2019 Annual Community Satisfaction Survey
Page 81 of 152
Of the 327 respondents who typically drive to these local destinations, a total of just 62 (18.9%) provided a response as to anything that would encourage them to walk or cycle. The most common responses related to better footpaths, closer shops, and more time. This is an important result, as it highlights the fact that for the majority of respondents who currently drive to these local destinations, there is no specific and easily identified action that could be taken by Council that may encourage them to change their travel behaviour choices.
Encouragement to walk or cycle instead of driving to get to the local shops / other destinations
Bayside City Council - 2019 Annual Community Satisfaction Survey
(Number of respondents who drove providing a response)
Better footpath 6
Closer shops 6
If I had more time 5
If not carry things 5
Good weather 4
More bike paths 4
If I go out for coffee or buy milk, I would walk 3
Better bike lanes 2
I do walk on weekend where possible 2
More bike parking 2
Physical health 2
Probably better options 2
The frequency of public transport 2
With my dog 2
Accessibility of public transport 1
Availability of bike facil ities 1
Better dog walk facil ities 1
Better knee 1
Cannot carry heavy weights on bikes 1
Depends on type of mood 1
For cycling make it safer 1
Have a bike 1
If there is a place in shopping centre that I can tie my dogs 1
More awareness 1
More direct public transport 1
More security 1
Not at this age 1
Shrinking machine 1
Walk for exercise 1
Total 62
Response Number

Bayside City Council – 2019 Annual Community Satisfaction Survey
Page 82 of 152
Community
Volunteering
Respondents were asked:
“Do you volunteer regularly?”
There was a small decline this year in the proportion of respondents reporting that they volunteer.
A little more than one-fifth (21.1% down from 30.4%) of respondents providing a response to this question reported that they volunteer, including 12.7% locally, 7.4% outside the local area, and a small number (1.0%) volunteering both locally and outside the local area.
Metropolis Research typically records results across metropolitan Melbourne where between approximately one-quarter and one-third of respondents report that they volunteer. By way of comparison, a result of 19.7% was recorded in the City of Whittlesea in 2018 and 38.7% in Banyule in 2017. In 2014, 10.7% of Darebin respondents reported that they volunteer locally.
There was some variation in this result observed across municipality, both by precinct and by respondent profile, as follows:
• Hampton East – respondents were somewhat less likely than average to volunteer. Respondents from Hampton East were also the least likely to volunteer in the 2018 survey.
• Adolescents (aged 15 to 19 years) – the small sample of adolescents were somewhat less likely than average to volunteer, which is down significantly on last year.
• Adults (aged 35 to 44 years) – respondents were notably less likely than average to volunteer.
• Gender – male respondents were notably less likely to volunteer than female respondents.
• Language spoken at home – respondents from English speaking households were somewhat more likely to volunteer than respondents from multi-lingual households.
Be a volunteer regularly
Bayside City Council - 2019 Annual Community Satisfaction Survey
(Number and percent of respondents providing a response)
Number Percent
Yes - locally 86 12.7% 19.2%
Yes - non locally 50 7.4% 9.5%
Yes - both locally and non locally 7 1.0% 1.6%
No 535 78.9% 69.6%
Not stated 24 24
Total 702 100% 705
Response2019
2018
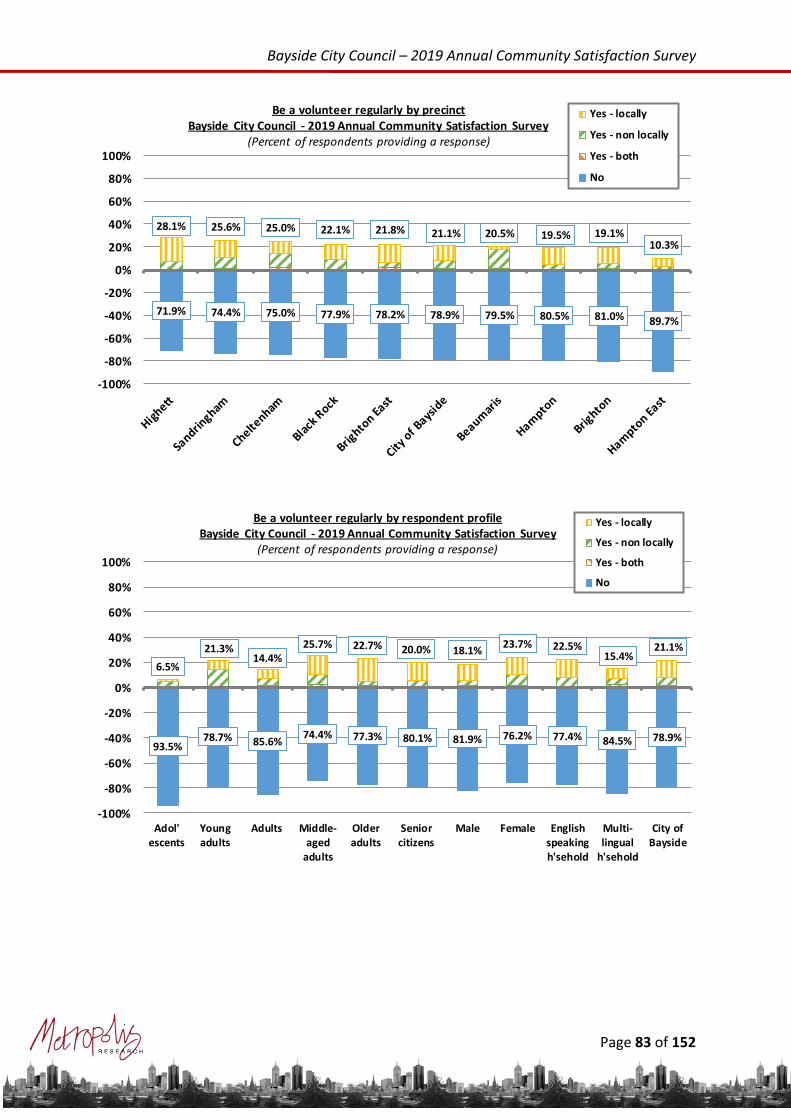
Bayside City Council – 2019 Annual Community Satisfaction Survey
Page 83 of 152
71.9% 74.4% 75.0% 77.9% 78.2% 78.9% 79.5% 80.5% 81.0% 89.7%
28.1% 25.6% 25.0% 22.1% 21.8% 21.1% 20.5% 19.5% 19.1%10.3%
-100%
-80%
-60%
-40%
-20%
0%
20%
40%
60%
80%
100%
Be a volunteer regularly by precinctBayside City Council - 2019 Annual Community Satisfaction Survey
(Percent of respondents providing a response)
Yes - locally
Yes - non locally
Yes - both
No
93.5%78.7% 85.6%
74.4% 77.3% 80.1% 81.9% 76.2% 77.4% 84.5% 78.9%
6.5%
21.3%14.4%
25.7% 22.7% 20.0% 18.1%23.7% 22.5%
15.4%21.1%
-100%
-80%
-60%
-40%
-20%
0%
20%
40%
60%
80%
100%
Adol'escents
Youngadults
Adults Middle-aged
adults
Olderadults
Seniorcitizens
Male Female Englishspeakingh'sehold
Multi-lingual
h'sehold
City ofBayside
Be a volunteer regularly by respondent profileBayside City Council - 2019 Annual Community Satisfaction Survey
(Percent of respondents providing a response)
Yes - locally
Yes - non locally
Yes - both
No

Bayside City Council – 2019 Annual Community Satisfaction Survey
Page 84 of 152
Sense of community / health and wellbeing
Respondents were asked:
“On a scale of 1 (strongly disagree) to 5 (strongly agree), please rate your agreement with the following statements.”
Respondents were asked to rate their level of agreement or disagreement with five statements related to the sense of local community, safety, and alcohol consumption. Some of these questions have been previously included in the Bayside – 2016 Health and Wellbeing Survey. The average agreement with these five statements can best be summarised as follows:
• Very Strong Agreement – that the respondents’ feel safe online using the internet. Almost half of the respondents strongly agreed with this statement, whilst less than six percent disagreed or strongly disagreed
• Strong Agreement – that there are adequate community services available in the local area. Whilst almost one-quarter of respondents strongly agreed with this statement, more than half agreed, and less than four percent disagreed or strongly disagreed.
• Moderate Agreement – that the respondent feels a strong sense of belonging to a community. Whilst more than one-fifth of respondents strongly agreed with this statement, seven percent disagreed or strongly disagreed.
• Neutral – respondents were on average neutral in terms of their agreement that they play an active role in their community. Whilst approximately forty percent of respondents agreed or strongly agreed with this statement, more than one-third disagreed or strongly disagreed.
• Very Strong Disagreement – that alcohol consumption has a negative impact on the respondent’s household. Almost two-thirds of respondents strongly agreed with this statement, whilst a further one-fifth disagreed. Less than ten percent of respondents agreed or strongly agreed with this statement. It is important to bear in mind the potential for a strong skew in these results, given the personal nature of the question.
When comparing these results to those recorded in the 2012, 2014, and 2016 Bayside Health and Wellbeing surveys it does appear that: active participation has increased since 2012, the impact of alcohol consumption has remained relatively stable, the sense of belonging to a community has proved somewhat volatile around a relatively stable long-term average, and access to community services locally has trended marginally higher. There was also some interesting variation by precinct and by respondent profile, as outlined in the following pages.

Bayside City Council – 2019 Annual Community Satisfaction Survey
Page 85 of 152
Active community participation
When compared to the results from the 2012, 2014, and 2016 Health and Wellbeing surveys conducted by Metropolis Research for the City of Bayside, it is clear that active community participation appears to have increased somewhat over time, from a low of 4.34 in 2012 to 5.25 this year.
7.827.46
6.88
5.25
1.89
0
1
2
3
4
5
6
7
8
9
10
I feel safe online(using the internet)
There are adequatecommunity servicesavailable in the local
area
I feel a strong senseof belonging to a
community
I play an active role inmy community
Alcohol consumptionhas a negative impact
on my household
Agreement with selected aspects of sense of communityBayside City Council - 2019 Annual Community Satisfaction Survey
scale from 0 (strongly disagree) to 10 (strongly agree)
4.4% 3.3% 4.6%17.6% 20.8%
1.8% 0.5% 2.3%10.4%
58.4%
39.9%53.7%
42.1%25.7%
4.7%
40.3%24.6%
21.2%
11.3% 4.2%
-80%
-60%
-40%
-20%
0%
20%
40%
60%
80%
100%
I feel safe online(using the internet)
There are adequatecommunity servicesavailable in the local
area
I feel a strong sense ofbelonging to a
community
I play an active role inmy community
Alcohol consumptionhas a negative impact
on my household
Agreement with selected aspects of sense of communityBayside City Council - 2019 Annual Community Satisfaction Survey
(Percent of respondents providing a response)Strongly agree
Agree
Strongly disagree
Disagree

Bayside City Council – 2019 Annual Community Satisfaction Survey
Page 86 of 152
Whilst there was no statistically significant variation in average agreement that “I play an active role in my community” observed across the municipality, it is noted that respondents from Black Rock were somewhat more in agreement than average, and respondents from Brighton East and Hampton East were somewhat less in agreement.
4.344.79 4.72
5.25
0
1
2
3
4
5
6
7
8
9
10
2012 2014 2016 2019
Agreement that "I play an active role in my community"Bayside City Council - 2019 Annual Community Satisfaction Survey
scale from 0 (strongly disagree) to 10 (strongly agree)
5.945.66 5.62 5.61
5.30 5.25 5.03 4.964.59 4.53
0
1
2
3
4
5
6
7
8
9
10
Agreement that "I play an active role in my community" by precinctBayside City Council - 2019 Annual Community Satisfaction Survey
scale from 0 (strongly disagree) to 10 (strongly agree)

Bayside City Council – 2019 Annual Community Satisfaction Survey
Page 87 of 152
There was no statistically significant variation in agreement observed by respondent profile, although it is noted that agreement tended to rise from adolescents to older adults. Attention is drawn to the fact that female respondents were measurably more in agreement than males.
Alcohol consumption
The perceived impact of alcohol consumption on the respondents household has increased very marginally over time, and has increased from the unusually low 0.84 recorded in 2014.
4.354.86
5.36 5.275.63
4.79 5.015.48
5.20 5.37 5.25
0
1
2
3
4
5
6
7
8
9
10
Adol'escents
Youngadults
Adults Middle-aged
adults
Olderadults
Seniorcitizens
Male Female Englishspeakingh'sehold
Multi-lingual
h'sehold
City ofBayside
Agreement that "I play an active role in my community" by respondent profileBayside City Council - 2019 Annual Community Satisfaction Survey
scale from 0 (strongly disagree) to 10 (strongly agree)
1.59
0.84
1.601.89
0
1
2
3
4
5
6
7
8
9
10
2012 2014 2016 2019
Agreement that "alcohol consumption has a negative impact on my household"Bayside City Council - 2019 Annual Community Satisfaction Survey
scale from 0 (strongly disagree) to 10 (strongly agree)

Bayside City Council – 2019 Annual Community Satisfaction Survey
Page 88 of 152
There was measurable and significant variation in agreement that “alcohol consumption has a negative impact on my household” observed across the municipality, as follows:
• Highett, Sandringham, and Black Rock – respondents were measurably more in agreement than average.
• Brighton East and Hampton East – respondents were measurably less in agreement than average.
There was no statistically significant variation in this result observed by respondent profile, although attention is drawn to the following:
• Age structure – agreement that alcohol consumption has a negative impact on the household increases marginally but not measurably with the respondents age.
• Gender – there was no meaningful variation observed by gender.
• Language spoken at home – respondents from multi-lingual households were substantially, albeit not measurably more likely than respondents from English speaking households to agree that alcohol consumption has a negative impact on their household.
3.20 2.98 2.852.28 2.10 1.89 1.69 1.68
0.76 0.72
0
1
2
3
4
5
6
7
8
9
10
Agreement that "alcohol consumption has a negative impact on my household" by precinct
Bayside City Council - 2019 Annual Community Satisfaction Survey
scale from 0 (strongly disagree) to 10 (strongly agree)

Bayside City Council – 2019 Annual Community Satisfaction Survey
Page 89 of 152
Strong sense of belonging to a community
The average agreement that respondents feel a “strong sense of belonging to a community” has trended marginally higher over time, around a long-term average of approximately 6.76.
1.38 1.472.02 2.00 1.97 2.14 1.93 1.94 1.84
2.351.89
0
1
2
3
4
5
6
7
8
9
10
Adol'escents
Youngadults
Adults Middle-aged
adults
Olderadults
Seniorcitizens
Male Female Englishspeakingh'sehold
Multi-lingual
h'sehold
City ofBayside
Agreement that "alcohol consumption has a negative impact on my household" by respondent profile
Bayside City Council - 2019 Annual Community Satisfaction Survey
scale from 0 (strongly disagree) to 10 (strongly agree)
6.686.36
7.126.88
0
1
2
3
4
5
6
7
8
9
10
2012 2014 2016 2019
Agreement that "I feel a strong sense of belonging to a community"Bayside City Council - 2019 Annual Community Satisfaction Survey
scale from 0 (strongly disagree) to 10 (strongly agree)

Bayside City Council – 2019 Annual Community Satisfaction Survey
Page 90 of 152
There was some variation in agreement that “I feel a strong sense of belonging to a community” observed across the municipality, as follows:
• Black Rock – respondents were measurably more in agreement than average.
• Hampton East – respondents were measurably less in agreement than average.
There was significant variation in this result observed by respondent profile, as follows:
• Age structure – agreement that the respondent feels a strong sense of belonging to a community increases substantially with the respondents age, with younger respondents (aged 15 to 34 years) measurably less in agreement than older respondents (aged 60 yrs and over).
• Gender – female respondents were measurably (8.5%) more in agreement than male respondents.
7.41 7.337.06 7.05 6.89 6.88 6.75 6.74
6.24 6.12
0
1
2
3
4
5
6
7
8
9
10
Agreement that "I feel a strong sene of belonging to a community" by precinctBayside City Council - 2019 Annual Community Satisfaction Survey
scale from 0 (strongly disagree) to 10 (strongly agree)
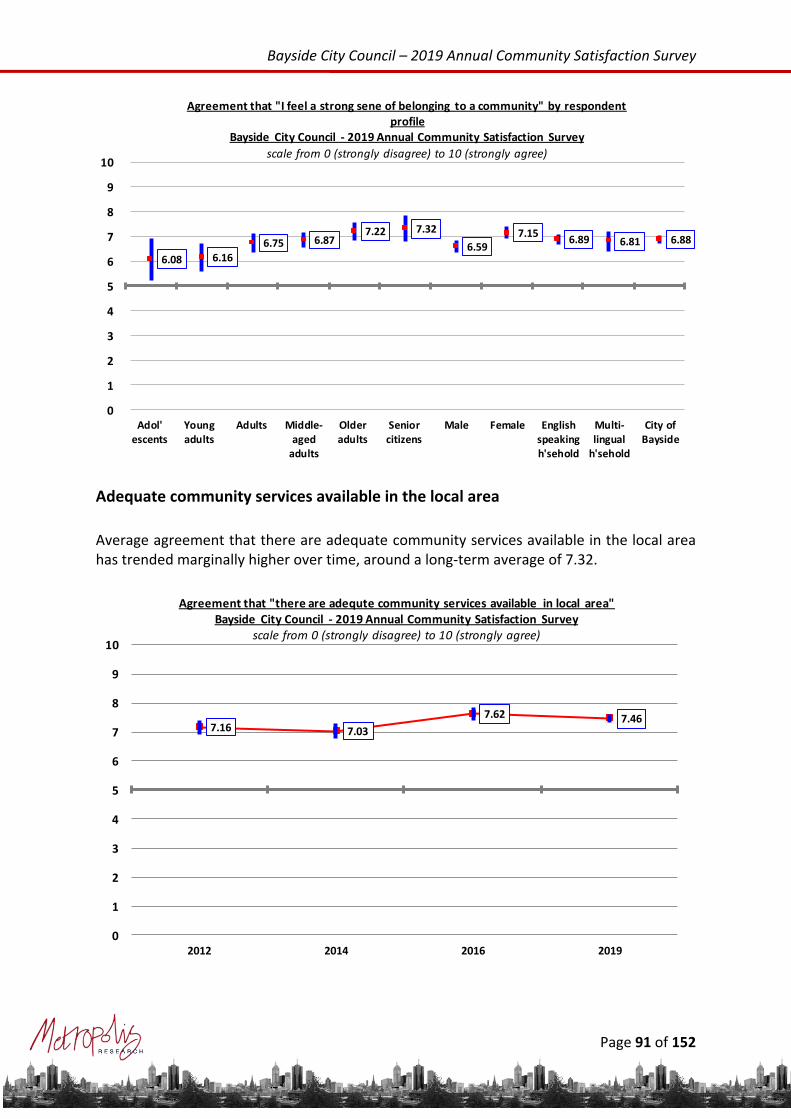
Bayside City Council – 2019 Annual Community Satisfaction Survey
Page 91 of 152
Adequate community services available in the local area
Average agreement that there are adequate community services available in the local area has trended marginally higher over time, around a long-term average of 7.32.
6.08 6.166.75 6.87
7.22 7.32
6.597.15
6.89 6.81 6.88
0
1
2
3
4
5
6
7
8
9
10
Adol'escents
Youngadults
Adults Middle-aged
adults
Olderadults
Seniorcitizens
Male Female Englishspeakingh'sehold
Multi-lingual
h'sehold
City ofBayside
Agreement that "I feel a strong sene of belonging to a community" by respondent profile
Bayside City Council - 2019 Annual Community Satisfaction Survey
scale from 0 (strongly disagree) to 10 (strongly agree)
7.16 7.03
7.62 7.46
0
1
2
3
4
5
6
7
8
9
10
2012 2014 2016 2019
Agreement that "there are adequte community services available in local area"Bayside City Council - 2019 Annual Community Satisfaction Survey
scale from 0 (strongly disagree) to 10 (strongly agree)

Bayside City Council – 2019 Annual Community Satisfaction Survey
Page 92 of 152
There was some variation in average agreement that “there are adequate community services available in the local area” observed across the municipality, as follows:
• Beaumaris – respondents were measurably and significantly more in agreement that there were adequate local community services available than the municipal average.
• Cheltenham and Highett – respondents were marginally, but not measurably less in agreement than the municipal average.
Whilst there was no statistically significant variation in this result observed by respondent profile, attention is drawn to the following:
• Gender – female respondents were somewhat, albeit not measurably more in agreement than male respondents.
• Language spoken at home – respondents from English speaking households were measurably more in agreement than respondents from multi-lingual households.
8.137.74 7.71 7.56 7.46 7.35 7.19 7.07 6.97 6.86
0
1
2
3
4
5
6
7
8
9
10
Agreement that "there are adequate community services available in the local area" by precinct
Bayside City Council - 2019 Annual Community Satisfaction Survey
scale from 0 (strongly disagree) to 10 (strongly agree)

Bayside City Council – 2019 Annual Community Satisfaction Survey
Page 93 of 152
Online safety
There was some measurable variation in agreement that “I feel safe online using the internet” observed by precinct, with respondents from Brighton East measurably more in agreement than average.
7.36 7.167.53 7.35 7.56
7.817.32
7.60 7.557.14
7.46
0
1
2
3
4
5
6
7
8
9
10
Adol'escents
Youngadults
Adults Middle-aged
adults
Olderadults
Seniorcitizens
Male Female Englishspeakingh'sehold
Multi-lingual
h'sehold
City ofBayside
Agreement that "there are adequate community services available in the local area" by respondent profile
Bayside City Council - 2019 Annual Community Satisfaction Survey
scale from 0 (strongly disagree) to 10 (strongly agree)
8.548.06 8.05 8.05 7.82 7.81 7.72 7.59 7.55 7.44
0
1
2
3
4
5
6
7
8
9
10
Agreement that "I feel safe online (using the internet)" by precinctBayside City Council - 2019 Annual Community Satisfaction Survey
scale from 0 (strongly disagree) to 10 (strongly agree)

Bayside City Council – 2019 Annual Community Satisfaction Survey
Page 94 of 152
There was no variation in this result by gender or language spoken at home, although it is noted that agreement declined substantially with the respondents’ age, particularly for older adults and senior citizens.
Perception of general health
Respondents were asked:
“On a scale of 1 (very poor) to 5 (excellent), please rate your level of physical health and mental health.”
This set of questions around respondents’ perception of their physical and mental health have been previously included in the Bayside Health and Wellbeing surveys in 2012, 2014, and 2016. There has been some variation over time in the naming of the various categories for this question. In 2016 and 2012, the question included the response options “excellent”, “very good”, “good”, “poor” and “very poor”. The variation in the response categories will have had a significant impact on the variability seen in these results over time. This is particularly true in relation to the use of the term “average” for the middle variable, rather than the “good” used in some of the previous years. Combining the results for the top two categories and the bottom two categories, as outlined in the following graph, provides a more reliable estimate of both the perception of physical and mental health.
8.648.30 8.23 8.06
7.41
5.92
7.80 7.84 7.80 7.90 7.82
0
1
2
3
4
5
6
7
8
9
10
Adol'escents
Youngadults
Adults Middle-aged
adults
Olderadults
Seniorcitizens
Male Female Englishspeakingh'sehold
Multi-lingual
h'sehold
City ofBayside
Agreement that "I feel safe online (using the internet)" by respondent profileBayside City Council - 2019 Annual Community Satisfaction Survey
scale from 0 (strongly disagree) to 10 (strongly agree)
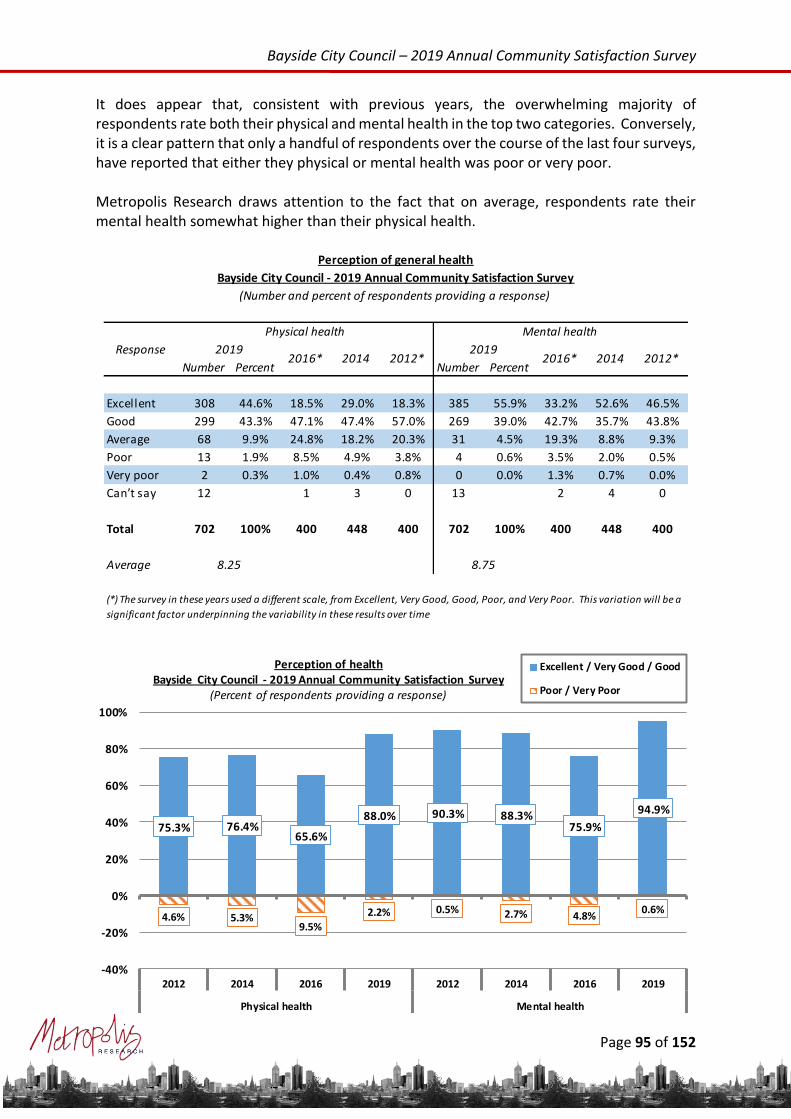
Bayside City Council – 2019 Annual Community Satisfaction Survey
Page 95 of 152
It does appear that, consistent with previous years, the overwhelming majority of respondents rate both their physical and mental health in the top two categories. Conversely, it is a clear pattern that only a handful of respondents over the course of the last four surveys, have reported that either they physical or mental health was poor or very poor. Metropolis Research draws attention to the fact that on average, respondents rate their mental health somewhat higher than their physical health.
Perception of general health
Bayside City Council - 2019 Annual Community Satisfaction Survey
(Number and percent of respondents providing a response)
Number Percent Number Percent
Excellent 308 44.6% 18.5% 29.0% 18.3% 385 55.9% 33.2% 52.6% 46.5%
Good 299 43.3% 47.1% 47.4% 57.0% 269 39.0% 42.7% 35.7% 43.8%
Average 68 9.9% 24.8% 18.2% 20.3% 31 4.5% 19.3% 8.8% 9.3%
Poor 13 1.9% 8.5% 4.9% 3.8% 4 0.6% 3.5% 2.0% 0.5%
Very poor 2 0.3% 1.0% 0.4% 0.8% 0 0.0% 1.3% 0.7% 0.0%
Can’t say 12 1 3 0 13 2 4 0
Total 702 100% 400 448 400 702 100% 400 448 400
Average
(*) The survey in these years used a different scale, from Excellent, Very Good, Good, Poor, and Very Poor. This variation will be a
significant factor underpinning the variability in these results over time
Response
Physical health Mental health
20192016* 2014 2012*
20192016* 2014 2012*
8.25 8.75
4.6% 5.3%9.5%
2.2% 0.5% 2.7% 4.8%0.6%
75.3% 76.4%65.6%
88.0% 90.3% 88.3%75.9%
94.9%
-40%
-20%
0%
20%
40%
60%
80%
100%
2012 2014 2016 2019 2012 2014 2016 2019
Physical health Mental health
Perception of healthBayside City Council - 2019 Annual Community Satisfaction Survey
(Percent of respondents providing a response)
Excellent / Very Good / Good
Poor / Very Poor

Bayside City Council – 2019 Annual Community Satisfaction Survey
Page 96 of 152
The following graph provides an estimated average perception of physical and mental health, based on an indexing of the raw percentage results. As discussed, it is clear that on average, respondents considered both their physical and mental health to be very good, with average scores of more than eight out of ten. It is worth noting that the average perception of mental health is measurably and significantly higher than the average perception of physical health.
The following two graphs provide the average perception of physical and mental health by respondent profile, including age structure, gender, and language spoken at home. Attention is drawn to the following:
• Age structure – the perception of physical health declines with the respondents’ age, from a high of 9.34 for adolescents to a low of 6.68 for senior citizens. Whilst this pattern is generally evident for the perception of mental health, it is noted that young adults (aged 20 to 34 years) rated their mental health somewhat lower than either adolescents or adults aged 35 to 74 years.
• Gender – there was no meaningful variation observed in the perception of physical or mental health between male and female respondents.
• Language spoken at home – there was no meaningful variation observed in the perception of physical or mental health between respondents from English speaking and multi-lingual households.
8.758.25
0
1
2
3
4
5
6
7
8
9
10
Mental health Physical health
Perception of your level of general healthBayside City Council - 2019 Annual Community Satisfaction Survey
scale from 0 (very poor) to 10 (excellent)

Bayside City Council – 2019 Annual Community Satisfaction Survey
Page 97 of 152
9.34
8.468.76 8.57
7.87
6.68
8.21 8.29 8.27 8.25 8.25
0
1
2
3
4
5
6
7
8
9
10
Adol'escents
Youngadults
Adults Middle-aged
adults
Olderadults
Seniorcitizens
Male Female Englishspeakingh'sehold
Multi-lingual
h'sehold
City ofBayside
Perception of physical health by respondent profileBayside City Council - 2019 Annual Community Satisfaction Survey
scale from 0 (very poor) to 10 (excellent)
9.23
8.498.85 8.98
8.618.29
8.75 8.75 8.78 8.69 8.75
0
1
2
3
4
5
6
7
8
9
10
Adol'escents
Youngadults
Adults Middle-aged
adults
Olderadults
Seniorcitizens
Male Female Englishspeakingh'sehold
Multi-lingual
h'sehold
City ofBayside
Perception of mental health by respondent profileBayside City Council - 2019 Annual Community Satisfaction Survey
scale from 0 (very poor) to 10 (excellent)

Bayside City Council – 2019 Annual Community Satisfaction Survey
Page 98 of 152
Coping with extreme weather
Respondents were asked: “Does your household have its own resources and a plan to cope with extreme weather and to keep
yourself / yourselves safe and well?”
The overwhelming majority (87.7%) of respondents reported that they believe their household “has its own resources and a plan to cope with extreme weather and to keep themselves safe and well”. Metropolis Research notes that the question is relatively broad in nature, not specifying the nature of either the resources or plans that respondents’ may have to cope with extreme weather. It can often be the case that a proportion of respondents may assume that they have the necessary resources or a plan in place for extreme events, without having given specific and sustained attention to the details that would be required for a considered plan.
There was no statistically significant variation in the proportion of respondents who report that they have resources and a plan in place for extreme weather events observed across the municipality.
Have resources to cope with extreme weather and to keep yourself safe and well
Bayside City Council - 2019 Annual Community Satisfaction Survey
(Number and percent of respondents providing a response)
Number Percent
Yes 616 87.7%
No 38 5.4%
Not sure / not stated 48 6.8%
Total 702 100%
Response2019

Bayside City Council – 2019 Annual Community Satisfaction Survey
Page 99 of 152
The following graph provides a breakdown of this result by respondents’ household structure. It is important to bear in the mind the relatively small sample size for some of these household structures. However, Metropolis Research still draws attention to the fact that a noticeably lower than average proportion of one-parent families, both those with children as well as those comprised of adults only, reported that they had the resources and a plan to cope with extreme weather events.
93.1%90.7% 88.6% 88.4% 87.9% 87.7% 87.1% 86.2% 85.2% 85.2%
0%
10%
20%
30%
40%
50%
60%
70%
80%
90%
100%
Have resources to cope with extreme weather to keep yourself safe and wellBayside City Council - 2019 Annual Community Satisfaction Survey
(Percent of respondents providing a response)
95.6% 92.5% 91.2% 90.9% 89.0% 88.4% 87.9% 87.7% 84.9% 84.5% 84.2%80.5%
76.9%
0%
10%
20%
30%
40%
50%
60%
70%
80%
90%
100%
Have resources to cope with extreme weather to keep yourself safe and well by profileBayside City Council - 2019 Annual Community Satisfaction Survey
(Percent of respondents providing a response)

Bayside City Council – 2019 Annual Community Satisfaction Survey
Page 100 of 152
Community engagement
Active member of club or community group
Respondents were asked:
“Are you an active member of a club or community group?”
A little less than half (43.3%) of the respondents reported that they were an active member of a club or community group. By way of comparison, Metropolis Research recorded results of 48.4% in Banyule in 2017 and 46.0% in the City of Whittlesea in 2018. It is important to bear in mind that the sample included in voluntary surveys (of any type) are naturally slightly skewed towards those in the community who are more engaged with their local council and / or community, as it is these individuals who are more likely to take the time to participate. The door-to-door methodology, by coming and speaking directly in-person with residents, will minimise this skew as much as is possible in large-sample social research. This skew should however be borne in mind when interpreting these results.
There was measurable variation in this result observed across the City of Bayside, both by precinct and by respondent profile (age structure, gender, and language spoken at home):
• Black Rock – respondents were measurably more likely than average to be a member of a club or community group.
• Hampton East – respondents were measurably less likely than average to be a member of a club or community group.
• Middle-aged adults (aged 45 to 59 years) – respondents were measurably more likely than average to be a member of a club or community group.
• Gender – female respondents were marginally but not measurably more likely than male respondents to be a member of a club or community group.
• Language spoken at home – respondents from English speaking households were measurably more likely than respondents from multi-lingual households to be a member of a club or community group.
Active member of a club or community group
Bayside City Council - 2019 Annual Community Satisfaction Survey
(Number and percent of respondents providing a response)
Number Percent
Yes 302 43.3%
No 396 56.7%
Not stated 4
Total 702 100%
Response2019

Bayside City Council – 2019 Annual Community Satisfaction Survey
Page 101 of 152
Sit on a community group board or committee
Respondents were asked:
“Do you currently sit on a community group board or committee?”
A little less than one-sixth (13.4%) of respondents reported that they currently sit on a community group board or committee.
55.3%50.9% 50.5% 49.1%
45.5% 43.3% 41.4%38.6% 38.4%
34.5%
0%
10%
20%
30%
40%
50%
60%
70%
80%
90%
100%
Active member of a club or community group by precinctBayside City Council - 2019 Annual Community Satisfaction Survey
(Percent of respondents providing a response)
36.1% 36.8%40.1%
53.5%
37.0%40.8% 41.9%
44.5% 45.9%
33.0%
43.3%
0%
10%
20%
30%
40%
50%
60%
70%
80%
90%
100%
Active member of a club or community group by respondent profileBayside City Council - 2019 Annual Community Satisfaction Survey
(Percent of respondents providing a response)

Bayside City Council – 2019 Annual Community Satisfaction Survey
Page 102 of 152
There was significant variation in this result observed across the municipality, as follows:
• Black Rock, Cheltenham, and Sandringham – respondents were measurably more likely than average to currently sit on a community group board or committee.
• Hampton East – respondents were measurably less likely than average to currently sit on a community group board or committee.
There was some variation in this result observed by respondent profile, as follows:
• Adolescents (aged 15 to 19 years) – none of the small sample of adolescent respondents were currently sitting on a community group board or committee.
• Middle-aged adults (aged 45 to 59 years) – respondents were measurably more likely than average to currently sit on a community group board or committee.
Currently sit on a community group board or committee
Bayside City Council - 2019 Annual Community Satisfaction Survey
(Number and percent of respondents providing a response)
Number Percent
Yes 93 13.4%
No 601 86.6%
Not stated 8
Total 702 100%
Response2019
24.7% 23.2% 21.5%18.4% 16.3%
13.4%10.7%
8.0% 7.0%1.8%
0%
10%
20%
30%
40%
50%
60%
70%
80%
90%
100%
Currently sit on a community group board or committee by precinctBayside City Council - 2019 Annual Community Satisfaction Survey
(Percent of respondents providing a response)

Bayside City Council – 2019 Annual Community Satisfaction Survey
Page 103 of 152
• Language spoken at home – respondents from English speaking households were somewhat more likely than respondents from multi-lingual households to currently sit on a community group board or committee.
Satisfaction with community connections
Respondents were asked:
“On a scale of 0 (lowest) to 10 (highest), can you please rate your satisfaction with my own community connections?”
Respondents on average rated their satisfaction with their own community connections at 7.47 out of a potential ten, or a “very good” level of satisfaction. More than half (54.3%) of respondents were “very satisfied” (i.e. rated satisfaction at eight or more), whilst just 3.1% were dissatisfied (i.e. rated satisfaction at zero to four).
8.6%12.5%
19.3%
11.6% 10.2%12.8% 13.9% 14.1%
10.5%13.4%
0%
10%
20%
30%
40%
50%
60%
70%
80%
90%
100%
Currently sit on a community group board or committee by respondent profileBayside City Council - 2019 Annual Community Satisfaction Survey
(Percent of respondents providing a response)
Satisfaction with my own community connections
Bayside City Council - 2019 Annual Community Satisfaction Survey
(Number and percent of respondents providing a response)
Number Percent
Very satisfied (8 to 10) 351 54.3%
Neutral to somewhat satisfied (5 to 7) 276 42.7%
Dissatisfied (0 to 4) 20 3.1%
Can't say 55
Total 702 100%
Aspect2019

Bayside City Council – 2019 Annual Community Satisfaction Survey
Page 104 of 152
There was measurable variation in this result observed across the municipality, as follows:
• Cheltenham – respondents were measurably more satisfied than average with their community connections and at an “excellent” level.
• Highett and Hampton East – respondents were notably if not measurably less satisfied with their community connections, although still at “good” levels.
There was some notable variation in satisfaction with the respondents’ community connections observed by respondent profile, as follows:
• Age structure – there was no statistically significant variation in this result observed by age structure, although it is noted that young adults (aged 20 to 34 years) were somewhat less satisfied than other respondents.
• Gender – female respondents were marginally but not measurably more satisfied with their community connections than male respondents.
• Language spoken at home – respondents from English speaking households were measurably more satisfied with their community connections than respondents from multi-lingual households.
7.81 7.71 7.61 7.52 7.47 7.45 7.44 7.397.07 6.96
0
1
2
3
4
5
6
7
8
9
10
Satisfaction with my own community connections by precinctBayside City Council - 2019 Annual Community Satisfaction Survey
scale from 0 (very dissatisfied) to 10 (very satisfied)

Bayside City Council – 2019 Annual Community Satisfaction Survey
Page 105 of 152
The small number of respondents dissatisfied with their own community connections provided the following responses as to the reasons for their dissatisfaction.
7.37 7.19 7.35 7.52 7.54 7.657.41 7.52 7.54
7.167.47
0
1
2
3
4
5
6
7
8
9
10
Adol'escents
Youngadults
Adults Middle-aged
adults
Olderadults
Seniorcitizens
Male Female Englishspeakingh'sehold
Multi-lingual
h'sehold
City ofBayside
Satisfaction with my own community connections by respondent profileBayside City Council - 2019 Annual Community Satisfaction Survey
scale from 0 (very dissatisfied) to 10 (very satisfied)
New to the area 3
I work so that I don't have much time 2
No connections 2
Don't see neighbours a lot 1
I am aware of services, just haven't used them 1
I don't play an active enough role 1
I think that not many community connections in Bayside 1
Many weird people 1
More community events and awareness 1
Not enough time 1
Not happy 1
Probably l ike to meet more people in the area 1
Total 16
Reason for dissatisfaction with my own community connections
Bayside City Council - 2019 Annual Community Satisfaction Survey
(Number of responses)
Reason Number

Bayside City Council – 2019 Annual Community Satisfaction Survey
Page 106 of 152
Engagement and contact with Council
Engaging with Council in the last twelve months
Respondents were asked:
“In the last twelve months, have you engaged with Council in any of the following ways?”
A little less than two-thirds (62.0%) of respondents reported that they had engaged with Council in the last twelve months, an increase on the 50.6% recorded last year. The reason for this increase being that the question last year asked “have you contacted Council in the last twelve months?” rather than have you engaged with Council in any of the following ways. The broader definition of “engagement” compared to “contact” explains the increase. It is noted that more than half (59.7%) of respondents reported that visiting the Council website was one of the methods by which they last engaged with Council, with 33.0% had looked up information, 14.2% had filled in a form or made a request, and 12.5% had made a payment using the Council website.
Method of engaging with Council in the last twelve months
Bayside City Council - 2019 Annual Community Satisfaction Survey
(Number and percent of total respondents)
Number Percent
Telephoned Council / Council officer 272 38.7%
Looked up information on Council website 232 33.0%
Visited Council officers in Sandringham 112 16.0%
Filled in a form / made a request using Council website 100 14.2%
Emailed Council / Council officer 90 12.8%
Made a payment using the Counil website 88 12.5%
Read or responded to social media post 24 3.4%
Total responses
Respondents identifying at least one method
Response2019
918
435
(62.0%)

Bayside City Council – 2019 Annual Community Satisfaction Survey
Page 107 of 152
Preferred method of contacting Council
Respondents who contacted Council by telephone or visit in-person were asked: “If contacted Council by telephone or a visit in-person, was this your preferred method of contacting
Council, or did you try another method first?”
Of the 312 respondents who had contacted Council by telephone or a visit in-person, almost all (94.8%) respondents reported that the method by which they contacted Council was their preferred method.
Preferred method of contacting Council
Bayside City Council - 2019 Annual Community Satisfaction Survey
(Number and percent of respondents contacted Council by telephone or visit in-person)
Number Percent
Preferred method of contacting Council 291 94.8%
Tried another method first 16 5.2%
Not stated 5
Total 312 100%
Response2019
96.0% 94.8%92.1%
0%
10%
20%
30%
40%
50%
60%
70%
80%
90%
100%
Telephone(272 respondents)
City of Bayside(312 respondents)
Visit in person(112respondents)
Preferred method of contacting Council by telephone or visit in-personBayside City Council - 2019 Annual Community Satisfaction Survey
(Percent of respondents contacting Council by telephone and visit in -person)

Bayside City Council – 2019 Annual Community Satisfaction Survey
Page 108 of 152
Satisfaction with Council’s customer service
Respondents who contacted Council by telephone, email or a visit in-person were asked:
“On a scale of 0 (lowest) to 10 (highest), please rate your satisfaction with the following aspects of service when you last contacted the Bayside City Council?”
Respondents who had engaged with Council by telephone, email, or a visit in-person in the last twelve months were asked to rate their satisfaction with six aspects of customer service, including their satisfaction with the final outcome. The wording of these aspects of satisfaction are somewhat different to those currently used in the Governing Melbourne research and therefore no metropolitan or regional comparison of these results is available. The average satisfaction with the five included aspects of customer service (excluding satisfaction with the final outcome) increased marginally in 2019, up 2.2% from 7.67 to 7.84 out of ten. This level of satisfaction is “excellent”, an improvement on the “very good” recorded last year. Satisfaction with these six aspects of customer service can best be summarised as follows:
• Excellent – for the professionalism of staff, staff understanding the respondents’ needs, staff understanding language needs (46 respondents from multi-lingual households), and the accuracy and comprehensiveness of the information provided.
• Very Good – for satisfaction with the final outcome and how long it took to deal with the issue.
7.808.17
7.467.95
6.73
7.48 7.337.75
9.01
7.88
7.087.52
0
1
2
3
4
5
6
7
8
9
10
2018 2019 2018 2019 2018 2019 2018 2019 2018 2019 2018 2019
Professionalism
of staff
Understanding
of your needs
How long
it took to
deal with
Accuracy and
comprehensive
of information
Understanding
language
needs
Satisfaction
with final
outcome
Satisfaction with aspects of customer service (telephone, in-person, email)Bayside City Council - 2019 Annual Community Satisfaction Survey
scale from 0 (very dissatisfied) to 10 (very satisified)

Bayside City Council – 2019 Annual Community Satisfaction Survey
Page 109 of 152
Whilst two-third or more of respondents were very satisfied with each of these six aspects, it is noted that more than ten percent of respondents were dissatisfied with how long it took to deal with the issue (11.8%) and the final outcome (12.5%).
The following graph provides a comparison of satisfaction with the six aspects of customer service between respondents telephoning Council, visiting in person and those who emailed Council or Council Officer. As is clearly evident in the graph, there was no statistically significant variation in satisfaction observed based on the method of contacting Council. This is at least partly due to the fact that the sample of respondents for each method of contacting Council is relatively small. Having said that, attention is drawn to the fact that respondents contacting Council by email rated their average satisfaction with the six aspects of customer service at 7.14, 8.2% lower than the average for respondents visiting Council in person (7.78). Metropolis Research notes that this result may reflect a range of factors including that good customer service is easier to provide face-to-face; respondents visiting in person may have different types of enquiries; and respondents visiting in person may reflect a different demographic with different expectations.
1.0% 2.2% 4.3%7.9%
11.8% 12.5%
19.5% 25.1% 29.1% 26.1% 26.4% 21.6%
79.5% 72.7% 66.6%66.0% 61.8% 65.9%
-40%
-20%
0%
20%
40%
60%
80%
100%
Understandinglanguage
needs
Professionalismof staff
Understandingof your needs
Accuracy andcomprehensiveness
of information
How longit took todeal with
Satisfactionwith finaloutcome
Satisfaction with selected aspects of customer serviceBayside City Council - 2019 Annual Community Satisfaction Survey
(Percent of respondents contacted Council by telephone, email or visit in-person)
Very satisfied
Neutral to somewhat satisfied
Dissatisfied

Bayside City Council – 2019 Annual Community Satisfaction Survey
Page 110 of 152
8.28
7.85 8.09 8.11 8.227.55 7.89 7.97
7.167.46 7.52
6.43
7.72 7.79
6.937.25 7.54
6.71
0
1
2
3
4
5
6
7
8
9
10
Visit Call email Visit Call email Visit Call email Visit Call email Visit Call email Visit Call email
Understandinglanguage
needs
Professionalismof staff
Understandingof your needs
How longit took todeal with
Accuracy andcomprehensiveness
of information
Satisfactionwith finaloutcome
Satisfaction with aspects of customer service by type of contactBayside City Council - 2019 Annual Community Satisfaction Survey
scale from 0 (very dissatisfied) to 10 (very satisfied)
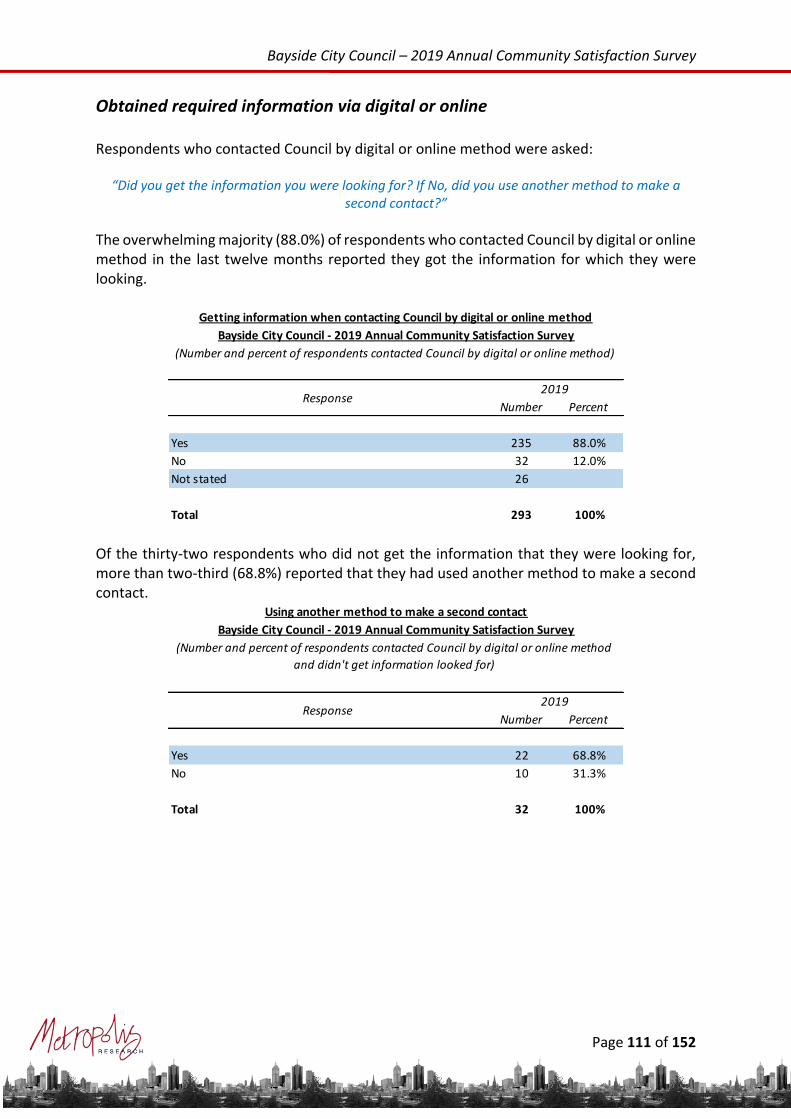
Bayside City Council – 2019 Annual Community Satisfaction Survey
Page 111 of 152
Obtained required information via digital or online
Respondents who contacted Council by digital or online method were asked:
“Did you get the information you were looking for? If No, did you use another method to make a second contact?”
The overwhelming majority (88.0%) of respondents who contacted Council by digital or online method in the last twelve months reported they got the information for which they were looking.
Of the thirty-two respondents who did not get the information that they were looking for, more than two-third (68.8%) reported that they had used another method to make a second contact.
Getting information when contacting Council by digital or online method
Bayside City Council - 2019 Annual Community Satisfaction Survey
(Number and percent of respondents contacted Council by digital or online method)
Number Percent
Yes 235 88.0%
No 32 12.0%
Not stated 26
Total 293 100%
Response2019
Using another method to make a second contact
Bayside City Council - 2019 Annual Community Satisfaction Survey
Number Percent
Yes 22 68.8%
No 10 31.3%
Total 32 100%
Response2019
(Number and percent of respondents contacted Council by digital or online method
and didn't get information looked for)
Bayside City Council – 2019 Annual Community Satisfaction Survey
Page 112 of 152
Importance of and satisfaction with Council services
Respondents were asked:
“On a scale of 0 (lowest) to 10 (0 being the lowest and 10 the highest), can you please rate the importance to the community, and your personal level of satisfaction with each of the following
Council provided services?”
Importance of Council services and facilities
Respondents were asked how important they considered each of the twenty-six Council services and facilities are to the community, rather than to them as individuals.
The average importance of these twenty-six Council provided services and facilities increased marginally this year, up 3.1% to 8.96 out of ten. Metropolis Research notes that respondents on average rated all twenty-six services and facilities to be very important, with the lowest importance score being 8.27 out of ten and the highest 9.50. This highlights the fact that the community consider important the full range of services and facilities provided by Council, although naturally they tend to rate as relatively more important core service areas such as waste and recycling and health and human services. The following table displays the average importance of each of the twenty-six services and facilities included in the 2019 survey, along with the 95% confidence interval around each average importance score. It also provides the number of respondents providing a score for each service and facility and a comparison to the 2019 metropolitan Melbourne average. The table also displays a graphic showing which services and facilities were measurably more important than the average of all services and facilities in Bayside and which services and facilities were measurably less important than the average of all services and facilities in Bayside. Increased importance The importance of twenty-five of the twenty-six services and facilities increased in 2019. This includes most significantly Council’s website (up 8.8%), Art Centres (up 8.1%), parking enforcement (up 6.7%), local library (up 5.6%), animal management (up 3.5%), on and off-road bike paths (up 3.4%), hard rubbish booking and pick up service (up 3.3%), and public toilets (up 3.3%). Decreased importance The average importance of only one service and facility declined in 2019, that being the appearance of the beach, foreshore and bushland (down 0.9%).

Bayside City Council – 2019 Annual Community Satisfaction Survey
Page 113 of 152
Comparison to the metropolitan Melbourne average importance
The right hand column of the table displays the average importance results for metropolitan Melbourne sourced from the 2019 Governing Melbourne survey. The following measurable variation was observed:
• Higher than average importance in Bayside – includes services for youth (4.0% higher), animal management (3.7% higher), services for older people (3.1% higher), and the provision and maintenance of parks, gardens and reserves (3.1% higher).
• Lower than average importance in Bayside – includes Art Centres (1.7% lower) and parking enforcement (0.1% lower).
Importance of selected Council services and facilities
Bayside City Council - 2019 Annual Community Satisfaction Survey
(Number and index score scale 0 - 10)
Lower Mean Upper
Regular recycling service 697 9.42 9.50 9.58 9.31 9.24
Weekly garbage collection service 698 9.41 9.48 9.56 9.38 9.33
Provision & maint. of parks, gardens and reserves 690 9.13 9.21 9.28 9.03 8.93
Services for people with a disability 631 9.12 9.20 9.28 8.94 9.00
Local l ibrary 672 9.12 9.20 9.28 8.71 8.99
Services for older people 639 9.07 9.15 9.23 8.89 8.87
Green waste collection 685 9.05 9.13 9.21 8.88 9.01
Hard rubbish booking / pick up service 673 9.01 9.10 9.18 8.81 8.98
Maintenance and repair of footpaths 695 8.99 9.08 9.17 8.79 8.93
Maintenance and cleaning of public areas 690 8.97 9.05 9.14 8.80 8.93
Council meeting its environmental responsibilities 642 8.91 9.00 9.10 8.85 8.84
Maintenance and repair of sealed local roads 695 8.91 9.00 9.10 8.80 9.00
Maintenance and repair of drains 681 8.90 9.00 9.10 8.83 8.92
Appearance of the beach & foreshore & bushland 688 8.89 8.98 9.08 9.06 n.a.
Provision and maintenance of street trees 693 8.84 8.94 9.04 8.74 8.77
Public toilets 656 8.85 8.94 9.03 8.65 8.84
Sports grounds and ovals 667 8.82 8.91 8.99 8.64 8.72
Maintenance and cleaning of strip shopping areas 692 8.80 8.89 8.98 8.68 8.78
Services for children from birth to 5 years of age 632 8.79 8.89 8.98 8.65 8.75
Services for youth 634 8.75 8.85 8.95 8.63 8.51
On and off-road bike paths 657 8.72 8.82 8.91 8.53 8.64
Animal management 638 8.65 8.75 8.85 8.46 8.44
Recreation and Aquatic facil ities 627 8.58 8.67 8.76 8.56 8.65
Council's website 648 8.41 8.51 8.61 7.82 8.36
Parking enforcement 686 8.33 8.46 8.59 7.93 8.47
Art Centres 617 8.16 8.27 8.39 7.65 8.42
Average importance 8.87 8.96 9.05 8.69 8.78
(*) 2019 metropolitan Melbourne average from Governing Melbourne
Lowe
r than
average A
verage importance
2019
Metro.*2018Service/facility Number
2019
Higher than average
importance

Bayside City Council – 2019 Annual Community Satisfaction Survey
Page 114 of 152
Satisfaction with Council services and facilities
Respondents were asked to rate their personal satisfaction with each of thirteen core Council provided services and facilities, as well as their satisfaction with each of the thirteen client-based services that they personally or members of their household had used in the last year.
The average satisfaction with these twenty-six services and facilities increased marginally in 2019, up 0.5% to 7.86. This average satisfaction score remains at an “excellent” level.
The following table displays the average satisfaction with each of the twenty-six Council provided services and facilities, along the with the 95% confidence interval around each average importance score. It also provides the number of respondents providing a score for each service and facility and a comparison to the 2019 metropolitan Melbourne average.
Increased satisfaction
Satisfaction with thirteen services and facilities increased in 2019, with attention drawn to the increase in satisfaction with hard rubbish booking and pick up service (up 5.3%), on and off-road bike paths (up 4.3%), the maintenance and repair of footpaths (up 4.3%), and the maintenance and repairs of drains (up 4.2%), all of which were statistically significant.
Decreased satisfaction
Satisfaction with twelve services and facilities declined in 2019, although only the decline in satisfaction with services for people with a disability (down 7.1%) was notable, albeit not statistically significant.
Relative satisfaction with Council services and facilities
The average satisfaction with the twenty-six services and facilities included in the survey can best be summarised as follows:
• Excellent – for local library, weekly garbage collection service, green waste collection, regular recycling service, hard rubbish booking / pick-up service, services for older people, services for children from birth to 5 years of age, sports grounds and ovals, the provision and maintenance of parks, gardens, and reserves, Art Centres, the appearance of the beach, foreshore and bushland, services for people with a disability, recreation and aquatic services, and on and off-road bike paths.
• Very Good – for the maintenance and cleaning of strip shopping areas and public areas, animal management, Council’s website, services for youth, Council meeting its environmental responsibilities, the maintenance and repair of drains and sealed local roads, and the provision and maintenance of street trees.
• Good – for the maintenance and repair of footpaths, public toilets and parking enforcement.
Comparison to the metropolitan Melbourne average satisfaction
Satisfaction with twenty-three of the twenty-five services and facilities that were included in both the Bayside survey and Governing Melbourne was higher in the City of Bayside in 2019 than the 2019 metropolitan Melbourne average, whilst satisfaction with just one service and facility was lower, and one being the same.

Bayside City Council – 2019 Annual Community Satisfaction Survey
Page 115 of 152
The right hand column of the table displays the average satisfaction results for metropolitan Melbourne sourced from the 2019 Governing Melbourne survey. The following measurable variation in satisfaction with services and facilities between the City of Bayside and the metropolitan Melbourne average is noted:
• Higher than average satisfaction – services for older people (7.8% higher), hard rubbish booking and pick up service (7.2% higher), local library (5.7% higher), on and off-road bike paths (5.7% higher), regular recycling service ( 5.6% higher), maintenance and cleaning of public areas (5.4% higher), services for people with a disability (5.3% higher), public toilets (5.2% higher), sports grounds and ovals (5.2% higher), and green waste collection (5.2% higher).
• Lower than average satisfaction – services for youth (0.5% lower).
Satisfaction with selected Council services and facilities
Bayside City Council - 2019 Annual Community Satisfaction Survey
(Number and index score scale 0 - 10)
Lower Mean Upper
Local l ibrary 432 8.95 9.05 9.16 8.78 8.56
Weekly garbage collection service 697 8.67 8.77 8.88 8.88 8.53
Green waste collection 531 8.60 8.71 8.81 8.74 8.28
Regular recycling service 691 8.36 8.49 8.63 8.67 8.04
Hard rubbish booking / pick up service 502 8.33 8.48 8.62 8.05 7.90
Services for older people 91 7.89 8.25 8.60 8.21 7.65
Services for children from birth to 5 years of age 112 7.91 8.19 8.46 8.20 7.92
Sports grounds and ovals 448 8.05 8.18 8.30 8.20 7.78
Provision & maint. of parks, gardens and reserves 678 8.00 8.10 8.20 8.13 7.74
Art Centres 136 7.79 7.99 8.19 8.00 7.86
Appearance of the beach & foreshore & bushland 671 7.82 7.92 8.02 7.92 n.a.
Services for people with a disability 33 7.27 7.92 8.58 8.52 7.52
Recreation and Aquatic facil ities 290 7.71 7.90 8.09 8.09 7.90
On and off-road bike paths 375 7.65 7.82 7.98 7.49 7.40
Maintenance and cleaning of strip shopping areas 686 7.59 7.70 7.81 7.71 7.43
Maintenance and cleaning of public areas 683 7.58 7.69 7.80 7.65 7.30
Animal management 572 7.52 7.65 7.78 7.40 7.41
Council's website 356 7.46 7.62 7.78 7.60 7.34
Services for youth 69 7.08 7.52 7.95 7.64 7.55
Council meeting its environmental responsibilities 592 7.36 7.49 7.62 7.31 7.26
Maintenance and repair of drains 668 7.28 7.43 7.58 7.13 7.39
Maintenance and repair of sealed local roads 690 7.21 7.35 7.49 7.21 7.27
Provision and maintenance of street trees 692 7.11 7.25 7.40 7.04 7.10
Maintenance and repair of footpaths 692 6.88 7.02 7.17 6.73 6.93
Public toilets 292 6.67 6.92 7.16 7.04 6.58
Parking enforcement 663 6.72 6.89 7.05 6.86 6.80
Average satisfaction 7.67 7.86 8.04 7.82 7.48
(*) 2019 metropolitan Melbourne average from Governing Melbourne
High
er th
an ave
rage
satisfaction
Low
er th
an ave
rage
satisfaction
Ave
rage satisfactio
n
2019
Metro.*2018Service/facility Number
2019

Bayside City Council – 2019 Annual Community Satisfaction Survey
Page 116 of 152
The following table provides details as to the number of respondents rating satisfaction with each of the twenty-three services and facilities, and the proportion of respondents that were very satisfied (rating satisfaction at eight or more) and the percentage of respondents dissatisfied (rating zero to four) with each service and facility. Attention is drawn to the fact that more than four-fifths of respondents were very satisfied with the local library (91.4%), weekly garbage collection service (88.8%), green waste collection (87.7%), regular recycling service (83.8%), and the hard rubbish booking / pick up service (81.0%). There were only three services and facilities with which more than ten percent of respondents were dissatisfied; the maintenance and repair of footpaths (11.4%), parking enforcement (11.2%), and public toilets (13.3%).
Satisfaction with selected Council services and facilities
Bayside City Council - 2019 Annual Community Satisfaction Survey
(Percent of respondents providing a response)
Local l ibrary 432 0.3% 91.4%
Weekly garbage collection service 697 1.3% 88.8%
Green waste collection 531 0.5% 87.7%
Regular recycling service 691 3.8% 83.8%
Hard rubbish booking / pick up service 502 3.3% 81.0%
Sports grounds and ovals 448 2.5% 77.6%
Services for older people 91 3.7% 74.8%
Services for children from birth to 5 years of age 112 1.9% 73.4%
Provision and maintenance of parks, gardens and reserves 678 1.3% 72.4%
Recreation and Aquatic facil ities 290 5.4% 70.0%
Appearance of the beach & foreshore & bushland 671 1.9% 68.9%
Art Centres 136 0.0% 68.7%
Services for people with a disability 33 0.0% 65.7%
On and off-road bike paths 375 3.5% 65.0%
Animal management 572 4.0% 64.3%
Maintenance and cleaning of strip shopping areas 686 3.9% 63.4%
Maintenance and cleaning of public areas 683 3.3% 63.1%
Council's website 356 3.9% 61.7%
Maintenance and repair of drains 668 7.1% 60.2%
Services for youth 69 5.9% 58.9%
Council meeting its environmental responsibilities 592 3.7% 58.8%
Maintenance and repair of sealed local roads 690 6.5% 57.8%
Provision and maintenance of street trees 692 8.3% 56.5%
Maintenance and repair of footpaths 692 11.4% 50.1%
Parking enforcement 663 11.2% 48.1%
Public toilets 292 13.3% 47.3%
Dissatisfied
(0 to 4)
Very
Satisfied
(8 to 10)
Service / facility Number

Bayside City Council – 2019 Annual Community Satisfaction Survey
Page 117 of 152
Importance and satisfaction cross tabulation
The following graph provides a cross-tabulation of the average importance of each of the twenty-six included Council services and facilities against the average satisfaction with each service and facility.
The grey cross-hairs represent the metropolitan Melbourne average importance and satisfaction with Council services and facilities as recorded in the 2019 Governing Melbourne research conducted independently by Metropolis Research.
Services and facilities located in the top right-hand quadrant are therefore more important than average, and of higher than average satisfaction. Conversely services in the bottom right hand quadrant are those of most concern as they are of higher than average importance but received lower than average satisfaction scores.
Metropolis Research notes that most of the services of higher than average importance also obtained higher than average satisfaction scores. This suggests that Council is on the whole effectively meeting community expectations in terms of quality service delivery in relation to the most important services. This general pattern is commonly observed by Metropolis Research and is not unique to Bayside.
All the waste and recycling collection services (weekly garbage, recycling, green waste, and hard rubbish) are included in the top right-hand quadrant, as are most of the core health and human services (families and children, older persons, youth, disability services). Metropolis Research has consistently found this pattern both in the City of Bayside, as well as more broadly across metropolitan Melbourne.
It is noted that many of the communication, arts and cultural, and recreation and aquatic facilities tend to be of marginally lower than average importance, but higher than average satisfaction (e.g. Art Centres).
The stand-out service in this top right hand quadrant is the library service, with an average satisfaction score of more than nine out of ten.
The services and facilities of most concern are those in the bottom right hand quadrant, which are of higher than average importance and which received lower than average satisfaction. Within this quadrant, the service that stands out most is the maintenance and repair of footpaths and public toilets.
That said, it is important to bear in mind that the average satisfaction with footpath maintenance and repairs was 7.02 and public toilets was 6.92, both still at a “good” level.
Parking enforcement was of somewhat lower than both the average importance and satisfaction, however this result is consistent with results observed elsewhere across metropolitan Melbourne. Satisfaction with parking enforcement is a very difficult result to improve substantially over time and tends to be a little volatile, as increased enforcement will create additional dissatisfaction with some respondents, whilst reduced enforcement will create additional dissatisfaction with a different group of respondents.

Bayside City Council – 2019 Annual Community Satisfaction Survey
Page 118 of 152
Correlation between satisfaction with services and facilities and overall satisfaction
The following table provides the Pearson correlation coefficient for each of the twenty-six services and facilities when analysed individually against satisfaction with Council’s overall performance. The correlation coefficient provides a measure of the relationship between satisfaction with each of the twenty-six services and facilities and satisfaction with Council’s overall performance. The correlation coefficient is a number between minus one and positive one, with scores of more than zero representing a positive correlation, and scores of less than one a negative correlation. In other words, these results show how closely related satisfaction with the individual services and facilities are to satisfaction with Council’s overall performance. It does not show a causal relationship between satisfaction with services and facilities and overall performance but does highlight how closely they are related (correlated). Each of these correlation coefficients were statistically significant, in other words there was a positive relationship between satisfaction with each service and facility when compared individually to satisfaction with Council’s overall performance.
RoadsDrains
Footpaths
Public areasStrip shopping
Street trees
Garbage
Recycling
Parks and gardensBeach &
foreshore
Envir. Respons.
Animal management
Parking
Website
Green waste
Hard rubbish
Library
Public toilets
Bike paths
Art Centres
Sports grounds
Recreation & Aquatic facilities
Childern services
Youth services
Older people services
Disabled services
6.00
6.25
6.50
6.75
7.00
7.25
7.50
7.75
8.00
8.25
8.50
8.75
9.00
9.25
7.50 7.75 8.00 8.25 8.50 8.75 9.00 9.25 9.50 9.75
Sati
sfac
tio
n
Importance
Importance of and satisfaction with Council servicesBayside City Council - 2019 Annual Community Satisfaction Survey
(Index score scale 0 - 10)

Bayside City Council – 2019 Annual Community Satisfaction Survey
Page 119 of 152
It is important to bear in mind when interpreting the correlation coefficients, that many of the services that are most important and which have consistently recorded high levels of satisfaction tend to have a low correlation coefficient. This is because almost all the respondents are very satisfied with these services (such as the library and the garbage collection service), regardless of whether they were satisfied or dissatisfied with Council’s overall performance. If the performance of Council delivering these critical services and facilities was to fall unexpectedly, such a fall would likely have a significant impact on overall satisfaction with Council.
Satisfaction with selected services and facilities
Bayside City Council - 2019 Annual Community Satisfaction Survey
(Number and index score scale 0 - 10)
Number Mean
Services for people with a disability 33 7.92 0.540
Services for youth 69 7.52 0.477
Council's website 356 7.62 0.449
Recreation and Aquatic facil ities 290 7.90 0.428
Public toilets 292 6.92 0.418
Council meeting its environmental responsibilities 592 7.49 0.412
Maintenance and repair of sealed local roads 690 7.35 0.407
Services for older people 91 8.25 0.384
Sports grounds and ovals 448 8.18 0.377
Maintenance and cleaning of public areas 683 7.69 0.374
On and off-road bike paths 375 7.82 0.373
Maintenance and cleaning of strip shopping areas 686 7.70 0.370
Provision & maintenance of parks, gardens and reserves 678 8.10 0.370
Maintenance and repair of drains 668 7.43 0.363
Provision and maintenance of street trees 692 7.25 0.335
Maintenance and repair of footpaths 692 7.02 0.324
Animal management 572 7.65 0.303
Parking enforcement 663 6.89 0.268
Hard rubbish booking / pick up service 502 8.48 0.249
Art Centres 136 7.99 0.248
Appearance of the beach and foreshore and bushland 671 7.92 0.229
Regular recycling service 691 8.49 0.225
Services for children from birth to 5 years of age 112 8.19 0.198
Green waste collection 531 8.71 0.196
Weekly garbage collection service 697 8.77 0.169
Local l ibrary 432 9.05 0.148
Average satisfaction with selected services
(*) Pearson coefficent
Service / facility2019
Correlation*

Bayside City Council – 2019 Annual Community Satisfaction Survey
Page 120 of 152
Satisfaction by broad service areas
Metropolis Research has created a standard set of broad service areas for use in comparing average satisfaction with results from Governing Melbourne. The following graph provides the average satisfaction with the six broad service areas for the City of Bayside, with a comparison to the metropolitan Melbourne 2019 averages. The breakdown of services and facilities into these six broad service areas is as follows:
• Recreation – includes local library, on and off-road bike paths, Art Centres, sports grounds and ovals, and recreation and aquatic facilities.
• Community – includes services for children from birth to 5 years of age, services for youth, services for older people, and services for people with a disability.
• Waste – includes the maintenance and cleaning of strips shopping areas, the weekly garbage collection service, the regular recycling service, the green waste collection, the hard rubbish booking / pick-up service.
• Communications – includes the Council’s website.
• Infrastructure – includes the maintenance and repair of sealed local roads, the maintenance and repair of drains, the maintenance and repair of footpaths, the maintenance and cleaning of public areas, the provision and maintenance of street trees, the provision and maintenance of parks, gardens and reserves, the appearance of the beach and foreshore and bushland, and public toilets.
• Local laws – includes animal management, and parking enforcement.
The average satisfaction with three of the six broad service areas increased measurably in 2019, whilst satisfaction with two declined marginally. Satisfaction with these six broad service areas can best be summarised as follows:
• Excellent – for waste, recreation, community services, and local laws.
• Very Good – for communications and infrastructure.

Bayside City Council – 2019 Annual Community Satisfaction Survey
Page 121 of 152
When compared to the 2019 metropolitan Melbourne average satisfaction with the six broad service areas, it is noted that satisfaction with waste services, recreation, local laws, communications, and infrastructure were all measurably higher, whilst satisfaction with community services was marginally higher in the City of Bayside than the metropolitan Melbourne average.
8.32 8.42
7.73
8.30 8.14 7.96
7.357.78
6.86
7.62 7.58 7.46
0
1
2
3
4
5
6
7
8
9
10
2018 2019 2018 2019 2018 2019 2018 2019 2018 2019 2018 2019
Waste Recreation Community Local laws Communications Infrastructure
Satisfaction by broad service areasBayside City Council - 2019 Annual Community Satisfaction Survey
scale from 0 (very dissatisfied) to 10 (very satisfied)
8.427.81
8.307.90 7.96 7.66 7.78
7.187.62
7.17 7.467.12
0
1
2
3
4
5
6
7
8
9
10
City
of
Bay
side
met
ro. M
elb
ourn
e
City
of
Bay
side
met
ro. M
elb
ourn
e
City
of
Bay
side
met
ro. M
elb
ourn
e
City
of
Bay
side
met
ro. M
elb
ourn
e
City
of
Bay
side
met
ro. M
elb
ourn
e
City
of
Bay
side
met
ro. M
elb
ourn
e
Waste Recreation Community Local laws Communications Infrastructure
Satisfaction by broad service areasBayside City Council - 2019 Annual Community Satisfaction Survey
scale from 0 (very dissatisfied) to 10 (very satisfied)

Bayside City Council – 2019 Annual Community Satisfaction Survey
Page 122 of 152
Recreation services and facilities
Local library
Library
Bike paths
Art Centres
Sports grounds
Recreation & Aquatic facilities
6.50
6.75
7.00
7.25
7.50
7.75
8.00
8.25
8.50
8.75
9.00
9.25
8.00 8.25 8.50 8.75 9.00 9.25 9.50 9.75
Sati
sfac
tio
n
Importance
Importance of and satisfaction with RecreationBayside City Council - 2019 Annual Community Satisfaction Survey
(Index score scale 0 - 10)
8.719.20
8.789.05
0
1
2
3
4
5
6
7
8
9
10
2018 2019 2018 2019
Importance Satisfaction
Importance of and satisfaction with local libraryBayside City Council - 2019 Annual Community Satisfaction Survey
(Index score 0 - 10)

Bayside City Council – 2019 Annual Community Satisfaction Survey
Page 123 of 152
On and off-road bike paths
Art Centres
8.538.82
7.497.82
0
1
2
3
4
5
6
7
8
9
10
2018 2019 2018 2019
Importance Satisfaction
Importance of and satisfaction with on and off-road bike pathsBayside City Council - 2019 Annual Community Satisfaction Survey
(Index score 0 - 10)
7.65
8.278.00 7.99
0
1
2
3
4
5
6
7
8
9
10
2018 2019 2018 2019
Importance Satisfaction
Importance of and satisfaction with Art CentresBayside City Council - 2019 Annual Community Satisfaction Survey
(Index score 0 - 10)

Bayside City Council – 2019 Annual Community Satisfaction Survey
Page 124 of 152
Sports grounds and ovals
Recreation and Aquatic facilities
8.648.91
8.20 8.18
0
1
2
3
4
5
6
7
8
9
10
2018 2019 2018 2019
Importance Satisfaction
Importance of and satisfaction with sports grounds and ovalsBayside City Council - 2019 Annual Community Satisfaction Survey
(Index score 0 - 10)
8.56 8.67
8.09 7.90
0
1
2
3
4
5
6
7
8
9
10
2018 2019 2018 2019
Importance Satisfaction
Importance of and satisfaction with recreation and aquatic facilitiesBayside City Council - 2019 Annual Community Satisfaction Survey
(Index score 0 - 10)

Bayside City Council – 2019 Annual Community Satisfaction Survey
Page 125 of 152
Community
Services for children from birth to 5 years of age
Childern services
Youth services
Older people services
Disabled services
6.50
6.75
7.00
7.25
7.50
7.75
8.00
8.25
8.50
8.75
9.00
9.25
8.00 8.25 8.50 8.75 9.00 9.25 9.50 9.75
Sati
sfac
tio
n
Importance
Importance of and satisfaction with Community servicesBayside City Council - 2019 Annual Community Satisfaction Survey
(Index score scale 0 - 10)
8.658.89
8.20 8.19
0
1
2
3
4
5
6
7
8
9
10
2018 2019 2018 2019
Importance Satisfaction
Importance of and satisfaction with services for children from birth to 5 years of ageBayside City Council - 2019 Annual Community Satisfaction Survey
(Index score 0 - 10)

Bayside City Council – 2019 Annual Community Satisfaction Survey
Page 126 of 152
Services for youth
The biggest centre closed 1
Total 1
Reason for dissatisfaction with services for children
Bayside City Council - 2019 Annual Community Satisfaction Survey
(Number of responses)
Reason Number
8.63 8.85
7.64 7.52
0
1
2
3
4
5
6
7
8
9
10
2018 2019 2018 2019
Importance Satisfaction
Importance of and satisfaction with services for youthBayside City Council - 2019 Annual Community Satisfaction Survey
(Index score 0 - 10)
Don't see any activities (not promote), low visibility 1
Nothing for children (very little activities) 1
There is no variety and lack of infrastructure, nothing for working parents 1
Total 3
Reason for dissatisfaction with services for youth
Bayside City Council - 2019 Annual Community Satisfaction Survey
(Number of responses)
Reason Number

Bayside City Council – 2019 Annual Community Satisfaction Survey
Page 127 of 152
Services for older people
8.899.15
8.21 8.25
0
1
2
3
4
5
6
7
8
9
10
2018 2019 2018 2019
Importance Satisfaction
Importance of and satisfaction with services for older peopleBayside City Council - 2019 Annual Community Satisfaction Survey
(Index score 0 - 10)
Not many services 1
Totally inadequate and inconsistent 1
When applied - they were not available 1
Total 3
Reason for dissatisfaction with services for older people
Bayside City Council - 2019 Annual Community Satisfaction Survey
(Number of responses)
Reason Number

Bayside City Council – 2019 Annual Community Satisfaction Survey
Page 128 of 152
Services for people with a disability
8.949.20
8.52
7.92
0
1
2
3
4
5
6
7
8
9
10
2018 2019 2018 2019
Importance Satisfaction
Importance of and satisfaction with services for people with a disabilityBayside City Council - 2019 Annual Community Satisfaction Survey
(Index score 0 - 10)
Need even footpaths 2
I don't know how to do this, the people in the hospital need the service, I need assistance when I
get injured1
Total 3
Reason for dissatisfaction with services for people with a disability
Bayside City Council - 2019 Annual Community Satisfaction Survey
(Number of responses)
Reason Number

Bayside City Council – 2019 Annual Community Satisfaction Survey
Page 129 of 152
Waste
Maintenance and cleaning of strips shopping areas
Strip shopping
Garbage
Recycling
Green waste
Hard rubbish
6.50
6.75
7.00
7.25
7.50
7.75
8.00
8.25
8.50
8.75
9.00
9.25
8.00 8.25 8.50 8.75 9.00 9.25 9.50 9.75
Sati
sfac
tio
n
Importance
Importance of and satisfaction with Waste servicesBayside City Council - 2019 Annual Community Satisfaction Survey
(Index score scale 0 - 10)
8.68 8.89
7.71 7.70
0
1
2
3
4
5
6
7
8
9
10
2018 2019 2018 2019
Importance Satisfaction
Importance of and satisfaction with the maintenance and cleaning of shopping areasBayside City Council - 2019 Annual Community Satisfaction Survey
(Index score 0 - 10)

Bayside City Council – 2019 Annual Community Satisfaction Survey
Page 130 of 152
Weekly garbage collection
Regular recycling
9.38 9.48
8.88 8.77
0
1
2
3
4
5
6
7
8
9
10
2018 2019 2018 2019
Importance Satisfaction
Importance of and satisfaction with the weekly garbage collection serviceBayside City Council - 2019 Anuual Community Satisfaction Survey
(Index score 0 - 10)
9.31 9.50
8.67 8.49
0
1
2
3
4
5
6
7
8
9
10
2018 2019 2018 2019
Importance Satisfaction
Importance of and satisfaction with the regualr recycling serviceBayside City Council - 2019 Annual Community Satisfaction Survey
(Index score 0 - 10)

Bayside City Council – 2019 Annual Community Satisfaction Survey
Page 131 of 152
Green waste collection
Hard rubbish booking / pick up service
8.889.13
8.74 8.71
0
1
2
3
4
5
6
7
8
9
10
2018 2019 2018 2019
Importance Satisfaction
Importance of and satisfaction with green waste collectionBayside City Council - 2019 Annual Community Satisfaction Survey
(Index score 0 - 10)
8.819.10
8.058.48
0
1
2
3
4
5
6
7
8
9
10
2018 2019 2018 2019
Importance Satisfaction
Importance of and satisfaction with hard rubbish booking / pick up serviceBayside City Council - 2019 Annual Community Satisfaction Survey
(Index score 0 - 10)

Bayside City Council – 2019 Annual Community Satisfaction Survey
Page 132 of 152
Council meeting its environmental responsibilities
8.85 9.00
7.31 7.49
0
1
2
3
4
5
6
7
8
9
10
2018 2019 2018 2019
Importance Satisfaction
Importance of and satisfaction with Council meeting environmental responsibilitiesBayside City Council - 2019 Annual Community Satisfaction Survey
(Index score 0 - 10)

Bayside City Council – 2019 Annual Community Satisfaction Survey
Page 133 of 152
Too much development 4
Lack of awareness 3
No evidence of meeting responsibilities 3
They are cutting down the trees 3
Cleaning of drains isn't ensured 2
Could be more 2
Knocking down properties with trees 2
More budget should be put on environmental protection 2
Bay St Brighton is not managed well 1
Because they don't recycle stuff l ike the mattress 1
Better trees should be better maintained 1
Council don't tell me anything besides recycling rubbish 1
Green waste and the cost of disposal is too high 1
I think sometimes environmental issue is over concerned 1
Issue with adversity housing 1
Need better recycling 1
Need to do more for climate change 1
Need to make more efforts 1
Not doing enough for the environment in terms of cleanliness 1
Not enough focus on carbon pollution 1
Not sufficient education on waste management 1
Overcharging for solar power 1
Pesticides 1
There should be more education about recycling 1
They do nothing, only think of themselves 1
They don't do enough for environment (e.g. public building using green energy) 1
Trees are fall ing onto my car in the drive way 1
Waste management 1
We need more bins around on Marriage Rd 1
Total 42
Reason for dissatisfaction with Council meeting its environmental responsibilities
Bayside City Council - 2019 Annual Community Satisfaction Survey
(Number of responses)
Reason Number

Bayside City Council – 2019 Annual Community Satisfaction Survey
Page 134 of 152
Communications
Council’s website
Website
6.50
6.75
7.00
7.25
7.50
7.75
8.00
8.25
8.50
8.75
9.00
9.25
8.00 8.25 8.50 8.75 9.00 9.25 9.50 9.75
Sati
sfac
tio
n
Importance
Importance of and satisfaction with CommunicationBayside City Council - 2019 Annual Community Satisfaction Survey
(Index score scale 0 - 10)
7.82
8.51
7.60 7.62
0
1
2
3
4
5
6
7
8
9
10
2018 2019 2018 2019
Importance Satisfaction
Importance of and satisfaction with Council's websiteBayside City Council - 2019 Annual Community Satisfaction Survey
(Index score 0 - 10)
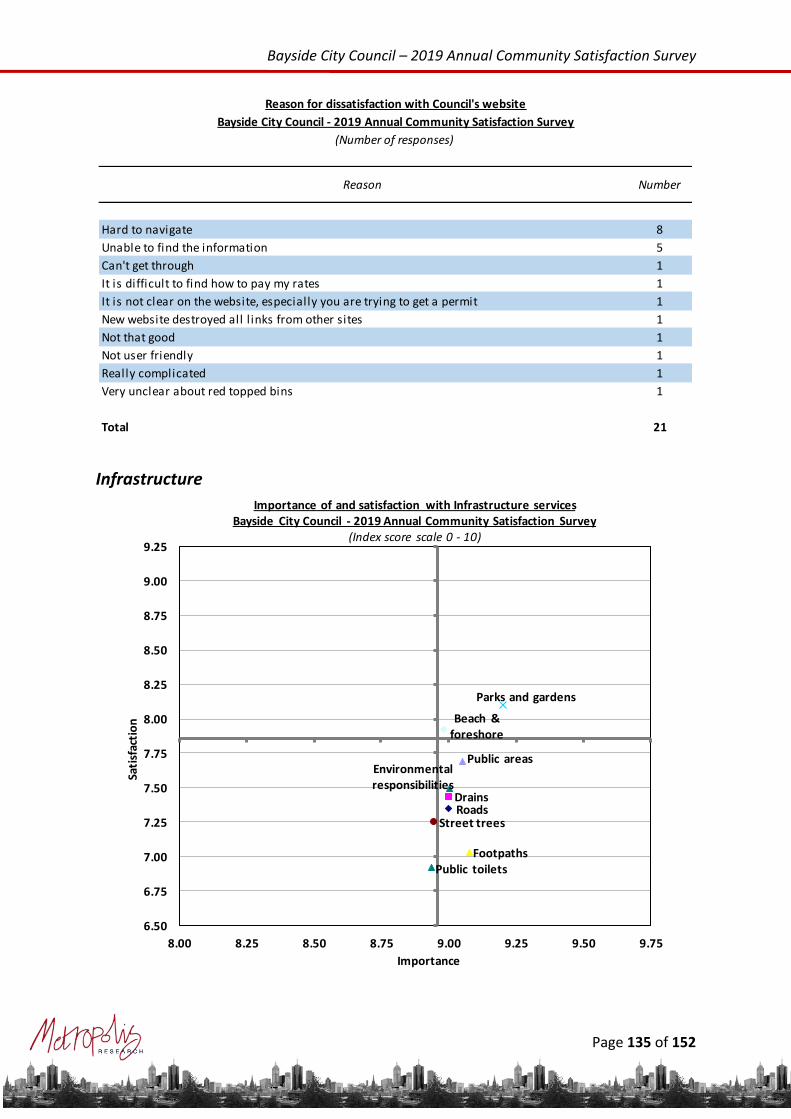
Bayside City Council – 2019 Annual Community Satisfaction Survey
Page 135 of 152
Infrastructure
Hard to navigate 8
Unable to find the information 5
Can't get through 1
It is difficult to find how to pay my rates 1
It is not clear on the website, especially you are trying to get a permit 1
New website destroyed all l inks from other sites 1
Not that good 1
Not user friendly 1
Really complicated 1
Very unclear about red topped bins 1
Total 21
Reason for dissatisfaction with Council's website
Bayside City Council - 2019 Annual Community Satisfaction Survey
(Number of responses)
Reason Number
RoadsDrains
Footpaths
Public areas
Street trees
Parks and gardens
Beach & foreshore
Environmental responsibilities
Public toilets
6.50
6.75
7.00
7.25
7.50
7.75
8.00
8.25
8.50
8.75
9.00
9.25
8.00 8.25 8.50 8.75 9.00 9.25 9.50 9.75
Sati
sfac
tio
n
Importance
Importance of and satisfaction with Infrastructure servicesBayside City Council - 2019 Annual Community Satisfaction Survey
(Index score scale 0 - 10)

Bayside City Council – 2019 Annual Community Satisfaction Survey
Page 136 of 152
Maintenance and repairs of sealed local roads
Maintenance and repair of drains
8.80 9.00
7.21 7.35
0
1
2
3
4
5
6
7
8
9
10
2018 2019 2018 2019
Importance Satisfaction
Importance of and satisfaction with the maintenance and repair of sealed local roadsBayside City Council - 2019 Annual Community Satisfaction Survey
(Index score 0 - 10)
8.83 9.00
7.137.43
0
1
2
3
4
5
6
7
8
9
10
2018 2019 2018 2019
Importance Satisfaction
Importance of and satisfaction with the maintenance and repair of drainsBayside City Council - 2019 Annual Community Satisfaction Survey
(Index score 0 - 10)

Bayside City Council – 2019 Annual Community Satisfaction Survey
Page 137 of 152
Maintenance and repair of footpaths
Maintenance and cleaning of public areas
8.799.08
6.737.02
0
1
2
3
4
5
6
7
8
9
10
2018 2019 2018 2019
Importance Satisfaction
Importance of and satisfaction with the maintenance and repair of footpathsBayside City Council - 2019 Annual Community Satisfaction Survey
(Index score 0 - 10)
8.809.05
7.65 7.69
0
1
2
3
4
5
6
7
8
9
10
2018 2019 2018 2019
Importance Satisfaction
Importance of and satisfaction with the maintenance and cleaning of public areasBayside City Council - 2019 Annual Community Satisfaction Survey
(Index score 0 - 10)

Bayside City Council – 2019 Annual Community Satisfaction Survey
Page 138 of 152
Public toilets
Provision and maintenance of street trees
8.658.94
7.04 6.92
0
1
2
3
4
5
6
7
8
9
10
2018 2019 2018 2019
Importance Satisfaction
Importance of and satisfaction with public toiletsBayside City Council - 2019 Annual Community Satisfaction Survey
(Index score 0 - 10)
8.74 8.94
7.04 7.25
0
1
2
3
4
5
6
7
8
9
10
2018 2019 2018 2019
Importance Satisfaction
Importance of and satisfaction with the provision and maintenance of street treesBayside City Council - 2019 Annual Community Satisfaction Survey
(Index score 0 - 10)

Bayside City Council – 2019 Annual Community Satisfaction Survey
Page 139 of 152
Provision and maintenance of parks, gardens and reserves
9.03 9.21
8.13 8.10
0
1
2
3
4
5
6
7
8
9
10
2018 2019 2018 2019
Importance Satisfaction
Importance of and satisfaction with the provision of parks, gardens and reservesBayside City Council - 2019 Annual Community Satisfaction Survey
(Index score 0 - 10)
Don't get watered enough 3
Not well maintained 3
Too much litter around in the park 3
Dendy Park has issues with dogs on leash, kids playground has no fences 1
Equipment needs maintenance 1
I think some green area could be better designed 1
Need to be more 1
Neglected paths 1
Not adequate 1
Not enough new playground 1
Not very clean 1
Parks are in bad state on South Road 1
Public toilets need to be replaced for safety reason 1
Unresponsive to suggestions 1
Use of pesticides in the park 1
Total 21
Reason for dissatisfaction with the provision and maintenance of parks, gardens and reserves
Bayside City Council - 2019 Annual Community Satisfaction Survey
(Number of responses)
Reason Number

Bayside City Council – 2019 Annual Community Satisfaction Survey
Page 140 of 152
Appearance of beach and foreshore and bushland
Local laws
9.06 8.98
7.92 7.92
0
1
2
3
4
5
6
7
8
9
10
2018 2019 2018 2019
Importance Satisfaction
Importance of and satisfaction with the appearance of the beach and foreshore and bushland
Bayside City Council - 2019 Annual Community Satisfaction Survey
(Index score 0 - 10)
Animal management
Parking
6.50
6.75
7.00
7.25
7.50
7.75
8.00
8.25
8.50
8.75
9.00
9.25
8.00 8.25 8.50 8.75 9.00 9.25 9.50 9.75
Sati
sfac
tio
n
Importance
Importance of and satisfaction with Local LawsBayside City Council - 2019 Annual Community Satisfaction Survey
(Index score scale 0 - 10)

Bayside City Council – 2019 Annual Community Satisfaction Survey
Page 141 of 152
Animal management
Parking enforcement
It is noted that of the 77 comments received from respondents dissatisfied with Council’s parking enforcement performance, 15 said that there was “not enough parking”, which is clearly a different issue.
8.468.75
7.407.65
0
1
2
3
4
5
6
7
8
9
10
2018 2019 2018 2019
Importance Satisfaction
Importance of and satisfaction with animal managementBayside City Council - 2019 Annual Community Satisfaction Survey
(Index score 0 - 10)
7.938.46
6.86 6.89
0
1
2
3
4
5
6
7
8
9
10
2018 2019 2018 2019
Importance Satisfaction
Importance of and satisfaction with parking enforcementBayside City Council - 2019 Annual Community Satisfaction Survey
(Index score 0 - 10)

Bayside City Council – 2019 Annual Community Satisfaction Survey
Page 142 of 152
Not enough parking 15
Not enough enforcement 6
Too many cars parked in front of houses / in residential area 6
Too many restrictions 5
Over enforced 4
We often have cars parking il legally 4
Not enough time / time limits should be longer 3
Charged too much for parking, how can families afford it 2
Got fined for parking that we should not have 2
People are parking in my driveway 2
4h parking on our streets 1
Been fined in official car parks 1
Council should spend money elsewhere on more serious issues 1
Focus on the wrong thing, parking enforcement is to raise fund, not for the real interest 1
I am confused about the parking system and it's inconsistent 1
Money grabbing as a result of insufficient parking 1
More handicap parking 1
More no standing sign 1
Not enough parking at train station 1
Parking in the hospital 1
Parking tickets 1
People park anywhere they want, blocking the street 1
School parking is inconvenient 1
Should be free along the beach 1
They are money grabbing 1
Too expensive to park near the beach 1
Too strict at the beach 1
Too strict, 4H parking in quiet streets 1
Too inflexible for locals 1
Two hour parking on one side of the Lotter St 2
Dendy St (no Council checking around the Beach on weekends) 1
Gill ies St has l imitation now - 2P, it is a bad news for us 1
No parking, the street is constantly parked - Bil lson St 1
Not enough parking around Summerhill Rd and nature strip parking issue 1
Parking all over Southey St, always full 1
Parking issue on Lotter St 1
Ridiculous restriction on Highett Road, hence side streets get blocked 1
Total 77
Specific sites identified by respondents
Reason for dissatisfaction with parking enforcement
Bayside City Council - 2019 Annual Community Satisfaction Survey
(Number of responses)
Reason Number

Bayside City Council – 2019 Annual Community Satisfaction Survey
Page 143 of 152
Respondent profile
The following section provides the demographic profile of respondents to the Bayside City Council – 2019 Annual Community Satisfaction Survey.
These results clearly indicate that for the core components of age, gender, and language spoken at home, the survey obtained a sample that was generally reflective of the underlying population of the City of Bayside. This reflects well on the comprehensive nature of the survey methodology.
It is noted that whilst the gender results are very consistent with the 2017 estimated resident population results, the survey does slightly under-represent young persons (aged 15 to 34 years) and slightly over-represent adults aged 35 to 74 years. The under-representation of young adults is a well established issue with social research, and the door-to-door methodology is the best method of ensuring these residents are included. Staff specifically asked at the door if there was a young person available, to maximise their participation.
Age structure
Gender
Age structure
Bayside City Council - 2019 Annual Community Satisfaction Survey
(Number and percent of respondents providing a response)
Number Percent
Adolescents (15 - 19 years) 25 3.6% 2.4% 7.8%
Young adults (20 - 34 years) 69 9.8% 11.6% 17.8%
Adults (35 - 44 years) 134 19.1% 18.2% 15.4%
Middle-aged adults (45 - 59 years) 226 32.2% 25.4% 28.4%
Older adults (60 - 74 years) 170 24.2% 30.3% 19.5%
Senior citizens (75 years and over) 78 11.1% 12.1% 11.0%
Not stated 0 1
Total 702 100% 705 84,456
2017
ERPAge
20192018
Gender
Bayside City Council - 2019 Annual Community Satisfaction Survey
(Number and percent of respondents providing a response)
Number Percent
Male 339 48.3% 49.1% 47.4%
Female 363 51.7% 50.9% 52.6%
Other 0 0.0% 0.0% 0.0%
Prefer not to say / not stated 0 2 0
Total 702 100% 705 84,456
Gender2019
20182017
ERP

Bayside City Council – 2019 Annual Community Satisfaction Survey
Page 144 of 152
Language spoken at home
Language spoken at home
Bayside City Council - 2019 Annual Community Satisfaction Survey
(Number and percent of respondents providing a response)
Number Percent
English 561 80.6% 84.8%
Mandarin 18 2.6% 1.6%
Italian 16 2.3% 1.6%
German 9 1.3% 0.3%
French 8 1.1% 1.4%
Greek 8 1.1% 1.1%
Russian 6 0.9% 1.4%
Hindi 5 0.7% 0.3%
Arabic 4 0.6% 0.1%
Polish 4 0.6% 0.3%
Swedish 4 0.6% 0.0%
African Languages (excluding North Africa) 3 0.5% 0.0%
Croatian 2 0.3% 0.3%
Danish 2 0.3% 0.1%
Dutch 2 0.3% 0.5%
Hebrew 2 0.3% 0.1%
Japanese 2 0.3% 0.9%
Maltese 2 0.3% 0.0%
Spanish 2 0.3% 0.1%
Tamil 2 0.2% 0.0%
Ukranian 2 0.3% 0.0%
Afrikaans 1 0.1% 0.1%
Irish 1 0.1% 0.0%
Latin 1 0.1% 0.0%
Malayalam 1 0.2% 0.0%
Malayalam 1 0.2% 0.0%
Persian 1 0.1% 0.2%
Punjabi 1 0.1% 0.0%
Serbian 1 0.1% 0.2%
Swedish 1 0.1% 0.1%
Turkish 1 0.2% 0.0%
Turkish 1 0.1% 0.1%
Urdu 1 0.1% 0.0%
Vietnamese 1 0.1% 0.2%
Other languages 3 0.4% 0.9%
Multiple 16 2.3% 1.9%
Not stated 6 8
Total 702 100% 705
Language2019
2018

Bayside City Council – 2019 Annual Community Satisfaction Survey
Page 145 of 152
Household structure
Household member with a disability
Household structure
Bayside City Council - 2019 Annual Community Satisfaction Survey
(Number and percent of respondents providing a response)
Number Percent
Two parent family total 353 50.5% 43.8%
youngest child 0 - 4 years 58 8.3% 8.0%
youngest child 5 - 12 years 121 17.3% 14.1%
youngest child 13 - 18 years 72 10.3% 8.4%
adult children only 102 14.6% 13.4%
One parent family 40 5.7% 5.4%
youngest child 0 - 4 years 0 0.0% 0.1%
youngest child 5 - 12 years 9 1.3% 1.1%
youngest child 13 - 18 years 9 1.3% 0.4%
adult children only 22 3.1% 3.7%
Couple only household 170 24.3% 33.7%
Group household 27 3.9% 1.8%
Sole person household 90 12.9% 12.1%
Extended or multiple families 19 2.7% 3.3%
Not stated 3 1
Total 702 100% 705
Structure2019
2018
Household member with a disability
Bayside City Council - 2019 Annual Community Satisfaction Survey
(Number and percent of respondents providing a response)
Number Percent
Yes 44 6.3% 9.8%
No 656 93.7% 90.2%
Not stated 2 3
Total 702 100% 705
Response2019
2018

Bayside City Council – 2019 Annual Community Satisfaction Survey
Page 146 of 152
Dog or cat owners
Current housing situation
Own dogs or cats
Bayside City Council - 2019 Annual Community Satisfaction Survey
(Number and percent of respondents providing a response)
Number Percent
Dog or dogs 255 36.6%
Cat or cats 79 11.3%
Both dogs and cats 32 4.6%
No dogs or cats in the home 331 47.5%
Not stated 5
Total 702 100%
Response2019
Current housing situation
Bayside City Council - 2019 Annual Community Satisfaction Survey
(Number and percent of respondents providing a response)
Number Percent
Own this home 473 68.1% 67.2%
Mortgage (paying-off this home) 127 18.3% 19.5%
Private rental 93 13.4% 11.0%
Renting from the Office of Housing 2 0.3% 2.3%
Not stated 7 6
Total 702 100% 705
Situation2019
2018

Bayside City Council – 2019 Annual Community Satisfaction Survey
Page 147 of 152
Dwelling type
Period of residence in the City of Bayside
Dwelling type
Bayside City Council - 2019 Annual Community Satisfaction Survey
(Number and percent of respondents providing a response)
Number Percent
Separate house 563 80.7% 75.8%
Semi-detached, row or terrace 68 9.7% 8.3%
Flat, unit, or apartment 67 9.6% 15.6%
Other 0 0.0% 0.3%
Not stated 4 6
Total 702 100% 705
Type2019
2018
Period of residence
Bayside City Council - 2019 Annual Community Satisfaction Survey
(Number and percent of respondents providing a response)
Number Percent
Less than one year 36 5.1% 4.6%
One to less than five years 121 17.2% 16.2%
Five to less than ten years 98 14.0% 13.5%
Ten years or more 447 63.7% 65.7%
Not stated 0 3
Total 702 100% 705
Period2019
2018

Bayside City Council – 2019 Annual Community Satisfaction Survey
Page 148 of 152
General comments
The following comments were received from respondents to the Bayside City Council – 2019 Annual Community Satisfaction Survey.
General comments
Bayside City Council - 2019 Annual Community Satisfaction Survey
(Number of total responses)
Number Percent
Planning and development issues 14 19.4% 15.3%
Roads, footpath and bike facil ities 8 11.1% 4.6%
General positive comments 7 9.7% 6.1%
Parking 6 8.3% 11.5%
Green waste, recycling, l itter, hard rubbish 6 8.3% 3.1%
Traffic and public transport management 4 5.6% 9.2%
Communication, consultation & Council management 4 5.6% 9.2%
Parks, gardens, open spaces and tree maintenances 4 5.6% 6.1%
Comments relating to this survey 3 4.2% 6.1%
Rates / financial management 3 4.2% 2.3%
Community facil ities / services 2 2.8% 6.1%
Animal management 2 2.8% 4.6%
Drains and flooding 2 2.8% 2.3%
Cleanliness of areas 0 0.0% 2.3%
Safety, policing and crime 0 0.0% 1.5%
General negative comments 0 0.0% 0.8%
Other 7 9.7% 9.2%
Total 72 100% 131
20182019
Comment

Bayside City Council – 2019 Annual Community Satisfaction Survey
Page 149 of 152
Overdevelopment is a big concern 3
Dandy St Beach development needs to be stopped 1
Be more flexible with planning 1
Development planning needs to be sorted 1
Focus on the basics of adequate infrastructure 1
I love living here but not looking forward to all development and traffic 1
I think planning for development particularly in residential area is a big issue 1
If the planning can be improved, it will be 100% good 1
Need more protection, because developers seem to get exceptions from the requirement to
protect trees1
Stop development of multistorey apartment 1
They seem to be alright at the moment, there is too much new development over my road 1
Unnecessary development in the area, leading to a less of ethics 1
Improve public transport 1
Improve public transport from East Brighton to Southland 1
Just traffic on Hampton Street 1
The speed of traffic on residential streets is too fast, put more speed humps 1
Recycling 2
Cost of green waste needs to be better managed 1
Don't know what is happening to recycling - environmentally stabilised locally 1
More waste composting 1
Please provide green waste bin free of charge 1
Fix damaged drains on Bay Road 1
Sweep gutter more often, leaves everywhere 1
Planning and development issues
General comments
Bayside City Council - 2019 Annual Community Satisfaction Survey
(Number of responses)
Comment Number
Drains and flooding
Traffic and public transport management
Green waste, recycling, litter, hard rubbish

Bayside City Council – 2019 Annual Community Satisfaction Survey
Page 150 of 152
Better skate parks 1
Just let me take my tree out, because it is dangerous now 1
Planting fruit trees 1
Replacement of trees 1
Feel that the Council collects more for running office and not happy with the rates paid 1
Rates should be controlled 1
The Council doesn't get the best price for projects 1
Be proactive 1
Listen what people say 1
More consultation 1
Pander too much to the government, which should stop 1
All day parking on Southey St is a huge issue, sometimes it stays for weeks 1
All residents must have their own parking 1
Coles car park (Bay St and Male St) is very dangerous - it holds up the traffic 1
Need more parking in Bay St Brighton 1
Parking doesn't accept real money but only credit cards 1
Street parking should be longer (more than 1 hour) 1
Control dogs on foreshore 1
Please move the possums 1
They are doing a good job 3
Bayside Council is the best Council in Melbourne 1
Lucky to stay in the place 1
Very happy living in East Brighton 1
Very happy with the Council 1
General positive comments
(Number of responses)
Comment Number
Parking
Animal management
Parks, gardens, open spaces and tree maintenance
Rates / financial management
Communication, consultation and Council management
General comments
Bayside City Council - 2019 Annual Community Satisfaction Survey

Bayside City Council – 2019 Annual Community Satisfaction Survey
Page 151 of 152
Needs more family friendly activities 1
Facilities are quite underwhelming 1
Better bike paths 2
Concourse footpath needs to be repaired 1
Do not make Beach Rd single lane 1
Holes on Were St need to be repaired 1
Need more bike paths 1
Too many bumps on the road 1
Zebra crossing for the kids 1
Market research should be mailed out, with a return envelope, not brought around door to
door, I would have more time to think about my responses1
Questions are too personal and not make sense 1
This survey is too long 1
Access to school is not safe and convenient - Brighton Primary School 1
Awareness of possibilities of flammable cladding in houses 1
Cap population as steady as possible 1
I don't understand why they want to increase population 1
Keeping bay water clean - top priority in Bayside - main attraction and asset 1
Not happy with the corner of Panorama Ave and Highett Road 1
Talk to me about the future of Bayside 1
Total 72
Comments relating to this survey
General comments
Bayside City Council - 2019 Annual Community Satisfaction Survey
(Number of responses)
Comment Number
Other
Roads, footpath and bike facilities
Community facilities / services

Bayside City Council – 2019 Annual Community Satisfaction Survey
Page 152 of 152
Appendix One: survey form

On a scale of 0 (lowest) to 10 (highest), can you please rate the importance to the community, and your personal level of satisfaction with each of the following Council provided services?
1. The maintenance and repair of sealed local roads
Importance 0 1 2 3 4 5 6 7 8 9 10 99
Satisfaction 0 1 2 3 4 5 6 7 8 9 10 99
2. The maintenance and repair of drains
Importance 0 1 2 3 4 5 6 7 8 9 10 99
Satisfaction 0 1 2 3 4 5 6 7 8 9 10 99
3. The maintenance and repair of footpaths
Importance 0 1 2 3 4 5 6 7 8 9 10 99
Satisfaction 0 1 2 3 4 5 6 7 8 9 10 99
4. The maintenance and cleaning of public areas (including litter collection)
Importance 0 1 2 3 4 5 6 7 8 9 10 99
Satisfaction 0 1 2 3 4 5 6 7 8 9 10 99
5. The maintenance and cleaning of strip shopping areas
Importance 0 1 2 3 4 5 6 7 8 9 10 99
Satisfaction 0 1 2 3 4 5 6 7 8 9 10 99
6. The provision and maintenance of street trees
Importance 0 1 2 3 4 5 6 7 8 9 10 99
Satisfaction 0 1 2 3 4 5 6 7 8 9 10 99
7. The weekly garbage collection service
Importance 0 1 2 3 4 5 6 7 8 9 10 99
Satisfaction 0 1 2 3 4 5 6 7 8 9 10 99
8. The regular recycling service
Importance 0 1 2 3 4 5 6 7 8 9 10 99
Satisfaction 0 1 2 3 4 5 6 7 8 9 10 99
9. The provision and maintenance of parks, gardens and reserves
Importance 0 1 2 3 4 5 6 7 8 9 10 99
Satisfaction 0 1 2 3 4 5 6 7 8 9 10 99
Reason for rating satisfaction less than 6
10. The appearance of the beach and foreshore and bushland
Importance 0 1 2 3 4 5 6 7 8 9 10 99
Satisfaction 0 1 2 3 4 5 6 7 8 9 10 99
11. Council meeting its environmental responsibilities
Importance 0 1 2 3 4 5 6 7 8 9 10 99
Satisfaction 0 1 2 3 4 5 6 7 8 9 10 99
Reason for rating satisfaction less than 6
12. Animal management Importance 0 1 2 3 4 5 6 7 8 9 10 99
Satisfaction 0 1 2 3 4 5 6 7 8 9 10 99
13. Parking enforcement Importance 0 1 2 3 4 5 6 7 8 9 10 99
Satisfaction 0 1 2 3 4 5 6 7 8 9 10 99
Reason for rating satisfaction less than 6
1
Bayside City Council
2019 Annual Customer Service Survey

On a scale of 0 (lowest) to 10 (highest), please rate the importance of the following services to the community, followed by your personal level of satisfaction with only those services you or a member of your household has used in the past 12 months.
(Survey note: Ask importance, then use, then satisfaction only if service has been used in last twelve months)
1. Council’s website
Importance 0 1 2 3 4 5 6 7 8 9 10 99
Used Yes No
Satisfaction 0 1 2 3 4 5 6 7 8 9 10 99
Reason for rating satisfaction less than 6
2. The green waste collection
Importance 0 1 2 3 4 5 6 7 8 9 10 99
Used Yes No
Satisfaction 0 1 2 3 4 5 6 7 8 9 10 99
3. The hard rubbish booking / pick up service
Importance 0 1 2 3 4 5 6 7 8 9 10 99
Used Yes No
Satisfaction 0 1 2 3 4 5 6 7 8 9 10 99
4. Local library
Importance 0 1 2 3 4 5 6 7 8 9 10 99
Used Yes No
Satisfaction 0 1 2 3 4 5 6 7 8 9 10 99
5. Public toilets
Importance 0 1 2 3 4 5 6 7 8 9 10 99
Used Yes No
Satisfaction 0 1 2 3 4 5 6 7 8 9 10 99
6. On and off-road bike paths (including shared paths)
Importance 0 1 2 3 4 5 6 7 8 9 10 99
Used Yes No
Satisfaction 0 1 2 3 4 5 6 7 8 9 10 99
7. Art Centres (e.g. Bayside Art Gallery)
Importance 0 1 2 3 4 5 6 7 8 9 10 99
Used Yes No
Satisfaction 0 1 2 3 4 5 6 7 8 9 10 99
8. Sports grounds and ovals
Importance 0 1 2 3 4 5 6 7 8 9 10 99
Used Yes No
Satisfaction 0 1 2 3 4 5 6 7 8 9 10 99
9. Recreation and Aquatic facilities
Importance 0 1 2 3 4 5 6 7 8 9 10 99
Used Yes No
Satisfaction 0 1 2 3 4 5 6 7 8 9 10 99
2

10. Services for children from birth to 5 years of age (e.g.
Maternal and Child Health, childcare)
Importance 0 1 2 3 4 5 6 7 8 9 10 99
Used Yes No
Satisfaction 0 1 2 3 4 5 6 7 8 9 10 99
Reason for rating satisfaction less than 6
11. Services for youth (e.g. School holiday programs, Council recreation events)
Importance 0 1 2 3 4 5 6 7 8 9 10 99
Used Yes No
Satisfaction 0 1 2 3 4 5 6 7 8 9 10 99
Reason for rating satisfaction less than 6
12. Services for older people (community transport, delivered meals, social support)
Importance 0 1 2 3 4 5 6 7 8 9 10 99
Used Yes No
Satisfaction 0 1 2 3 4 5 6 7 8 9 10 99
Reason for rating satisfaction less than 6
13. Services for people with a disability
Importance 0 1 2 3 4 5 6 7 8 9 10 99
Used Yes No
Satisfaction 0 1 2 3 4 5 6 7 8 9 10 99
Reason for rating satisfaction less than 6
2
On a scale of 0 (lowest) to 10 (highest), can you please rate your personal level of satisfaction with the following aspects of Council’s performance?
1. Council’s community consultation and engagement
0 1 2 3 4 5 6 7 8 9 10 99
Reason for rating less than 6
2. The responsiveness of Council to local community needs
0 1 2 3 4 5 6 7 8 9 10 99
3. Council’s representation, lobbying and advocacy on behalf of the community with other levels of government and private organisations on key issues
0 1 2 3 4 5 6 7 8 9 10 99
3a. Can you list any Council advocacy of which you are aware?
4. Council’s performance in maintaining the trust and confidence of the local community
0 1 2 3 4 5 6 7 8 9 10 99
5. Council making decisions in the best interests of the community
0 1 2 3 4 5 6 7 8 9 10 99
6. Performance of Council across all areas of responsibility
0 1 2 3 4 5 6 7 8 9 10 99
6a. Why did you rate Council’s overall performance at the level you did?
3

On a scale of zero (lowest) to ten (highest), please rate your satisfaction with Council’s advocacy to other levels of government in relation to the following:
4
1. for better bus routes, sufficient commuter parking, development around train stations
0 1 2 3 4 5 6 7 8 9 10 99
2. for a planning system that provides more certainty for Bayside residents
0 1 2 3 4 5 6 7 8 9 10 99
3. for increasing the supply of social and affordable housing in Bayside
0 1 2 3 4 5 6 7 8 9 10 99
4. to protect Port Phillip Bay and limiting coastal erosion
0 1 2 3 4 5 6 7 8 9 10 99
5. to ensure that the elderly, and people with a disability, continue to have access to high quality support services
0 1 2 3 4 5 6 7 8 9 10 99
On a scale of zero (strongly disagree) to ten (strongly agree), please rate your agreement with the following statements regarding Bayside City Council as an organisation.
5
1. Is trustworthy and reliable 0 1 2 3 4 5 6 7 8 9 10 99
2. Provides important services that meet the needs of the whole community
0 1 2 3 4 5 6 7 8 9 10 99
3. Is bureaucratic and ineffective 0 1 2 3 4 5 6 7 8 9 10 99
4. Offers value for rates 0 1 2 3 4 5 6 7 8 9 10 99
5. Has a sound direction for the future 0 1 2 3 4 5 6 7 8 9 10 99
6. Is progressive and “up to date” 0 1 2 3 4 5 6 7 8 9 10 99
7. Is a responsible financial manager 0 1 2 3 4 5 6 7 8 9 10 99
Can you please list what you consider to be the top three issues for the City of Bayside at the moment?
Issue One:
Issue Two:
Issue Three:
6
In the last twelve months, have you engaged with Council in any of the following ways?
(please select as many as appropriate)
Visited Council offices in Sandringham 1 Telephoned Council / Council officer 5
Looked up information on Council website 2 Emailed Council / Council officer 6
Filled in a form / made a request using the Council website
3 Read or responded to social media post (Facebook, Twitter, Instagram)
7
Made a payment using the Council website 4
7

If contacted Council by telephone, email, or a visit in-person: On a scale of 0 (lowest) to 10 (highest), please rate your satisfaction with the following aspects of service when you last contacted the Bayside City Council?
1. Professionalism of the staff 0 1 2 3 4 5 6 7 8 9 10 99
2. Understanding of your needs 0 1 2 3 4 5 6 7 8 9 10 99
3. How long it took to deal with the enquiry / issue
0 1 2 3 4 5 6 7 8 9 10 99
4. Accuracy and comprehensiveness of the information provided
0 1 2 3 4 5 6 7 8 9 10 99
5. Staff’s understanding of your language needs (LOTE respondents only)
0 1 2 3 4 5 6 7 8 9 10 99
6. Satisfaction with the final outcome 0 1 2 3 4 5 6 7 8 9 10 99
9
If contacted Council by telephone or a visit in-person: Was this your preferred method of contacting Council, or did you try another method first?
Preferred method of contacting Council 1 Tried another method first 2
8
If contacted Council by digital or online method: Did you get the information you were looking for?
Yes 1 No 2
If No, did you use another method to make a second contact?
Yes 1 No 2
10
On a scale of 0 (lowest) to 10 (highest), can you please rate your satisfaction with?
1. Planning for population growth 0 1 2 3 4 5 6 7 8 9 10 99
If you rated satisfaction less than 5, what concerns you most about population growth in the municipality?
12
The State Government has planned for the population of Bayside to continue growing by approximately 13,000 over the next 20 years. The responsibility for providing services, transport infrastructure, and facilities rests with both Council and the State Government.
Do you volunteer regularly?
Yes - locally 1 No 3
Yes - non locally 2
11
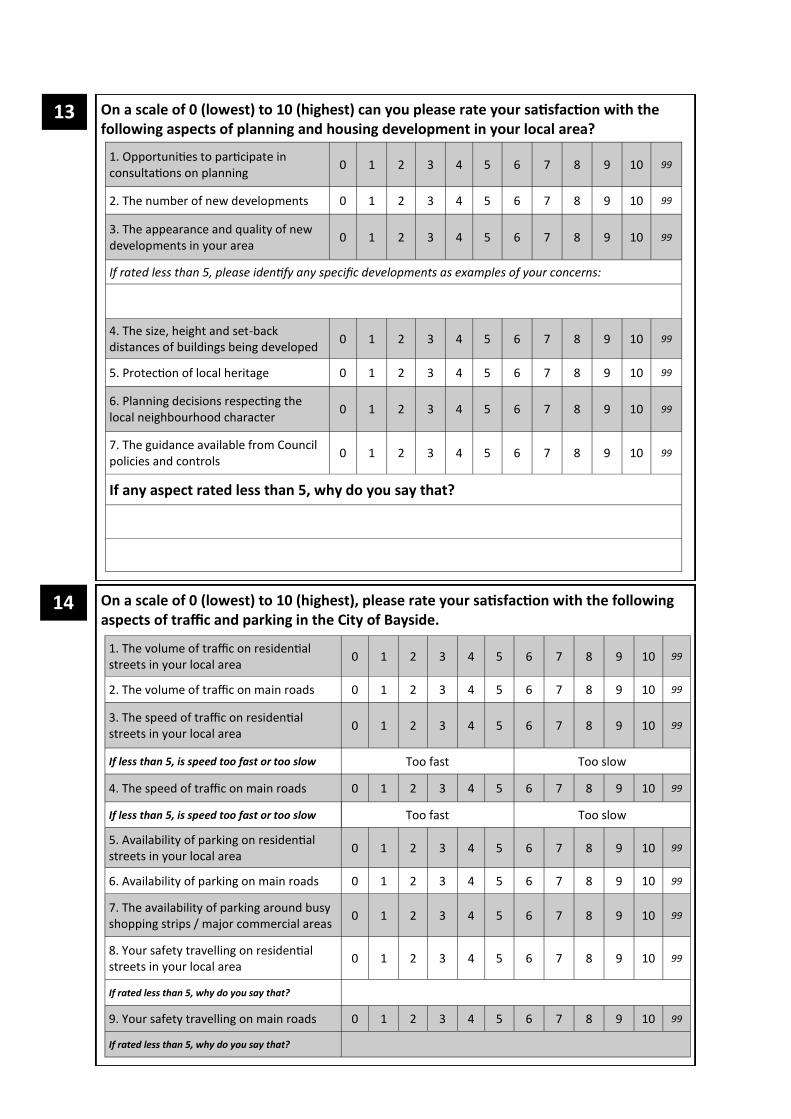
On a scale of 0 (lowest) to 10 (highest), please rate your satisfaction with the following aspects of traffic and parking in the City of Bayside.
1. The volume of traffic on residential streets in your local area
0 1 2 3 4 5 6 7 8 9 10 99
2. The volume of traffic on main roads 0 1 2 3 4 5 6 7 8 9 10 99
3. The speed of traffic on residential streets in your local area
0 1 2 3 4 5 6 7 8 9 10 99
If less than 5, is speed too fast or too slow Too fast Too slow
4. The speed of traffic on main roads 0 1 2 3 4 5 6 7 8 9 10 99
If less than 5, is speed too fast or too slow Too fast Too slow
5. Availability of parking on residential streets in your local area
0 1 2 3 4 5 6 7 8 9 10 99
6. Availability of parking on main roads 0 1 2 3 4 5 6 7 8 9 10 99
7. The availability of parking around busy shopping strips / major commercial areas
0 1 2 3 4 5 6 7 8 9 10 99
8. Your safety travelling on residential streets in your local area
0 1 2 3 4 5 6 7 8 9 10 99
If rated less than 5, why do you say that?
9. Your safety travelling on main roads 0 1 2 3 4 5 6 7 8 9 10 99
If rated less than 5, why do you say that?
14
On a scale of 0 (lowest) to 10 (highest) can you please rate your satisfaction with the following aspects of planning and housing development in your local area?
1. Opportunities to participate in consultations on planning
0 1 2 3 4 5 6 7 8 9 10 99
2. The number of new developments 0 1 2 3 4 5 6 7 8 9 10 99
3. The appearance and quality of new developments in your area
0 1 2 3 4 5 6 7 8 9 10 99
If rated less than 5, please identify any specific developments as examples of your concerns:
4. The size, height and set-back distances of buildings being developed
0 1 2 3 4 5 6 7 8 9 10 99
5. Protection of local heritage 0 1 2 3 4 5 6 7 8 9 10 99
6. Planning decisions respecting the local neighbourhood character
0 1 2 3 4 5 6 7 8 9 10 99
7. The guidance available from Council policies and controls
0 1 2 3 4 5 6 7 8 9 10 99
If any aspect rated less than 5, why do you say that?
13

How do you usually get to the local shops or other destinations up to approximately 1 km from home?
(please circle one number only)
Drive / passenger in a car 1 Bicycle 3
Walk 2 Public transport 4
If drive, why is that?
If drive, is there anything that would encourage you to walk or cycle instead?
15
On a scale of 1 (strongly disagree) to 5 (strongly agree), please rate your agreement with the following statements.
16
Strongly disagree
Neutral Strongly
agree Can’t say
1. I play an active role in my community 1 2 3 4 5 99
2. Alcohol consumption has a negative impact on my household
1 2 3 4 5 99
3. I feel a strong sense of belonging to a community 1 2 3 4 5 99
4. There are adequate community services available in the local area
1 2 3 4 5 99
5. I feel safe online (using the internet) 1 2 3 4 5 99
On a scale of 1 (very poor) to 5 (excellent), please rate your level of: 17
Very poor
Poor Average Good Excellent Can’t say
1. Physical health 1 2 3 4 5 99
2. Mental health 1 2 3 4 5 99
Does your household have its own resources and a plan to cope with extreme weather and to keep yourself / yourselves safe and well?
Yes 1 Not sure 3
No 2
18
Are you an active member of a club or community group?
Yes 1 No 2
19
Do you currently sit on a community group board or committee?
Yes 1 No 2
20
On a scale of 0 (lowest) to 10 (highest), can you please rate your satisfaction with?
1. My own community connections 0 1 2 3 4 5 6 7 8 9 10 99
If you rated satisfaction less than 5, why do you say that?
21

© Metropolis Research Pty Ltd, 2019
Which of the following best describes the current housing situation of this household?
Own this home 1 Private rental (eg Real Estate Agent) 3
Mortgage (paying-off this home)
2 Renting from Office of Housing or Housing Association
4
28
How long have you lived in the City of Bayside?
Less than 1 year 1 5 to less than 10 years 3
1 to less than 5 years 2 10 years or more 4
30
Do you have any further comments you would like to make?
31
What type of dwelling is this? (DO NOT READ OUT - FILL IN)
Separate house 1 Flat, unit or apartment 3
Semi-detached, row or terrace house 2 Other 4
29
Do any members of this household have a permanent or long-term disability?
Yes 1 No 2
26
What is the structure of this household?
Two parent family (youngest 0 - 4 yrs) 1 One parent family (youngest 13-18yr) 7
Two parent family (youngest 5 – 12 yrs) 2 One parent family (adult child only) 8
Two parent family (youngest 13 - 18 yrs) 3 Extended or multiple families 9
Two parent family (adult child only) 4 Group household 10
One parent family (youngest 0 - 4 yrs) 5 Sole person household 11
One parent family (youngest 5 – 12 yrs) 6 Couple only household 12
25
Do any members of this household speak a language other than English at home? 24 English only 1 Other (specify):________________ 2
With which gender do you identify?
Male 1 Other (trans, intersex, non-binary) 3
Female 2 Prefer not to say 9
23
Please indicate which of the following best describes you.
15 - 19 Years 1 45 - 59 Years 4
20 - 34 Years 2 60 - 74 Years 5
35 - 44 Years 3 75 Years or Over 6
22
THANK YOU FOR YOUR TIME AND PARTICIPATION
Does this household own a dog or cat? (please circle one number only)
Dog or dogs 1 Both dogs and cats 3
Cat or cats 2 No dogs or cats in the home 4
27