Embed Size (px)
Citation preview

LosAngelesCityEmployees’RetirementSystem(ADepartmentoftheMunicipalityoftheCityofLosAngeles,California)
ComprehensiveAnnualFinancialReportFortheFiscalYearEndedJune30,2018
POBox512218LosAngeles,CA90051‐0218www.LACERS.org
IssuedbyNeilM.GuglielmoGeneralManager

i
Table of Contents
INTRODUCTORY SECTION Letter of Transmittal ................................................................................................................ 1
Board of Administration ........................................................................................................... 5
Organization Chart ................................................................................................................... 6
Professional Consultants .......................................................................................................... 6
Certificate of Achievement ....................................................................................................... 7
FINANCIAL SECTION Independent Auditor’s Report .................................................................................................. 11
Management’s Discussion and Analysis ................................................................................. 15
Financial Highlights ................................................................................................................. 15
Overview of the Financial Statements .................................................................................... 15
Financial Analysis .................................................................................................................... 17
Basic Financial Statements
Statement of Fiduciary Net Position ……………………………………………………………….. 24
Statement of Changes in Fiduciary Net Position ………………………………………………… 25
Notes to the Basic Financial Statements ………………………………………………………….. 26
Required Supplementary Information
Retirement Plan
Schedule of Net Pension Liability ............................................................................................ 50
Schedule of Changes in Net Pension Liability and Related Ratios ........................................ 51
Schedule of Contribution History ............................................................................................. 52
Schedule of Investment Returns .............................................................................................. 53
Postemployment Health Care Plan
Schedule of Net OPEB Liability ............................................................................................... 54
Schedule of Changes in Net OPEB Liability and Related Ratios .......................................... 55
Schedule of Contribution History ............................................................................................. 57
Schedule of Investment Returns .............................................................................................. 58
Supplemental Schedules
Schedule of Administrative Expenses ...................................................................................... 60
Schedule of Investment Fees and Expenses ............................................................................ 61
INVESTMENT SECTION Report on Investment Activity ................................................................................................. 65
Outline of Investment Policies ................................................................................................. 67
Investment Results ................................................................................................................... 67
Investment Contract Activity .................................................................................................... 68
Asset Allocation ......................................................................................................................... 70
Table of Contents (Continued)
ii
56 INVESTMENT SECTION (Continued) List of Largest Assets Held by Fair Value
Largest U.S. Equity Holdings .................................................................................................. 71
Largest Non-U.S. Equity Holdings .......................................................................................... 71
Largest U.S. Fixed Income Holdings ....................................................................................... 72
Largest Non-U.S. Fixed Income Holdings ............................................................................... 72
Schedules of Fees and Commissions ....................................................................................... 58
Schedule of Fees ......................................................................................................................... 73
Schedule of Top Ten Brokerage Commissions ......................................................................... 73
Investment Summary ............................................................................................................... 74
Advisory/Consulting/Custody Services .................................................................................... 75
ACTUARIAL SECTION Actuarial Valuation Summary ................................................................................................ 65
Summary of Significant Valuation Results ............................................................................. 81
Retirement Benefits Valuation ............................................................................................... 67
Actuarial Certification .............................................................................................................. 83
Active Member Valuation Data ................................................................................................ 85
Retirees and Beneficiaries Added to and Removed from Retiree Payroll .............................. 85
Schedule of Funded Liabilities by Type ................................................................................... 86
Schedule of Funding Progress .................................................................................................. 86
Actuarial Analysis of Financial Experience ............................................................................ 87
Actuarial Balance Sheet ........................................................................................................... 87
Schedule of Changes in Net Pension Liability and Related Ratios ........................................ 88
Projection of Plan’s Fiduciary Net Position for Use in Calculation of Discount Rate ........... 90
Summary of Actuarial Assumptions and Actuarial Cost Method .......................................... 92
Summary of Plan Provisions .................................................................................................... 94
Health Benefits Valuation ...................................................................................................... 75
Actuarial Certification .............................................................................................................. 99
Active Member Valuation Data ................................................................................................ 101
Retirees and Beneficiaries Added to and Removed from Health Benefits ............................ 101
Member Benefit Coverage Information ................................................................................... 102
Schedule of Funding Progress .................................................................................................. 102
Actuarial Analysis of Financial Experience ............................................................................ 103
Actuarial Balance Sheet ........................................................................................................... 103
Schedule of Changes in Net OPEB Liability and Related Ratios .......................................... 104
Projection of Plan’s Fiduciary Net Position for Use in Calculation of Discount Rate ........... 105
Summary of Actuarial Assumptions and Actuarial Cost Method .......................................... 107
iii
Table of Contents (Continued)
ACTUARIAL SECTION (Continued) Summary of Plan Provisions .................................................................................................... 110
STATISTICAL SECTION Schedule of Additions by Source - Retirement Plan ............................................................... 115
Schedule of Deductions by Type - Retirement Plan ................................................................ 115
Schedule of Additions by Source - Postemployment Health Care Plan ................................. 116
Schedule of Deductions by Type - Postemployment Health Care Plan ................................. 116
Net Increase (Decrease) in Fiduciary Net Position - Retirement Plan .................................. 117
Net Increase (Decrease) in Fiduciary Net Position - Postemployment Health Care Plan .... 117
Schedule of Benefit Expenses by Type - Retirement Plan ...................................................... 118
City Contributions versus Benefits Paid - Retirement Plan .................................................. 118
Schedule of Benefit Expenses by Type - Postemployment Health Care Plan ....................... 119
City Contributions versus Benefits Paid - Postemployment Health Care Plan .................... 119
Schedule of Retired Members by Type of Benefits - Retirement Plan ................................... 120
Schedule of Retired Members by Type of Benefits - Postemployment Health Care Plan ..... 121
Schedule of Average Benefit Payments - Retirement Plan .................................................... 122
Schedule of Average Benefit Payments - Postemployment Health Care Plan ...................... 123

This page intentionally left blank.


202 W. First Street, Suite 500 Los Angeles, CA 90012-4401
(800) 779-8328 TDD (888) 349-3996
www.lacers.org
1
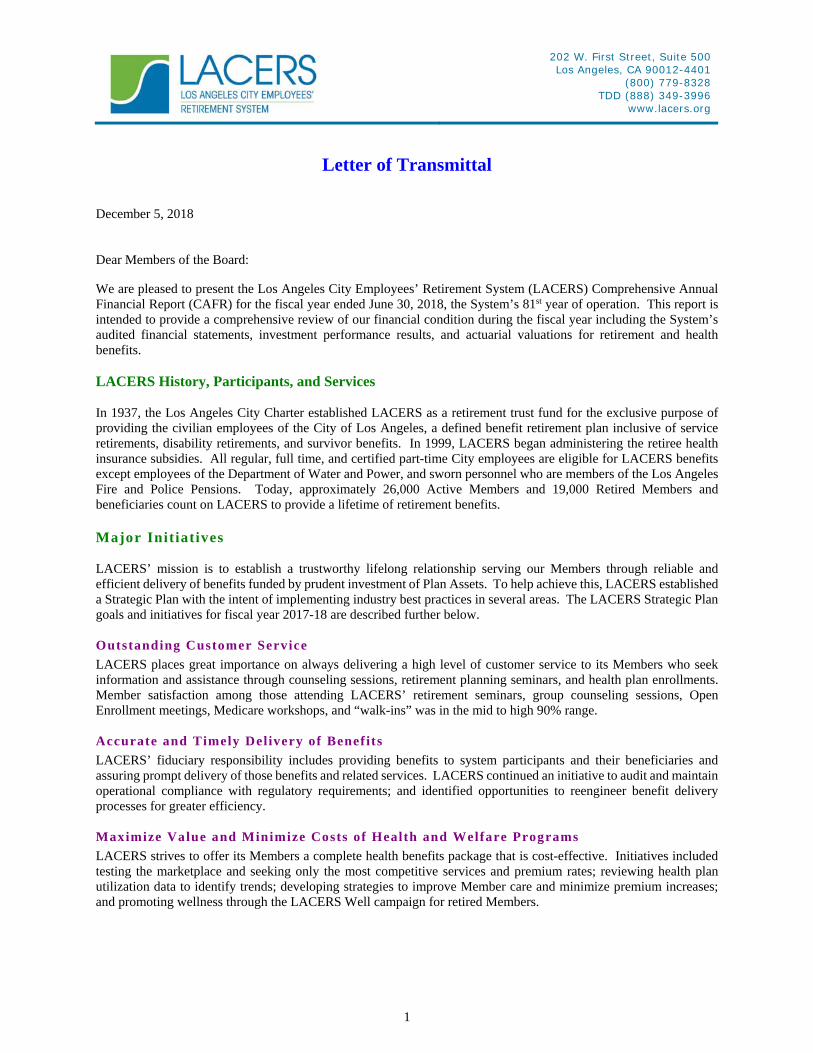
Letter of Transmittal
December 5, 2018
Dear Members of the Board: We are pleased to present the Los Angeles City Employees’ Retirement System (LACERS) Comprehensive Annual Financial Report (CAFR) for the fiscal year ended June 30, 2018, the System’s 81st year of operation. This report is intended to provide a comprehensive review of our financial condition during the fiscal year including the System’s audited financial statements, investment performance results, and actuarial valuations for retirement and health benefits. LACERS History, Participants, and Services In 1937, the Los Angeles City Charter established LACERS as a retirement trust fund for the exclusive purpose of providing the civilian employees of the City of Los Angeles, a defined benefit retirement plan inclusive of service retirements, disability retirements, and survivor benefits. In 1999, LACERS began administering the retiree health insurance subsidies. All regular, full time, and certified part-time City employees are eligible for LACERS benefits except employees of the Department of Water and Power, and sworn personnel who are members of the Los Angeles Fire and Police Pensions. Today, approximately 26,000 Active Members and 19,000 Retired Members and beneficiaries count on LACERS to provide a lifetime of retirement benefits. Major Initiatives LACERS’ mission is to establish a trustworthy lifelong relationship serving our Members through reliable and efficient delivery of benefits funded by prudent investment of Plan Assets. To help achieve this, LACERS established a Strategic Plan with the intent of implementing industry best practices in several areas. The LACERS Strategic Plan goals and initiatives for fiscal year 2017-18 are described further below. Outstanding Customer Service
LACERS places great importance on always delivering a high level of customer service to its Members who seek information and assistance through counseling sessions, retirement planning seminars, and health plan enrollments. Member satisfaction among those attending LACERS’ retirement seminars, group counseling sessions, Open Enrollment meetings, Medicare workshops, and “walk-ins” was in the mid to high 90% range. Accurate and Timely Delivery of Benef its
LACERS’ fiduciary responsibility includes providing benefits to system participants and their beneficiaries and assuring prompt delivery of those benefits and related services. LACERS continued an initiative to audit and maintain operational compliance with regulatory requirements; and identified opportunities to reengineer benefit delivery processes for greater efficiency. Maximize Value and Minimize Costs of Health and Welfare Programs
LACERS strives to offer its Members a complete health benefits package that is cost-effective. Initiatives included testing the marketplace and seeking only the most competitive services and premium rates; reviewing health plan utilization data to identify trends; developing strategies to improve Member care and minimize premium increases; and promoting wellness through the LACERS Well campaign for retired Members.
2
Achieve Satisfactory Long-Term Risk-Adjusted Investment Returns
Achievement of this goal will help ensure funding to provide plan participants with postemployment benefits and maintain or reduce the City contributions to the System. Main initiatives were to ensure investments were within target of the Asset Allocation Policy and to increase due diligence and regular review efforts of investment managers.
Uphold Good Governance Pract ices which Aff irm Transparency, Accountabil i ty, and Fiduciary Duty
LACERS strives to be accountable, transparent, law-abiding, responsive, equitable and inclusive, effective and efficient, and participatory through establishing and maintaining Board Administrative Policies, Board Governance, and Investment Policies. Maximize Organizat ional Effect iveness and Eff ic iency
LACERS is committed to meeting its established goals by making use of its resources to maximize output. LACERS completed a major initiative of replacing the Pension Administration System, successfully going live on March 1, 2018. Recruit , Mentor, Empower, and Promote a High-Performing Workforce
LACERS strives to hire the best qualified employees and develop them to their full potential. Completed initiatives include maintaining a regular schedule of training and education, and continuing the staff-led Guiding Principles campaign. Development of a New Strategic Plan
LACERS is in the process of reviewing its existing vision, mission, guiding principles and strategic goals, and developing a new Strategic Plan. The new Strategic Plan, which will reflect ongoing and new initiatives to support current goals, will be introduced and implemented in 2019. Funding Status and Progress Annual actuarial valuations are performed by LACERS’ consulting actuary to determine the actuarial accrued liability arisen from the benefits promised by the City, among other things. Such liability is expected to be met by LACERS’ assets accumulated through City contributions, Member contributions, and investment returns. The funding status, commonly expressed by the term “funded ratio,” is calculated by dividing the plan assets, based either on actuarial (smoothed) value or fair value, by the actuarial accrued liabilities. The funded ratio is a snapshot of the relative status of LACERS’ assets and liabilities at the end of each reporting year. Determined annually in the actuarial valuation, it reflects changes that affect the assets and liabilities during the reporting year due to investment performance, change in demographics, assumptions, benefit terms, and other factors. Funded ratios are useful when they are looked at over several years to determine trends, and should be viewed in light of the economic situation at each time point. If the ratio is less than 100%, indicating an underfunding condition, then the underfunded portion is paid for by the City systematically over a period no longer than 20 years pursuant to LACERS’ funding policy (fiscal year beginning from 2013-14), which targets a funding status of 100% in the long run. In the June 30, 2018 actuarial valuation, the combined funded ratio, based on the actuarial value of assets, for the Retirement Plan and the Postemployment Health Care Plan has decreased by (1.2)% from a year ago to 71.6%. Individually, the funded ratio, on the same actuarial basis, for the Retirement Plan decreased from 71.4% to 70.1%; and for the Postemployment Health Care Plan, the ratio has decreased from 81.1% to 80.7%. The decrease in the funded ratios coincides with an increase of the Unfunded Actuarial Accrued Liabilities (UAAL) by $742.9 million primarily as a result of the change of demographic assumptions, including the change to generational mortality tables to reflect future mortality improvement, though largely offset for the Postemployment Health Care Plan’s actuarial accrued liabilities by lower than expected 2019 renewal premiums payable to the healthcare providers. It is noteworthy that the funded ratio for the Postemployment Health Care Plan maintains a relatively high funding status of being 80.7% funded, while a majority of local governments do not pre-fund their retiree health benefits. The fair value of LACERS’ assets as of June 30, 2018 maintains consistency with the actuarial value of assets, which is determined by the seven-year asset smoothing policy, as gains and losses on investment returns prior to 2018 largely balance out, coupled with an investment return of 7.57% on the actuarial value of assets basis for the 2018 plan year, in excess of the 7.25% assumed rate of return.
3
Investment Summary The System established its investment policies in accordance with Section 1106 of the Charter of the City of Los Angeles for the systematic administration of LACERS. The investment policies are designed to achieve the best risk-adjusted investment returns. The System’s assets are managed on a total return basis in compliance with the investment policies to produce a total portfolio, long-term, real (above inflation) return of 5.0%. Consequently, prudent risk-taking is warranted within the context of the overall portfolio diversification. The Board implements its risk management policy by monitoring the portfolio’s compliance through the adoption of investment policies, guidelines, and procedures for determining the strategic management of investment risk, while allowing sufficient flexibility in capturing investment opportunities, as they may occur, and establishing reasonable risk parameters to ensure prudence and care in the management of the System’s assets. The portfolio consists of investments in U.S. and non-U.S. equities and fixed income, private equity, private real estate, public real assets, and short-term investments. The System’s total portfolio was valued at $17.0 billion as of June 30, 2018, an increase of $1.3 billion (8.3%) compared to the prior fiscal year. The portfolio posted a gross of fees return of 9.2% (or a net of fees return of 9.0%) over a one-year period. The total fund outperformed its policy benchmark by 0.60% gross of fees return (or 0.45% net of fees return), and outperformed its actuarial assumed rate of investment return. The annualized investment returns in detail are presented in the Investment Results on page 67 of the Investment Section. The detail of investment income and loss can be found on pages 20 - 21 of the Financial Section. Other investment related information is summarized in the Investment Section of this report. Financial Reporting The financial statements included within this report are the responsibility of LACERS’ management and have been prepared in accordance with generally accepted accounting principles in the United States of America (US GAAP) as promulgated or adopted by the Governmental Accounting Standards Board (GASB). A system of internal controls is designed, implemented, and maintained by management, as a means to protect System assets, and to assure the integrity of LACERS’ financial statements. Management is confident that its system of internal control, with oversight from LACERS Audit Committee, in tandem with internal audit staff, as well as the annual engagement of an independent external auditing firm to render an opinion on LACERS’ financial statements, provide the requisite level of due diligence expected from a governmental pension system. This position is supported by our external auditor, Brown Armstrong Accountancy Corporation, which has audited and expressed an unmodified opinion that LACERS’ basic financial statements are free of material misstatement, presented fairly, and in conformity with US GAAP.
Readers of this CAFR are encouraged to review the Management’s Discussion and Analysis (MD & A) Section starting on page 15, which provides narrative analysis and highlights of our financial condition and fiscal operations during the reporting period. Awards and Acknowledgements GFOA Certif icate of Achievement
The Government Finance Officers Association of the United States and Canada (GFOA) awarded a Certificate of Achievement for Excellence in Financial Reporting to LACERS for its CAFR for the fiscal year ended June 30, 2017. In order to be awarded a Certificate of Achievement, a government must publish an easily readable and efficiently organized CAFR. This report must satisfy both US GAAP and applicable legal requirements. A Certificate of Achievement is valid for a period of one year. We believe that this report for the fiscal year ended June 30, 2018, will again meet the requirements of the Certificate of Achievement Program and we are submitting it to the GFOA for consideration of an annual award. PPCC Standards Award
The Public Pension Coordinating Council presented its Public Pension Standards Award For Funding and Administration to LACERS in recognition of compliance with professional standards for plan funding and administration for the fiscal year ending 2018. To receive this honor, LACERS was assessed to have met the standards

4
in six key areas: Comprehensive Benefit Program, Actuarial Valuation, Independent Audit, External Investments Performance Evaluation, Member Communications, and Funding Adequacy. Acknowledgements Lastly, I would like to acknowledge the professional and dedicated staff of the Fiscal Management Unit of LACERS for the preparation of this report. I would also like to express appreciation for the leadership and commitment of the LACERS Commissioners, as well as all other LACERS’ staff for their assistance and contributions. Lastly, I would also like to thank our external auditor, Brown Armstrong, and our consulting actuary, Segal Consulting, for their professional assistance in the preparation of this report. Respectfully Submitted, Neil M. Guglielmo General Manager
Mikyong Jang Chief Accountant

5
Sung Won Sohn Member
Appointed by the Mayor
Annie ChaoMember
Elected by Active Members
Board of Administration For the Fiscal Year Ended June 30, 2018
Elizabeth L. Greenwood Vice President
Elected by Active Members
Nilza R. SerranoMember
Appointed by the Mayor
Michael R. WilkinsonMember
Elected by Retired Members
Cynthia M. RuizPresident
Appointed by the Mayor
Sandra Lee Member
Appointed by the Mayor
6
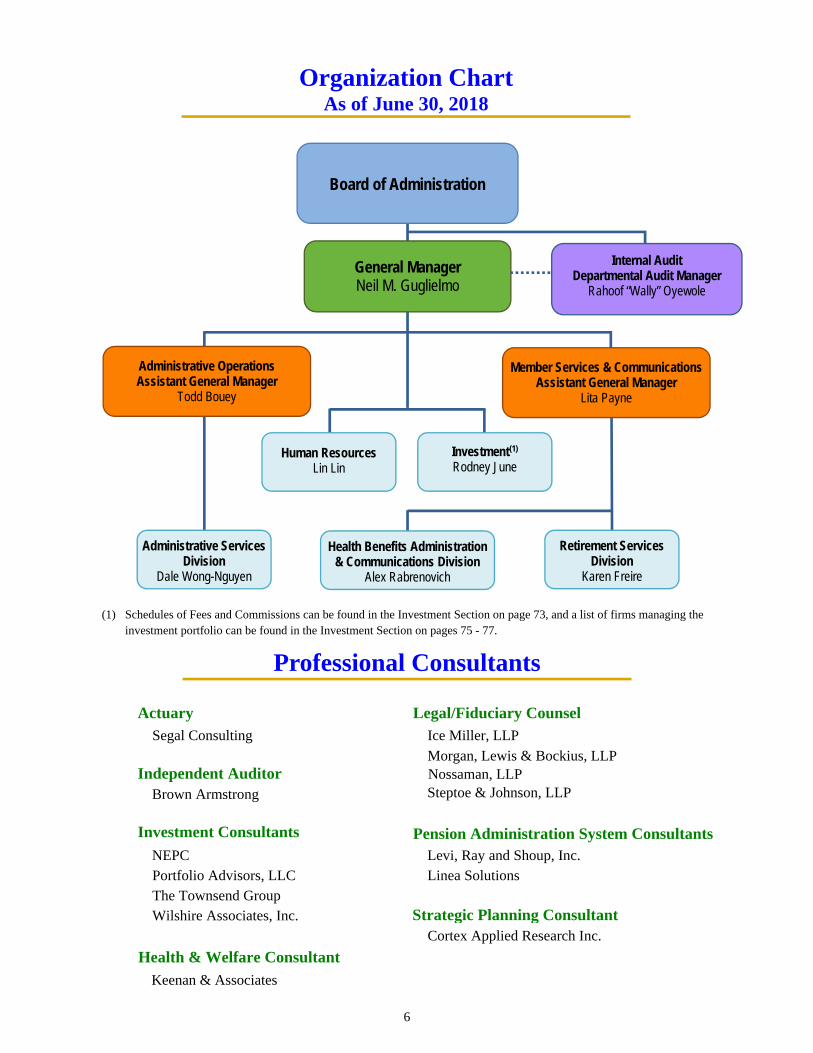
Organization Chart As of June 30, 2018
(1) Schedules of Fees and Commissions can be found in the Investment Section on page 73, and a list of firms managing the investment portfolio can be found in the Investment Section on pages 75 - 77.
Actuary Legal/Fiduciary Counsel Segal Consulting Ice Miller, LLP
Morgan, Lewis & Bockius, LLP
Independent Auditor Nossaman, LLP
Brown Armstrong Steptoe & Johnson, LLP
Investment Consultants Pension Administration System ConsultantsNEPC Levi, Ray and Shoup, Inc. Portfolio Advisors, LLC Linea SolutionsThe Townsend Group Wilshire Associates, Inc. Strategic Planning Consultant Cortex Applied Research Inc.
Health & Welfare Consultant
Keenan & Associates
Professional Consultants
General Manager Neil M. Guglielmo
Board of Administration
Investment(1)
Rodney June Human Resources
Lin Lin
Member Services & Communications Assistant General Manager
Lita Payne
Health Benefits Administration & Communications Division
Alex Rabrenovich
Retirement Services Division
Karen Freire
Administrative Operations Assistant General Manager
Todd Bouey
Administrative Services Division
Dale Wong-Nguyen
Internal Audit Departmental Audit Manager
Rahoof “Wally” Oyewole
7
AWARDED 19 CONSECUTIVE YEARS SINCE 1999
8
Public Pension Coordinating Council
Public Pension Standards Award For Funding and Administration
2018
Presented to
Los Angeles City Employees' Retirement System (LACERS)
In recognition of meeting professional standards for
plan funding and administration as set forth in the Public Pension Standards.
Presented by the Public Pension Coordinating Council, a confederation of
National Association of State Retirement Administrators (NASRA)
National Conference on Public Employee Retirement Systems (NCPERS) National Council on Teacher Retirement (NCTR)
Alan H. Winkle
Program Administrator
P CP C
AWARDED CONSECUTIVELY SINCE 2013

LOS ANGELES CITY EMPLOYEES’ RETIREMENT SYSTEM

11
INDEPENDENT AUDITOR’S REPORT
Board of Administration Los Angeles City Employees’ Retirement System Los Angeles, California Report on the Financial Statements We have audited the accompanying Retirement Plan and Postemployment Health Care Plan Statement of Fiduciary Net Position of the Los Angeles City Employees’ Retirement System (LACERS), a department of the Municipality of the City of Los Angeles, California, as of June 30, 2018, and the related Retirement Plan and Postemployment Health Care Plan Statement of Changes in Fiduciary Net Position for the year then ended, and the related notes to the financial statements, which collectively comprise LACERS basic financial statements as listed in the table of contents. Management’s Responsibility for the Financial Statements Management is responsible for the preparation and fair presentation of these financial statements in accordance with accounting principles generally accepted in the United States of America; this includes the design, implementation, and maintenance of internal control relevant to the preparation and fair presentation of financial statements that are free from material misstatement, whether due to fraud or error. Auditor’s Responsibility Our responsibility is to express an opinion on these financial statements based on our audit. We conducted our audit in accordance with auditing standards generally accepted in the United States of America and the standards applicable to financial audits contained in Government Auditing Standards, issued by the Comptroller General of the United States. Those standards require that we plan and perform the audit to obtain reasonable assurance about whether the financial statements are free of material misstatement. An audit involves performing procedures to obtain audit evidence about the amounts and disclosures in the financial statements. The procedures selected depend on the auditor’s judgment, including the assessment of the risks of material misstatement of the financial statements, whether due to fraud or error. In making those risk assessments, the auditor considers internal control relevant to LACERS preparation and fair presentation of the financial statements in order to design audit procedures that are appropriate in the circumstances, but not for the purpose of expressing an opinion on the effectiveness of LACERS internal control. Accordingly, we express no such opinion. An audit also includes evaluating the appropriateness of accounting policies used and the reasonableness of significant accounting estimates made by management, as well as evaluating the overall presentation of the financial statements. We believe that the audit evidence we have obtained is sufficient and appropriate to provide a basis for our audit opinion.
12
Opinion In our opinion, the financial statements referred to above present fairly, in all material respects, the fiduciary net position of the Retirement Plan and Postemployment Health Care Plan of LACERS as of June 30, 2018, and the changes in fiduciary net position for the year then ended in conformity with accounting principles generally accepted in the United States of America. Other Matters Required Supplementary Information Accounting principles generally accepted in the United States of America require that the management’s discussion and analysis and required supplementary information, as listed in the table of contents, be presented to supplement the basic financial statements. Such information, although not a part of the basic financial statements, is required by the GASB who considers it to be an essential part of financial reporting for placing the basic financial statements in an appropriate operational, economic, or historical context. We have applied certain limited procedures to the required supplementary information in accordance with auditing standards generally accepted in the United States of America, which consisted of inquiries of management about the methods of preparing the information and comparing the information for consistency with management’s responses to our inquiries, the basic financial statements, and other knowledge we obtained during our audit of the basic financial statements. We do not express an opinion or provide any assurance on the information because the limited procedures do not provide us with sufficient evidence to express an opinion or provide any assurance. Other Information Our audit was conducted for the purpose of forming an opinion on the financial statements of LACERS that collectively comprise LACERS basic financial statements. The supplemental schedules, as listed in the table of contents, are presented for purposes of additional analysis and are not a required part of the basic financial statements. The supplemental schedules are the responsibility of management and were derived from and relate directly to the underlying accounting and other records used to prepare the financial statements. Such information has been subjected to the auditing procedures applied in the audit of the financial statements and certain additional procedures, including comparing and reconciling such information directly to the underlying accounting and other records used in the financial statements or to the financial statements themselves, and other additional procedures in accordance with auditing standards generally accepted in the United States of America. In our opinion, the information is fairly stated in all material respects in relation to the financial statements as a whole. The introductory, investment, actuarial and statistical sections have not been subjected to the auditing procedures applied in the audit of the basic financial statements and, accordingly, we do not express an opinion or provide any assurance on them. Report on Summarized Comparative Information We have previously audited LACERS June 30, 2017 financial statements, and our report dated November 21, 2017, expressed an unmodified opinion on those audited financial statements. In our opinion, the summarized comparative information presented herein as of and for the year ended June 30, 2017, is consistent in all material respects, with the audited financial statements from which it has been derived.
13
Other Reporting Required by Government Auditing Standards In accordance with Government Auditing Standards, we have also issued our report dated November 27, 2018, on our consideration of LACERS internal control over financial reporting and on our tests of its compliance with certain provisions of laws, regulations, contracts, and agreements and other matters. The purpose of that report is to describe the scope of our testing of internal control over financial reporting and compliance and the results of that testing, and not to provide an opinion on the internal control over financial reporting or on compliance. That report is an integral part of an audit performed in accordance with Government Auditing Standards in considering LACERS internal control over financial reporting and compliance. BROWN ARMSTRONG ACCOUNTANCY CORPORATION Bakersfield, California November 27, 2018

This page intentionally left blank.
Management’s Discussion and Analysis
15
As management of the Los Angeles City Employees’ Retirement System (LACERS), we are pleased to provide this overview and analysis of the financial activities of LACERS for the fiscal year ended June 30, 2018. We encourage readers to consider the information presented here in conjunction with additional information included in our letter of transmittal in the Introductory Section of LACERS Comprehensive Annual Financial Report. Financial Highlights The Los Angeles City Employees’ Retirement
System (LACERS, the Plan, or the System) fiduciary net position as of June 30, 2018 was $16,989,616,000, an increase of $1,300,046,000 or 8.3% over the prior fiscal year.
The total additions to the fiduciary net position of LACERS, from employer contributions made by the City of Los Angeles (the City), Member contributions, and net investment income, were $2,306,348,000, a 12.4% decrease from the prior fiscal year.
The employer contributions to the Retirement Plan represented 100% of the Actuarially Determined Contribution of the employer as defined by the Governmental Accounting Standards Board (GASB) Statements No. 67, Financial Reporting for Pension Plans – an amendment of GASB Statement No. 25, and No. 68, Accounting and Financial Reporting for Pensions – an amendment of GASB Statement No. 27.
The employer contributions to the Postemployment Health Care Plan represented 100% of the Actuarially Determined Contribution of the employer as defined by GASB Statements No. 74, Financial Reporting for Postemployment Benefit Plans Other than Pension Plans, and No. 75, Accounting and Financial Reporting for Postemployment Benefits Other than Pensions.
Net investment income for this fiscal year was $1,518,879,000, representing an 18.1% decrease compared with an investment income of $1,854,901,000 for the previous reporting period.
The total deductions from the fiduciary net position were $1,006,302,000, a 6.1% increase from the prior fiscal year, for the payment of retirement and postemployment health care benefits, refunds of Member contributions, and administrative expenses.
The System’s Net Pension Liability (NPL) for the retirement benefits was $5,709,348,000 as of June 30, 2018. NPL, an important measure required by GASB Statement No. 67 to disclose in the financial notes of a pension plan, is the
difference between the Total Pension Liability (TPL) and the Plan fiduciary net position. As the Plan fiduciary net position is equal to the market value of the System’s assets, NPL is determined on a market value basis, and it fully reflects the Plan’s investment performance (9.2% rate of return, gross of fees) of this fiscal year. Compared with the previous fiscal year, the NPL increased by $431,676,000.
The System’s Net Other Postemployment Benefits (OPEB) Plan Liability for the postemployment health care benefits was $580,456,000 as of June 30, 2018. Net OPEB Liability (NOL) is an important measure required by GASB Statement No. 74. NOL is determined on a market value basis, and is the difference between the Total OPEB Liability (TOL) and the Plan fiduciary net position (market value of the System’s assets). NOL reflects the Plan’s investment performance (9.2% rate of return, gross of fees) for this fiscal year. As compared with the previous fiscal year, the NOL increased by $13,512,000.
The Plan fiduciary net position as a percentage of TPL for the Retirement Plan, another required disclosure of GASB Statement No. 67, was 71.4%, which is the same as the funded ratio on a market value basis reported in the actuarial valuation for the retirement benefits.
The Plan fiduciary net position as a percentage of TOL for the Postemployment Health Care Plan, another required disclosure of GASB Statement No. 74, was 82.2%, which is the same as the funded ratio on a market value basis reported in the actuarial valuation for the postemployment health care benefits.
Overview of the Financial Statements The following discussion and analysis are intended to serve as an introduction to LACERS financial statements and the accompanying notes thereto. The required supplementary information and supplemental schedules provide additional financial data on LACERS operations.
Management’s Discussion and Analysis
16
Overview of the Financial Statements (Continued) Financial Statements
There are two financial statements presented by LACERS. The Statement of Fiduciary Net Position on page 24 gives a snapshot of the account balances at year-end and shows the amount of the fiduciary net position (the difference between the assets plus deferred outflows of resources, and liabilities plus deferred inflows of resources) available to pay future benefits. Over time, increases or decreases in fiduciary net position may serve as a useful indicator of whether the fiduciary net position of LACERS is improving or deteriorating. The Statement of Changes in Fiduciary Net Position on page 25 provides a view of current year additions to, and deductions from, the fiduciary net position. Notes to the Basic Financial Statements
The notes to the basic financial statements (Notes) provide additional information that is essential for a full understanding of the data provided in the financial statements. The notes to the basic financial statements can be found on pages 26 - 47 of this report. Required Supplementary Information
In addition to the Management’s Discussion and Analysis, other required supplementary information consists of the Schedule of Net Pension Liability, Schedule of Changes in Net Pension Liability and Related Ratios, Schedule of Contribution History, and Schedule of Investment Returns for the Retirement Plan, and the Schedule of Net OPEB Liability, Schedule of Changes in Net OPEB Liability and Related Ratios, Schedule of Contribution History, and Schedule of Investment Returns for the Postemployment Health Care Plan. These schedules and notes primarily present multi-year information as required by the applicable financial reporting standards of GASB Statements No. 67 and No. 74. This required supplementary information can be found on pages 50 - 58 of this report. Supplemental Schedules
The supplemental schedules, including a Schedule of Administrative Expenses and a Schedule of Investment Fees and Expenses, are presented to provide additional financial information on LACERS operations for the current year. These can be found on pages 60 and 61 of this report.
Management’s Discussion and Analysis
17
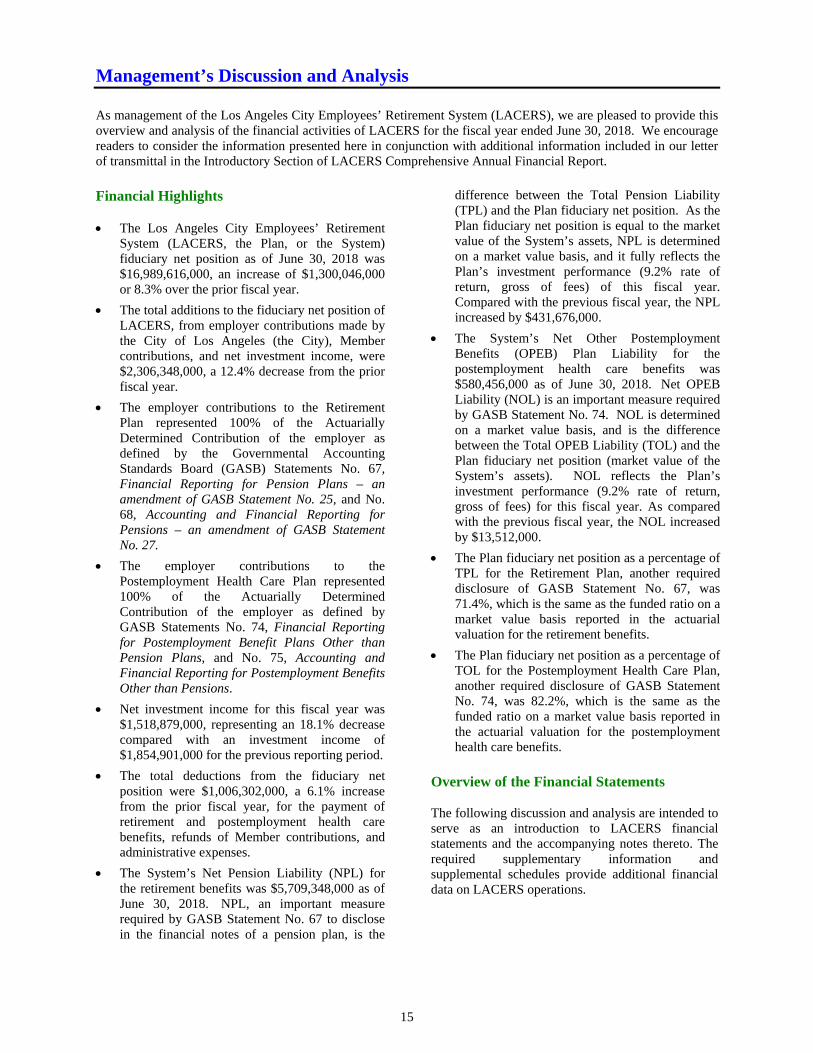
Financial Analysis Allocation of Fiduciary Net Position
Fiduciary net position may serve as a useful indicator of a plan’s financial position. The total fiduciary net position is allocated between the Retirement Plan and Postemployment Health Care Plan, as required by the existing reporting standards. The following information provides a brief description of the asset allocation between the Retirement Plan and the Postemployment Health Care Plan as of June 30, 2018 (dollars in thousands):
Fiduciary
Net Position Percent
Retirement Plan $14,313,245 84.2%
Postemployment
Health Care Plan
2,676,371
15.8
Fiduciary Net Position $16,989,616 100.0%
Fiduciary Net Position
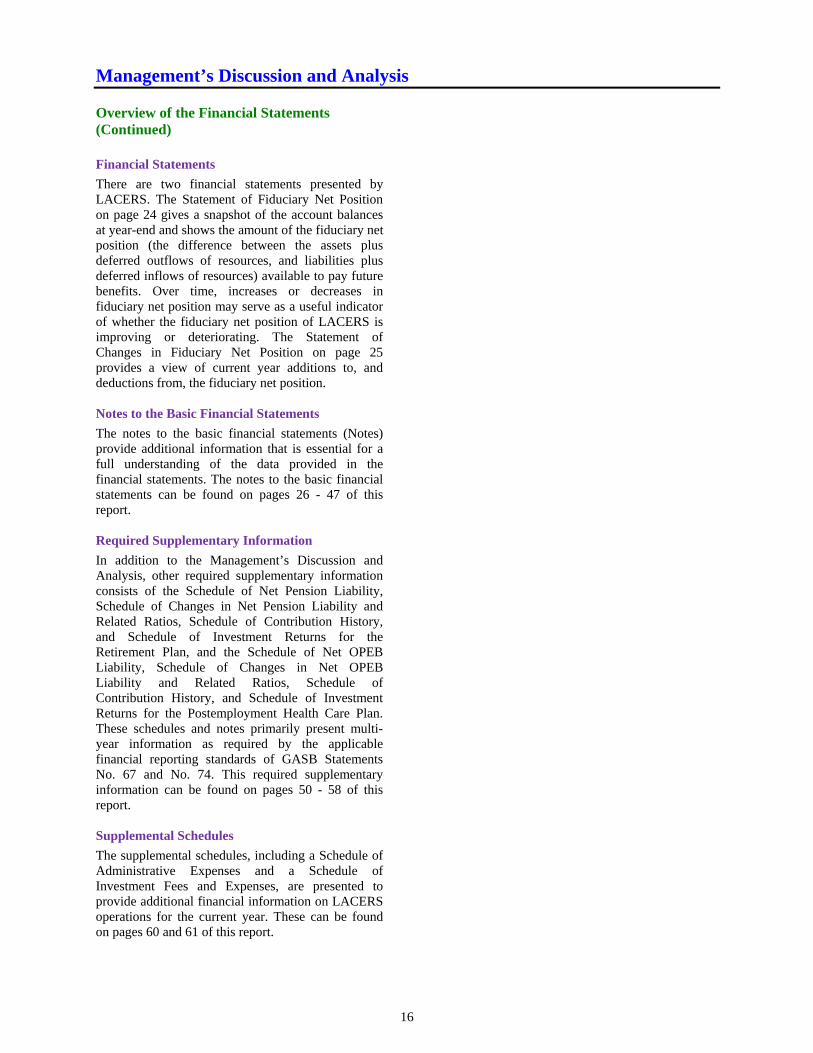
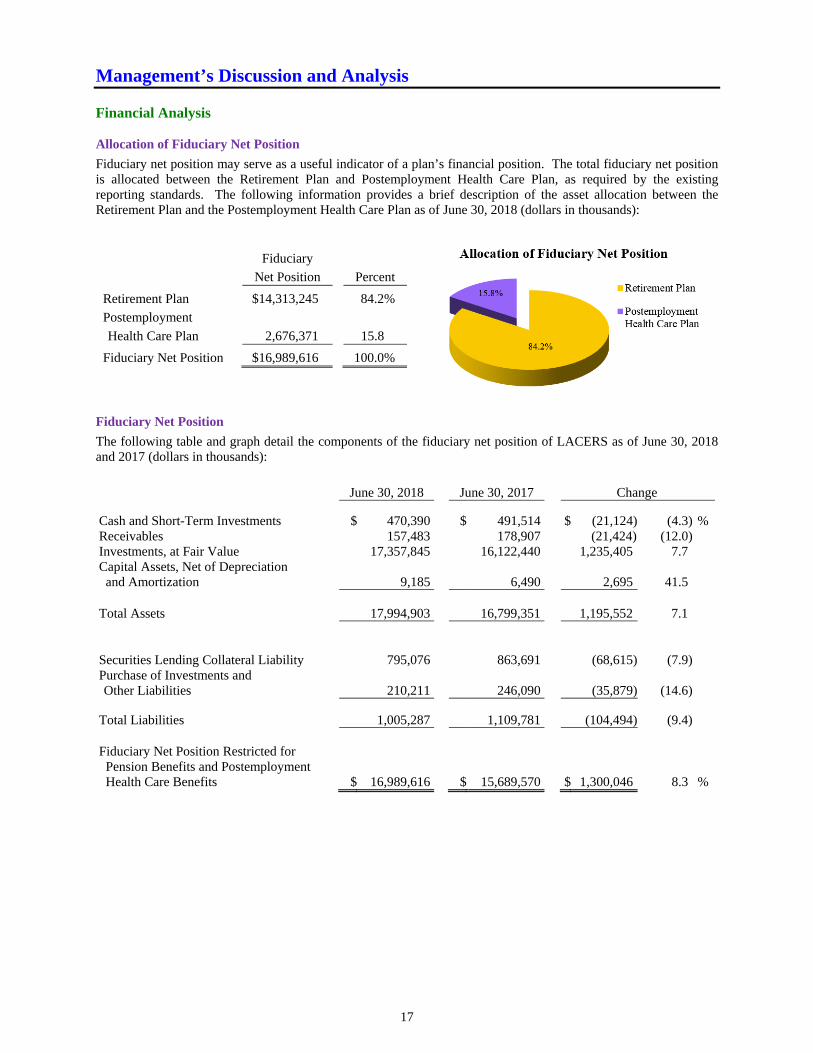
The following table and graph detail the components of the fiduciary net position of LACERS as of June 30, 2018 and 2017 (dollars in thousands):
June 30, 2018 June 30, 2017 Change
Cash and Short-Term Investments $ 470,390 $ 491,514 $ (21,124) (4.3) %Receivables 157,483 178,907 (21,424) (12.0)Investments, at Fair Value 17,357,845 16,122,440 1,235,405 7.7 Capital Assets, Net of Depreciation and Amortization 9,185 6,490 2,695 41.5
Total Assets 17,994,903 16,799,351 1,195,552 7.1
Securities Lending Collateral Liability 795,076 863,691 (68,615) (7.9)Purchase of Investments and Other Liabilities 210,211 246,090 (35,879) (14.6)
Total Liabilities 1,005,287 1,109,781 (104,494) (9.4) Fiduciary Net Position Restricted for Pension Benefits and Postemployment Health Care Benefits $ 16,989,616 $ 15,689,570 $ 1,300,046 8.3 %
Management’s Discussion and Analysis
18
Financial Analysis (Continued) Fiduciary Net Position (Continued)
The majority of LACERS fiduciary net position is contained in its investment portfolio, which consists of cash and short-term investments, receivables, fixed income, equities, and other asset classes. Fiduciary net position increased by $1,300,046,000, or 8.3%, during this fiscal year. Net Increase (Decrease) in Fiduciary Net Position
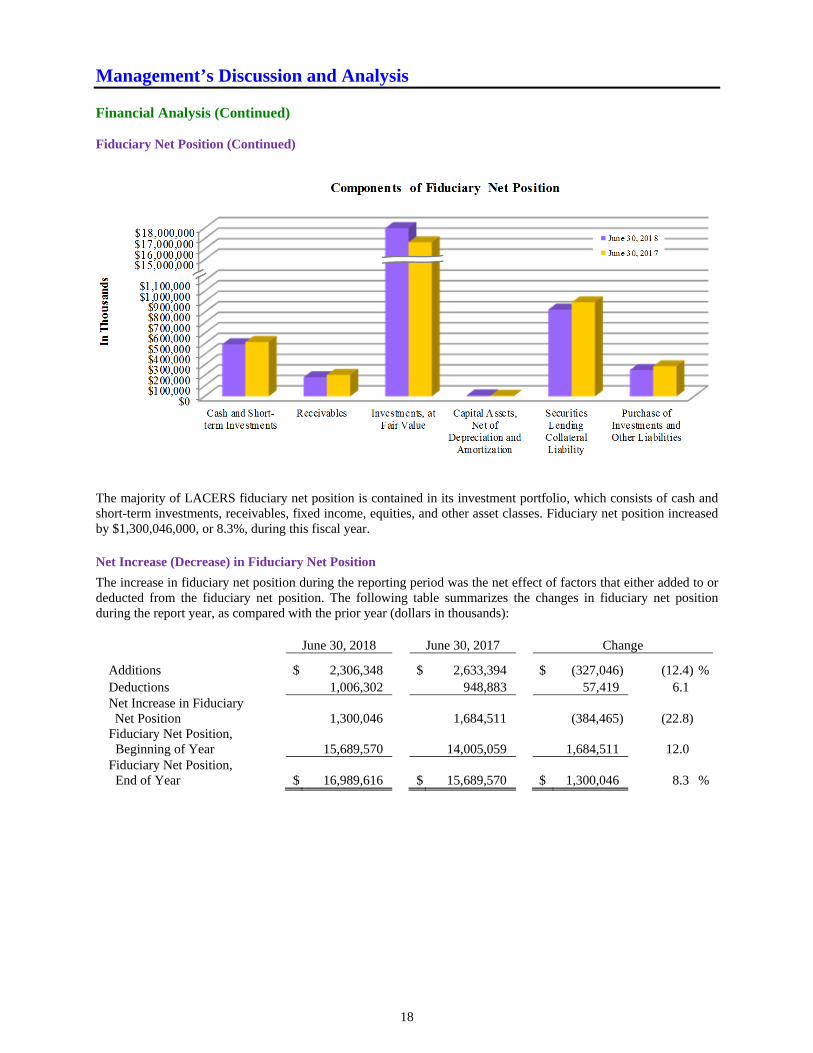
The increase in fiduciary net position during the reporting period was the net effect of factors that either added to or deducted from the fiduciary net position. The following table summarizes the changes in fiduciary net position during the report year, as compared with the prior year (dollars in thousands):
June 30, 2018 June 30, 2017 Change
Additions $ 2,306,348 $ 2,633,394 $ (327,046) (12.4) %Deductions 1,006,302 948,883 57,419 6.1 Net Increase in Fiduciary Net Position 1,300,046 1,684,511 (384,465) (22.8)
Fiduciary Net Position, Beginning of Year 15,689,570 14,005,059 1,684,511 12.0 Fiduciary Net Position, End of Year $ 16,989,616 $ 15,689,570 $ 1,300,046 8.3 %
Management’s Discussion and Analysis
19
Financial Analysis (Continued) Net Increase (Decrease) in Fiduciary Net Position – Additions to Fiduciary Net Position
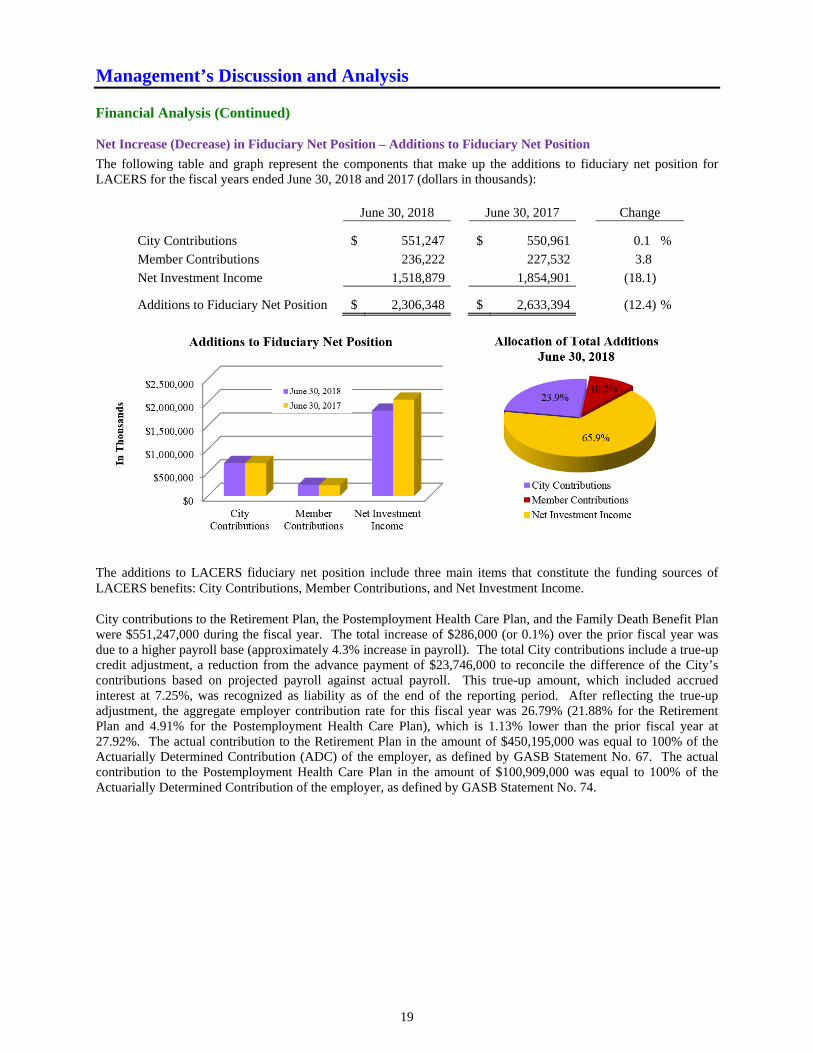
The following table and graph represent the components that make up the additions to fiduciary net position for LACERS for the fiscal years ended June 30, 2018 and 2017 (dollars in thousands):
June 30, 2018 June 30, 2017 Change
City Contributions $ 551,247 $ 550,961 0.1 %
Member Contributions 236,222 227,532 3.8
Net Investment Income 1,518,879 1,854,901 (18.1)
Additions to Fiduciary Net Position $ 2,306,348 $ 2,633,394 (12.4) %
The additions to LACERS fiduciary net position include three main items that constitute the funding sources of LACERS benefits: City Contributions, Member Contributions, and Net Investment Income. City contributions to the Retirement Plan, the Postemployment Health Care Plan, and the Family Death Benefit Plan were $551,247,000 during the fiscal year. The total increase of $286,000 (or 0.1%) over the prior fiscal year was due to a higher payroll base (approximately 4.3% increase in payroll). The total City contributions include a true-up credit adjustment, a reduction from the advance payment of $23,746,000 to reconcile the difference of the City’s contributions based on projected payroll against actual payroll. This true-up amount, which included accrued interest at 7.25%, was recognized as liability as of the end of the reporting period. After reflecting the true-up adjustment, the aggregate employer contribution rate for this fiscal year was 26.79% (21.88% for the Retirement Plan and 4.91% for the Postemployment Health Care Plan), which is 1.13% lower than the prior fiscal year at 27.92%. The actual contribution to the Retirement Plan in the amount of $450,195,000 was equal to 100% of the Actuarially Determined Contribution (ADC) of the employer, as defined by GASB Statement No. 67. The actual contribution to the Postemployment Health Care Plan in the amount of $100,909,000 was equal to 100% of the Actuarially Determined Contribution of the employer, as defined by GASB Statement No. 74.
Management’s Discussion and Analysis
20
Financial Analysis (Continued) Net Increase (Decrease) in Fiduciary Net Position – Additions to Fiduciary Net Position (Continued)
In fiscal year 2017-18, Member contributions were $236,222,000, which was $8,690,000 or 3.8% greater than the prior year. The primary cause of the increased contributions was the increase in number of Members and their salaries during the fiscal year. The net investment income was $1,518,879,000, which included $1,206,714,000 of net appreciation in the fair value of investments. This is discussed in more detail in the next section. Investment Income
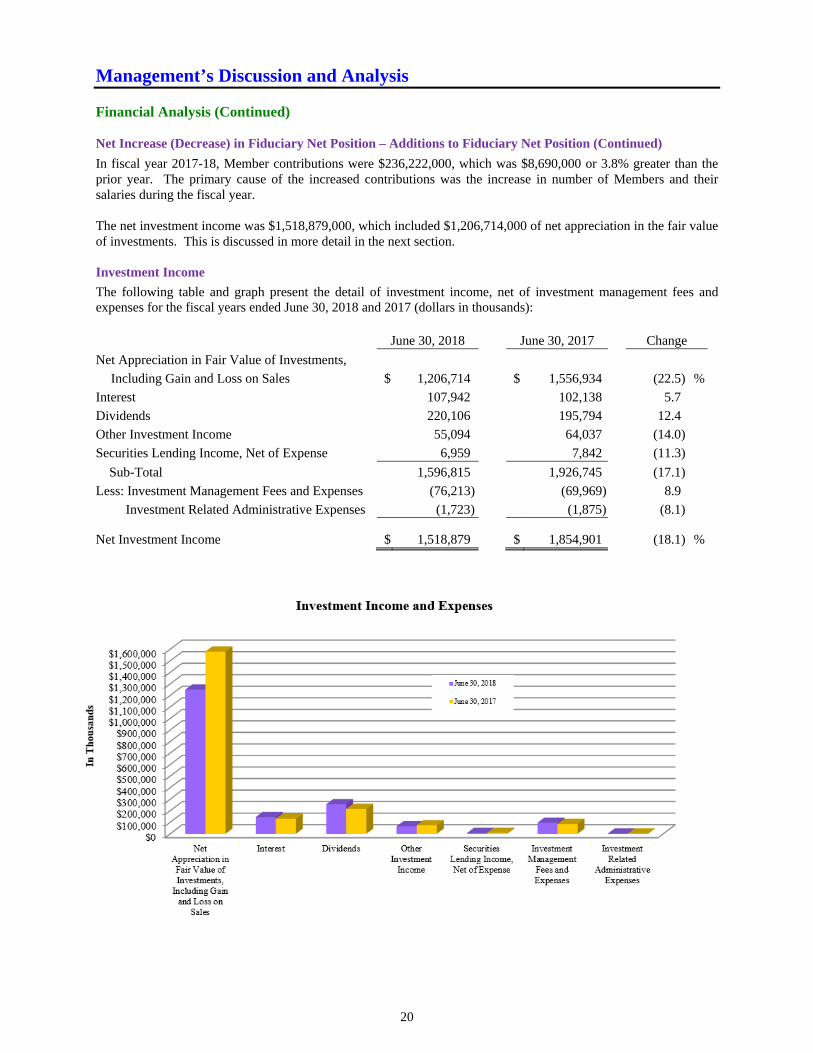
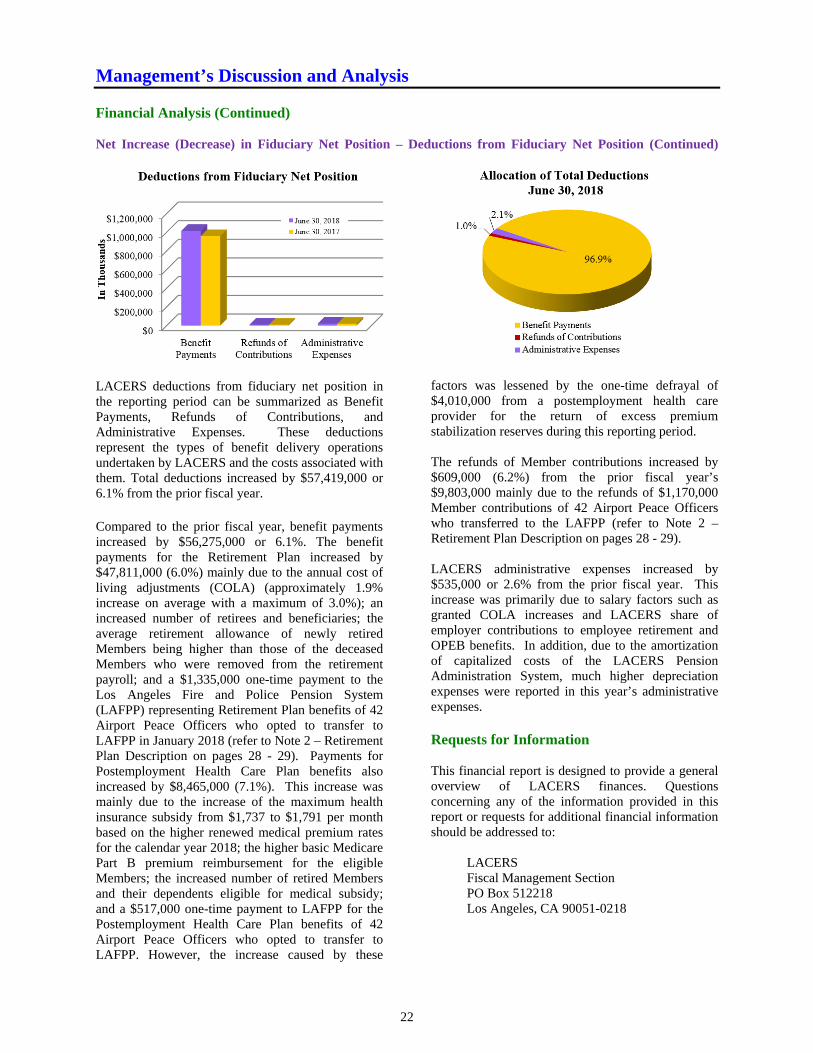
The following table and graph present the detail of investment income, net of investment management fees and expenses for the fiscal years ended June 30, 2018 and 2017 (dollars in thousands): June 30, 2018 June 30, 2017 Change
Net Appreciation in Fair Value of Investments,
Including Gain and Loss on Sales $ 1,206,714 $ 1,556,934 (22.5) %
Interest 107,942 102,138 5.7
Dividends 220,106 195,794 12.4
Other Investment Income 55,094 64,037 (14.0)
Securities Lending Income, Net of Expense 6,959 7,842 (11.3)
Sub-Total 1,596,815 1,926,745 (17.1)
Less: Investment Management Fees and Expenses (76,213) (69,969) 8.9
Investment Related Administrative Expenses (1,723) (1,875) (8.1)
Net Investment Income $ 1,518,879 $ 1,854,901 (18.1) %
Management’s Discussion and Analysis
21
Financial Analysis (Continued) Investment Income (Continued)
The net investment income for the current fiscal year was $1,518,879,000, as compared with the income of $1,854,901,000 for the previous fiscal year (18.1% decrease). The primary cause of the decrease of investment income was a lower net appreciation, including gain and loss on sales, in the fair value of the investments of $1,206,714,000 as compared with the previous fiscal year’s amount of $1,556,934,000. Major U.S. and non-U.S. equity indices achieved strong returns during the fiscal year. The Russell 3000 Index, which tracks U.S. broad market equities, returned 14.8%; the Standard & Poor’s 500 Index, a gauge of U.S. large capitalization equities, returned 14.4%. In the non-U.S. markets, the MSCI World Ex-U.S. Index, which tracks non-U.S. equities in developed markets, returned 7.3%; MSCI Emerging Markets Index returned 8.2%. With the passage of Assembly Bill No. 2833 in January 2017, private equity and real estate funds have provided more detailed disclosure on fees, expenses, and carried interest. The net appreciation as reported reflects a deduction for carried interest in the amount of $48,196,000, which represents a profit share that the general partners of these funds received as a compensation after the performance of the funds achieved agreed-upon return level. Interest income derived from bonds and other fixed income securities increased by $5,804,000 (5.7%), which was attributed primarily to an increase in
LACERS fixed income holdings relative to the previous fiscal year. Dividend income derived from equities increased by $24,312,000 (12.4%) due to an increase in public equity holdings relative to the previous fiscal year. Other investment income, primarily derived from private equity and private real estate partnership investments, decreased by $8,943,000 (14.0%) to $55,094,000 in the current fiscal year. This decrease was attributed to a slowdown of partnership distributions during the current fiscal year. LACERS earns additional investment income by lending the securities to borrowers through its custodian bank. The borrowers provide cash or non-cash collateral to LACERS custodian bank. To earn income for LACERS, the custodian bank invests the cash collateral pledged by borrowers on behalf of LACERS in short-term fixed-income securities. LACERS also generates income from fees paid by borrowers that pledge non-cash collateral. In the reporting year, LACERS securities lending income (net of expense) decreased by $883,000 (11.3%) from a year ago due to lower borrower demand for securities held in the LACERS portfolio. Investment management fees, expenses, and investment related administrative expenses increased by $6,092,000 (8.5%) from the prior fiscal year. This increase corresponded with the increase in the fair value of LACERS investments over the fiscal year.
Net Increase (Decrease) in Fiduciary Net Position – Deductions from Fiduciary Net Position
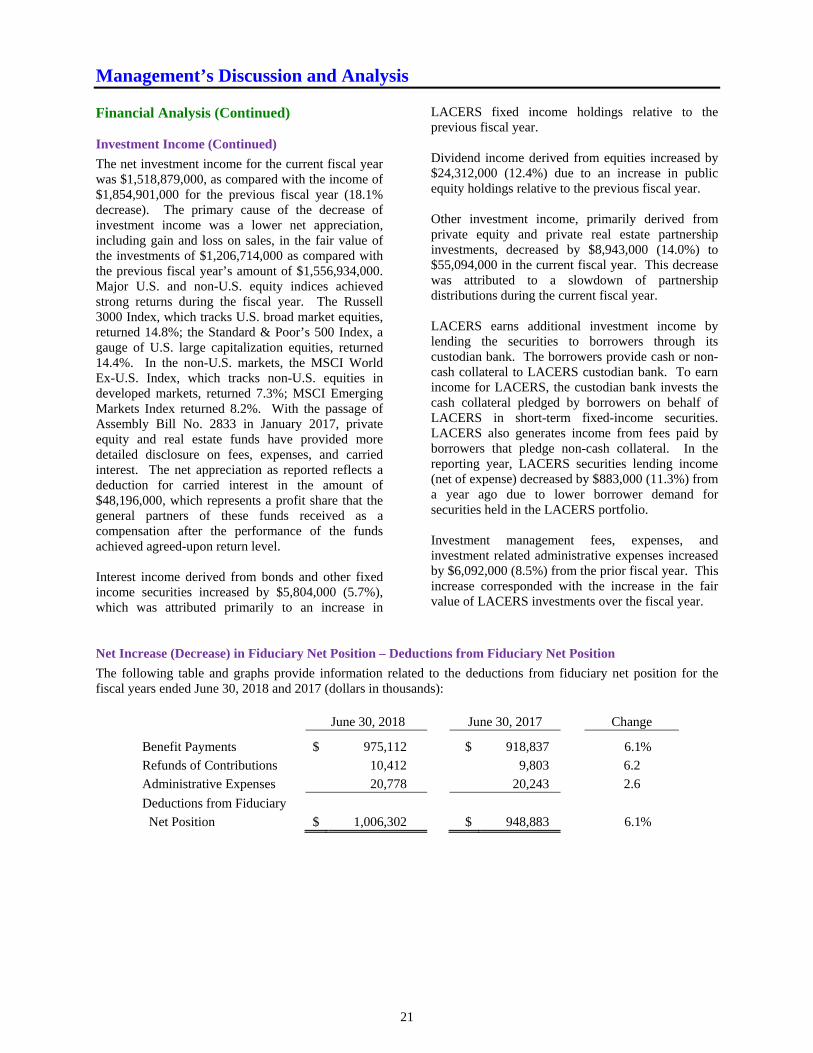
The following table and graphs provide information related to the deductions from fiduciary net position for the fiscal years ended June 30, 2018 and 2017 (dollars in thousands):
June 30, 2018 June 30, 2017 Change
Benefit Payments $ 975,112 $ 918,837 6.1%
Refunds of Contributions 10,412 9,803 6.2
Administrative Expenses 20,778 20,243 2.6
Deductions from Fiduciary
Net Position $ 1,006,302 $ 948,883 6.1%
Management’s Discussion and Analysis
22
Financial Analysis (Continued) Net Increase (Decrease) in Fiduciary Net Position – Deductions from Fiduciary Net Position (Continued)
LACERS deductions from fiduciary net position in the reporting period can be summarized as Benefit Payments, Refunds of Contributions, and Administrative Expenses. These deductions represent the types of benefit delivery operations undertaken by LACERS and the costs associated with them. Total deductions increased by $57,419,000 or 6.1% from the prior fiscal year. Compared to the prior fiscal year, benefit payments increased by $56,275,000 or 6.1%. The benefit payments for the Retirement Plan increased by $47,811,000 (6.0%) mainly due to the annual cost of living adjustments (COLA) (approximately 1.9% increase on average with a maximum of 3.0%); an increased number of retirees and beneficiaries; the average retirement allowance of newly retired Members being higher than those of the deceased Members who were removed from the retirement payroll; and a $1,335,000 one-time payment to the Los Angeles Fire and Police Pension System (LAFPP) representing Retirement Plan benefits of 42 Airport Peace Officers who opted to transfer to LAFPP in January 2018 (refer to Note 2 – Retirement Plan Description on pages 28 - 29). Payments for Postemployment Health Care Plan benefits also increased by $8,465,000 (7.1%). This increase was mainly due to the increase of the maximum health insurance subsidy from $1,737 to $1,791 per month based on the higher renewed medical premium rates for the calendar year 2018; the higher basic Medicare Part B premium reimbursement for the eligible Members; the increased number of retired Members and their dependents eligible for medical subsidy; and a $517,000 one-time payment to LAFPP for the Postemployment Health Care Plan benefits of 42 Airport Peace Officers who opted to transfer to LAFPP. However, the increase caused by these
factors was lessened by the one-time defrayal of $4,010,000 from a postemployment health care provider for the return of excess premium stabilization reserves during this reporting period. The refunds of Member contributions increased by $609,000 (6.2%) from the prior fiscal year’s $9,803,000 mainly due to the refunds of $1,170,000 Member contributions of 42 Airport Peace Officers who transferred to the LAFPP (refer to Note 2 – Retirement Plan Description on pages 28 - 29). LACERS administrative expenses increased by $535,000 or 2.6% from the prior fiscal year. This increase was primarily due to salary factors such as granted COLA increases and LACERS share of employer contributions to employee retirement and OPEB benefits. In addition, due to the amortization of capitalized costs of the LACERS Pension Administration System, much higher depreciation expenses were reported in this year’s administrative expenses. Requests for Information This financial report is designed to provide a general overview of LACERS finances. Questions concerning any of the information provided in this report or requests for additional financial information should be addressed to:
LACERS Fiscal Management Section PO Box 512218 Los Angeles, CA 90051-0218

BASIC FINANCIAL STATEMENTS
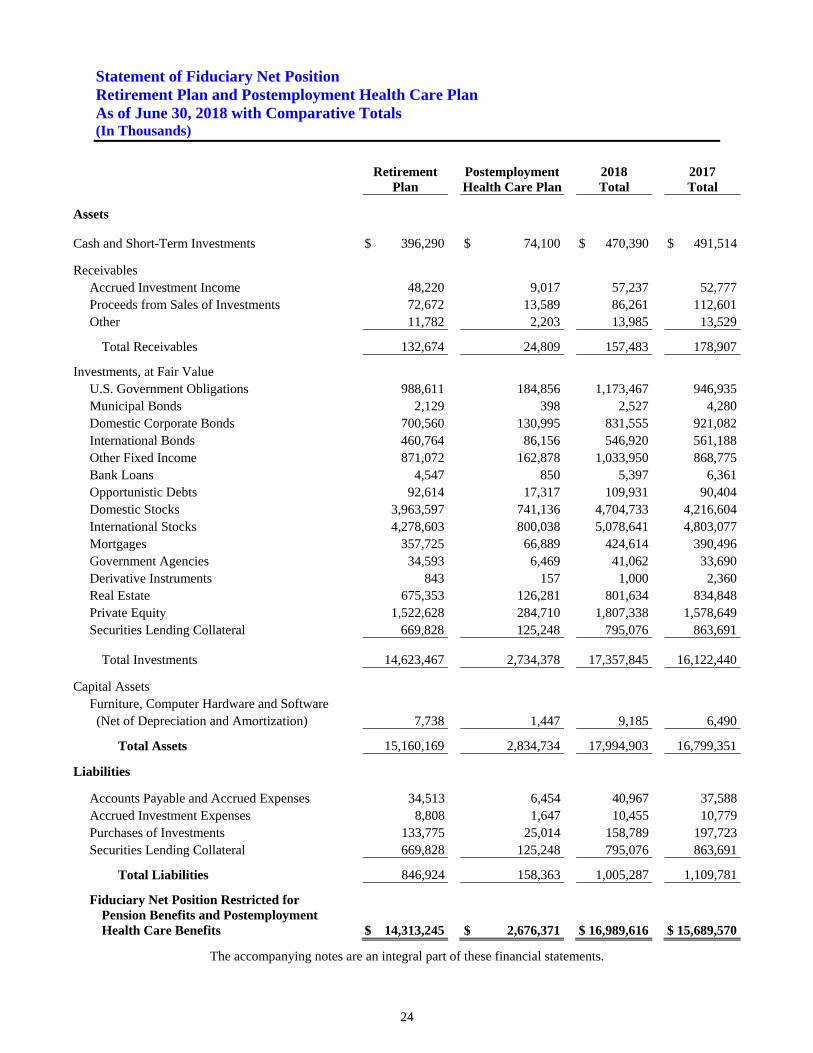
Statement of Fiduciary Net Position Retirement Plan and Postemployment Health Care Plan As of June 30, 2018 with Comparative Totals (In Thousands)
24
Retirement Postemployment 2018 2017 Plan Health Care Plan Total Total
Assets Cash and Short-Term Investments $ 396,290 $ 74,100 $ 470,390 $ 491,514
Receivables Accrued Investment Income 48,220 9,017 57,237 52,777 Proceeds from Sales of Investments 72,672 13,589 86,261 112,601 Other 11,782 2,203 13,985 13,529
Total Receivables 132,674 24,809 157,483 178,907
Investments, at Fair Value U.S. Government Obligations 988,611 184,856 1,173,467 946,935 Municipal Bonds 2,129 398 2,527 4,280 Domestic Corporate Bonds 700,560 130,995 831,555 921,082 International Bonds 460,764 86,156 546,920 561,188 Other Fixed Income 871,072 162,878 1,033,950 868,775 Bank Loans 4,547 850 5,397 6,361 Opportunistic Debts 92,614 17,317 109,931 90,404 Domestic Stocks 3,963,597 741,136 4,704,733 4,216,604 International Stocks 4,278,603 800,038 5,078,641 4,803,077 Mortgages 357,725 66,889 424,614 390,496 Government Agencies 34,593 6,469 41,062 33,690 Derivative Instruments 843 157 1,000 2,360 Real Estate 675,353 126,281 801,634 834,848 Private Equity 1,522,628 284,710 1,807,338 1,578,649 Securities Lending Collateral 669,828 125,248 795,076 863,691 Total Investments 14,623,467 2,734,378 17,357,845 16,122,440
Capital Assets Furniture, Computer Hardware and Software (Net of Depreciation and Amortization) 7,738 1,447 9,185 6,490
Total Assets 15,160,169 2,834,734 17,994,903 16,799,351
Liabilities
Accounts Payable and Accrued Expenses 34,513 6,454 40,967 37,588 Accrued Investment Expenses 8,808 1,647 10,455 10,779 Purchases of Investments 133,775 25,014 158,789 197,723 Securities Lending Collateral 669,828 125,248 795,076 863,691
Total Liabilities 846,924 158,363 1,005,287 1,109,781
Fiduciary Net Position Restricted for Pension Benefits and Postemployment Health Care Benefits $ 14,313,245 $ 2,676,371 $ 16,989,616 $ 15,689,570
The accompanying notes are an integral part of these financial statements.
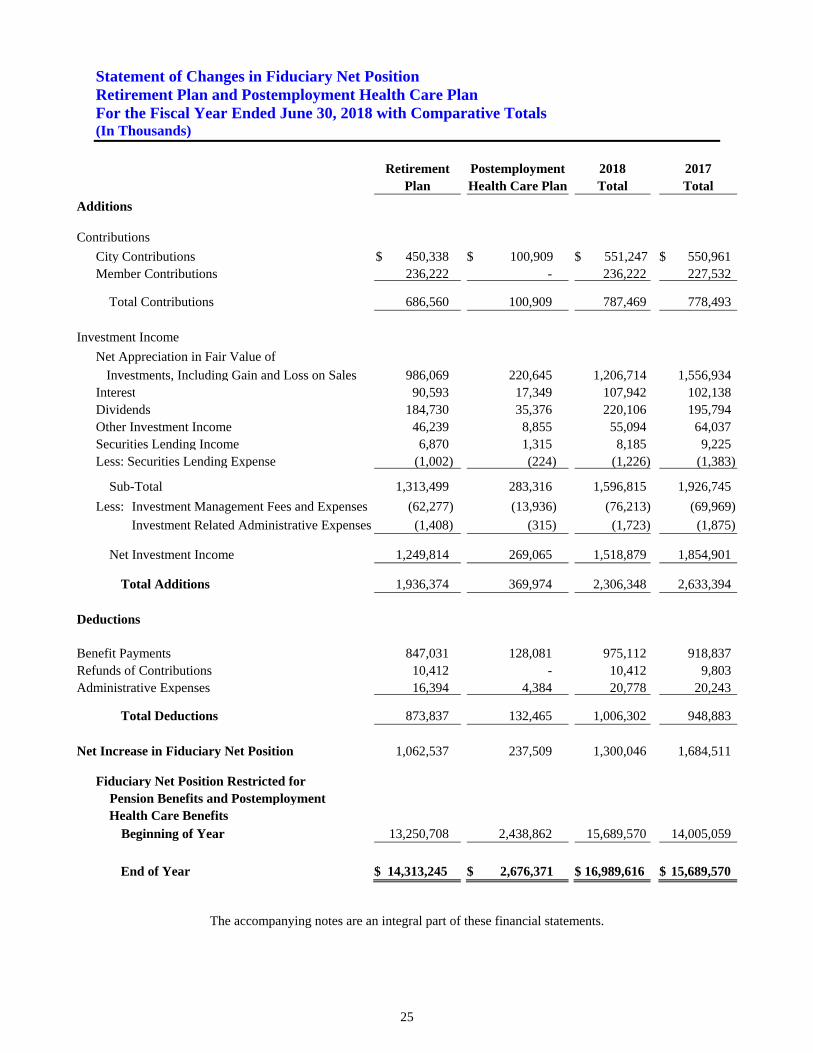
Statement of Changes in Fiduciary Net Position Retirement Plan and Postemployment Health Care Plan For the Fiscal Year Ended June 30, 2018 with Comparative Totals (In Thousands)
25
Retirement
Plan
Postemployment Health Care Plan
2018 Total
2017 Total
Additions
Contributions
City Contributions $ 450,338 $ 100,909 $ 551,247 $ 550,961Member Contributions 236,222 - 236,222 227,532
Total Contributions 686,560 100,909 787,469 778,493
Investment Income
Net Appreciation in Fair Value of
Investments, Including Gain and Loss on Sales 986,069 220,645 1,206,714 1,556,934Interest 90,593 17,349 107,942 102,138Dividends 184,730 35,376 220,106 195,794Other Investment Income 46,239 8,855 55,094 64,037Securities Lending Income 6,870 1,315 8,185 9,225Less: Securities Lending Expense (1,002) (224) (1,226) (1,383)
Sub-Total 1,313,499 283,316 1,596,815 1,926,745
Less: Investment Management Fees and Expenses (62,277) (13,936) (76,213) (69,969)
Investment Related Administrative Expenses (1,408) (315) (1,723) (1,875)
Net Investment Income 1,249,814 269,065 1,518,879 1,854,901
Total Additions 1,936,374 369,974 2,306,348 2,633,394
Deductions
Benefit Payments 847,031 128,081 975,112 918,837Refunds of Contributions 10,412 - 10,412 9,803Administrative Expenses 16,394 4,384 20,778 20,243
Total Deductions 873,837 132,465 1,006,302 948,883
Net Increase in Fiduciary Net Position 1,062,537 237,509 1,300,046 1,684,511
Fiduciary Net Position Restricted for Pension Benefits and Postemployment Health Care Benefits Beginning of Year 13,250,708 2,438,862 15,689,570 14,005,059
End of Year $ 14,313,245 $ 2,676,371 $ 16,989,616 $ 15,689,570
The accompanying notes are an integral part of these financial statements.
Notes to the Basic Financial Statements
26
1. Description of LACERS and Significant
Accounting Policies General Description
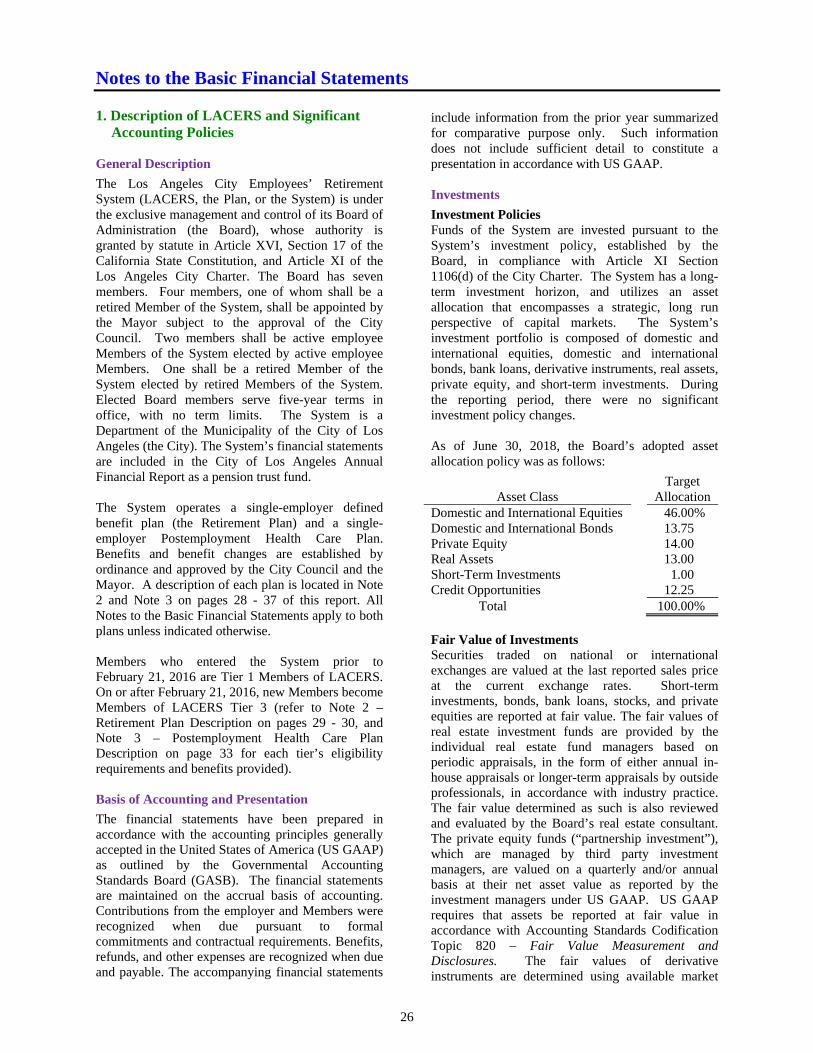
The Los Angeles City Employees’ Retirement System (LACERS, the Plan, or the System) is under the exclusive management and control of its Board of Administration (the Board), whose authority is granted by statute in Article XVI, Section 17 of the California State Constitution, and Article XI of the Los Angeles City Charter. The Board has seven members. Four members, one of whom shall be a retired Member of the System, shall be appointed by the Mayor subject to the approval of the City Council. Two members shall be active employee Members of the System elected by active employee Members. One shall be a retired Member of the System elected by retired Members of the System. Elected Board members serve five-year terms in office, with no term limits. The System is a Department of the Municipality of the City of Los Angeles (the City). The System’s financial statements are included in the City of Los Angeles Annual Financial Report as a pension trust fund. The System operates a single-employer defined benefit plan (the Retirement Plan) and a single-employer Postemployment Health Care Plan. Benefits and benefit changes are established by ordinance and approved by the City Council and the Mayor. A description of each plan is located in Note 2 and Note 3 on pages 28 - 37 of this report. All Notes to the Basic Financial Statements apply to both plans unless indicated otherwise. Members who entered the System prior to February 21, 2016 are Tier 1 Members of LACERS. On or after February 21, 2016, new Members become Members of LACERS Tier 3 (refer to Note 2 – Retirement Plan Description on pages 29 - 30, and Note 3 – Postemployment Health Care Plan Description on page 33 for each tier’s eligibility requirements and benefits provided). Basis of Accounting and Presentation
The financial statements have been prepared in accordance with the accounting principles generally accepted in the United States of America (US GAAP) as outlined by the Governmental Accounting Standards Board (GASB). The financial statements are maintained on the accrual basis of accounting. Contributions from the employer and Members were recognized when due pursuant to formal commitments and contractual requirements. Benefits, refunds, and other expenses are recognized when due and payable. The accompanying financial statements
include information from the prior year summarized for comparative purpose only. Such information does not include sufficient detail to constitute a presentation in accordance with US GAAP. Investments
Investment Policies Funds of the System are invested pursuant to the System’s investment policy, established by the Board, in compliance with Article XI Section 1106(d) of the City Charter. The System has a long-term investment horizon, and utilizes an asset allocation that encompasses a strategic, long run perspective of capital markets. The System’s investment portfolio is composed of domestic and international equities, domestic and international bonds, bank loans, derivative instruments, real assets, private equity, and short-term investments. During the reporting period, there were no significant investment policy changes. As of June 30, 2018, the Board’s adopted asset allocation policy was as follows:
Asset Class Target
Allocation Domestic and International Equities 46.00% Domestic and International Bonds 13.75 Private Equity 14.00 Real Assets 13.00 Short-Term Investments 1.00 Credit Opportunities 12.25
Total 100.00% Fair Value of Investments Securities traded on national or international exchanges are valued at the last reported sales price at the current exchange rates. Short-term investments, bonds, bank loans, stocks, and private equities are reported at fair value. The fair values of real estate investment funds are provided by the individual real estate fund managers based on periodic appraisals, in the form of either annual in-house appraisals or longer-term appraisals by outside professionals, in accordance with industry practice. The fair value determined as such is also reviewed and evaluated by the Board’s real estate consultant. The private equity funds (“partnership investment”), which are managed by third party investment managers, are valued on a quarterly and/or annual basis at their net asset value as reported by the investment managers under US GAAP. US GAAP requires that assets be reported at fair value in accordance with Accounting Standards Codification Topic 820 – Fair Value Measurement and Disclosures. The fair values of derivative instruments are determined using available market
Notes to the Basic Financial Statements
27
1. Description of LACERS and Significant
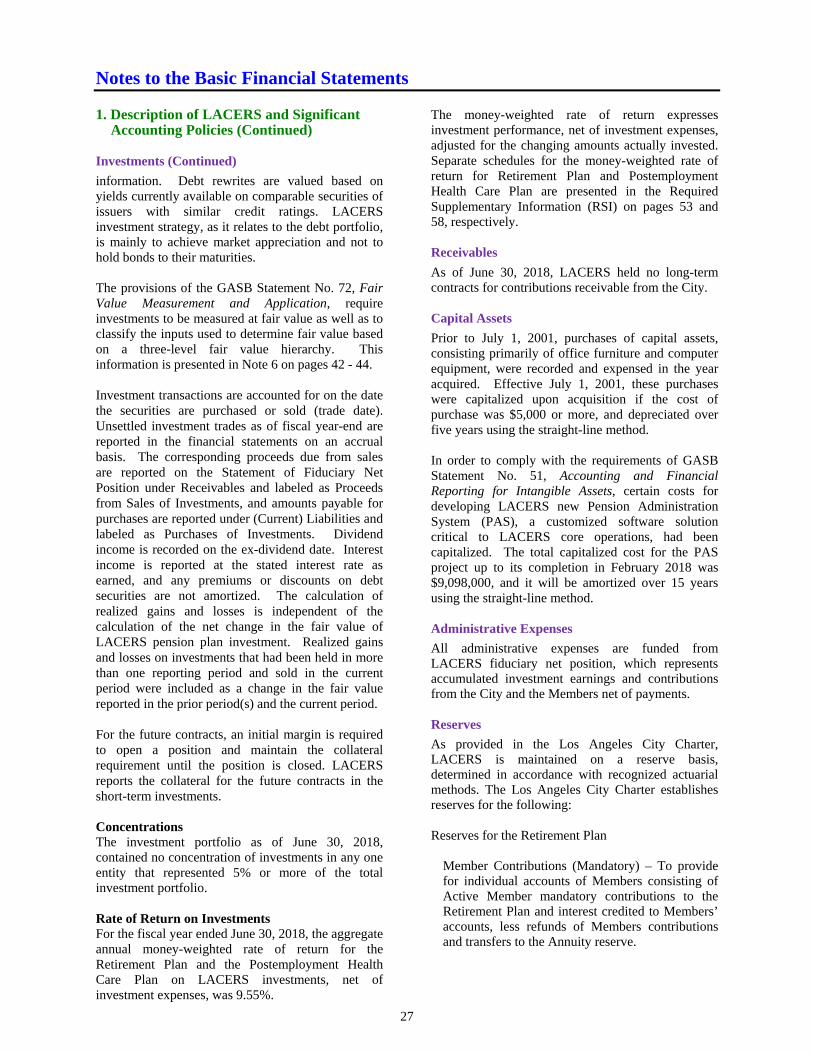
Accounting Policies (Continued) Investments (Continued)
information. Debt rewrites are valued based on yields currently available on comparable securities of issuers with similar credit ratings. LACERS investment strategy, as it relates to the debt portfolio, is mainly to achieve market appreciation and not to hold bonds to their maturities. The provisions of the GASB Statement No. 72, Fair Value Measurement and Application, require investments to be measured at fair value as well as to classify the inputs used to determine fair value based on a three-level fair value hierarchy. This information is presented in Note 6 on pages 42 - 44. Investment transactions are accounted for on the date the securities are purchased or sold (trade date). Unsettled investment trades as of fiscal year-end are reported in the financial statements on an accrual basis. The corresponding proceeds due from sales are reported on the Statement of Fiduciary Net Position under Receivables and labeled as Proceeds from Sales of Investments, and amounts payable for purchases are reported under (Current) Liabilities and labeled as Purchases of Investments. Dividend income is recorded on the ex-dividend date. Interest income is reported at the stated interest rate as earned, and any premiums or discounts on debt securities are not amortized. The calculation of realized gains and losses is independent of the calculation of the net change in the fair value of LACERS pension plan investment. Realized gains and losses on investments that had been held in more than one reporting period and sold in the current period were included as a change in the fair value reported in the prior period(s) and the current period. For the future contracts, an initial margin is required to open a position and maintain the collateral requirement until the position is closed. LACERS reports the collateral for the future contracts in the short-term investments. Concentrations The investment portfolio as of June 30, 2018, contained no concentration of investments in any one entity that represented 5% or more of the total investment portfolio. Rate of Return on Investments For the fiscal year ended June 30, 2018, the aggregate annual money-weighted rate of return for the Retirement Plan and the Postemployment Health Care Plan on LACERS investments, net of investment expenses, was 9.55%.
The money-weighted rate of return expresses investment performance, net of investment expenses, adjusted for the changing amounts actually invested. Separate schedules for the money-weighted rate of return for Retirement Plan and Postemployment Health Care Plan are presented in the Required Supplementary Information (RSI) on pages 53 and 58, respectively. Receivables
As of June 30, 2018, LACERS held no long-term contracts for contributions receivable from the City. Capital Assets
Prior to July 1, 2001, purchases of capital assets, consisting primarily of office furniture and computer equipment, were recorded and expensed in the year acquired. Effective July 1, 2001, these purchases were capitalized upon acquisition if the cost of purchase was $5,000 or more, and depreciated over five years using the straight-line method. In order to comply with the requirements of GASB Statement No. 51, Accounting and Financial Reporting for Intangible Assets, certain costs for developing LACERS new Pension Administration System (PAS), a customized software solution critical to LACERS core operations, had been capitalized. The total capitalized cost for the PAS project up to its completion in February 2018 was $9,098,000, and it will be amortized over 15 years using the straight-line method. Administrative Expenses
All administrative expenses are funded from LACERS fiduciary net position, which represents accumulated investment earnings and contributions from the City and the Members net of payments. Reserves
As provided in the Los Angeles City Charter, LACERS is maintained on a reserve basis, determined in accordance with recognized actuarial methods. The Los Angeles City Charter establishes reserves for the following: Reserves for the Retirement Plan
Member Contributions (Mandatory) – To provide for individual accounts of Members consisting of Active Member mandatory contributions to the Retirement Plan and interest credited to Members’ accounts, less refunds of Members contributions and transfers to the Annuity reserve.
Notes to the Basic Financial Statements
28
1. Description of LACERS and Significant
Accounting Policies (Continued)
Reserves (Continued)
Reserves for the Retirement Plan (Continued)
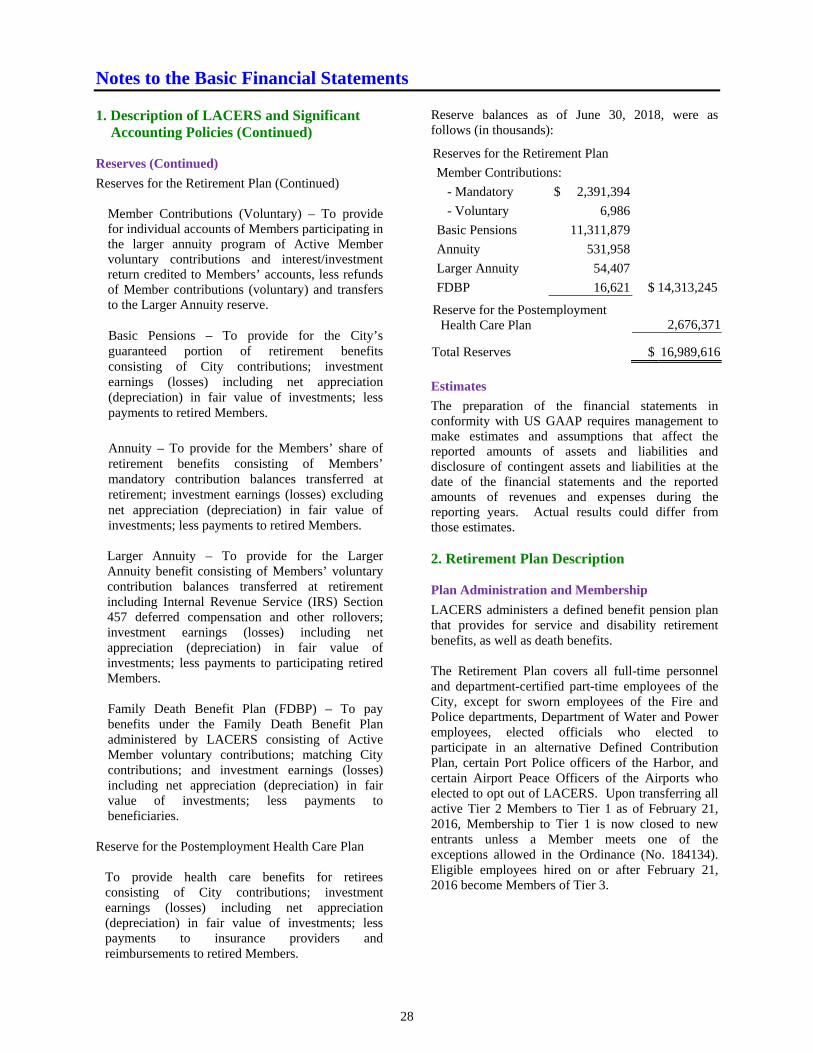
Member Contributions (Voluntary) – To provide for individual accounts of Members participating in the larger annuity program of Active Member voluntary contributions and interest/investment return credited to Members’ accounts, less refunds of Member contributions (voluntary) and transfers to the Larger Annuity reserve. Basic Pensions – To provide for the City’s guaranteed portion of retirement benefits consisting of City contributions; investment earnings (losses) including net appreciation (depreciation) in fair value of investments; less payments to retired Members.
Annuity – To provide for the Members’ share of retirement benefits consisting of Members’ mandatory contribution balances transferred at retirement; investment earnings (losses) excluding net appreciation (depreciation) in fair value of investments; less payments to retired Members. Larger Annuity – To provide for the Larger Annuity benefit consisting of Members’ voluntary contribution balances transferred at retirement including Internal Revenue Service (IRS) Section 457 deferred compensation and other rollovers; investment earnings (losses) including net appreciation (depreciation) in fair value of investments; less payments to participating retired Members. Family Death Benefit Plan (FDBP) – To pay benefits under the Family Death Benefit Plan administered by LACERS consisting of Active Member voluntary contributions; matching City contributions; and investment earnings (losses) including net appreciation (depreciation) in fair value of investments; less payments to beneficiaries.
Reserve for the Postemployment Health Care Plan
To provide health care benefits for retirees consisting of City contributions; investment earnings (losses) including net appreciation (depreciation) in fair value of investments; less payments to insurance providers and reimbursements to retired Members.
Reserve balances as of June 30, 2018, were as follows (in thousands):
Reserves for the Retirement Plan
Member Contributions:
- Mandatory $ 2,391,394
- Voluntary 6,986
Basic Pensions 11,311,879
Annuity 531,958
Larger Annuity 54,407
FDBP 16,621 $ 14,313,245
Reserve for the Postemployment Health Care Plan 2,676,371
Total Reserves $ 16,989,616
Estimates
The preparation of the financial statements in conformity with US GAAP requires management to make estimates and assumptions that affect the reported amounts of assets and liabilities and disclosure of contingent assets and liabilities at the date of the financial statements and the reported amounts of revenues and expenses during the reporting years. Actual results could differ from those estimates. 2. Retirement Plan Description Plan Administration and Membership
LACERS administers a defined benefit pension plan that provides for service and disability retirement benefits, as well as death benefits. The Retirement Plan covers all full-time personnel and department-certified part-time employees of the City, except for sworn employees of the Fire and Police departments, Department of Water and Power employees, elected officials who elected to participate in an alternative Defined Contribution Plan, certain Port Police officers of the Harbor, and certain Airport Peace Officers of the Airports who elected to opt out of LACERS. Upon transferring all active Tier 2 Members to Tier 1 as of February 21, 2016, Membership to Tier 1 is now closed to new entrants unless a Member meets one of the exceptions allowed in the Ordinance (No. 184134). Eligible employees hired on or after February 21, 2016 become Members of Tier 3.
Notes to the Basic Financial Statements
29
2. Retirement Plan Description (Continued) Plan Administration and Membership (Continued)
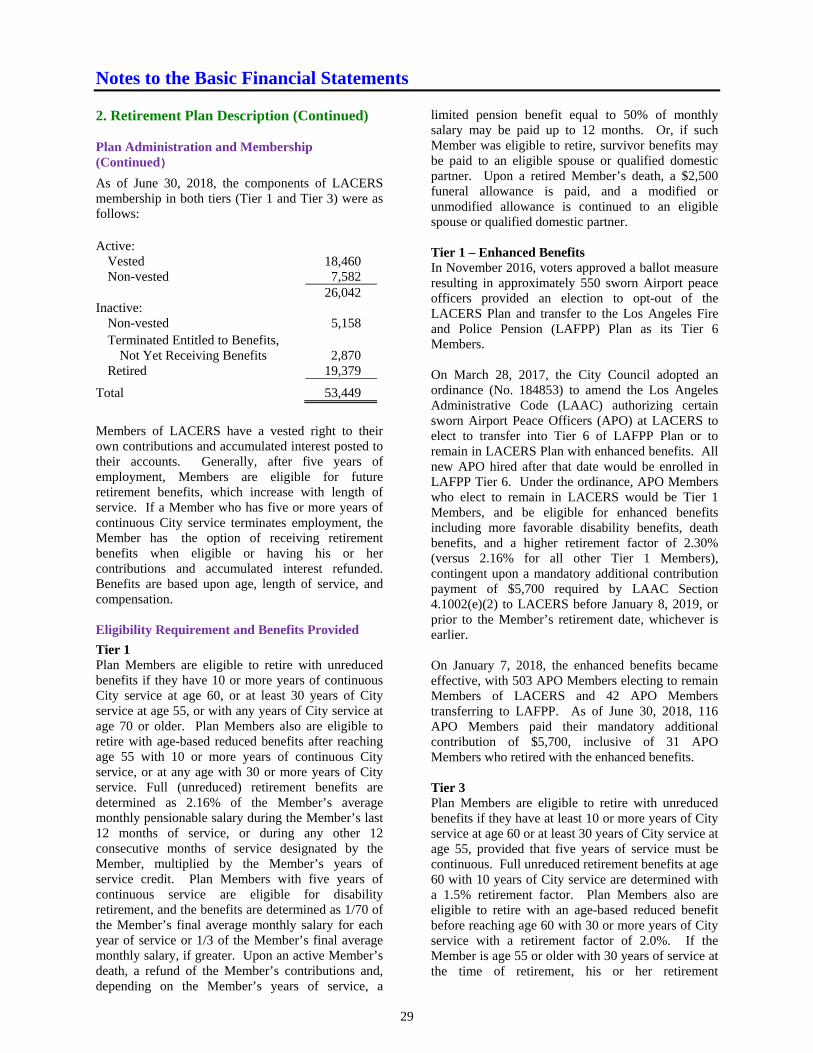
As of June 30, 2018, the components of LACERS membership in both tiers (Tier 1 and Tier 3) were as follows: Active:
Vested 18,460 Non-vested 7,582
26,042 Inactive:
Non-vested 5,158 Terminated Entitled to Benefits,
Not Yet Receiving Benefits 2,870 Retired 19,379
Total 53,449
Members of LACERS have a vested right to their own contributions and accumulated interest posted to their accounts. Generally, after five years of employment, Members are eligible for future retirement benefits, which increase with length of service. If a Member who has five or more years of continuous City service terminates employment, the Member has the option of receiving retirement benefits when eligible or having his or her contributions and accumulated interest refunded. Benefits are based upon age, length of service, and compensation. Eligibility Requirement and Benefits Provided
Tier 1 Plan Members are eligible to retire with unreduced benefits if they have 10 or more years of continuous City service at age 60, or at least 30 years of City service at age 55, or with any years of City service at age 70 or older. Plan Members also are eligible to retire with age-based reduced benefits after reaching age 55 with 10 or more years of continuous City service, or at any age with 30 or more years of City service. Full (unreduced) retirement benefits are determined as 2.16% of the Member’s average monthly pensionable salary during the Member’s last 12 months of service, or during any other 12 consecutive months of service designated by the Member, multiplied by the Member’s years of service credit. Plan Members with five years of continuous service are eligible for disability retirement, and the benefits are determined as 1/70 of the Member’s final average monthly salary for each year of service or 1/3 of the Member’s final average monthly salary, if greater. Upon an active Member’s death, a refund of the Member’s contributions and, depending on the Member’s years of service, a
limited pension benefit equal to 50% of monthly salary may be paid up to 12 months. Or, if such Member was eligible to retire, survivor benefits may be paid to an eligible spouse or qualified domestic partner. Upon a retired Member’s death, a $2,500 funeral allowance is paid, and a modified or unmodified allowance is continued to an eligible spouse or qualified domestic partner. Tier 1 – Enhanced Benefits In November 2016, voters approved a ballot measure resulting in approximately 550 sworn Airport peace officers provided an election to opt-out of the LACERS Plan and transfer to the Los Angeles Fire and Police Pension (LAFPP) Plan as its Tier 6 Members. On March 28, 2017, the City Council adopted an ordinance (No. 184853) to amend the Los Angeles Administrative Code (LAAC) authorizing certain sworn Airport Peace Officers (APO) at LACERS to elect to transfer into Tier 6 of LAFPP Plan or to remain in LACERS Plan with enhanced benefits. All new APO hired after that date would be enrolled in LAFPP Tier 6. Under the ordinance, APO Members who elect to remain in LACERS would be Tier 1 Members, and be eligible for enhanced benefits including more favorable disability benefits, death benefits, and a higher retirement factor of 2.30% (versus 2.16% for all other Tier 1 Members), contingent upon a mandatory additional contribution payment of $5,700 required by LAAC Section 4.1002(e)(2) to LACERS before January 8, 2019, or prior to the Member’s retirement date, whichever is earlier. On January 7, 2018, the enhanced benefits became effective, with 503 APO Members electing to remain Members of LACERS and 42 APO Members transferring to LAFPP. As of June 30, 2018, 116 APO Members paid their mandatory additional contribution of $5,700, inclusive of 31 APO Members who retired with the enhanced benefits. Tier 3 Plan Members are eligible to retire with unreduced benefits if they have at least 10 or more years of City service at age 60 or at least 30 years of City service at age 55, provided that five years of service must be continuous. Full unreduced retirement benefits at age 60 with 10 years of City service are determined with a 1.5% retirement factor. Plan Members also are eligible to retire with an age-based reduced benefit before reaching age 60 with 30 or more years of City service with a retirement factor of 2.0%. If the Member is age 55 or older with 30 years of service at the time of retirement, his or her retirement
Notes to the Basic Financial Statements
30
2. Retirement Plan Description (Continued) Eligibility Requirement and Benefits Provided (Continued)
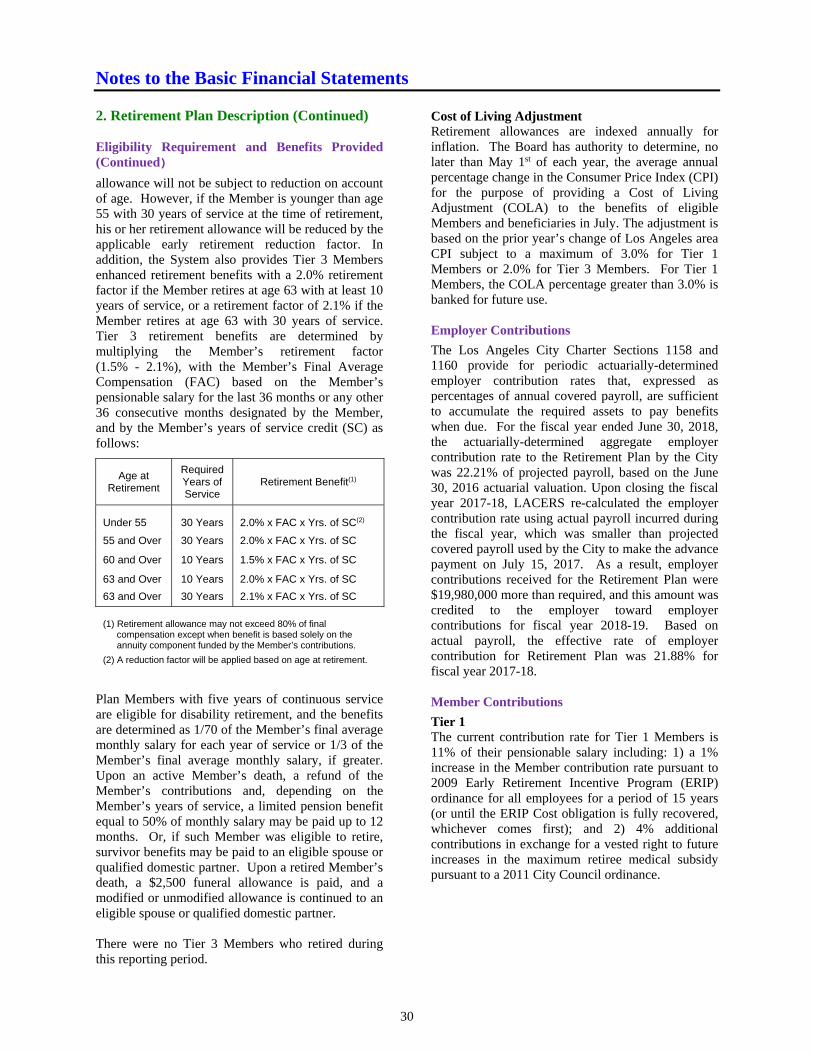
allowance will not be subject to reduction on account of age. However, if the Member is younger than age 55 with 30 years of service at the time of retirement, his or her retirement allowance will be reduced by the applicable early retirement reduction factor. In addition, the System also provides Tier 3 Members enhanced retirement benefits with a 2.0% retirement factor if the Member retires at age 63 with at least 10 years of service, or a retirement factor of 2.1% if the Member retires at age 63 with 30 years of service. Tier 3 retirement benefits are determined by multiplying the Member’s retirement factor (1.5% - 2.1%), with the Member’s Final Average Compensation (FAC) based on the Member’s pensionable salary for the last 36 months or any other 36 consecutive months designated by the Member, and by the Member’s years of service credit (SC) as follows:
Age at Retirement
Required Years of Service
Retirement Benefit(1)
Under 55 30 Years 2.0% x FAC x Yrs. of SC(2)
55 and Over 30 Years 2.0% x FAC x Yrs. of SC
60 and Over 10 Years 1.5% x FAC x Yrs. of SC
63 and Over 10 Years 2.0% x FAC x Yrs. of SC
63 and Over 30 Years 2.1% x FAC x Yrs. of SC
(1) Retirement allowance may not exceed 80% of final compensation except when benefit is based solely on the annuity component funded by the Member’s contributions.
(2) A reduction factor will be applied based on age at retirement.
Plan Members with five years of continuous service are eligible for disability retirement, and the benefits are determined as 1/70 of the Member’s final average monthly salary for each year of service or 1/3 of the Member’s final average monthly salary, if greater. Upon an active Member’s death, a refund of the Member’s contributions and, depending on the Member’s years of service, a limited pension benefit equal to 50% of monthly salary may be paid up to 12 months. Or, if such Member was eligible to retire, survivor benefits may be paid to an eligible spouse or qualified domestic partner. Upon a retired Member’s death, a $2,500 funeral allowance is paid, and a modified or unmodified allowance is continued to an eligible spouse or qualified domestic partner. There were no Tier 3 Members who retired during this reporting period.
Cost of Living Adjustment Retirement allowances are indexed annually for inflation. The Board has authority to determine, no later than May 1st of each year, the average annual percentage change in the Consumer Price Index (CPI) for the purpose of providing a Cost of Living Adjustment (COLA) to the benefits of eligible Members and beneficiaries in July. The adjustment is based on the prior year’s change of Los Angeles area CPI subject to a maximum of 3.0% for Tier 1 Members or 2.0% for Tier 3 Members. For Tier 1 Members, the COLA percentage greater than 3.0% is banked for future use. Employer Contributions
The Los Angeles City Charter Sections 1158 and 1160 provide for periodic actuarially-determined employer contribution rates that, expressed as percentages of annual covered payroll, are sufficient to accumulate the required assets to pay benefits when due. For the fiscal year ended June 30, 2018, the actuarially-determined aggregate employer contribution rate to the Retirement Plan by the City was 22.21% of projected payroll, based on the June 30, 2016 actuarial valuation. Upon closing the fiscal year 2017-18, LACERS re-calculated the employer contribution rate using actual payroll incurred during the fiscal year, which was smaller than projected covered payroll used by the City to make the advance payment on July 15, 2017. As a result, employer contributions received for the Retirement Plan were $19,980,000 more than required, and this amount was credited to the employer toward employer contributions for fiscal year 2018-19. Based on actual payroll, the effective rate of employer contribution for Retirement Plan was 21.88% for fiscal year 2017-18. Member Contributions
Tier 1 The current contribution rate for Tier 1 Members is 11% of their pensionable salary including: 1) a 1% increase in the Member contribution rate pursuant to 2009 Early Retirement Incentive Program (ERIP) ordinance for all employees for a period of 15 years (or until the ERIP Cost obligation is fully recovered, whichever comes first); and 2) 4% additional contributions in exchange for a vested right to future increases in the maximum retiree medical subsidy pursuant to a 2011 City Council ordinance.
Notes to the Basic Financial Statements
31
2. Retirement Plan Description (Continued) Member Contributions (Continued)
Tier 3 The contribution rate for Tier 3 Members is 11% of their pensionable salary including 4% additional contributions in exchange for a vested right to future increases in the maximum retiree medical subsidy. Unlike Tier 1, Tier 3 Members do not pay ERIP contribution, therefore, Tier 3 Members’ contribution rate will not drop down when Tier 1 Members cease to pay the 1% ERIP contribution. Net Pension Liability
In calculating the Plan’s net pension liability, the total pension liability and the Plan fiduciary net position exclude amounts associated with Family Death and Larger Annuity Benefits. As of June 30, 2018, the components of the net pension liability were as follows (in thousands):
Total Pension Liability $ 19,944,578 Plan Fiduciary Net Position (1) 14,235,230
Plan’s Net Pension Liability $ 5,709,348
Plan Fiduciary Net Position as a percentage of the Total Pension Liability 71.4% (1) Plan fiduciary net position was $14,313,245,000 as of June 30, 2018 without excluding amounts associated with Family
Death and Larger Annuity Benefits. Significant Assumptions Projections of benefits for financial reporting purposes are based on the types of benefits provided to active, inactive, and retired Members at the time of each valuation, including expected future COLAs. The attribution method and significant assumptions used in the valuation year of June 30, 2018, are summarized below:
Valuation Date June 30, 2018
Actuarial Cost Method
Amortization Method
Entry Age Method – assuming a closed group (individual basis).
Level Percent of Payroll
Actuarial Assumptions:
Date of Experience Study June 30, 2017 (July 1, 2014 through June 30, 2017)
Long-Term Expected Rate of Return 7.25%
Inflation 3.00%
Real Across-the-Board Salary Increase 0.50%
Projected Salary Increases Ranges from 3.90% to 10.00% based on years of service, including inflation assumption at 3.00% and the real across-the-board salary increase assumption of 0.50%.
Annual COLAs 3.00% maximum for Tier 1 and 2.00% maximum for Tier 3.
Mortality Table for Retirees and Beneficiaries
Headcount-Weighted RP-2014 Healthy Annuitant Mortality Table (separate tables for males and females) projected generationally with the two-dimensional mortality improvement scale MP-2017.
Mortality Table for Disabled Retirees
Headcount-Weighted RP-2014 Disabled Retiree Mortality Table (separate tables for males and females) projected generationally with the two-dimensional mortality improvement scale MP-2017.
Percent Married / Domestic Partner 76% of male participants and 50% of female participants are assumed to be married or have a qualified domestic partner.
Spouse Age Difference Male retirees are assumed to be three years older than their female spouses. Female retirees are assumed to be two years younger than their male spouses.
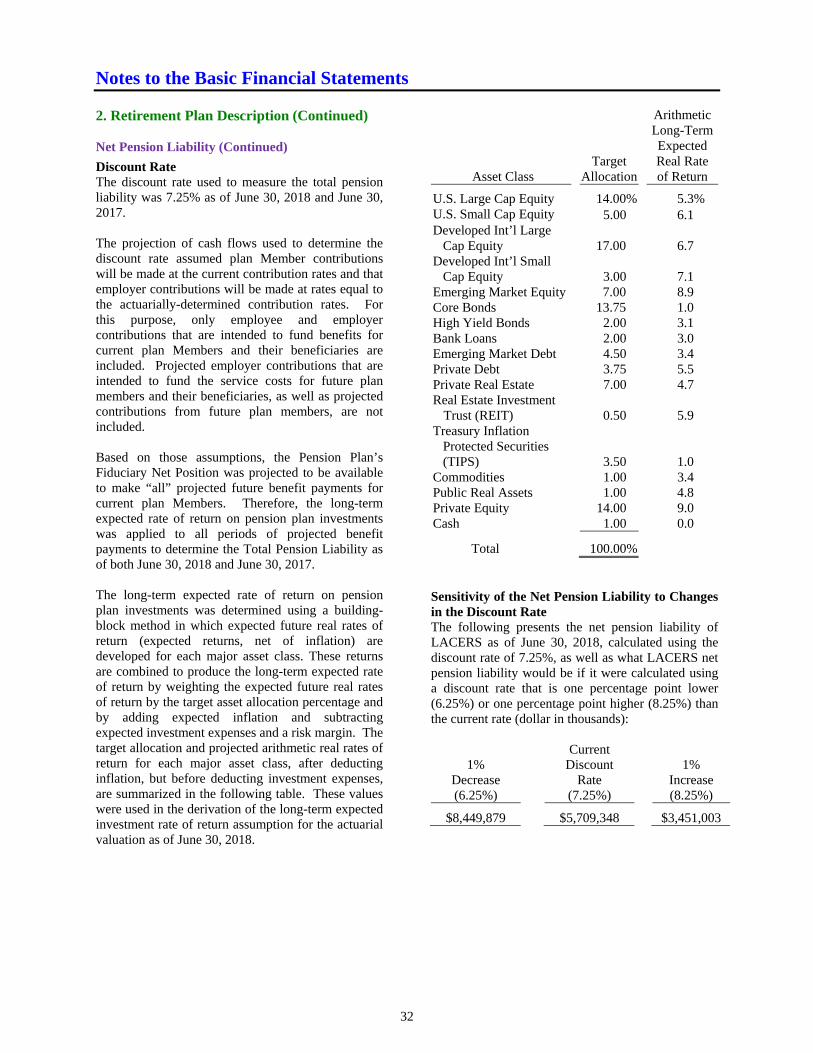
Notes to the Basic Financial Statements
32
2. Retirement Plan Description (Continued) Net Pension Liability (Continued)
Discount Rate The discount rate used to measure the total pension liability was 7.25% as of June 30, 2018 and June 30, 2017. The projection of cash flows used to determine the discount rate assumed plan Member contributions will be made at the current contribution rates and that employer contributions will be made at rates equal to the actuarially-determined contribution rates. For this purpose, only employee and employer contributions that are intended to fund benefits for current plan Members and their beneficiaries are included. Projected employer contributions that are intended to fund the service costs for future plan members and their beneficiaries, as well as projected contributions from future plan members, are not included. Based on those assumptions, the Pension Plan’s Fiduciary Net Position was projected to be available to make “all” projected future benefit payments for current plan Members. Therefore, the long-term expected rate of return on pension plan investments was applied to all periods of projected benefit payments to determine the Total Pension Liability as of both June 30, 2018 and June 30, 2017. The long-term expected rate of return on pension plan investments was determined using a building-block method in which expected future real rates of return (expected returns, net of inflation) are developed for each major asset class. These returns are combined to produce the long-term expected rate of return by weighting the expected future real rates of return by the target asset allocation percentage and by adding expected inflation and subtracting expected investment expenses and a risk margin. The target allocation and projected arithmetic real rates of return for each major asset class, after deducting inflation, but before deducting investment expenses, are summarized in the following table. These values were used in the derivation of the long-term expected investment rate of return assumption for the actuarial valuation as of June 30, 2018.
Asset Class Target
Allocation
Arithmetic Long-Term Expected Real Rate of Return
U.S. Large Cap Equity 14.00% 5.3% U.S. Small Cap Equity 5.00 6.1 Developed Int’l Large
Cap Equity
17.00 6.7 Developed Int’l Small
Cap Equity
3.00 7.1 Emerging Market Equity 7.00 8.9 Core Bonds 13.75 1.0 High Yield Bonds 2.00 3.1 Bank Loans 2.00 3.0 Emerging Market Debt 4.50 3.4 Private Debt 3.75 5.5 Private Real Estate 7.00 4.7 Real Estate Investment
Trust (REIT)
0.50 5.9 Treasury Inflation
Protected Securities (TIPS)
3.50 1.0 Commodities 1.00 3.4 Public Real Assets 1.00 4.8 Private Equity 14.00 9.0 Cash 1.00 0.0
Total
100.00% Sensitivity of the Net Pension Liability to Changes in the Discount Rate The following presents the net pension liability of LACERS as of June 30, 2018, calculated using the discount rate of 7.25%, as well as what LACERS net pension liability would be if it were calculated using a discount rate that is one percentage point lower (6.25%) or one percentage point higher (8.25%) than the current rate (dollar in thousands):
1%
Decrease
Current Discount
Rate
1%
Increase (6.25%) (7.25%) (8.25%)
$8,449,879 $5,709,348 $3,451,003
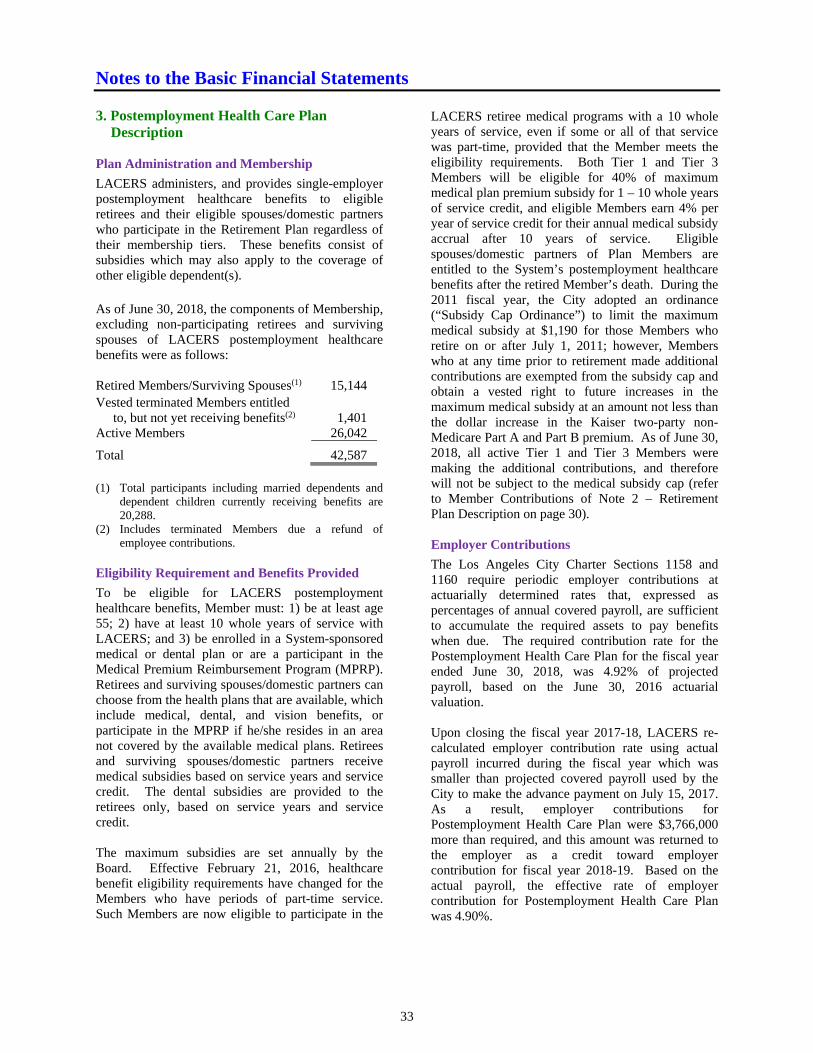
Notes to the Basic Financial Statements
33
3. Postemployment Health Care Plan
Description Plan Administration and Membership
LACERS administers, and provides single-employer postemployment healthcare benefits to eligible retirees and their eligible spouses/domestic partners who participate in the Retirement Plan regardless of their membership tiers. These benefits consist of subsidies which may also apply to the coverage of other eligible dependent(s). As of June 30, 2018, the components of Membership, excluding non-participating retirees and surviving spouses of LACERS postemployment healthcare benefits were as follows: Retired Members/Surviving Spouses(1) 15,144 Vested terminated Members entitled
to, but not yet receiving benefits(2) 1,401 Active Members 26,042
Total 42,587 (1) Total participants including married dependents and
dependent children currently receiving benefits are 20,288.
(2) Includes terminated Members due a refund of employee contributions.
Eligibility Requirement and Benefits Provided
To be eligible for LACERS postemployment healthcare benefits, Member must: 1) be at least age 55; 2) have at least 10 whole years of service with LACERS; and 3) be enrolled in a System-sponsored medical or dental plan or are a participant in the Medical Premium Reimbursement Program (MPRP). Retirees and surviving spouses/domestic partners can choose from the health plans that are available, which include medical, dental, and vision benefits, or participate in the MPRP if he/she resides in an area not covered by the available medical plans. Retirees and surviving spouses/domestic partners receive medical subsidies based on service years and service credit. The dental subsidies are provided to the retirees only, based on service years and service credit. The maximum subsidies are set annually by the Board. Effective February 21, 2016, healthcare benefit eligibility requirements have changed for the Members who have periods of part-time service. Such Members are now eligible to participate in the
LACERS retiree medical programs with a 10 whole years of service, even if some or all of that service was part-time, provided that the Member meets the eligibility requirements. Both Tier 1 and Tier 3 Members will be eligible for 40% of maximum medical plan premium subsidy for 1 – 10 whole years of service credit, and eligible Members earn 4% per year of service credit for their annual medical subsidy accrual after 10 years of service. Eligible spouses/domestic partners of Plan Members are entitled to the System’s postemployment healthcare benefits after the retired Member’s death. During the 2011 fiscal year, the City adopted an ordinance (“Subsidy Cap Ordinance”) to limit the maximum medical subsidy at $1,190 for those Members who retire on or after July 1, 2011; however, Members who at any time prior to retirement made additional contributions are exempted from the subsidy cap and obtain a vested right to future increases in the maximum medical subsidy at an amount not less than the dollar increase in the Kaiser two-party non-Medicare Part A and Part B premium. As of June 30, 2018, all active Tier 1 and Tier 3 Members were making the additional contributions, and therefore will not be subject to the medical subsidy cap (refer to Member Contributions of Note 2 – Retirement Plan Description on page 30). Employer Contributions
The Los Angeles City Charter Sections 1158 and 1160 require periodic employer contributions at actuarially determined rates that, expressed as percentages of annual covered payroll, are sufficient to accumulate the required assets to pay benefits when due. The required contribution rate for the Postemployment Health Care Plan for the fiscal year ended June 30, 2018, was 4.92% of projected payroll, based on the June 30, 2016 actuarial valuation. Upon closing the fiscal year 2017-18, LACERS re-calculated employer contribution rate using actual payroll incurred during the fiscal year which was smaller than projected covered payroll used by the City to make the advance payment on July 15, 2017. As a result, employer contributions for Postemployment Health Care Plan were $3,766,000 more than required, and this amount was returned to the employer as a credit toward employer contribution for fiscal year 2018-19. Based on the actual payroll, the effective rate of employer contribution for Postemployment Health Care Plan was 4.90%.
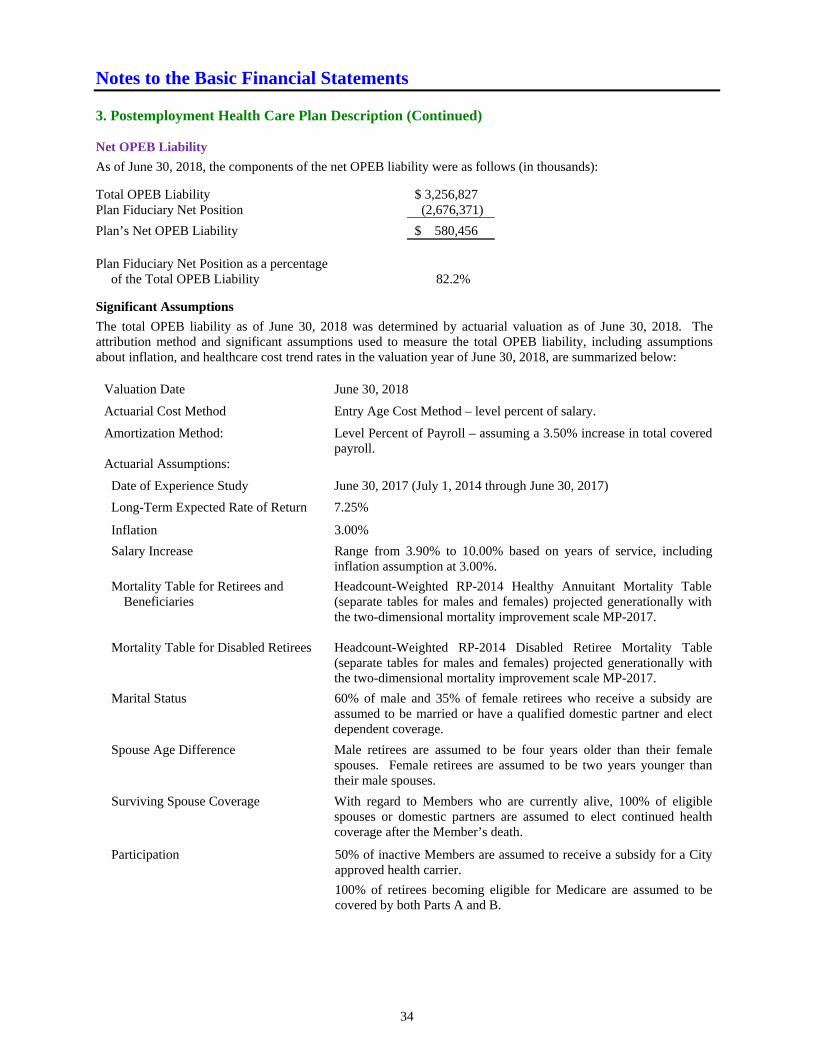
Notes to the Basic Financial Statements
34
3. Postemployment Health Care Plan Description (Continued) Net OPEB Liability
As of June 30, 2018, the components of the net OPEB liability were as follows (in thousands):
Total OPEB Liability $ 3,256,827 Plan Fiduciary Net Position (2,676,371)
Plan’s Net OPEB Liability $ 580,456 Plan Fiduciary Net Position as a percentage
of the Total OPEB Liability 82.2%
Significant Assumptions
The total OPEB liability as of June 30, 2018 was determined by actuarial valuation as of June 30, 2018. The attribution method and significant assumptions used to measure the total OPEB liability, including assumptions about inflation, and healthcare cost trend rates in the valuation year of June 30, 2018, are summarized below:
Valuation Date June 30, 2018
Actuarial Cost Method Entry Age Cost Method – level percent of salary.
Amortization Method: Level Percent of Payroll – assuming a 3.50% increase in total covered payroll.
Actuarial Assumptions:
Date of Experience Study June 30, 2017 (July 1, 2014 through June 30, 2017)
Long-Term Expected Rate of Return 7.25%
Inflation 3.00%
Salary Increase Range from 3.90% to 10.00% based on years of service, including inflation assumption at 3.00%.
Mortality Table for Retirees and Beneficiaries
Headcount-Weighted RP-2014 Healthy Annuitant Mortality Table (separate tables for males and females) projected generationally with the two-dimensional mortality improvement scale MP-2017.
Mortality Table for Disabled Retirees
Headcount-Weighted RP-2014 Disabled Retiree Mortality Table (separate tables for males and females) projected generationally with the two-dimensional mortality improvement scale MP-2017.
Marital Status 60% of male and 35% of female retirees who receive a subsidy are assumed to be married or have a qualified domestic partner and elect dependent coverage.
Spouse Age Difference Male retirees are assumed to be four years older than their female spouses. Female retirees are assumed to be two years younger than their male spouses.
Surviving Spouse Coverage With regard to Members who are currently alive, 100% of eligible spouses or domestic partners are assumed to elect continued health coverage after the Member’s death.
Participation 50% of inactive Members are assumed to receive a subsidy for a City approved health carrier.
100% of retirees becoming eligible for Medicare are assumed to be covered by both Parts A and B.
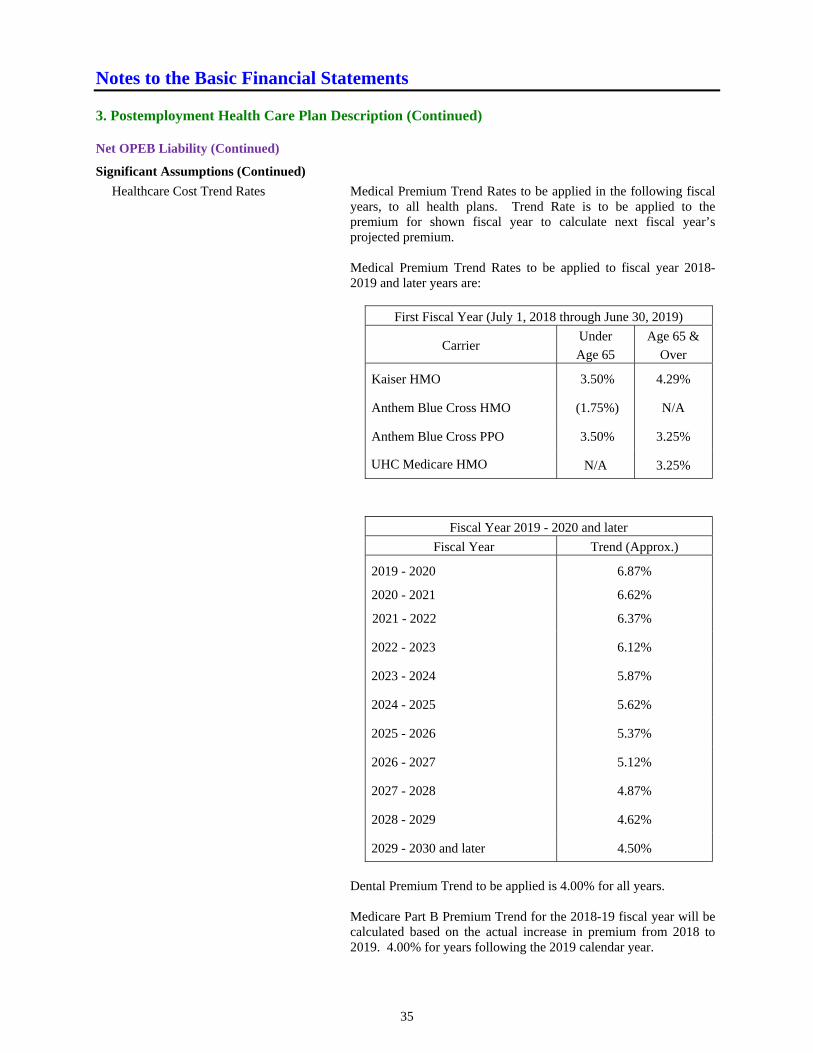
Notes to the Basic Financial Statements
35
3. Postemployment Health Care Plan Description (Continued) Net OPEB Liability (Continued)
Significant Assumptions (Continued)
Healthcare Cost Trend Rates
Medical Premium Trend Rates to be applied in the following fiscalyears, to all health plans. Trend Rate is to be applied to thepremium for shown fiscal year to calculate next fiscal year’sprojected premium. Medical Premium Trend Rates to be applied to fiscal year 2018-2019 and later years are:
First Fiscal Year (July 1, 2018 through June 30, 2019)
Carrier
Under
Age 65
Age 65 &
Over
Kaiser HMO 3.50% 4.29%
Anthem Blue Cross HMO (1.75%) N/A
Anthem Blue Cross PPO 3.50% 3.25%
UHC Medicare HMO N/A 3.25%
Fiscal Year 2019 - 2020 and later
Fiscal Year Trend (Approx.)
2019 - 2020 6.87%
2020 - 2021 6.62%
2021 - 2022 6.37%
2022 - 2023 6.12%
2023 - 2024 5.87%
2024 - 2025 5.62%
2025 - 2026 5.37%
2026 - 2027 5.12%
2027 - 2028 4.87%
2028 - 2029 4.62%
2029 - 2030 and later 4.50%
Dental Premium Trend to be applied is 4.00% for all years. Medicare Part B Premium Trend for the 2018-19 fiscal year will be calculated based on the actual increase in premium from 2018 to 2019. 4.00% for years following the 2019 calendar year.
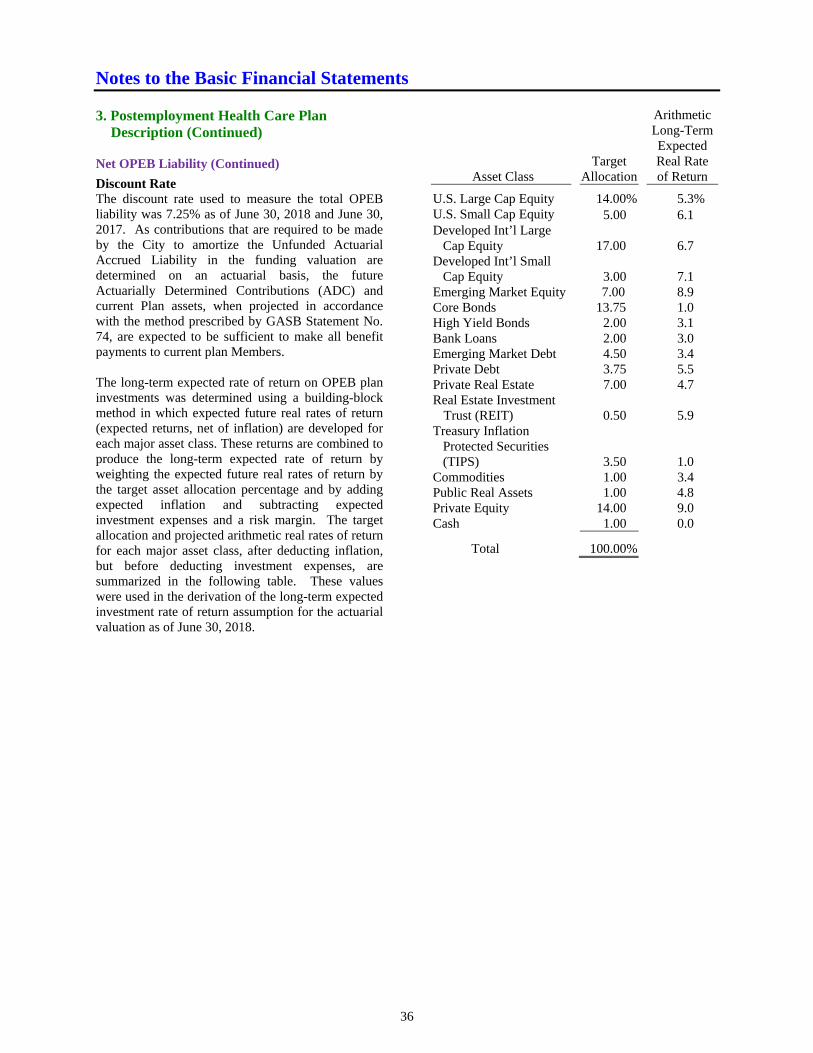
Notes to the Basic Financial Statements
36
3. Postemployment Health Care Plan
Description (Continued) Net OPEB Liability (Continued)
Discount Rate The discount rate used to measure the total OPEB liability was 7.25% as of June 30, 2018 and June 30, 2017. As contributions that are required to be made by the City to amortize the Unfunded Actuarial Accrued Liability in the funding valuation are determined on an actuarial basis, the future Actuarially Determined Contributions (ADC) and current Plan assets, when projected in accordance with the method prescribed by GASB Statement No. 74, are expected to be sufficient to make all benefit payments to current plan Members. The long-term expected rate of return on OPEB plan investments was determined using a building-block method in which expected future real rates of return (expected returns, net of inflation) are developed for each major asset class. These returns are combined to produce the long-term expected rate of return by weighting the expected future real rates of return by the target asset allocation percentage and by adding expected inflation and subtracting expected investment expenses and a risk margin. The target allocation and projected arithmetic real rates of return for each major asset class, after deducting inflation, but before deducting investment expenses, are summarized in the following table. These values were used in the derivation of the long-term expected investment rate of return assumption for the actuarial valuation as of June 30, 2018.
Asset Class Target
Allocation
Arithmetic Long-Term Expected Real Rate of Return
U.S. Large Cap Equity 14.00% 5.3% U.S. Small Cap Equity 5.00 6.1 Developed Int’l Large
Cap Equity
17.00 6.7 Developed Int’l Small
Cap Equity
3.00 7.1 Emerging Market Equity 7.00 8.9 Core Bonds 13.75 1.0 High Yield Bonds 2.00 3.1 Bank Loans 2.00 3.0 Emerging Market Debt 4.50 3.4 Private Debt 3.75 5.5 Private Real Estate 7.00 4.7 Real Estate Investment
Trust (REIT)
0.50 5.9 Treasury Inflation
Protected Securities (TIPS)
3.50 1.0 Commodities 1.00 3.4 Public Real Assets 1.00 4.8 Private Equity 14.00 9.0 Cash 1.00 0.0
Total
100.00%
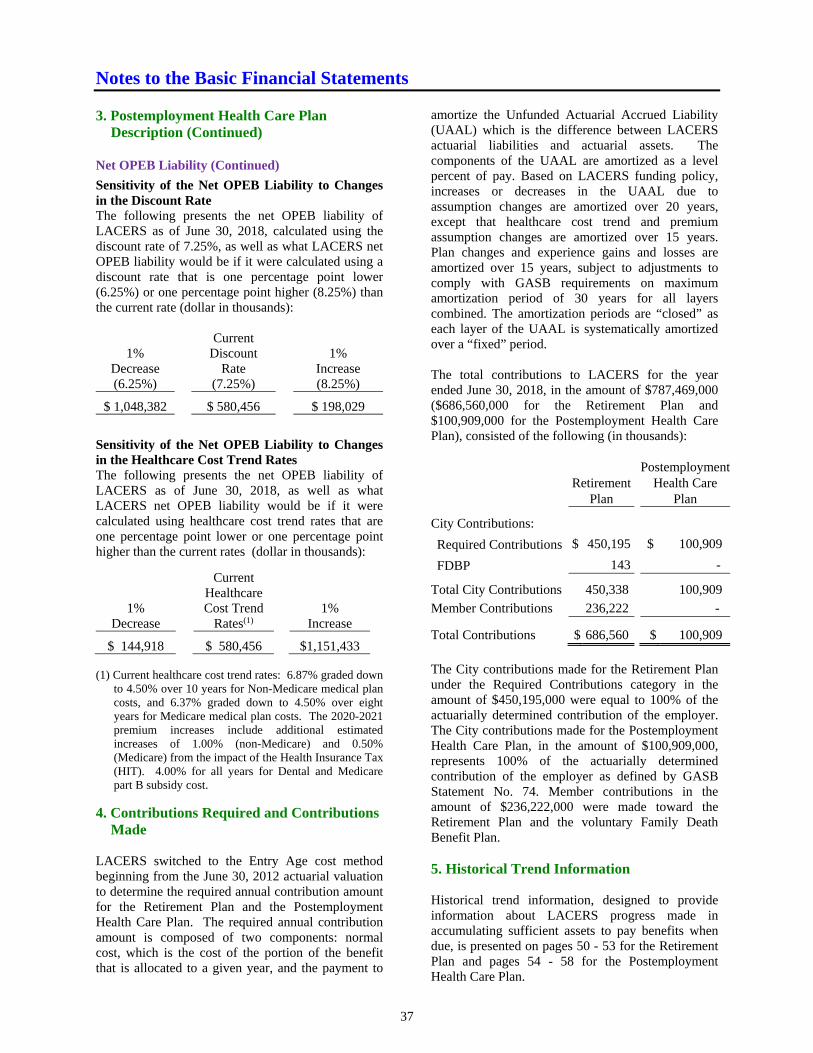
Notes to the Basic Financial Statements
37
3. Postemployment Health Care Plan
Description (Continued) Net OPEB Liability (Continued)
Sensitivity of the Net OPEB Liability to Changes in the Discount Rate The following presents the net OPEB liability of LACERS as of June 30, 2018, calculated using the discount rate of 7.25%, as well as what LACERS net OPEB liability would be if it were calculated using a discount rate that is one percentage point lower (6.25%) or one percentage point higher (8.25%) than the current rate (dollar in thousands):
1%
Decrease
Current Discount
Rate
1%
Increase (6.25%) (7.25%) (8.25%)
$ 1,048,382 $ 580,456 $ 198,029
Sensitivity of the Net OPEB Liability to Changes in the Healthcare Cost Trend Rates The following presents the net OPEB liability of LACERS as of June 30, 2018, as well as what LACERS net OPEB liability would be if it were calculated using healthcare cost trend rates that are one percentage point lower or one percentage point higher than the current rates (dollar in thousands):
1% Decrease
Current Healthcare Cost Trend
Rates(1)
1% Increase
$ 144,918 $ 580,456 $1,151,433
(1) Current healthcare cost trend rates: 6.87% graded down to 4.50% over 10 years for Non-Medicare medical plan costs, and 6.37% graded down to 4.50% over eight years for Medicare medical plan costs. The 2020-2021 premium increases include additional estimated increases of 1.00% (non-Medicare) and 0.50% (Medicare) from the impact of the Health Insurance Tax (HIT). 4.00% for all years for Dental and Medicare part B subsidy cost.
4. Contributions Required and Contributions Made
LACERS switched to the Entry Age cost method beginning from the June 30, 2012 actuarial valuation to determine the required annual contribution amount for the Retirement Plan and the Postemployment Health Care Plan. The required annual contribution amount is composed of two components: normal cost, which is the cost of the portion of the benefit that is allocated to a given year, and the payment to
amortize the Unfunded Actuarial Accrued Liability (UAAL) which is the difference between LACERS actuarial liabilities and actuarial assets. The components of the UAAL are amortized as a level percent of pay. Based on LACERS funding policy, increases or decreases in the UAAL due to assumption changes are amortized over 20 years, except that healthcare cost trend and premium assumption changes are amortized over 15 years. Plan changes and experience gains and losses are amortized over 15 years, subject to adjustments to comply with GASB requirements on maximum amortization period of 30 years for all layers combined. The amortization periods are “closed” as each layer of the UAAL is systematically amortized over a “fixed” period. The total contributions to LACERS for the year ended June 30, 2018, in the amount of $787,469,000 ($686,560,000 for the Retirement Plan and $100,909,000 for the Postemployment Health Care Plan), consisted of the following (in thousands):
Retirement
Plan
Postemployment Health Care
Plan
City Contributions:
Required Contributions $ 450,195 $ 100,909
FDBP 143 -
Total City Contributions 450,338 100,909
Member Contributions 236,222 -
Total Contributions $ 686,560 $ 100,909
The City contributions made for the Retirement Plan under the Required Contributions category in the amount of $450,195,000 were equal to 100% of the actuarially determined contribution of the employer. The City contributions made for the Postemployment Health Care Plan, in the amount of $100,909,000, represents 100% of the actuarially determined contribution of the employer as defined by GASB Statement No. 74. Member contributions in the amount of $236,222,000 were made toward the Retirement Plan and the voluntary Family Death Benefit Plan. 5. Historical Trend Information Historical trend information, designed to provide information about LACERS progress made in accumulating sufficient assets to pay benefits when due, is presented on pages 50 - 53 for the Retirement Plan and pages 54 - 58 for the Postemployment Health Care Plan.
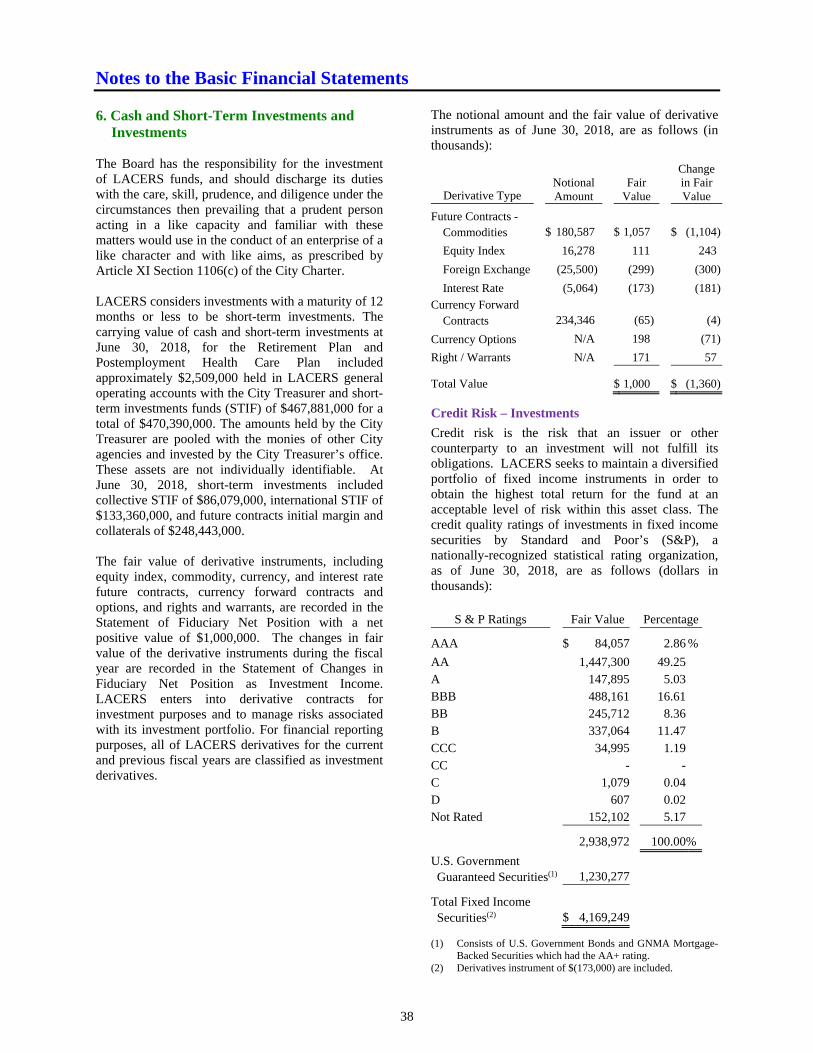
Notes to the Basic Financial Statements
38
6. Cash and Short-Term Investments and
Investments The Board has the responsibility for the investment of LACERS funds, and should discharge its duties with the care, skill, prudence, and diligence under the circumstances then prevailing that a prudent person acting in a like capacity and familiar with these matters would use in the conduct of an enterprise of a like character and with like aims, as prescribed by Article XI Section 1106(c) of the City Charter. LACERS considers investments with a maturity of 12 months or less to be short-term investments. The carrying value of cash and short-term investments at June 30, 2018, for the Retirement Plan and Postemployment Health Care Plan included approximately $2,509,000 held in LACERS general operating accounts with the City Treasurer and short-term investments funds (STIF) of $467,881,000 for a total of $470,390,000. The amounts held by the City Treasurer are pooled with the monies of other City agencies and invested by the City Treasurer’s office. These assets are not individually identifiable. At June 30, 2018, short-term investments included collective STIF of $86,079,000, international STIF of $133,360,000, and future contracts initial margin and collaterals of $248,443,000. The fair value of derivative instruments, including equity index, commodity, currency, and interest rate future contracts, currency forward contracts and options, and rights and warrants, are recorded in the Statement of Fiduciary Net Position with a net positive value of $1,000,000. The changes in fair value of the derivative instruments during the fiscal year are recorded in the Statement of Changes in Fiduciary Net Position as Investment Income. LACERS enters into derivative contracts for investment purposes and to manage risks associated with its investment portfolio. For financial reporting purposes, all of LACERS derivatives for the current and previous fiscal years are classified as investment derivatives.
The notional amount and the fair value of derivative instruments as of June 30, 2018, are as follows (in thousands):
Derivative Type Notional Amount
Fair Value
Change in Fair Value
Future Contracts - Commodities $ 180,587 $ 1,057 $ (1,104)
Equity Index 16,278 111 243
Foreign Exchange (25,500) (299) (300)
Interest Rate (5,064) (173) (181)
Currency Forward Contracts 234,346 (65) (4)
Currency Options N/A 198 (71)
Right / Warrants N/A 171 57
Total Value $ 1,000 $ (1,360)
Credit Risk – Investments
Credit risk is the risk that an issuer or other counterparty to an investment will not fulfill its obligations. LACERS seeks to maintain a diversified portfolio of fixed income instruments in order to obtain the highest total return for the fund at an acceptable level of risk within this asset class. The credit quality ratings of investments in fixed income securities by Standard and Poor’s (S&P), a nationally-recognized statistical rating organization, as of June 30, 2018, are as follows (dollars in thousands):
S & P Ratings Fair Value Percentage
AAA $ 84,057 2.86 %
AA 1,447,300 49.25A 147,895 5.03BBB 488,161 16.61BB 245,712 8.36B 337,064 11.47CCC 34,995 1.19CC - -C 1,079 0.04D 607 0.02Not Rated 152,102 5.17
2,938,972 100.00%
U.S. Government Guaranteed Securities(1) 1,230,277
Total Fixed Income Securities(2) $ 4,169,249
(1) Consists of U.S. Government Bonds and GNMA Mortgage-Backed Securities which had the AA+ rating.
(2) Derivatives instrument of $(173,000) are included.
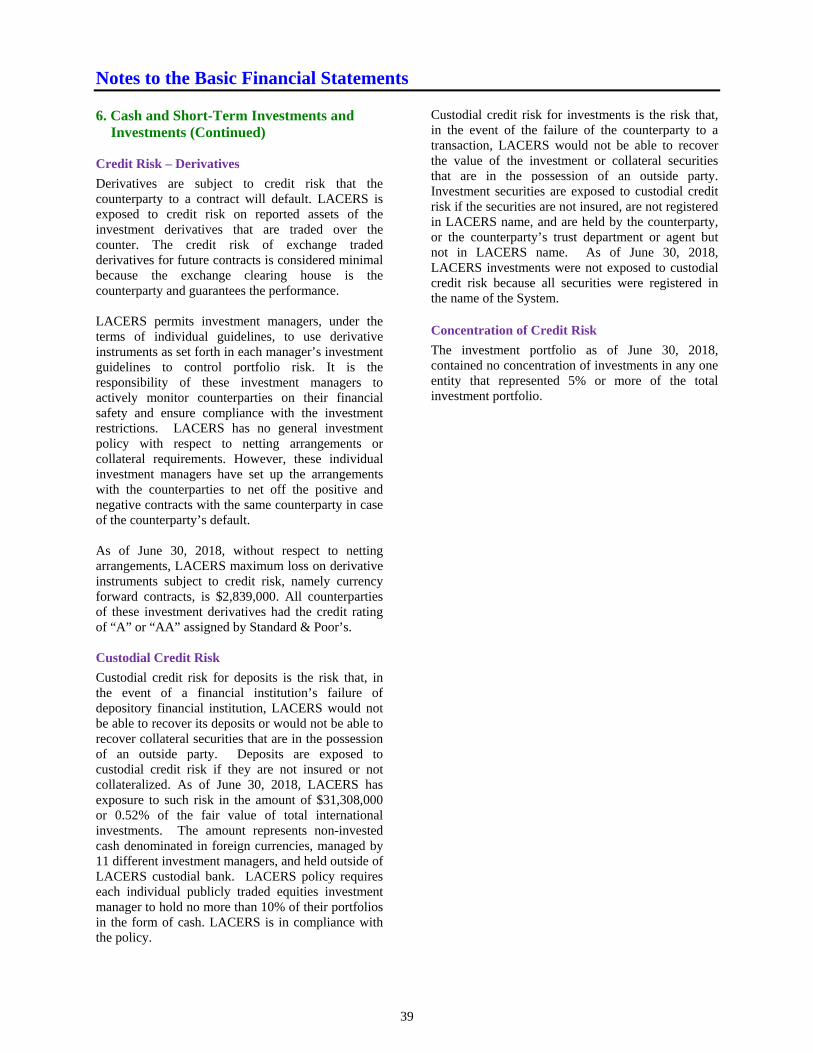
Notes to the Basic Financial Statements
39
6. Cash and Short-Term Investments and
Investments (Continued) Credit Risk – Derivatives
Derivatives are subject to credit risk that the counterparty to a contract will default. LACERS is exposed to credit risk on reported assets of the investment derivatives that are traded over the counter. The credit risk of exchange traded derivatives for future contracts is considered minimal because the exchange clearing house is the counterparty and guarantees the performance. LACERS permits investment managers, under the terms of individual guidelines, to use derivative instruments as set forth in each manager’s investment guidelines to control portfolio risk. It is the responsibility of these investment managers to actively monitor counterparties on their financial safety and ensure compliance with the investment restrictions. LACERS has no general investment policy with respect to netting arrangements or collateral requirements. However, these individual investment managers have set up the arrangements with the counterparties to net off the positive and negative contracts with the same counterparty in case of the counterparty’s default. As of June 30, 2018, without respect to netting arrangements, LACERS maximum loss on derivative instruments subject to credit risk, namely currency forward contracts, is $2,839,000. All counterparties of these investment derivatives had the credit rating of “A” or “AA” assigned by Standard & Poor’s. Custodial Credit Risk
Custodial credit risk for deposits is the risk that, in the event of a financial institution’s failure of depository financial institution, LACERS would not be able to recover its deposits or would not be able to recover collateral securities that are in the possession of an outside party. Deposits are exposed to custodial credit risk if they are not insured or not collateralized. As of June 30, 2018, LACERS has exposure to such risk in the amount of $31,308,000 or 0.52% of the fair value of total international investments. The amount represents non-invested cash denominated in foreign currencies, managed by 11 different investment managers, and held outside of LACERS custodial bank. LACERS policy requires each individual publicly traded equities investment manager to hold no more than 10% of their portfolios in the form of cash. LACERS is in compliance with the policy.
Custodial credit risk for investments is the risk that, in the event of the failure of the counterparty to a transaction, LACERS would not be able to recover the value of the investment or collateral securities that are in the possession of an outside party. Investment securities are exposed to custodial credit risk if the securities are not insured, are not registered in LACERS name, and are held by the counterparty, or the counterparty’s trust department or agent but not in LACERS name. As of June 30, 2018, LACERS investments were not exposed to custodial credit risk because all securities were registered in the name of the System. Concentration of Credit Risk
The investment portfolio as of June 30, 2018, contained no concentration of investments in any one entity that represented 5% or more of the total investment portfolio.
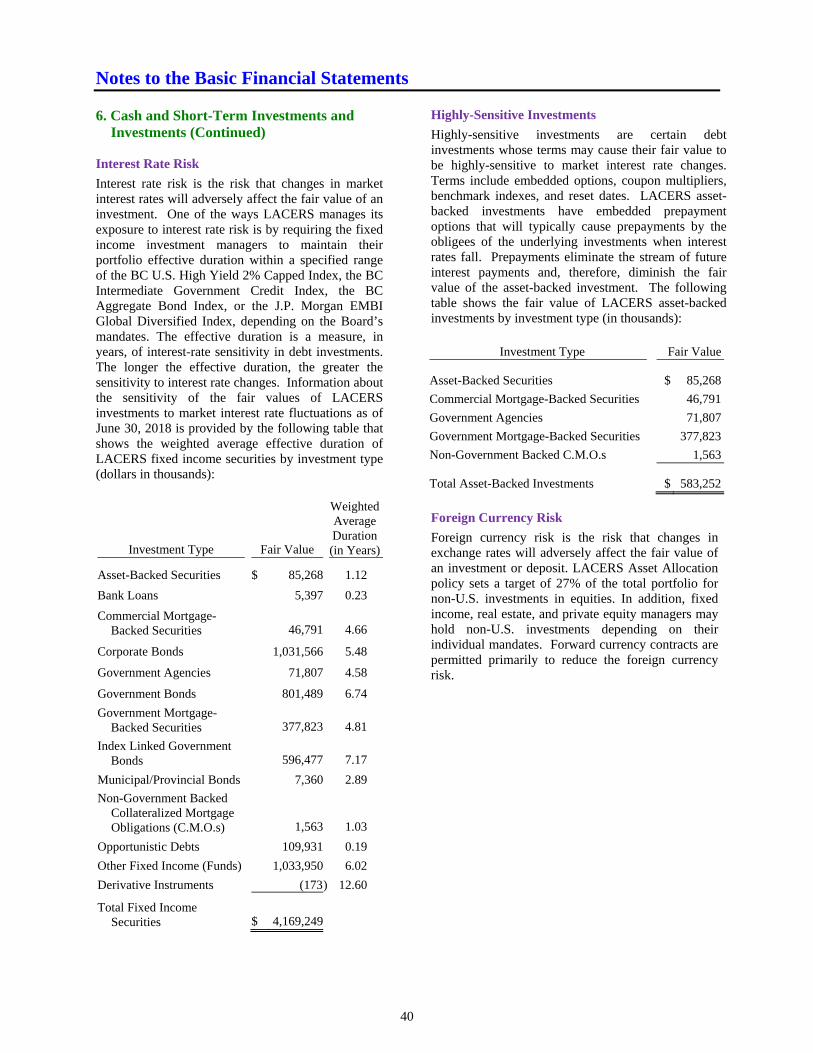
Notes to the Basic Financial Statements
40
6. Cash and Short-Term Investments and
Investments (Continued) Interest Rate Risk
Interest rate risk is the risk that changes in market interest rates will adversely affect the fair value of an investment. One of the ways LACERS manages its exposure to interest rate risk is by requiring the fixed income investment managers to maintain their portfolio effective duration within a specified range of the BC U.S. High Yield 2% Capped Index, the BC Intermediate Government Credit Index, the BC Aggregate Bond Index, or the J.P. Morgan EMBI Global Diversified Index, depending on the Board’s mandates. The effective duration is a measure, in years, of interest-rate sensitivity in debt investments. The longer the effective duration, the greater the sensitivity to interest rate changes. Information about the sensitivity of the fair values of LACERS investments to market interest rate fluctuations as of June 30, 2018 is provided by the following table that shows the weighted average effective duration of LACERS fixed income securities by investment type (dollars in thousands):
Investment Type Fair Value
Weighted Average Duration (in Years)
Asset-Backed Securities $ 85,268 1.12
Bank Loans 5,397 0.23
Commercial Mortgage-Backed Securities 46,791 4.66
Corporate Bonds 1,031,566 5.48
Government Agencies 71,807 4.58
Government Bonds 801,489 6.74
Government Mortgage- Backed Securities 377,823 4.81
Index Linked Government Bonds 596,477 7.17
Municipal/Provincial Bonds 7,360 2.89
Non-Government Backed Collateralized Mortgage Obligations (C.M.O.s) 1,563 1.03
Opportunistic Debts 109,931 0.19
Other Fixed Income (Funds) 1,033,950 6.02
Derivative Instruments (173 ) 12.60
Total Fixed Income Securities $ 4,169,249
Highly-Sensitive Investments
Highly-sensitive investments are certain debt investments whose terms may cause their fair value to be highly-sensitive to market interest rate changes. Terms include embedded options, coupon multipliers, benchmark indexes, and reset dates. LACERS asset-backed investments have embedded prepayment options that will typically cause prepayments by the obligees of the underlying investments when interest rates fall. Prepayments eliminate the stream of future interest payments and, therefore, diminish the fair value of the asset-backed investment. The following table shows the fair value of LACERS asset-backed investments by investment type (in thousands):
Investment Type Fair Value
Asset-Backed Securities $ 85,268
Commercial Mortgage-Backed Securities 46,791
Government Agencies 71,807
Government Mortgage-Backed Securities 377,823
Non-Government Backed C.M.O.s 1,563
Total Asset-Backed Investments $ 583,252
Foreign Currency Risk
Foreign currency risk is the risk that changes in exchange rates will adversely affect the fair value of an investment or deposit. LACERS Asset Allocation policy sets a target of 27% of the total portfolio for non-U.S. investments in equities. In addition, fixed income, real estate, and private equity managers may hold non-U.S. investments depending on their individual mandates. Forward currency contracts are permitted primarily to reduce the foreign currency risk.
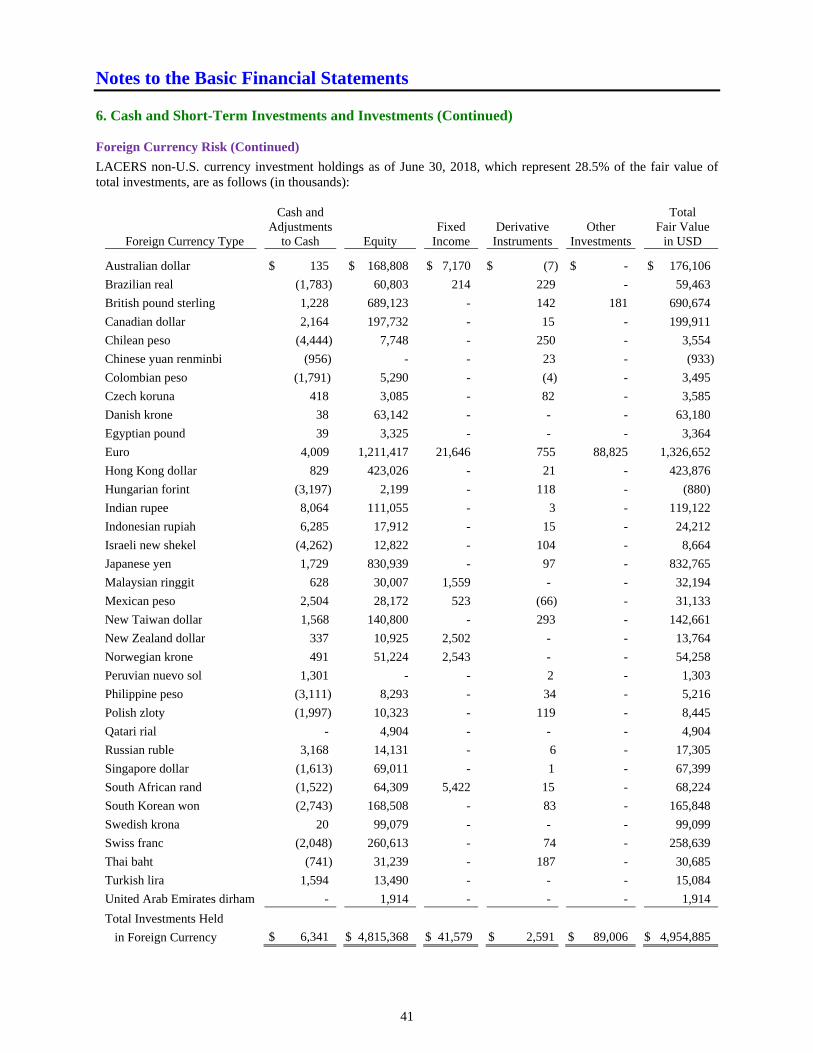
Notes to the Basic Financial Statements
41
6. Cash and Short-Term Investments and Investments (Continued) Foreign Currency Risk (Continued)
LACERS non-U.S. currency investment holdings as of June 30, 2018, which represent 28.5% of the fair value of total investments, are as follows (in thousands):
Cash and Total Adjustments Fixed Derivative Other Fair Value
Foreign Currency Type to Cash Equity Income Instruments Investments in USD
Australian dollar $ 135 $ 168,808 $ 7,170 $ (7) $ - $ 176,106
Brazilian real (1,783) 60,803 214 229 - 59,463
British pound sterling 1,228 689,123 - 142 181 690,674
Canadian dollar 2,164 197,732 - 15 - 199,911
Chilean peso (4,444) 7,748 - 250 - 3,554
Chinese yuan renminbi (956) - - 23 - (933)
Colombian peso (1,791) 5,290 - (4) - 3,495
Czech koruna 418 3,085 - 82 - 3,585
Danish krone 38 63,142 - - - 63,180
Egyptian pound 39 3,325 - - - 3,364
Euro 4,009 1,211,417 21,646 755 88,825 1,326,652
Hong Kong dollar 829 423,026 - 21 - 423,876
Hungarian forint (3,197) 2,199 - 118 - (880)
Indian rupee 8,064 111,055 - 3 - 119,122
Indonesian rupiah 6,285 17,912 - 15 - 24,212
Israeli new shekel (4,262) 12,822 - 104 - 8,664
Japanese yen 1,729 830,939 - 97 - 832,765
Malaysian ringgit 628 30,007 1,559 - - 32,194
Mexican peso 2,504 28,172 523 (66) - 31,133
New Taiwan dollar 1,568 140,800 - 293 - 142,661
New Zealand dollar 337 10,925 2,502 - - 13,764
Norwegian krone 491 51,224 2,543 - - 54,258
Peruvian nuevo sol 1,301 - - 2 - 1,303
Philippine peso (3,111) 8,293 - 34 - 5,216
Polish zloty (1,997) 10,323 - 119 - 8,445
Qatari rial - 4,904 - - - 4,904
Russian ruble 3,168 14,131 - 6 - 17,305
Singapore dollar (1,613) 69,011 - 1 - 67,399
South African rand (1,522) 64,309 5,422 15 - 68,224
South Korean won (2,743) 168,508 - 83 - 165,848
Swedish krona 20 99,079 - - - 99,099
Swiss franc (2,048) 260,613 - 74 - 258,639
Thai baht (741) 31,239 - 187 - 30,685
Turkish lira 1,594 13,490 - - - 15,084
United Arab Emirates dirham - 1,914 - - - 1,914
Total Investments Held
in Foreign Currency $ 6,341 $ 4,815,368 $ 41,579 $ 2,591 $ 89,006 $ 4,954,885
Notes to the Basic Financial Statements
42
6. Cash and Short-Term Investments and Investments (Continued) Fair Value Measurements
LACERS follows GASB Statement No. 72 (GASB 72), Fair Value Measurements and Application. GASB 72 addresses accounting and financial reporting issues related to fair value measurements and disclosures. Fair value is the price that would be received to sell an asset or paid to transfer a liability in an orderly transaction between market participants in either a government’s principal or the most advantageous market at the measurement date. The System’s investments are measured and reported within the fair value hierarchy established by US GAAP. The fair value hierarchy, which has three levels, is based on the valuation inputs used to measure an asset’s fair value and gives the highest priority to unadjusted quoted prices in active markets for identical assets or liabilities (Level 1 measurements) and the lowest priority to unobservable inputs (Level 3 measurements). The three levels of the fair value hierarchy are as follows:
Level 1 inputs are quoted prices (unadjusted) for identical assets or liabilities in active markets. Level 2 inputs are inputs other than quoted prices included within Level 1 that are observable for an asset or liability, either directly or indirectly. Inputs to the valuation include: 1) quoted prices for similar assets or liabilities in active markets; 2) quoted prices for identical or similar assets or liabilities in markets that are not active; 3) inputs other than quoted prices that are observable for the asset or liability; and 4) market-corroborated inputs. Level 3 inputs are unobservable inputs for an asset or liability where there are little market activities. The inputs into the determination of fair value are based upon the best information in the circumstances and may require management judgment or estimation.
Schedule of Investments by Fair Value Hierarchy Equity securities classified in Level 1 of the fair value hierarchy are valued using prices quoted in active markets for those securities. Debt and equity securities classified in Level 2 or 3 of the fair value hierarchy are valued using a matrix pricing technique based on the availability of the market price, the pricing source and type, and the country of incorporation of the securities. The hierarchy levels are determined based on the level of corroborative information obtained from other market sources to assert that the prices provided represent observable data. Private equity funds classified in Level 3 of the fair value hierarchy are valued based on the availability of market price of the underlying assets, and using either a discounted cash flow or Comparable Company Analysis with internal assumptions. Real estate funds classified in Level 2 or 3 of the fair value hierarchy are valued based on periodic appraisals in accordance with industry practice. The exchange traded Future Contracts classified in Level 1 of the fair value hierarchy are valued using a daily settlement when available or as a daily mark to market. The Foreign Exchange Contracts classified in Level 2 of the fair value hierarchy are valued using independent pricing services including London Close mid-evaluation, WM/Reuters Company, Bloomberg, and Thomson Reuters. Certain investments which do not have a readily determinable fair value have been valued at the Net Asset Value (NAV) per share (or its equivalent) provided that the NAV is calculated and used as a practical expedient to estimate fair value in accordance with US GAAP requirements. These investments are not categorized within the fair value hierarchy but disclosed in the Investments Measured at the NAV on page 43.
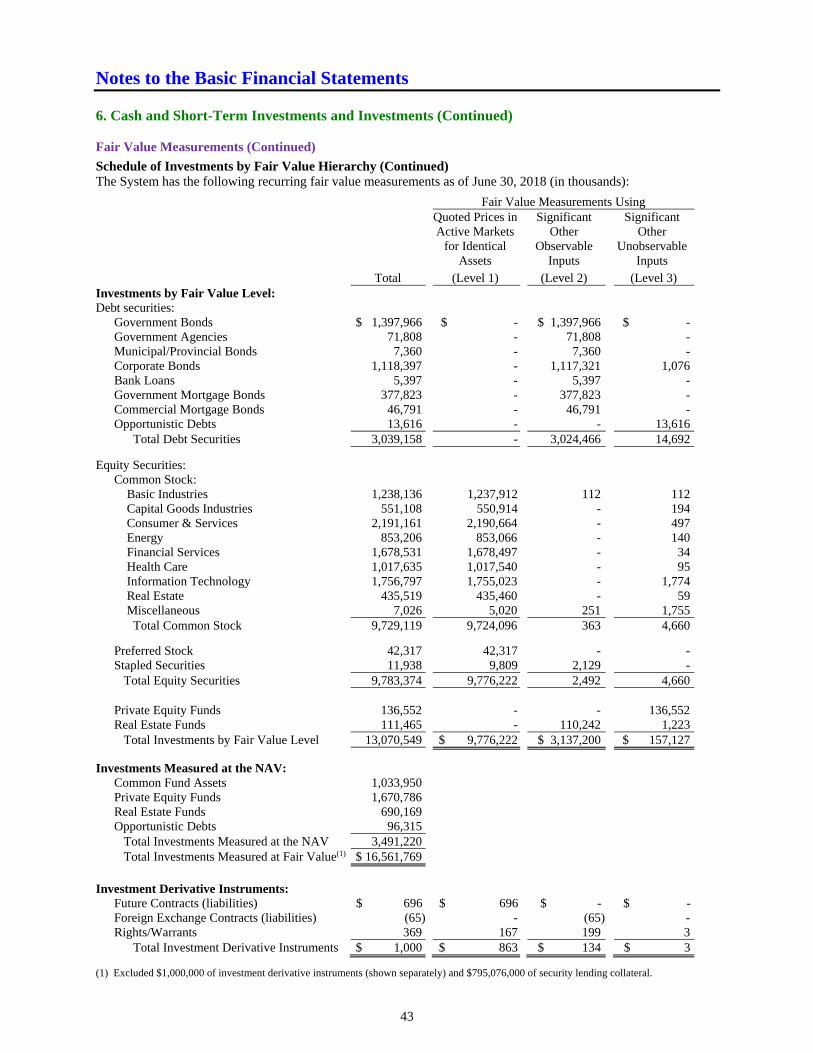
Notes to the Basic Financial Statements
43
6. Cash and Short-Term Investments and Investments (Continued) Fair Value Measurements (Continued)
Schedule of Investments by Fair Value Hierarchy (Continued) The System has the following recurring fair value measurements as of June 30, 2018 (in thousands):
(1) Excluded $1,000,000 of investment derivative instruments (shown separately) and $795,076,000 of security lending collateral.
Fair Value Measurements Using Quoted Prices in Active Markets
for Identical Assets
Significant Other
Observable Inputs
Significant Other
Unobservable Inputs
Total (Level 1) (Level 2) (Level 3) Investments by Fair Value Level: Debt securities:
Government Bonds $ 1,397,966 $ - $ 1,397,966 $ -Government Agencies 71,808 - 71,808 -Municipal/Provincial Bonds 7,360 - 7,360 -Corporate Bonds 1,118,397 - 1,117,321 1,076Bank Loans 5,397 - 5,397 -Government Mortgage Bonds 377,823 - 377,823 -Commercial Mortgage Bonds 46,791 - 46,791 -Opportunistic Debts 13,616 - - 13,616 Total Debt Securities 3,039,158 - 3,024,466 14,692
Equity Securities: Common Stock: Basic Industries 1,238,136 1,237,912 112 112 Capital Goods Industries 551,108 550,914 - 194 Consumer & Services 2,191,161 2,190,664 - 497 Energy 853,206 853,066 - 140 Financial Services 1,678,531 1,678,497 - 34 Health Care 1,017,635 1,017,540 - 95 Information Technology 1,756,797 1,755,023 - 1,774
Real Estate 435,519 435,460 - 59 Miscellaneous 7,026 5,020 251 1,755 Total Common Stock 9,729,119 9,724,096 363 4,660
Preferred Stock 42,317 42,317 - -Stapled Securities 11,938 9,809 2,129 - Total Equity Securities 9,783,374 9,776,222 2,492 4,660
Private Equity Funds 136,552 - - 136,552
Real Estate Funds 111,465 - 110,242 1,223 Total Investments by Fair Value Level 13,070,549 $ 9,776,222 $ 3,137,200 $ 157,127
Investments Measured at the NAV:
Common Fund Assets 1,033,950 Private Equity Funds 1,670,786 Real Estate Funds 690,169 Opportunistic Debts 96,315 Total Investments Measured at the NAV 3,491,220 Total Investments Measured at Fair Value(1) $ 16,561,769
Investment Derivative Instruments:
Future Contracts (liabilities) $ 696 $ 696 $ - $ -Foreign Exchange Contracts (liabilities) (65) - (65) -Rights/Warrants 369 167 199 3 Total Investment Derivative Instruments $ 1,000 $ 863 $ 134 $ 3
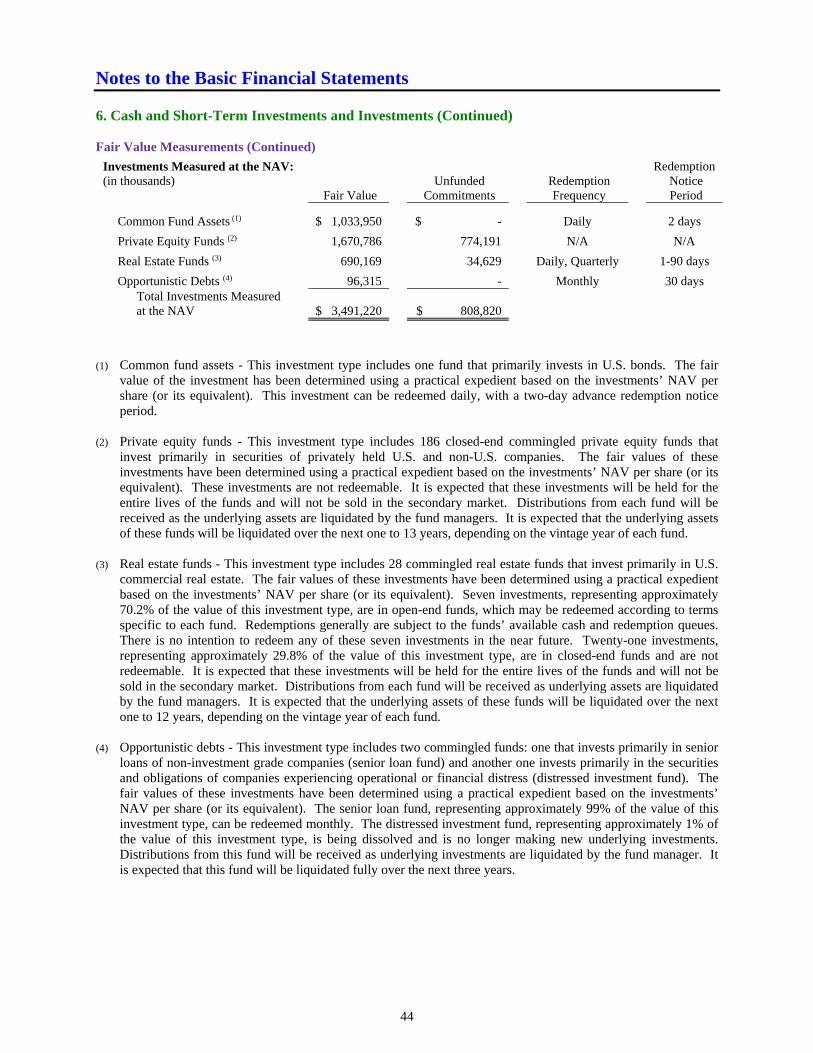
Notes to the Basic Financial Statements
44
6. Cash and Short-Term Investments and Investments (Continued) Fair Value Measurements (Continued)
Investments Measured at the NAV: Redemption (in thousands) Unfunded Redemption Notice
Fair Value Commitments Frequency Period
Common Fund Assets (1) $ 1,033,950 $ - Daily 2 days
Private Equity Funds (2) 1,670,786 774,191 N/A N/A
Real Estate Funds (3) 690,169 34,629 Daily, Quarterly 1-90 days
Opportunistic Debts (4) 96,315 - Monthly 30 days Total Investments Measured
at the NAV $ 3,491,220 $ 808,820
(1) Common fund assets - This investment type includes one fund that primarily invests in U.S. bonds. The fair
value of the investment has been determined using a practical expedient based on the investments’ NAV per share (or its equivalent). This investment can be redeemed daily, with a two-day advance redemption notice period.
(2) Private equity funds - This investment type includes 186 closed-end commingled private equity funds that invest primarily in securities of privately held U.S. and non-U.S. companies. The fair values of these investments have been determined using a practical expedient based on the investments’ NAV per share (or its equivalent). These investments are not redeemable. It is expected that these investments will be held for the entire lives of the funds and will not be sold in the secondary market. Distributions from each fund will be received as the underlying assets are liquidated by the fund managers. It is expected that the underlying assets of these funds will be liquidated over the next one to 13 years, depending on the vintage year of each fund.
(3) Real estate funds - This investment type includes 28 commingled real estate funds that invest primarily in U.S. commercial real estate. The fair values of these investments have been determined using a practical expedient based on the investments’ NAV per share (or its equivalent). Seven investments, representing approximately 70.2% of the value of this investment type, are in open-end funds, which may be redeemed according to terms specific to each fund. Redemptions generally are subject to the funds’ available cash and redemption queues. There is no intention to redeem any of these seven investments in the near future. Twenty-one investments, representing approximately 29.8% of the value of this investment type, are in closed-end funds and are not redeemable. It is expected that these investments will be held for the entire lives of the funds and will not be sold in the secondary market. Distributions from each fund will be received as underlying assets are liquidated by the fund managers. It is expected that the underlying assets of these funds will be liquidated over the next one to 12 years, depending on the vintage year of each fund.
(4) Opportunistic debts - This investment type includes two commingled funds: one that invests primarily in senior loans of non-investment grade companies (senior loan fund) and another one invests primarily in the securities and obligations of companies experiencing operational or financial distress (distressed investment fund). The fair values of these investments have been determined using a practical expedient based on the investments’ NAV per share (or its equivalent). The senior loan fund, representing approximately 99% of the value of this investment type, can be redeemed monthly. The distressed investment fund, representing approximately 1% of the value of this investment type, is being dissolved and is no longer making new underlying investments. Distributions from this fund will be received as underlying investments are liquidated by the fund manager. It is expected that this fund will be liquidated fully over the next three years.
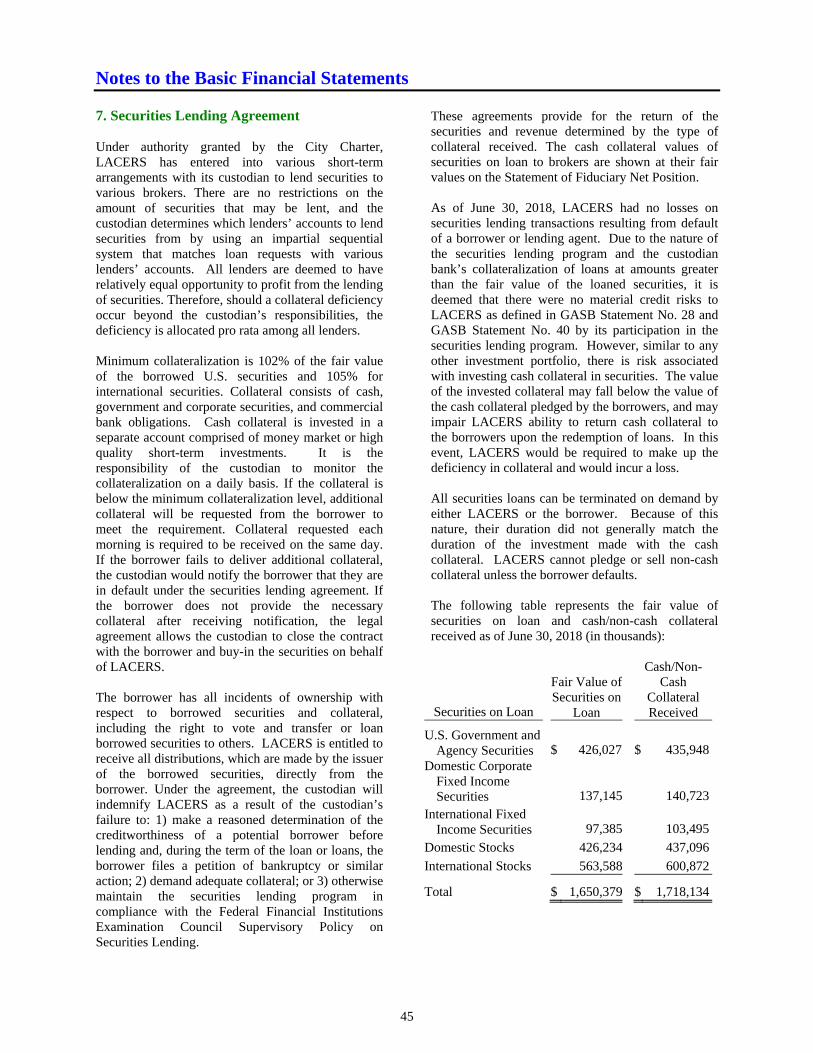
Notes to the Basic Financial Statements
45
7. Securities Lending Agreement Under authority granted by the City Charter, LACERS has entered into various short-term arrangements with its custodian to lend securities to various brokers. There are no restrictions on the amount of securities that may be lent, and the custodian determines which lenders’ accounts to lend securities from by using an impartial sequential system that matches loan requests with various lenders’ accounts. All lenders are deemed to have relatively equal opportunity to profit from the lending of securities. Therefore, should a collateral deficiency occur beyond the custodian’s responsibilities, the deficiency is allocated pro rata among all lenders. Minimum collateralization is 102% of the fair value of the borrowed U.S. securities and 105% for international securities. Collateral consists of cash, government and corporate securities, and commercial bank obligations. Cash collateral is invested in a separate account comprised of money market or high quality short-term investments. It is the responsibility of the custodian to monitor the collateralization on a daily basis. If the collateral is below the minimum collateralization level, additional collateral will be requested from the borrower to meet the requirement. Collateral requested each morning is required to be received on the same day. If the borrower fails to deliver additional collateral, the custodian would notify the borrower that they are in default under the securities lending agreement. If the borrower does not provide the necessary collateral after receiving notification, the legal agreement allows the custodian to close the contract with the borrower and buy-in the securities on behalf of LACERS. The borrower has all incidents of ownership with respect to borrowed securities and collateral, including the right to vote and transfer or loan borrowed securities to others. LACERS is entitled to receive all distributions, which are made by the issuer of the borrowed securities, directly from the borrower. Under the agreement, the custodian will indemnify LACERS as a result of the custodian’s failure to: 1) make a reasoned determination of the creditworthiness of a potential borrower before lending and, during the term of the loan or loans, the borrower files a petition of bankruptcy or similar action; 2) demand adequate collateral; or 3) otherwise maintain the securities lending program in compliance with the Federal Financial Institutions Examination Council Supervisory Policy on Securities Lending.
These agreements provide for the return of the securities and revenue determined by the type of collateral received. The cash collateral values of securities on loan to brokers are shown at their fair values on the Statement of Fiduciary Net Position. As of June 30, 2018, LACERS had no losses on securities lending transactions resulting from default of a borrower or lending agent. Due to the nature of the securities lending program and the custodian bank’s collateralization of loans at amounts greater than the fair value of the loaned securities, it is deemed that there were no material credit risks to LACERS as defined in GASB Statement No. 28 and GASB Statement No. 40 by its participation in the securities lending program. However, similar to any other investment portfolio, there is risk associated with investing cash collateral in securities. The value of the invested collateral may fall below the value of the cash collateral pledged by the borrowers, and may impair LACERS ability to return cash collateral to the borrowers upon the redemption of loans. In this event, LACERS would be required to make up the deficiency in collateral and would incur a loss. All securities loans can be terminated on demand by either LACERS or the borrower. Because of this nature, their duration did not generally match the duration of the investment made with the cash collateral. LACERS cannot pledge or sell non-cash collateral unless the borrower defaults. The following table represents the fair value of securities on loan and cash/non-cash collateral received as of June 30, 2018 (in thousands):
Securities on Loan
Fair Value of Securities on
Loan
Cash/Non-Cash
Collateral Received
U.S. Government and Agency Securities $
426,027 $ 435,948Domestic Corporate
Fixed Income Securities 137,145 140,723
International Fixed Income Securities 97,385 103,495
Domestic Stocks 426,234 437,096
International Stocks 563,588 600,872
Total $ 1,650,379 $ 1,718,134
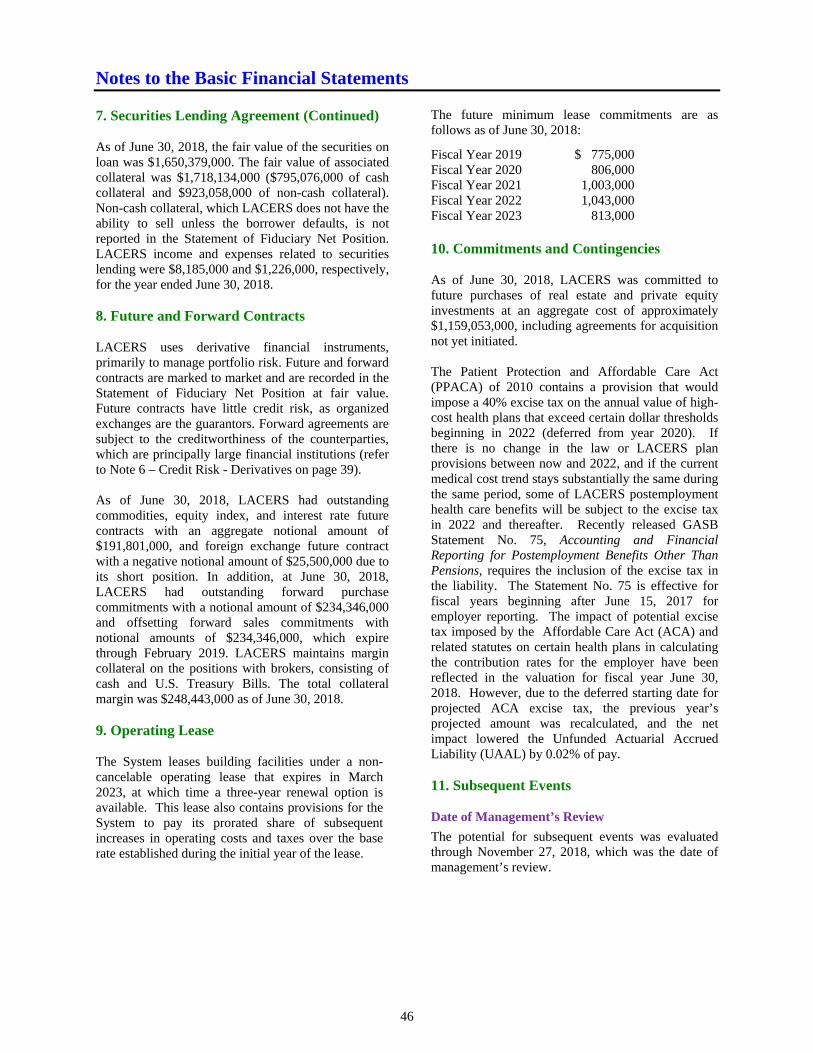
Notes to the Basic Financial Statements
46
7. Securities Lending Agreement (Continued) As of June 30, 2018, the fair value of the securities on loan was $1,650,379,000. The fair value of associated collateral was $1,718,134,000 ($795,076,000 of cash collateral and $923,058,000 of non-cash collateral). Non-cash collateral, which LACERS does not have the ability to sell unless the borrower defaults, is not reported in the Statement of Fiduciary Net Position. LACERS income and expenses related to securities lending were $8,185,000 and $1,226,000, respectively, for the year ended June 30, 2018. 8. Future and Forward Contracts LACERS uses derivative financial instruments, primarily to manage portfolio risk. Future and forward contracts are marked to market and are recorded in the Statement of Fiduciary Net Position at fair value. Future contracts have little credit risk, as organized exchanges are the guarantors. Forward agreements are subject to the creditworthiness of the counterparties, which are principally large financial institutions (refer to Note 6 – Credit Risk - Derivatives on page 39). As of June 30, 2018, LACERS had outstanding commodities, equity index, and interest rate future contracts with an aggregate notional amount of $191,801,000, and foreign exchange future contract with a negative notional amount of $25,500,000 due to its short position. In addition, at June 30, 2018, LACERS had outstanding forward purchase commitments with a notional amount of $234,346,000 and offsetting forward sales commitments with notional amounts of $234,346,000, which expire through February 2019. LACERS maintains margin collateral on the positions with brokers, consisting of cash and U.S. Treasury Bills. The total collateral margin was $248,443,000 as of June 30, 2018. 9. Operating Lease The System leases building facilities under a non-cancelable operating lease that expires in March 2023, at which time a three-year renewal option is available. This lease also contains provisions for the System to pay its prorated share of subsequent increases in operating costs and taxes over the base rate established during the initial year of the lease.
The future minimum lease commitments are as follows as of June 30, 2018:
Fiscal Year 2019 $ 775,000 Fiscal Year 2020 806,000 Fiscal Year 2021 1,003,000 Fiscal Year 2022 1,043,000 Fiscal Year 2023 813,000 10. Commitments and Contingencies As of June 30, 2018, LACERS was committed to future purchases of real estate and private equity investments at an aggregate cost of approximately $1,159,053,000, including agreements for acquisition not yet initiated. The Patient Protection and Affordable Care Act (PPACA) of 2010 contains a provision that would impose a 40% excise tax on the annual value of high-cost health plans that exceed certain dollar thresholds beginning in 2022 (deferred from year 2020). If there is no change in the law or LACERS plan provisions between now and 2022, and if the current medical cost trend stays substantially the same during the same period, some of LACERS postemployment health care benefits will be subject to the excise tax in 2022 and thereafter. Recently released GASB Statement No. 75, Accounting and Financial Reporting for Postemployment Benefits Other Than Pensions, requires the inclusion of the excise tax in the liability. The Statement No. 75 is effective for fiscal years beginning after June 15, 2017 for employer reporting. The impact of potential excise tax imposed by the Affordable Care Act (ACA) and related statutes on certain health plans in calculating the contribution rates for the employer have been reflected in the valuation for fiscal year June 30, 2018. However, due to the deferred starting date for projected ACA excise tax, the previous year’s projected amount was recalculated, and the net impact lowered the Unfunded Actuarial Accrued Liability (UAAL) by 0.02% of pay. 11. Subsequent Events Date of Management’s Review
The potential for subsequent events was evaluated through November 27, 2018, which was the date of management’s review.
Notes to the Basic Financial Statements
47
11. Subsequent Events (Continued) Establishment of LACERS Health Care Fund
On November 9, 2018, the City Council approved Ordinance No. 185829 to amend Article 1 of Chapter 11, Division 4 of the Los Angeles Administrative Code to establish the LACERS Health Care Fund for the sole purpose of funding the retiree healthcare benefits for eligible LACERS retirees and beneficiaries. The City and the Board of LACERS shall enter into a written trust agreement for the LACERS Health Care Fund sometime on or before July 15, 2019. The LACERS Health Care Fund shall provide an alternative funding mechanism, in addition to or in lieu of the existing 401 (h) account described in LAAC Section 4.1102 for funding benefits under the health and welfare programs. The LACERS Health Care Fund is intended to qualify for federal tax exemption under Section 115 of the Internal Revenue Code. Because health benefits paid out of the LACERS Health Care Fund are not required to be subordinate to the Plan retirement benefits, the LACERS Health Care Fund would not become taxable if the Plan health benefits surpass the 25% threshold. Second, the LACERS Health Care Fund gives LACERS more flexibility to invest premium surpluses to provide for smoothing should healthcare premiums considerably increase in the future. Currently, the Health Care Coverage Account cannot receive full refunds of excess premiums from insurance providers. However, the LACERS Health Care Fund can receive full premium surplus refunds from insurance providers; therefore, the System can invest these funds at a higher rate of return than the insurance providers’ reserve account interest rate. Establishment of Self-Funded LACERS Dental PPO Plan
Effective January 1, 2019, LACERS existing fully-insured Delta Dental PPO Plan will be replaced with LACERS self-funded Delta Dental PPO Plan. Although, Delta will continue to administer the plan for a fee, LACERS will set and collect premiums from enrolled Members and pay billed claims to Delta. With this arrangement, LACERS bears financial risk if claims cost exceed collected premiums. This change does not affect the maximum dental subsidy amount to the eligible retired Members.

This page intentionally left blank.

REQUIRED SUPPLEMENTARY INFORMATION
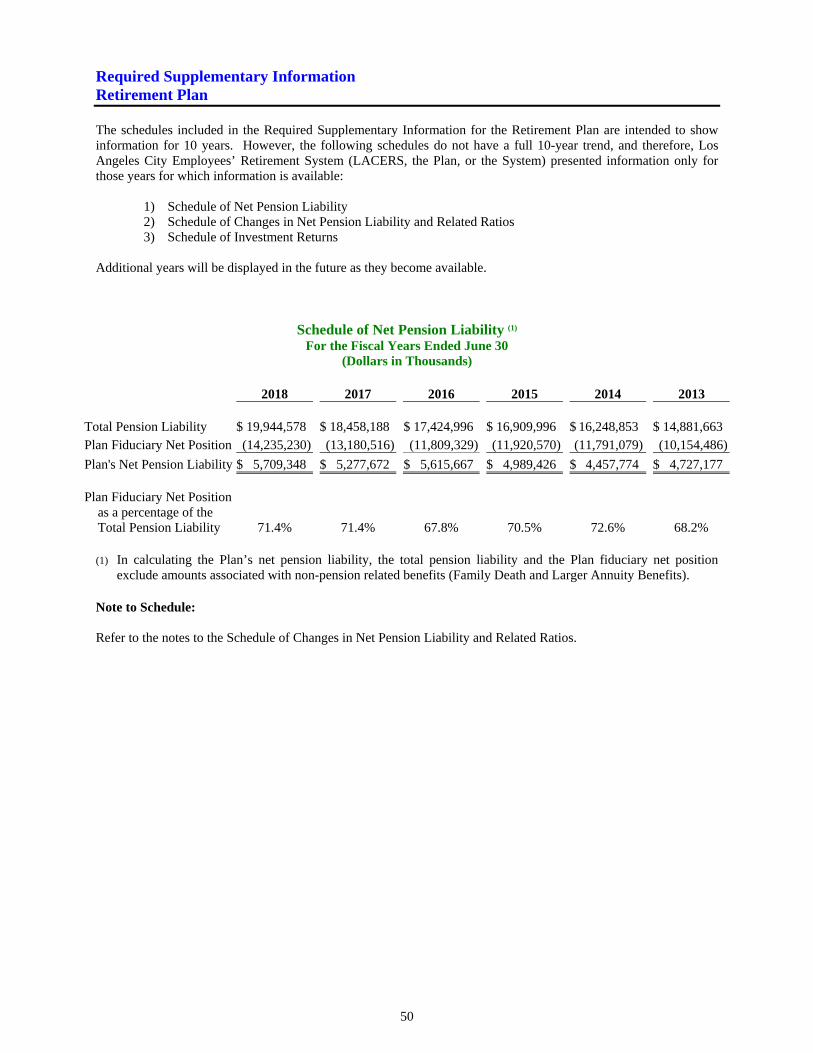
Required Supplementary Information Retirement Plan
50
The schedules included in the Required Supplementary Information for the Retirement Plan are intended to show information for 10 years. However, the following schedules do not have a full 10-year trend, and therefore, Los Angeles City Employees’ Retirement System (LACERS, the Plan, or the System) presented information only for those years for which information is available:
1) Schedule of Net Pension Liability 2) Schedule of Changes in Net Pension Liability and Related Ratios 3) Schedule of Investment Returns
Additional years will be displayed in the future as they become available.
Schedule of Net Pension Liability (1) For the Fiscal Years Ended June 30
(Dollars in Thousands)
2018
2017 2016 2015 2014 2013
Total Pension Liability $ 19,944,578
$ 18,458,188 $ 17,424,996 $ 16,909,996 $ 16,248,853 $ 14,881,663Plan Fiduciary Net Position (14,235,230)
(13,180,516) (11,809,329) (11,920,570) (11,791,079) (10,154,486)
Plan's Net Pension Liability $ 5,709,348
$ 5,277,672 $ 5,615,667 $ 4,989,426 $ 4,457,774 $ 4,727,177 Plan Fiduciary Net Position as a percentage of the Total Pension Liability
71.4%
71.4% 67.8% 70.5% 72.6% 68.2%
(1) In calculating the Plan’s net pension liability, the total pension liability and the Plan fiduciary net position exclude amounts associated with non-pension related benefits (Family Death and Larger Annuity Benefits).
Note to Schedule: Refer to the notes to the Schedule of Changes in Net Pension Liability and Related Ratios.
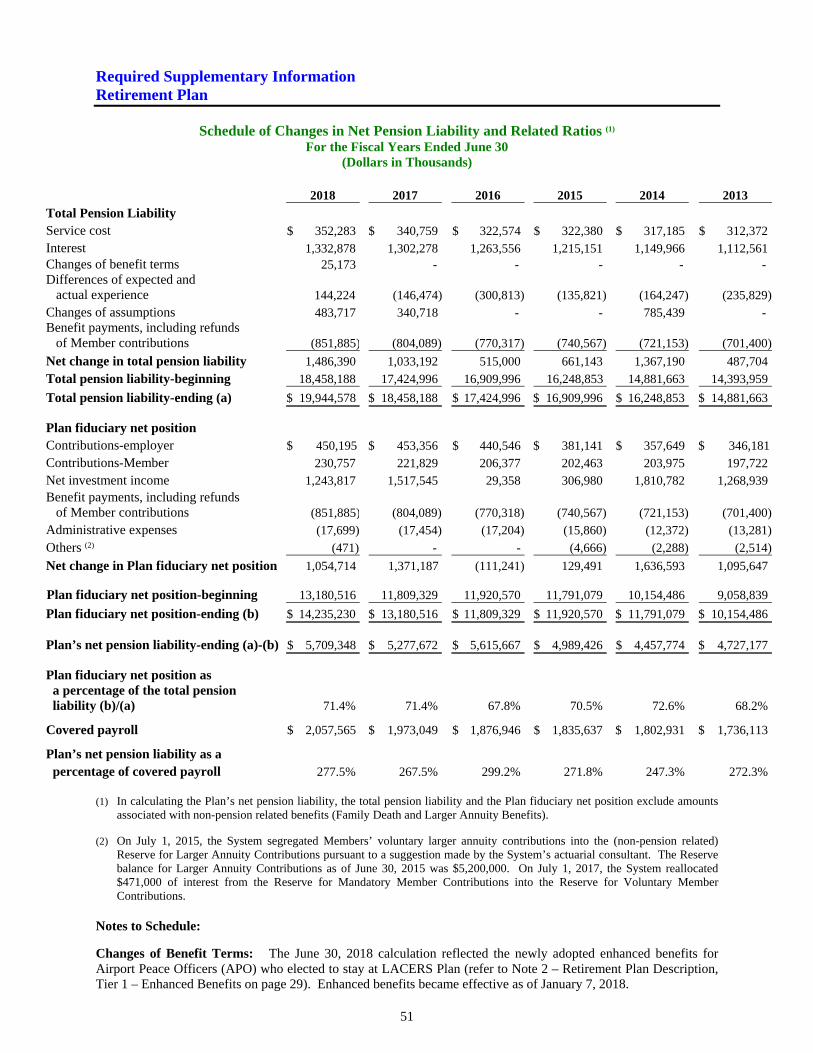
Required Supplementary Information Retirement Plan
51
Schedule of Changes in Net Pension Liability and Related Ratios (1)
For the Fiscal Years Ended June 30 (Dollars in Thousands)
2018 2017 2016 2015 2014 2013
Total Pension Liability Service cost $ 352,283 $ 340,759 $ 322,574 $ 322,380 $ 317,185 $ 312,372Interest 1,332,878 1,302,278 1,263,556 1,215,151 1,149,966 1,112,561Changes of benefit terms 25,173 - - - - -Differences of expected and actual experience 144,224 (146,474) (300,813) (135,821) (164,247) (235,829)Changes of assumptions 483,717 340,718 - - 785,439 -Benefit payments, including refunds of Member contributions (851,885) (804,089) (770,317) (740,567) (721,153) (701,400)
Net change in total pension liability 1,486,390 1,033,192 515,000 661,143 1,367,190 487,704
Total pension liability-beginning 18,458,188 17,424,996 16,909,996
16,248,853 14,881,663 14,393,959
Total pension liability-ending (a) $ 19,944,578 $ 18,458,188 $ 17,424,996 $ 16,909,996 $ 16,248,853 $ 14,881,663
Plan fiduciary net position Contributions-employer $ 450,195 $ 453,356 $ 440,546 $ 381,141 $ 357,649 $ 346,181Contributions-Member 230,757 221,829 206,377 202,463 203,975 197,722Net investment income 1,243,817 1,517,545 29,358 306,980 1,810,782 1,268,939Benefit payments, including refunds of Member contributions (851,885) (804,089) (770,318) (740,567) (721,153) (701,400)Administrative expenses (17,699) (17,454) (17,204) (15,860) (12,372) (13,281)Others (2) (471) - - (4,666) (2,288) (2,514)
Net change in Plan fiduciary net position 1,054,714 1,371,187 (111,241) 129,491 1,636,593 1,095,647
Plan fiduciary net position-beginning 13,180,516 11,809,329 11,920,570 11,791,079 10,154,486 9,058,839
Plan fiduciary net position-ending (b) $ 14,235,230 $ 13,180,516 $ 11,809,329 $ 11,920,570 $ 11,791,079 $ 10,154,486
Plan’s net pension liability-ending (a)-(b) $ 5,709,348 $ 5,277,672 $ 5,615,667 $ 4,989,426 $ 4,457,774 $ 4,727,177
Plan fiduciary net position as a percentage of the total pension liability (b)/(a) 71.4% 71.4% 67.8% 70.5% 72.6% 68.2%
Covered payroll $ 2,057,565 $ 1,973,049 $ 1,876,946 $ 1,835,637 $ 1,802,931 $ 1,736,113
Plan’s net pension liability as a percentage of covered payroll 277.5% 267.5% 299.2% 271.8% 247.3% 272.3%
(1) In calculating the Plan’s net pension liability, the total pension liability and the Plan fiduciary net position exclude amounts
associated with non-pension related benefits (Family Death and Larger Annuity Benefits). (2) On July 1, 2015, the System segregated Members’ voluntary larger annuity contributions into the (non-pension related)
Reserve for Larger Annuity Contributions pursuant to a suggestion made by the System’s actuarial consultant. The Reserve balance for Larger Annuity Contributions as of June 30, 2015 was $5,200,000. On July 1, 2017, the System reallocated $471,000 of interest from the Reserve for Mandatory Member Contributions into the Reserve for Voluntary Member Contributions.
Notes to Schedule:
Changes of Benefit Terms: The June 30, 2018 calculation reflected the newly adopted enhanced benefits for Airport Peace Officers (APO) who elected to stay at LACERS Plan (refer to Note 2 – Retirement Plan Description, Tier 1 – Enhanced Benefits on page 29). Enhanced benefits became effective as of January 7, 2018.
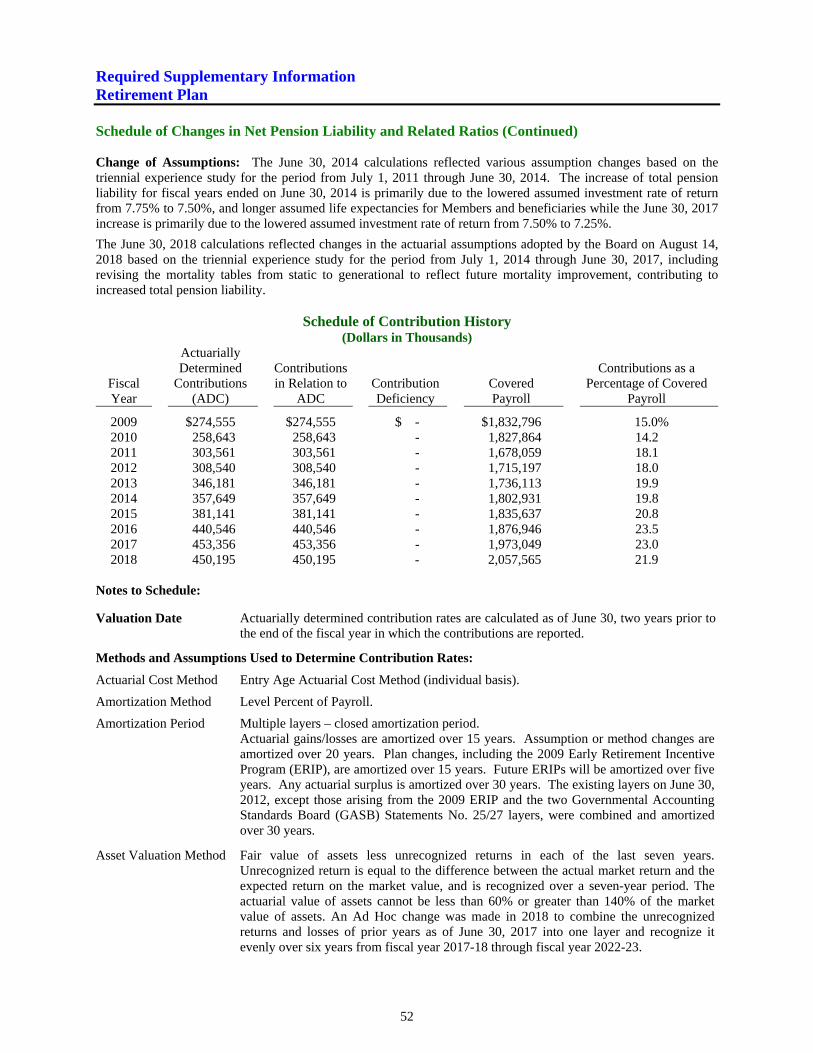
Required Supplementary Information Retirement Plan
52
Schedule of Changes in Net Pension Liability and Related Ratios (Continued) Change of Assumptions: The June 30, 2014 calculations reflected various assumption changes based on the triennial experience study for the period from July 1, 2011 through June 30, 2014. The increase of total pension liability for fiscal years ended on June 30, 2014 is primarily due to the lowered assumed investment rate of return from 7.75% to 7.50%, and longer assumed life expectancies for Members and beneficiaries while the June 30, 2017 increase is primarily due to the lowered assumed investment rate of return from 7.50% to 7.25%.
The June 30, 2018 calculations reflected changes in the actuarial assumptions adopted by the Board on August 14, 2018 based on the triennial experience study for the period from July 1, 2014 through June 30, 2017, including revising the mortality tables from static to generational to reflect future mortality improvement, contributing to increased total pension liability.
Schedule of Contribution History (Dollars in Thousands)
Fiscal Year
Actuarially Determined
Contributions (ADC)
Contributions in Relation to
ADC Contribution Deficiency
Covered Payroll
Contributions as a Percentage of Covered
Payroll
2009
$274,555 $274,555 $ - $1,832,796 15.0% 2010 258,643 258,643 - 1,827,864 14.2 2011 303,561 303,561 - 1,678,059 18.1 2012 308,540 308,540 - 1,715,197 18.0 2013 346,181 346,181 - 1,736,113 19.9 2014 357,649 357,649 - 1,802,931 19.8 2015 381,141 381,141 - 1,835,637 20.8 2016 440,546 440,546 - 1,876,946 23.5 2017 453,356 453,356 - 1,973,049 23.0 2018 450,195 450,195 - 2,057,565 21.9
Notes to Schedule:
Valuation Date
Actuarially determined contribution rates are calculated as of June 30, two years prior to the end of the fiscal year in which the contributions are reported.
Methods and Assumptions Used to Determine Contribution Rates:
Actuarial Cost Method Entry Age Actuarial Cost Method (individual basis).
Amortization Method Level Percent of Payroll.
Amortization Period Multiple layers – closed amortization period. Actuarial gains/losses are amortized over 15 years. Assumption or method changes are amortized over 20 years. Plan changes, including the 2009 Early Retirement Incentive Program (ERIP), are amortized over 15 years. Future ERIPs will be amortized over five years. Any actuarial surplus is amortized over 30 years. The existing layers on June 30, 2012, except those arising from the 2009 ERIP and the two Governmental Accounting Standards Board (GASB) Statements No. 25/27 layers, were combined and amortized over 30 years.
Asset Valuation Method Fair value of assets less unrecognized returns in each of the last seven years. Unrecognized return is equal to the difference between the actual market return and the expected return on the market value, and is recognized over a seven-year period. The actuarial value of assets cannot be less than 60% or greater than 140% of the market value of assets. An Ad Hoc change was made in 2018 to combine the unrecognized returns and losses of prior years as of June 30, 2017 into one layer and recognize it evenly over six years from fiscal year 2017-18 through fiscal year 2022-23.
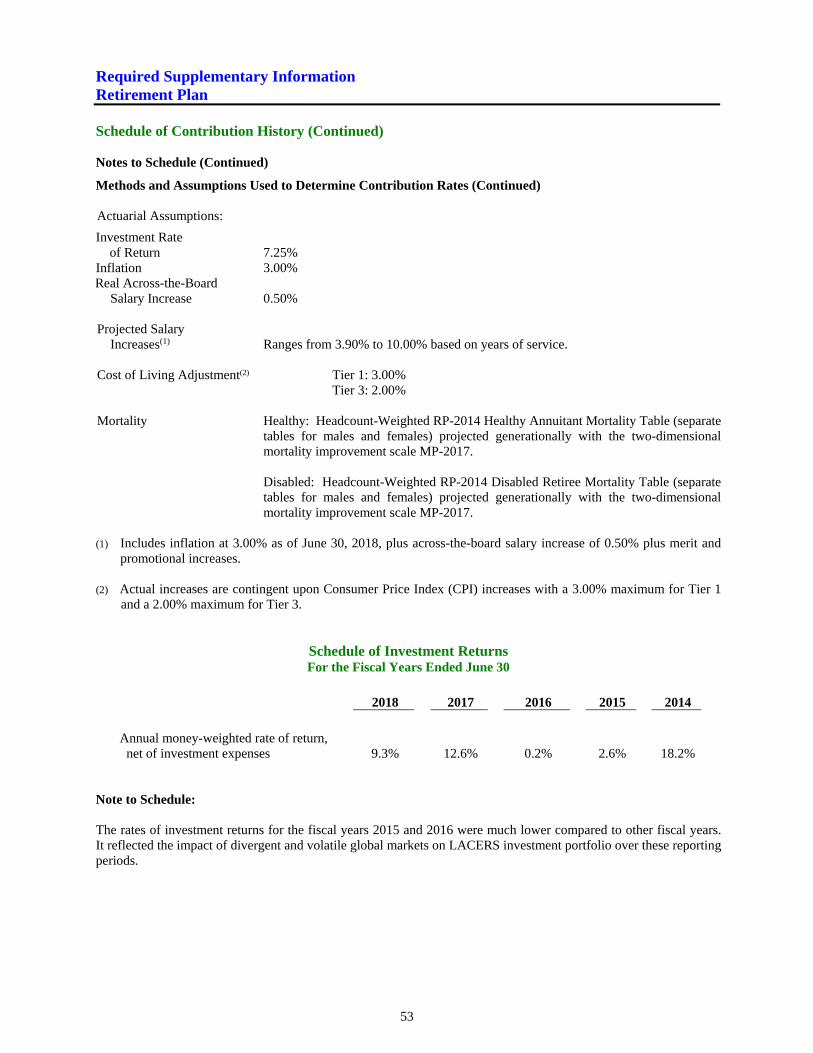
Required Supplementary Information Retirement Plan
53
Schedule of Contribution History (Continued) Notes to Schedule (Continued)
Methods and Assumptions Used to Determine Contribution Rates (Continued) Actuarial Assumptions:
Investment Rate of Return 7.25%
Inflation 3.00% Real Across-the-Board Salary Increase 0.50%
Projected Salary Increases(1) Ranges from 3.90% to 10.00% based on years of service. Cost of Living Adjustment(2)
Tier 1: 3.00%
Tier 3: 2.00%
Mortality Healthy: Headcount-Weighted RP-2014 Healthy Annuitant Mortality Table (separate tables for males and females) projected generationally with the two-dimensional mortality improvement scale MP-2017. Disabled: Headcount-Weighted RP-2014 Disabled Retiree Mortality Table (separate tables for males and females) projected generationally with the two-dimensional mortality improvement scale MP-2017.
(1) Includes inflation at 3.00% as of June 30, 2018, plus across-the-board salary increase of 0.50% plus merit and
promotional increases.
(2) Actual increases are contingent upon Consumer Price Index (CPI) increases with a 3.00% maximum for Tier 1 and a 2.00% maximum for Tier 3.
Schedule of Investment Returns For the Fiscal Years Ended June 30
2018 2017 2016 2015 2014
Annual money-weighted rate of return, net of investment expenses
9.3%
12.6% 0.2%
2.6%
18.2%
Note to Schedule: The rates of investment returns for the fiscal years 2015 and 2016 were much lower compared to other fiscal years. It reflected the impact of divergent and volatile global markets on LACERS investment portfolio over these reporting periods.
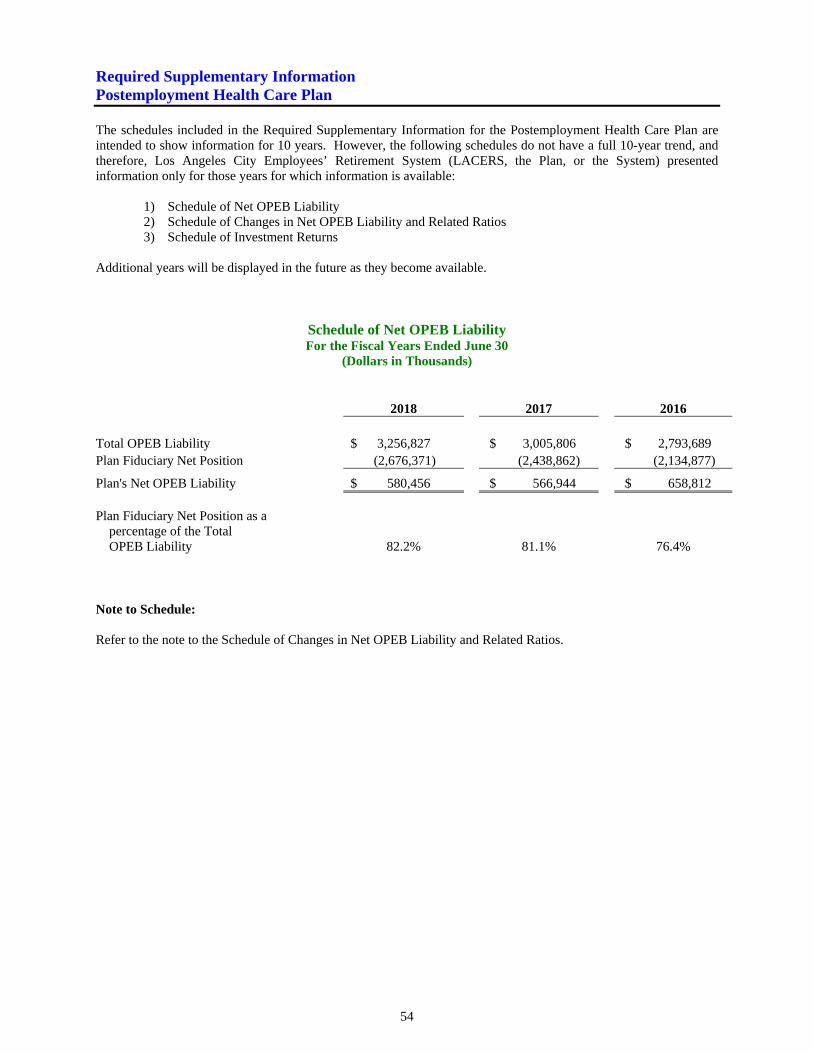
Required Supplementary Information Postemployment Health Care Plan
54
The schedules included in the Required Supplementary Information for the Postemployment Health Care Plan are intended to show information for 10 years. However, the following schedules do not have a full 10-year trend, and therefore, Los Angeles City Employees’ Retirement System (LACERS, the Plan, or the System) presented information only for those years for which information is available:
1) Schedule of Net OPEB Liability 2) Schedule of Changes in Net OPEB Liability and Related Ratios 3) Schedule of Investment Returns
Additional years will be displayed in the future as they become available.
Schedule of Net OPEB Liability For the Fiscal Years Ended June 30
(Dollars in Thousands)
2018 2017 2016
Total OPEB Liability $ 3,256,827 $ 3,005,806 $ 2,793,689 Plan Fiduciary Net Position (2,676,371) (2,438,862) (2,134,877)
Plan's Net OPEB Liability $ 580,456 $ 566,944 $ 658,812 Plan Fiduciary Net Position as a percentage of the Total OPEB Liability 82.2%
81.1%
76.4%
Note to Schedule: Refer to the note to the Schedule of Changes in Net OPEB Liability and Related Ratios.
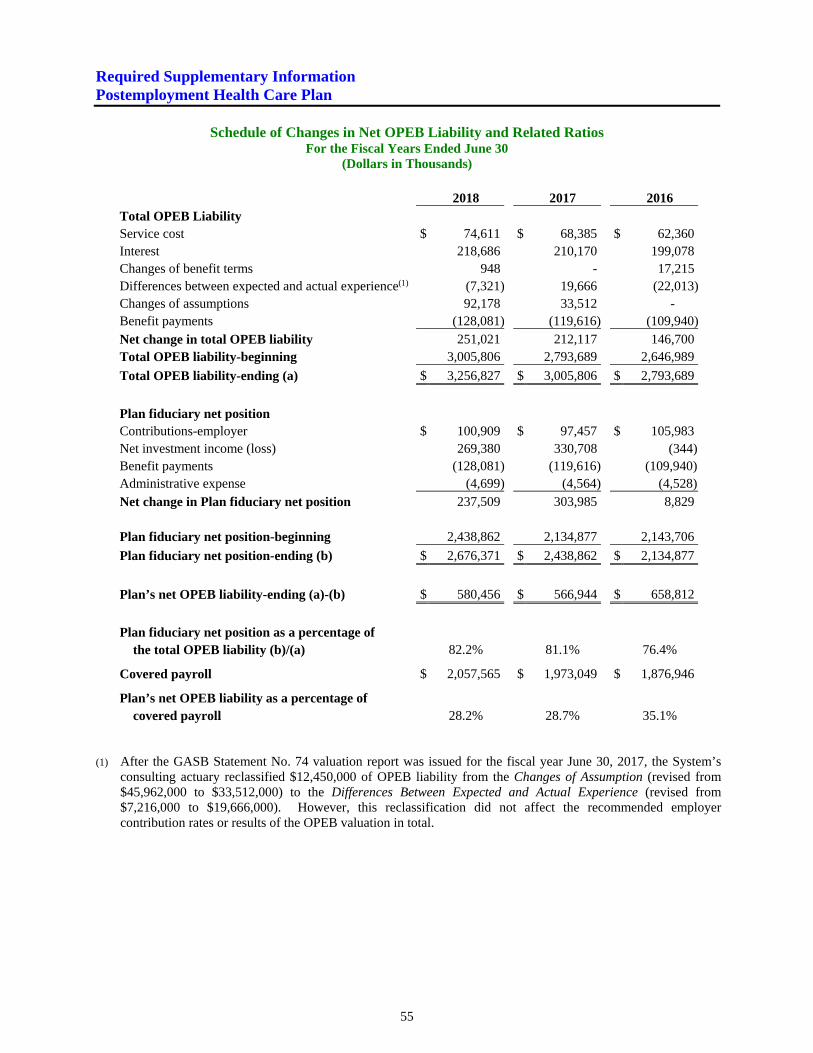
Required Supplementary Information Postemployment Health Care Plan
55
Schedule of Changes in Net OPEB Liability and Related Ratios
For the Fiscal Years Ended June 30 (Dollars in Thousands)
2018 2017 2016
Total OPEB Liability Service cost $ 74,611 $ 68,385 $ 62,360Interest 218,686 210,170 199,078Changes of benefit terms 948 - 17,215Differences between expected and actual experience(1)
(7,321) 19,666 (22,013)Changes of assumptions 92,178 33,512 - Benefit payments (128,081) (119,616) (109,940)Net change in total OPEB liability 251,021 212,117 146,700Total OPEB liability-beginning 3,005,806 2,793,689 2,646,989
Total OPEB liability-ending (a) $ 3,256,827 $ 3,005,806 $ 2,793,689
Plan fiduciary net position Contributions-employer $ 100,909 $ 97,457 $ 105,983Net investment income (loss) 269,380 330,708 (344)Benefit payments (128,081) (119,616) (109,940)Administrative expense (4,699) (4,564) (4,528)Net change in Plan fiduciary net position 237,509 303,985 8,829
Plan fiduciary net position-beginning 2,438,862 2,134,877 2,143,706
Plan fiduciary net position-ending (b) $ 2,676,371 $ 2,438,862 $ 2,134,877
Plan’s net OPEB liability-ending (a)-(b) $ 580,456 $ 566,944 $ 658,812
Plan fiduciary net position as a percentage of the total OPEB liability (b)/(a) 82.2% 81.1% 76.4%
Covered payroll $ 2,057,565 $ 1,973,049 $ 1,876,946
Plan’s net OPEB liability as a percentage of covered payroll 28.2% 28.7% 35.1%
(1) After the GASB Statement No. 74 valuation report was issued for the fiscal year June 30, 2017, the System’s
consulting actuary reclassified $12,450,000 of OPEB liability from the Changes of Assumption (revised from $45,962,000 to $33,512,000) to the Differences Between Expected and Actual Experience (revised from $7,216,000 to $19,666,000). However, this reclassification did not affect the recommended employer contribution rates or results of the OPEB valuation in total.
Required Supplementary Information Postemployment Health Care Plan
56
Schedule of Changes in Net OPEB Liability and Related Ratios (Continued) Notes to Schedule: Changes of Benefit Terms: The OPEB liability from the changes of benefit terms for the fiscal year ended June 30, 2016 is primarily due to providing retiree healthcare benefits to part-time employees who retired with 10 years of service but less than 10 years of service credit (refer to Note 3 – Postemployment Health Care Plan Description, Eligibility Requirement and Benefits Provided on page 33) while the June 30, 2018 increase is primarily as a result of the newly adopted enhanced benefits for Airport Peace Officers (APO) who elected to stay at LACERS Plan (refer to Note 2 – Retirement Plan Description, Tier 1 – Enhanced Benefits on page 29) as some APO Members may retire earlier than expected. Enhanced benefits became effective as of January 7, 2018. Changes of Assumptions: The OPEB liability from the changes of assumptions for the fiscal year ended June 30, 2017 is primarily due to the lowered assumed investment rate of return, from 7.50% to 7.25%, while the June 30, 2018 increase is primarily due to the new actuarial assumptions adopted in the triennial experience study (July 1, 2014 through June 30, 2017), including revising the mortality tables from static to generational.
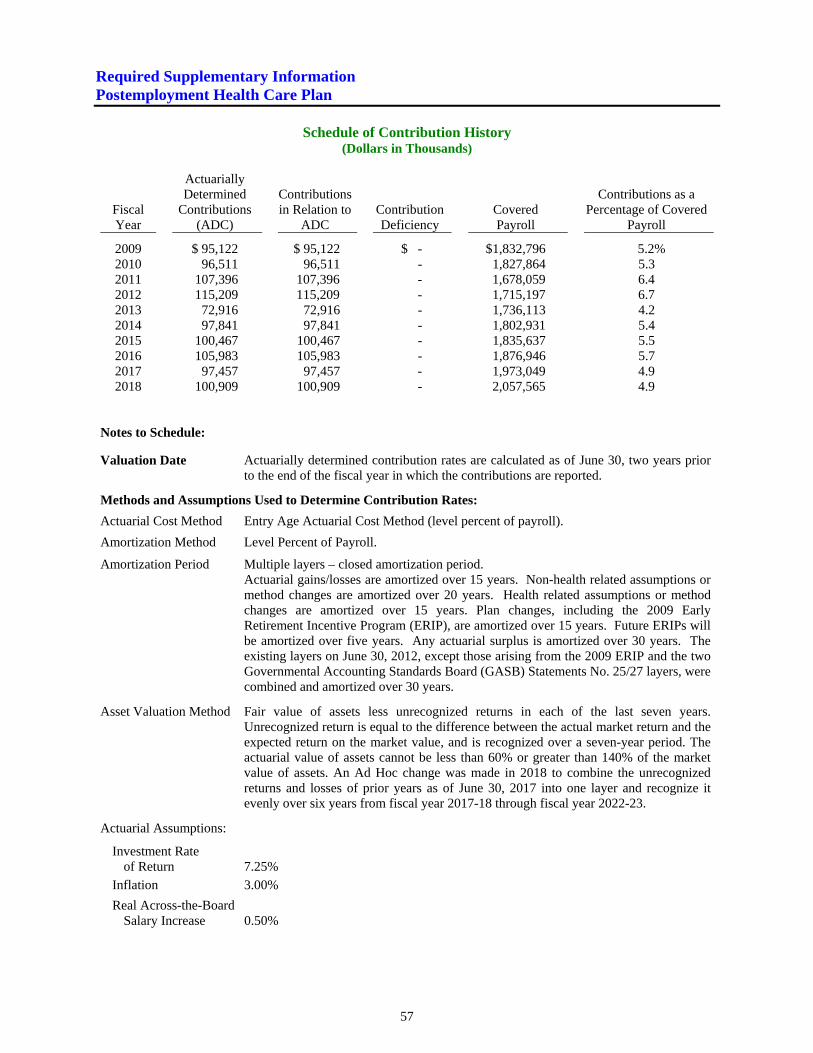
Required Supplementary Information Postemployment Health Care Plan
57
Schedule of Contribution History
(Dollars in Thousands)
Fiscal Year
Actuarially Determined
Contributions (ADC)
Contributions in Relation to
ADC Contribution Deficiency
Covered Payroll
Contributions as a Percentage of Covered
Payroll
2009
$ 95,122 $ 95,122 $ - $1,832,796 5.2% 2010 96,511 96,511 - 1,827,864 5.3 2011 107,396 107,396 - 1,678,059 6.4 2012 115,209 115,209 - 1,715,197 6.7 2013 72,916 72,916 - 1,736,113 4.2 2014 97,841 97,841 - 1,802,931 5.4 2015 100,467 100,467 - 1,835,637 5.5 2016 105,983 105,983 - 1,876,946 5.7 2017 97,457 97,457 - 1,973,049 4.9 2018 100,909 100,909 - 2,057,565 4.9
Notes to Schedule:
Valuation Date
Actuarially determined contribution rates are calculated as of June 30, two years prior to the end of the fiscal year in which the contributions are reported.
Methods and Assumptions Used to Determine Contribution Rates:
Actuarial Cost Method Entry Age Actuarial Cost Method (level percent of payroll).
Amortization Method Level Percent of Payroll.
Amortization Period Multiple layers – closed amortization period. Actuarial gains/losses are amortized over 15 years. Non-health related assumptions or method changes are amortized over 20 years. Health related assumptions or method changes are amortized over 15 years. Plan changes, including the 2009 Early Retirement Incentive Program (ERIP), are amortized over 15 years. Future ERIPs will be amortized over five years. Any actuarial surplus is amortized over 30 years. The existing layers on June 30, 2012, except those arising from the 2009 ERIP and the two Governmental Accounting Standards Board (GASB) Statements No. 25/27 layers, were combined and amortized over 30 years.
Asset Valuation Method Fair value of assets less unrecognized returns in each of the last seven years. Unrecognized return is equal to the difference between the actual market return and the expected return on the market value, and is recognized over a seven-year period. The actuarial value of assets cannot be less than 60% or greater than 140% of the market value of assets. An Ad Hoc change was made in 2018 to combine the unrecognized returns and losses of prior years as of June 30, 2017 into one layer and recognize it evenly over six years from fiscal year 2017-18 through fiscal year 2022-23.
Actuarial Assumptions:
Investment Rate of Return
7.25%
Inflation 3.00% Real Across-the-Board Salary Increase 0.50%
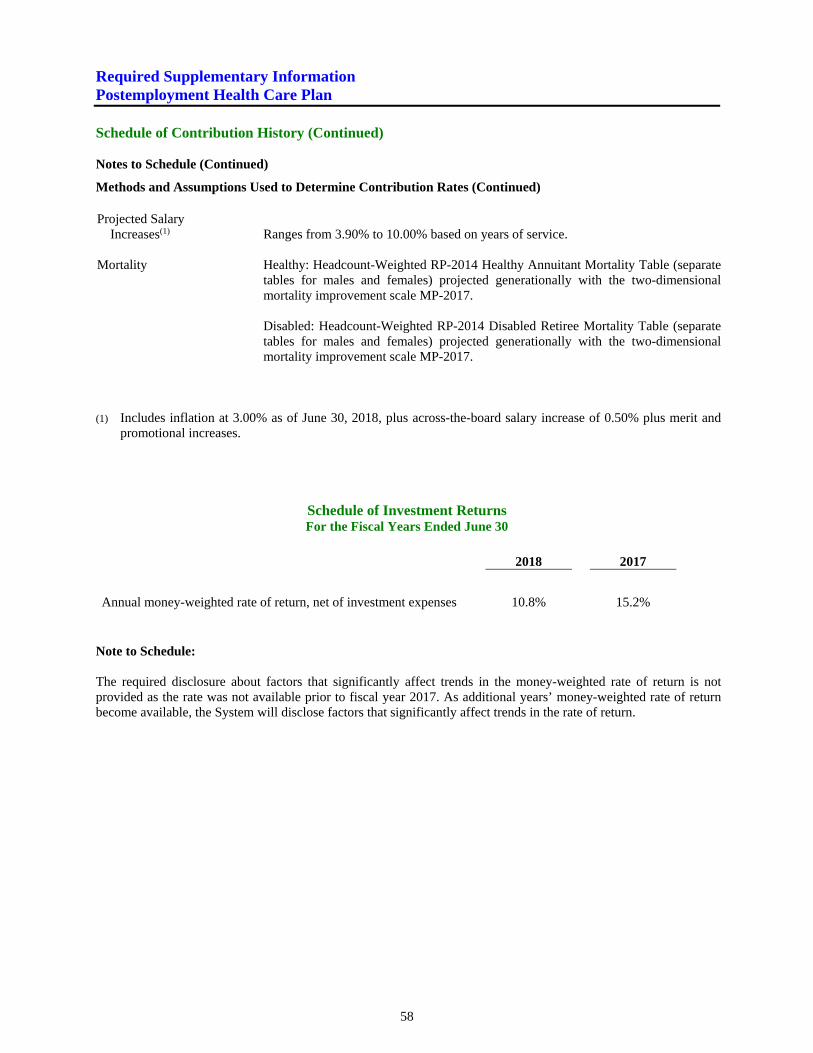
Required Supplementary Information Postemployment Health Care Plan
58
Schedule of Contribution History (Continued) Notes to Schedule (Continued)
Methods and Assumptions Used to Determine Contribution Rates (Continued) Projected Salary Increases(1) Ranges from 3.90% to 10.00% based on years of service.
Mortality Healthy: Headcount-Weighted RP-2014 Healthy Annuitant Mortality Table (separate tables for males and females) projected generationally with the two-dimensional mortality improvement scale MP-2017. Disabled: Headcount-Weighted RP-2014 Disabled Retiree Mortality Table (separate tables for males and females) projected generationally with the two-dimensional mortality improvement scale MP-2017.
(1) Includes inflation at 3.00% as of June 30, 2018, plus across-the-board salary increase of 0.50% plus merit and
promotional increases.
Schedule of Investment Returns For the Fiscal Years Ended June 30
2018 2017
Annual money-weighted rate of return, net of investment expenses 10.8% 15.2%
Note to Schedule: The required disclosure about factors that significantly affect trends in the money-weighted rate of return is not provided as the rate was not available prior to fiscal year 2017. As additional years’ money-weighted rate of return become available, the System will disclose factors that significantly affect trends in the rate of return.

SUPPLEMENTAL SCHEDULES
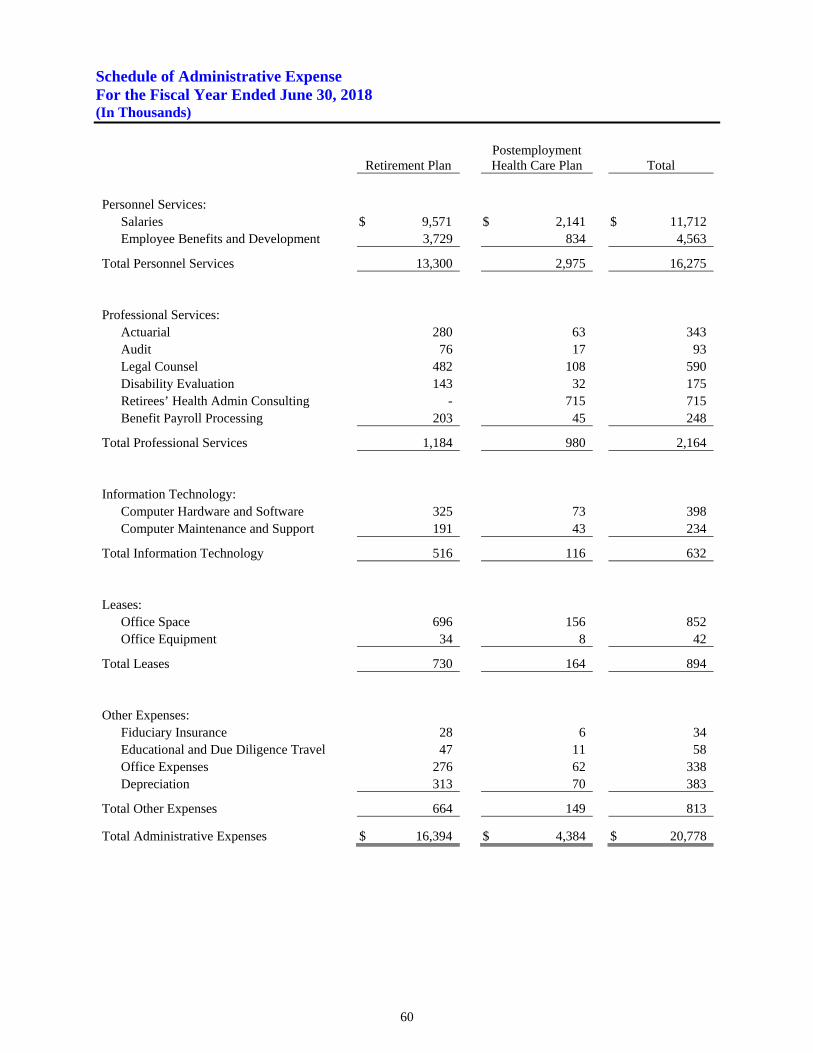
Schedule of Administrative Expense For the Fiscal Year Ended June 30, 2018 (In Thousands)
60
Retirement Plan Postemployment Health Care Plan Total
Personnel Services: Salaries $ 9,571 $ 2,141 $ 11,712 Employee Benefits and Development 3,729 834 4,563
Total Personnel Services 13,300 2,975 16,275
Professional Services: Actuarial 280 63 343 Audit 76 17 93 Legal Counsel 482 108 590 Disability Evaluation 143 32 175 Retirees’ Health Admin Consulting - 715 715 Benefit Payroll Processing 203 45 248
Total Professional Services 1,184 980 2,164
Information Technology: Computer Hardware and Software 325 73 398 Computer Maintenance and Support 191 43 234
Total Information Technology 516 116 632
Leases: Office Space 696 156 852 Office Equipment 34 8 42
Total Leases 730 164 894
Other Expenses: Fiduciary Insurance 28 6 34 Educational and Due Diligence Travel 47 11 58 Office Expenses 276 62 338 Depreciation 313 70 383
Total Other Expenses 664 149 813
Total Administrative Expenses $ 16,394 $ 4,384 $ 20,778
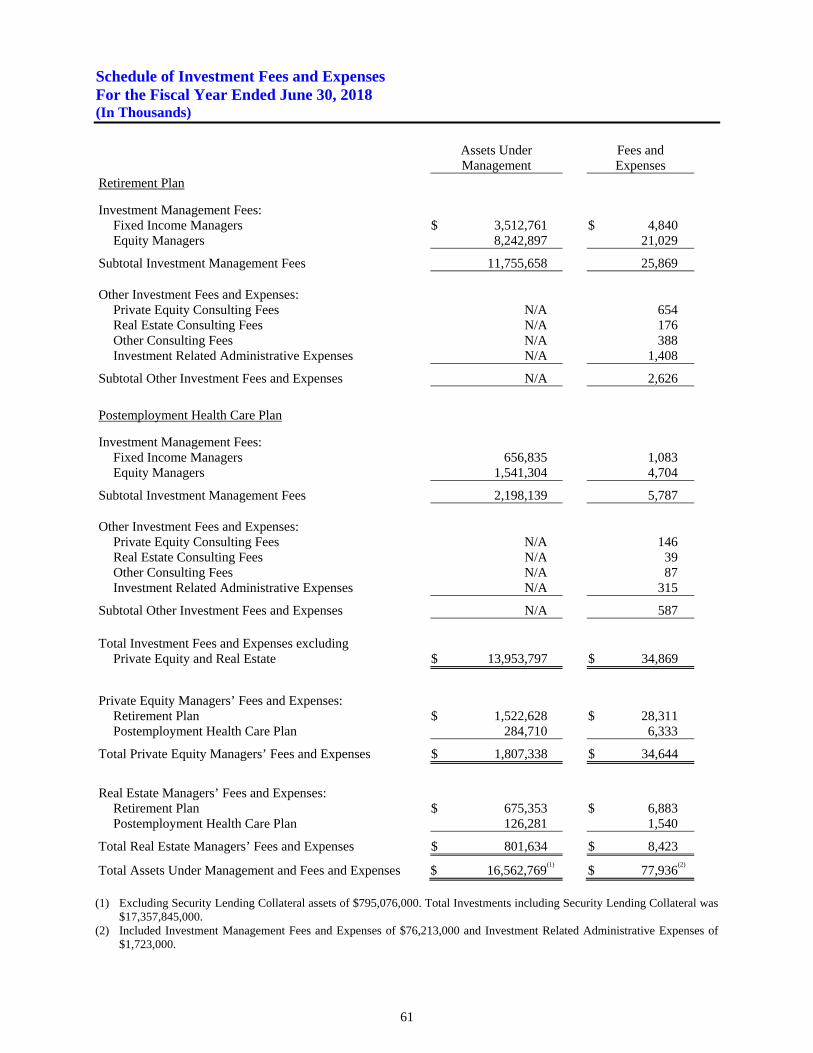
Schedule of Investment Fees and Expenses For the Fiscal Year Ended June 30, 2018 (In Thousands)
61
Assets Under Management
Fees and Expenses
Retirement Plan
Investment Management Fees: Fixed Income Managers $ 3,512,761 $ 4,840 Equity Managers 8,242,897 21,029
Subtotal Investment Management Fees 11,755,658 25,869 Other Investment Fees and Expenses: Private Equity Consulting Fees N/A 654 Real Estate Consulting Fees N/A 176 Other Consulting Fees N/A 388 Investment Related Administrative Expenses N/A 1,408
Subtotal Other Investment Fees and Expenses N/A 2,626
Postemployment Health Care Plan
Investment Management Fees: Fixed Income Managers 656,835 1,083 Equity Managers 1,541,304 4,704
Subtotal Investment Management Fees 2,198,139 5,787 Other Investment Fees and Expenses:
Private Equity Consulting Fees
N/A
146 Real Estate Consulting Fees N/A 39 Other Consulting Fees N/A 87 Investment Related Administrative Expenses N/A 315
Subtotal Other Investment Fees and Expenses N/A 587
Total Investment Fees and Expenses excluding Private Equity and Real Estate $ 13,953,797 $ 34,869
Private Equity Managers’ Fees and Expenses: Retirement Plan $ 1,522,628 $ 28,311 Postemployment Health Care Plan 284,710 6,333
Total Private Equity Managers’ Fees and Expenses $ 1,807,338 $ 34,644
Real Estate Managers’ Fees and Expenses: Retirement Plan $ 675,353 $ 6,883 Postemployment Health Care Plan 126,281 1,540
Total Real Estate Managers’ Fees and Expenses $ 801,634 $ 8,423
Total Assets Under Management and Fees and Expenses $ 16,562,769(1) $ 77,936
(2)
(1) Excluding Security Lending Collateral assets of $795,076,000. Total Investments including Security Lending Collateral was
$17,357,845,000. (2) Included Investment Management Fees and Expenses of $76,213,000 and Investment Related Administrative Expenses of
$1,723,000.

This page intentionally left blank.


202 W. First Street, Suite 500 Los Angeles, CA 90012-4401
(800) 779-8328 TDD (888) 349-3996
www.lacers.org
65
Report on Investment Activity
December 3, 2018
Dear Members of the Board: Presented below is a summary report of the Fund’s investment activities for the fiscal year 2017-2018.
Market Overview
The 2018 fiscal year was another favorable period for the LACERS investment portfolio, characterized by strong global equity market returns and heightened volatility. For the one-year period ending June 30, 2018, the LACERS investment portfolio returned 9.2% (gross of fees). The first quarter of the fiscal year continued a bullish trend across equity markets as anticipation for U.S. tax reform, which would benefit corporate earnings, increased. U.S.
equities produced positive performance, with small cap equities leading the way. Non-U.S. equities, particularly in emerging markets, fared even better than U.S. equities with the assistance of a depreciating U.S. dollar and strong returns in China. Global equity markets continued to produce positive performance during the second quarter of the fiscal year. The performance of U.S. equities received a boost by the approval of the U.S. tax reform bill. A strong U.S. labor market and better-than-expected economic growth provided support for the U.S. Federal Reserve to hike the federal funds rate a quarter-point to a range of 1.25% to 1.50%. Non-U.S. equities also performed well amid upbeat economic and corporate earnings data in certain developed European and Asian countries, as well as the broad emerging markets. Market volatility remained subdued while the U.S. dollar continued to depreciate. With the start of the third quarter of the fiscal year and a new calendar year, the market faced a potential trade war between the U.S. and China and concerns over rising U.S. interest rates, which contributed to a spike in market volatility and downward pressure on investment returns. The Federal Reserve increased the federal funds rate another quarter-point to a range of 1.50% to 1.75% -- the highest since September 2008. Global markets experienced negative returns; particularly, the U.S. equities market produced its first negative quarter in over two years. Emerging markets were an exception and continued to produce positive performance due to strong earnings and GDP growth. Meanwhile, the U.S. dollar continued its downward slide relative to other currencies. The U.S. equities market rebounded in the last quarter of the fiscal year, supported by strong corporate earnings growth. Solid U.S. economic data gave the Federal Reserve confidence to increase the federal funds rate another quarter-point to a range of 1.75% to 2.00%. Despite an appreciating U.S. dollar and the escalating trade war tension between the U.S. and China, non-U.S. equities managed to produce a slightly positive return. While the 2018 fiscal year was a period of strong returns and volatility in the markets, LACERS’ investment portfolio is constructed based on a long-term investment horizon and is well diversified in order to weather increases in market volatility in the future.
66
Investment Performance
LACERS primary investment objective is to maximize the return of the portfolio at a prudent level of risk to meet the obligations of the System. The Fund is managed on a total return basis over a long-term investment horizon. While the System recognizes the importance of capital preservation, it also recognizes that varying degrees of investment risk are generally rewarded with commensurate returns. Consequently, prudent risk-taking is warranted within the context of overall portfolio diversification, which is achieved through the System’s strategic asset allocation policy. LACERS investments are reported at fair value. The total portfolio was $17.0 billion on June 30, 2018, an increase of $1.3 billion over the prior fiscal year. The Fund realized a 9.2% (gross of fees) return for the fiscal year. Individual asset class gross returns were: U.S. equity, 15.4%; non-U.S. equity, 9.9%; core fixed income, -0.3%; credit opportunities, 1.8%; private equity, 13.9%; and real assets, 5.9%. The total portfolio outperformed its policy benchmark by 60 basis points (gross of fees) for the fiscal year, mainly attributed to the relative outperformance of U.S. and non-U.S. equities, which outperformed their benchmarks by 60 and 260 basis points, respectively. The Investment Results table presented on page 67 provides a summary of time-weighted rates of return based on fair value of assets by asset classes and for the total fund.
Policies, Procedures and Guidelines
During the fiscal year, the Board of Administration continued a comprehensive review of the LACERS Investment Policy that began in fiscal year 2014-2015. The Board approved most of the policy revisions on October 24, 2017, but deferred action on two specific sections: Private Equity Investment Policy and Emerging Investment Manager Policy. These two sections will be reviewed at the next annual review of the Investment Policy. Additionally, the Board, with the assistance of staff and the General Fund Consultant, conducted an asset-liability study, resulting in the adoption of a new asset allocation policy on April 10, 2018. The new asset allocation targets are presented in the pie chart on page 70.
Investment Manager Contract Awards and Renewals
As presented in the table on page 68, contracts with seven investment managers of publicly traded securities were awarded or renewed during the fiscal year: two with active U.S. equity managers, a U.S. index manager, a core fixed income manager, a credit opportunities manager, a real estate investment trust securities (REITS) manager, and a long-only commodities manager.
Private Investments
LACERS approved 10 private equity and venture capital partnerships totaling $207.5 million of committed capital as presented in the table on page 68. Respectfully submitted,
_______________________________ Rodney L. June Chief Investment Officer
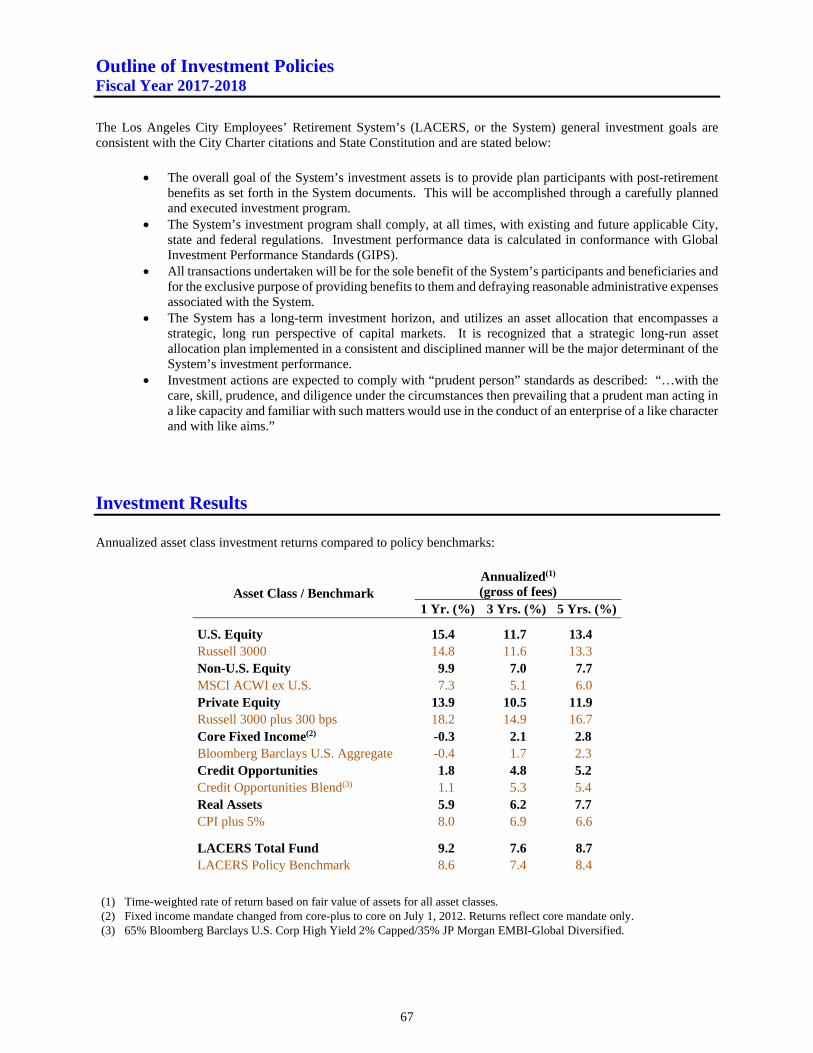
Outline of Investment Policies Fiscal Year 2017-2018
67
The Los Angeles City Employees’ Retirement System’s (LACERS, or the System) general investment goals are consistent with the City Charter citations and State Constitution and are stated below:
The overall goal of the System’s investment assets is to provide plan participants with post-retirement benefits as set forth in the System documents. This will be accomplished through a carefully planned and executed investment program.
The System’s investment program shall comply, at all times, with existing and future applicable City, state and federal regulations. Investment performance data is calculated in conformance with Global Investment Performance Standards (GIPS).
All transactions undertaken will be for the sole benefit of the System’s participants and beneficiaries and for the exclusive purpose of providing benefits to them and defraying reasonable administrative expenses associated with the System.
The System has a long-term investment horizon, and utilizes an asset allocation that encompasses a strategic, long run perspective of capital markets. It is recognized that a strategic long-run asset allocation plan implemented in a consistent and disciplined manner will be the major determinant of the System’s investment performance.
Investment actions are expected to comply with “prudent person” standards as described: “…with the care, skill, prudence, and diligence under the circumstances then prevailing that a prudent man acting in a like capacity and familiar with such matters would use in the conduct of an enterprise of a like character and with like aims.”
Investment Results
Annualized asset class investment returns compared to policy benchmarks:
Asset Class / Benchmark Annualized(1)
(gross of fees) 1 Yr. (%) 3 Yrs. (%) 5 Yrs. (%)
U.S. Equity 15.4 11.7 13.4 Russell 3000 14.8 11.6 13.3 Non-U.S. Equity 9.9 7.0 7.7 MSCI ACWI ex U.S. 7.3 5.1 6.0 Private Equity 13.9 10.5 11.9 Russell 3000 plus 300 bps 18.2 14.9 16.7 Core Fixed Income(2) -0.3 2.1 2.8 Bloomberg Barclays U.S. Aggregate -0.4 1.7 2.3 Credit Opportunities 1.8 4.8 5.2 Credit Opportunities Blend(3) 1.1 5.3 5.4 Real Assets 5.9 6.2 7.7 CPI plus 5% 8.0 6.9 6.6
LACERS Total Fund 9.2 7.6 8.7 LACERS Policy Benchmark 8.6 7.4 8.4
(1) Time-weighted rate of return based on fair value of assets for all asset classes. (2) Fixed income mandate changed from core-plus to core on July 1, 2012. Returns reflect core mandate only. (3) 65% Bloomberg Barclays U.S. Corp High Yield 2% Capped/35% JP Morgan EMBI-Global Diversified.
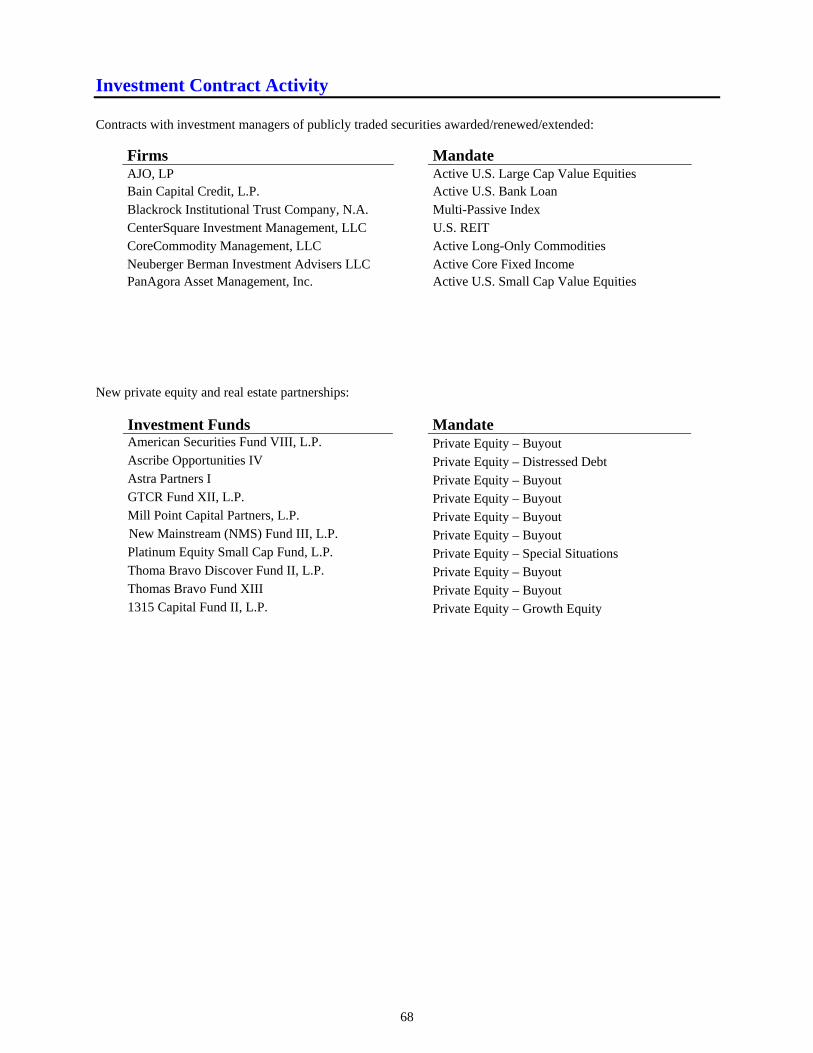
Investment Contract Activity
68
Contracts with investment managers of publicly traded securities awarded/renewed/extended:
Firms Mandate AJO, LP Active U.S. Large Cap Value Equities Bain Capital Credit, L.P. Active U.S. Bank Loan Blackrock Institutional Trust Company, N.A. Multi-Passive Index CenterSquare Investment Management, LLC U.S. REIT CoreCommodity Management, LLC Active Long-Only Commodities Neuberger Berman Investment Advisers LLC Active Core Fixed Income PanAgora Asset Management, Inc. Active U.S. Small Cap Value Equities
New private equity and real estate partnerships:
Investment Funds Mandate American Securities Fund VIII, L.P. Private Equity – Buyout Ascribe Opportunities IV Private Equity – Distressed Debt Astra Partners I Private Equity – Buyout GTCR Fund XII, L.P. Private Equity – Buyout Mill Point Capital Partners, L.P. Private Equity – Buyout New Mainstream (NMS) Fund III, L.P. Private Equity – Buyout Platinum Equity Small Cap Fund, L.P. Private Equity – Special Situations Thoma Bravo Discover Fund II, L.P. Private Equity – Buyout Thomas Bravo Fund XIII Private Equity – Buyout 1315 Capital Fund II, L.P. Private Equity – Growth Equity
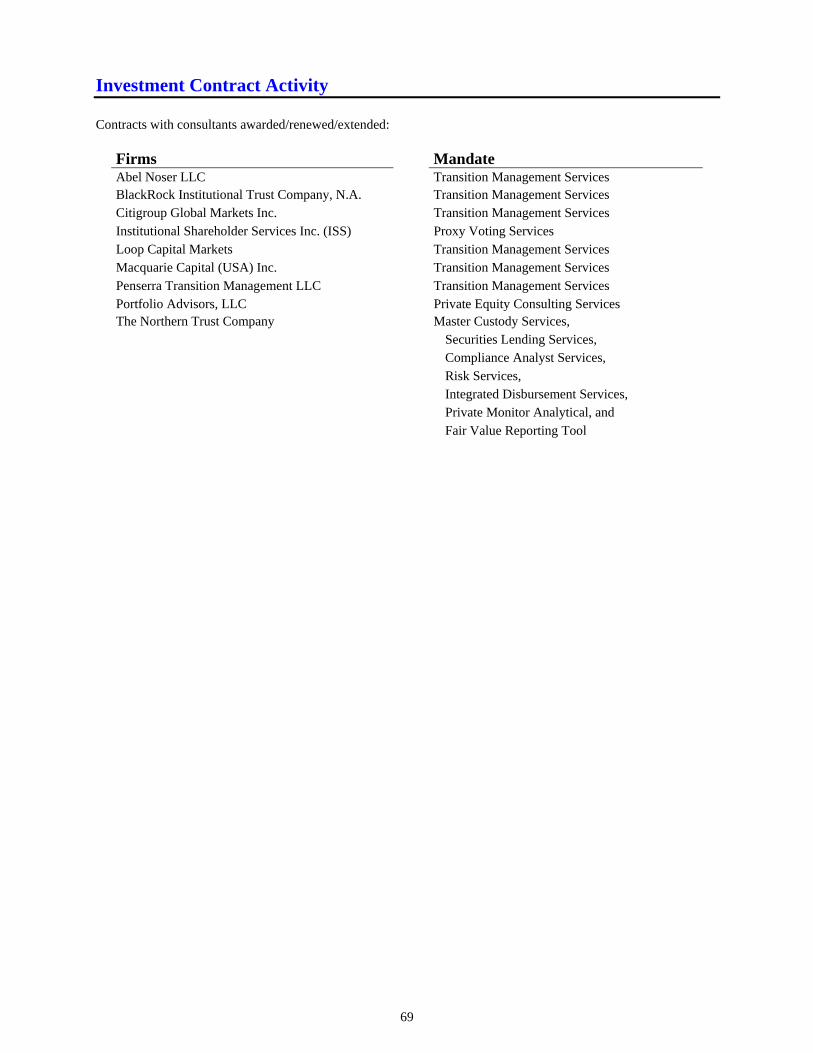
Investment Contract Activity
69
Contracts with consultants awarded/renewed/extended:
Firms Mandate Abel Noser LLC Transition Management Services BlackRock Institutional Trust Company, N.A. Transition Management Services Citigroup Global Markets Inc. Transition Management Services Institutional Shareholder Services Inc. (ISS) Proxy Voting Services Loop Capital Markets Transition Management Services Macquarie Capital (USA) Inc. Transition Management Services Penserra Transition Management LLC Transition Management Services Portfolio Advisors, LLC Private Equity Consulting Services The Northern Trust Company Master Custody Services, Securities Lending Services, Compliance Analyst Services, Risk Services, Integrated Disbursement Services, Private Monitor Analytical, and Fair Value Reporting Tool
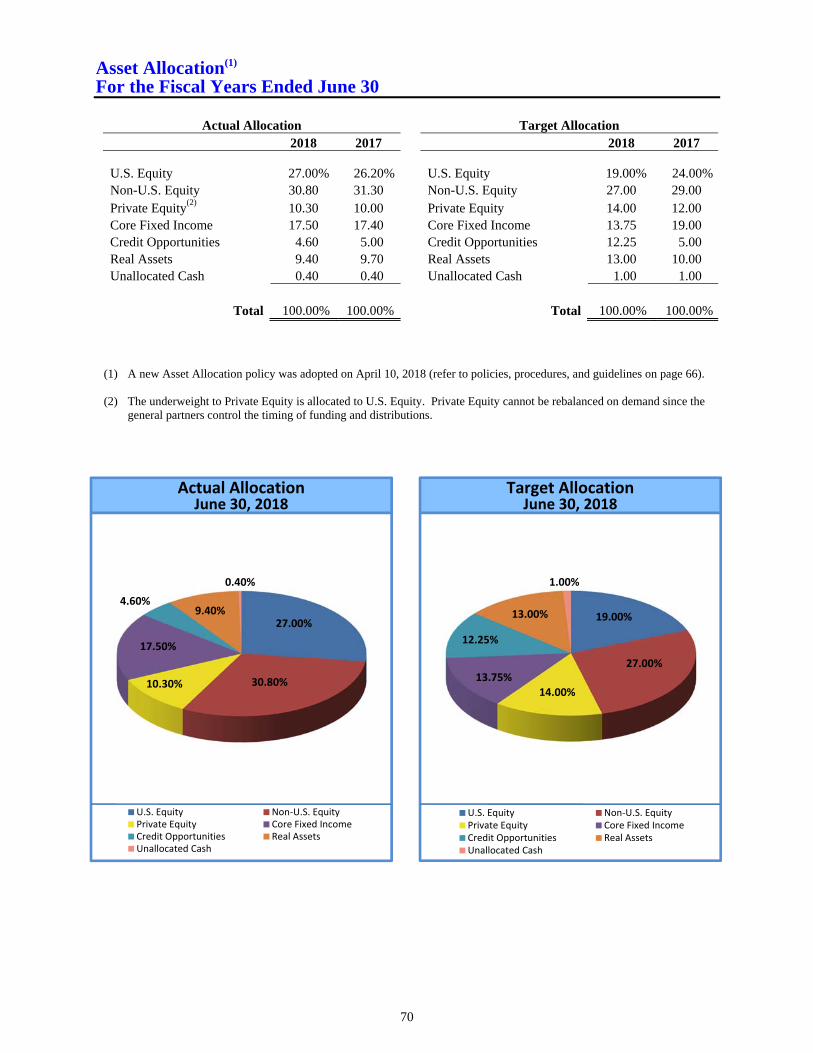
Asset Allocation(1)
For the Fiscal Years Ended June 30
70
Actual Allocation Target Allocation
2018 2017 2018 2017
U.S. Equity 27.00% 26.20% U.S. Equity 19.00% 24.00%Non-U.S. Equity 30.80 31.30 Non-U.S. Equity 27.00 29.00 Private Equity(2) 10.30 10.00 Private Equity 14.00 12.00 Core Fixed Income 17.50 17.40 Core Fixed Income 13.75 19.00 Credit Opportunities 4.60 5.00 Credit Opportunities 12.25 5.00 Real Assets 9.40 9.70 Real Assets 13.00 10.00 Unallocated Cash 0.40 0.40 Unallocated Cash 1.00 1.00
Total 100.00% 100.00% Total 100.00% 100.00%
(1) A new Asset Allocation policy was adopted on April 10, 2018 (refer to policies, procedures, and guidelines on page 66).
(2) The underweight to Private Equity is allocated to U.S. Equity. Private Equity cannot be rebalanced on demand since the general partners control the timing of funding and distributions.
27.00%
30.80%10.30%
17.50%
4.60%9.40%
0.40%
U.S. Equity Non‐U.S. EquityPrivate Equity Core Fixed IncomeCredit Opportunities Real AssetsUnallocated Cash
Actual AllocationJune 30, 2018
19.00%
27.00%
14.00%13.75%
12.25%
13.00%
1.00%
U.S. Equity Non‐U.S. EquityPrivate Equity Core Fixed IncomeCredit Opportunities Real AssetsUnallocated Cash
Target AllocationJune 30, 2018
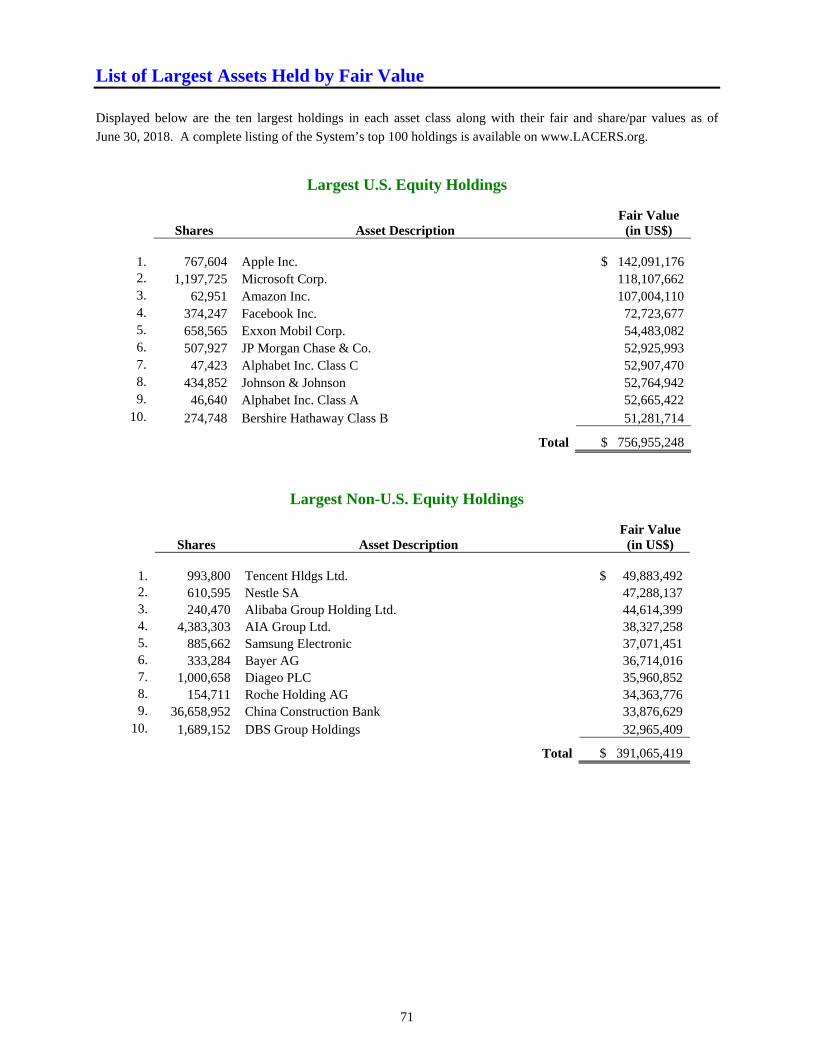
List of Largest Assets Held by Fair Value
71
Displayed below are the ten largest holdings in each asset class along with their fair and share/par values as of
June 30, 2018. A complete listing of the System’s top 100 holdings is available on www.LACERS.org.
Largest U.S. Equity Holdings
Shares Asset Description Fair Value
(in US$)
1. 767,604 Apple Inc. $ 142,091,176 2. 1,197,725 Microsoft Corp. 118,107,662 3. 62,951 Amazon Inc. 107,004,110 4. 374,247 Facebook Inc. 72,723,677 5. 658,565 Exxon Mobil Corp. 54,483,082 6. 507,927 JP Morgan Chase & Co. 52,925,993 7. 47,423 Alphabet Inc. Class C 52,907,470 8. 434,852 Johnson & Johnson 52,764,942 9. 46,640 Alphabet Inc. Class A 52,665,422
10. 274,748 Bershire Hathaway Class B 51,281,714
Total $ 756,955,248
Largest Non-U.S. Equity Holdings
Shares Asset Description Fair Value
(in US$)
1. 993,800 Tencent Hldgs Ltd. $ 49,883,492 2. 610,595 Nestle SA 47,288,137 3. 240,470 Alibaba Group Holding Ltd. 44,614,399 4. 4,383,303 AIA Group Ltd. 38,327,258 5. 885,662 Samsung Electronic 37,071,451 6. 333,284 Bayer AG 36,714,016 7. 1,000,658 Diageo PLC 35,960,852 8. 154,711 Roche Holding AG 34,363,776 9. 36,658,952 China Construction Bank 33,876,629
10. 1,689,152 DBS Group Holdings 32,965,409
Total $ 391,065,419
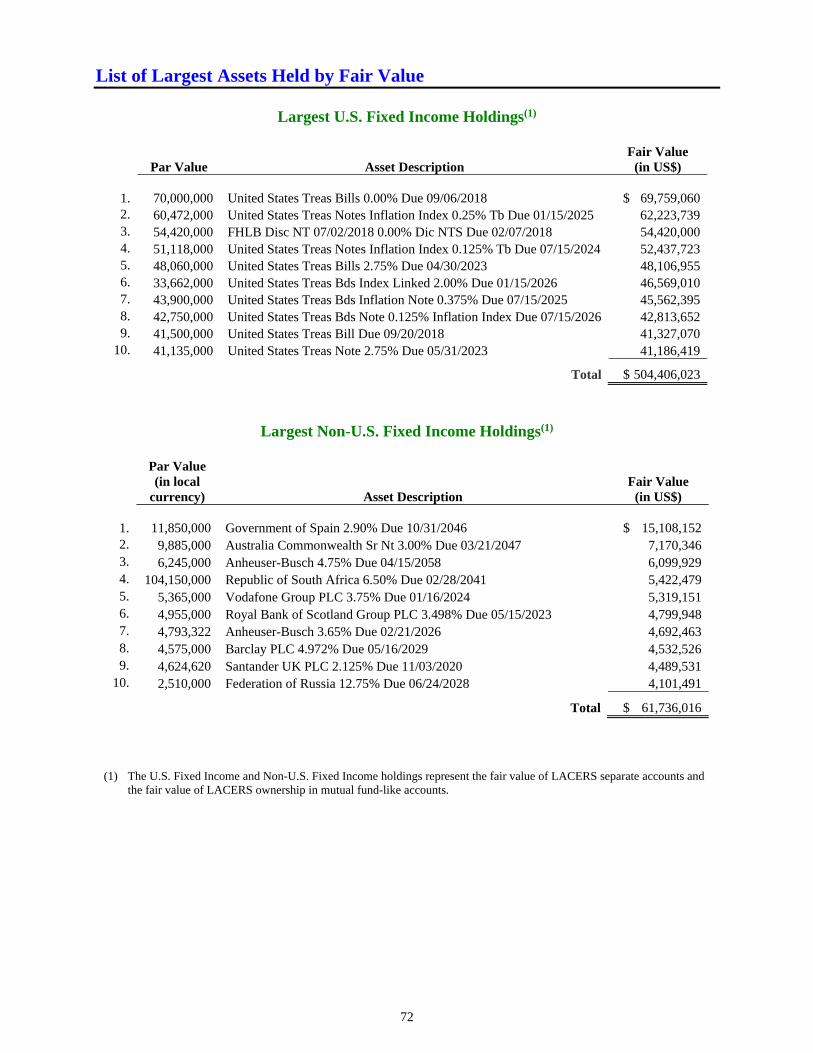
List of Largest Assets Held by Fair Value
72
Largest U.S. Fixed Income Holdings(1)
Par Value Asset Description Fair Value
(in US$)
1. 70,000,000 United States Treas Bills 0.00% Due 09/06/2018 $ 69,759,060 2. 60,472,000 United States Treas Notes Inflation Index 0.25% Tb Due 01/15/2025 62,223,739 3. 54,420,000 FHLB Disc NT 07/02/2018 0.00% Dic NTS Due 02/07/2018 54,420,000 4. 51,118,000 United States Treas Notes Inflation Index 0.125% Tb Due 07/15/2024 52,437,723 5. 48,060,000 United States Treas Bills 2.75% Due 04/30/2023 48,106,955 6. 33,662,000 United States Treas Bds Index Linked 2.00% Due 01/15/2026 46,569,010 7. 43,900,000 United States Treas Bds Inflation Note 0.375% Due 07/15/2025 45,562,395 8. 42,750,000 United States Treas Bds Note 0.125% Inflation Index Due 07/15/2026 42,813,652 9. 41,500,000 United States Treas Bill Due 09/20/2018 41,327,070
10. 41,135,000 United States Treas Note 2.75% Due 05/31/2023 41,186,419
Total $ 504,406,023
Largest Non-U.S. Fixed Income Holdings(1)
Par Value (in local
currency) Asset Description Fair Value
(in US$)
1. 11,850,000 Government of Spain 2.90% Due 10/31/2046 $ 15,108,152 2. 9,885,000 Australia Commonwealth Sr Nt 3.00% Due 03/21/2047 7,170,346 3. 6,245,000 Anheuser-Busch 4.75% Due 04/15/2058 6,099,929 4. 104,150,000 Republic of South Africa 6.50% Due 02/28/2041 5,422,479 5. 5,365,000 Vodafone Group PLC 3.75% Due 01/16/2024 5,319,151 6. 4,955,000 Royal Bank of Scotland Group PLC 3.498% Due 05/15/2023 4,799,948 7. 4,793,322 Anheuser-Busch 3.65% Due 02/21/2026 4,692,463 8. 4,575,000 Barclay PLC 4.972% Due 05/16/2029 4,532,526 9. 4,624,620 Santander UK PLC 2.125% Due 11/03/2020 4,489,531
10. 2,510,000 Federation of Russia 12.75% Due 06/24/2028 4,101,491
Total $ 61,736,016
(1) The U.S. Fixed Income and Non-U.S. Fixed Income holdings represent the fair value of LACERS separate accounts and
the fair value of LACERS ownership in mutual fund-like accounts.
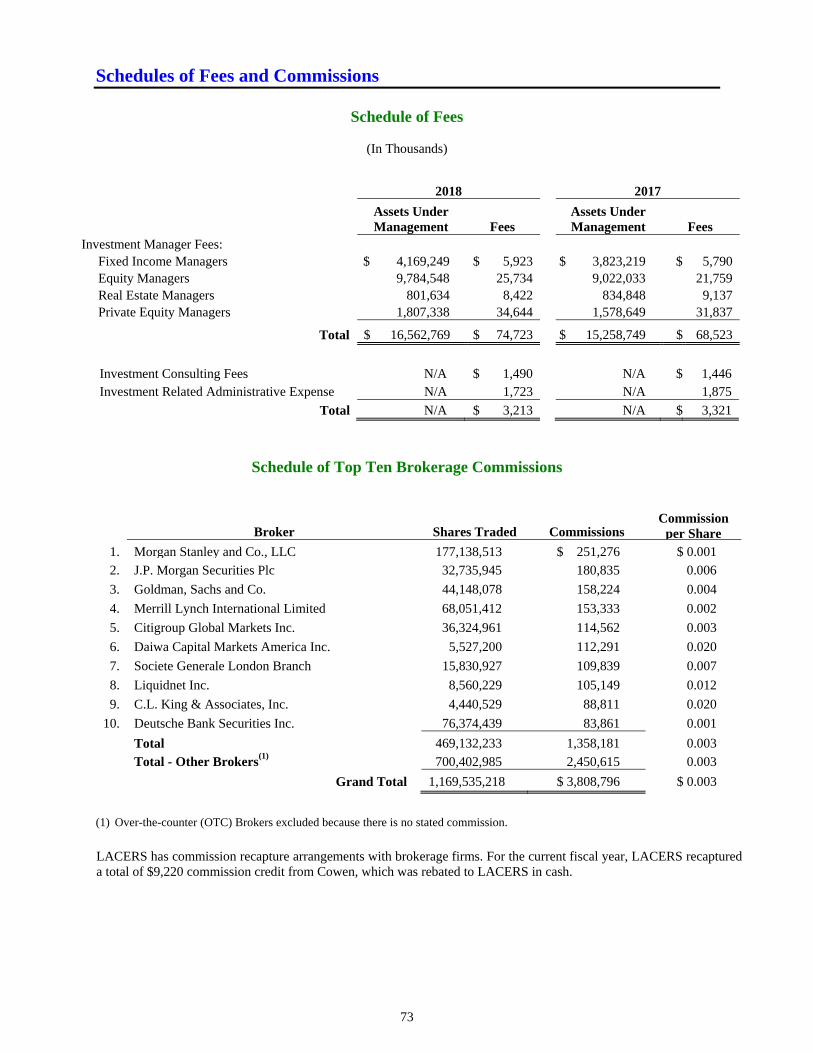
Schedules of Fees and Commissions
73
Schedule of Fees
(In Thousands)
2018 2017
Assets Under Management Fees
Assets Under Management Fees
Investment Manager Fees: Fixed Income Managers $ 4,169,249 $ 5,923 $ 3,823,219 $ 5,790 Equity Managers 9,784,548 25,734 9,022,033 21,759 Real Estate Managers 801,634 8,422 834,848 9,137 Private Equity Managers 1,807,338 34,644 1,578,649 31,837
Total $ 16,562,769 $ 74,723 $ 15,258,749 $ 68,523
Investment Consulting Fees N/A $ 1,490 N/A $ 1,446 Investment Related Administrative Expense N/A 1,723 N/A 1,875
Total N/A $ 3,213 N/A $ 3,321
Schedule of Top Ten Brokerage Commissions
Broker Shares Traded Commissions Commission
per Share1. Morgan Stanley and Co., LLC 177,138,513 $ 251,276 $ 0.0012. J.P. Morgan Securities Plc 32,735,945 180,835 0.006
3. Goldman, Sachs and Co. 44,148,078 158,224 0.004
4. Merrill Lynch International Limited 68,051,412 153,333 0.002
5. Citigroup Global Markets Inc. 36,324,961 114,562 0.003
6. Daiwa Capital Markets America Inc. 5,527,200 112,291 0.020
7. Societe Generale London Branch 15,830,927 109,839 0.007
8. Liquidnet Inc. 8,560,229 105,149 0.012
9. C.L. King & Associates, Inc. 4,440,529 88,811 0.020
10. Deutsche Bank Securities Inc. 76,374,439 83,861 0.001
Total 469,132,233 1,358,181 0.003Total - Other Brokers(1) 700,402,985 2,450,615 0.003
Grand Total 1,169,535,218 $ 3,808,796 $ 0.003
(1) Over-the-counter (OTC) Brokers excluded because there is no stated commission.
LACERS has commission recapture arrangements with brokerage firms. For the current fiscal year, LACERS recaptured a total of $9,220 commission credit from Cowen, which was rebated to LACERS in cash.
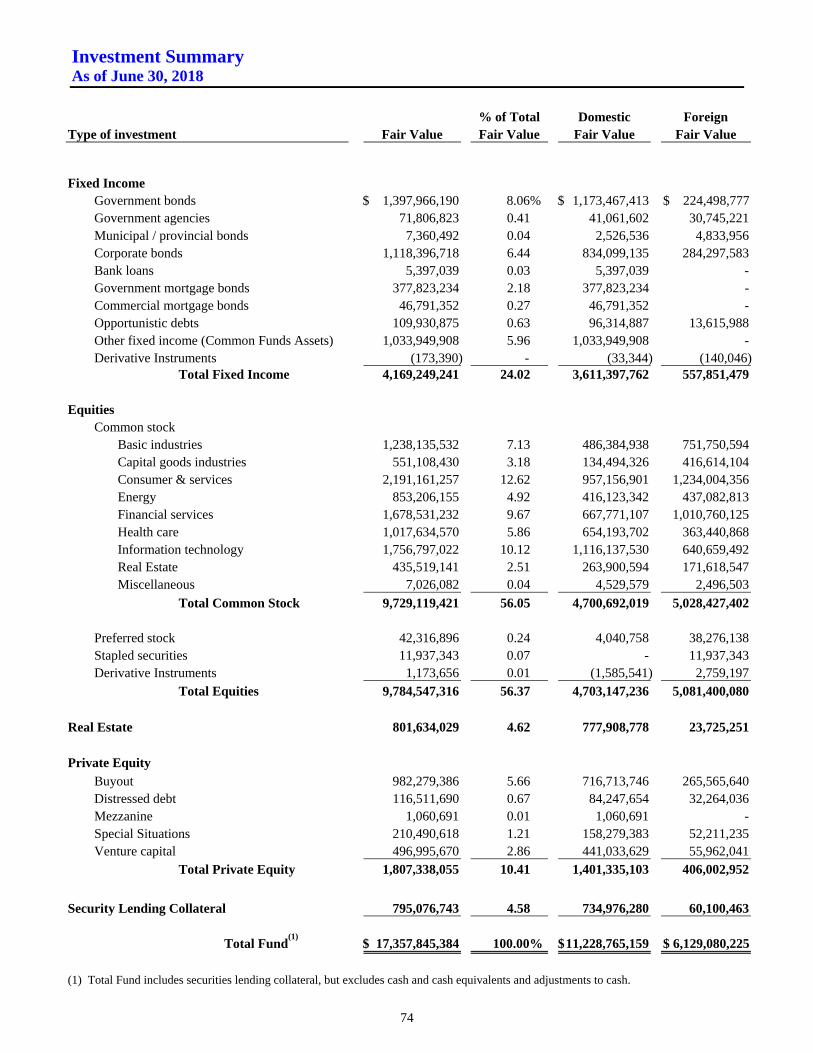
Investment Summary As of June 30, 2018
74
% of Total Domestic Foreign
Type of investment Fair Value Fair Value Fair Value Fair Value Fixed Income
Government bonds $ 1,397,966,190 8.06% $ 1,173,467,413 $ 224,498,777 Government agencies 71,806,823 0.41 41,061,602 30,745,221 Municipal / provincial bonds 7,360,492 0.04 2,526,536 4,833,956 Corporate bonds 1,118,396,718 6.44 834,099,135 284,297,583 Bank loans 5,397,039 0.03 5,397,039 - Government mortgage bonds 377,823,234 2.18 377,823,234 - Commercial mortgage bonds 46,791,352 0.27 46,791,352 - Opportunistic debts 109,930,875 0.63 96,314,887 13,615,988 Other fixed income (Common Funds Assets) 1,033,949,908 5.96 1,033,949,908 - Derivative Instruments (173,390) - (33,344) (140,046) Total Fixed Income 4,169,249,241 24.02 3,611,397,762 557,851,479
Equities
Common stock
Basic industries 1,238,135,532 7.13 486,384,938 751,750,594 Capital goods industries 551,108,430 3.18 134,494,326 416,614,104 Consumer & services 2,191,161,257 12.62 957,156,901 1,234,004,356 Energy 853,206,155 4.92 416,123,342 437,082,813 Financial services 1,678,531,232 9.67 667,771,107 1,010,760,125 Health care 1,017,634,570 5.86 654,193,702 363,440,868 Information technology 1,756,797,022 10.12 1,116,137,530 640,659,492 Real Estate 435,519,141 2.51 263,900,594 171,618,547 Miscellaneous 7,026,082 0.04 4,529,579 2,496,503
Total Common Stock 9,729,119,421 56.05 4,700,692,019 5,028,427,402
Preferred stock 42,316,896 0.24 4,040,758 38,276,138 Stapled securities 11,937,343 0.07 - 11,937,343 Derivative Instruments 1,173,656 0.01 (1,585,541) 2,759,197 Total Equities 9,784,547,316 56.37 4,703,147,236 5,081,400,080
Real Estate 801,634,029 4.62 777,908,778 23,725,251
Private Equity
Buyout 982,279,386 5.66 716,713,746 265,565,640 Distressed debt 116,511,690 0.67 84,247,654 32,264,036 Mezzanine 1,060,691 0.01 1,060,691 - Special Situations 210,490,618 1.21 158,279,383 52,211,235 Venture capital 496,995,670 2.86 441,033,629 55,962,041 Total Private Equity 1,807,338,055 10.41 1,401,335,103 406,002,952
Security Lending Collateral 795,076,743 4.58 734,976,280 60,100,463
Total Fund(1)
$ 17,357,845,384 100.00% $ 11,228,765,159 $ 6,129,080,225 (1) Total Fund includes securities lending collateral, but excludes cash and cash equivalents and adjustments to cash.
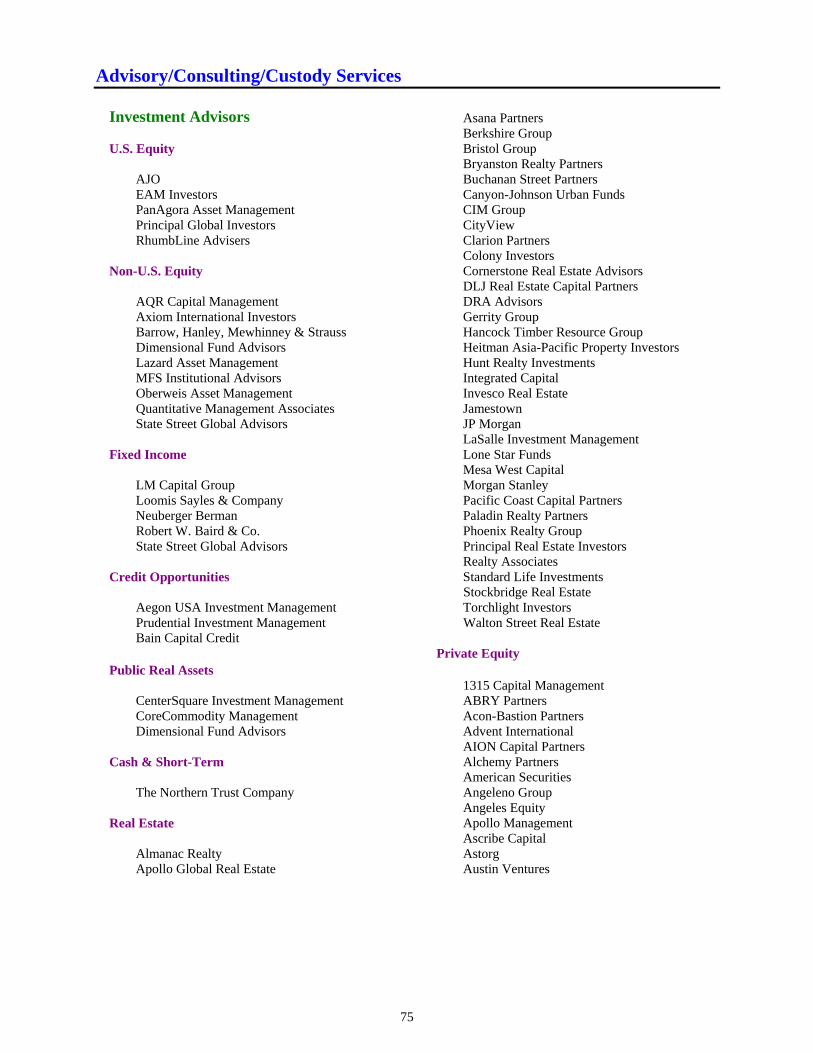
Advisory/Consulting/Custody Services
75
Investment Advisors Asana Partners Berkshire Group U.S. Equity Bristol Group Bryanston Realty Partners
AJO Buchanan Street Partners EAM Investors Canyon-Johnson Urban Funds PanAgora Asset Management CIM Group Principal Global Investors CityView RhumbLine Advisers Clarion Partners Colony Investors
Non-U.S. Equity Cornerstone Real Estate Advisors DLJ Real Estate Capital Partners
AQR Capital Management DRA Advisors Axiom International Investors Gerrity Group Barrow, Hanley, Mewhinney & Strauss Hancock Timber Resource Group Dimensional Fund Advisors Heitman Asia-Pacific Property Investors Lazard Asset Management Hunt Realty Investments MFS Institutional Advisors Integrated Capital Oberweis Asset Management Invesco Real Estate Quantitative Management Associates Jamestown State Street Global Advisors JP Morgan LaSalle Investment Management
Fixed Income Lone Star Funds Mesa West Capital
LM Capital Group Morgan Stanley Loomis Sayles & Company Pacific Coast Capital Partners Neuberger Berman Paladin Realty Partners Robert W. Baird & Co. Phoenix Realty Group State Street Global Advisors Principal Real Estate Investors Realty Associates
Credit Opportunities Standard Life Investments Stockbridge Real Estate
Aegon USA Investment Management Torchlight Investors Prudential Investment Management Walton Street Real Estate Bain Capital Credit
Private Equity Public Real Assets 1315 Capital Management
CenterSquare Investment Management ABRY Partners CoreCommodity Management Acon-Bastion Partners Dimensional Fund Advisors Advent International AION Capital Partners
Cash & Short-Term Alchemy Partners American Securities
The Northern Trust Company Angeleno Group Angeles Equity
Real Estate Apollo Management Ascribe Capital
Almanac Realty Astorg Apollo Global Real Estate Austin Ventures
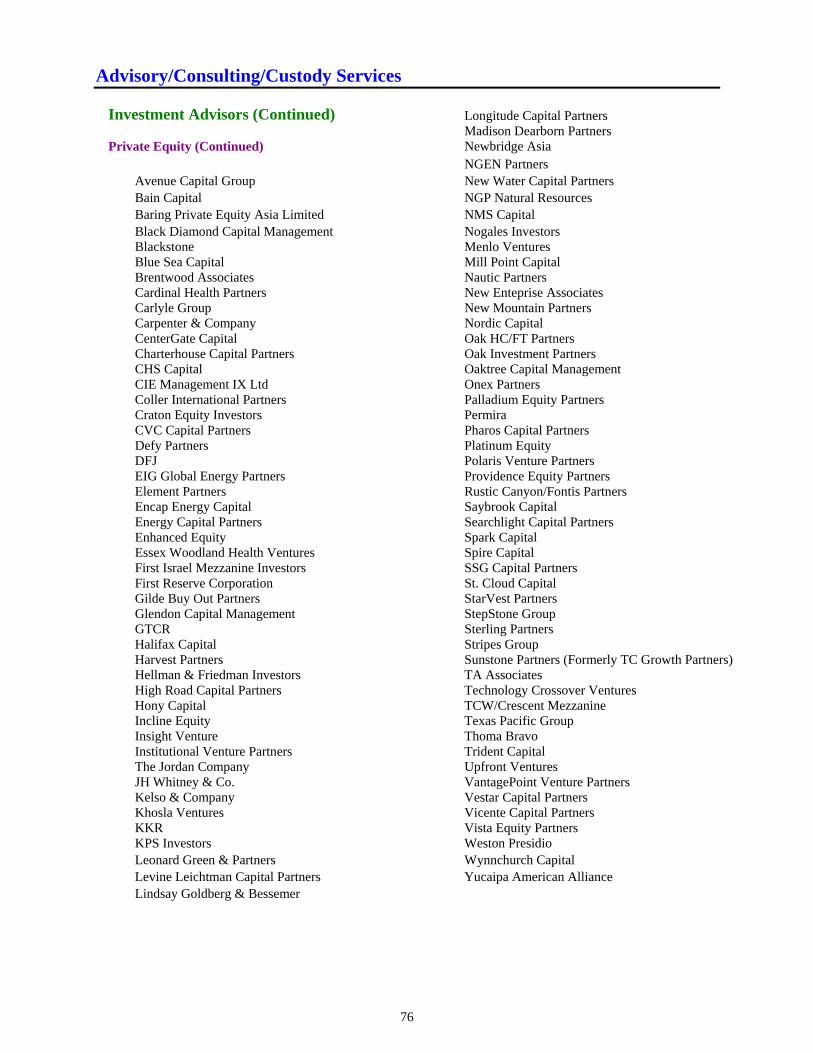
Advisory/Consulting/Custody Services
76
Investment Advisors (Continued) Longitude Capital Partners Madison Dearborn Partners Private Equity (Continued) Newbridge Asia
NGEN Partners Avenue Capital Group New Water Capital Partners Bain Capital NGP Natural Resources Baring Private Equity Asia Limited NMS Capital Black Diamond Capital Management Nogales Investors Blackstone Menlo Ventures Blue Sea Capital Mill Point Capital Brentwood Associates Nautic Partners Cardinal Health Partners New Enteprise Associates Carlyle Group New Mountain Partners Carpenter & Company Nordic Capital CenterGate Capital Oak HC/FT Partners Charterhouse Capital Partners Oak Investment Partners CHS Capital Oaktree Capital Management CIE Management IX Ltd Onex Partners Coller International Partners Palladium Equity Partners Craton Equity Investors Permira CVC Capital Partners Pharos Capital Partners Defy Partners Platinum Equity DFJ Polaris Venture Partners EIG Global Energy Partners Providence Equity Partners Element Partners Rustic Canyon/Fontis Partners Encap Energy Capital Saybrook Capital Energy Capital Partners Searchlight Capital Partners Enhanced Equity Spark Capital Essex Woodland Health Ventures Spire Capital First Israel Mezzanine Investors SSG Capital Partners First Reserve Corporation St. Cloud Capital Gilde Buy Out Partners StarVest Partners Glendon Capital Management StepStone Group GTCR Sterling Partners Halifax Capital Stripes Group Harvest Partners Sunstone Partners (Formerly TC Growth Partners) Hellman & Friedman Investors TA Associates High Road Capital Partners Technology Crossover Ventures Hony Capital TCW/Crescent Mezzanine Incline Equity Texas Pacific Group Insight Venture Thoma Bravo Institutional Venture Partners Trident Capital The Jordan Company Upfront Ventures JH Whitney & Co. VantagePoint Venture Partners Kelso & Company Vestar Capital Partners Khosla Ventures Vicente Capital Partners KKR Vista Equity Partners KPS Investors Weston Presidio Leonard Green & Partners Wynnchurch Capital Levine Leichtman Capital Partners Yucaipa American Alliance Lindsay Goldberg & Bessemer
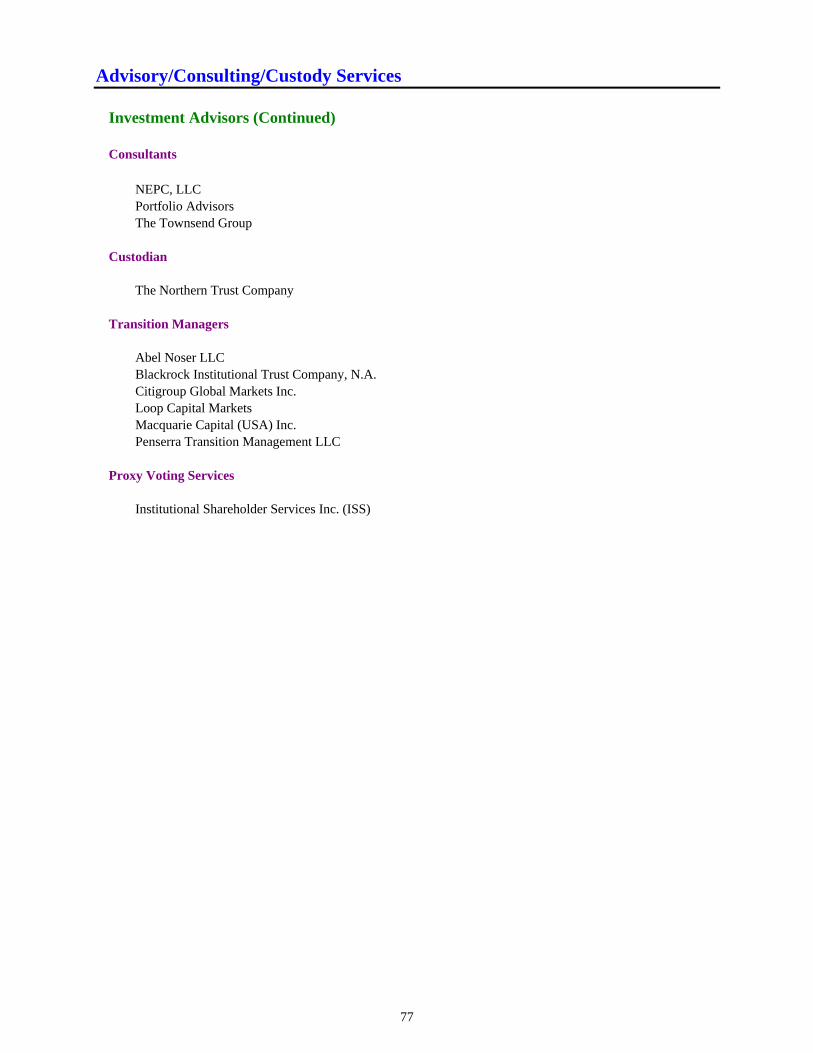
Advisory/Consulting/Custody Services
77
Investment Advisors (Continued) Consultants
NEPC, LLC Portfolio Advisors The Townsend Group
Custodian The Northern Trust Company
Transition Managers
Abel Noser LLC Blackrock Institutional Trust Company, N.A. Citigroup Global Markets Inc. Loop Capital Markets Macquarie Capital (USA) Inc. Penserra Transition Management LLC
Proxy Voting Services Institutional Shareholder Services Inc. (ISS)

This page intentionally left blank.

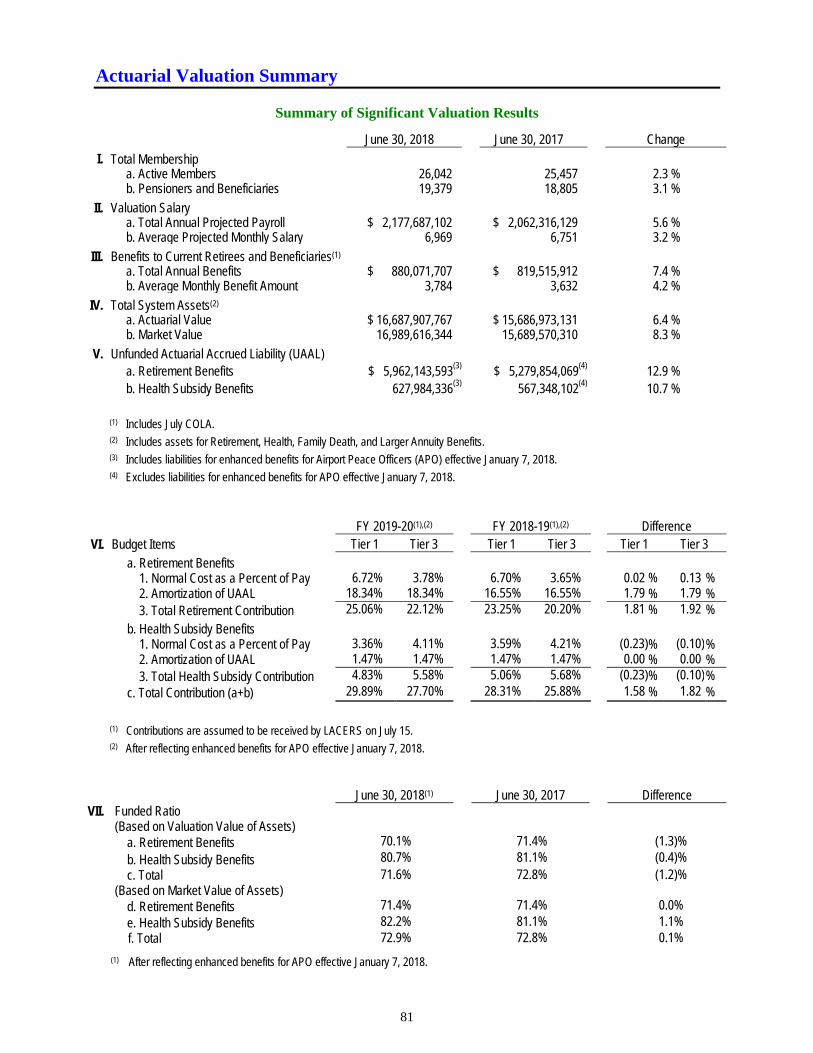
Actuarial Valuation Summary
81
Summary of Significant Valuation Results
June 30, 2018 June 30, 2017 Change
I. Total Membership a. Active Members 26,042 25,457 2.3 % b. Pensioners and Beneficiaries 19,379 18,805 3.1 %
II. Valuation Salary a. Total Annual Projected Payroll $ 2,177,687,102 $ 2,062,316,129 5.6 % b. Average Projected Monthly Salary 6,969 6,751 3.2 %
III. Benefits to Current Retirees and Beneficiaries(1) a. Total Annual Benefits $ 880,071,707 $ 819,515,912 7.4 % b. Average Monthly Benefit Amount 3,784 3,632 4.2 %
IV. Total System Assets(2) a. Actuarial Value $ 16,687,907,767 $ 15,686,973,131 6.4 % b. Market Value 16,989,616,344 15,689,570,310 8.3 %
V. Unfunded Actuarial Accrued Liability (UAAL) a. Retirement Benefits $ 5,962,143,593(3) $ 5,279,854,069(4) 12.9 % b. Health Subsidy Benefits 627,984,336(3) 567,348,102(4) 10.7 %
(1) Includes July COLA. (2) Includes assets for Retirement, Health, Family Death, and Larger Annuity Benefits. (3) Includes liabilities for enhanced benefits for Airport Peace Officers (APO) effective January 7, 2018. (4) Excludes liabilities for enhanced benefits for APO effective January 7, 2018.
FY 2019-20(1),(2)
FY 2018-19(1),(2)
Difference VI. Budget Items Tier 1 Tier 3 Tier 1 Tier 3 Tier 1 Tier 3
a. Retirement Benefits 1. Normal Cost as a Percent of Pay 6.72% 3.78% 6.70% 3.65% 0.02 % 0.13 % 2. Amortization of UAAL 18.34% 18.34% 16.55% 16.55% 1.79 % 1.79 % 3. Total Retirement Contribution 25.06% 22.12% 23.25% 20.20% 1.81 % 1.92 %
b. Health Subsidy Benefits 1. Normal Cost as a Percent of Pay 3.36% 4.11% 3.59% 4.21% (0.23) % (0.10) % 2. Amortization of UAAL 1.47% 1.47% 1.47% 1.47% 0.00 % 0.00 % 3. Total Health Subsidy Contribution 4.83% 5.58% 5.06% 5.68% (0.23) % (0.10) %c. Total Contribution (a+b) 29.89% 27.70% 28.31% 25.88% 1.58 % 1.82 %
(1) Contributions are assumed to be received by LACERS on July 15. (2) After reflecting enhanced benefits for APO effective January 7, 2018.
June 30, 2018(1)
June 30, 2017
Difference VII. Funded Ratio (Based on Valuation Value of Assets)
a. Retirement Benefits 70.1% 71.4% (1.3)% b. Health Subsidy Benefits 80.7% 81.1% (0.4)% c. Total 71.6% 72.8% (1.2)%
(Based on Market Value of Assets) d. Retirement Benefits 71.4% 71.4% 0.0% e. Health Subsidy Benefits 82.2% 81.1% 1.1% f. Total 72.9% 72.8% 0.1%
(1) After reflecting enhanced benefits for APO effective January 7, 2018.
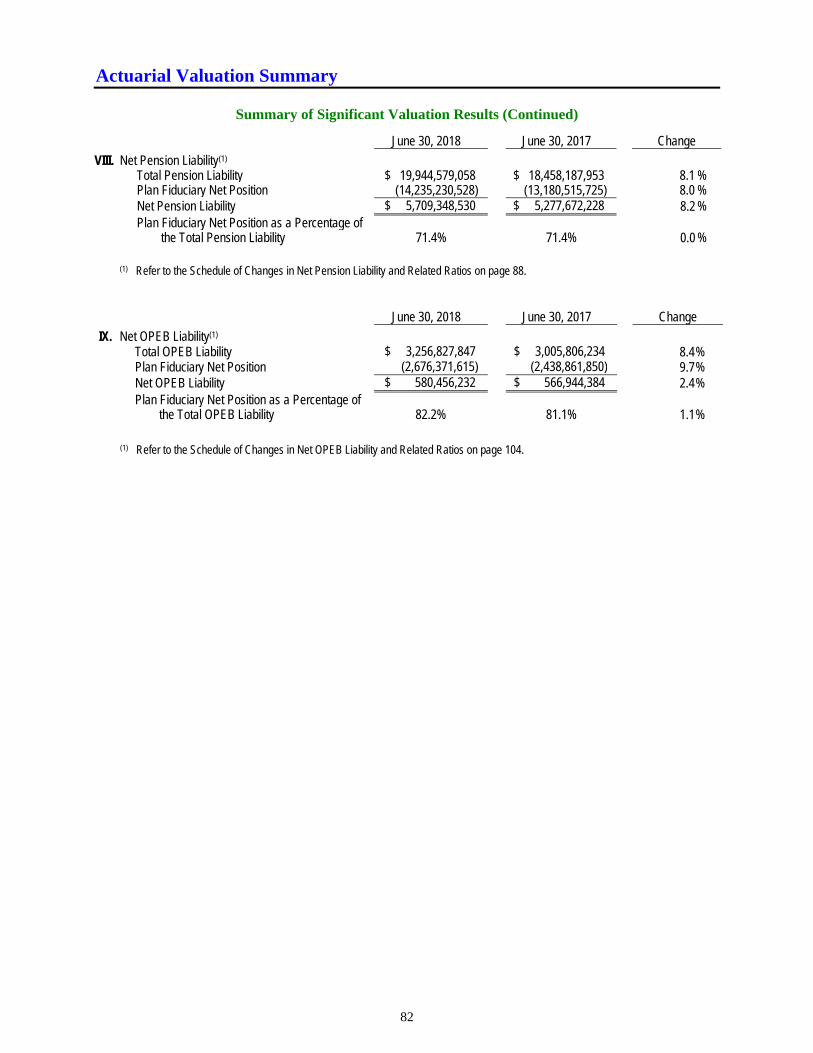
Actuarial Valuation Summary
82
Summary of Significant Valuation Results (Continued)
June 30, 2018 June 30, 2017 Change
VIII. Net Pension Liability(1) Total Pension Liability $ 19,944,579,058 $ 18,458,187,953 8.1 % Plan Fiduciary Net Position (14,235,230,528) (13,180,515,725) 8.0 % Net Pension Liability $ 5,709,348,530 $ 5,277,672,228 8.2 % Plan Fiduciary Net Position as a Percentage of
the Total Pension Liability 71.4%
71.4% 0.0 %
(1) Refer to the Schedule of Changes in Net Pension Liability and Related Ratios on page 88.
June 30, 2018 June 30, 2017 Change
IX. Net OPEB Liability(1) Total OPEB Liability $ 3,256,827,847 $ 3,005,806,234 8.4 % Plan Fiduciary Net Position (2,676,371,615) (2,438,861,850) 9.7 % Net OPEB Liability $ 580,456,232 $ 566,944,384 2.4 % Plan Fiduciary Net Position as a Percentage of
the Total OPEB Liability 82.2%
81.1% 1.1 %
(1) Refer to the Schedule of Changes in Net OPEB Liability and Related Ratios on page 104.
Retirement Benefits Valuation
83
100 Montgomery Street Suite 500 San Francisco, CA 94104-4308 T 415.263.8200 www.segalco.com
Actuarial Certification
November 7, 2018
This is to certify that Segal Consulting (Segal) has conducted an actuarial valuation of the Los Angeles City Employees’ Retirement System (LACERS or the System) retirement program as of June 30, 2018, in accordance with generally accepted actuarial principles and practices. In particular, it is our understanding that the assumptions and methods used for funding purposes meet the parameters set by the Actuarial Standards of Practice (ASOPs). Actuarial valuations are performed annually for this retirement program with the last valuation completed on June 30, 2017. The actuarial calculations presented in this report have been made on a basis consistent with our understanding of the historical funding methods used in determination of the liability for retirement benefits.
The actuarial valuation is based on the plan of benefits verified by LACERS and on participant and financial data provided by LACERS. Segal did not audit LACERS’ financial statements, but we conducted an examination of all participant data for reasonableness and we concluded that it was reasonable and consistent with the prior year’s data.
One of the general goals of an actuarial valuation is to establish contributions that fully fund the Retirement System’s liabilities, and that, as a percentage of payroll, remain as level as possible for each generation of active members. Both the Normal Cost and the Actuarial Accrued Liability are determined under the Entry Age cost method.
The actuarial computations made are for funding plan benefits. Accordingly, additional determinations will be needed for other purposes, such as satisfying financial accounting requirements under Governmental Accounting Standards Board (GASB) Statements No. 67 and No. 68 and judging benefit security at termination of the plan.
Segal prepared all of the supporting schedules in the Actuarial Section of the Comprehensive Annual Financial Report (CAFR) and certain supporting schedules in the Financial Section, based on the results of the June 30, 2018 actuarial valuation. A listing of the supporting schedules Segal prepared for inclusion in the Financial Section as Required Supplementary Information prescribed by GASB, and in the Actuarial Section, is provided below:
Financial Section 1) Schedule of Net Pension Liability* 2) Schedule of Changes in Net Pension Liability and Related Ratios* 3) Schedule of Contribution History* Actuarial Section 4) Summary of Significant Valuation Results 5) Active Member Valuation Data 6) Retirees and Beneficiaries Added to and Removed from Retiree Payroll 7) Schedule of Funded Liabilities by Type 8) Schedule of Funding Progress 9) Actuarial Analysis of Financial Experience 10) Actuarial Balance Sheet 11) Schedule of Changes in Net Pension Liability and Related Ratios* 12) Projection of Pension Plan’s Fiduciary Net Position for Use in Calculation of Discount Rate of 7.25% and
Preparation of GASB 67 Report as of June 30, 2018*
* Source: Segal’s GASB Statement No. 67 valuation report as of June 30, 2018.
Benefits, Compensation and HR Consulting. Member of The Segal Group. Offices throughout the United States and Canada
Retirement Benefits Valuation
84
Actuarial Certification (Continued)
LACERS’ staff prepared other trend data schedules in the Statistical Section based on information supplied in Segal’s valuation report.
To the best of our knowledge, this report is complete and accurate and in our opinion presents the plan’s current funding information. The undersigned is a member of the American Academy of Actuaries and is qualified to render the actuarial opinion contained herein.
Andy Yeung, ASA, MAAA, FCA, EA
Vice President and Actuary
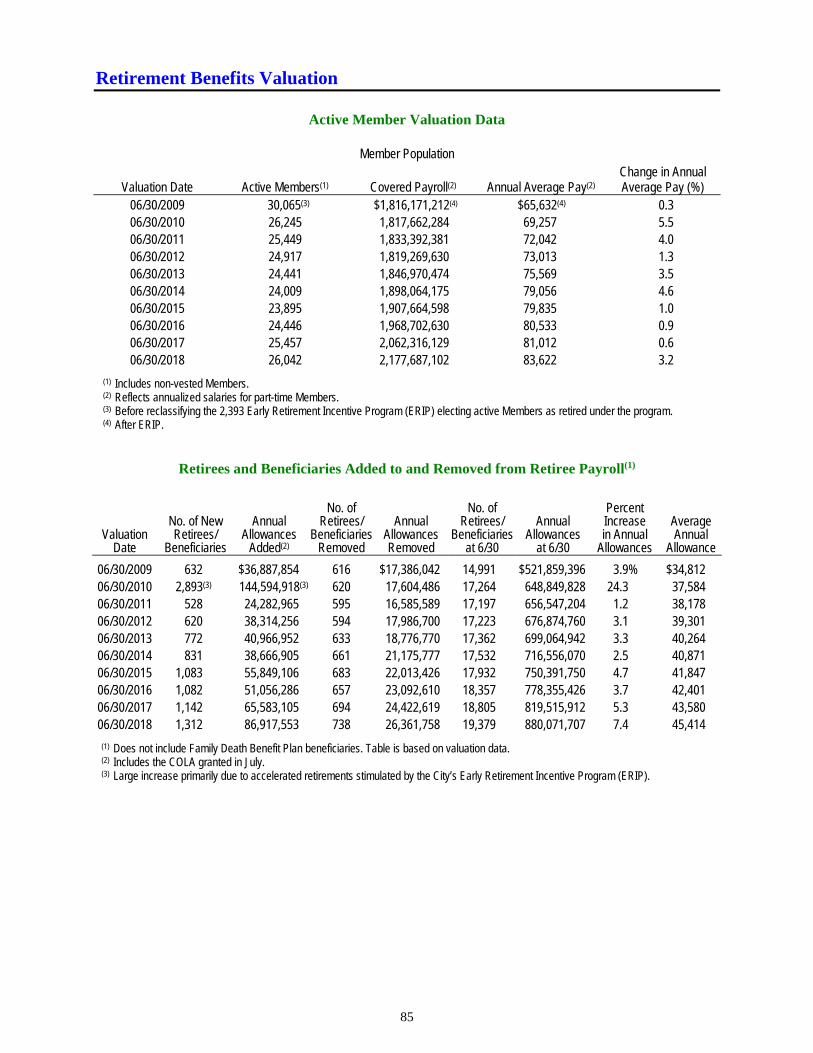
Retirement Benefits Valuation
85
Active Member Valuation Data
Member Population
Valuation Date Active Members(1) Covered Payroll(2) Annual Average Pay(2) Change in Annual Average Pay (%)
06/30/2009 30,065(3) $1,816,171,212(4) $65,632(4) 0.3 06/30/2010 26,245 1,817,662,284 69,257 5.5 06/30/2011 25,449 1,833,392,381 72,042 4.0 06/30/2012 24,917 1,819,269,630 73,013 1.3 06/30/2013 24,441 1,846,970,474 75,569 3.5 06/30/2014 24,009 1,898,064,175 79,056 4.6 06/30/2015 23,895 1,907,664,598 79,835 1.0 06/30/2016 24,446 1,968,702,630 80,533 0.9 06/30/2017 25,457 2,062,316,129 81,012 0.6 06/30/2018 26,042 2,177,687,102 83,622 3.2
(1) Includes non-vested Members. (2) Reflects annualized salaries for part-time Members. (3) Before reclassifying the 2,393 Early Retirement Incentive Program (ERIP) electing active Members as retired under the program. (4) After ERIP.
Retirees and Beneficiaries Added to and Removed from Retiree Payroll(1)
Valuation Date
No. of New Retirees/
Beneficiaries
Annual Allowances
Added(2)
No. of Retirees/
Beneficiaries Removed
Annual Allowances Removed
No. of Retirees/
Beneficiaries at 6/30
Annual Allowances
at 6/30
Percent Increase in Annual
Allowances
Average Annual
Allowance 06/30/2009 632 $36,887,854 616 $17,386,042 14,991 $521,859,396 3.9% $34,812
06/30/2010 2,893(3) 144,594,918(3) 620 17,604,486 17,264 648,849,828 24.3 37,584 06/30/2011 528 24,282,965 595 16,585,589 17,197 656,547,204 1.2 38,178 06/30/2012 620 38,314,256 594 17,986,700 17,223 676,874,760 3.1 39,301 06/30/2013 772 40,966,952 633 18,776,770 17,362 699,064,942 3.3 40,264 06/30/2014 831 38,666,905 661 21,175,777 17,532 716,556,070 2.5 40,871 06/30/2015 1,083 55,849,106 683 22,013,426 17,932 750,391,750 4.7 41,847 06/30/2016 1,082 51,056,286 657 23,092,610 18,357 778,355,426 3.7 42,401 06/30/2017 1,142 65,583,105 694 24,422,619 18,805 819,515,912 5.3 43,580 06/30/2018 1,312 86,917,553 738 26,361,758 19,379 880,071,707 7.4 45,414
(1) Does not include Family Death Benefit Plan beneficiaries. Table is based on valuation data. (2) Includes the COLA granted in July. (3) Large increase primarily due to accelerated retirements stimulated by the City’s Early Retirement Incentive Program (ERIP).
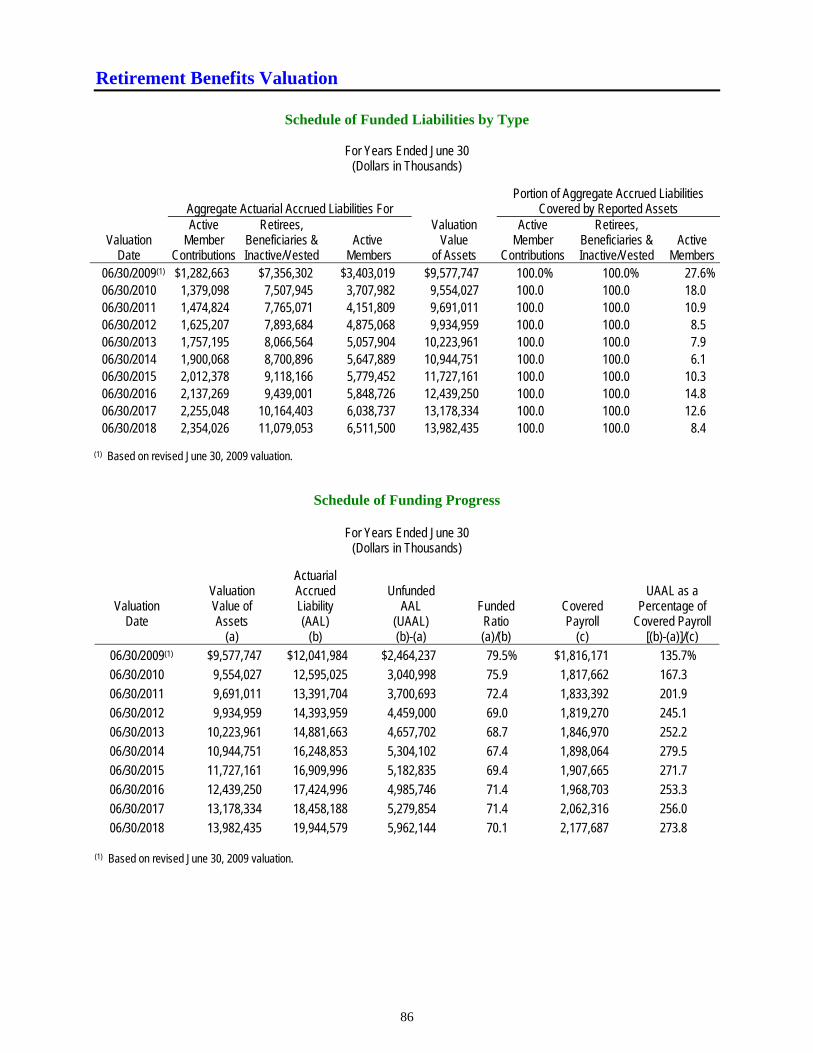
Retirement Benefits Valuation
86
Schedule of Funded Liabilities by Type
For Years Ended June 30
(Dollars in Thousands)
Aggregate Actuarial Accrued Liabilities For Portion of Aggregate Accrued Liabilities
Covered by Reported Assets
Valuation Date
Active Member
Contributions
Retirees, Beneficiaries & Inactive/Vested
Active Members
Valuation Value
of Assets
Active Member
Contributions
Retirees, Beneficiaries & Inactive/Vested
Active Members
06/30/2009(1) $1,282,663 $7,356,302 $3,403,019 $9,577,747 100.0% 100.0% 27.6% 06/30/2010 1,379,098 7,507,945 3,707,982 9,554,027 100.0 100.0 18.0 06/30/2011 1,474,824 7,765,071 4,151,809 9,691,011 100.0 100.0 10.9 06/30/2012 1,625,207 7,893,684 4,875,068 9,934,959 100.0 100.0 8.5 06/30/2013 1,757,195 8,066,564 5,057,904 10,223,961 100.0 100.0 7.9 06/30/2014 1,900,068 8,700,896 5,647,889 10,944,751 100.0 100.0 6.1 06/30/2015 2,012,378 9,118,166 5,779,452 11,727,161 100.0 100.0 10.3 06/30/2016 2,137,269 9,439,001 5,848,726 12,439,250 100.0 100.0 14.8 06/30/2017 2,255,048 10,164,403 6,038,737 13,178,334 100.0 100.0 12.6 06/30/2018 2,354,026 11,079,053 6,511,500 13,982,435 100.0 100.0 8.4
(1) Based on revised June 30, 2009 valuation.
Schedule of Funding Progress
For Years Ended June 30 (Dollars in Thousands)
Actuarial Valuation Accrued Unfunded UAAL as a
Valuation Value of Liability AAL Funded Covered Percentage of Date Assets (AAL) (UAAL) Ratio Payroll Covered Payroll
(a) (b) (b)-(a) (a)/(b) (c) [(b)-(a)]/(c) 06/30/2009(1) $9,577,747 $12,041,984 $2,464,237 79.5 % $1,816,171 135.7%
06/30/2010 9,554,027 12,595,025 3,040,998 75.9 1,817,662 167.3
06/30/2011 9,691,011 13,391,704 3,700,693 72.4 1,833,392 201.9
06/30/2012 9,934,959 14,393,959 4,459,000 69.0 1,819,270 245.1
06/30/2013 10,223,961 14,881,663 4,657,702 68.7 1,846,970 252.2
06/30/2014 10,944,751 16,248,853 5,304,102 67.4 1,898,064 279.5
06/30/2015 11,727,161 16,909,996 5,182,835 69.4 1,907,665 271.7
06/30/2016 12,439,250 17,424,996 4,985,746 71.4 1,968,703 253.3
06/30/2017 13,178,334 18,458,188 5,279,854 71.4 2,062,316 256.0
06/30/2018 13,982,435 19,944,579 5,962,144 70.1 2,177,687 273.8
(1) Based on revised June 30, 2009 valuation.
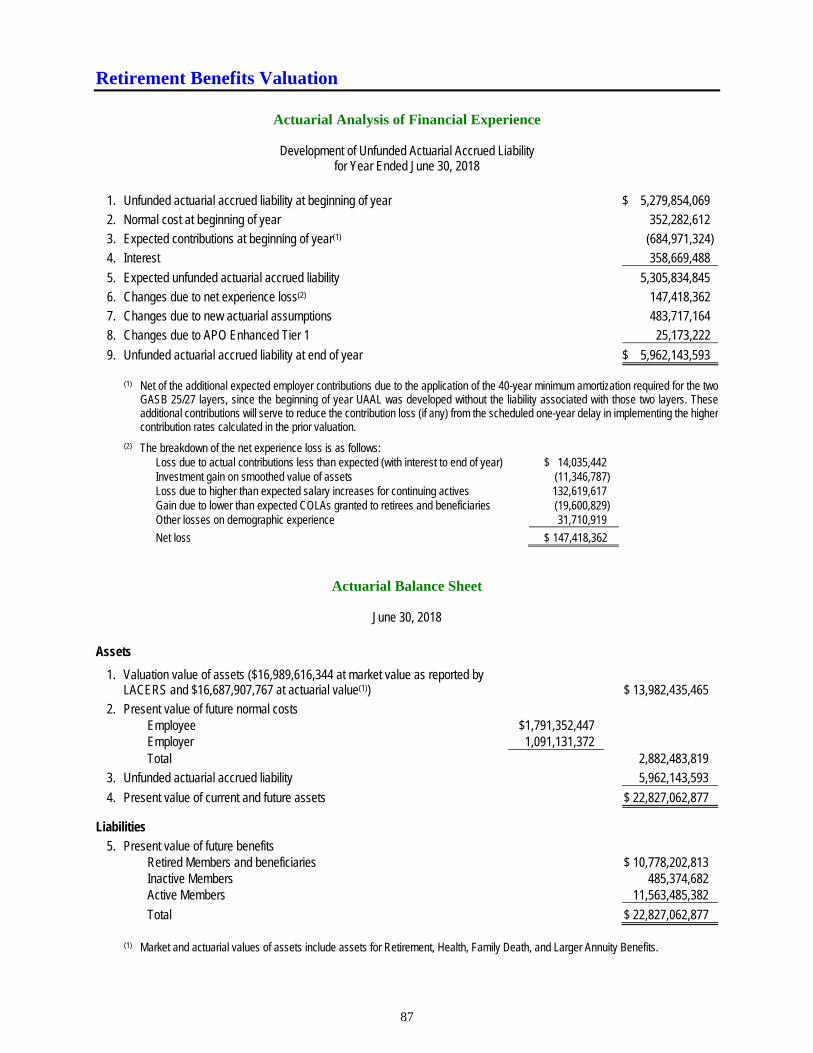
Retirement Benefits Valuation
87
Actuarial Analysis of Financial Experience
Development of Unfunded Actuarial Accrued Liability
for Year Ended June 30, 2018
1. Unfunded actuarial accrued liability at beginning of year $ 5,279,854,069
2. Normal cost at beginning of year 352,282,612
3. Expected contributions at beginning of year(1) (684,971,324)
4. Interest 358,669,488
5. Expected unfunded actuarial accrued liability 5,305,834,845
6. Changes due to net experience loss(2) 147,418,362
7. Changes due to new actuarial assumptions 483,717,164
8. Changes due to APO Enhanced Tier 1 25,173,222
9. Unfunded actuarial accrued liability at end of year $ 5,962,143,593
(1) Net of the additional expected employer contributions due to the application of the 40-year minimum amortization required for the two GASB 25/27 layers, since the beginning of year UAAL was developed without the liability associated with those two layers. These additional contributions will serve to reduce the contribution loss (if any) from the scheduled one-year delay in implementing the higher contribution rates calculated in the prior valuation.
(2) The breakdown of the net experience loss is as follows: Loss due to actual contributions less than expected (with interest to end of year) $ 14,035,442 Investment gain on smoothed value of assets (11,346,787) Loss due to higher than expected salary increases for continuing actives 132,619,617 Gain due to lower than expected COLAs granted to retirees and beneficiaries (19,600,829) Other losses on demographic experience 31,710,919
Net loss $ 147,418,362
Actuarial Balance Sheet
June 30, 2018
Assets
1. Valuation value of assets ($16,989,616,344 at market value as reported by LACERS and $16,687,907,767 at actuarial value(1))
$ 13,982,435,465
2. Present value of future normal costs Employee $1,791,352,447 Employer 1,091,131,372 Total 2,882,483,819
3. Unfunded actuarial accrued liability 5,962,143,593
4. Present value of current and future assets $ 22,827,062,877
Liabilities
5. Present value of future benefits Retired Members and beneficiaries $ 10,778,202,813 Inactive Members 485,374,682 Active Members 11,563,485,382
Total $ 22,827,062,877
(1) Market and actuarial values of assets include assets for Retirement, Health, Family Death, and Larger Annuity Benefits.
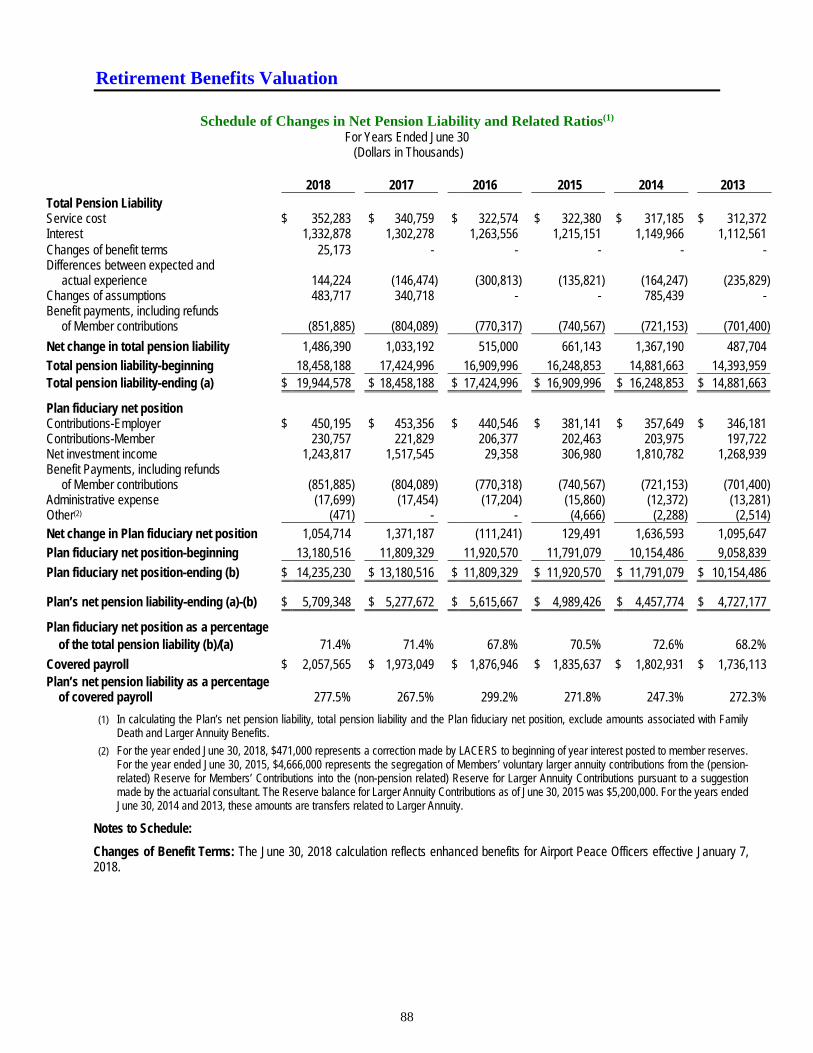
Retirement Benefits Valuation
88
Schedule of Changes in Net Pension Liability and Related Ratios(1)
For Years Ended June 30 (Dollars in Thousands)
2018 2017 2016 2015 2014 2013 Total Pension Liability Service cost $ 352,283 $ 340,759 $ 322,574 $ 322,380 $ 317,185 $ 312,372 Interest 1,332,878 1,302,278 1,263,556 1,215,151 1,149,966 1,112,561 Changes of benefit terms 25,173 - - - - - Differences between expected and
actual experience 144,224
(146,474)
(300,813)
(135,821)
(164,247) (235,829)Changes of assumptions 483,717 340,718 - - 785,439 - Benefit payments, including refunds of Member contributions (851,885)
(804,089)
(770,317)
(740,567)
(721,153) (701,400)
Net change in total pension liability 1,486,390 1,033,192 515,000 661,143 1,367,190 487,704
Total pension liability-beginning 18,458,188 17,424,996 16,909,996 16,248,853 14,881,663 14,393,959 Total pension liability-ending (a) $ 19,944,578 $ 18,458,188 $ 17,424,996 $ 16,909,996 $ 16,248,853 $ 14,881,663
Plan fiduciary net position Contributions-Employer $ 450,195 $ 453,356 $ 440,546 $ 381,141 $ 357,649 $ 346,181 Contributions-Member 230,757 221,829 206,377 202,463 203,975 197,722 Net investment income 1,243,817 1,517,545 29,358 306,980 1,810,782 1,268,939 Benefit Payments, including refunds of Member contributions (851,885)
(804,089)
(770,318)
(740,567)
(721,153) (701,400)
Administrative expense (17,699) (17,454) (17,204) (15,860) (12,372) (13,281)Other(2) (471) - - (4,666) (2,288) (2,514)Net change in Plan fiduciary net position 1,054,714 1,371,187 (111,241) 129,491 1,636,593 1,095,647
Plan fiduciary net position-beginning 13,180,516 11,809,329 11,920,570 11,791,079 10,154,486 9,058,839
Plan fiduciary net position-ending (b) $ 14,235,230 $ 13,180,516 $ 11,809,329 $ 11,920,570 $ 11,791,079 $ 10,154,486
Plan’s net pension liability-ending (a)-(b) $ 5,709,348 $ 5,277,672 $ 5,615,667 $ 4,989,426 $ 4,457,774 $ 4,727,177
Plan fiduciary net position as a percentage of the total pension liability (b)/(a) 71.4% 71.4% 67.8% 70.5% 72.6% 68.2%
Covered payroll $ 2,057,565 $ 1,973,049 $ 1,876,946 $ 1,835,637 $ 1,802,931 $ 1,736,113 Plan’s net pension liability as a percentage of covered payroll 277.5% 267.5% 299.2% 271.8% 247.3% 272.3%
(1) In calculating the Plan’s net pension liability, total pension liability and the Plan fiduciary net position, exclude amounts associated with Family Death and Larger Annuity Benefits.
(2) For the year ended June 30, 2018, $471,000 represents a correction made by LACERS to beginning of year interest posted to member reserves. For the year ended June 30, 2015, $4,666,000 represents the segregation of Members’ voluntary larger annuity contributions from the (pension-related) Reserve for Members’ Contributions into the (non-pension related) Reserve for Larger Annuity Contributions pursuant to a suggestion made by the actuarial consultant. The Reserve balance for Larger Annuity Contributions as of June 30, 2015 was $5,200,000. For the years ended June 30, 2014 and 2013, these amounts are transfers related to Larger Annuity.
Notes to Schedule:
Changes of Benefit Terms: The June 30, 2018 calculation reflects enhanced benefits for Airport Peace Officers effective January 7, 2018.
Retirement Benefits Valuation
89
Schedule of Changes in Net Pension Liability and Related Ratios (Continued)
Notes to Schedule: (Continued)
Changes of Assumptions: The June 30, 2018 calculations reflected various non-economic assumption changes based on the triennial experience study for the period from July 1, 2014 through June 30, 2017. The increase in the total pension liability for the fiscal year ended on June 30, 2018 resulting from the assumption changes is primarily due to the mortality assumption change.
The June 30, 2017 calculations reflected various economic assumption changes based on the Review of Economic Actuarial Assumptions report dated June 30, 2017 and on the Supplemental Information report dated August 10, 2017. The increase in the total pension liability for the fiscal year ended on June 30, 2017 is primarily due to the lowered assumed investment rate of return from 7.50% to 7.25%, offset somewhat by the decrease in the inflation assumption from 3.25% to 3.00%, and the decrease in the across-the-board salary increase assumption from 0.75% to 0.50%.
The June 30, 2014 calculations reflected various assumption changes based on the triennial experience study for the period from July 1, 2011 through June 30, 2014. The increase in the total pension liability for the fiscal year ended on June 30, 2014 is primarily due to the lowered assumed investment rate of return from 7.75% to 7.50%, and longer assumed life expectancies for Members and beneficiaries.
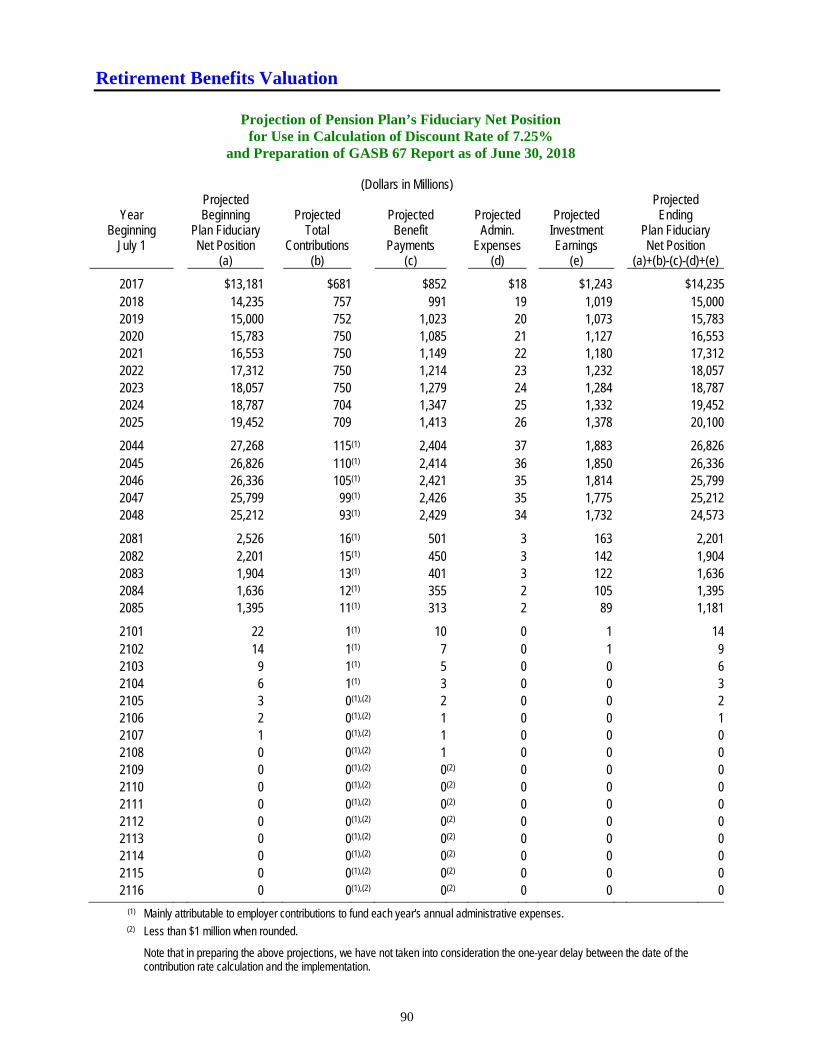
Retirement Benefits Valuation
90
Projection of Pension Plan’s Fiduciary Net Position
for Use in Calculation of Discount Rate of 7.25% and Preparation of GASB 67 Report as of June 30, 2018
(Dollars in Millions)
Projected Projected Year Beginning Projected Projected Projected Projected Ending
Beginning Plan Fiduciary Total Benefit Admin. Investment Plan Fiduciary July 1 Net Position Contributions Payments Expenses Earnings Net Position
(a) (b) (c) (d) (e) (a)+(b)-(c)-(d)+(e)
2017 $13,181 $681 $852 $18 $1,243 $14,235 2018 14,235 757 991 19 1,019 15,0002019 15,000 752 1,023 20 1,073 15,7832020 15,783 750 1,085 21 1,127 16,5532021 16,553 750 1,149 22 1,180 17,3122022 17,312 750 1,214 23 1,232 18,0572023 18,057 750 1,279 24 1,284 18,7872024 18,787 704 1,347 25 1,332 19,4522025 19,452 709 1,413 26 1,378 20,100
2044 27,268 115(1) 2,404 37 1,883 26,8262045 26,826 110(1) 2,414 36 1,850 26,3362046 26,336 105(1) 2,421 35 1,814 25,7992047 25,799 99(1) 2,426 35 1,775 25,2122048 25,212 93(1) 2,429 34 1,732 24,573
2081 2,526 16(1) 501 3 163 2,2012082 2,201 15(1) 450 3 142 1,9042083 1,904 13(1) 401 3 122 1,6362084 1,636 12(1) 355 2 105 1,3952085 1,395 11(1) 313 2 89 1,181
2101 22 1(1) 10 0 1 142102 14 1(1) 7 0 1 92103 9 1(1) 5 0 0 62104 6 1(1) 3 0 0 32105 3 0(1),(2) 2 0 0 22106 2 0(1),(2) 1 0 0 12107 1 0(1),(2) 1 0 0 02108 0 0(1),(2) 1 0 0 02109 0 0(1),(2) 0(2) 0 0 02110 0 0(1),(2) 0(2) 0 0 02111 0 0(1),(2) 0(2) 0 0 02112 0 0(1),(2) 0(2) 0 0 02113 0 0(1),(2) 0(2) 0 0 02114 0 0(1),(2) 0(2) 0 0 02115 0 0(1),(2) 0(2) 0 0 02116 0 0(1),(2) 0(2) 0 0 0
(1) Mainly attributable to employer contributions to fund each year's annual administrative expenses. (2) Less than $1 million when rounded.
Note that in preparing the above projections, we have not taken into consideration the one-year delay between the date of the contribution rate calculation and the implementation.
Retirement Benefits Valuation
91
Projection of Pension Plan’s Fiduciary Net Position
for Use in Calculation of Discount Rate of 7.25% and Preparation of GASB 67 Report as of June 30, 2018 (Continued)
Notes to Schedule:
1. Amounts may not total exactly due to rounding.
2. Amounts shown for the year beginning July 1, 2017 row are actual amounts, based on the unaudited financial statements provided by LACERS.
3. Years 2026-2043, 2049-2080, and 2086-2100 have been omitted from this table.
4. Column (a): None of the projected beginning Plan Fiduciary Net Position amounts shown have been adjusted for the time value of money.
5. Column (b): Projected total contributions include employee and employer normal cost contributions based on closed group projections (based on covered active Members as of June 30, 2018); plus employer contributions to the unfunded actuarial accrued liability; plus contributions to fund each year's annual administrative expenses reflecting a 15-year amortization schedule. Contributions are assumed to occur halfway through the year, on average.
6. Column (c): Projected benefit payments have been determined in accordance with paragraph 39 of GASB Statement No. 67, and are based on the closed group of active, inactive vested, retired Members, and beneficiaries as of June 30, 2018. The projected benefit payments reflect the cost of living increase assumptions used in the June 30, 2018 funding valuation report. Benefit payments are assumed to occur halfway through the year, on average. In accordance with paragraph 31.b.(1)(e) of GASB Statement No. 67, the long-term expected rate of return on Plan investments of 7.25% was applied to all periods of projected benefit payments to determine the discount rate.
7. Column (d): Projected administrative expenses are calculated as approximately 0.13% of the projected beginning Plan Fiduciary Net Position amount. The 0.13% portion was based on the actual fiscal year 2017-18 administrative expenses as a percentage of the beginning Plan Fiduciary Net Position amount as of July 1, 2017. Administrative expenses are assumed to occur halfway through the year, on average.
8. Column (e): Projected investment earnings are based on the assumed investment rate of return of 7.25% per annum.
9. As illustrated in this Schedule, the Plan's Fiduciary Net Position was projected to be available to make all projected future benefit payments for current Plan Members. In other words, there is no projected 'cross-over date' when projected benefits are not covered by projected assets. Therefore, the long-term expected rate of return on Plan investments of 7.25% per annum was applied to all periods of projected benefit payments to determine the Total Pension Liability as of June 30, 2018 shown in the GASB 67 report, pursuant to paragraph 44 of GASB Statement No. 67.
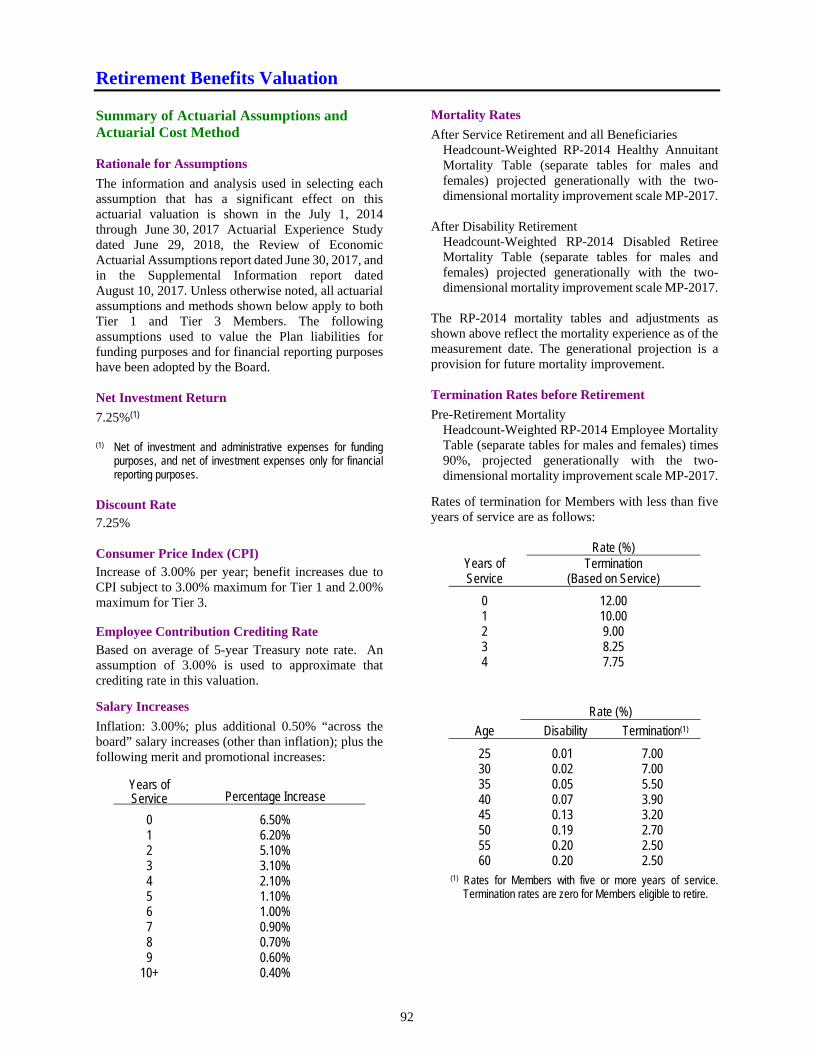
Retirement Benefits Valuation
92
Summary of Actuarial Assumptions and Actuarial Cost Method Rationale for Assumptions
The information and analysis used in selecting each assumption that has a significant effect on this actuarial valuation is shown in the July 1, 2014 through June 30, 2017 Actuarial Experience Study dated June 29, 2018, the Review of Economic Actuarial Assumptions report dated June 30, 2017, and in the Supplemental Information report dated August 10, 2017. Unless otherwise noted, all actuarial assumptions and methods shown below apply to both Tier 1 and Tier 3 Members. The following assumptions used to value the Plan liabilities for funding purposes and for financial reporting purposes have been adopted by the Board. Net Investment Return
7.25%(1) (1) Net of investment and administrative expenses for funding
purposes, and net of investment expenses only for financial reporting purposes.
Discount Rate
7.25% Consumer Price Index (CPI)
Increase of 3.00% per year; benefit increases due to CPI subject to 3.00% maximum for Tier 1 and 2.00% maximum for Tier 3. Employee Contribution Crediting Rate
Based on average of 5-year Treasury note rate. An assumption of 3.00% is used to approximate that crediting rate in this valuation.
Salary Increases
Inflation: 3.00%; plus additional 0.50% “across the board” salary increases (other than inflation); plus the following merit and promotional increases:
Years of Service Percentage Increase
0 6.50% 1 6.20% 2 5.10% 3 3.10% 4 2.10% 5 1.10% 6 1.00% 7 0.90% 8 0.70% 9 0.60%
10+ 0.40%
Mortality Rates
After Service Retirement and all Beneficiaries Headcount-Weighted RP-2014 Healthy Annuitant Mortality Table (separate tables for males and females) projected generationally with the two-dimensional mortality improvement scale MP-2017.
After Disability Retirement
Headcount-Weighted RP-2014 Disabled Retiree Mortality Table (separate tables for males and females) projected generationally with the two-dimensional mortality improvement scale MP-2017.
The RP-2014 mortality tables and adjustments as shown above reflect the mortality experience as of the measurement date. The generational projection is a provision for future mortality improvement. Termination Rates before Retirement
Pre-Retirement Mortality Headcount-Weighted RP-2014 Employee Mortality Table (separate tables for males and females) times 90%, projected generationally with the two-dimensional mortality improvement scale MP-2017.
Rates of termination for Members with less than five years of service are as follows:
Rate (%) Years of Service
Termination (Based on Service)
0 12.00 1 10.00 2 9.00 3 8.25 4 7.75
Rate (%)
Age Disability Termination(1)
25 0.01 7.00 30 0.02 7.00 35 0.05 5.50 40 0.07 3.90 45 0.13 3.20 50 0.19 2.70 55 0.20 2.50 60 0.20 2.50
(1) Rates for Members with five or more years of service. Termination rates are zero for Members eligible to retire.
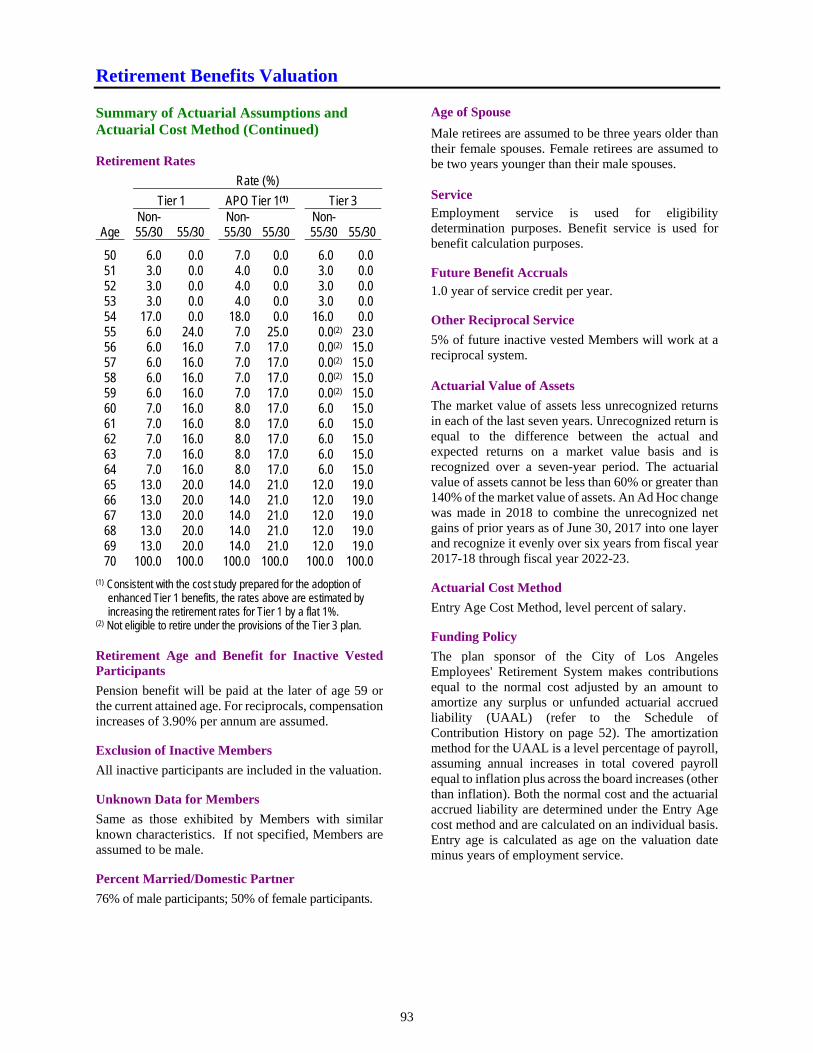
Retirement Benefits Valuation
93
Summary of Actuarial Assumptions and Actuarial Cost Method (Continued) Retirement Rates
Rate (%)
Tier 1 APO Tier 1(1) Tier 3
Age Non-55/30 55/30
Non-55/30 55/30
Non-55/30 55/30
50 6.0 0.0 7.0 0.0 6.0 0.0 51 3.0 0.0 4.0 0.0 3.0 0.0 52 3.0 0.0 4.0 0.0 3.0 0.0 53 3.0 0.0 4.0 0.0 3.0 0.0 54 17.0 0.0 18.0 0.0 16.0 0.0 55 6.0 24.0 7.0 25.0 0.0(2) 23.0 56 6.0 16.0 7.0 17.0 0.0(2) 15.0 57 6.0 16.0 7.0 17.0 0.0(2) 15.0 58 6.0 16.0 7.0 17.0 0.0(2) 15.0 59 6.0 16.0 7.0 17.0 0.0(2) 15.0 60 7.0 16.0 8.0 17.0 6.0 15.0 61 7.0 16.0 8.0 17.0 6.0 15.0 62 7.0 16.0 8.0 17.0 6.0 15.0 63 7.0 16.0 8.0 17.0 6.0 15.0 64 7.0 16.0 8.0 17.0 6.0 15.0 65 13.0 20.0 14.0 21.0 12.0 19.0 66 13.0 20.0 14.0 21.0 12.0 19.0 67 13.0 20.0 14.0 21.0 12.0 19.0 68 13.0 20.0 14.0 21.0 12.0 19.0 69 13.0 20.0 14.0 21.0 12.0 19.0 70 100.0 100.0 100.0 100.0 100.0 100.0
(1) Consistent with the cost study prepared for the adoption of enhanced Tier 1 benefits, the rates above are estimated by increasing the retirement rates for Tier 1 by a flat 1%.
(2) Not eligible to retire under the provisions of the Tier 3 plan.
Retirement Age and Benefit for Inactive Vested Participants
Pension benefit will be paid at the later of age 59 or the current attained age. For reciprocals, compensation increases of 3.90% per annum are assumed. Exclusion of Inactive Members
All inactive participants are included in the valuation. Unknown Data for Members
Same as those exhibited by Members with similar known characteristics. If not specified, Members are assumed to be male. Percent Married/Domestic Partner
76% of male participants; 50% of female participants.
Age of Spouse
Male retirees are assumed to be three years older than their female spouses. Female retirees are assumed to be two years younger than their male spouses. Service
Employment service is used for eligibility determination purposes. Benefit service is used for benefit calculation purposes. Future Benefit Accruals
1.0 year of service credit per year. Other Reciprocal Service
5% of future inactive vested Members will work at a reciprocal system. Actuarial Value of Assets
The market value of assets less unrecognized returns in each of the last seven years. Unrecognized return is equal to the difference between the actual and expected returns on a market value basis and is recognized over a seven-year period. The actuarial value of assets cannot be less than 60% or greater than 140% of the market value of assets. An Ad Hoc change was made in 2018 to combine the unrecognized net gains of prior years as of June 30, 2017 into one layer and recognize it evenly over six years from fiscal year 2017-18 through fiscal year 2022-23. Actuarial Cost Method
Entry Age Cost Method, level percent of salary. Funding Policy
The plan sponsor of the City of Los Angeles Employees' Retirement System makes contributions equal to the normal cost adjusted by an amount to amortize any surplus or unfunded actuarial accrued liability (UAAL) (refer to the Schedule of Contribution History on page 52). The amortization method for the UAAL is a level percentage of payroll, assuming annual increases in total covered payroll equal to inflation plus across the board increases (other than inflation). Both the normal cost and the actuarial accrued liability are determined under the Entry Age cost method and are calculated on an individual basis. Entry age is calculated as age on the valuation date minus years of employment service.
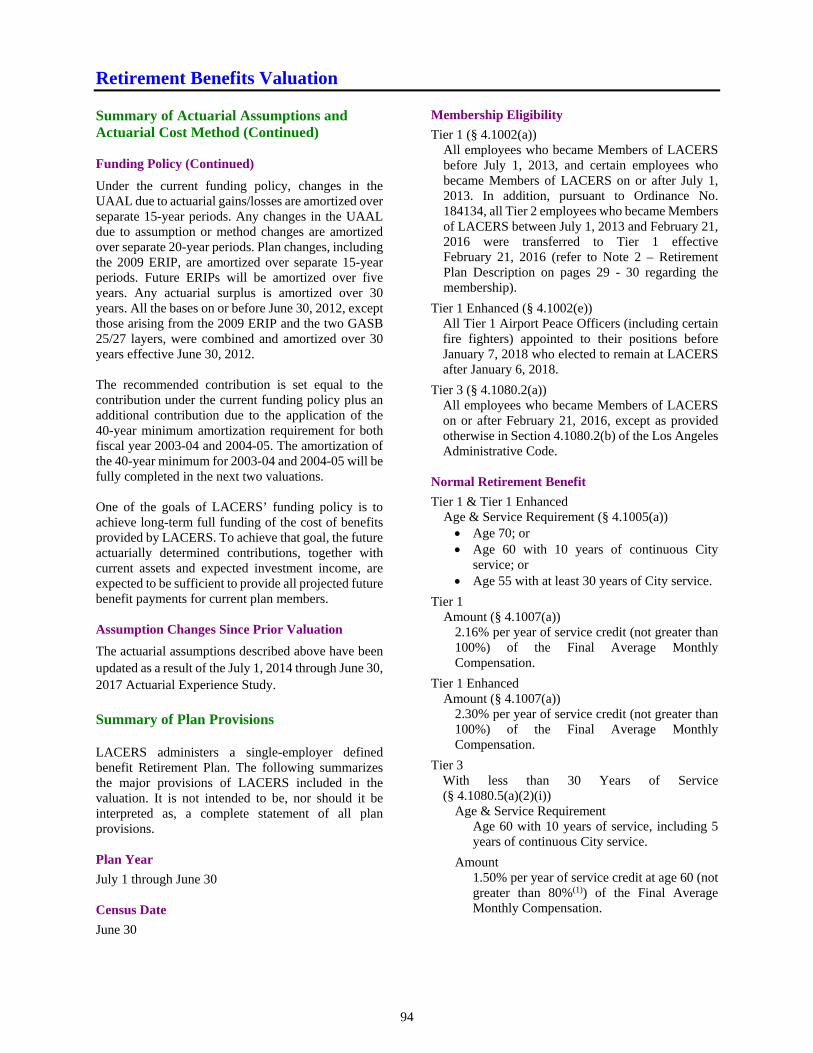
Retirement Benefits Valuation
94
Summary of Actuarial Assumptions and Actuarial Cost Method (Continued) Funding Policy (Continued)
Under the current funding policy, changes in the UAAL due to actuarial gains/losses are amortized over separate 15-year periods. Any changes in the UAAL due to assumption or method changes are amortized over separate 20-year periods. Plan changes, including the 2009 ERIP, are amortized over separate 15-year periods. Future ERIPs will be amortized over five years. Any actuarial surplus is amortized over 30 years. All the bases on or before June 30, 2012, except those arising from the 2009 ERIP and the two GASB 25/27 layers, were combined and amortized over 30 years effective June 30, 2012. The recommended contribution is set equal to the contribution under the current funding policy plus an additional contribution due to the application of the 40-year minimum amortization requirement for both fiscal year 2003-04 and 2004-05. The amortization of the 40-year minimum for 2003-04 and 2004-05 will be fully completed in the next two valuations. One of the goals of LACERS’ funding policy is to achieve long-term full funding of the cost of benefits provided by LACERS. To achieve that goal, the future actuarially determined contributions, together with current assets and expected investment income, are expected to be sufficient to provide all projected future benefit payments for current plan members. Assumption Changes Since Prior Valuation
The actuarial assumptions described above have been updated as a result of the July 1, 2014 through June 30, 2017 Actuarial Experience Study. Summary of Plan Provisions LACERS administers a single-employer defined benefit Retirement Plan. The following summarizes the major provisions of LACERS included in the valuation. It is not intended to be, nor should it be interpreted as, a complete statement of all plan provisions. Plan Year
July 1 through June 30 Census Date
June 30
Membership Eligibility
Tier 1 (§ 4.1002(a)) All employees who became Members of LACERS before July 1, 2013, and certain employees who became Members of LACERS on or after July 1, 2013. In addition, pursuant to Ordinance No. 184134, all Tier 2 employees who became Members of LACERS between July 1, 2013 and February 21, 2016 were transferred to Tier 1 effective February 21, 2016 (refer to Note 2 – Retirement Plan Description on pages 29 - 30 regarding the membership).
Tier 1 Enhanced (§ 4.1002(e)) All Tier 1 Airport Peace Officers (including certain fire fighters) appointed to their positions before January 7, 2018 who elected to remain at LACERS after January 6, 2018.
Tier 3 (§ 4.1080.2(a)) All employees who became Members of LACERS on or after February 21, 2016, except as provided otherwise in Section 4.1080.2(b) of the Los Angeles Administrative Code.
Normal Retirement Benefit
Tier 1 & Tier 1 Enhanced Age & Service Requirement (§ 4.1005(a)) Age 70; or Age 60 with 10 years of continuous City
service; or Age 55 with at least 30 years of City service.
Tier 1 Amount (§ 4.1007(a))
2.16% per year of service credit (not greater than 100%) of the Final Average Monthly Compensation.
Tier 1 Enhanced Amount (§ 4.1007(a))
2.30% per year of service credit (not greater than 100%) of the Final Average Monthly Compensation.
Tier 3 With less than 30 Years of Service (§ 4.1080.5(a)(2)(i))
Age & Service Requirement Age 60 with 10 years of service, including 5 years of continuous City service.
Amount 1.50% per year of service credit at age 60 (not greater than 80%(1)) of the Final Average Monthly Compensation.
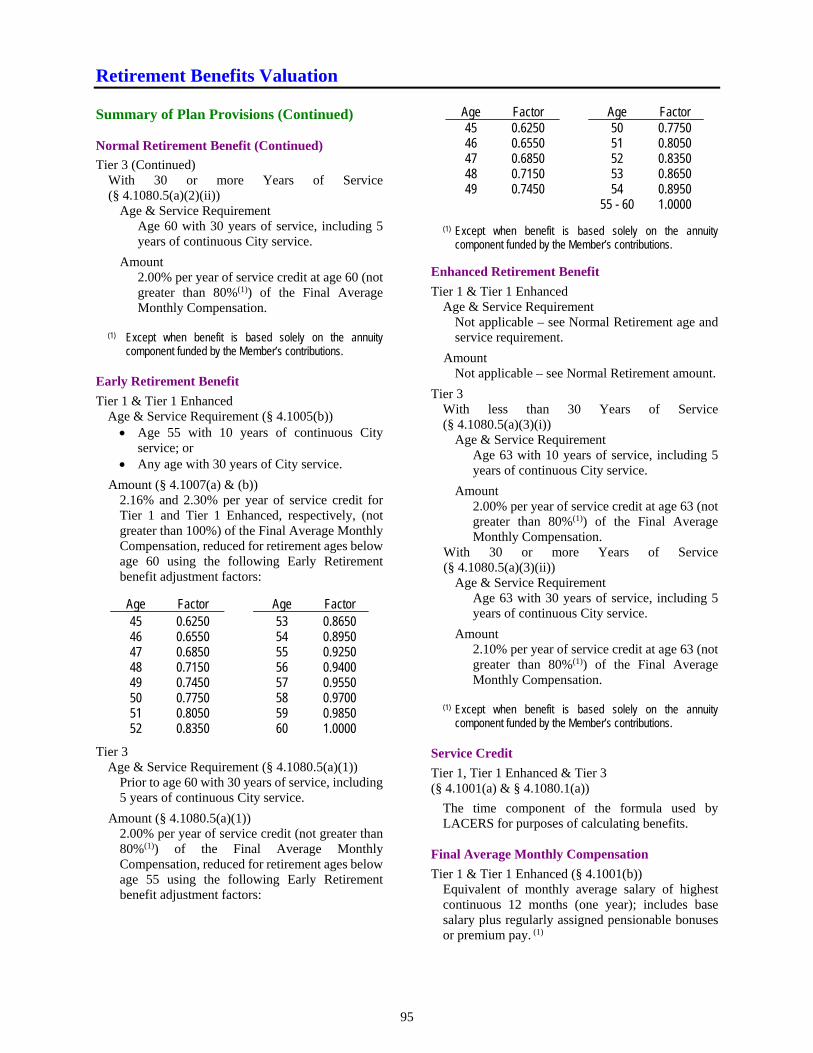
Retirement Benefits Valuation
95
Summary of Plan Provisions (Continued) Normal Retirement Benefit (Continued)
Tier 3 (Continued) With 30 or more Years of Service (§ 4.1080.5(a)(2)(ii))
Age & Service Requirement Age 60 with 30 years of service, including 5 years of continuous City service.
Amount 2.00% per year of service credit at age 60 (not greater than 80%(1)) of the Final Average Monthly Compensation.
(1) Except when benefit is based solely on the annuity component funded by the Member’s contributions.
Early Retirement Benefit
Tier 1 & Tier 1 Enhanced Age & Service Requirement (§ 4.1005(b)) Age 55 with 10 years of continuous City
service; or Any age with 30 years of City service.
Amount (§ 4.1007(a) & (b)) 2.16% and 2.30% per year of service credit for Tier 1 and Tier 1 Enhanced, respectively, (not greater than 100%) of the Final Average Monthly Compensation, reduced for retirement ages below age 60 using the following Early Retirement benefit adjustment factors:
Age Factor Age Factor 45 0.6250 53 0.8650 46 0.6550 54 0.8950 47 0.6850 55 0.9250 48 0.7150 56 0.9400 49 0.7450 57 0.9550 50 0.7750 58 0.9700 51 0.8050 59 0.9850 52 0.8350 60 1.0000
Tier 3 Age & Service Requirement (§ 4.1080.5(a)(1))
Prior to age 60 with 30 years of service, including 5 years of continuous City service.
Amount (§ 4.1080.5(a)(1)) 2.00% per year of service credit (not greater than 80%(1)) of the Final Average Monthly Compensation, reduced for retirement ages below age 55 using the following Early Retirement benefit adjustment factors:
Age Factor Age Factor 45 0.6250 50 0.7750 46 0.6550 51 0.8050 47 0.6850 52 0.8350 48 0.7150 53 0.8650 49 0.7450 54 0.8950 55 - 60 1.0000
(1) Except when benefit is based solely on the annuity
component funded by the Member’s contributions.
Enhanced Retirement Benefit
Tier 1 & Tier 1 Enhanced Age & Service Requirement
Not applicable – see Normal Retirement age and service requirement.
Amount Not applicable – see Normal Retirement amount.
Tier 3 With less than 30 Years of Service (§ 4.1080.5(a)(3)(i))
Age & Service Requirement Age 63 with 10 years of service, including 5 years of continuous City service.
Amount 2.00% per year of service credit at age 63 (not greater than 80%(1)) of the Final Average Monthly Compensation.
With 30 or more Years of Service (§ 4.1080.5(a)(3)(ii))
Age & Service Requirement Age 63 with 30 years of service, including 5 years of continuous City service.
Amount 2.10% per year of service credit at age 63 (not greater than 80%(1)) of the Final Average Monthly Compensation.
(1) Except when benefit is based solely on the annuity component funded by the Member’s contributions.
Service Credit
Tier 1, Tier 1 Enhanced & Tier 3 (§ 4.1001(a) & § 4.1080.1(a))
The time component of the formula used by LACERS for purposes of calculating benefits.
Final Average Monthly Compensation
Tier 1 & Tier 1 Enhanced (§ 4.1001(b)) Equivalent of monthly average salary of highest continuous 12 months (one year); includes base salary plus regularly assigned pensionable bonuses or premium pay. (1)
Retirement Benefits Valuation
96
Summary of Plan Provisions (Continued) Final Average Monthly Compensation (Continued)
Tier 3 (§ 4.1080.1(b)) Equivalent of monthly average salary of highest continuous 36 months (three years); limited to base salary and any items of compensation that are designated as pension based. (1)
(1) IRC Section 401(a)(17) compensation limit would apply to all employees who began membership in LACERS after June 30, 1996.
Cost of Living Benefit
Tier 1 & Tier 1 Enhanced (§ 4.1022) Based on changes to Los Angeles area Consumer Price Index, to a maximum of 3% per year; excess banked.
Tier 3 (§ 4.1080.17) Based on changes to Los Angeles area Consumer Price Index, to a maximum of 2% per year; excess not banked.
Death after Retirement
Tier 1 & Tier 3 (§ 4.1010(c), § 4.1080.10(c), & § 4.1012(c)) 50% of retiree’s unmodified allowance
continued to an eligible spouse or a domestic partner; or a modified continuance to an eligible spouse or a domestic partner at the time of Member’s death (or a designated beneficiary selected by Member at the time of retirement)(1); and
$2,500 lump sum death benefit paid to a designated beneficiary; and
Any unused contributions if the Member has elected the cash refund annuity option.
(1) The retiree may elect at the time of retirement to take a reduced allowance in order to provide for a higher continuance percentage pursuant to the provisions of either Section 4.1015 (Tier 1) or Section 4.1080.14 (Tier 3).
Tier 1 Enhanced (§ 4.1010.1(b), § 4.1010.1(i), & § 4.1010.1(j)) While on service-connected disability 80% of retiree’s unmodified allowance
continued to an eligible spouse or a domestic partner; or a modified continuance to an eligible spouse or a domestic partner at the time of Member’s death (or a designated beneficiary selected by Member at the time of
retirement)(1), (2); and
$2,500 lump sum death benefit paid to a designated beneficiary; and
Any unused contributions if the Member has elected the cash refund annuity option.
(1) If the death occurs within three years of the retiree’s retirement, the eligible survivor shall receive 80% of the Final Average Monthly Compensation (adjusted with Cost of Living benefit).
(2) The retiree may elect at the time of retirement to take a reduced allowance in order to provide for a higher continuance percentage pursuant to the provisions of Section 4.1010.1(c).
While on nonservice-connected disability 70% of retiree’s unmodified allowance
continued to an eligible spouse or a domestic partner; or a modified continuance to an eligible spouse or a domestic partner at the time of Member’s death (or a designated beneficiary selected by Member at the time of retirement)(3); and
$2,500 lump sum death benefit paid to a designated beneficiary; and
Any unused contributions if the Member has elected the cash refund annuity option.
(3) The retiree may elect at the time of retirement to take a reduced allowance in order to provide for a higher continuance percentage pursuant to the provisions of Section 4.1010.1(c).
Death before Retirement
Tier 1, Tier 1 Enhanced, & Tier 3 (§ 4.1010(a), § 4.1010.1(b), & § 4.1080.10(a))
Greater of:
Option #1: Eligibility – None. Benefit – Refund of employee contributions
plus a limited pension benefit equal to 50% of monthly salary paid, according to the following schedule:
Service Credit Total Number of Monthly
Payments
Less than 1 year 0 1 year 2 2 years 4 3 years 6 4 years 8 5 years 10 6+ years 12
Tier 1 & Tier 3
Option #2: Eligibility – Duty-related death or after five
years of continuous service. Benefit – Continuance of service or disability
benefit payable under 100% joint and survivor option to an eligible spouse or qualified domestic partner.
Retirement Benefits Valuation
97
Summary of Plan Provisions (Continued)
Death before Retirement (Continued)
Tier 1 Enhanced Service-Connected Death
Option #2: Eligibility – None. Benefit – 80% of Member’s Final Average
Monthly Compensation. Nonservice-Connected Death
Option #2: Eligibility – 5 years of service (unless on
military leave and killed while on military duties).
Benefit – 50% of Member’s Final Average Monthly Compensation.
Member Contributions
Tier 1 & Tier 1 Enhanced (§ 4.1003) Effective July 1, 2011, the Member contribution rate became 7% for all employees. Of the 7% rate, 0.5% is the survivor contribution portion and 6.5% is the normal contribution. The 7% Member rate shall be paid until June 30, 2026 or until the ERIP Cost Obligation (defined in ERIP Ordinance No. 180926) is fully paid, whichever comes first(1).
Beginning January 1, 2013, all non-represented Members and Members in certain bargaining groups are required to pay an additional 4% Member contribution rate to defray the cost of providing a Retiree Medical Plan premium subsidy (this now applies to all Tier 1 and Tier 1 Enhanced Members and this additional rate has increased to 4.5% for certain Members).
For Tier 1, members with no eligible spouse or domestic partner at retirement can request a refund of the survivor portion of the Member contributions (i.e., generally based on a contribution rate of 0.5% of pay). (1) The Member contribution rate will drop down to 6%
afterwards.
Tier 3 (§ 4.1080.3) The Member contribution rate is 7% for all employees. Of the 7% rate, 0.5% is the survivor contribution portion and 6.5% is the normal contribution.
All Members are required to pay an additional 4% Member contribution rate to defray the cost of providing a Retiree Medical Plan premium subsidy.
Members with no eligible spouse or domestic partner at retirement can request a refund of the survivor portion of the Member contributions (i.e., generally based on a contribution rate of 0.5% of pay).
Disability
Tier 1 & Tier 3 Service Requirement (§ 4.1008(a) & § 4.1080.8(a))
5 years of continuous service.
Amount(1) (§ 4.1008(c) & § 4.1080.8(c)) 1/70 (1.43%) of the Final Average Monthly Compensation per year of service or 1/3 of the Final Average Monthly Compensation, if greater.
Tier 1 Enhanced Service Requirement (§ 4.1008.1)
Service-Connected Disability: None. Nonservice-Connected Disability: 5 years of
continuous service.
Amount(1) (§ 4.1008.1) Service-Connected Disability: 30% to 90% of the
Final Average Monthly Compensation depending on severity of disability, with a minimum of 2% of the Final Average Monthly Compensation per year of service.
Nonservice-Connected Disability: 30% to 50% of the Final Average Monthly Compensation depending on severity of disability.
(1) The benefit calculated using the service retirement formula
will be paid if the Member is eligible and that benefit is greater than that calculated under the disability retirement formula.
Deferred Retirement Benefit (Vested)
Tier 1 & Tier 1 Enhanced (§ 4.1006) Age & Service Requirement Age 70 with 5 years of continuous City
service; or
Age 60 with 5 years of continuous City service and at least 10 years elapsed from first date of membership; or
Age 55 with at least 30 years of service.
Deferred employee who meets part-time eligibility: age 60 and at least 10 years elapsed from first date of membership.
Amount Normal Retirement Benefit (or refund of contributions and accumulated interest).
Age & Service Requirement Age 55 with 5 years of continuous City
service and at least 10 years elapsed from first date of membership; or
Age 55 with 10 years of continuous City service.
Deferred employee who meets part-time eligibility: age 55 and at least 10 years elapsed from first date of membership.
Retirement Benefits Valuation
98
Summary of Plan Provisions (Continued) Deferred Retirement Benefit (Vested) (Continued)
Amount Early Retirement Benefit (or refund of contributions and accumulated interest), using the following Early Retirement benefit adjustment factors:
Age Factor
55 0.9250 56 0.9400 57 0.9550 58 0.9700 59 0.9850
Tier 3 (§ 4.1080.6)
Age & Service Requirement
Age 60 with 5 years of continuous City service and at least 10 years elapsed from first date of membership; or
Age 70 with 5 years of continuous City service, regardless of the number of years that have elapsed from first date of membership.
Amount Normal retirement benefit (based on a Retirement Factor of 1.50%; or refund of contributions and accumulated interest).
Age & Service Requirement Age 60 with 30 years of continuous City
service and at least 10 years elapsed from first date of membership; or
Age 63 with 10 years of service, including 5 years of continuous City Service.
Amount Normal retirement benefit (based on a Retirement Factor of 2.00%; or refund of contributions and accumulated interest).
Age & Service Requirement Age 63 with 30 years of continuous City service and at least 10 years elapsed from first date of membership.
Amount Enhanced retirement (benefit based on a Retirement Factor of 2.10%; or refund of contributions and accumulated interest).
Age & Service Requirement Age 55 (but not yet 60) with 5 years of continuous City service and at least 10 years elapsed from first date of membership.
Amount
Early retirement benefit (based on a Retirement Factor of 1.50% instead of 2.00%; or refund of contributions and accumulated interest), using the following Early Retirement benefit adjustment factors:
Age Factor
55 0.9250 56 0.9400 57 0.9550 58 0.9700 59 0.9850
Withdrawal of Contributions Benefit (Ordinary Withdrawal)
Refund of employee contributions with interest.
Changes in Plan Provisions
Effective January 7, 2018, Tier 1 enhanced benefits are available to APO members who elected to remain at LACERS. The Plan Provisions shown above reflect these enhanced benefits.
Health Benefits Valuation
99
100 Montgomery Street Suite 500 San Francisco, CA 94104-4308 T 415.263.8200 www.segalco.com
Actuarial Certification
November 7, 2018
This is to certify that Segal Consulting (Segal) has conducted an actuarial valuation of certain benefit obligations of Los Angeles City Employees’ Retirement System’s other postemployment benefit programs as of June 30, 2018, in accordance with generally accepted actuarial principles and practices. In particular, it is our understanding that the assumptions and methods used for funding purposes meet the parameters set by the Actuarial Standards of Practice (ASOPs). Actuarial valuations are performed annually for this other postemployment benefit program with the last valuation completed as of June 30, 2017.
The actuarial valuation is based on the plan of benefits verified by LACERS and on participant, premium, claims and financial data provided by LACERS. Segal did not audit LACERS’ financial statements, but conducted an examination of all participant data for reasonableness and we concluded that it was reasonable and consistent with the prior year’s data.
One of the general goals of an actuarial valuation is to establish contributions that fully fund the Retirement System’s liabilities, and that, as a percentage of payroll, remain as level as possible for each generation of active members. Both the Normal Cost and the Actuarial Accrued Liability are determined under the Entry Age cost method.
The actuarial computations made are for purposes of funding plan benefits. Accordingly, additional determinations will be needed for other purposes, such as satisfying financial accounting requirements under Governmental Accounting Standards Board (GASB) Statement No. 74 and judging benefit security at termination of the plan.
Segal prepared all of the supporting schedules in the Actuarial Section of the Comprehensive Annual Financial Report (CAFR) and certain supporting schedules in the Financial Section, based on the results of the June 30, 2018 actuarial valuation. A listing of the supporting schedules Segal prepared for inclusion in the Financial Section, and in the Actuarial Section, is provided below:
Financial Section 1) Schedule of Net Other Postemployment Benefits (OPEB) Liability* 2) Schedule of Changes in Net OPEB Liability and Related Ratios* 3) Schedule of Contribution History*
Actuarial Section 4) Summary of Significant Valuation Results 5) Active Member Valuation Data 6) Retirees and Beneficiaries Added to and Removed from Health Benefits 7) Member Benefit Coverage Information 8) Schedule of Funding Progress 9) Actuarial Analysis of Financial Experience 10) Actuarial Balance Sheet 11) Schedule of Changes in Net OPEB Liability and Related Ratios* 12) Projection of OPEB Plan’s Fiduciary Net Position for Use in Calculation of Discount Rate of 7.25% and
Preparation of GASB 74 Report as of June 30, 2018 * Source: Segal’s GASB Statement No. 74 valuation report as of June 30, 2018.
Benefits, Compensation and HR Consulting. Member of The Segal Group. Offices throughout the United States and Canada

Health Benefits Valuation
100
Actuarial Certification (Continued)
LACERS’ staff prepared other trend data schedules in the Statistical Section based on information supplied in Segal’s valuation report.
To the best of our knowledge, this report is complete and accurate and in our opinion presents the information necessary to fund the Plan with respect to the benefit obligations addressed. The signing actuaries are members of the Society of Actuaries, and/or the American Academy of Actuaries, as well as other professional actuarial organizations and collectively meet their “General Qualification Standards for Statements of Actuarial Opinions” to render the actuarial opinion contained herein.
Thomas Bergman, ASA, MAAA, EA Retiree Health Actuary
Andy Yeung, ASA, MAAA, FCA, EA Vice President and Actuary
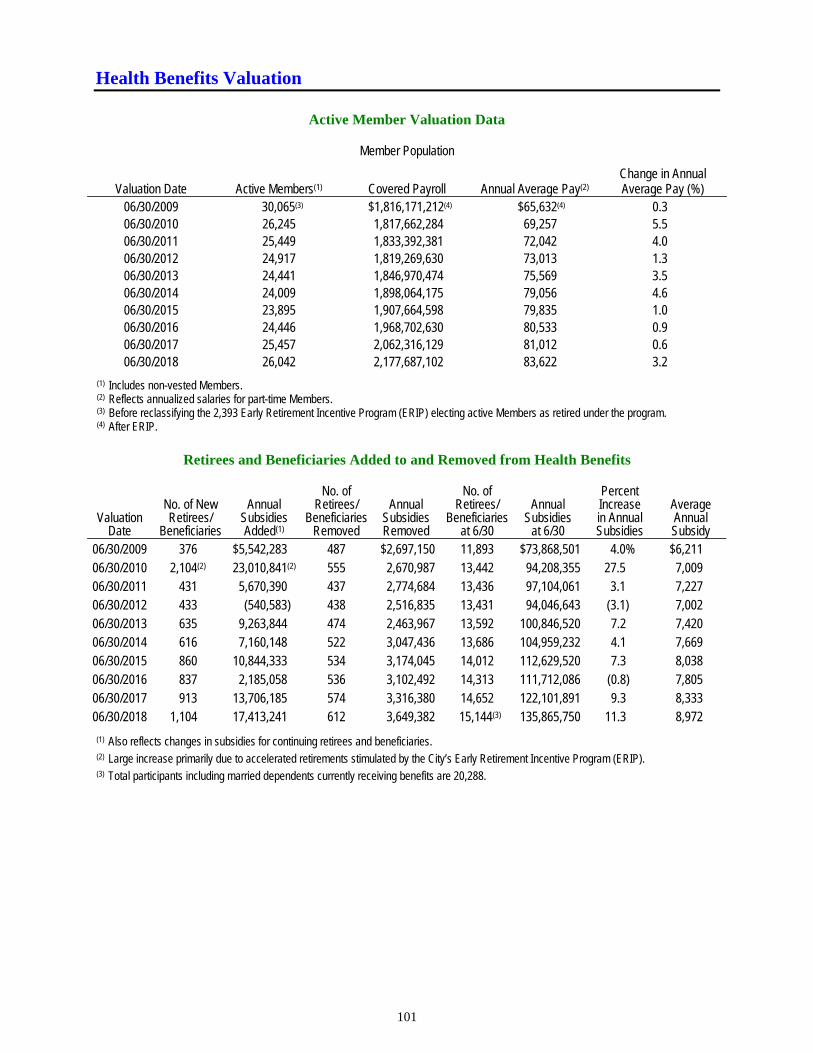
Health Benefits Valuation
101
Active Member Valuation Data
Member Population
Valuation Date Active Members(1) Covered Payroll Annual Average Pay(2) Change in Annual Average Pay (%)
06/30/2009 30,065(3) $1,816,171,212(4) $65,632(4) 0.3 06/30/2010 26,245 1,817,662,284 69,257 5.5 06/30/2011 25,449 1,833,392,381 72,042 4.0 06/30/2012 24,917 1,819,269,630 73,013 1.3 06/30/2013 24,441 1,846,970,474 75,569 3.5 06/30/2014 24,009 1,898,064,175 79,056 4.6 06/30/2015 23,895 1,907,664,598 79,835 1.0 06/30/2016 24,446 1,968,702,630 80,533 0.9 06/30/2017 25,457 2,062,316,129 81,012 0.6 06/30/2018 26,042 2,177,687,102 83,622 3.2
(1) Includes non-vested Members. (2) Reflects annualized salaries for part-time Members. (3) Before reclassifying the 2,393 Early Retirement Incentive Program (ERIP) electing active Members as retired under the program. (4) After ERIP.
Retirees and Beneficiaries Added to and Removed from Health Benefits
Valuation Date
No. of New Retirees/
Beneficiaries
Annual Subsidies Added(1)
No. of Retirees/
Beneficiaries Removed
Annual Subsidies Removed
No. of Retirees/
Beneficiaries at 6/30
Annual Subsidies
at 6/30
Percent Increase in Annual Subsidies
Average Annual Subsidy
06/30/2009 376 $5,542,283 487 $2,697,150 11,893 $73,868,501 4.0% $6,211 06/30/2010 2,104(2) 23,010,841(2) 555 2,670,987 13,442 94,208,355 27.5 7,009 06/30/2011 431 5,670,390 437 2,774,684 13,436 97,104,061 3.1 7,227 06/30/2012 433 (540,583) 438 2,516,835 13,431 94,046,643 (3.1) 7,002 06/30/2013 635 9,263,844 474 2,463,967 13,592 100,846,520 7.2 7,420 06/30/2014 616 7,160,148 522 3,047,436 13,686 104,959,232 4.1 7,669 06/30/2015 860 10,844,333 534 3,174,045 14,012 112,629,520 7.3 8,038 06/30/2016 837 2,185,058 536 3,102,492 14,313 111,712,086 (0.8) 7,805 06/30/2017 913 13,706,185 574 3,316,380 14,652 122,101,891 9.3 8,333 06/30/2018 1,104 17,413,241 612 3,649,382 15,144(3) 135,865,750 11.3 8,972
(1) Also reflects changes in subsidies for continuing retirees and beneficiaries. (2) Large increase primarily due to accelerated retirements stimulated by the City’s Early Retirement Incentive Program (ERIP). (3) Total participants including married dependents currently receiving benefits are 20,288.
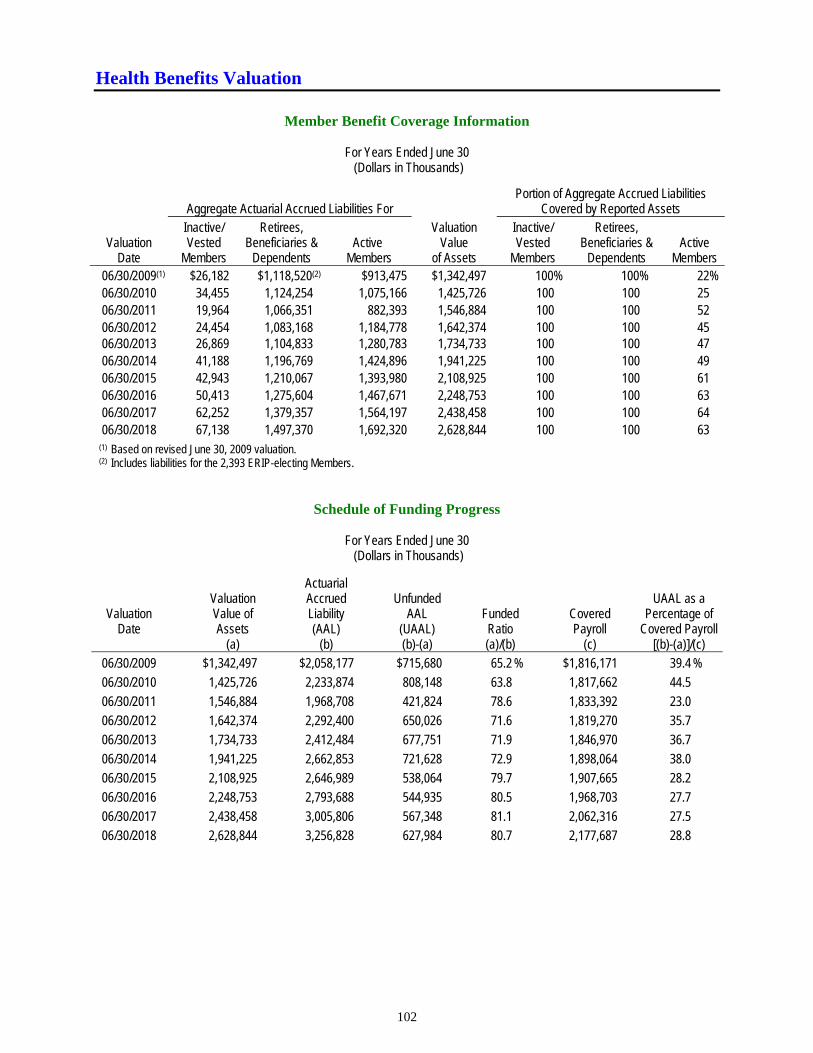
Health Benefits Valuation
102
Member Benefit Coverage Information
For Years Ended June 30 (Dollars in Thousands)
Aggregate Actuarial Accrued Liabilities For Portion of Aggregate Accrued Liabilities
Covered by Reported Assets
Valuation Date
Inactive/ Vested
Members
Retirees, Beneficiaries &
Dependents Active
Members
Valuation Value
of Assets
Inactive/ Vested
Members
Retirees, Beneficiaries &
Dependents Active
Members 06/30/2009(1) $26,182 $1,118,520(2) $913,475 $1,342,497 100% 100% 22% 06/30/2010 34,455 1,124,254 1,075,166 1,425,726 100 100 25 06/30/2011 19,964 1,066,351 882,393 1,546,884 100 100 52 06/30/2012 24,454 1,083,168 1,184,778 1,642,374 100 100 45 06/30/2013 26,869 1,104,833 1,280,783 1,734,733 100 100 47 06/30/2014 41,188 1,196,769 1,424,896 1,941,225 100 100 49 06/30/2015 42,943 1,210,067 1,393,980 2,108,925 100 100 61 06/30/2016 50,413 1,275,604 1,467,671 2,248,753 100 100 63 06/30/2017 62,252 1,379,357 1,564,197 2,438,458 100 100 64 06/30/2018 67,138 1,497,370 1,692,320 2,628,844 100 100 63
(1) Based on revised June 30, 2009 valuation. (2) Includes liabilities for the 2,393 ERIP-electing Members.
Schedule of Funding Progress
For Years Ended June 30 (Dollars in Thousands)
Actuarial Valuation Accrued Unfunded UAAL as a
Valuation Value of Liability AAL Funded Covered Percentage of Date Assets (AAL) (UAAL) Ratio Payroll Covered Payroll
(a) (b) (b)-(a) (a)/(b) (c) [(b)-(a)]/(c) 06/30/2009 $1,342,497 $2,058,177 $715,680 65.2 % $1,816,171 39.4 %
06/30/2010 1,425,726 2,233,874 808,148 63.8 1,817,662 44.5
06/30/2011 1,546,884 1,968,708 421,824 78.6 1,833,392 23.0
06/30/2012 1,642,374 2,292,400 650,026 71.6 1,819,270 35.7
06/30/2013 1,734,733 2,412,484 677,751 71.9 1,846,970 36.7
06/30/2014 1,941,225 2,662,853 721,628 72.9 1,898,064 38.0
06/30/2015 2,108,925 2,646,989 538,064 79.7 1,907,665 28.2
06/30/2016 2,248,753 2,793,688 544,935 80.5 1,968,703 27.7
06/30/2017 2,438,458 3,005,806 567,348 81.1 2,062,316 27.5
06/30/2018 2,628,844 3,256,828 627,984 80.7 2,177,687 28.8
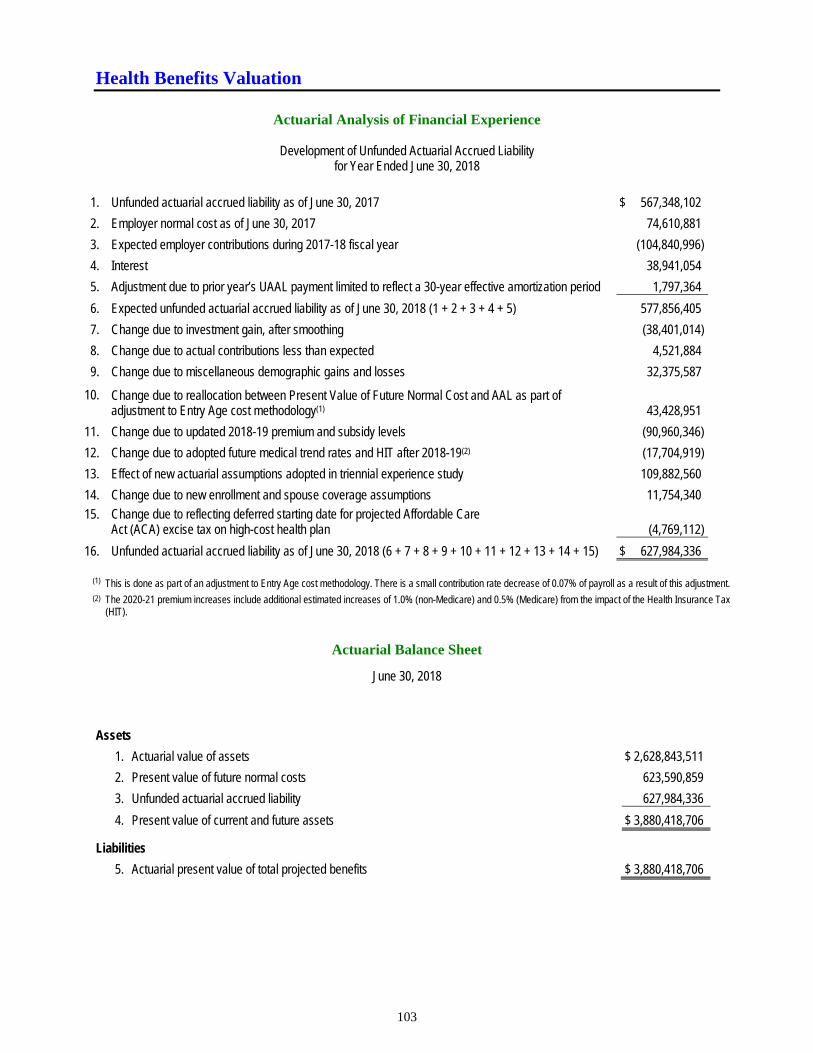
Health Benefits Valuation
103
Actuarial Analysis of Financial Experience
Development of Unfunded Actuarial Accrued Liability
for Year Ended June 30, 2018
1. Unfunded actuarial accrued liability as of June 30, 2017 $ 567,348,102
2. Employer normal cost as of June 30, 2017 74,610,881
3. Expected employer contributions during 2017-18 fiscal year (104,840,996)
4. Interest 38,941,054
5. Adjustment due to prior year’s UAAL payment limited to reflect a 30-year effective amortization period 1,797,364
6. Expected unfunded actuarial accrued liability as of June 30, 2018 (1 + 2 + 3 + 4 + 5) 577,856,405
7. Change due to investment gain, after smoothing (38,401,014)
8. Change due to actual contributions less than expected 4,521,884
9. Change due to miscellaneous demographic gains and losses 32,375,587
10. Change due to reallocation between Present Value of Future Normal Cost and AAL as part of adjustment to Entry Age cost methodology(1) 43,428,951
11. Change due to updated 2018-19 premium and subsidy levels (90,960,346)
12. Change due to adopted future medical trend rates and HIT after 2018-19(2) (17,704,919)
13. Effect of new actuarial assumptions adopted in triennial experience study 109,882,560
14. Change due to new enrollment and spouse coverage assumptions 11,754,340
15. Change due to reflecting deferred starting date for projected Affordable Care Act (ACA) excise tax on high-cost health plan (4,769,112)
16. Unfunded actuarial accrued liability as of June 30, 2018 (6 + 7 + 8 + 9 + 10 + 11 + 12 + 13 + 14 + 15) $ 627,984,336
(1) This is done as part of an adjustment to Entry Age cost methodology. There is a small contribution rate decrease of 0.07% of payroll as a result of this adjustment. (2) The 2020-21 premium increases include additional estimated increases of 1.0% (non-Medicare) and 0.5% (Medicare) from the impact of the Health Insurance Tax
(HIT).
Actuarial Balance Sheet
June 30, 2018
Assets
1. Actuarial value of assets $ 2,628,843,511
2. Present value of future normal costs 623,590,859
3. Unfunded actuarial accrued liability 627,984,336
4. Present value of current and future assets $ 3,880,418,706
Liabilities
5. Actuarial present value of total projected benefits $ 3,880,418,706
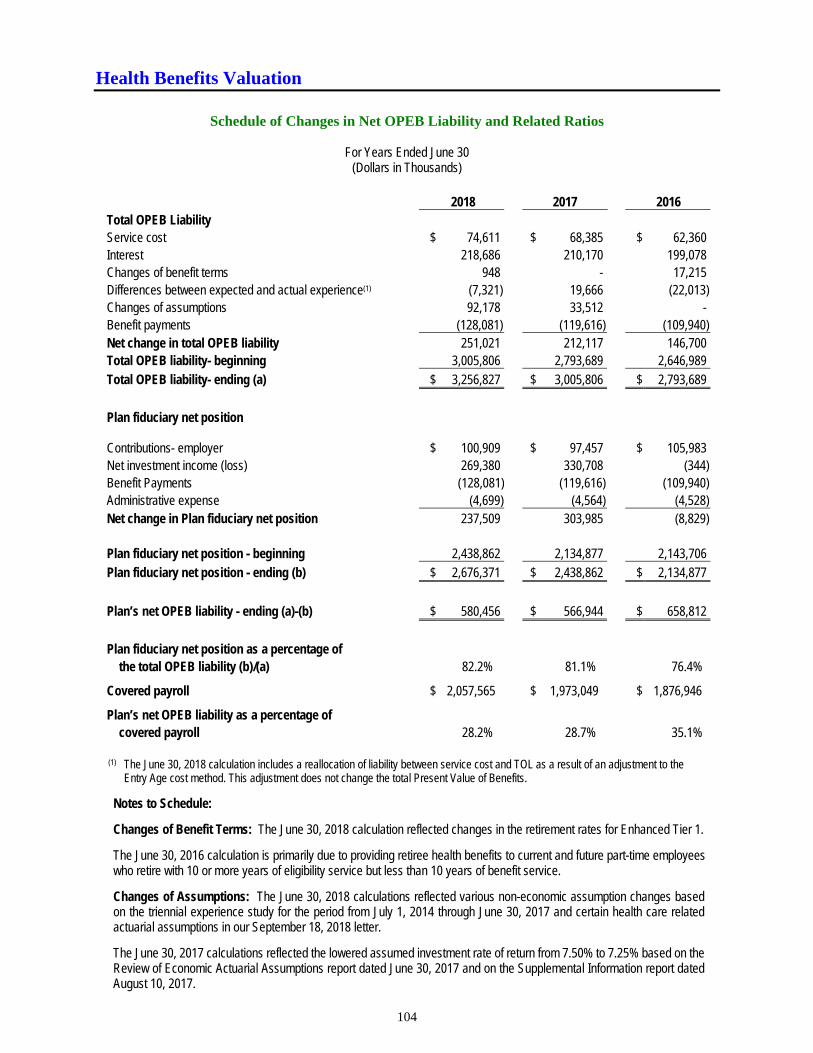
Health Benefits Valuation
104
Schedule of Changes in Net OPEB Liability and Related Ratios
For Years Ended June 30
(Dollars in Thousands)
2018 2017 2016 Total OPEB Liability Service cost $ 74,611 $ 68,385 $ 62,360 Interest 218,686 210,170 199,078 Changes of benefit terms 948 - 17,215 Differences between expected and actual experience(1) (7,321) 19,666 (22,013) Changes of assumptions 92,178 33,512 - Benefit payments (128,081) (119,616) (109,940) Net change in total OPEB liability 251,021 212,117 146,700 Total OPEB liability- beginning 3,005,806 2,793,689 2,646,989 Total OPEB liability- ending (a) $ 3,256,827 $ 3,005,806 $ 2,793,689
Plan fiduciary net position
Contributions- employer $
100,909
$ 97,457
$ 105,983 Net investment income (loss) 269,380 330,708 (344) Benefit Payments (128,081) (119,616) (109,940) Administrative expense (4,699) (4,564) (4,528) Net change in Plan fiduciary net position 237,509 303,985 (8,829)
Plan fiduciary net position - beginning 2,438,862 2,134,877 2,143,706 Plan fiduciary net position - ending (b) $ 2,676,371 $ 2,438,862 $ 2,134,877
Plan’s net OPEB liability - ending (a)-(b) $ 580,456 $ 566,944 $ 658,812
Plan fiduciary net position as a percentage of the total OPEB liability (b)/(a) 82.2% 81.1% 76.4% Covered payroll $ 2,057,565 $ 1,973,049 $ 1,876,946 Plan’s net OPEB liability as a percentage of covered payroll 28.2% 28.7% 35.1% (1) The June 30, 2018 calculation includes a reallocation of liability between service cost and TOL as a result of an adjustment to the
Entry Age cost method. This adjustment does not change the total Present Value of Benefits.
Notes to Schedule:
Changes of Benefit Terms: The June 30, 2018 calculation reflected changes in the retirement rates for Enhanced Tier 1.
The June 30, 2016 calculation is primarily due to providing retiree health benefits to current and future part-time employees who retire with 10 or more years of eligibility service but less than 10 years of benefit service.
Changes of Assumptions: The June 30, 2018 calculations reflected various non-economic assumption changes based on the triennial experience study for the period from July 1, 2014 through June 30, 2017 and certain health care related actuarial assumptions in our September 18, 2018 letter.
The June 30, 2017 calculations reflected the lowered assumed investment rate of return from 7.50% to 7.25% based on the Review of Economic Actuarial Assumptions report dated June 30, 2017 and on the Supplemental Information report dated August 10, 2017.
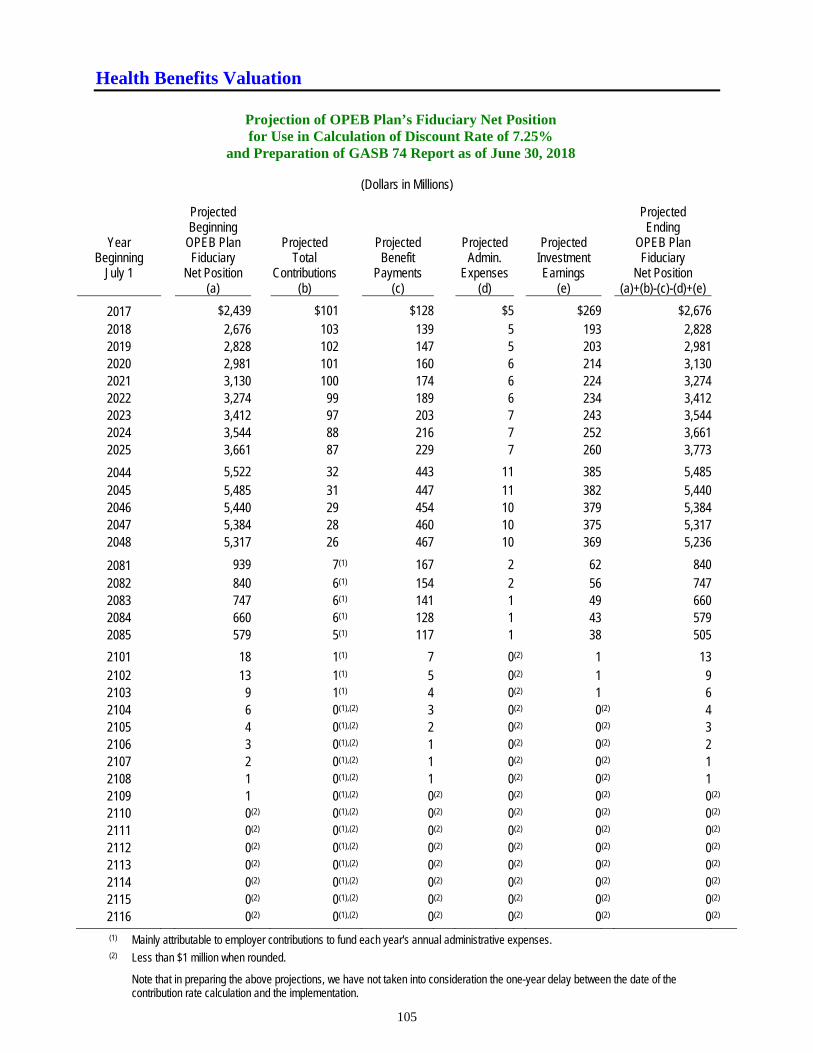
Health Benefits Valuation
105
Projection of OPEB Plan’s Fiduciary Net Position for Use in Calculation of Discount Rate of 7.25%
and Preparation of GASB 74 Report as of June 30, 2018
(Dollars in Millions)
Projected Projected Beginning Ending
Year OPEB Plan Projected Projected Projected Projected OPEB Plan Beginning Fiduciary Total Benefit Admin. Investment Fiduciary
July 1 Net Position Contributions Payments Expenses Earnings Net Position (a) (b) (c) (d) (e) (a)+(b)-(c)-(d)+(e)
2017 $2,439 $101 $128 $5 $269 $2,676 2018 2,676 103 139 5 193 2,828 2019 2,828 102 147 5 203 2,981 2020 2,981 101 160 6 214 3,130 2021 3,130 100 174 6 224 3,274 2022 3,274 99 189 6 234 3,412 2023 3,412 97 203 7 243 3,544 2024 3,544 88 216 7 252 3,661 2025 3,661 87 229 7 260 3,773
2044 5,522 32 443 11 385 5,485 2045 5,485 31 447 11 382 5,440 2046 5,440 29 454 10 379 5,384 2047 5,384 28 460 10 375 5,317 2048 5,317 26 467 10 369 5,236
2081 939 7 (1) 167 2 62 840 2082 840 6 (1) 154 2 56 747 2083 747 6 (1) 141 1 49 660 2084 660 6 (1) 128 1 43 579 2085 579 5 (1) 117 1 38 505
2101 18 1 (1) 7 0(2) 1 13 2102 13 1 (1) 5 0(2) 1 9 2103 9 1 (1) 4 0(2) 1 6 2104 6 0 (1),(2) 3 0(2) 0(2) 4 2105 4 0 (1),(2) 2 0(2) 0(2) 3 2106 3 0 (1),(2) 1 0(2) 0(2) 2 2107 2 0 (1),(2) 1 0(2) 0(2) 1 2108 1 0 (1),(2) 1 0(2) 0(2) 1 2109 1 0 (1),(2) 0(2) 0(2) 0(2) 0(2) 2110 0(2) 0 (1),(2) 0(2) 0(2) 0(2) 0(2) 2111 0(2) 0 (1),(2) 0(2) 0(2) 0(2) 0(2) 2112 0(2) 0 (1),(2) 0(2) 0(2) 0(2) 0(2) 2113 0(2) 0 (1),(2) 0(2) 0(2) 0(2) 0(2) 2114 0(2) 0 (1),(2) 0(2) 0(2) 0(2) 0(2) 2115 0(2) 0 (1),(2) 0(2) 0(2) 0(2) 0(2) 2116 0(2) 0 (1),(2) 0(2) 0(2) 0(2) 0(2)
(1) Mainly attributable to employer contributions to fund each year's annual administrative expenses. (2) Less than $1 million when rounded.
Note that in preparing the above projections, we have not taken into consideration the one-year delay between the date of the contribution rate calculation and the implementation.
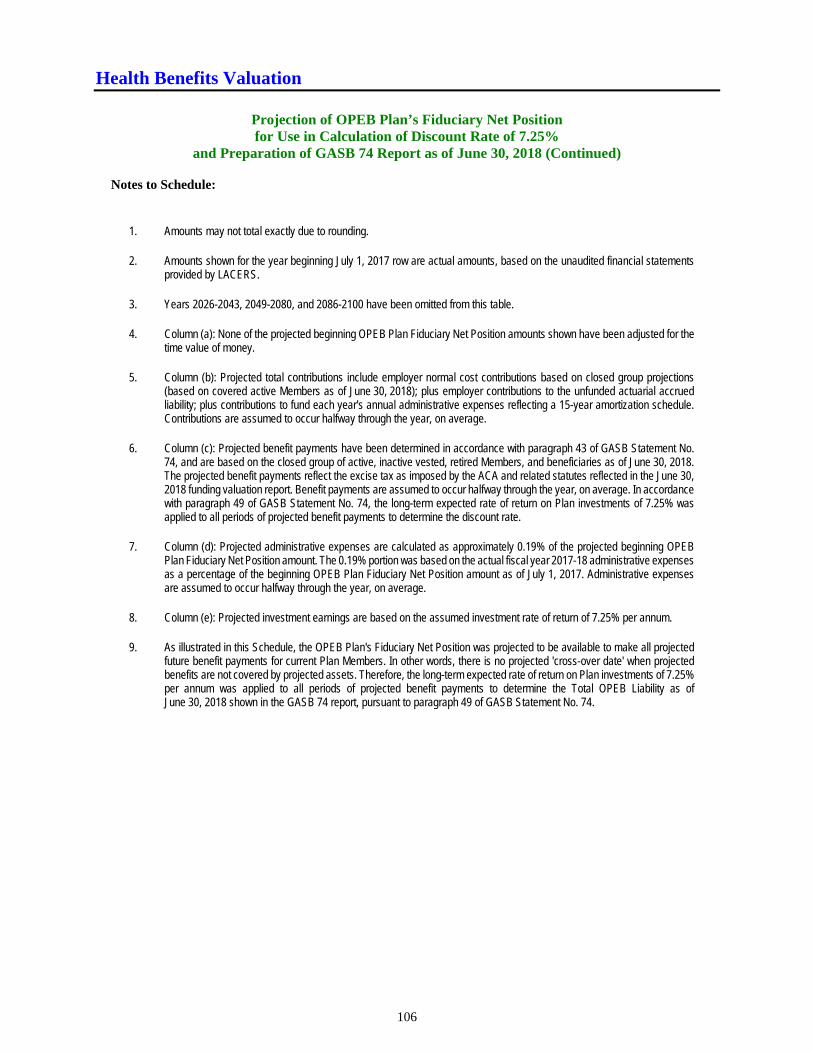
Health Benefits Valuation
106
Projection of OPEB Plan’s Fiduciary Net Position for Use in Calculation of Discount Rate of 7.25%
and Preparation of GASB 74 Report as of June 30, 2018 (Continued)
Notes to Schedule:
1. Amounts may not total exactly due to rounding.
2. Amounts shown for the year beginning July 1, 2017 row are actual amounts, based on the unaudited financial statements provided by LACERS.
3. Years 2026-2043, 2049-2080, and 2086-2100 have been omitted from this table.
4. Column (a): None of the projected beginning OPEB Plan Fiduciary Net Position amounts shown have been adjusted for the time value of money.
5. Column (b): Projected total contributions include employer normal cost contributions based on closed group projections (based on covered active Members as of June 30, 2018); plus employer contributions to the unfunded actuarial accrued liability; plus contributions to fund each year's annual administrative expenses reflecting a 15-year amortization schedule. Contributions are assumed to occur halfway through the year, on average.
6. Column (c): Projected benefit payments have been determined in accordance with paragraph 43 of GASB Statement No. 74, and are based on the closed group of active, inactive vested, retired Members, and beneficiaries as of June 30, 2018. The projected benefit payments reflect the excise tax as imposed by the ACA and related statutes reflected in the June 30, 2018 funding valuation report. Benefit payments are assumed to occur halfway through the year, on average. In accordance with paragraph 49 of GASB Statement No. 74, the long-term expected rate of return on Plan investments of 7.25% was applied to all periods of projected benefit payments to determine the discount rate.
7. Column (d): Projected administrative expenses are calculated as approximately 0.19% of the projected beginning OPEB Plan Fiduciary Net Position amount. The 0.19% portion was based on the actual fiscal year 2017-18 administrative expenses as a percentage of the beginning OPEB Plan Fiduciary Net Position amount as of July 1, 2017. Administrative expenses are assumed to occur halfway through the year, on average.
8. Column (e): Projected investment earnings are based on the assumed investment rate of return of 7.25% per annum.
9. As illustrated in this Schedule, the OPEB Plan's Fiduciary Net Position was projected to be available to make all projected future benefit payments for current Plan Members. In other words, there is no projected 'cross-over date' when projected benefits are not covered by projected assets. Therefore, the long-term expected rate of return on Plan investments of 7.25% per annum was applied to all periods of projected benefit payments to determine the Total OPEB Liability as of June 30, 2018 shown in the GASB 74 report, pursuant to paragraph 49 of GASB Statement No. 74.
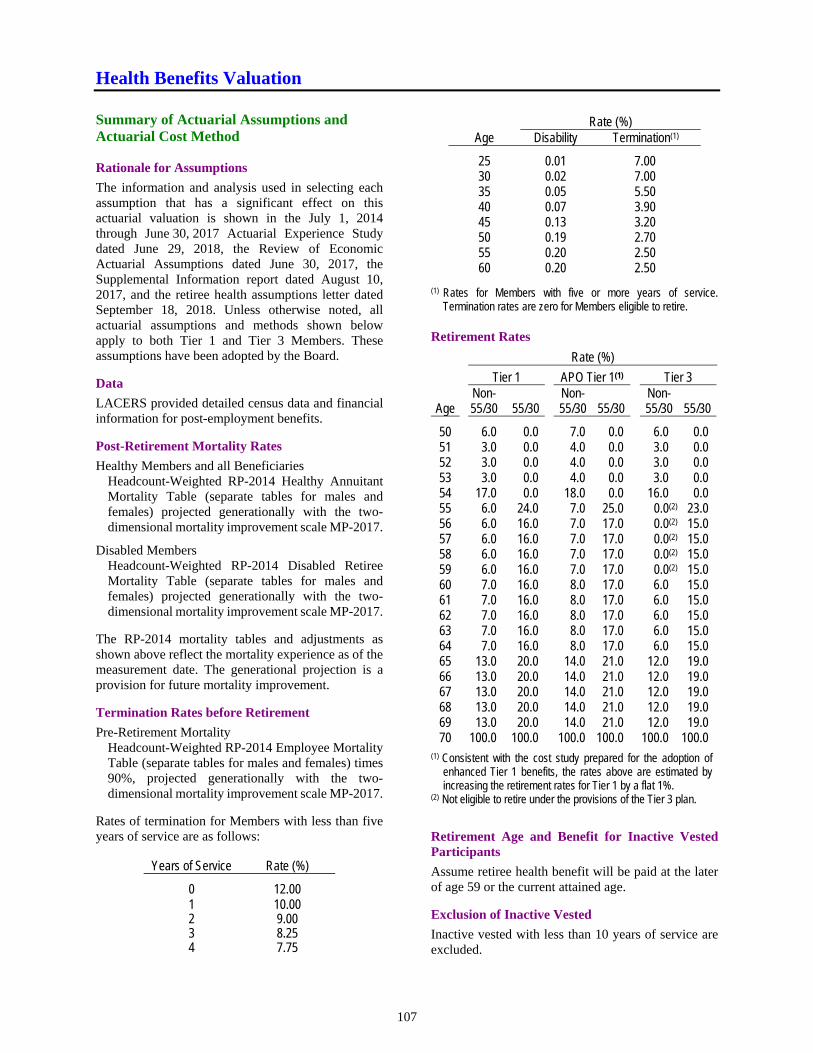
Health Benefits Valuation
107
Summary of Actuarial Assumptions and Actuarial Cost Method Rationale for Assumptions
The information and analysis used in selecting each assumption that has a significant effect on this actuarial valuation is shown in the July 1, 2014 through June 30, 2017 Actuarial Experience Study dated June 29, 2018, the Review of Economic Actuarial Assumptions dated June 30, 2017, the Supplemental Information report dated August 10, 2017, and the retiree health assumptions letter dated September 18, 2018. Unless otherwise noted, all actuarial assumptions and methods shown below apply to both Tier 1 and Tier 3 Members. These assumptions have been adopted by the Board.
Data
LACERS provided detailed census data and financial information for post-employment benefits.
Post-Retirement Mortality Rates
Healthy Members and all Beneficiaries Headcount-Weighted RP-2014 Healthy Annuitant Mortality Table (separate tables for males and females) projected generationally with the two-dimensional mortality improvement scale MP-2017.
Disabled Members Headcount-Weighted RP-2014 Disabled Retiree Mortality Table (separate tables for males and females) projected generationally with the two-dimensional mortality improvement scale MP-2017.
The RP-2014 mortality tables and adjustments as shown above reflect the mortality experience as of the measurement date. The generational projection is a provision for future mortality improvement.
Termination Rates before Retirement
Pre-Retirement Mortality Headcount-Weighted RP-2014 Employee Mortality Table (separate tables for males and females) times 90%, projected generationally with the two-dimensional mortality improvement scale MP-2017.
Rates of termination for Members with less than five years of service are as follows:
Years of Service Rate (%)
0 12.00 1 10.00 2 9.00 3 8.25 4 7.75
Rate (%)
Age Disability Termination(1)
25 0.01 7.00 30 0.02 7.00 35 0.05 5.50 40 0.07 3.90 45 0.13 3.20 50 0.19 2.70 55 0.20 2.50 60 0.20 2.50
(1) Rates for Members with five or more years of service. Termination rates are zero for Members eligible to retire.
Retirement Rates
Rate (%)
Tier 1 APO Tier 1(1) Tier 3
Age Non-55/30 55/30
Non-55/30 55/30
Non-55/30 55/30
50 6.0 0.0 7.0 0.0 6.0 0.0 51 3.0 0.0 4.0 0.0 3.0 0.0 52 3.0 0.0 4.0 0.0 3.0 0.0 53 3.0 0.0 4.0 0.0 3.0 0.0 54 17.0 0.0 18.0 0.0 16.0 0.0 55 6.0 24.0 7.0 25.0 0.0(2) 23.0 56 6.0 16.0 7.0 17.0 0.0(2) 15.0 57 6.0 16.0 7.0 17.0 0.0(2) 15.0 58 6.0 16.0 7.0 17.0 0.0(2) 15.0 59 6.0 16.0 7.0 17.0 0.0(2) 15.0 60 7.0 16.0 8.0 17.0 6.0 15.0 61 7.0 16.0 8.0 17.0 6.0 15.0 62 7.0 16.0 8.0 17.0 6.0 15.0 63 7.0 16.0 8.0 17.0 6.0 15.0 64 7.0 16.0 8.0 17.0 6.0 15.0 65 13.0 20.0 14.0 21.0 12.0 19.0 66 13.0 20.0 14.0 21.0 12.0 19.0 67 13.0 20.0 14.0 21.0 12.0 19.0 68 13.0 20.0 14.0 21.0 12.0 19.0 69 13.0 20.0 14.0 21.0 12.0 19.0 70 100.0 100.0 100.0 100.0 100.0 100.0
(1) Consistent with the cost study prepared for the adoption of enhanced Tier 1 benefits, the rates above are estimated by increasing the retirement rates for Tier 1 by a flat 1%.
(2) Not eligible to retire under the provisions of the Tier 3 plan.
Retirement Age and Benefit for Inactive Vested Participants
Assume retiree health benefit will be paid at the later of age 59 or the current attained age.
Exclusion of Inactive Vested
Inactive vested with less than 10 years of service are excluded.
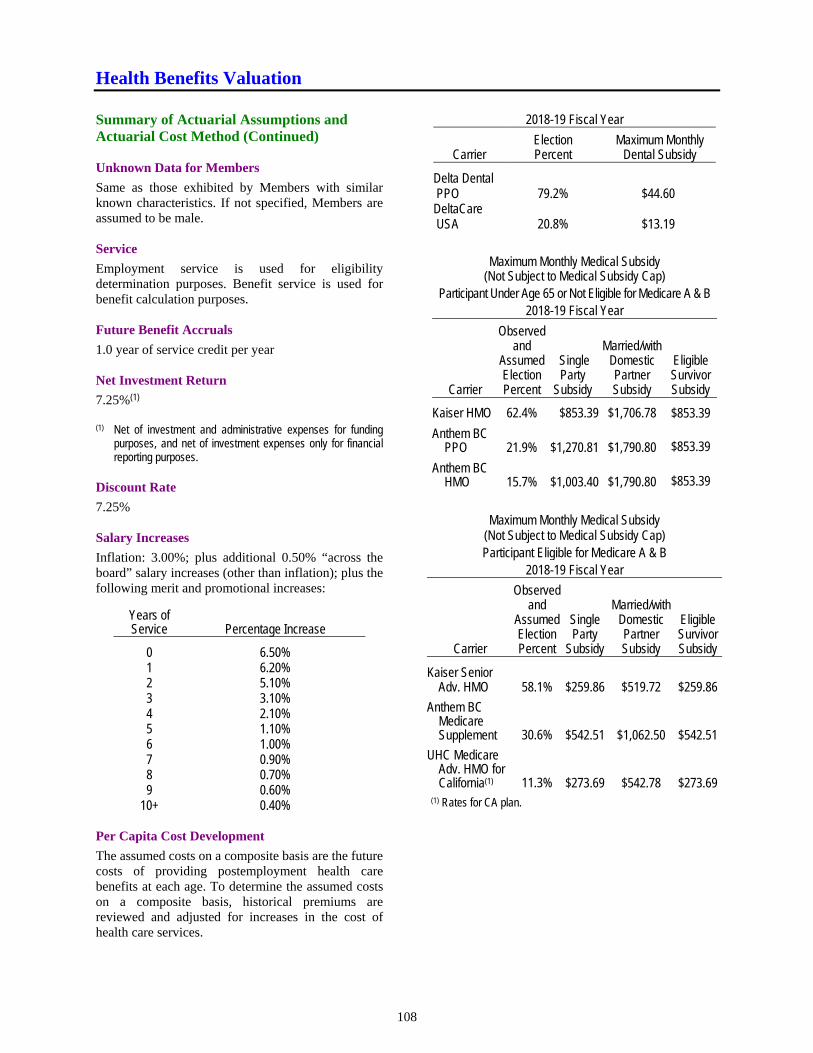
Health Benefits Valuation
108
Summary of Actuarial Assumptions and Actuarial Cost Method (Continued) Unknown Data for Members
Same as those exhibited by Members with similar known characteristics. If not specified, Members are assumed to be male. Service
Employment service is used for eligibility determination purposes. Benefit service is used for benefit calculation purposes. Future Benefit Accruals
1.0 year of service credit per year Net Investment Return
7.25%(1) (1) Net of investment and administrative expenses for funding
purposes, and net of investment expenses only for financial reporting purposes.
Discount Rate
7.25% Salary Increases
Inflation: 3.00%; plus additional 0.50% “across the board” salary increases (other than inflation); plus the following merit and promotional increases:
Years of Service Percentage Increase
0 6.50% 1 6.20% 2 5.10% 3 3.10% 4 2.10% 5 1.10% 6 1.00% 7 0.90% 8 0.70% 9 0.60%
10+ 0.40% Per Capita Cost Development
The assumed costs on a composite basis are the future costs of providing postemployment health care benefits at each age. To determine the assumed costs on a composite basis, historical premiums are reviewed and adjusted for increases in the cost of health care services.
2018-19 Fiscal Year
Carrier Election Percent
Maximum Monthly Dental Subsidy
Delta Dental PPO 79.2% $44.60 DeltaCare USA 20.8% $13.19
Maximum Monthly Medical Subsidy (Not Subject to Medical Subsidy Cap)
Participant Under Age 65 or Not Eligible for Medicare A & B 2018-19 Fiscal Year
Carrier
Observed and
Assumed Election Percent
Single Party
Subsidy
Married/with Domestic Partner Subsidy
Eligible Survivor Subsidy
Kaiser HMO 62.4% $853.39 $1,706.78 $853.39
Anthem BC PPO 21.9% $1,270.81 $1,790.80 $853.39
Anthem BC HMO 15.7% $1,003.40 $1,790.80 $853.39
Maximum Monthly Medical Subsidy (Not Subject to Medical Subsidy Cap) Participant Eligible for Medicare A & B
2018-19 Fiscal Year
Carrier
Observed and
Assumed Election Percent
Single Party
Subsidy
Married/with Domestic Partner Subsidy
Eligible Survivor Subsidy
Kaiser Senior Adv. HMO 58.1% $259.86 $519.72 $259.86
Anthem BC Medicare Supplement 30.6% $542.51 $1,062.50 $542.51
UHC Medicare Adv. HMO for California(1) 11.3% $273.69 $542.78 $273.69
(1) Rates for CA plan.
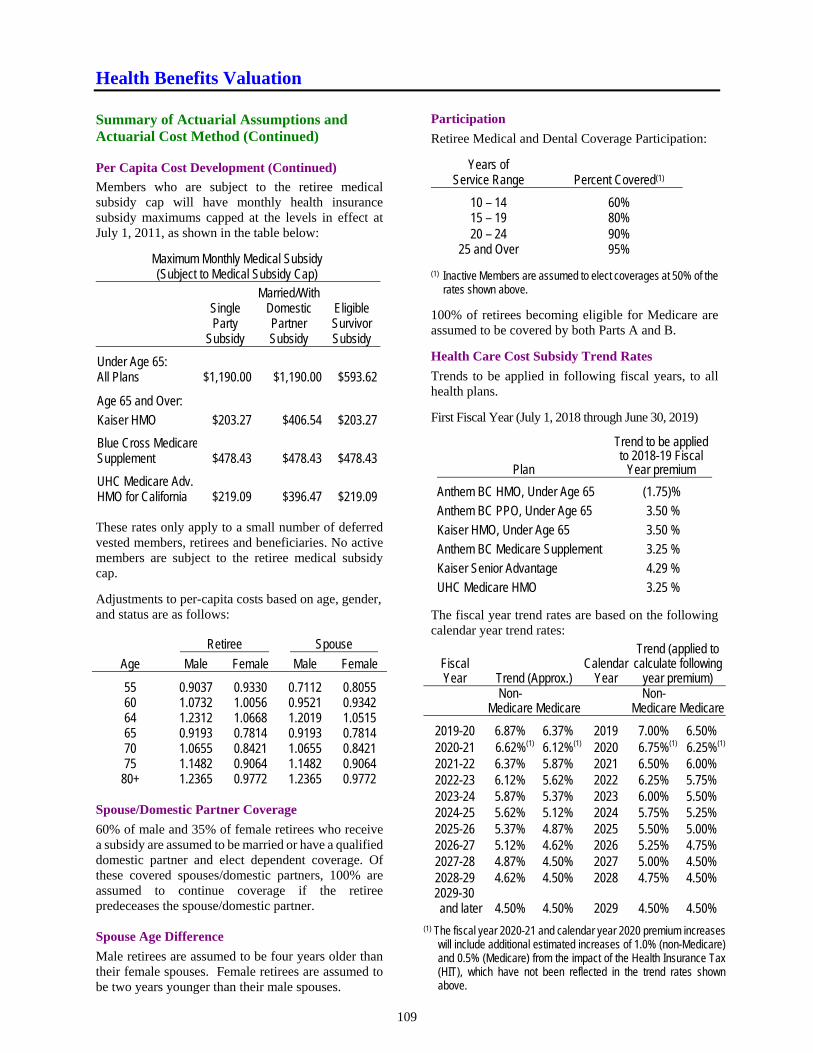
Health Benefits Valuation
109
Summary of Actuarial Assumptions and Actuarial Cost Method (Continued) Per Capita Cost Development (Continued)
Members who are subject to the retiree medical subsidy cap will have monthly health insurance subsidy maximums capped at the levels in effect at July 1, 2011, as shown in the table below:
Maximum Monthly Medical Subsidy (Subject to Medical Subsidy Cap)
Single Party
Subsidy
Married/With Domestic Partner Subsidy
Eligible Survivor Subsidy
Under Age 65: All Plans $1,190.00 $1,190.00 $593.62
Age 65 and Over:
Kaiser HMO $203.27 $406.54 $203.27
Blue Cross MedicareSupplement $478.43 $478.43 $478.43
UHC Medicare Adv. HMO for California $219.09 $396.47 $219.09 These rates only apply to a small number of deferred vested members, retirees and beneficiaries. No active members are subject to the retiree medical subsidy cap.
Adjustments to per-capita costs based on age, gender, and status are as follows:
Retiree Spouse
Age Male Female Male Female
55 0.9037 0.9330 0.7112 0.8055 60 1.0732 1.0056 0.9521 0.9342 64 1.2312 1.0668 1.2019 1.0515 65 0.9193 0.7814 0.9193 0.7814 70 1.0655 0.8421 1.0655 0.8421 75 1.1482 0.9064 1.1482 0.9064
80+ 1.2365 0.9772 1.2365 0.9772 Spouse/Domestic Partner Coverage
60% of male and 35% of female retirees who receive a subsidy are assumed to be married or have a qualified domestic partner and elect dependent coverage. Of these covered spouses/domestic partners, 100% are assumed to continue coverage if the retiree predeceases the spouse/domestic partner. Spouse Age Difference
Male retirees are assumed to be four years older than their female spouses. Female retirees are assumed to be two years younger than their male spouses.
Participation
Retiree Medical and Dental Coverage Participation:
Years of Service Range Percent Covered(1)
10 – 14 60% 15 – 19 80% 20 – 24 90%
25 and Over 95% (1) Inactive Members are assumed to elect coverages at 50% of the
rates shown above.
100% of retirees becoming eligible for Medicare are assumed to be covered by both Parts A and B.
Health Care Cost Subsidy Trend Rates
Trends to be applied in following fiscal years, to all health plans.
First Fiscal Year (July 1, 2018 through June 30, 2019)
Plan
Trend to be applied to 2018-19 Fiscal
Year premium
Anthem BC HMO, Under Age 65 (1.75)%
Anthem BC PPO, Under Age 65 3.50 %
Kaiser HMO, Under Age 65 3.50 %
Anthem BC Medicare Supplement 3.25 %
Kaiser Senior Advantage 4.29 %
UHC Medicare HMO 3.25 %
The fiscal year trend rates are based on the following calendar year trend rates:
Fiscal Year Trend (Approx.)
Calendar Year
Trend (applied to calculate following
year premium)
Non-
Medicare Medicare Non-
Medicare Medicare
2019-20 6.87% 6.37% 2019 7.00% 6.50% 2020-21 6.62%(1) 6.12%(1) 2020 6.75%(1) 6.25%(1) 2021-22 6.37% 5.87% 2021 6.50% 6.00% 2022-23 6.12% 5.62% 2022 6.25% 5.75% 2023-24 5.87% 5.37% 2023 6.00% 5.50% 2024-25 5.62% 5.12% 2024 5.75% 5.25% 2025-26 5.37% 4.87% 2025 5.50% 5.00% 2026-27 5.12% 4.62% 2026 5.25% 4.75% 2027-28 4.87% 4.50% 2027 5.00% 4.50% 2028-29 4.62% 4.50% 2028 4.75% 4.50% 2029-30 and later 4.50% 4.50% 2029 4.50% 4.50%
(1) The fiscal year 2020-21 and calendar year 2020 premium increases will include additional estimated increases of 1.0% (non-Medicare) and 0.5% (Medicare) from the impact of the Health Insurance Tax (HIT), which have not been reflected in the trend rates shown above.
Health Benefits Valuation
110
Summary of Actuarial Assumptions and Actuarial Cost Method (Continued)
Health Care Cost Subsidy Trend Rates (Continued)
Dental Premium Trend: 4.00% for all years. Medicare Part B Premium Trend: 4.00% for all years. Health Care Reform
As directed by LACERS, the impact of potential excise tax imposed by the Affordable Care Act (ACA) and related statutes on certain health plans was reflected in the current valuation in calculating the contribution rates for the employer. Statements No. 74 and No. 75 by the Governmental Accounting Standards Board (GASB) for financial reporting purposes require the inclusion of the excise tax in the liability. Administrative Expenses
No administrative expenses were valued separately from the premium costs. Actuarial Value of Assets
The market value of assets less unrecognized returns in each of the last seven years. Unrecognized return is equal to the difference between the actual and expected returns on a market value basis and is recognized over a seven-year period. The actuarial value of assets cannot be less than 60% or greater than 140% of the market value of assets. An Ad Hoc change was made in 2018 to combine the unrecognized gains of prior years as of June 30, 2017 into one layer and recognize it evenly over six years from fiscal year 2017-18 through fiscal year 2022-23. Actuarial Cost Method
Entry Age Cost Method, level percent of salary. Funding Policy
The plan sponsor of the City of Los Angeles Employees' Retirement System makes contributions equal to the normal cost adjusted by an amount to amortize any surplus or unfunded actuarial accrued liability (UAAL) (refer to the Schedule of Contribution History presented on page 57). The amortization method for the UAAL is a level percentage of payroll, assuming annual increases in total covered payroll equal to inflation plus across the board increases (other than inflation). Both the normal cost and the actuarial accrued liability are determined under the Entry Age cost method and are calculated on an individual basis. Entry age is calculated as age on the valuation date minus years of employment service.
Under the current funding policy, changes in the UAAL due to actuarial gains/losses are amortized over separate 15-year periods. Any changes in the UAAL due to assumption or method changes are amortized over separate 20-year periods. Plan changes, including the 2009 ERIP, are amortized over separate 15-year periods. Future ERIPs will be amortized over five years. Any actuarial surplus is amortized over 30 years. All the bases on or before June 30, 2012, except those arising from the 2009 ERIP, were combined and amortized over 30 years effective June 30, 2012. Health trend and premium assumption changes are amortized over 15 years. One of the goals of LACERS’ funding policy is to achieve long-term full funding of the cost of benefits provided by LACERS. To achieve that goal, the future actuarially determined contributions, together with current assets and expected investment income, are expected to be sufficient to provide all projected future benefit payments for current plan members. Assumption Changes since Prior Valuation
The non-economic actuarial assumptions described above have been updated as a result of the July 1, 2014 through June 30, 2017 Actuarial Experience Study.
The ultimate trend rate was reduced from 4.50% to 4.00% for Medicare Part B and Dental.
Starting premium costs and first year trends were revised to reflect 2019 calendar year premium data.
Medical and dental carrier election assumptions were updated.
The spouse coverage and retiree medical participation assumptions were updated.
Summary of Plan Provisions
LACERS administers a single–employer postemployment health care plan. The following summarizes the major benefit provisions as included in the valuation. To the best of our knowledge, the summary represents the substantive plans as of the measurement date. It is not intended to be, nor should it be interpreted as, a complete statement of all benefit provisions.
Health Benefits Valuation
111
Summary of Plan Provisions (Continued) Membership Eligibility
Tier 1 (§4.1002(a)) All employees who became Members of LACERS before July 1, 2013, and certain employees who became Members of LACERS on or after July 1, 2013. In addition, pursuant to Ordinance No. 184134, all Tier 2 employees who became Members of LACERS between July 1, 2013 and February 21, 2016 were transferred to Tier 1 effective February 21, 2016 (refer to Note 3 – Postemployment Health Care Plan Description on page 33 regarding the membership).
Tier 3 (§4.1080.2(a)) All employees who became Members of LACERS on or after February 21, 2016, except as provided otherwise in Section 4.1080.2(b) of the Los Angeles Administrative Code.
Benefit Eligibility
Tier 1 (§4.1111(a)) and Tier 3 (§4.1126(a)) Retired age 55 or older with at least 10 years of service (including deferred vested Members who terminate employment and receive a retirement benefit from LACERS), or if retirement date is between October 2, 1996, and September 30, 1999 at age 50 or older with at least 30 years of service. Benefits are also payable to spouses, domestic partners, or other qualified dependents while the retiree is alive. The health subsidy is not payable to a disabled retiree before the Member reaches age 55.
Medical Subsidy for Members Not Subject to Cap
Under Age 65 or Over Age 65 Without Medicare Part A:
Tier 1 (§4.1111(d)) and Tier 3 (§4.1126(c)) Both Tier 1 and Tier 3 Members will be eligible for 40% of maximum medical plan premium subsidy for 1 – 10 whole years of service credit, and eligible Members earn 4% per year of service credit for their annual medical subsidy accrual after 10 years of service (limited to actual premium). As of July 1, 2018, the maximum monthly health subsidy is $1,790.80, remaining unchanged in calendar year 2019. This amount includes coverage of dependent premium costs.
Over Age 65 and Enrolled in Both Medicare Parts A and B:
Tier 1 (§4.1111(e)) and Tier 3 (§4.1126(d)) For retirees, a maximum health subsidy shall be paid in the amount of the single-party monthly premium of the approved Medicare supplemental or coordinated plan in which the retiree is enrolled, subject to the following vesting schedule:
Completed Years of Service Credit
Vested Percentage
1-14 75% 15-19 90% 20+ 100%
Subsidy Cap for Tier 1
Tier 1 (§4.1111(b)) As of the June 30, 2011 valuation, the retiree health benefits program was changed to cap the medical subsidy for non-retired Members who do not contribute an additional 4.0% or 4.5% of employee contributions to the System.
The capped subsidy is different for Medicare and non-Medicare retirees.
The cap applies to the medical subsidy limits at the 2011 calendar year level.
The cap does not apply to the dental subsidy or the Medicare Part B premium reimbursement.
Dependents
Tier 1 (§4.1111(e)(4)) and Tier 3 (§4.1126(d)(4)) An additional amount is added for coverage of dependents which shall not exceed the amount provided to a retiree not enrolled in Medicare Parts A and B and covered by the same medical plan with the same years of service credit. The combined Member and dependent subsidy shall not exceed the actual premium. This refers to dependents of retired Members with Medicare Parts A and B. It does not apply to those without Medicare or Part B only.
Health Benefits Valuation
112
Summary of Plan Provisions (Continued)
Dental Subsidy for Members
Tier 1 (§4.1114(b)) and Tier 3 (§4.1129(b)) The System will pay 4% of the maximum dental subsidy (limited to actual premium) for each year of Service Credit, up to 100% of the maximum dental subsidy. As of July 1, 2018, the maximum dental subsidy is $44.60 per month; remaining unchanged in calendar year 2019.
There is no subsidy available to spouses or domestic partners or for dependent coverage. There is also no reimbursement for dental plans not sponsored by the System.
Medicare Part B Reimbursement for Members
Tier 1 (§4.1113) and Tier 3 (§4.1128) If a retiree is covered by both Medicare Parts A and B, and enrolled in a LACERS medical plan or participates in the LACERS Retiree Medical Premium Reimbursement Program, LACERS will reimburse the retiree the basic Medicare Part B premium.
Medical Subsidy for Surviving Spouse
Tier 1 (§4.1115) and Tier 3 (§4.1129.1) The surviving spouse or domestic partner will be entitled to a health subsidy based on the Member’s years of service credit and the surviving dependent’s eligibility for Medicare.
Under Age 65 or Over Age 65 Without Medicare Part A
The maximum health subsidy available for survivors is the lowest cost plan available (currently Kaiser) single-party premium ($853.39 per month as of July 1, 2018, remaining unchanged in calendar year 2019).
Over Age 65 and Enrolled in Both Medicare Parts A and B:
For survivors, a maximum health subsidy limited to the single-party monthly premium of the plan in which the survivor is enrolled, is provided subject to the following vesting schedule:
Completed Years of Service Credit
Vested Percentage
1-14 75% 15-19 90% 20+ 100%
Changes in Plan Provisions
A new Tier 1 Enhanced Plan providing a higher retirement benefit was adopted pursuant to Ordinance No. 184853. However, other than the actuary applying higher retirement rate assumptions to anticipate somewhat earlier retirement, there are no differences between the retiree health benefits paid by LACERS to those members.


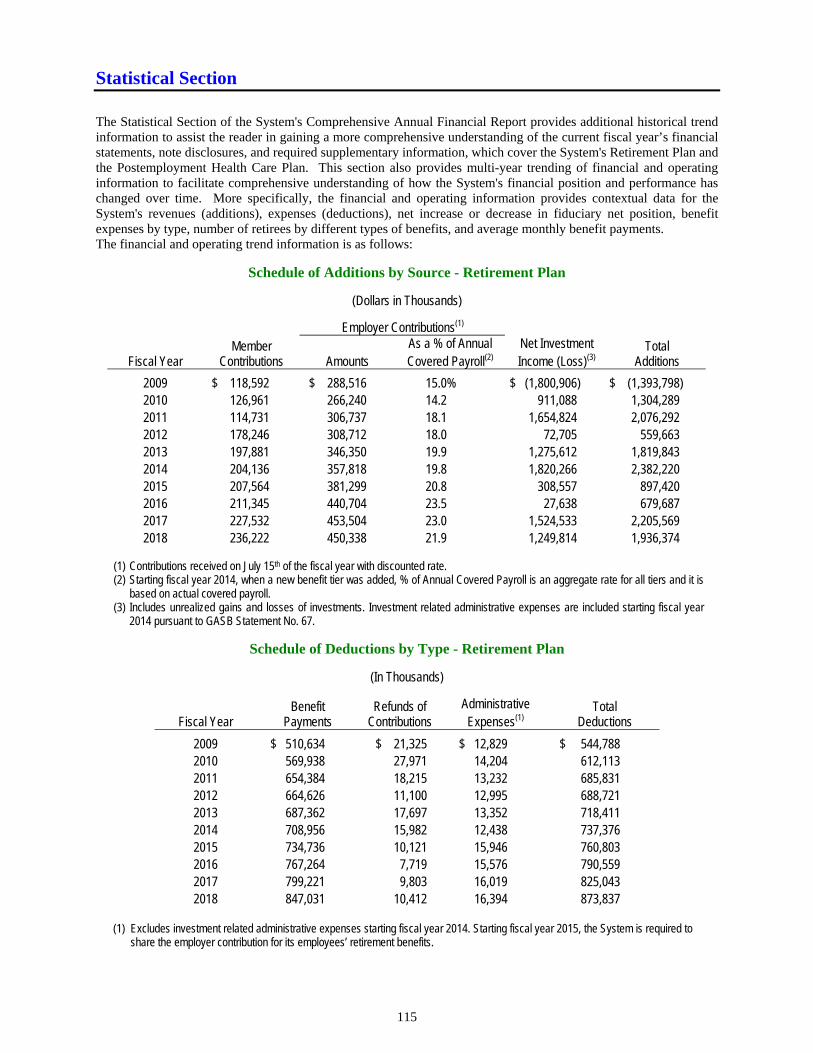
Statistical Section
115
The Statistical Section of the System's Comprehensive Annual Financial Report provides additional historical trend information to assist the reader in gaining a more comprehensive understanding of the current fiscal year’s financial statements, note disclosures, and required supplementary information, which cover the System's Retirement Plan and the Postemployment Health Care Plan. This section also provides multi-year trending of financial and operating information to facilitate comprehensive understanding of how the System's financial position and performance has changed over time. More specifically, the financial and operating information provides contextual data for the System's revenues (additions), expenses (deductions), net increase or decrease in fiduciary net position, benefit expenses by type, number of retirees by different types of benefits, and average monthly benefit payments. The financial and operating trend information is as follows:
Schedule of Additions by Source - Retirement Plan
(Dollars in Thousands)
Schedule of Deductions by Type - Retirement Plan
(In Thousands)
Fiscal Year Benefit
Payments Refunds of
Contributions Administrative Expenses(1)
Total Deductions
2009 $ 510,634 $ 21,325 $ 12,829 $ 544,788 2010 569,938 27,971 14,204 612,113 2011 654,384 18,215 13,232 685,831 2012 664,626 11,100 12,995 688,721 2013 687,362 17,697 13,352 718,411 2014 708,956 15,982 12,438 737,376 2015 734,736 10,121 15,946 760,803 2016 767,264 7,719 15,576 790,559 2017 799,221 9,803 16,019 825,043 2018 847,031 10,412 16,394 873,837
(1) Excludes investment related administrative expenses starting fiscal year 2014. Starting fiscal year 2015, the System is required to
share the employer contribution for its employees’ retirement benefits.
Employer Contributions(1)
Fiscal Year Member
Contributions Amounts As a % of Annual Covered Payroll(2)
Net Investment Income (Loss)(3)
Total Additions
2009 $ 118,592 $ 288,516 15.0% $ (1,800,906) $ (1,393,798) 2010 126,961 266,240 14.2 911,088 1,304,289 2011 114,731 306,737 18.1 1,654,824 2,076,292 2012 178,246 308,712 18.0 72,705 559,663 2013 197,881 346,350 19.9 1,275,612 1,819,843 2014 204,136 357,818 19.8 1,820,266 2,382,220 2015 207,564 381,299 20.8 308,557 897,420 2016 211,345 440,704 23.5 27,638 679,687 2017 227,532 453,504 23.0 1,524,533 2,205,569 2018 236,222 450,338 21.9 1,249,814 1,936,374
(1) Contributions received on July 15th of the fiscal year with discounted rate. (2)
(3)
Starting fiscal year 2014, when a new benefit tier was added, % of Annual Covered Payroll is an aggregate rate for all tiers and it is based on actual covered payroll. Includes unrealized gains and losses of investments. Investment related administrative expenses are included starting fiscal year 2014 pursuant to GASB Statement No. 67.
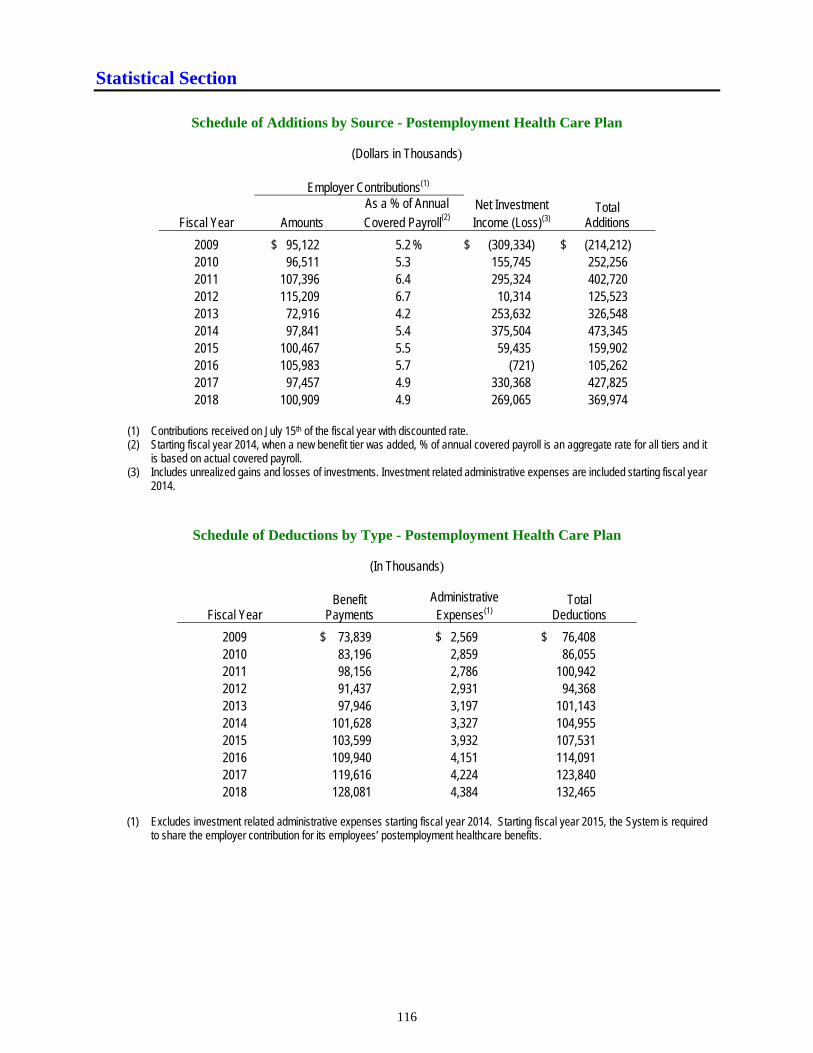
Statistical Section
116
Schedule of Additions by Source - Postemployment Health Care Plan
(Dollars in Thousands)
Employer Contributions(1)
Fiscal Year Amounts
As a % of Annual
Covered Payroll(2)
Net Investment Income (Loss)(3)
Total Additions
2009 $ 95,122 5.2 % $ (309,334) $ (214,212) 2010 96,511 5.3 155,745 252,256 2011 107,396 6.4 295,324 402,720 2012 115,209 6.7 10,314 125,523 2013 72,916 4.2 253,632 326,548 2014 97,841 5.4 375,504 473,345 2015 100,467 5.5 59,435 159,902 2016 105,983 5.7 (721) 105,262 2017 97,457 4.9 330,368 427,825 2018 100,909 4.9 269,065 369,974
(1) Contributions received on July 15th of the fiscal year with discounted rate. (2) Starting fiscal year 2014, when a new benefit tier was added, % of annual covered payroll is an aggregate rate for all tiers and it
is based on actual covered payroll. (3) Includes unrealized gains and losses of investments. Investment related administrative expenses are included starting fiscal year
2014.
Schedule of Deductions by Type - Postemployment Health Care Plan
(In Thousands)
Fiscal Year Benefit
Payments Administrative Expenses(1)
Total Deductions
2009 $ 73,839 $ 2,569 $ 76,408 2010 83,196 2,859 86,055 2011 98,156 2,786 100,942 2012 91,437 2,931 94,368 2013 97,946 3,197 101,143 2014 101,628 3,327 104,955 2015 103,599 3,932 107,531 2016 109,940 4,151 114,091 2017 119,616 4,224 123,840 2018 128,081 4,384 132,465
(1) Excludes investment related administrative expenses starting fiscal year 2014. Starting fiscal year 2015, the System is required
to share the employer contribution for its employees’ postemployment healthcare benefits.
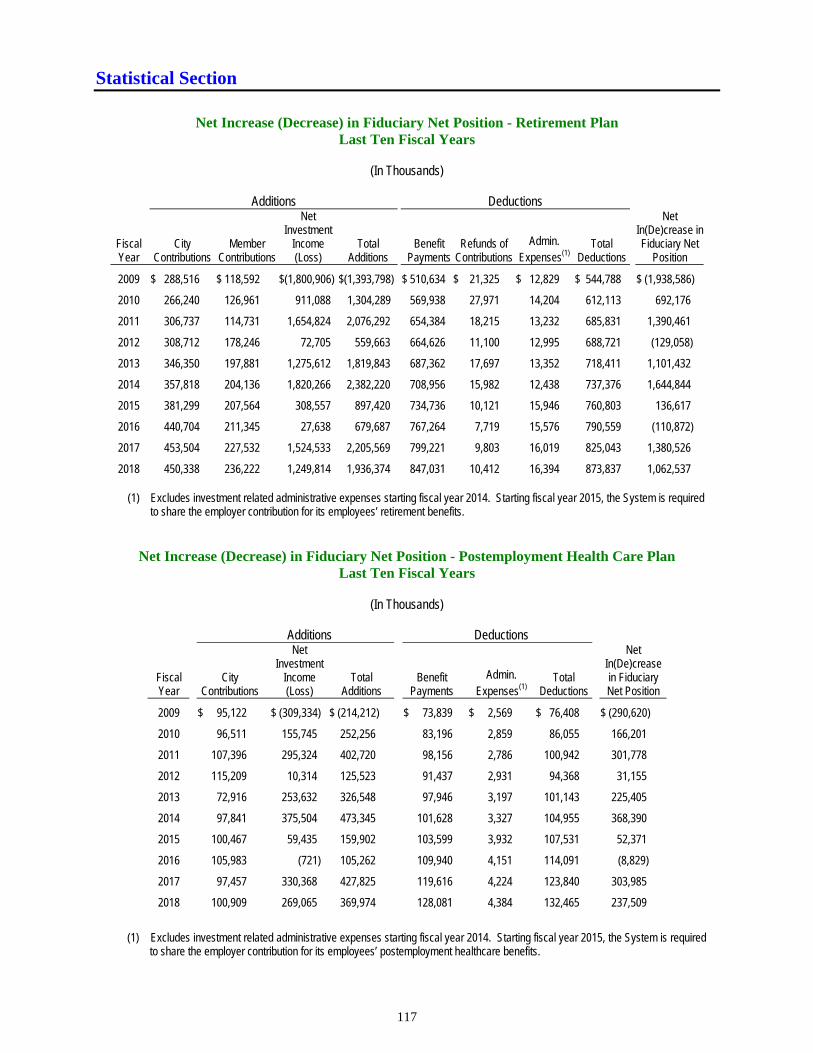
Statistical Section
117
Net Increase (Decrease) in Fiduciary Net Position - Retirement Plan
Last Ten Fiscal Years
(In Thousands)
(1) Excludes investment related administrative expenses starting fiscal year 2014. Starting fiscal year 2015, the System is required
to share the employer contribution for its employees’ retirement benefits.
Net Increase (Decrease) in Fiduciary Net Position - Postemployment Health Care Plan
Last Ten Fiscal Years
(In Thousands)
(1) Excludes investment related administrative expenses starting fiscal year 2014. Starting fiscal year 2015, the System is required to share the employer contribution for its employees’ postemployment healthcare benefits.
Additions Deductions
Fiscal Year
City Contributions
Member Contributions
Net Investment
Income (Loss)
Total Additions
Benefit Payments
Refunds of Contributions
Admin. Expenses(1)
Total Deductions
Net In(De)crease in Fiduciary Net
Position
2009 $ 288,516 $ 118,592 $(1,800,906) $(1,393,798) $ 510,634 $ 21,325 $ 12,829 $ 544,788 $ (1,938,586)
2010 266,240 126,961 911,088 1,304,289 569,938 27,971 14,204 612,113 692,176
2011 306,737 114,731 1,654,824 2,076,292 654,384 18,215 13,232 685,831 1,390,461
2012 308,712 178,246 72,705 559,663 664,626 11,100 12,995 688,721 (129,058)
2013 346,350 197,881 1,275,612 1,819,843 687,362 17,697 13,352 718,411 1,101,432
2014 357,818 204,136 1,820,266 2,382,220 708,956 15,982 12,438 737,376 1,644,844
2015 381,299 207,564 308,557 897,420 734,736 10,121 15,946 760,803 136,617
2016 440,704 211,345 27,638 679,687 767,264 7,719 15,576 790,559 (110,872)
2017 453,504 227,532 1,524,533 2,205,569 799,221 9,803 16,019 825,043 1,380,526
2018 450,338 236,222 1,249,814 1,936,374 847,031 10,412 16,394 873,837 1,062,537
Additions Deductions
Fiscal Year
City Contributions
Net Investment
Income (Loss)
Total Additions
Benefit Payments
Admin. Expenses(1)
Total Deductions
Net In(De)crease in Fiduciary Net Position
2009
$ 95,122 $ (309,334) $ (214,212) $ 73,839 $ 2,569 $ 76,408 $ (290,620)
2010
96,511 155,745 252,256 83,196 2,859 86,055 166,201
2011
107,396 295,324 402,720 98,156 2,786 100,942 301,778
2012
115,209 10,314 125,523 91,437 2,931 94,368 31,155
2013
72,916 253,632 326,548 97,946 3,197 101,143 225,405
2014
97,841 375,504 473,345 101,628 3,327 104,955 368,390
2015
100,467 59,435 159,902 103,599 3,932 107,531 52,371
2016
105,983 (721) 105,262 109,940 4,151 114,091 (8,829)
2017
97,457 330,368 427,825 119,616 4,224 123,840 303,985
2018
100,909 269,065 369,974 128,081 4,384 132,465 237,509
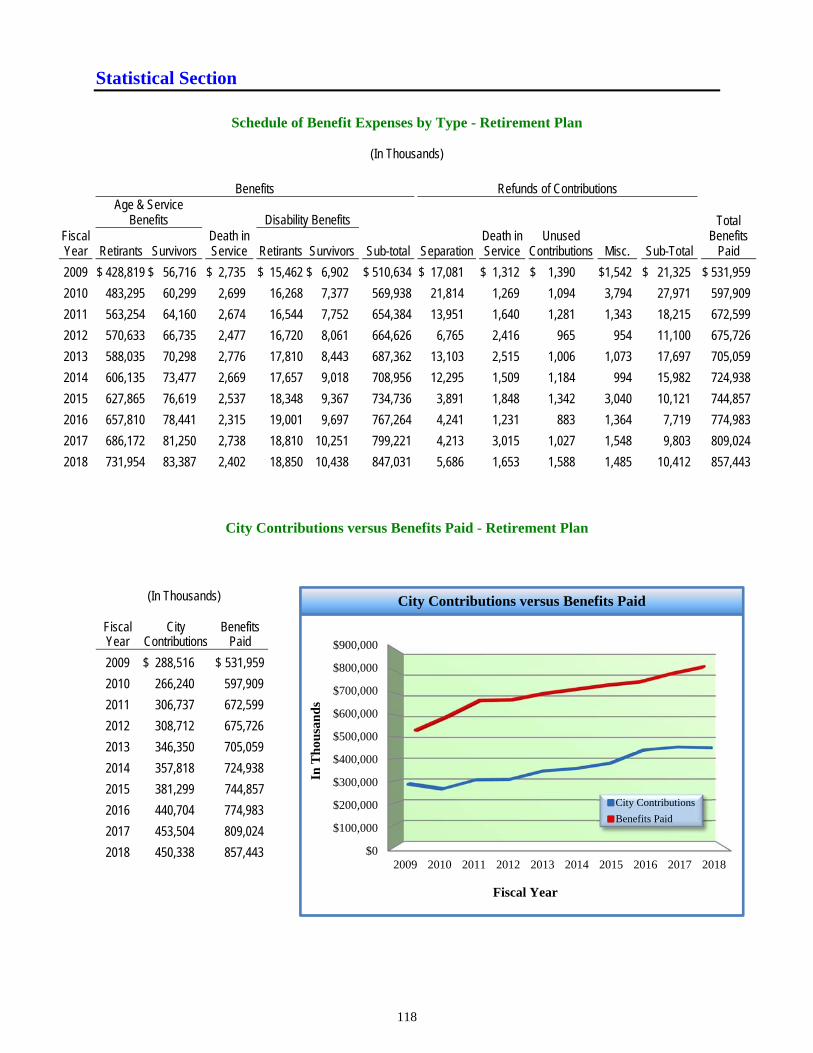
Statistical Section
118
Schedule of Benefit Expenses by Type - Retirement Plan
(In Thousands)
Benefits Refunds of Contributions
Age & Service
Benefits Death in Service
Disability Benefits
Total Benefits
Paid Fiscal Year Retirants Survivors Retirants Survivors
Sub-total Separation
Death in Service
Unused Contributions
Misc.
Sub-Total
2009 $ 428,819 $ 56,716 $ 2,735 $ 15,462 $ 6,902 $ 510,634 $ 17,081 $ 1,312 $ 1,390 $1,542 $ 21,325 $ 531,959
2010 483,295 60,299 2,699 16,268 7,377 569,938 21,814 1,269 1,094 3,794 27,971 597,909
2011 563,254 64,160 2,674 16,544 7,752 654,384 13,951 1,640 1,281 1,343 18,215 672,599
2012 570,633 66,735 2,477 16,720 8,061 664,626 6,765 2,416 965 954 11,100 675,726
2013 588,035 70,298 2,776 17,810 8,443 687,362 13,103 2,515 1,006 1,073 17,697 705,059
2014 606,135 73,477 2,669 17,657 9,018 708,956 12,295 1,509 1,184 994 15,982 724,938
2015 627,865 76,619 2,537 18,348 9,367 734,736 3,891 1,848 1,342 3,040 10,121 744,857
2016 657,810 78,441 2,315 19,001 9,697 767,264 4,241 1,231 883 1,364 7,719 774,983
2017 686,172 81,250 2,738 18,810 10,251 799,221 4,213 3,015 1,027 1,548 9,803 809,024
2018 731,954 83,387 2,402 18,850 10,438 847,031 5,686 1,653 1,588 1,485 10,412 857,443
City Contributions versus Benefits Paid - Retirement Plan
(In Thousands)
Fiscal Year
City Contributions
Benefits Paid
2009 $ 288,516 $ 531,959
2010 266,240 597,909
2011 306,737 672,599
2012 308,712 675,726
2013 346,350 705,059
2014 357,818 724,938
2015 381,299 744,857
2016 440,704 774,983
2017 453,504 809,024
2018 450,338 857,443
$0
$100,000
$200,000
$300,000
$400,000
$500,000
$600,000
$700,000
$800,000
$900,000
2009 2010 2011 2012 2013 2014 2015 2016 2017 2018
In T
hou
san
ds
Fiscal Year
City Contributions
Benefits Paid
City Contributions versus Benefits Paid
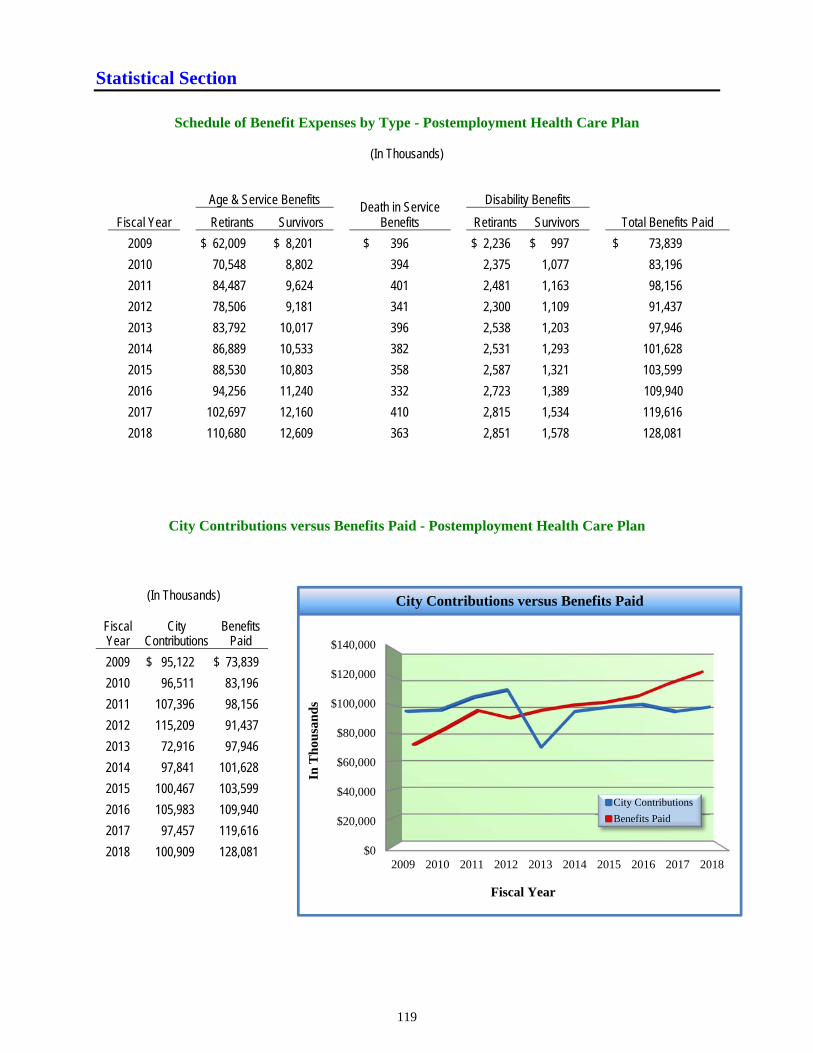
Statistical Section
119
Schedule of Benefit Expenses by Type - Postemployment Health Care Plan
(In Thousands)
Age & Service Benefits Death in Service Benefits
Disability Benefits
Fiscal Year Retirants Survivors Retirants Survivors Total Benefits Paid
2009 $ 62,009 $ 8,201 $ 396 $ 2,236 $ 997 $ 73,839
2010 70,548 8,802 394 2,375 1,077 83,196
2011 84,487 9,624 401 2,481 1,163 98,156
2012 78,506 9,181 341 2,300 1,109 91,437
2013 83,792 10,017 396 2,538 1,203 97,946
2014 86,889 10,533 382 2,531 1,293 101,628
2015 88,530 10,803 358 2,587 1,321 103,599
2016 94,256 11,240 332 2,723 1,389 109,940
2017 102,697 12,160 410 2,815 1,534 119,616
2018 110,680 12,609 363 2,851 1,578 128,081
City Contributions versus Benefits Paid - Postemployment Health Care Plan
(In Thousands)
Fiscal Year
City Contributions
Benefits Paid
2009 $ 95,122 $ 73,839
2010 96,511 83,196
2011 107,396 98,156
2012 115,209 91,437
2013 72,916 97,946
2014 97,841 101,628
2015 100,467 103,599
2016 105,983 109,940
2017 97,457 119,616
2018 100,909 128,081
$0
$20,000
$40,000
$60,000
$80,000
$100,000
$120,000
$140,000
2009 2010 2011 2012 2013 2014 2015 2016 2017 2018
In T
hou
san
ds
Fiscal Year
City Contributions
Benefits Paid
City Contributions versus Benefits Paid
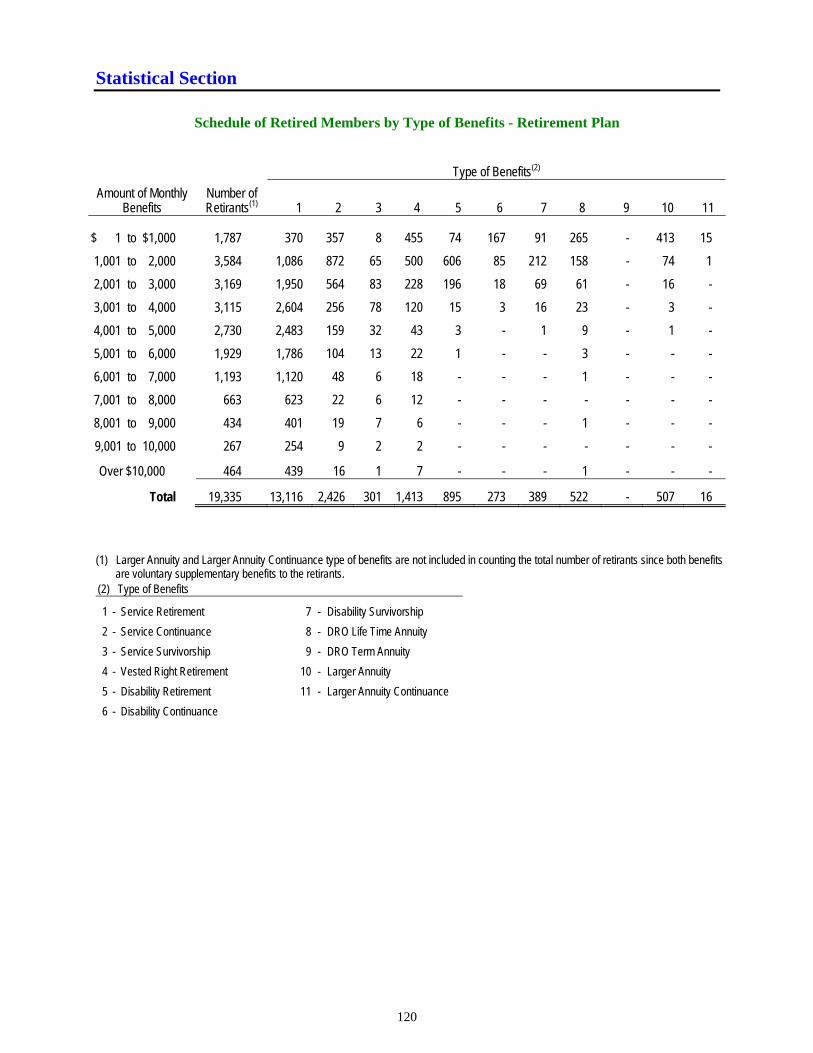
Statistical Section
120
Schedule of Retired Members by Type of Benefits - Retirement Plan
Type of Benefits(2)
Amount of Monthly Benefits
Number of Retirants(1) 1 2 3 4 5 6 7 8 9 10 11
$ 1 to $1,000 1,787 370 357 8 455 74 167 91 265 - 413 15
1,001 to 2,000 3,584 1,086 872 65 500 606 85 212 158 - 74 1
2,001 to 3,000 3,169 1,950 564 83 228 196 18 69 61 - 16 -
3,001 to 4,000 3,115 2,604 256 78 120 15 3 16 23 - 3 -
4,001 to 5,000 2,730 2,483 159 32 43 3 - 1 9 - 1 -
5,001 to 6,000 1,929 1,786 104 13 22 1 - - 3 - - -
6,001 to 7,000 1,193 1,120 48 6 18 - - - 1 - - -
7,001 to 8,000 663 623 22 6 12 - - - - - - -
8,001 to 9,000 434 401 19 7 6 - - - 1 - - -
9,001 to 10,000 267 254 9 2 2 - - - - - - -
Over $10,000 464 439 16 1 7 - - - 1 - - -
Total 19,335 13,116 2,426 301 1,413 895 273 389 522 - 507 16 (1) Larger Annuity and Larger Annuity Continuance type of benefits are not included in counting the total number of retirants since both benefits are voluntary supplementary benefits to the retirants. (2) Type of Benefits
1 - Service Retirement 7 - Disability Survivorship
2 - Service Continuance 8 - DRO Life Time Annuity
3 - Service Survivorship 9 - DRO Term Annuity
4 - Vested Right Retirement 10 - Larger Annuity
5 - Disability Retirement 11 - Larger Annuity Continuance
6 - Disability Continuance
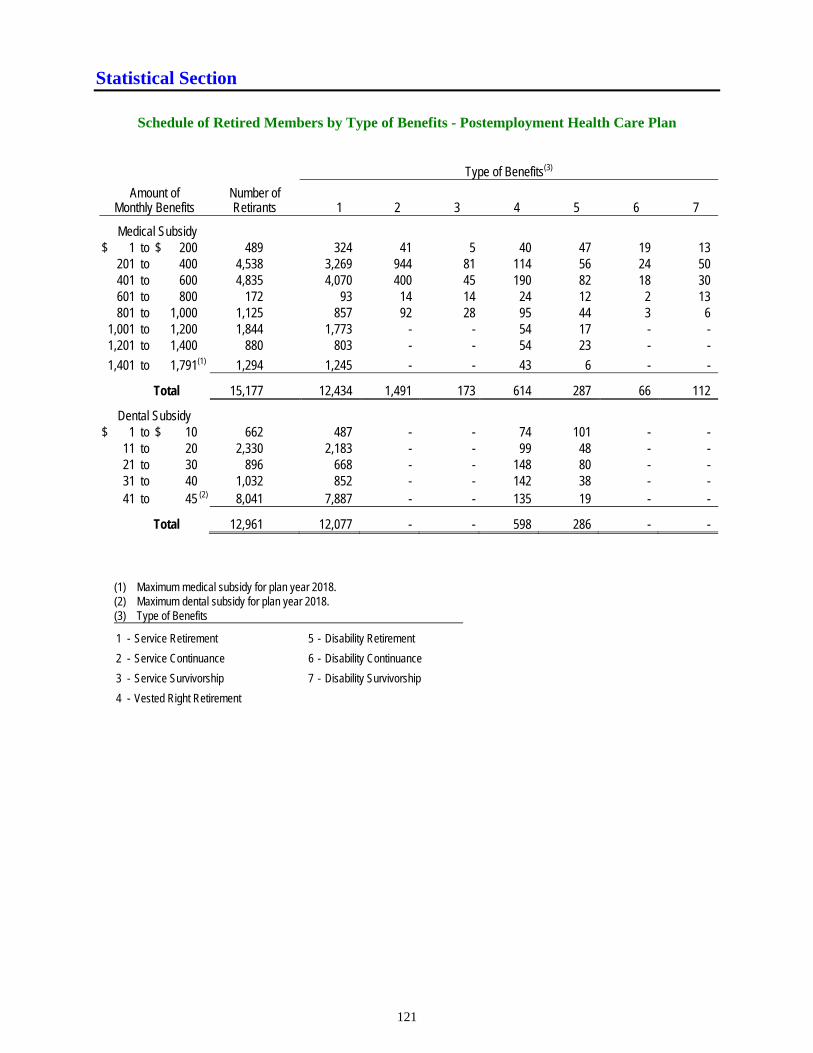
Statistical Section
121
Schedule of Retired Members by Type of Benefits - Postemployment Health Care Plan
Type of Benefits(3)
Amount of Monthly Benefits
Number of Retirants 1 2 3 4 5 6 7
Medical Subsidy $ 1 to $ 200 489 324 41 5 40 47 19 13 201 to 400 4,538 3,269 944 81 114 56 24 50 401 to 600 4,835 4,070 400 45 190 82 18 30 601 to 800 172 93 14 14 24 12 2 13 801 to 1,000 1,125 857 92 28 95 44 3 6 1,001 to 1,200 1,844 1,773 - - 54 17 - - 1,201 to 1,400 880 803 - - 54 23 - -
1,401 to 1,791(1) 1,294 1,245 - - 43 6 - -
Total 15,177 12,434 1,491 173 614 287 66 112
Dental Subsidy $ 1 to $ 10 662 487 - - 74 101 - -
11 to 20 2,330 2,183 - - 99 48 - - 21 to 30 896 668 - - 148 80 - -
31 to 40 1,032 852 - - 142 38 - - 41 to 45 (2) 8,041 7,887 - - 135 19 - -
Total 12,961 12,077 - - 598 286 - -
(1) Maximum medical subsidy for plan year 2018. (2) Maximum dental subsidy for plan year 2018. (3) Type of Benefits
1 - Service Retirement 5 - Disability Retirement
2 - Service Continuance 6 - Disability Continuance
3 - Service Survivorship 7 - Disability Survivorship
4 - Vested Right Retirement
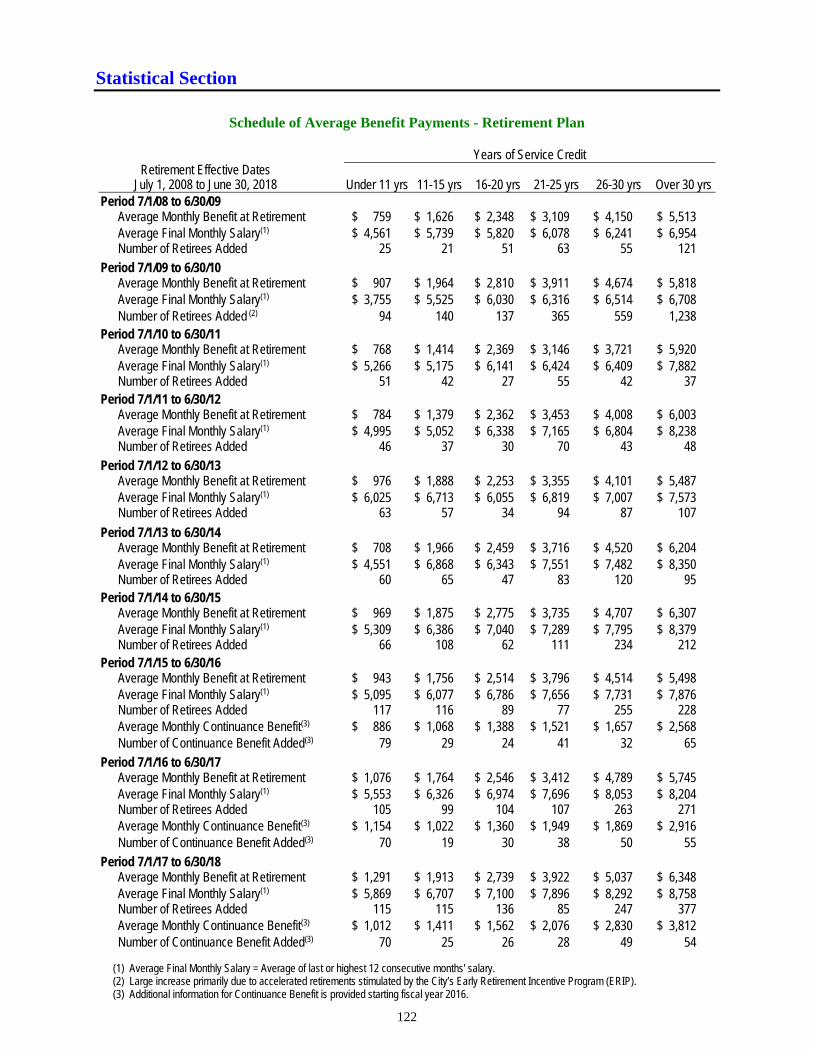
Statistical Section
122
Schedule of Average Benefit Payments - Retirement Plan
Years of Service Credit
Retirement Effective Dates July 1, 2008 to June 30, 2018 Under 11 yrs 11-15 yrs 16-20 yrs 21-25 yrs 26-30 yrs Over 30 yrs
Period 7/1/08 to 6/30/09 Average Monthly Benefit at Retirement $ 759 $ 1,626 $ 2,348 $ 3,109 $ 4,150 $ 5,513 Average Final Monthly Salary(1) $ 4,561 $ 5,739 $ 5,820 $ 6,078 $ 6,241 $ 6,954 Number of Retirees Added 25 21 51 63 55 121
Period 7/1/09 to 6/30/10 Average Monthly Benefit at Retirement $ 907 $ 1,964 $ 2,810 $ 3,911 $ 4,674 $ 5,818 Average Final Monthly Salary(1) $ 3,755 $ 5,525 $ 6,030 $ 6,316 $ 6,514 $ 6,708 Number of Retirees Added (2) 94 140 137 365 559 1,238 Period 7/1/10 to 6/30/11 Average Monthly Benefit at Retirement $ 768 $ 1,414 $ 2,369 $ 3,146 $ 3,721 $ 5,920 Average Final Monthly Salary(1) $ 5,266 $ 5,175 $ 6,141 $ 6,424 $ 6,409 $ 7,882 Number of Retirees Added 51 42 27 55 42 37 Period 7/1/11 to 6/30/12 Average Monthly Benefit at Retirement $ 784 $ 1,379 $ 2,362 $ 3,453 $ 4,008 $ 6,003 Average Final Monthly Salary(1) $ 4,995 $ 5,052 $ 6,338 $ 7,165 $ 6,804 $ 8,238 Number of Retirees Added 46 37 30 70 43 48
Period 7/1/12 to 6/30/13 Average Monthly Benefit at Retirement $ 976 $ 1,888 $ 2,253 $ 3,355 $ 4,101 $ 5,487 Average Final Monthly Salary(1) $ 6,025 $ 6,713 $ 6,055 $ 6,819 $ 7,007 $ 7,573 Number of Retirees Added 63 57 34 94 87 107
Period 7/1/13 to 6/30/14 Average Monthly Benefit at Retirement $ 708 $ 1,966 $ 2,459 $ 3,716 $ 4,520 $ 6,204 Average Final Monthly Salary(1) $ 4,551 $ 6,868 $ 6,343 $ 7,551 $ 7,482 $ 8,350 Number of Retirees Added 60 65 47 83 120 95 Period 7/1/14 to 6/30/15 Average Monthly Benefit at Retirement $ 969 $ 1,875 $ 2,775 $ 3,735 $ 4,707 $ 6,307 Average Final Monthly Salary(1) $ 5,309 $ 6,386 $ 7,040 $ 7,289 $ 7,795 $ 8,379 Number of Retirees Added 66 108 62 111 234 212 Period 7/1/15 to 6/30/16 Average Monthly Benefit at Retirement $ 943 $ 1,756 $ 2,514 $ 3,796 $ 4,514 $ 5,498 Average Final Monthly Salary(1) $ 5,095 $ 6,077 $ 6,786 $ 7,656 $ 7,731 $ 7,876 Number of Retirees Added 117 116 89 77 255 228 Average Monthly Continuance Benefit(3) $ 886 $ 1,068 $ 1,388 $ 1,521 $ 1,657 $ 2,568 Number of Continuance Benefit Added(3) 79 29 24 41 32 65
Period 7/1/16 to 6/30/17 Average Monthly Benefit at Retirement $ 1,076 $ 1,764 $ 2,546 $ 3,412 $ 4,789 $ 5,745 Average Final Monthly Salary(1) $ 5,553 $ 6,326 $ 6,974 $ 7,696 $ 8,053 $ 8,204 Number of Retirees Added 105 99 104 107 263 271 Average Monthly Continuance Benefit(3) $ 1,154 $ 1,022 $ 1,360 $ 1,949 $ 1,869 $ 2,916 Number of Continuance Benefit Added(3) 70 19 30 38 50 55
Period 7/1/17 to 6/30/18 Average Monthly Benefit at Retirement $ 1,291 $ 1,913 $ 2,739 $ 3,922 $ 5,037 $ 6,348 Average Final Monthly Salary(1) $ 5,869 $ 6,707 $ 7,100 $ 7,896 $ 8,292 $ 8,758 Number of Retirees Added 115 115 136 85 247 377 Average Monthly Continuance Benefit(3) $ 1,012 $ 1,411 $ 1,562 $ 2,076 $ 2,830 $ 3,812 Number of Continuance Benefit Added(3) 70 25 26 28 49 54
(1) Average Final Monthly Salary = Average of last or highest 12 consecutive months' salary. (2) Large increase primarily due to accelerated retirements stimulated by the City’s Early Retirement Incentive Program (ERIP). (3) Additional information for Continuance Benefit is provided starting fiscal year 2016.
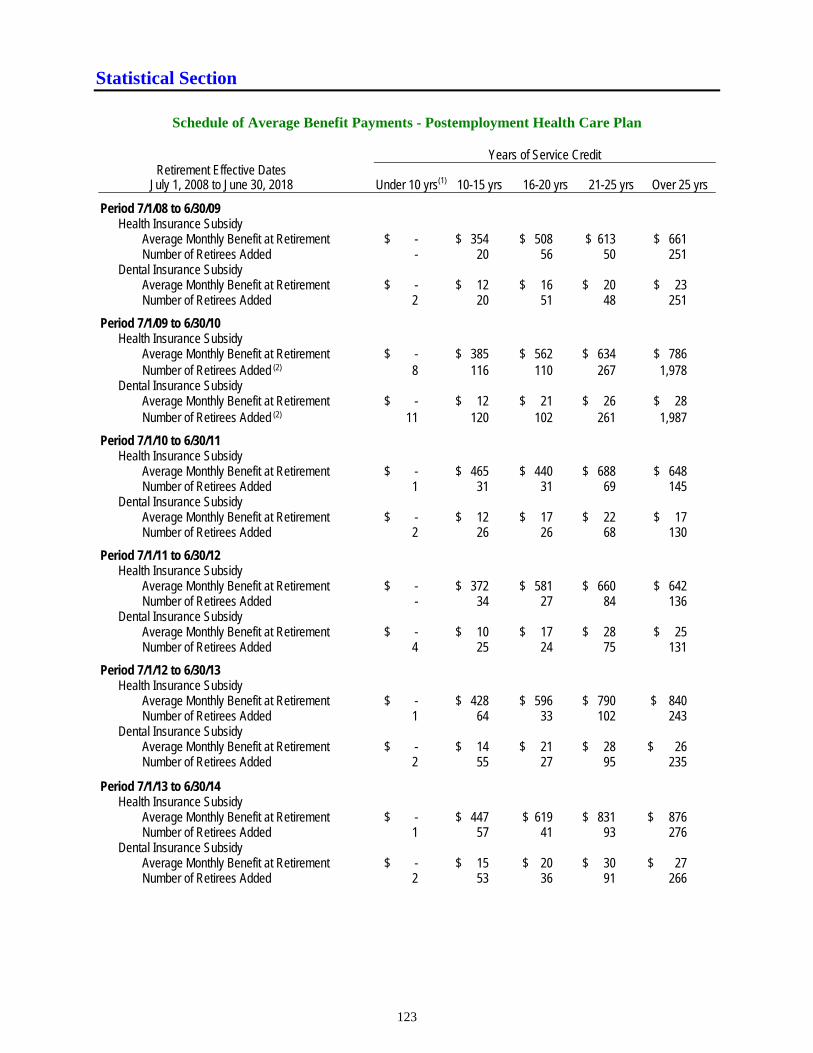
Statistical Section
123
Schedule of Average Benefit Payments - Postemployment Health Care Plan
Years of Service Credit
Retirement Effective Dates July 1, 2008 to June 30, 2018 Under 10 yrs(1) 10-15 yrs 16-20 yrs 21-25 yrs Over 25 yrs
Period 7/1/08 to 6/30/09 Health Insurance Subsidy Average Monthly Benefit at Retirement $ - $ 354 $ 508 $ 613 $ 661 Number of Retirees Added - 20 56 50 251 Dental Insurance Subsidy Average Monthly Benefit at Retirement $ - $ 12 $ 16 $ 20 $ 23 Number of Retirees Added 2 20 51 48 251
Period 7/1/09 to 6/30/10 Health Insurance Subsidy Average Monthly Benefit at Retirement $ - $ 385 $ 562 $ 634 $ 786 Number of Retirees Added (2) 8 116 110 267 1,978 Dental Insurance Subsidy Average Monthly Benefit at Retirement $ - $ 12 $ 21 $ 26 $ 28 Number of Retirees Added (2) 11 120 102 261 1,987
Period 7/1/10 to 6/30/11 Health Insurance Subsidy Average Monthly Benefit at Retirement $ - $ 465 $ 440 $ 688 $ 648 Number of Retirees Added 1 31 31 69 145 Dental Insurance Subsidy Average Monthly Benefit at Retirement $ - $ 12 $ 17 $ 22 $ 17 Number of Retirees Added 2 26 26 68 130
Period 7/1/11 to 6/30/12 Health Insurance Subsidy Average Monthly Benefit at Retirement $ - $ 372 $ 581 $ 660 $ 642 Number of Retirees Added - 34 27 84 136 Dental Insurance Subsidy Average Monthly Benefit at Retirement $ - $ 10 $ 17 $ 28 $ 25 Number of Retirees Added 4 25 24 75 131
Period 7/1/12 to 6/30/13 Health Insurance Subsidy Average Monthly Benefit at Retirement $ - $ 428 $ 596 $ 790 $ 840 Number of Retirees Added 1 64 33 102 243 Dental Insurance Subsidy Average Monthly Benefit at Retirement $ - $ 14 $ 21 $ 28 $ 26 Number of Retirees Added 2 55 27 95 235
Period 7/1/13 to 6/30/14 Health Insurance Subsidy Average Monthly Benefit at Retirement $ - $ 447 $ 619 $ 831 $ 876 Number of Retirees Added 1 57 41 93 276 Dental Insurance Subsidy Average Monthly Benefit at Retirement $ - $ 15 $ 20 $ 30 $ 27 Number of Retirees Added 2 53 36 91 266
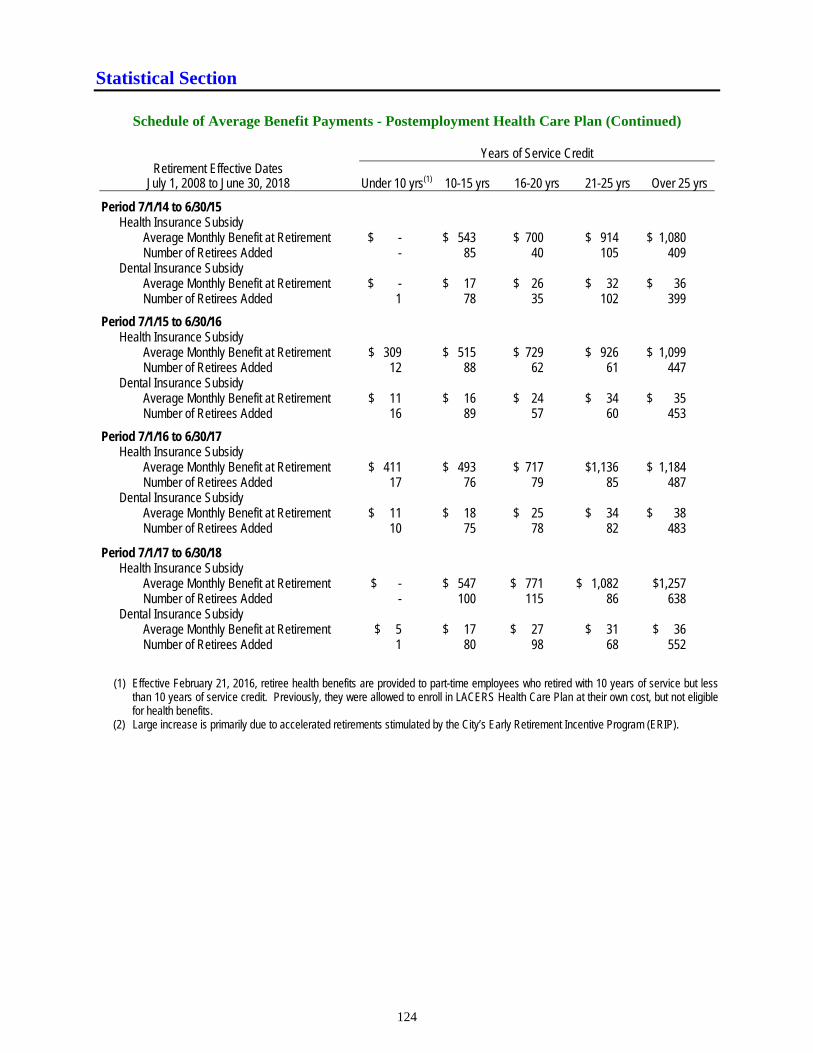
Statistical Section
124
Schedule of Average Benefit Payments - Postemployment Health Care Plan (Continued)
Years of Service Credit
Retirement Effective Dates July 1, 2008 to June 30, 2018 Under 10 yrs(1) 10-15 yrs 16-20 yrs 21-25 yrs Over 25 yrs
Period 7/1/14 to 6/30/15 Health Insurance Subsidy Average Monthly Benefit at Retirement $ - $ 543 $ 700 $ 914 $ 1,080 Number of Retirees Added - 85 40 105 409 Dental Insurance Subsidy Average Monthly Benefit at Retirement $ - $ 17 $ 26 $ 32 $ 36 Number of Retirees Added 1 78 35 102 399
Period 7/1/15 to 6/30/16 Health Insurance Subsidy Average Monthly Benefit at Retirement $ 309 $ 515 $ 729 $ 926 $ 1,099 Number of Retirees Added 12 88 62 61 447 Dental Insurance Subsidy Average Monthly Benefit at Retirement $ 11 $ 16 $ 24 $ 34 $ 35 Number of Retirees Added 16 89 57 60 453
Period 7/1/16 to 6/30/17 Health Insurance Subsidy Average Monthly Benefit at Retirement $ 411 $ 493 $ 717 $1,136 $ 1,184 Number of Retirees Added 17 76 79 85 487 Dental Insurance Subsidy Average Monthly Benefit at Retirement $ 11 $ 18 $ 25 $ 34 $ 38 Number of Retirees Added 10 75 78 82 483
Period 7/1/17 to 6/30/18 Health Insurance Subsidy Average Monthly Benefit at Retirement $ - $ 547 $ 771 $ 1,082 $1,257 Number of Retirees Added - 100 115 86 638 Dental Insurance Subsidy Average Monthly Benefit at Retirement $ 5 $ 17 $ 27 $ 31 $ 36 Number of Retirees Added 1 80 98 68 552
(1) Effective February 21, 2016, retiree health benefits are provided to part-time employees who retired with 10 years of service but less than 10 years of service credit. Previously, they were allowed to enroll in LACERS Health Care Plan at their own cost, but not eligible for health benefits.
(2) Large increase is primarily due to accelerated retirements stimulated by the City’s Early Retirement Incentive Program (ERIP).