Embed Size (px)
Citation preview
2018–2022CORPORATE PLAN SUMMARY
OPERATING BUDGET • CAPITAL BUDGET


iiiEDC | 2018-2022 Corporate Plan Summary
TABLE OF CONTENTS
Executive Summary iv
2016 Corporate Highlights 6
Chapter 1: Planning Environment 7
1.1 Global Economic Outlook 7
1.2 The Canadian Outlook 9
1.3 Challenges and Opportunities for Canadian Companies 10
1.4 The Canadian Trade Landscape 12
1.5 Summary 14
Chapter 2: Business Strategy 16
2.1 Overview 16
2.2 Contributing to Canada’s Progressive Trade and Investment Agenda 17
2.3 Modernizing EDC’s Digital Platform 18
2.4 Strategy and Objectives 19
2.5 EDC’s 2018-2022 Objectives 20
Objective 1: Build greater awareness among canadian companies of EDC’s solutions to help them go international. 20
Objective 2: To anticipate the needs of canadian companies with a range of financial solutions that will launch – and then accelerate – their international growth. 24
Objective 3: Expand opportunities for Canadian companies to succeed internationally by promoting and facilitating trade diversification. 32
2.6 Corporate Social Responsibility 40
2.7 How We Deliver on Our Objectives 43
2.8 Measuring Success: Scorecard 47
Chapter 3: EDC’s Financial Plan 50
3.1 Key Business Assumptions 51
3.2 Administrative Expenses and Productivity Ratio 53
3.3 Capital Expenditures 55
3.4 Financial Results 56
3.5 Capital Management 62
3.6 Statutory Limits 65
3.7 Asset/Liability Management and Borrowing Strategies 66
3.8 Operation of Subsidiaries 72
3.9 Consolidated Financial Results 73
Appendix I: Export Development Canada Corporate Overview 78
Appendix II: Overview of EDC’s Financing and Insurance Solutions 83
Annex I: Development Finance Institute Canada (DFIC) Inc. Corporate Plan 2018-2022 86
iv 2018-2022 Corporate Plan Summary | EDC
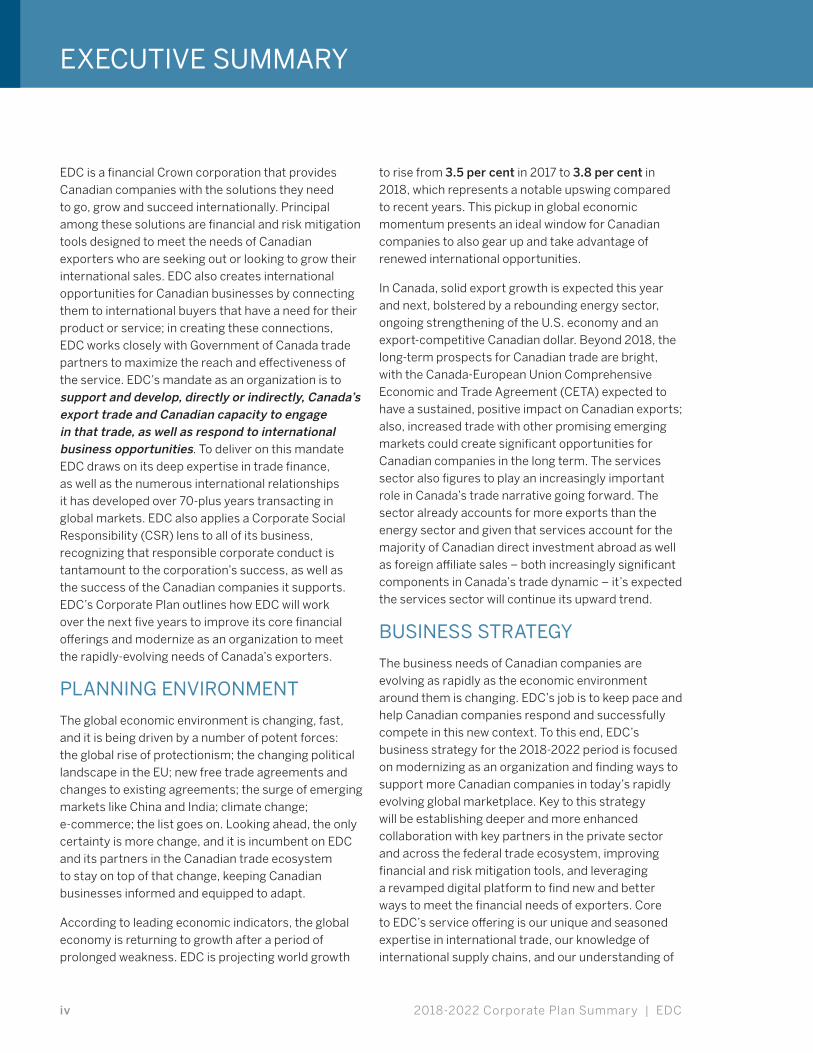
EDC is a financial Crown corporation that provides Canadian companies with the solutions they need to go, grow and succeed internationally. Principal among these solutions are financial and risk mitigation tools designed to meet the needs of Canadian exporters who are seeking out or looking to grow their international sales. EDC also creates international opportunities for Canadian businesses by connecting them to international buyers that have a need for their product or service; in creating these connections, EDC works closely with Government of Canada trade partners to maximize the reach and effectiveness of the service. EDC’s mandate as an organization is to support and develop, directly or indirectly, Canada’s export trade and Canadian capacity to engage in that trade, as well as respond to international business opportunities. To deliver on this mandate EDC draws on its deep expertise in trade finance, as well as the numerous international relationships it has developed over 70-plus years transacting in global markets. EDC also applies a Corporate Social Responsibility (CSR) lens to all of its business, recognizing that responsible corporate conduct is tantamount to the corporation’s success, as well as the success of the Canadian companies it supports. EDC’s Corporate Plan outlines how EDC will work over the next five years to improve its core financial offerings and modernize as an organization to meet the rapidly-evolving needs of Canada’s exporters.
PLANNING ENVIRONMENT
The global economic environment is changing, fast, and it is being driven by a number of potent forces: the global rise of protectionism; the changing political landscape in the EU; new free trade agreements and changes to existing agreements; the surge of emerging markets like China and India; climate change; e-commerce; the list goes on. Looking ahead, the only certainty is more change, and it is incumbent on EDC and its partners in the Canadian trade ecosystem to stay on top of that change, keeping Canadian businesses informed and equipped to adapt.
According to leading economic indicators, the global economy is returning to growth after a period of prolonged weakness. EDC is projecting world growth
to rise from 3.5 per cent in 2017 to 3.8 per cent in 2018, which represents a notable upswing compared to recent years. This pickup in global economic momentum presents an ideal window for Canadian companies to also gear up and take advantage of renewed international opportunities.
In Canada, solid export growth is expected this year and next, bolstered by a rebounding energy sector, ongoing strengthening of the U.S. economy and an export-competitive Canadian dollar. Beyond 2018, the long-term prospects for Canadian trade are bright, with the Canada-European Union Comprehensive Economic and Trade Agreement (CETA) expected to have a sustained, positive impact on Canadian exports; also, increased trade with other promising emerging markets could create significant opportunities for Canadian companies in the long term. The services sector also figures to play an increasingly important role in Canada’s trade narrative going forward. The sector already accounts for more exports than the energy sector and given that services account for the majority of Canadian direct investment abroad as well as foreign affiliate sales – both increasingly significant components in Canada’s trade dynamic – it’s expected the services sector will continue its upward trend.
BUSINESS STRATEGY
The business needs of Canadian companies are evolving as rapidly as the economic environment around them is changing. EDC’s job is to keep pace and help Canadian companies respond and successfully compete in this new context. To this end, EDC’s business strategy for the 2018-2022 period is focused on modernizing as an organization and finding ways to support more Canadian companies in today’s rapidly evolving global marketplace. Key to this strategy will be establishing deeper and more enhanced collaboration with key partners in the private sector and across the federal trade ecosystem, improving financial and risk mitigation tools, and leveraging a revamped digital platform to find new and better ways to meet the financial needs of exporters. Core to EDC’s service offering is our unique and seasoned expertise in international trade, our knowledge of international supply chains, and our understanding of
EXECUTIVE SUMMARY

EDC | 2018-2022 Corporate Plan Summary v
Canadian capabilities. While we will leverage and build on this experience, we will also be innovative in looking for new and creative ways to help more Canadian companies win business internationally. In doing so, EDC will have a greater impact on Canadian economic growth and employment, while also contributing to the Government of Canada’s stated objective to grow Canadian trade by 30 per cent by 2025.
Over the planning period EDC will focus its efforts around three key objectives that will underpin its corporate strategy:
1. Build greater awareness among Canadian companies of EDC’s solutions to help them go international.
2. Anticipate the needs of Canadian companies with a range of financial solutions that will launch – and then accelerate – their international growth.
3. Expand opportunities for Canadian companies to succeed internationally by promoting and facilitating trade diversification.
EDC serves companies of all sizes, in various sectors and markets around the world. We aim to support the growth of small and medium-sized enterprises (SMEs) into the global business leaders of tomorrow. We also look to support companies in the innovative sectors that are laying the groundwork for Canada’s future trade success, most notably clean technology. We do this in part through our network of representatives in Canada and abroad and through our partners, most notably the Trade Commissioner Service.
To establish a strong internal foundation from which the organization can deliver on its strategic goals, EDC employs rigorous risk management, operational management, and sustainability practices that align with the very best practices of the private sector. Beyond these systems, EDC is continuously searching for ways to free up capacity and improve efficiency so that the corporation might be more productive and deliver more value to Canadian companies.
THE FINANCIAL PLAN
Our ability to deploy lending and insurance solutions to Canadian exporters is dependent on our commitment to sound financial management. The 2018-2022 Financial Plan outlines how EDC is managing its administrative and operating expenses. The Financial Plan also provides details on our key business assumptions, which underlay our projected financial performance. Chapter 3 includes Statements of Comprehensive Income, Statements of Financial Position, Statement of Changes in Equity, Statement of Cash Flows and planned capital expenditures for 2018-2022.
6 2018-2022 Corporate Plan Summary | EDC
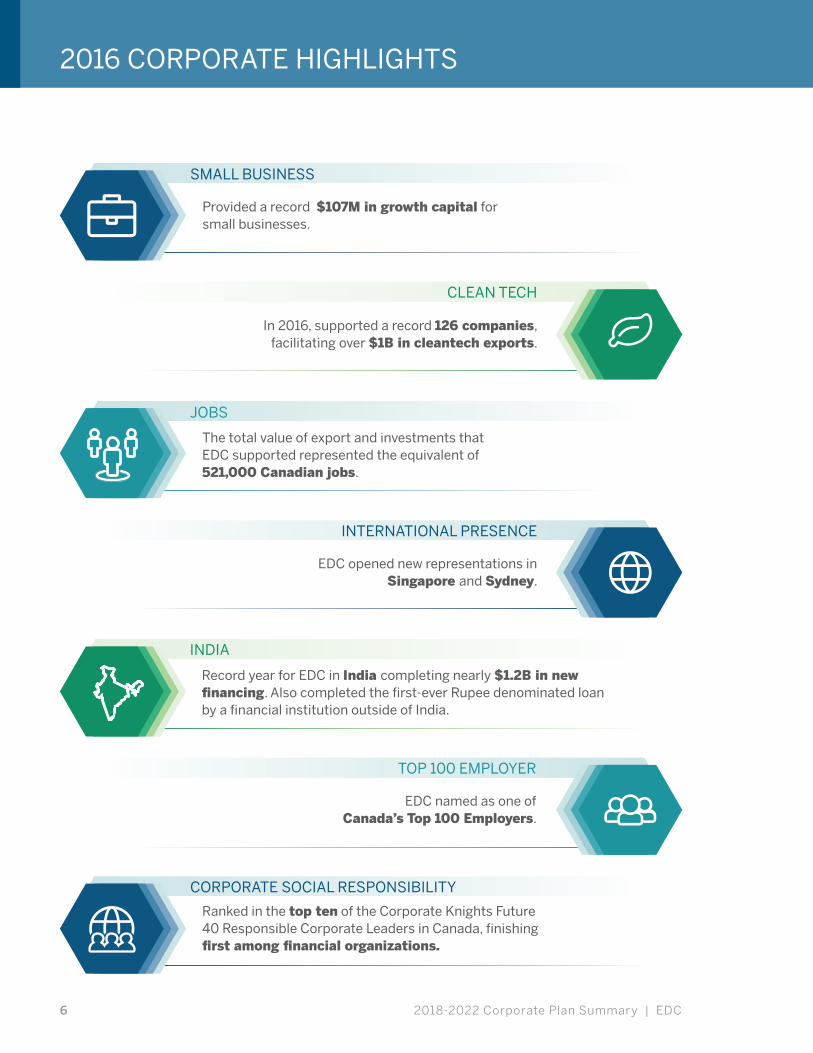
2016 CORPORATE HIGHLIGHTS
Provided a record $107M in growth capital forsmall businesses.
Record year for EDC in India completing nearly $1.2B in newfinancing. Also completed the first-ever Rupee denominated loanby a financial institution outside of India.
EDC opened new representations inSingapore and Sydney.
EDC named as one ofCanada’s Top 100 Employers.
Ranked in the top ten of the Corporate Knights Future40 Responsible Corporate Leaders in Canada, finishingfirst among financial organizations.
The total value of export and investments thatEDC supported represented the equivalent of521,000 Canadian jobs.
SMALL BUSINESS
CORPORATE SOCIAL RESPONSIBILITY
INDIA
INTERNATIONAL PRESENCE
TOP 100 EMPLOYER
JOBS
In 2016, supported a record 126 companies,facilitating over $1B in cleantech exports.
CLEAN TECH
7EDC | 2018-2022 Corporate Plan Summary
CHAPTER 1: PLANNING ENVIRONMENT
1.1 GLOBAL ECONOMIC OUTLOOK
‘Globalization on the Brink?’ is the title of EDC’s export forecast for 2017-2018 and it speaks to the number one risk facing the global economy today – negative sentiment about globalization and the corresponding rise of protectionism around the world. At its crux is frustration among people who are discontent with the slow pace of economic recovery in recent years. This sentiment has bubbled up into the political realm, and become a real threat to a world system that touches every country, every firm, and virtually every individual.
The economic data, however, tell a very different story. The numbers portray a global economy that is on the rise, one that is actually serving up what many lament as missing: growth, jobs, and a green light for continued expansion. Take away the sentiment and what remains is perhaps one of the greatest moments of economic opportunity in the new millennium. The question is whether globalization has the resilience and momentum to carry through this period of uncertainty.
EDC believes it does, largely because globalization has been such a force for good – lifting millions out of poverty, helping wealthy nations like Canada create quality jobs and achieve some of the lowest unemployment levels on recent record, and lowering prices for consumers the world over. Beyond this, the leading economic indicators and key statistics point to a world economy that is gearing up, leaving behind the weakness that served to frustrate so many people following the recession. With this pickup in momentum, the time is now for Canadian companies to also gear up and take advantage of renewed global opportunities.
EDC is projecting world growth to rise from 3.5 per cent in 2017 to 3.8 per cent in 2018 – a notable upswing in momentum given that growth has hovered around 3.5 per cent over the last five years.
Canada’s closest trading partner, the United States, is expected to see economic growth of 2.7 per cent in 2018. After a particularly long 7-year wait in the U.S., key demographic groups sidelined by sluggish economic growth – both older workers and millennials – are now rejoining the job market. Industrial capacity is tightening up again and several industries are bursting at the seams. Across the pond, the Euro Area economy is showing momentum of its own. Headline GDP growth is forecast at 1.7 per cent for 2018 and is expected to maintain a relatively healthy pace propelled by promising economic indicators. Private consumption is expected to be supported by broad based improvement in labour market performance, while bouts of policy uncertainty are expected to have a marginal impact on the continuing recovery in business investment.
Meanwhile to the east, China’s built-in momentum from fiscal policy, infrastructure, and real estate activity in recent years will continue to buoy the country’s macroeconomic growth in 2018 to 6.4 per cent. Exports, especially driven by resurgent U.S. and EU demand, will also contribute. The country’s extensive ‘One Belt One Road’ initiative – which aims to build China’s future trading capacity through massive new infrastructure – also presents considerable economic upside for the fast-growing market.
EDC is projecting world growth to rise from 3.5 per cent in 2017 to 3.8 per cent in 2018 – a notable upswing in momentum given that growth has hovered around 3.5 per cent over the last five years.
2018-2022 Corporate Plan Summary | EDC8
India is forecast to grow by 7.6 per cent in 2018. While demonetization is expected to have some impact in the short term, growth has performed better than expected on the back of increased government expenditure and record levels of foreign direct investment. Nonetheless, India’s outlook continues to be one of the brightest.
In Japan, the economic momentum that built up in 2017, in particular with exports, will drive 2018 growth to reach 1.1 per cent. The uptick in U.S., EU and Chinese demand as well as a weaker Yen will remain critical drivers of Japan’s exports. Investment activity going forward will continue to be supported by private real estate and capital expenditure, as well as public infrastructure.
Beyond 2018 the long-term global economic outlook will be affected largely by two factors – changing demographics and rapidly-evolving technology. Because it is so difficult to anticipate future technologies and what their impact might be on economic growth and jobs, long-term economic forecasting focusses mainly on demographics. In much of the developed world the aging of the primary workforce, made up of “baby boomers,” is expected
to lower the ceiling for economic growth. This will be especially true in countries where immigration is limited. In North America, where there is a higher birth rate and strong immigration flows, the long-term outlooks are stronger. While most emerging markets will see their longer term economic growth increase due to rapidly expanding populations, China will remain the exception. China’s limited population growth will be more than offset by surging growth of its middle class – a phenomenon that will increase wealth and generate demand across the emerging world for years to come.
China’s limited population growth will be more than offset by surging growth of its middle class – a phenomenon that will increase wealth and generate demand across the emerging world for years to come.
EDC | 2018-2022 Corporate Plan Summary 9
1.2 THE CANADIAN OUTLOOK
In Canada, higher commodity prices will fuel a 6 per cent increase in the country’s overall export performance for 2017. In addition to a recovery in prices, new and accelerating global growth will further boost Canada’s exports by 5 per cent in 2018. These are noteworthy increases over 2016 when exports stalled, due in large part to a sharp decline in the energy sector. Now, an expected 18 per cent increase in energy exports in 2017 will lead Canada’s export rebound. Growth in energy exports will continue in 2018 with an additional 7 per cent rise.
Ongoing strengthening of the U.S. economy and an export-competitive Canadian dollar serve as the main pillars of Canada’s export growth story. Other bright spots in the Canadian outlook include an 11 per cent increase in ores and metals exports, as well as notable increases in machinery and equipment, chemicals and plastics, forestry, and aerospace exports. Services, increasingly a key driver in the Canadian export story, will post back-to-back 5 per cent growth over the next two years.
The Loonie is likely to soften slightly in 2018 as commodity prices fluctuate, but will maintain its hold as the U.S. Federal Reserve accelerates its tightening cycle, and as the Bank of Canada initiates its own. These tightening cycles will differ however, given that the fundamentals of demand in the U.S. and Canada are different. In the U.S. there is ample evidence of pent up demand in key parts of the economy
whereas in Canada, there is equally ample evidence of excess in areas like the consumer and housing markets. Consequently, it’s expected that short-term interest rates in the two countries will grow apart in the near term, with rates rising more aggressively in the U.S. This, together with continued moderation of commodity prices, will keep the Canadian dollar in the range of 75-83 cents U.S. over the planning period. For this reason Canadian exporters can count on a period of currency stability, at or close to current levels. This is expected to continue boosting Canadian export growth in the medium-term.
One key risk facing the Canadian outlook is the shortage of skilled labour across a number of industries. It’s expected that given Canada’s aging workforce, this will soon become a more generalized labour shortage that could prove an inhibitor to economic growth going forward.
Overall, the long-term outlook for the Canadian economy remains strong. It is expected to continue its evolution from an economy focused heavily on commodity exports to one that relies increasingly on service exports – a surging sector that will be discussed in more detail later in the chapter. The Canada-European Union Comprehensive Economic and Trade Agreement (CETA) – which is also explored at length later in the plan – is also expected to have a positive impact on Canada’s long-term outlook.
2018-2022 Corporate Plan Summary | EDC10
1.3 CHALLENGES AND OPPORTUNITIES FOR CANADIAN COMPANIES
MAIN CHALLENGES
Global protectionism – The recent rise in global anti-trade sentiment presents an obvious challenge to Canadian companies looking to do business abroad. This trend could lead to policies and actions that would impede and increase the cost of global trade flows. It also presents a degree of uncertainty in Canada’s relationships with its global trading partners. In this context it will be imperative that exporters stay informed and up to date on new developments. In this, as addressed later, EDC will have an important role to play.
Trade Diversification – More than three-quarters of Canada’s exports are destined for the U.S. which means that Canadian companies are highly dependent on one market for revenue. While currently this is a strong position to be in, given the signs of solid and sustainable growth in the U.S. economy, there are proven advantages to diversifying into new markets (these are discussed more in Chapter 2). Exporters can be reluctant to do this, however, given the perceived challenges of expanding from a familiar and friendly market into lesser-known markets. This can ultimately cause companies to miss out on opportunities for growth.
Reluctance to export – With Canada’s economy being so heavily dependent on trade, more Canadian companies need to be engaged internationally. But the prospect of doing business abroad can be daunting, particularly for micro and small-sized enterprises. It requires them to dedicate considerable time and resources, which are generally in short supply for smaller companies. While medium-sized companies are more apt to start exporting than their smaller counterparts, they are often reluctant to diversify outside of the safer international markets. These barriers faced by Canadian SMEs need to be overcome because the advantages of expanding internationally are many, including long-term stability, increased market access, and greater competitiveness.
These barriers faced by Canadian SMEs need to be overcome because the advantages of expanding internationally are many, including long-term stability, increased market access, and greater competitiveness.
EDC | 2018-2022 Corporate Plan Summary 11
KEY OPPORTUNITIES
CDIA – Having a local presence within global markets helps eliminate trade barriers often encountered in exporting, and can increase access to resources that will help accelerate global growth. Setting up a foreign affiliate can enable access to preferential trade agreements specific to that country. Canadian Direct Investment Abroad (CDIA) enables Canadian companies to expand their reach and come in contact with new buyers and opportunities, thereby hedging against risk by engaging in multiple markets.
CETA – The Canada-European Union Comprehensive Economic and Trade Agreement (CETA) will provide Canadian companies with preferential access to more than 500 million people across 28 countries, with a combined GDP of $20 trillion. This single trade agreement could eliminate as many as 9,000 tariffs that Canadian companies currently have to deal with when selling to Europe. It will also help place Canada in a unique position to become a supply chain leader in Europe. Key Canadian exports like agri-food and automotive products stand to gain from the deal.
Emerging Markets – In 2000, Canada shipped just five per cent of its goods to emerging markets. By 2008 it was 12 per cent, an impressive increase over such a short span. The share hit 13 per cent in 2013, and has held steady since. The bulk of this – more than 85 per cent – is destined for three markets – China, Mexico and India – but exports to other markets are also rising. There are also the yet-to-emerge markets, often referred to as frontier markets – countries not yet on the radar but that still offer very competitive entry points for Canadian companies. Examples are Peru, Thailand, and Colombia – countries that have needs in sectors where Canada has expertise such as mining, oil and gas, infrastructure, and clean technology.
Canadian Brand – Wherever a Canadian company chooses to go in the world they carry with them a powerful marketing tool – the Canadian brand. Behind the maple leaf is a reputation for being reliable, responsible, innovative, and producers of quality goods and services. A land of extraordinary natural space and resources, with a population rich in its diversity and generosity, Canada and it’s people have a long history of being both open to and engaging with the world. It is this that has made Canada an ideal international partner to trade with. Today, when so many nations are retreating to protectionism, Canada is heading in the opposite direction, seeking out more trade. This openness acts as a competitive advantage for Canadian companies in today’s global context.
Today, when so many nations are retreating to protectionism, Canada is heading in the opposite direction, seeking out more trade. This openness acts as a competitive advantage for Canadian companies in today’s global context.
2018-2022 Corporate Plan Summary | EDC12
1.4 THE CANADIAN TRADE LANDSCAPE
Since the fur trade laid the foundation for Canada to be established, trade has been deeply woven into this country’s DNA. Rich in resources and entrepreneurial spirit, Canada has always had a lot to offer the world, and Canada’s economy has come to depend on what it gets in return – economic growth, wealth and investment opportunities, and high-quality jobs. Simply put, Canada needs trade. Sixty per cent of our GDP depends on it, and with such a small population of potential customers, Canadian companies need to be connected into overseas markets to achieve real growth.
For EDC to effectively serve these Canadian companies, a deep understanding of the business landscape is essential – the types of companies, what drives them, their challenges, and what they need to overcome barriers to growth. EDC continuously surveys Canadian businesses to learn more about their world. We must also know the context in which they operate, which is why we keep our finger on the pulse of international trade and stay informed about global economic trends. In doing so we help ensure that EDC can be agile, responsive, and relevant to what Canadian companies need to succeed in the fast-changing world of international trade.
Last year’s Corporate Plan introduced EDC’s research on the Exporter Journey and Exporter Needs, two pieces that played an important role in informing EDC’s new strategic direction. In 2017 we added to our foundational research by digging deeper into the makeup of the Canadian exporter population; we also completed a study on the services sector and its considerable impact on Canadian exports and foreign investment, details on which are found in the next section.
EXPORTER POPULATION (THE ADDRESSABLE MARKET)
As trade is changing so too is the definition of an exporter – beyond the simple concept of a company that ships goods across a border. By that traditional definition, Canada would have approximately 40,000 exporters today. But in the modern trade paradigm that definition can be expanded to more completely reflect the variety of ways companies participate in international trade.
EDC conducted research to help us better understand this exporter population, which represents the universe of companies we should be serving. We found that in addition to the 40,000 traditional exporters, we also needed to consider the more than 35,000 Canadian companies that export services, as well as the 6,000 companies that invest abroad, some of which sell goods or services from their foreign affiliates. Then there are the 25,000 or so that export indirectly (companies that sell goods or services to domestic firms which then export on to another country). And finally there are the 34,000 companies that are planning to export or are export-ready, but haven’t taken their first step onto the international stage.
All told, through this modern trade lens the addressable market of exporters and imminent exporters is approximately 140,000 companies. Our newest research has also shown us that of these companies more than 107,000 are ‘micro-sized,’ earning annual revenues under $1M. This is also the segment EDC serves the least, at just over one per cent of the population. Identifying how we might be able to support this population of companies, either directly or through enhanced collaboration with key partners, will be an area of exploration for EDC over the planning period.

EDC | 2018-2022 Corporate Plan Summary 13
EXPORTER POPULATION
77,19033,729
25,333
5,610
DirectReady toExport
CDIA
Indirect
by Type of Exporter
by Company Size
107,421
3,432
15,919
15,089
Micro
Large
Small
Medium
2018-2022 Corporate Plan Summary | EDC14
SURGE OF THE SERVICES SECTOR
Services in Canada account for more exports than the energy sector or the automotive sector, which likely comes as a surprise to many. To better quantify its weight and importance within Canada’s trade landscape, and to better understand the needs of the sector, EDC took a deep dive into services. What we found is a sector that is truly surging and providing a significant boost to Canadian exports and the Canadian economy.
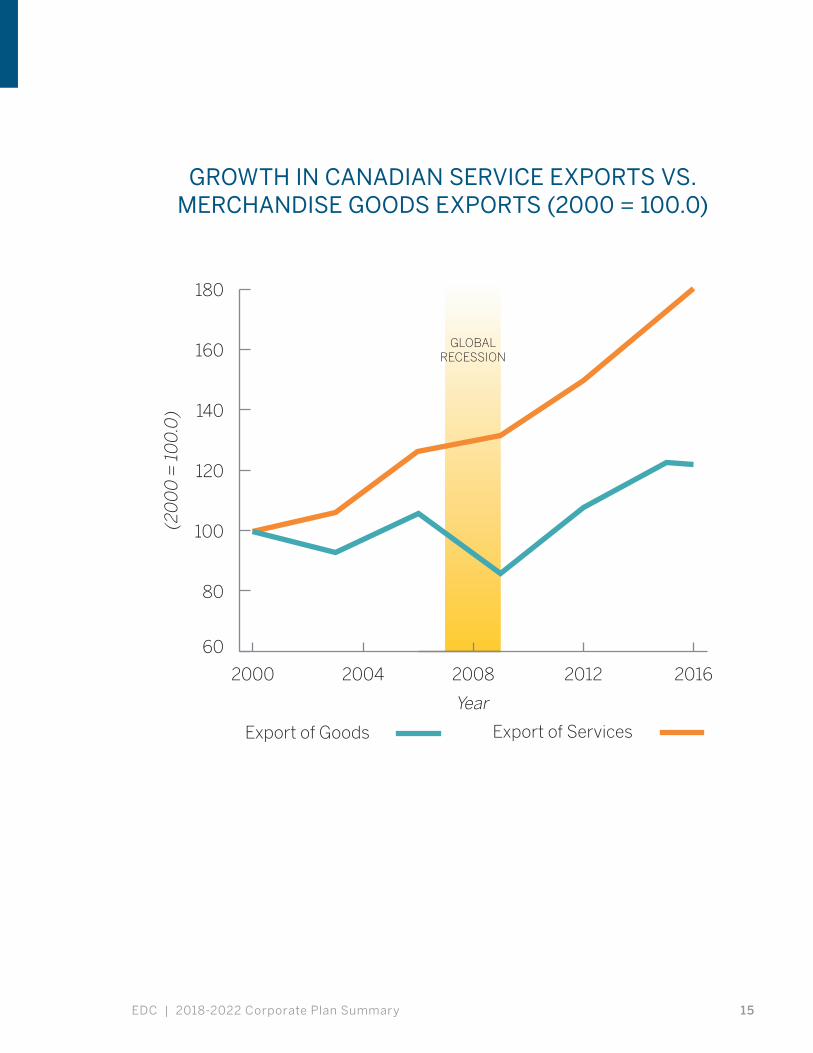
Data shows that from 2005 to 2015, Canadian trade in services grew at an annual average rate of 3.4 per cent compared with 1.8 per cent for goods. Services now account for 17 per cent of Canadian exports and this total is expected to top 20 per cent within the next five years. Given current trends, EDC expects growth in service exports to outpace goods exports over the long term. Technology (e.g. digital, internet, increased broadband, and logistics software) has increased tradability of many service sectors, and Canadian companies are taking advantage of these tools to grow their exports. This trend is only expected to continue as technologies improve further. The services sector has proven to be more resilient to major changes in the international market as well, as was demonstrated during the recession in 2009 when goods exports plummeted by 25 per cent and services exports dipped by only 2 per cent. As a whole, services
represent significant value-added in total exports (33 cents for every dollar of exports), and account for more than 60 per cent of all jobs in the Canadian export supply chain. These also tend to be high-paying jobs, especially in areas such as engineering, financial, information technology and other professional services. The supports offered through a dynamic and modern services sector is critical to the overall competitiveness of Canada’s export sector.
The financial services sector in particular is Canada’s fastest-growing export, driven by a strong foreign appetite for Canadian financial expertise. This growth has enabled Canadian financial institutions – banks, insurance companies and pension funds – to expand their international footprint, providing employment and economic opportunities abroad as well as here in Canada. The financial services sector accounts for about seven per cent of Canada’s gross domestic product (GDP) and approximately 780,000 jobs.
Services play the lead role in the Canadian Direct Investment Abroad (CDIA) and foreign affiliate sales (FAS) story, accounting for 71 per cent and 53 per cent of their totals, respectively. Through these avenues, services help create strong commercial networks and local business contacts in foreign markets where they are established, laying the groundwork for other Canadian exports to those areas. Research shows that exports often follow in the wake of investment flows. For these reasons, services are expected to play a major role in Canada’s export story going forward.
1.5 SUMMARY
The rate of change in global trade has been staggering over the last 12-18 months. Looking ahead, the only certainty is more change, and it is incumbent on EDC and its partners in the Canadian trade ecosystem to stay on top of that change, keeping Canadian businesses informed and equipped to react. Also as we learn more about exporting and how it benefits the companies that participate in it, as well as the economies those companies hail from, the importance of engaging in more trade crystalizes. Companies
today can’t afford to rely only on domestic sales and to measure themselves only against the competitor down the street. Competition is now global in nature, which presents opportunities but also challenges. With their diverse expertise and talent, and a strong Canadian brand internationally, Canadian companies are well positioned to seize opportunities in this global context, and over the planning period EDC’s strategy is to continue to deploy products and services to help companies do just that.
EDC | 2018-2022 Corporate Plan Summary 15
GROWTH IN CANADIAN SERVICE EXPORTS VS. MERCHANDISE GOODS EXPORTS (2000 = 100.0)
GLOBALRECESSION
Year
Export of Goods Export of Services
(20
00
= 1
00
.0)
60
80
100
120
140
160
180
20162012200820042000
16 2018-2022 Corporate Plan Summary | EDC
CHAPTER 2: BUSINESS STRATEGY
2.1 OVERVIEW
Export Development Canada is a leader in helping Canadian companies go, grow and succeed internationally. Whether a company is planning to export for the first time, or is an experienced exporter looking to expand their international footprint, EDC is there for them.
For the last 70-plus years EDC has fulfilled its core mandate to grow Canadian trade, and that success has been driven largely by three factors – our expertise as a global financier transacting in up to 200 markets annually, our ability to manage risk, and our willingness to adapt to change.
By helping more Canadian companies win business internationally, EDC will have a greater impact on Canadian economic growth and employment, while also contributing to the Government of Canada’s stated objective to grow Canadian trade by 30 per cent by 2025.
But our adaptability to the changing global context has never been more tested than today. Trade has evolved and, along with it, the opportunities and challenges facing Canadian companies engaged in trade. Recognizing this, EDC determined that the organization must modernize and find ways to become more relevant to Canadian companies engaged in or exploring the possibilities of export.
Guiding EDC is the aspiration to significantly increase the number of Canadian companies it serves over the planning period. We will achieve this growth by establishing deeper and more enhanced collaboration with key partners in the private sector and across the federal trade ecosystem, improving our financial and risk mitigation tools, and leveraging a revamped digital platform to find new and better ways to meet the financial needs of exporters. We will also cast a broader net with our products, with the goal of serving companies across the full spectrum of exporters – from micro-sized to large and across the country’s many industry sectors.
We understand that gearing up to help more companies will require EDC to modernize its services and innovate. Rather than waiting for companies to come to us for export support after they’ve advanced far enough in their corporate lifecycles, EDC will need to be more proactive and engage companies sooner. We will need to increase our ability to help SMEs with smaller transactions, which will draw more on the corporation’s resources and require new and different kinds of partnerships. We will need to better leverage our digital platform and collaborate more closely with the Trade Commissioner Service (TCS), others in the trade ecosystem and across the broader Government portfolio. We will also need to enhance our collaboration with private sector partners to reach more companies with the services that suit them best. Through this process of change EDC must remain absolutely committed to financial sustainability. It is this sustainability that has made EDC the stable financier it is today, and it will remain critical to EDC’s success going forward. The Corporation’s plans to maintain this financial sustainability over the planning period are reflected in more detail in the Financial Plan contained in Chapter 3.
In short, for EDC to better serve Canadian companies over the planning period – ranging from a lobster fishery in Halifax to an apparel factory in Quebec City and video game developer in Vancouver – it will need to improve on its current financial and risk mitigation offerings and experiment with new solutions to meet the needs of today’s exporter. To do so, EDC will work more closely with partners across the trade ecosystem that share the goal of increasing Canadian trade, starting first with the TCS.
EDC | 2018-2022 Corporate Plan Summary 17
2.2 CONTRIBUTING TO CANADA’S PROGRESSIVE TRADE AND INVESTMENT AGENDA
The Government of Canada has been clear in its support of globalization and free trade at a time when other countries seem to be heading in the opposite direction. This sends a message to the international marketplace that Canada is open for business. The Government’s progressive trade and investment agenda sets the foundation for how the Government of Canada, along with EDC and other partners in the Canadian trade portfolio, will bring more Canada to the world, and more of the world to Canada. EDC will continue to collaborate with the Government on this agenda and play an important role in achieving its goals.
Central to this agenda are the Government of Canada’s trade priorities, which have been identified as: contributing to Canada’s economic growth and efforts to strengthen the middle class; supporting small- to medium-sized enterprises; advancing the inclusive trade agenda; promoting clean technology; contributing to progress on environmental and climate change targets; promoting diversification, including free trade agreement promotion, and attracting investment. EDC understands the importance of these priorities and over the planning period will focus on certain parts of the agenda where it can exercise the most impact; for example, enabling more cleantech companies to succeed internationally and supporting a greater number of SMEs. EDC will also look to expand trade opportunities with large, fast-growing markets like China and India.
We will work alongside our trade portfolio partners the Trade Commissioner Service (TCS) and the Canadian Commercial Corporation (CCC); in addition, we will work in collaboration with other Government partners like the Business Development Bank of Canada (BDC), Innovation, Science and Economic Development Canada (ISED), Sustainable Development Technology Canada (SDTC), and the National Research Council (NRC) to better promote Canada’s brand and diverse range of companies around the world.
EDC is also aligned to Canada’s focus on inclusive trade. Our solutions are available to all Canadian companies and investors, including those in under-represented groups such as Indigenous-owned and women-owned businesses. EDC collaborates on events organized by the TCS’s Business Women in International Trade (BWIT) program, which provides targeted products and services to help women entrepreneurs go international. Over the planning period EDC will explore new opportunities to support BWIT in its goal to support women-owned businesses in trade. We also support events with the Organization for Women in Trade (OWIT) and facilitate training for women in international business through the Forum for International Trade Training (FITT). In addition, EDC works alongside Women Business Enterprises (WBE), sponsoring and speaking at their events as well as partnering with them on business matchmaking opportunities. For the last two years EDC has collaborated with a number of other government departments and like-minded organizations on the
Women’s Entrepreneurship Conference, participating in panel discussions at those events. Over the planning period we will continue to explore new opportunities to support under-represented groups in trade.

2018-2022 Corporate Plan Summary | EDC18
2.3 MODERNIZING EDC’S DIGITAL PLATFORM
Over the planning period EDC will invest heavily in its digital platform to ensure it can continue to serve the changing needs of Canadian companies and fulfill its mandate of growing Canadian trade in a global marketplace that is becoming increasingly shaped by digital technology. In this context it is incumbent on EDC to be more agile, responsive and capable of delivering solutions to customers in new and innovative ways. We view the investment in EDC’s digital platform as a necessary cost of doing business, given that business is becoming increasingly facilitated by digital and mobile means. Simply put, digitally accessible services are now the expectation of Canadian companies, and it is critical to EDC’s long-term sustainability to be able to deliver them. A modern and technologically advanced digital platform will also provide EDC with an effective means to share with Canadian companies the deep knowledge it has gained through its core business.
Investing in our digital platform is consistent with ongoing projects EDC is undertaking in other parts of the organization to modernize its risk and credit offerings to better meet companies’ changing needs and to remain relevant in the market. Central to EDC’s digital transformation is a new mobile-friendly website that will prioritize the user experience, and tailor content to match the visitor’s interests and needs. With smart phones and social media representing the primary locations where business owners access their information, EDC’s digital transformation is about increasing awareness of EDC’s solutions in the places that Canadian companies frequent most. We see this activity as critical to EDC’s ability to serve more companies with its financial and risk mitigation solutions. Throughout the plan are additional examples of how EDC is leveraging digital tools to better meet the needs of Canadian exporters.
With smart phones and social media representing the primary locations where business owners access their information, EDC’s digital transformation is about increasing awareness of EDC’s solutions in the places that Canadian companies frequent most.
EDC | 2018-2022 Corporate Plan Summary 19
2.4 STRATEGY AND OBJECTIVES
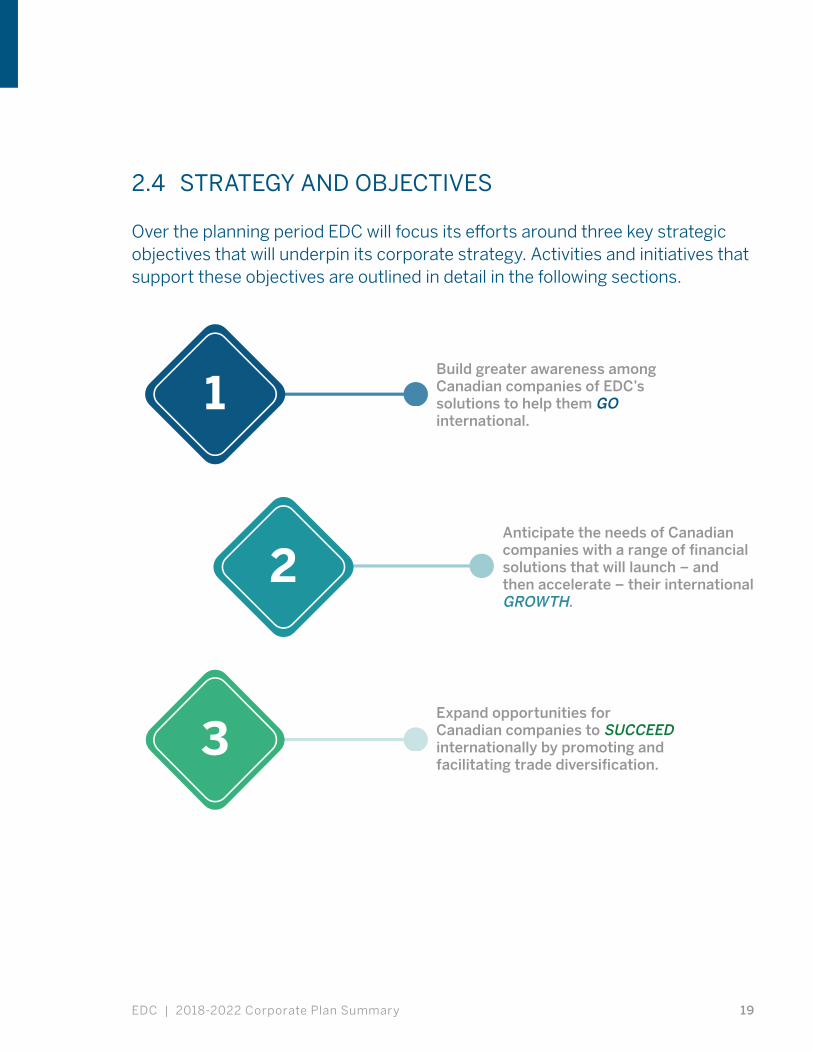
Over the planning period EDC will focus its efforts around three key strategic objectives that will underpin its corporate strategy. Activities and initiatives that support these objectives are outlined in detail in the following sections.
Build greater awareness among Canadian companies of EDC’s solutions to help them GO international.
1
2
3
Anticipate the needs of Canadian companies with a range of financial solutions that will launch – and then accelerate – their international GROWTH.
Expand opportunities for Canadian companies to SUCCEED internationally by promoting and facilitating trade diversification.
2018-2022 Corporate Plan Summary | EDC20
2.5 EDC’S 2018-2022 OBJECTIVES
OBJECTIVE 1: BUILD GREATER AWARENESS AMONG CANADIAN COMPANIES OF EDC’S SOLUTIONS TO HELP THEM GO INTERNATIONAL.
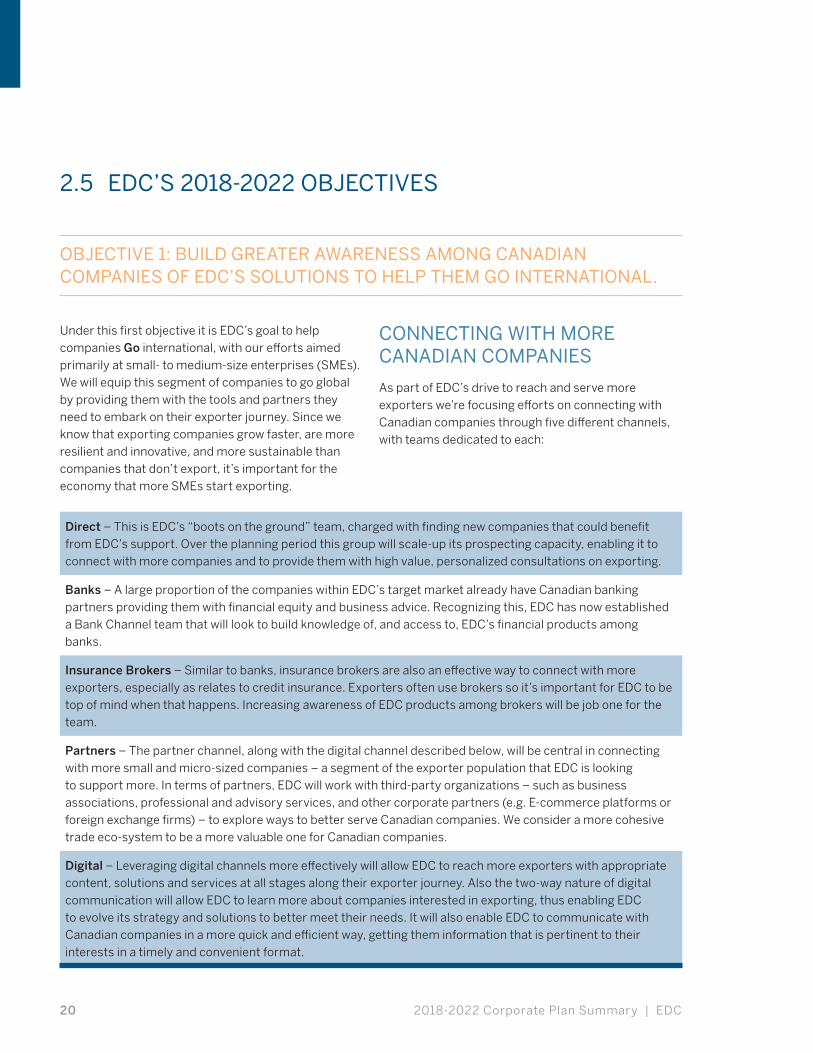
Under this first objective it is EDC’s goal to help companies Go international, with our efforts aimed primarily at small- to medium-size enterprises (SMEs). We will equip this segment of companies to go global by providing them with the tools and partners they need to embark on their exporter journey. Since we know that exporting companies grow faster, are more resilient and innovative, and more sustainable than companies that don’t export, it’s important for the economy that more SMEs start exporting.
CONNECTING WITH MORE CANADIAN COMPANIES
As part of EDC’s drive to reach and serve more exporters we’re focusing efforts on connecting with Canadian companies through five different channels, with teams dedicated to each:
Direct – This is EDC’s “boots on the ground” team, charged with finding new companies that could benefit from EDC’s support. Over the planning period this group will scale-up its prospecting capacity, enabling it to connect with more companies and to provide them with high value, personalized consultations on exporting.
Banks – A large proportion of the companies within EDC’s target market already have Canadian banking partners providing them with financial equity and business advice. Recognizing this, EDC has now established a Bank Channel team that will look to build knowledge of, and access to, EDC’s financial products among banks.
Insurance Brokers – Similar to banks, insurance brokers are also an effective way to connect with more exporters, especially as relates to credit insurance. Exporters often use brokers so it’s important for EDC to be top of mind when that happens. Increasing awareness of EDC products among brokers will be job one for the team.
Partners – The partner channel, along with the digital channel described below, will be central in connecting with more small and micro-sized companies – a segment of the exporter population that EDC is looking to support more. In terms of partners, EDC will work with third-party organizations – such as business associations, professional and advisory services, and other corporate partners (e.g. E-commerce platforms or foreign exchange firms) – to explore ways to better serve Canadian companies. We consider a more cohesive trade eco-system to be a more valuable one for Canadian companies.
Digital – Leveraging digital channels more effectively will allow EDC to reach more exporters with appropriate content, solutions and services at all stages along their exporter journey. Also the two-way nature of digital communication will allow EDC to learn more about companies interested in exporting, thus enabling EDC to evolve its strategy and solutions to better meet their needs. It will also enable EDC to communicate with Canadian companies in a more quick and efficient way, getting them information that is pertinent to their interests in a timely and convenient format.

EDC | 2018-2022 Corporate Plan Summary 21
WORKING WITH PARTNERS IN TRADE
Ensuring alignment and complementarity of services across government agencies is a key priority for the Government and EDC remains committed to partnership and collaboration over the planning period. By adopting this kind of “Team Canada” mentality and working with other like-minded agencies, we will broaden awareness of the array of services available to Canadian companies.
In collaborating with partners, EDC will focus on where it can truly leverage its unique financial, risk management and transactional expertise and add the most value. Over the last 70-plus years we have developed a deep understanding of international finance, the needs of foreign buyers, and the areas of opportunity for Canadian companies within global supply chains. We will look to share this experience and expertise with our partners to contribute to Canada’s progressive trade agenda.
CANADA’S TRADE PORTFOLIO
Both EDC and the Canadian Commercial Corporation (CCC) are Crown Corporations that report to the Minister of International Trade. Together with the Trade Commissioner Service (TCS), these three organizations make up Canada’s trade portfolio. EDC works closely with the TCS and CCC to promote each other’s services when appropriate, and collaborate seamlessly when working to serve Canadian companies.
In 2017, EDC extended the existing Memorandum of Understanding (MoU) with the TCS allowing for continued collaboration and coordination of joint services. The MoU lays out the two organization’s areas of expertise within the trade portfolio to ensure there is no duplication of services, and also to identify where the best opportunities are to work together. With the government of Canada setting the ambitious target of increasing trade by 30 per cent by 2025,
EDC’s relationship with the TCS has never been more important. Today, we regularly partner with the TCS to provide better service to Canadian exporters, share market intelligence and sponsor events that generate awareness of the benefits and opportunities for international trade. An example of this collaboration is our joint involvement in domestic and international signature trade events such as the annual Prospectors & Developers Association of Canada (PDAC) Convention and the Global Petroleum Show.
Going forward, as EDC takes steps to innovate and modernize its operations over the next five years, there will be more opportunities than ever to collaborate with the TCS. For example, it is anticipated that EDC’s revamped digital platform will play a major role in generating more referrals to the TCS; as we leverage our digital tools to learn more about companies interested in trade and what their specific needs are, we will be able to direct these companies to the services that suit them best, which will oftentimes include those offered by other government partners. Also, EDC’s digital platform will create opportunities to team up with the TCS, as well as other trade partners, to pilot new services and tools for Canadian exporters. Looking ahead there will be opportunities to partner on more initiatives like the TCS’s CanExport Program. Currently, EDC is working with the TCS to develop an integrated system of support for CanExport’s successful applicants, which will be built on information sharing between the two organizations. EDC’s commitment to exploring and developing these opportunities with the TCS will be reinforced through the renewal of the MOU between the two organizations in early 2018. Further examples of EDC’s partnership with the TCS are referenced throughout the remainder of the Plan.
We also continue to partner with our sister crown corporation the CCC to ensure we are complementing each other’s services and delivering the most value possible to Canadian companies. In 2017, for example, we started to pilot joint meetings to discuss potential transactions to partner on – or refer to each other – in order to maximize support for Canadian companies.
2018-2022 Corporate Plan Summary | EDC22
OTHER PARTNERS
EDC also collaborates with a number of government partners outside of the trade portfolio, key among these being Innovation, Science and Economic Development Canada (ISED), with which EDC partners on the Accelerated Growth Service (AGS) program, as well as cleantech initiatives (more details on those programs later in this chapter). We work especially closely with ISED’s partner Crown Corporation, the Business Development Bank of Canada (BDC).
Together, BDC and EDC are delivering complementary support to position Canadian firms for success. BDC assists entrepreneurs in bringing their innovative products and services to market and helps them strengthen their business domestically so that they can sustain further growth. When these SMEs set their sights on expanding internationally and begin their voyage along the exporter journey, they can come to EDC for support in establishing or growing their global footprint. Our existing protocol with BDC ensures that companies have access to the services and financial capacity that best suit their needs. The two Crowns have an agreement to not duplicate services, and have a referral program in place to ensure that companies deal with the right organization for their needs. In 2016 that resulted in more than 400 referrals between the organizations, almost 100 more than in 2015. In 2017, the EDC-BDC relationship continued to evolve with the introduction of the AGS program, discussed more in detail in the next section, and increased collaboration on support for the cleantech sector. The following joint initiatives were also introduced:
1. The introduction of Canada Tariff Finder, a free online tool developed by BDC, EDC and the TCS that allows Canadian exporters to check the tariffs applicable to a specific good in a foreign market.
2. The development of a one-click global export solution (one stop shop) that will enable SMEs to access a number of services from both organizations bundled into one convenient package, to help them embark on their export journey.
3. Enhanced referral service, where BDC introduces existing or prospective customers to EDC that are export ready, and could benefit from EDC’s trade connections. Likewise EDC would introduce Canadian companies that are not yet ready for the connections program to BDC Advisory Services to help them ramp up.
4. Enhanced support for innovative technology companies that would see EDC and BDC combine to help companies in this segment get access to financing.
Since 2015 EDC has also held a collaborative agreement with Sustainable Development Technology Canada (SDTC) to further develop Canada’s international capabilities in the cleantech sector. The key to this agreement is information sharing in a way that enables SDTC’s portfolio companies, those that have successfully demonstrated the viability of their clean technology, to quickly and efficiently transition to EDC once they’ve ramped up enough to consider exporting.
In 2017 EDC engaged with Farm Credit Canada (FCC) and the Industrial Research Assistance Program (IRAP) to explore more opportunities to work together. Both organizations serve a significant number of Canadian companies in different sectors of the economy – with FCC focused on agri-food and IRAP on technology and innovation – that could benefit from EDC’s export solutions. Together with FCC and IRAP, over the planning period we will search for new and creative ways to support the companies in their respective sectors.
Partnering with these federal agencies (as well as a number of provincial agencies and business associations with aligned mandates) will remain an important part of EDC’s business model over the planning period. Working with organizations like the Canadian Chamber of Commerce, Fédération des chambres de commerce du Québec and Women Business Enterprises supports outreach efforts and allows EDC to reach specific and underrepresented audiences. We leverage these relationships for awareness building and joint marketing activities. Further to this, we will continue to partner with innovation hubs like MaRS Discovery District and
EDC | 2018-2022 Corporate Plan Summary 23
Communitech, allowing increased access to innovative startups and early stage Canadian companies that are helping to make Canadian innovation accessible abroad.
RESPONDING TO THE NEED FOR KNOWLEDGE
EDC’s digital transformation is about using modern technology to better meet the needs of Canadian companies. One aspect of that transformation is the creation of a knowledge platform which can be leveraged to share EDC’s unique financial, risk management and transactional expertise it has accumulated in 73 years serving as Canada’s Export Credit Agency. EDC has a unique value proposition to offer companies based on decades of international financial transactions in over 200 markets with more than 50,000 buyers. We have always shared this expertise with companies in an ad-hoc and informal manner, but now our digital knowledge platform will provide a means to make that information more easily available for companies.
Risk Check is one example of the kind of knowledge resource EDC will be looking to offer – the corporation currently maintains a multitude of data from its financial business that, through this new tool, could be leveraged by companies to proactively measure the risk of new transactions they are looking to undertake. Rather than just insuring those risky transactions, companies could use Risk Check to better understand the risk they are undertaking when choosing which market to enter or which buyer to transact with. Risk Check demonstrates how over the planning period, EDC will look for ways to innovate and harness its existing trade finance knowledge and make it more accessible to Canadian companies.
EDC will complement its own offerings on the digital platform with tools and content from important trade partners such as the TCS, to ensure the best possible mix of information for Canadian companies. The platform will not only serve to make exporting easier for Canadian companies, but also encourage more of them to go global. It will also have an added benefit of serving as a resource for our trade partners in the field.
SUPPORTING FIRST INTERNATIONAL STEPS INTO THE U.S.
EDC’s research on the exporter journey tells us that nearly three-quarters of current exporters chose the U.S. as their first destination market. Yet our focus in the past has been to devote efforts primarily to diversification, given the already significant trading relationship between Canada and the U.S. That approach is now changing, with EDC instead taking the lead from Canadian companies and offering more support in a market that for many is a natural and necessary first step to exporting.
A four-part action plan has been developed with the objective of improving the depth and breadth of EDC’s support for the U.S. market, especially for SMEs and micro-sized exporters. The plan is focused on: providing deep, regionally focused support and advice for Canadian companies; growing the number of banks we work with in the U.S. to include regional banks; increasing opportunities for Canadian companies through connections; and using digital channels to engage, educate and inspire companies to do business there. The action plan takes into consideration the different corridors of the U.S. market as well as the research that EDC has done on the intricacies of the exporter journey.
EDC is working to enhance collaboration with the 18 Canadian Consulates and more than 100 Trade Commissioner resources in the U.S., with the goal of identifying opportunities and connecting Canadian SMEs with potential buyers.
2018-2022 Corporate Plan Summary | EDC24
OBJECTIVE 2: TO ANTICIPATE THE NEEDS OF CANADIAN COMPANIES WITH A RANGE OF FINANCIAL SOLUTIONS THAT WILL LAUNCH – AND THEN ACCELERATE – THEIR INTERNATIONAL GROWTH.
While the first strategic objective was concerned mostly with getting companies to go international, this second objective is focused more on helping companies grow internationally. As Canadian businesses progress along their exporter journey, their needs change. Some companies might need intermittent credit insurance on one-off foreign sales delivered through a quick and easy online solution. Other companies might have more complex needs, and require tailored financial solutions to continue on their growth path.
EDC understands this, and we’re constantly engaged in dialogue with exporters to learn more about what they need to grow, at whatever point they might be along their export journey. Over the planning period EDC will keep its ear to the ground, anticipating and responding to gaps in support and enhancing our financial and risk management services with the goal of sustaining and growing Canadian companies internationally.
REGIONAL PRESENCE
With offices in every province and multiple offices in the Greater-Toronto Area and Montreal, the vast majority of exporters in Canada are within reach of an EDC Account Manager. Our Canadian regional offices are responsible for managing EDC’s customer relationships, staying connected with exporters at a regional level, liaising with local partner organizations, and developing new business opportunities.
EDC now has 20 regional representations spread across Canada. Most recently we opened an office in Charlottetown, PEI to provide more hands-on service to the dynamic and trade-minded companies in that province. Also in 2017 we stationed a permanent EDC representative in Saskatoon, Saskatchewan to better
serve the growing number of companies in that region. Our representative is co-located with our primary industry partner in Saskatchewan, the Saskatchewan Trade and Export Partnership (STEP). By working together with a like-minded regional partner like STEP, we look to complement each other’s services and maximize the support available to Saskatchewan exporters.
SUPPORT FOR HIGH GROWTH SMEs
With SMEs accounting for more than 80 per cent of EDC’s customers, they are deeply woven into the fabric of the organization. Working with federal government partners, we continue to look for ways to enhance and streamline services to this segment and accelerate SME growth to contribute to Canada’s prosperity.
The Accelerated Growth Service (AGS), announced by the Government of Canada in Budget 2016, provides a prime example of a Team Canada approach to achieving this goal. At the heart of the service are the innovative, high-potential firms that are pushing the envelope for Canadian business and creating valuable middle-class jobs in the process. The AGS will provide these firms access to coordinated services that address their needs at critical stages of growth and international expansion. The service facilitates access to programs, financing, consulting, and support for trade and innovation by ensuring that all federal partners are aligned in supporting companies identified as high-impact. These partners include ISED, BDC, EDC, National Research Council and the Industrial Research Assistance Program (NRC/IRAP), the TCS and Regional Development Agencies (RDAs) across Canada.
EDC | 2018-2022 Corporate Plan Summary 25
The AGS is an important component of the Government’s Innovation Agenda and EDC is a key contributing partner in this initiative. Our diverse SME customer base allows us to identify eligible candidates to form part of the program and support its participation targets over the planning period.
In addition to contributing to the AGS, EDC will continue its own mentoring program, the centerpiece of which is our involvement in the Toronto Regional Board of Trade’s Trade Accelerator Program (TAP). Through TAP, EDC has committed to providing mentoring support to approximately 250 companies over a three-year period (the program kicked off in 2016).
INCREASING ONLINE SERVICES FOR OUR CUSTOMERS
Convenience, access and speed are critical in the digital age, especially as it relates to the delivery of financial services. In fact, our customers expect basic online administration and digital solutions that are simple, easy to access and available 24-7.
Recognizing this, EDC has invested significant resources to move our credit insurance products – EDC’s most popular offering geared towards SMEs – online to make it easy for customers to get the coverage they need, when they need it. Starting in 2017, EDC’s core credit insurance customers will benefit from a brand new, self-serve online solution that will allow them to apply for and receive insurance coverage, as well as view and manage their Export Portfolio Credit Insurance policies online. Billing will also be improved as they will access their invoices, statements of account and history of payments, and even pay their bills using pre-authorized debit, all online. In addition to our new digital platform, insurance customers can also now benefit from
a new and improved plain-language policy that’s easier to understand and will make interaction with EDC simpler, faster, and more predictable. At the same time, modernizing our technology and automating our processes will further increase EDC’s operating efficiency; enable us to introduce new, innovative products and insurance partnership models; and eliminate the very real risk of technology obsolescence associated with our legacy insurance systems, ultimately improving our long-term financial sustainability.
A growing number of Canadian exporters are already benefitting from the digital transformation. The first phase of the program, which launched in January 2015, gives customers the ability to obtain selective sales coverage in a matter of minutes using our online-only EDC Select Credit Insurance product (eSCI). EDC’s online self-serve insurance product – the first of its kind in the insurance space – has seen considerable growth, and it’s anticipated that over the planning period this upwards trajectory will continue as we build awareness for the product and explore ways to make it available through selected partners. ESCI is especially valuable for small businesses, particularly those at the very small end of the SME spectrum, that need to insure their sales to foreign buyers to protect themselves against the risk of not being paid.
EDC is also receiving positive reviews for its new Trade Partnership Insurance (TPI) solution, the second online-only product released on the new digital platform in 2015. TPI gives private sector insurers a simpler and more efficient way to secure additional credit capacity for their clients’ export sales. The online platform has made the process of attaining this reinsurance more seamless for private insurers, and as a result the popularity of the product has grown significantly since its launch. This provides another example of how EDC is working with private sector partners to grow Canadian exports.

2018-2022 Corporate Plan Summary | EDC26
IMPROVING ACCESS TO SME FINANCING
The key to reaching more companies and increasing EDC’s relevance among the exporter population will be the ability to do more for Canadian SMEs. Five years ago EDC began investing heavily in new programs and initiatives to help more companies in this segment, and those investments have yielded results. In 2016, EDC helped nearly 6,000 SMEs conduct more than $14B in exports. Significant numbers, yes, but more needs to be done.
As discussed previously, a major challenge that SMEs face in growing their business abroad is getting the financing they need. Fueled by our mandate to grow Canadian trade, EDC has developed solutions that address the needs of SMEs in this situation. We bring capacity to the market, with financing specifically structured to support SMEs’ ability to take advantage of international growth opportunities. While this will often require more oversight, more capital and more risk management for EDC, it can make all the difference for a Canadian SME looking to grow internationally. And that is exactly the kind of difference EDC is mandated to make. This provides a good example of how EDC is investing more in certain high-impact areas of the organization, while remaining dedicated to its core principle of financial sustainability.
The Export Guarantee Program (EGP) is one solution directed mainly at SME customers that can be used in this way. It is a risk-sharing guarantee that EDC provides to the bank of an exporter. In 2017, the EGP program continued to evolve, becoming more streamlined and simpler to use for banks – all with the goal of opening up financing for SME exporters. Also this year, a Canadian Direct Investment Abroad (CDIA) guarantee was added to the program, which EDC will be able to provide to a foreign banking partner in cases where a Canadian company investing abroad is trying to establish an overseas banking relationship.
EDC can also offer direct ‘breakthrough’ financing to SMEs. This is financing that can help a company make two breakthroughs: first into new markets with a major international contract; and second, into new and stronger banking relationships built on exporting success and stronger, earned credit profiles.
INTERNATIONAL GROWTH CAPITAL FOR CANADA’S NEXT EXPORT LEADERS
In 2017 the Government’s Advisory Council on Economic Growth released a report entitled “Unlocking Innovation to Drive Scale and Growth.” In the report it identified a gap in growth capital for more established, high-impact SMEs across various sectors and regions of the economy. These companies have reached a point in their lifecycle where they are too mature to receive funding through Canadian venture funds, which tend to focus more on earlier-stage companies. For this reason these companies can have trouble getting the capital injection they need to bid on new contracts or make acquisitions to propel themselves to that next level.
To help address this gap, in 2017 EDC established the International Growth Capital group which is focused on shaping solutions to meet the needs of exporters with the capabilities and aspirations to scale internationally. EDC will look to provide these companies with growth capital from debt through to equity. In addition to capital, EDC will also leverage its international expertise and relationships to further support their international growth. The program will focus on companies with revenues in the range of $5M - $300M, which have a proven business model and strong leadership. EDC will look to support companies in all export sectors, with a specific focus on cleantech companies.

EDC | 2018-2022 Corporate Plan Summary 27
Ekumenik
Ekumenik is a Winnipeg-based manufacturer of surf and skateboard apparel designed by freedom-seekers, for freedom-seekers. Strict dedication to the excellence of its consciously-produced apparel – hand-made in Indonesia – means that Ekumenik invests heavily in making products it can take pride in sharing with its customers. The brand has been around since 2007 but over the past two years has seen sales almost triple. The freedom to grow the company in a sustainable way and best meet the needs of their customers proved to be a challenge for Ekumenik. With their entire inventory located offshore in Indonesia, when it came time to expand their business further they didn’t have the assets in Canada that were required to secure a loan from a bank. Support from EDC in the form of breakthrough financing provided the working capital needed to work on new products that their customers were ready and waiting for. Today, exports account for ten per cent of Ekumenik’s sales, however a recent distribution agreement signed with an agent based in Germany will open access to one of Europe’s largest online ski and snowboard retailers. Ekumenik now has the capacity to focus on producing more apparel that inspires its wearers to escape confines, chase goals, and create good – just like they have. Want to learn more about this awesome Canadian company? Follow @Ekumenik on Instagram.
Image courtesy of Ekumenik
2018-2022 Corporate Plan Summary | EDC28
SUPPORTING CANADIAN DIRECT INVESTMENT ABROAD (CDIA)
In today’s integrated global economy, having a local presence in foreign markets is a key factor in achieving growth. Not only does it help the companies investing abroad, it also benefits Canada’s domestic economy. In late 2016 EDC released a ground-breaking study that shed light on why Canadian companies should be investing abroad. The study’s findings also challenged commonly held beliefs about Canadian companies and their foreign investments, particularly the myth that investments abroad erode domestic job numbers. Here are the top-five findings in the report:
• Strategic growth—the main driver of foreign affiliate activity is strategic revenue growth and improved access to global markets: reducing production costs is not a prime motivator for Canadian companies when setting up operations abroad.
• Competitiveness—foreign affiliate activity makes Canadian companies stronger: they have better sales, more customers, more profits and increased market share.
• Diversification—foreign affiliates allow Canadian companies to diversify their client base and business model: Canadian companies are increasingly shifting their investments towards emerging markets like China, India, and Brazil at a much greater pace than direct exports.
• Employment—foreign affiliates strengthen Canadian employment and domestic operations: most firms are hiring more at home as a result of their foreign operations.
• Wages—foreign affiliates enhance the ability of Canadian companies to augment compensation for Canada-based employees: as firms hire more at home because of the increased demand that comes from foreign operations, and that hiring is increasingly specialized with higher wages.
Increased and diversified trade is a key objective for the Government of Canada. CDIA is critical to this objective and, as EDC is uniquely positioned in the trade portfolio to facilitate CDIA, it remains a priority for EDC over the planning period. In support of this function EDC offers a wide range of solutions to assist Canadian companies with their foreign investment activities. These include loans to help companies open facilities in new markets or participate in joint ventures, or insurance products to mitigate risks, such as a customer’s refusal to pay a foreign affiliate or a foreign government taking possession of a Canadian company’s overseas equipment or facility.
It speaks to the effectiveness of CDIA as a strategy that today, Canadian companies generate almost as many sales via their foreign affiliates every year as they do directly from their Canadian exporting operations. In 2016, EDC facilitated over 500 CDIA transactions, nearly a 15 per cent increase over 2015.
SUPPORT FOR CANADIAN INDUSTRIES
The capabilities of Canadian companies are deep and spread across a number of sectors. To provide the most value to each, EDC has set up a number of dedicated teams tasked with supporting these sectors with appropriate financial and risk management solutions, and also promoting companies within these sectors around the world. The teams learn about the capabilities of the companies they are serving and search for markets and foreign buyers that could be a good match for those capabilities. EDC’s sector teams often collaborate with the TCS on industry events as well as supply chain matchmaking sessions to pool capabilities and maximize opportunities for Canadian companies within those sectors. The benefits for Canadian companies are enhanced through each partner contributing their core expertise – ensuring maximum value while reducing the possibility of overlap or duplication. Below are some of the primary sectors that EDC supports.

EDC | 2018-2022 Corporate Plan Summary 29
CLEANTECH
The adoption of the Paris Agreement in 2016 marked a critical turning point in the world’s fight against climate change and opened an unprecedented window of opportunity for Canadian companies in the clean technology (cleantech) sector. While an impressive 78 per cent of Canadian cleantech companies are currently exporting, there is potential for Canada to have a much larger share of the global market, which was estimated at USD $1.1T in 2015. With the trajectory of the sector climbing, it’s important to remove any barriers that might be impeding companies from taking advantage of this growth opportunity. In the case of cleantech, the most common challenge companies face is financing, and EDC has been sharpening its focus to address this issue since 2012 when it first developed its corporate cleantech strategy.
Last year EDC achieved a major milestone, partnering with a record 126 companies and facilitating over $1B in cleantech exports. This increase was a result of our longstanding working relationships in the sector and the growing maturity of the industry itself. Today, EDC has a dedicated cleantech team that works closely with federal government departments, agencies and organizations like BDC and SDTC, to provide enhanced support to the sector and make it easier for companies to obtain the financing they need. We also bring our unique ability to connect these companies to our global network. By working alongside partner organizations, we can help the Government of Canada deliver on its commitment to making Canadian cleantech companies world leaders in the development of clean and sustainable technology.
EDC’s cleantech 2.0 strategy officially launched in 2016 to very positive results, and in 2017 EDC began executing on that strategy with all its assets in place. The cleantech team has grown and now has employees across the country dealing directly with cleantech companies, managing initiatives specific to the sector, and supporting market intelligence and customer feedback activities. The team will focus on supporting
cleantech companies in five specific areas where we anticipate bringing the most value to the sector: equity investment, project finance, direct loans, bank guarantees and contract insurance, and bonding.
Alongside EDC’s existing focus on its corporate cleantech priorities, the 2017 Federal Budget asked EDC to deploy new and existing capital to the cleantech sector in three specific forms: working capital, equity and project finance. Over the planning period, EDC will continue to coordinate with its financial crown and government partners to ensure Canadian cleantech companies receive a full continuum of support. EDC will also be an active contributor to the newly formed Clean Growth Hub which is set up to ensure streamlined client triaging, event coordination and a “no wrong door” approach for companies. While the Clean Growth Hub is still being established, EDC will work throughout the planning period to coordinate cleantech activities with the Hub. EDC was also an active participant in the government’s recent Horizontal Review on Innovation and clean technology. EDC provided robust data to ensure our contributions to the Government innovation agenda were accounted for in the results of the initiative. We will continue to be active participants in the review and will contribute to the implementation of relevant outcomes.
AGRI-FOOD AND CONSUMER MERCHANDISE
Opportunities in both agri-food and consumer goods are expected to increase considerably over the planning period, especially in China and India where the middle class is growing fast and creating greater demand for food and merchandise. Canada’s Agri-food sector will be driven by steadily increasing global demand for high-quality food, both processed and unprocessed, as well as demand for the technologies and techniques used to grow and process that food. This demand is feeding the sector, so much so that agri-food is now one of the fastest-growing industry segments within the Canadian economy. The challenge will be for EDC and other trade partners like the TCS to work together to help companies ramp up to meet

2018-2022 Corporate Plan Summary | EDC30
Nanoleaf Canada Limited
From their roots as students building solar-powered cars, through to their successful Kickstarter campaign, the team behind Nanoleaf Canada Ltd. have long believed that there doesn’t have to be compromise between performance and efficiency. Driven by this vision – and combined with their human-centric design philosophy – Nanoleaf’s business took off with the creation of the world’s most energy-efficient lightbulb. Now offering a diverse line of lighting products, boasting lifespans of more than 20 years, Nanoleaf is bringing cutting-edge products to the masses. Motivated by a commitment to environmental sustainability, Nanoleaf’s products boast a net-positive environmental impact, giving their customers peace of mind. Already with production facilities in China, the company is determined to extend its presence into more markets around the world. Through distribution partners like Apple and Best Buy, Nanoleaf is now selling their products in more than 40 countries and have seen 4 consecutive years of growth. With new growth and expansion comes additional risk, but Nanoleaf is mitigating that risk with EDC’s Trade Credit Insurance. EDC is helping Nanoleaf and many other Canadian cleantech companies go global and succeed in a variety of ways. Through our dedicated cleantech strategy and in collaboration with key federal partners like the Business Development Bank of Canada (BDC), Sustainable Development Technology Canada (SDTC) and Global Affairs Canada (GAC), EDC is working to support the unique needs of Canadian companies in this sector. Together, we are helping more Canadian businesses shine their light in new corners of the world, just like Nanoleaf. To see just how far they’re shining, you can follow @Nanoleaf on Twitter and Instagram.
Image courtesy of Nanoleaf Canada Limited
EDC | 2018-2022 Corporate Plan Summary 31
the considerable demand for products and machinery expected over the planning period and beyond. EDC has developed a new strategy for the sector that focusses on creating trade connections (more on these in the next section), leveraging foreign buyers with a footprint in Canada, deepening relationships with industry partners, and exploring more tailored financial products that could better meet the needs of companies in the sector.
On the consumer merchandise side, EDC has identified an opportunity to better leverage Canada’s brand to increase exports in this sector, especially into new, niche-type markets. EDC was able to witness emerging market demand for Canadian goods first-hand when, in 2017, it joined forces with the TCS for a matchmaking session with Soriana, a Mexican chain of grocery and department stores, and the second largest retailer in Mexico. It was the largest matchmaking program EDC had ever held, and served to introduce 79 Canadian companies in both the agri-food and consumer merchandise sectors to the Mexican giant. Out of the event came a number of follow-up business meetings between Soriana and a selection of Canadian suppliers that attended, demonstrating the value of creating that initial connection.
AUTOMOTIVE SECTOR
The Canadian automotive industry is one of Canada’s largest manufacturing sectors, structured as a multi-tiered supply chain, which is concentrated in Ontario but with additional clusters in Quebec and British Columbia. North American vehicle production and sales are currently at record levels, resulting in substantial opportunities for the Canadian automotive supply chain. The automotive industry as a whole is going through an intensive period of innovation, wherein new global fuel efficiency standards, an increasing emphasis on in-vehicle connectivity and
the drive towards the development of autonomous vehicles are creating substantial opportunities for suppliers operating beyond the traditional supply chain. EDC is focused on promoting emerging, innovative SMEs in these areas and more broadly, promoting Canada as a strong source of innovative technologies for future vehicle platforms across all Original Equipment Manufacturers (OEM). Beyond innovation, EDC will also continue to support the traditional automotive supply chain.
OIL AND GAS
Following a difficult 2016, the oil and gas sector in Canada is rebounding thanks in large part to a modest increase in commodity prices and a return to normal export levels after the dip caused by the devastation of the Fort McMurray wildfires. EDC will continue its support for the sector through its financial products, but also as a supply chain matchmaker, helping Canadian companies find international opportunities that suit their capabilities. To help make these connections EDC works closely with the TCS, which has extensive knowledge of Canadian capabilities in the oil and gas sector and provides valuable support on the ground in foreign markets.
In 2016, EDC made $750M in financing capacity available to SMEs in the sector that were investing in more diversified and sustainable futures for their companies. So far EDC has supported 40 companies through this program, and financing capacity will continue to be distributed in 2018 and potentially beyond. EDC also co-sponsored and contributed its expertise to an initiative by JuneWarren-Nickel’s Energy group in 2017 called Going Global, which highlighted the top 16 export markets for Canadian companies in the oil and gas industry – this initiative and others like it complement the many tools EDC has available to assist Canadian companies in this sector.

2018-2022 Corporate Plan Summary | EDC32
OBJECTIVE 3: EXPAND OPPORTUNITIES FOR CANADIAN COMPANIES TO SUCCEED INTERNATIONALLY BY PROMOTING AND FACILITATING TRADE DIVERSIFICATION.
This third objective is about helping Canadian companies succeed internationally, by creating new opportunities and promoting diversification to bring their business to the next level. In order to achieve this goal, EDC will need to leverage its abilities as a global financier; its deep knowledge of Canadian business capabilities; its relationships with foreign buyers and understanding of their needs; as well as its international market intelligence. On top of this EDC will need to rely on its close relationships with government trade partners to extend its domestic and international reach. We will combine our respective strengths to generate new business for Canadian exporters, and also to attract more investment into Canada in coordination with the Invest in Canada office.
MAKING CONNECTIONS
In EDC’s ongoing research, the connection has often been cited as one of the most difficult and expensive requirements barring companies from engaging in international trade or reaching that next level. This is especially true for SMEs that might not have the resources to travel the world meeting with potential buyers. In recognition of this, EDC – in collaboration with other partners – began arranging matchmaking sessions and this service has since become a key tool to facilitate connections with buyers. This matchmaking is most often done in partnership with the TCS, which adds considerable value to these events with its network of contacts, both domestic and international, and extensive knowledge of international markets. EDC’s collaboration with the TCS is expected to continue to grow over the planning period.
Matchmaking sessions can be dedicated, one-on-one meetings between a Canadian exporter and a foreign buyer. Or they can also be larger events where EDC brings together groups of Canadian and foreign companies that suit each other’s needs. These can take place at trade shows, through in-market missions, or by arranging cross-Canada visits for foreign firms to meet potential Canadian suppliers.
The fact that EDC is able to draw major international buyers to Canada in this way demonstrates the strength of our international relationships, and the trust that buyers have in EDC’s ability to add value to their operations by referring them to quality Canadian suppliers. The connections program is also evolving beyond traditional tradeshows and missions. Virtual matchmaking was piloted for the first time in 2017 by way of video conference. We’ve also taken matchmaking a step further and hired specialists and technical experts on supply capabilities and international value chains to improve the accuracy of our connections. These experts will be able to better assess the needs of a foreign buyer and – as we’ve seen in some cases already – even suggest new Canadian supply to a buyer before they recognize the need themselves.
EDC | 2018-2022 Corporate Plan Summary 33
CREATING TRADE
While connections to international buyers and business opportunities are the end result, EDC has a number of tools it employs beforehand that lay the groundwork for those introductions. One of our most effective tools is the pull transaction, whereby EDC provides a loan to an international buyer – which is repayable and made on commercial terms – and as part of the loan the foreign buyer agrees to work with EDC so that we can identify their supply chain needs and gauge how they fit with Canadian capabilities. The buyer also commits to working with EDC and Canadian companies to fulfill their needs.
Pull facilities are most often negotiated with large international buyers that are industry leaders and have expansive global or regional footprints. The reality is that most Canadian companies, especially SMEs, could not otherwise get a seat at the table with these major buyers so an introduction can make all the difference for them. EDC’s international relationships in this case create real business for Canadian companies. In 2016, EDC added 39 pull facilities which initiated foreign procurement from 960 Canadian exporters, just under 70 per of which were SMEs. Twenty of these new pulls were signed with first-time pull borrowers, helping EDC diversify its portfolio of international buyers and helping Canadian companies diversify their international business.
In 2017 EDC continued to evolve the pull program to better serve Canadian companies. We developed a
Connections Tracking System that will allow us to capture our connection activities – activities such as the promotion of Canadian companies to buyers, person-to-person introductions, and specific exporter successes (including contract wins) that result from our targeted connections. This system will enable EDC to better highlight the effectiveness of our trade creation efforts, and will also help us be more strategic in selecting companies to introduce to buyers. Looking ahead EDC will continue to diversify the pull program with new borrowers, in new markets, and in new sectors.
The TCS plays an important role in ensuring the success of EDC’s pull facilities. Since first collaborating with the TCS on pulls in 2014, our joint efforts have only grown over time, with improved information sharing, planning and outreach, as well as better coordinated matchmaking efforts. Together with the TCS and other channel partners, in 2016 EDC arranged 15 matchmaking sessions with 32 pull buyers, resulting in 407 introductions for Canadian companies. In 2017 we aimed to create 500 connections through these pulls. EDC will continue to work closely with the TCS to increase the success rate and reach of EDC’s pull strategy going forward.
Another tool the global trade team uses to generate exports as well as foreign investment into Canada is the protocol transaction. With the protocol, EDC extends credit capacity to a foreign multinational company with the goal of encouraging that multinational to increase their economic footprint in Canada – this could mean buying more from Canadian suppliers or investing in the Canadian economy in other ways, like opening new factories or growing existing operations. EDC will only consider extending protocols to companies that already have significant footprints in Canada, meaning they already have operations in the country that benefit the Canadian economy by, for example, creating jobs. The protocol demonstrates how EDC’s international financing can pay dividends at home and directly benefit Canada. Beyond protocols, EDC is contributing to the Canadian investment through its contributions to a government committee focused on attracting investment, led by the Invest in Canada office.

2018-2022 Corporate Plan Summary | EDC34
JusTea
Since 2012, JusTea has been partnering with farmers in Kenya to share their artisanal teas with the world. Jointly based in Vancouver and the Nandi Hills community in Kenya, JusTea is dedicated to their sustainable and ethically sourced product, and also committed to helping the community in Kenya where they are creating opportunities for economic growth and development. JusTea’s small-scale approach is bringing new and unique products to the market while also providing fair and sustainable wages for the tea farming families they work with. JusTea’s products have grown steadily in popularity but for the company to grow its international market share, it needed to find new foreign customers – often a difficult task for smaller companies. In May 2017, EDC was able to help with that challenge through its matchmaking program, where EDC identifies interested foreign buyers and introduces them to leading Canadian companies. JusTea was one of nearly 80 Canadian companies to be introduced to a major Mexican buyer that EDC had invited to SIAL Canada’s International Beverage and Food Show. As of September 2017, JusTea is among the first companies to have secured a deal with this buyer, making them one of the first loose-leaf tea products to be introduced into the Mexican market. Thanks to EDC, the connection part of finding new business was taken care of, and JusTea’s incredible product spoke for itself in order to secure the deal. The story of JustTea is just one example of how when it comes to expanding into new markets and meeting buyers, EDC can help Canadian businesses with its extensive international network. You can keep up to date with farmers’ stories and JusTea’s diverse products by following @JusTeaKenya on Twitter and Instagram.
Image courtesy of JusTea
EDC | 2018-2022 Corporate Plan Summary 35
TRADE DIVERSIFICATION: INCREASING CANADA’S PRESENCE IN NEW MARKETS
For the large majority of companies, especially SMEs, the U.S. is the most enticing market to do business with. The geographic proximity and established trading relationship ease the complexities of international business that could be encountered elsewhere in the world. While Canada is fortunate to have the world’s largest economy next door, and while it will continue to be Canada’s most important export market, recent challenges to Canada-U.S. trade have served to highlight the importance of diversification. In the same way investment firms diversify to mitigate risk, but also to enable themselves to grow and take more risk, so should exporting companies. EDC is committed to helping them do this, by supporting their expansion into both developed and emerging markets.
INTERNATIONAL FOOTPRINT
Core to EDC’s trade diversification strategy is our own international footprint. Our ability to align solutions that meet the needs of Canadian exporters all over the world requires us to maintain current, on-the-ground knowledge on markets of importance to Canada’s exporter population. Our network of 20 foreign representations helps deepen relationships with local buyers and borrowers, and provides valuable in-market information and intelligence to Canadian exporters and investors. It helps us identify opportunities for Canadian supply and investment, and makes it possible to offer market-specific financial solutions that benefit Canadian companies.
EDC’s international focus is divided into three key geographic areas – the Americas, the EMEA region (Europe, Middle East, and Africa), and Asia – each with a dedicated office or ‘hub’ that oversees and delivers our solutions to that region. The hub offices are located in Ottawa, London (England), and Singapore, respectively. Our other international representations remain positioned as ‘spokes’ around the globe, and conduct targeted business development activities within the markets that will yield the greatest benefits for Canadian trade. This model allows us to better deploy our business development and underwriting efforts across key global regions to serve more Canadian exporters, in a more efficient way, than ever before.
2018-2022 Corporate Plan Summary | EDC36
DEVELOPED MARKETS
The U.S. is Canada’s number one developed market trading partner, and we are growing our support there to benefit SMEs and new exporters as discussed previously in this chapter, but there are other key developed markets where EDC is focusing its efforts. Trade with Europe and developed Asia for example, account for more than half of non-U.S. exports and will be key to diversification efforts. With CETA recently being signed, it’s expected that this percentage could grow even more over the planning period as Canadian trade with Europe surges. EDC is working to raise awareness of opportunities and increase trade to these developed markets. While emerging markets offer the most in terms of growth opportunities, first-time exporters tend to have more success in developed markets, mainly because of their economic stability and ease of doing business. Plus, developed markets often serve as jump-off points for companies looking to move into emerging markets, so in this way, by supporting diversification into developed markets it could also lead to emerging market opportunities.
EUROPE
CETA will have a major impact on Canadian trade with the world’s second largest comprehensive economy. The agreement covers investment flows, the movement of people, and recognizes the product standards and the professional certifications required by both Canada and the EU. It will make it easier for Canadian companies to set up foreign affiliates, and in cases where SMEs don’t have the resources necessary to set up an affiliate, the agreement allows for them to station people in Europe for up to three years.
EDC anticipates increased Canadian opportunities in a number of sectors, including agri-food and consumables, high-tech manufacturing, building
materials, aerospace technologies and industrial machinery. Because CETA also covers services, we see plenty of opportunities in this sector from engineering, to software and IT services, to environmental services. EDC’s representations in Dusseldorf and London will continue to focus on integrating Canadian companies into the European supply chain. They will also play an important role in supporting the anticipated increase in trade and investment that will result from the ratification of CETA.
DEVELOPED ASIA
We define developed Asia as Japan, South Korea, and Australia. Given significant opportunities for Canadian business growth in the region, EDC has chosen Sydney, Australia as the destination for its next international representation. When launched in late 2017, it will be EDC’s 20th international representation. Australia’s combination of solid economic credentials, highly educated labour force, political stability, and its proximity to the fast-growing markets of Asia make it a land of opportunity for Canadian exporters. The country also has strong business ties with Asia and is an active participant in ASEAN Free Trade Agreement discussions, which makes it advantageous for Canadian companies looking to penetrate Asian markets. In Australia, the biggest opportunities for Canadian companies are expected in oil & gas and infrastructure industries. Australia is rich in natural resources much like Canada, and there is strong potential for the country to become a major energy player as it ramps up to meet rising Asian energy demands.
Our network of foreign representations helps deepen relationships with local buyers and borrowers, and provides valuable in-market information and intelligence to Canadian exporters and investors.
EDC | 2018-2022 Corporate Plan Summary 37
EMERGING MARKETS
Emerging markets have been at the centre of EDC’s international growth strategy since opening its first representation in Beijing 20 years ago. These markets have the potential to sustain greater growth and investment rates given rapid population and middle class expansion, as well as the corresponding infrastructure gaps. From our research on the exporter journey we know that few exporters, especially new exporters, expand into multiple global markets at once and that it can take a long time to eventually expand into non-traditional markets. The result is missed opportunities, which is why EDC has an important role to play in encouraging and empowering companies to diversify into new, high growth, high potential and higher risk markets. We will assist in the development and execution of the Government’s targeted strategy to promote trade and investment in emerging markets, with a focus on China and India.
CHINA
China is one of the world’s largest economies and Canada’s second largest trading partner. It presents considerable opportunities across a variety of sectors, most notably in cleantech, automotive, aerospace, and infrastructure. E-commerce is also proving to be a successful avenue of entry into the Chinese market for Canadian companies, especially for consumer merchandise, and we expect this business will only grow with time. In 2017, EDC focused its efforts on supporting Canadian direct investment into China, and succeeded in helping 35 Canadian companies establish manufacturing and regional offices in the market. EDC will use its two foreign representations in China, both of which are co-located with the TCS, in Shanghai and Beijing as the base for Canadian support in-market. Through our local presence in China we work very closely with the TCS, adopting a Team Canada approach to creating connections and providing support for Canadian suppliers and Chinese buyers to increase awareness of the Canadian brand and trade between the two countries.
INDIA
Excitement is building around India’s economy and with 30 years of experience in the market, EDC is well positioned to support Canadian trade across a wide variety of sectors. The demand for infrastructure and engineering, information and communication technologies, as well as agri-food equipment and cleantech align very well with Canadian capabilities. 2016 was a record year for EDC in India with almost $1.2B in new financing. We also completed the first-ever rupee denominated loan (also referred to as a Masala loan) issued by a financial institution outside of India – a transaction model which provides a distinct local-currency advantage for Canadian companies active in India. Also in 2016, pull transactions with two large Indian oil and gas companies resulted in over 50 new connections for Canadian companies. Through its representations in Mumbai and New Delhi, EDC’s strategy for business development will focus on private sector opportunities and engagement with top-tier Indian multinationals.
ASIA
In 2016 EDC expanded its representation in Singapore, which has been there since 2008, into the corporation’s first ever international financing branch, with the capacity to negotiate and underwrite transactions in market. This strategic step was taken to give Canadian companies a competitive advantage and help them respond to significant business opportunities in the fastest growing economic region in the world. As both a financial and transport hub for the Association of Southeast Asian Nations (ASEAN), Singapore is a vital entry and distribution point in a region where the total stock of Canadian direct investment now exceeds that in China and India combined. Key sectors where Canadian companies match up well with demand in Asia include infrastructure (energy and clean technology), extractives (oil and gas), information and communications technology, and transportation (aerospace, automobile production, and rail). EDC staff in market will work alongside members of the TCS and together play a key role in the Government’s strategy to grow Canada’s trade footprint in Asia.

2018-2022 Corporate Plan Summary | EDC38
Martin & Vleminckx Ltée
Martin & Vleminckx is a world leader in the design, manufacture and installation of wooden roller coasters. Building on more than 30 years of experience in the field, Martin & Vleminckx has brought its classically designed coasters to new heights and locations far from its Quebec offices. As the domestic and U.S. market for wooden roller coasters became saturated, Martin & Vleminckx shifted focus to countries like Norway, the Netherlands, and most importantly, China, where the market was just opening up. Martin & Vleminckx was the first company to sell a wooden roller coaster in Shanghai, and their product quickly became the number one attraction in the park where it was installed. Since their first sale in Shanghai in 2009, Martin & Vleminckx has installed 10 more roller coasters in China. The company has learned through its experience in China that developing cross-cultural personal relationships and customer confidence is key to business success. With Account Performance Security Guarantees (APSG) from EDC, Martin & Vleminckx can guarantee that its letter of credit will be honoured in the case of a default, reassuring customers that their $6M to $8M investments are protected. With the APSG removing a considerable amount of the risk from a transaction, Martin & Vleminckx can focus its energy on building relationships with their customers and delivering roller coasters that thrill and impress the world over. For photos and videos of its rides in action, check out Martin & Vleminckx on Facebook.
Image courtesy of Martin & Vleminckx Ltée
EDC | 2018-2022 Corporate Plan Summary 39
AFRICA
With six of the world’s twenty highest growth countries in 2016 being situated in Africa, it is clear why this emerging market is a strategic focus for EDC. EDC’s business approach is to break down the continent into three tiers, based on macroeconomic indicators, political stability, alignment with priorities laid out by Global Affairs Canada, as well as sector alignment with Canadian business capabilities. Currently opportunities for Canadian business are seen to be most promising in South Africa; this, combined with the presence of strong continental and regional banks in the country, served as the rationale for EDC to establish a representation there in late 2015. It will also serve as a base to coordinate other business opportunities in Sub-Saharan Africa. EDC will continue to work closely with the TCS in Africa, as their diplomatic ties in the market facilitate access to government agencies and departments which are some of the most important potential buyers of Canadian supply.
LATIN AMERICA
The impact of EDC’s ability to create trade was perhaps best demonstrated in Colombia in 2016, where we supported $1.7B in Canadian business – double the amount supported in 2015. This was made possible by the determined work of our in-market representatives and the relationships they have built over the years. As a result of these relationships a number of large pull facilities were signed with major Colombian buyers in 2016. Ultimately these deals mean greater potential for Canadian business in Colombia down the road. EDC was similarly successful in other Latin American markets in 2016, highlighting the success of our trade creation efforts in the region. Canadian capabilities in the extractive sector, energy, and infrastructure match up very well with the needs of many Latin American countries which is fueling our growing business presence there. Looking ahead, EDC will continue to use its trade creation tools to spur more business for Canadian companies in this part of the world.
PROMOTING FREE TRADE AGREEMENTS
EDC found in its research on the exporter journey that when Canadian companies look to expand abroad, free trade agreements (FTAs) act as beacons attracting them to certain markets. FTAs provide the impetus that some companies need to diversify.
Canada currently boasts 15 FTAs that are either signed or already in force, and the Government of Canada continues to explore new opportunities. As Canada’s export credit agency, EDC has an important role to play in ensuring that Canadian companies are aware of, and take advantage of, these trade agreements in order to enter new markets. That is why we collaborated with the TCS and BDC on the Canada Tariff Finder tool, which is an online platform that companies can use to view tariffs in FTA markets, and also compare them to see which market would be most profitable for them to sell into. It is also why we’ve been active in our promotion of CETA from the outset. Since 2016 we’ve hosted sixteen events in partnership with the TCS to promote the agreement – eight of which were international and took place in various European countries, and eight of which were domestic and hosted in different cities across Canada. Going forward EDC will continue to support TCS-led events on CETA, and will also continue to create our own informative content and use our various channels to share the information broadly with Canadian companies.
EDC has also played a major role in keeping Canadian companies informed about developments with NAFTA, especially the process of renegotiation. We added a new hub on our website dedicated to Canada-U.S. trade relations and we’re regularly producing content for exporters. EDC will continue to monitor developments on the NAFTA front and supplement content already being produced by the TCS on this topic, to keep Canadian companies informed of any changes to the agreement.
2018-2022 Corporate Plan Summary | EDC40
2.6 CORPORATE SOCIAL RESPONSIBILITY
Corporate Social Responsibility (CSR) is gaining prominence in the international business community. Organizations around the world have recognized the benefits of working together to tackle global challenges like climate change, corruption, and social inclusion. There’s a growing understanding that strong CSR practices are no longer a ‘nice-to-have’ but instead essential drivers of innovation, contributing to a sustainable and competitive business.
CSR is a central pillar of EDC’s business. We consider the work we do to continuously improve our practices and advocate for responsible business conduct to be tantamount to our success, and to the success of the Canadian companies we work with. Our extensive CSR policies, practices and expertise are a big part of why EDC has such a strong reputation among its peers. We review transactions to ensure that international standards are met, while also working with Canadian companies and international borrowers to help increase their knowledge and understanding of these standards and how they can enhance business practices. By helping companies understand the totality of their business risk, the hope is that these companies can more effectively mitigate against them. Strong CSR is something that makes EDC more valuable as an organization, not only for the companies with which we do business, but also for our stakeholders and employees.
As an organization that has developed substantial CSR expertise over the years it’s our responsibility to continue pushing the boundaries and leading by example. In 2016 we were again ranked in the top ten of the Corporate Knights Future 40 Responsible Corporate Leaders in Canada, and finished first among financial organizations. We are exploring ways that EDC can contribute to achieving the United Nations’ Sustainable Development Goals (SDGs), which aim to end poverty and hunger, improve health and well-being, and promote equity and equality around the world in the next 15 years.
Our CSR practices aim to help companies we work with differentiate themselves in terms of their sustainable business practices. When EDC is part of a transaction, we want investors, financiers, customers, and every other link in the supply chain to know that best practices are being upheld. This doesn’t necessarily mean saying “no” to more transactions and leaving companies behind. It means being a force of positive influence for Canadian business and the many organizations we work with, as well as helping our customers to longer-term success, fueled by responsible business practices.
Our CSR practices aim to help companies we work with differentiate themselves in terms of their sustainable business practices. When EDC is part of a transaction, we want investors, financiers, customers, and every other link in the supply chain to know that best practices are being upheld.
EDC | 2018-2022 Corporate Plan Summary 41
ANTI-CORRUPTION AND BRIBERY
Corruption and bribery distort trade, undermine the free flow of goods and services and inhibit economic growth. Canada and other leading trading nations have taken concerted action to fight corruption, and EDC has a strong role to play in supporting their efforts. As an active participant in numerous international agreements aimed at addressing corruption and bribery in business transactions, we have developed processes and safeguards to ensure we do business in an ethical way. Further to this, our Code of Business Ethics and our Anti-Corruption Policy Guidelines prohibit us from knowingly supporting a transaction involving the offer or the giving of a bribe. EDC’s underwriting and business development staff conduct corruption screening on every transaction. Enhanced due diligence is undertaken by a specialized team if screening reveals potential concerns. The team conducts document reviews, online research and consults with company representatives to assess how they enforce their anti-corruption and compliance controls. In most cases, issues relate not to our Canadian customers, but to their foreign buyers, third-party entities or projects they may be supplying.
In 2016, EDC supported several initiatives to raise private sector awareness of bribery and corruption and offer guidance on how to combat and manage the risks. On International Anti-Corruption Day our corporate website (edc.ca) profiled a series of articles, co-authored with U.S.-based anti-corruption experts TRACE, on strategies for combatting corruption. These types of campaigns form part of our obligations under the Organization of Economic Co-operation and Development’s (OECD) Recommendation on Bribery and Officially Supported Export Credits.
We work closely with the Government of Canada to ensure proper due diligence and alignment in our approach to companies that face corruption allegations. We will continue to collaborate with Global Affairs Canada and Justice Canada in this regard.
ENVIRONMENTAL AND SOCIAL RISK MANAGEMENT
We understand that as a global financier, there are environmental and social risks involved in the business we facilitate for Canadian exporters and investors. It is critical for EDC to have the processes in place to identify those potential risks, and then the expertise to work with Canadian companies to help them mitigate against those risks. Our Environmental Advisory Services (EAS) team works closely with companies to review transactions, provide guidance, propose risk mitigation plans, and monitor progress against required benchmarks for the duration of our support. Underpinned by the OECD Common Approaches, the UN Guiding Principles, and various other international agreements and standards, our environmental and social risk management framework guides all the business we support.
For EAS reviews of project finance transactions (which are transactions where EDC commits financing to projects such as wind farms and mines) we apply the
Equator Principles – a rigorous set of standards that apply to commercial banks and other international financial institutions to assess and manage environmental and social risks in financing
2018-2022 Corporate Plan Summary | EDC42
transactions and project-related corporate loans. EDC is on the Steering Committee of the Equator Principles, and many of our CSR experts are involved in working groups of the Equator Principles and the OECD Environmental Practitioners, helping tackle global issues and shape international standards in the areas of climate, biodiversity, human rights and social risks.
We regularly review and evaluate our risk review policies and procedures to incorporate evolving best practices and industry standards. Our continued participation in international working groups helps us stay on the cutting edge and provides a forum for sharing and learning among our peers. Over the planning period we will continue to collaborate with Global Affairs Canada to ensure our systems and processes are aligned with their objectives under the Government of Canada’s new CSR strategy.
SUPPORT FOR CLIMATE CHANGE INITIATIVES
With the signing of the Paris Agreement in 2016, the Government of Canada took a leadership role in the fight against climate change, and EDC is a dedicated ally in that fight. We are committed to participating in the ‘whole of government’ approach to meet Canada’s commitment to the United Nations Framework Convention on Climate Change’s Climate Finance commitment, meaning that in addition to our own cleantech strategy, we will also work with government departments, including Environment and Climate Change Canada and Finance Canada, to scale up and report on our climate finance activities in developing countries.
EDC took major steps in 2016 to bolster our climate change efforts. We implemented the OECD Sector Understanding on Export Credits for Coal-Fired Electricity Generation Projects, limiting our support for new coal-fired power plants six months ahead of the formal effective date laid out by the OECD. In addition to supporting $1B in cleantech in 2016, we supported $273 million in climate finance eligible transactions, which represents the amount of support we provided for climate-friendly projects or companies operating in developing countries. We consider these to be substantial achievements in a priority sector for EDC.
EDC was the first organization in Canada to issue a Green Bond in 2014, and today the program continues to garner strong interest from the business community. We issued our third Green Bond in early 2017, valued at USD $500M. The proceeds of this Green Bond offering will go towards EDC’s portfolio of green assets, including loan assets made to companies that are active in fields of preservation, protection or remediation of air, water, and/or soil, creation of renewable energy and mitigation of climate change.
EDC | 2018-2022 Corporate Plan Summary 43
2.7 HOW WE DELIVER ON OUR OBJECTIVES
EDC’s success is measured by external outcomes, meaning the international success of the businesses we support and the benefits that increased trade brings back to Canada. But that success starts with decisions made internally – the systems we have in place and the people we employ. Anticipating the innovation and agility we’ll need as an organization to help more Canadian companies, EDC employs risk management, operational management, and sustainability practices that align with the very best practices of the private sector. Beyond these we are continuously searching for ways to free up capacity and improve efficiency, so that we might be more productive and deliver more value to Canadian companies.
RISK MANAGEMENT
EDC is always exploring and expanding its reach into new international markets and sectors to support trail-blazing Canadian companies. As we do so, the corporation will inevitably encounter a wide variety of risks – financial, operational, and strategic – across a diverse economic and political landscape. To reach our strategic goals in a responsible and sustainable way demands that the organization be vigilant in identifying, anticipating, and ultimately managing risk.
In 2015 EDC initiated a transformation of its Enterprise Risk Management (ERM) system, which is about building risk-management practices into our everyday operations, corporate-wide. The ERM transformation program is on schedule to be fully launched by its deadline of December 2019.
The focus of the program is not about developing a system to take more or less risk, but to better manage and govern the risks we do take, including elevating awareness, understanding and foresight throughout the organization. Our Board of Directors and management team are actively engaged to ensure that
the ERM plan is effectively implemented at all levels of the corporation. Key elements include: governance in accordance with a Three-Lines-of-Defense model (3LD); articulation and operationalization of EDC’s risk appetite; enhanced discipline around risk management processes; and integration of new financial risk policies. One component of our ERM practice is a well-established annual risk survey that considers all of the risks inherent to EDC’s business.
We have been working in collaboration with the Government of Canada to provide quarterly reports to the Department of Finance on the progress of the ERM Transformation program. These status updates will continue into the planning period and serve to provide transparency on our transformation.
FINANCIAL SUSTAINABILITY
While EDC’s strategy is to help more companies go, grow and succeed internationally today, it’s equally important that the corporation maintain a strong capital position to be able to help those companies down the road when they need us again. Over the planning period EDC will need to exercise the same level of financial responsibility that has made it into the stable financier it is today. This will mean maintaining sound risk management practices, responsible management of resources, and continuous improvement in its processes to maintain efficiencies.
The theme of financial sustainability will be explored in greater depth in Chapter 3, the Financial Plan. It provides details on the key business assumptions which underpin our projected financial performance over the next five years. It also includes details on our efficiency, as well as statements on: comprehensive income, financial position, changes in equity, cash flows, and finally planned capital expenditures for 2018-2022.
2018-2022 Corporate Plan Summary | EDC44
CAPITAL AND DIVIDEND POLICY FRAMEWORK
Over the past year, we have been collaborating with the Department of Finance and other financial crowns to develop a common framework for capital and dividends. The objective of this framework is to align on key principles for the management of capital and reporting on capital adequacy. Collaboration will continue into the planning period and more detail can be found on our capital adequacy and dividend policy in Chapter 3 of the Corporate Plan.
HUMAN RESOURCES
The success of EDC’s business strategy will be dependent on sound management of the organization’s most valuable resource – its people. Strategy provides the roadmap for change, but it is EDC’s employees that will drive that change, which is why Human Resources (HR) is such a foundational element in EDC’s continued transformation. We will need to continue attracting, developing and retaining employees that will be difference-makers in their service to Canadian companies. To draw in the finest talent available, it will be essential for EDC to maintain its compelling employee value proposition – an aspect of our business that in 2017 earned EDC a spot on Canada’s Top 100 Employer list. This honour recognizes Canadian employers that lead their industries in offering exceptional workplaces for their employees; it assessed businesses for their physical environments, performance management, and employee benefits.
Over the planning period EDC will continue to invest in its people and HR systems to strengthen the organization, and in the process make it more valuable to Canadian companies.
TALENT MANAGEMENT AND SUCCESSION PLANNING
Attracting and retaining a highly skilled talent pool will remain critical to delivering on our commitment to Canadian businesses. We recognize that most careers no longer follow the traditional path of long-term vertical growth within the same discipline, and that the ability to shift careers within the same company is an attractive component of an organization’s employee value proposition. As such, we continue to provide our employees with better tools and information required to manage their career. These tools will not only help employees build plans for the future roles they aspire to, but will also help EDC leverage its considerable internal talent for resource planning purposes.
A key element of our talent development strategy is to ensure we maintain a healthy pipeline of leaders well into the future. We will continue to review the effectiveness of our talent management process and programs, and use our talent review process to identify high performers and future leaders. We’ll also maintain our focus on performance management, ensuring that employees are receiving regular feedback and coaching from their leaders, and staying aligned with corporate objectives and behavioural expectations.
The success of EDC’s business strategy will be dependent on sound management of the organization’s most valuable resource – its people.

EDC | 2018-2022 Corporate Plan Summary 45
CULTURE
Within EDC we refer to our corporate culture as The EDC Way. Aligned to our core principles of operational excellence, the EDC Way is about driving sustainable long-term results with ideal behaviours that, in turn, maximize the value we create for Canadian companies. As part of our culture EDC strives to operate according to Lean management principles, which means we are constantly improving our internal and customer-facing processes to eliminate waste, incorporate new ideas, and promote efficiency. These principles help create an environment where employees feel empowered and equipped with the tools they need to continuously improve, both of which are key factors in employees feeling engaged with the organization.
Engagement is considered highly influential in predicting organizational success. It also serves as a leading indicator of positive corporate culture. EDC conducts a third-party survey approximately every two years to measure employee engagement and in 2017, scored an overall favourable engagement score of 86 per cent. Our survey scores were benchmarked externally against other North American organizations (600 companies including Bombardier, Pepsi, Walt Disney, Toyota, Oracle) and other High Performing organizations (32 companies including BlackRock, VISA, Nestle) and EDC’s survey scores consistently exceeded these benchmarks. Of note, 97 per cent of survey respondents would recommend EDC as a good place to work.
To further evaluate EDC’s cultural maturity as an organization we employ third-party assessments based on the Shingo Model. These assessments look at whether the systems a corporation has put in place are effectively changing the culture (behavior) of the organization and impacting the value the organization is providing to the customer; for EDC that means the value we are providing to Canadian companies. Since 2012, when EDC did its first Shingo assessment, the corporation has come a long way in its cultural transformation. We’ve gone from a score of 1.8 on the Shingo scale (which ranges from 1-5), indicating a culture in early adoption, to most recently in 2017 a 3.0, which signifies a more mature culture in which individual employees are more frequently displaying ideal behaviours and have performance objectives that are aligned with corporate priorities. This demonstrates that more than ever, the organization is focused on results, which translates into helping more Canadian companies.
Since 2013 over 40 organizations (and approximately 300 people) have visited EDC from around the world to see the EDC Way in action. They come from financial institutions, all levels of government, supra nationals, crown corporations, investment, management and consulting firms. For customers, EDC’s strong culture translates into the highest levels of service and innovative solutions. For the Government of Canada it means that EDC delivers incredible value and effectiveness as a high-performing Crown Corporation, with the highest standards of financial management. Over the planning period we will continue to evolve our culture and strive for even greater efficiencies and effectiveness.
2018-2022 Corporate Plan Summary | EDC46
DIVERSITY AND INCLUSION
We are fortunate in Canada to have such a diverse population. It means that on a regular basis we are exposed to unique ideas, perspectives, and talents; harnessing and unleashing these is part of what makes Canada strong and successful on the international stage. EDC’s ongoing diversity and inclusion strategy is to reflect that same strength within our organization. Fielding a diverse workforce and creating an environment where every employee – regardless of background – feels comfortable will ultimately make EDC stronger, and allow us to better serve Canadian companies. We have already made progress in this regard, which is why EDC was one of 18 employers recognized by the Minister of Employment, Workforce Development and Labour for outstanding achievement in employment equity at the annual Employment Equity Achievement Awards held in October 2017. EDC also received the 2016 Employer Excellence Award from Hire Immigrants Ottawa – the award recognizes employers who demonstrate innovative workplace policies and practices in recruiting and retaining newcomer talent.
We will continue this work with initiatives such as targeted unconscious bias training for leaders, which helps them become more mindful of how inherent bias can impact their decision making.
Other initiatives include: growing employee resource groups; encouraging employee grassroots initiatives; supporting ongoing employee dialogue through blogs; sponsoring diversity and inclusion business case competitions; building on our wellness strategy with a focus on mental health; and raising awareness of EDC as an employer among Indigenous communities and Canadians with disabilities. Languages also play an integral role in diversity and inclusion, and bilingualism across the corporation – from individual employees up to senior leadership – continues to be a priority. Employee fluency in multiple languages, not just in French and English but others as well, is an asset to the corporation and provides value to our customers.
EDC’s Diversity and Inclusion Strategy and Action Plan provides the roadmap for increasing the diversity of our workforce. By 2020 the goal is to have the internal employee population mirror, if not exceed, external availability for the four designated groups (women, visible minorities, Indigenous peoples and persons with disabilities). We are also looking to increase the representation of women in targeted areas (at the leadership level and within the lines of business); visible minorities in leadership; and Indigenous representation at the professional level. To date our efforts have yielded positive results, and we will continue to monitor and assess our progress in this regard.
We are fortunate in Canada to have such a diverse population. It means that on a regular basis we are exposed to unique ideas, perspectives, and talents; harnessing and unleashing these is part of what makes Canada strong and successful on the international stage.
EDC | 2018-2022 Corporate Plan Summary 47
2.8 MEASURING SUCCESS: SCORECARD
Our 2018 scorecard drives our behaviours and contributes to the achievement of the objectives laid out in the plan. As the trade environment and our priorities evolve, so do the benchmarks against which we measure our success. In 2018, we introduced a new customer measure, ‘Customers Served,’ to align with the new strategy EDC is building out.
NET PROMOTER SCORE
The Net Promoter Score (NPS) is the measure against which we evaluate our customers’ satisfaction and loyalty. NPS measures the likelihood that our customers would recommend EDC to business colleagues. EDC continues to be a leader in customer loyalty. Our score, relative to other organizations, is strong and remains in the top 10 per cent of North American B2B companies.
We expect the NPS score for 2017 to finish at 73.3 which is marginally lower than last year’s score but still within the high target range set in the previous Plan (70.0 – 76.0).
Given EDC’s strong focus on the customer experience and exceptional NPS results, we will keep the range at 70.0 – 76.0 for 2018. We believe this range represents a strong commitment to a superior customer experience.
TOTAL BUSINESS FACILITATED
This measure represents the amount of business Canadian companies were able to carry out with the help of EDC’s solutions. We expect business facilitated in 2017 to increase slightly by 0.2 per cent compared to 2016, and end the year at $102.3B.
Looking forward to 2018, we are forecasting that business facilitated will reach $113.3B, which would represent a significant 11 per cent increase compared to 2017’s results. This growth is primarily due to new initiatives within the financing program, such as the initiative to originate more business internationally. We will also look to do more business with our existing strategic customers (the largest companies EDC serves) and find other large companies we can support with our financial and risk mitigation solutions.
BUSINESS IN EMERGING MARKETS (BEM)
This measure uses revenue to demonstrate the value we deliver to Canadian companies in emerging markets. Revenue is a comparable measure of value across our insurance and financing programs, therefore providing a balanced view of our business. Revenue derived from all programs counts towards BEM and is defined as the accounting revenue reported on the income statement earned during the calendar year through premiums, fees and interest on transactions in emerging markets.
At the end of 2017, we expect to see growth in BEM of 20 per cent due to growth in our existing loan book, and due to the effects of foreign exchange and LIBOR rates. This is significantly higher than the 2-6 per cent growth range we forecasted in the last plan.

2018-2022 Corporate Plan Summary | EDC48
CANADIAN DIRECT INVESTMENT ABROAD (CDIA) TRANSACTIONS
CDIA continues to be critical to the health of the Canadian economy, and supporting CDIA transactions has become an integral part of EDC’s core business.
In 2017, we anticipate growth in CDIA transactions of 16 per cent due in large part to the strong performance of the Export Guarantee Program and our ongoing efforts to streamline and simplify our processes for CDIA support.
We expect this strong growth trend to continue into 2018, and as such have forecast the range of growth at 5-20 per cent. This range reflects continued growth in the Export Guarantee Program (EGP) due to the maturing bank channel and banker outreach campaigns.
SMALL BUSINESS AND COMMERCIAL TRANSACTIONS
Over the past number of years EDC has placed a strong emphasis on supporting small- to medium-sized enterprises (SMEs) in both developed and emerging markets. This emphasis on SMEs will continue into the planning period. For 2017, EDC replaced the previous Small to Medium-Sized Enterprise Transactions (SME-T) measure with the Small Business and Commercial (SBC) Transactions measure. This updated measure reflects a more comprehensive range of businesses that export to ensure that we have an eye on companies at all sizes and stages of the SME spectrum.
In 2017, we anticipate the SBC transaction measure to reach 5,722 transactions by the end of the year — a 10% increase over last year. This strong performance lands the measure at the upper end of the 2017 range outlined in last year’s Corporate Plan. Growth can be largely attributed to EDC’s strong push on prospecting for new clients, which was made possible by improving our internal processes to create the capacity for EDC account managers to be more proactive in their search for Canadian companies to support. Our increased outreach to banking partners to increase awareness of EDC’s services also contributed to the strong measure.
We will build off our momentum from 2017 and expect to see high SBC growth rates for 2018, estimated to be within the range of 7—20 per cent.
PRODUCTIVITY RATIO
Our Productivity Ratio (PR) captures in aggregate form how well we use our resources. It is the ratio of administrative expenses to net revenue.
In 2017, we expect PR to reach 30.6 per cent by year-end, which is within the Corporate Plan range of 28 – 32 outlined last year. For 2018 we are raising the expected range for PR to 32-36 per cent. We anticipate an increase in expenses because EDC is making investments to, among other things, add critical risk infrastructure and update some of our core systems and technology. These investments are essential to our ability to operate effectively and engage with customers in a digital world. We also expect that many of these investments will enable EDC to serve even more customers over the course of the planning period, contributing to increased revenue streams. Further information on this PR range is provided in section 3.2 in Chapter 3.
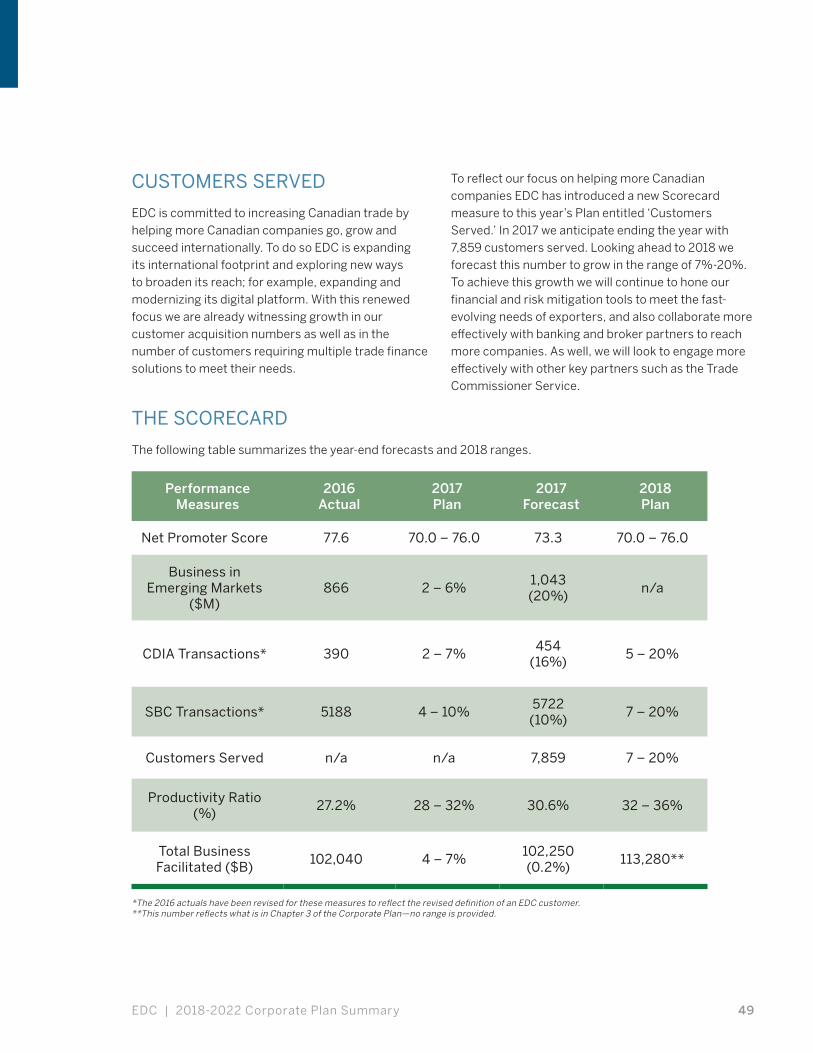
EDC | 2018-2022 Corporate Plan Summary 49
CUSTOMERS SERVED
EDC is committed to increasing Canadian trade by helping more Canadian companies go, grow and succeed internationally. To do so EDC is expanding its international footprint and exploring new ways to broaden its reach; for example, expanding and modernizing its digital platform. With this renewed focus we are already witnessing growth in our customer acquisition numbers as well as in the number of customers requiring multiple trade finance solutions to meet their needs.
To reflect our focus on helping more Canadian companies EDC has introduced a new Scorecard measure to this year’s Plan entitled ‘Customers Served.’ In 2017 we anticipate ending the year with 7,859 customers served. Looking ahead to 2018 we forecast this number to grow in the range of 7%-20%. To achieve this growth we will continue to hone our financial and risk mitigation tools to meet the fast-evolving needs of exporters, and also collaborate more effectively with banking and broker partners to reach more companies. As well, we will look to engage more effectively with other key partners such as the Trade Commissioner Service.
THE SCORECARD
The following table summarizes the year-end forecasts and 2018 ranges.
Performance Measures
2016 Actual
2017 Plan
2017 Forecast
2018 Plan
Net Promoter Score 77.6 70.0 – 76.0 73.3 70.0 – 76.0
Business in Emerging Markets
($M)866 2 – 6%
1,043 (20%)
n/a
CDIA Transactions* 390 2 – 7%454
(16%)5 – 20%
SBC Transactions* 5188 4 – 10%5722
(10%)7 – 20%
Customers Served n/a n/a 7,859 7 – 20%
Productivity Ratio (%)
27.2% 28 – 32% 30.6% 32 – 36%
Total Business Facilitated ($B)
102,040 4 – 7%102,250 (0.2%)
113,280**
*The 2016 actuals have been revised for these measures to reflect the revised definition of an EDC customer. **This number reflects what is in Chapter 3 of the Corporate Plan—no range is provided.
50 2018-2022 Corporate Plan Summary | EDC
INTRODUCTION
Key items to highlight in the Financial Plan are as follows:
• We aim to maintain and grow our business so we continue to generate:
• Net income in the range of $750 to $950 million. Net income is projected to be $757 million in 2017 and then is expected to be within the $800 to $950 million range between 2018 and 2022.
• Net revenue1 of $1.5 billion. Net revenue is projected to be $1.5 billion in 2017 and expected to be within the range of $1.5 billion to $1.7 billion for the Corporate Plan period.
• The 2017 financial results are expected to lead to an eligible dividend payment of $868 million in 2018. The eligible dividends for the remainder of the Corporate Plan period range between $600 and $900 million.
• Our financial position remains strong due to growth in interest earning assets throughout the Corporate Plan period.
• Throughout the Corporate Plan period, we are making significant foundational investments in our technology and digital platforms as we have underinvested in these areas in the past. We also have an ongoing need to make significant investments in risk management systems to keep pace with sound practices in managing financial and operational risks and bolstering compliance and controls. These planned investments will lead to higher administrative expenses and as a result we are projecting an increase in our productivity ratio over the Corporate Plan period. Refer to section 3.2 for further details.
In the Financial Plan, we will first present the key business assumptions which were used to derive our projected financial results followed by a discussion of our projected operating expenses and planned capital expenditures. Projected financial statements and a discussion of our capital management and the statutory limits by which we must manage our organization are also included.
1 Net income excluding the provision for credit losses, claims-related expenses, administrative expenses, and unrealized gains and losses.
CHAPTER 3: EDC’S FINANCIAL PLAN
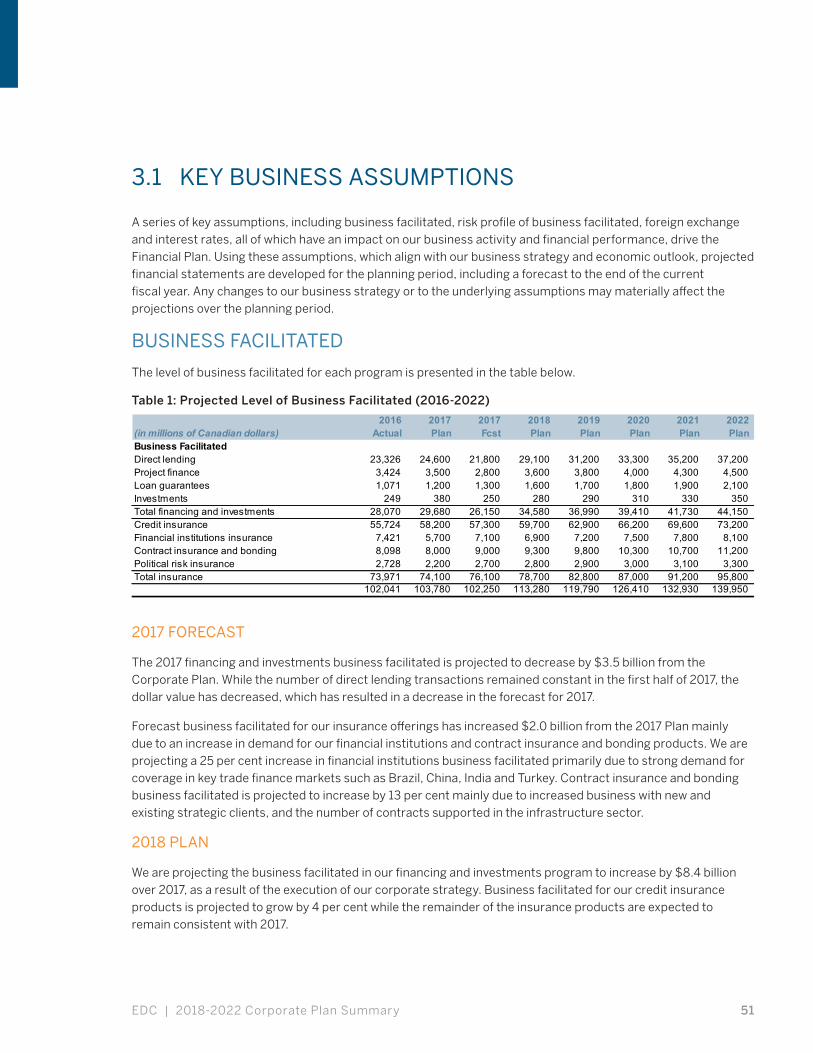
EDC | 2018-2022 Corporate Plan Summary 51
3.1 KEY BUSINESS ASSUMPTIONS
A series of key assumptions, including business facilitated, risk profile of business facilitated, foreign exchange and interest rates, all of which have an impact on our business activity and financial performance, drive the Financial Plan. Using these assumptions, which align with our business strategy and economic outlook, projected financial statements are developed for the planning period, including a forecast to the end of the current fiscal year. Any changes to our business strategy or to the underlying assumptions may materially affect the projections over the planning period.
BUSINESS FACILITATED
The level of business facilitated for each program is presented in the table below.
Table 1: Projected Level of Business Facilitated (2016-2022)
2016 2017 2017 2018 2019 2020 2021 2022(in millions of Canadian dollars) Actual Plan Fcst Plan Plan Plan Plan PlanBusiness FacilitatedDirect lendingProject financeLoan guaranteesInvestments Total financing and investmentsCredit insuranceFinancial institutions insurance Contract insurance and bondingPolitical risk insuranceTotal insurance
33,300 35,200 37,200 3,424 3,500 2,800 3,600 3,800 4,000 4,300 4,500
23,326 24,600 21,800 29,100 31,200
1,800 1,900 2,100 249 380 250 280 290 310 330 350
1,071 1,200 1,300 1,600 1,700
39,410 41,730 44,150 55,724 58,200 57,300 59,700 62,900 66,200 69,600 73,200 28,070 29,680 26,150 34,580 36,990
7,500 7,800 8,100 8,098 8,000 9,000 9,300 9,800 10,300 10,700 11,200 7,421 5,700 7,100 6,900 7,200
3,000 3,100 3,300 73,971 74,100 76,100 78,700 82,800 87,000 91,200 95,800
2,728 2,200 2,700 2,800 2,900
126,410 132,930 139,950 102,041 103,780 102,250 113,280 119,790
2017 FORECAST
The 2017 financing and investments business facilitated is projected to decrease by $3.5 billion from the Corporate Plan. While the number of direct lending transactions remained constant in the first half of 2017, the dollar value has decreased, which has resulted in a decrease in the forecast for 2017.
Forecast business facilitated for our insurance offerings has increased $2.0 billion from the 2017 Plan mainly due to an increase in demand for our financial institutions and contract insurance and bonding products. We are projecting a 25 per cent increase in financial institutions business facilitated primarily due to strong demand for coverage in key trade finance markets such as Brazil, China, India and Turkey. Contract insurance and bonding business facilitated is projected to increase by 13 per cent mainly due to increased business with new and existing strategic clients, and the number of contracts supported in the infrastructure sector.
2018 PLAN
We are projecting the business facilitated in our financing and investments program to increase by $8.4 billion over 2017, as a result of the execution of our corporate strategy. Business facilitated for our credit insurance products is projected to grow by 4 per cent while the remainder of the insurance products are expected to remain consistent with 2017.
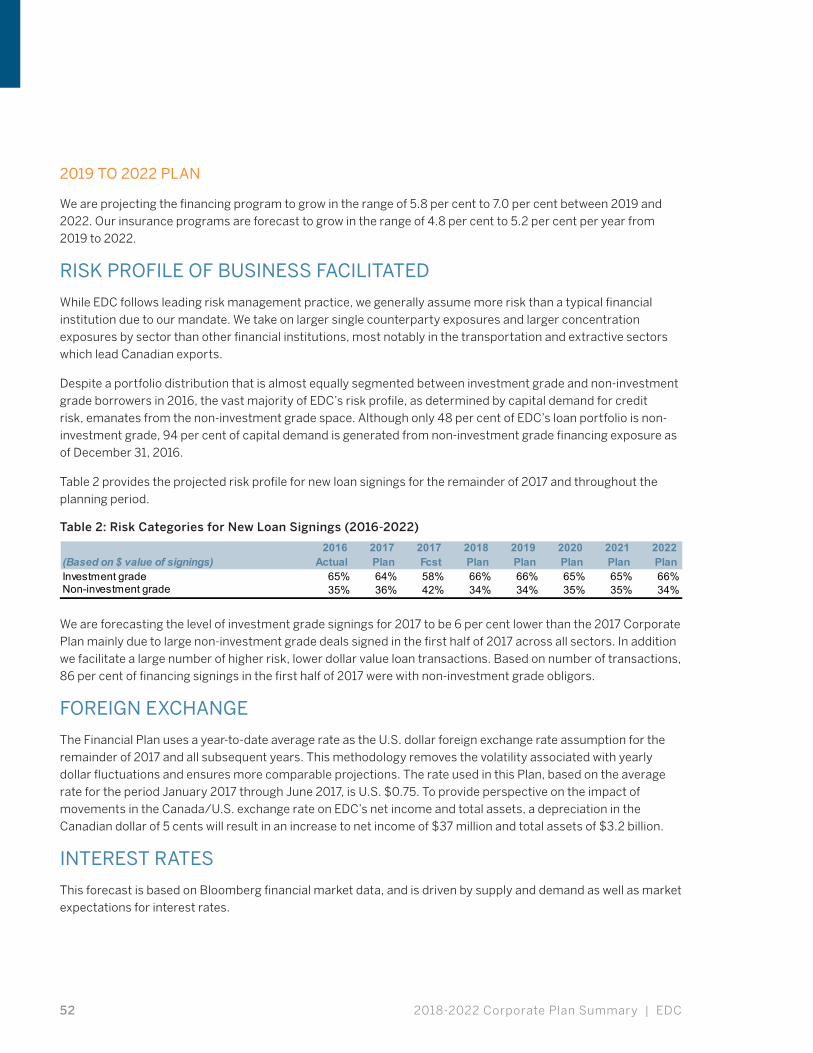
2018-2022 Corporate Plan Summary | EDC52
2019 TO 2022 PLAN
We are projecting the financing program to grow in the range of 5.8 per cent to 7.0 per cent between 2019 and 2022. Our insurance programs are forecast to grow in the range of 4.8 per cent to 5.2 per cent per year from 2019 to 2022.
RISK PROFILE OF BUSINESS FACILITATED
While EDC follows leading risk management practice, we generally assume more risk than a typical financial institution due to our mandate. We take on larger single counterparty exposures and larger concentration exposures by sector than other financial institutions, most notably in the transportation and extractive sectors which lead Canadian exports.
Despite a portfolio distribution that is almost equally segmented between investment grade and non-investment grade borrowers in 2016, the vast majority of EDC’s risk profile, as determined by capital demand for credit risk, emanates from the non-investment grade space. Although only 48 per cent of EDC’s loan portfolio is non-investment grade, 94 per cent of capital demand is generated from non-investment grade financing exposure as of December 31, 2016.
Table 2 provides the projected risk profile for new loan signings for the remainder of 2017 and throughout the planning period.
Table 2: Risk Categories for New Loan Signings (2016-2022)
2016 2017 2017 2018 2019 2020 2021 2022(Based on $ value of signings) Actual Plan Fcst Plan Plan Plan Plan PlanInvestment gradeNon-investment grade
65% 64% 58% 66% 66% 65% 65% 66%35% 35% 34%35% 36% 42% 34% 34%
We are forecasting the level of investment grade signings for 2017 to be 6 per cent lower than the 2017 Corporate Plan mainly due to large non-investment grade deals signed in the first half of 2017 across all sectors. In addition we facilitate a large number of higher risk, lower dollar value loan transactions. Based on number of transactions, 86 per cent of financing signings in the first half of 2017 were with non-investment grade obligors.
FOREIGN EXCHANGE
The Financial Plan uses a year-to-date average rate as the U.S. dollar foreign exchange rate assumption for the remainder of 2017 and all subsequent years. This methodology removes the volatility associated with yearly dollar fluctuations and ensures more comparable projections. The rate used in this Plan, based on the average rate for the period January 2017 through June 2017, is U.S. $0.75. To provide perspective on the impact of movements in the Canada/U.S. exchange rate on EDC’s net income and total assets, a depreciation in the Canadian dollar of 5 cents will result in an increase to net income of $37 million and total assets of $3.2 billion.
INTEREST RATES
This forecast is based on Bloomberg financial market data, and is driven by supply and demand as well as market expectations for interest rates.
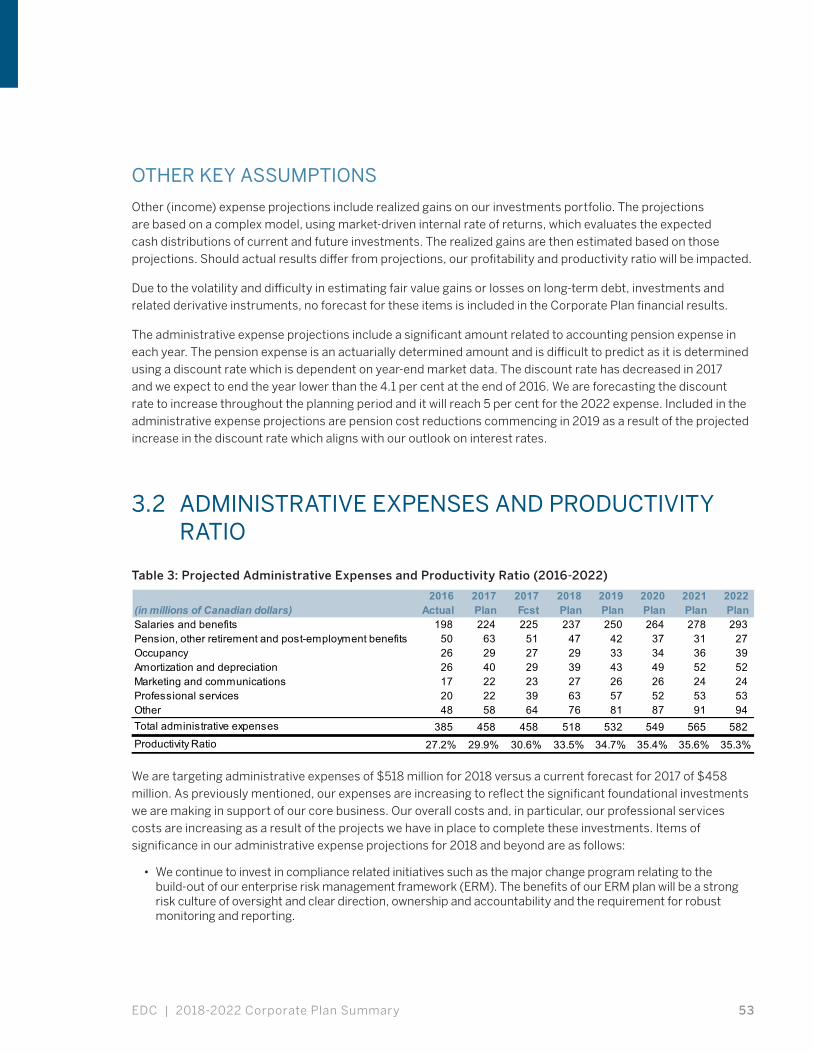
EDC | 2018-2022 Corporate Plan Summary 53
OTHER KEY ASSUMPTIONS
Other (income) expense projections include realized gains on our investments portfolio. The projections are based on a complex model, using market-driven internal rate of returns, which evaluates the expected cash distributions of current and future investments. The realized gains are then estimated based on those projections. Should actual results differ from projections, our profitability and productivity ratio will be impacted.
Due to the volatility and difficulty in estimating fair value gains or losses on long-term debt, investments and related derivative instruments, no forecast for these items is included in the Corporate Plan financial results.
The administrative expense projections include a significant amount related to accounting pension expense in each year. The pension expense is an actuarially determined amount and is difficult to predict as it is determined using a discount rate which is dependent on year-end market data. The discount rate has decreased in 2017 and we expect to end the year lower than the 4.1 per cent at the end of 2016. We are forecasting the discount rate to increase throughout the planning period and it will reach 5 per cent for the 2022 expense. Included in the administrative expense projections are pension cost reductions commencing in 2019 as a result of the projected increase in the discount rate which aligns with our outlook on interest rates.
3.2 ADMINISTRATIVE EXPENSES AND PRODUCTIVITY RATIO
Table 3: Projected Administrative Expenses and Productivity Ratio (2016-2022)
2016 2017 2017 2018 2019 2020 2021 2022(in millions of Canadian dollars) Actual Plan Fcst Plan Plan Plan Plan PlanSalaries and benefitsPension, other retirement and post-employment benefitsOccupancyAmortization and depreciationMarketing and communicationsProfessional servicesOtherTotal administrative expenses
Productivity Ratio
198 224 225 237 250 264 278 293 37 31 27
26 29 27 29 33 34 36 39 50 63 51 47 42
49 52 52 17 22 23 27 26 26 24 24 26 40 29 39 43
52 53 53 48 58 64 76 81 87 91 94 20 22 39 63 57
549 565 582
27.2% 29.9% 30.6% 33.5% 34.7% 35.4% 35.6% 35.3%
385 458 458 518 532
We are targeting administrative expenses of $518 million for 2018 versus a current forecast for 2017 of $458 million. As previously mentioned, our expenses are increasing to reflect the significant foundational investments we are making in support of our core business. Our overall costs and, in particular, our professional services costs are increasing as a result of the projects we have in place to complete these investments. Items of significance in our administrative expense projections for 2018 and beyond are as follows:
• We continue to invest in compliance related initiatives such as the major change program relating to the build-out of our enterprise risk management framework (ERM). The benefits of our ERM plan will be a strong risk culture of oversight and clear direction, ownership and accountability and the requirement for robust monitoring and reporting.
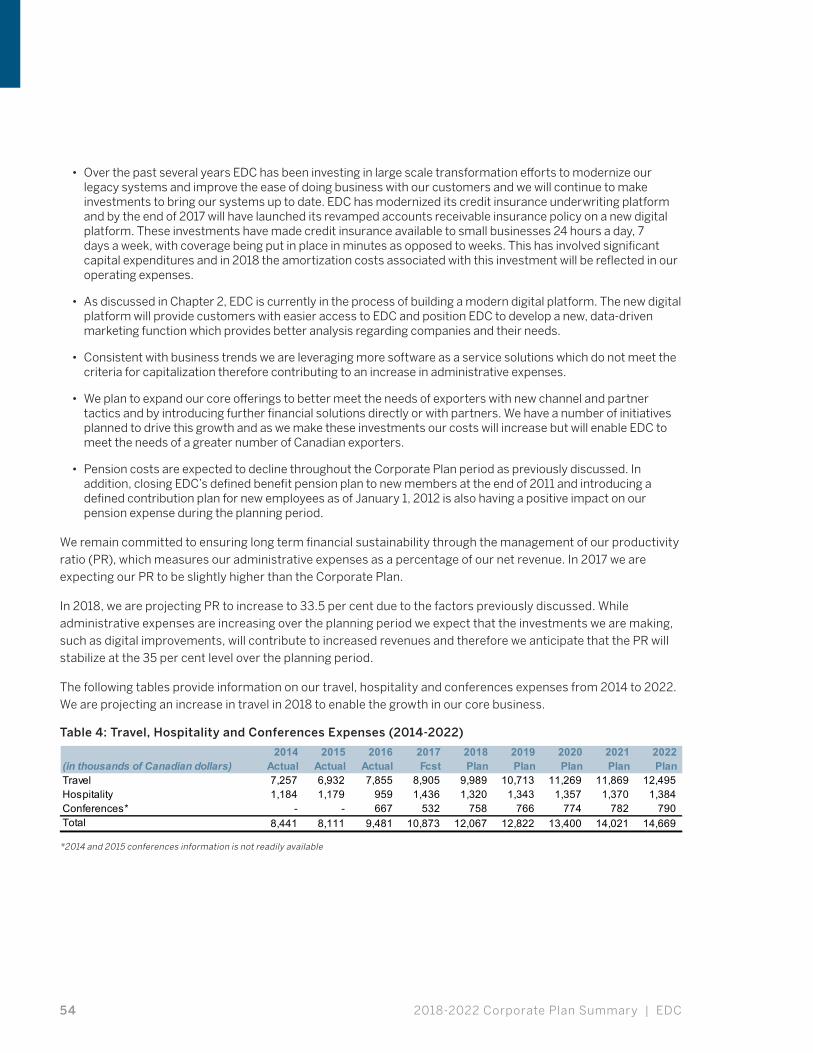
2018-2022 Corporate Plan Summary | EDC54
• Over the past several years EDC has been investing in large scale transformation efforts to modernize our legacy systems and improve the ease of doing business with our customers and we will continue to make investments to bring our systems up to date. EDC has modernized its credit insurance underwriting platform and by the end of 2017 will have launched its revamped accounts receivable insurance policy on a new digital platform. These investments have made credit insurance available to small businesses 24 hours a day, 7 days a week, with coverage being put in place in minutes as opposed to weeks. This has involved significant capital expenditures and in 2018 the amortization costs associated with this investment will be reflected in our operating expenses.
• As discussed in Chapter 2, EDC is currently in the process of building a modern digital platform. The new digital platform will provide customers with easier access to EDC and position EDC to develop a new, data-driven marketing function which provides better analysis regarding companies and their needs.
• Consistent with business trends we are leveraging more software as a service solutions which do not meet the criteria for capitalization therefore contributing to an increase in administrative expenses.
• We plan to expand our core offerings to better meet the needs of exporters with new channel and partner tactics and by introducing further financial solutions directly or with partners. We have a number of initiatives planned to drive this growth and as we make these investments our costs will increase but will enable EDC to meet the needs of a greater number of Canadian exporters.
• Pension costs are expected to decline throughout the Corporate Plan period as previously discussed. In addition, closing EDC’s defined benefit pension plan to new members at the end of 2011 and introducing a defined contribution plan for new employees as of January 1, 2012 is also having a positive impact on our pension expense during the planning period.
We remain committed to ensuring long term financial sustainability through the management of our productivity ratio (PR), which measures our administrative expenses as a percentage of our net revenue. In 2017 we are expecting our PR to be slightly higher than the Corporate Plan.
In 2018, we are projecting PR to increase to 33.5 per cent due to the factors previously discussed. While administrative expenses are increasing over the planning period we expect that the investments we are making, such as digital improvements, will contribute to increased revenues and therefore we anticipate that the PR will stabilize at the 35 per cent level over the planning period.
The following tables provide information on our travel, hospitality and conferences expenses from 2014 to 2022. We are projecting an increase in travel in 2018 to enable the growth in our core business.
Table 4: Travel, Hospitality and Conferences Expenses (2014-2022)
2014 2015 2016 2017 2018 2019 2020 2021 2022(in thousands of Canadian dollars) Actual Actual Actual Fcst Plan Plan Plan Plan PlanTravelHospitalityConferences*Total 12,822 13,400 14,021 14,669 8,441 8,111 9,481 10,873 12,067
766 774 782 790 1,184 1,179 959
- - 667 532 758 1,436 1,320
7,257 6,932 7,855 8,905 9,989 10,713 11,269 11,869 12,495 1,343 1,357 1,370 1,384
*2014 and 2015 conferences information is not readily available
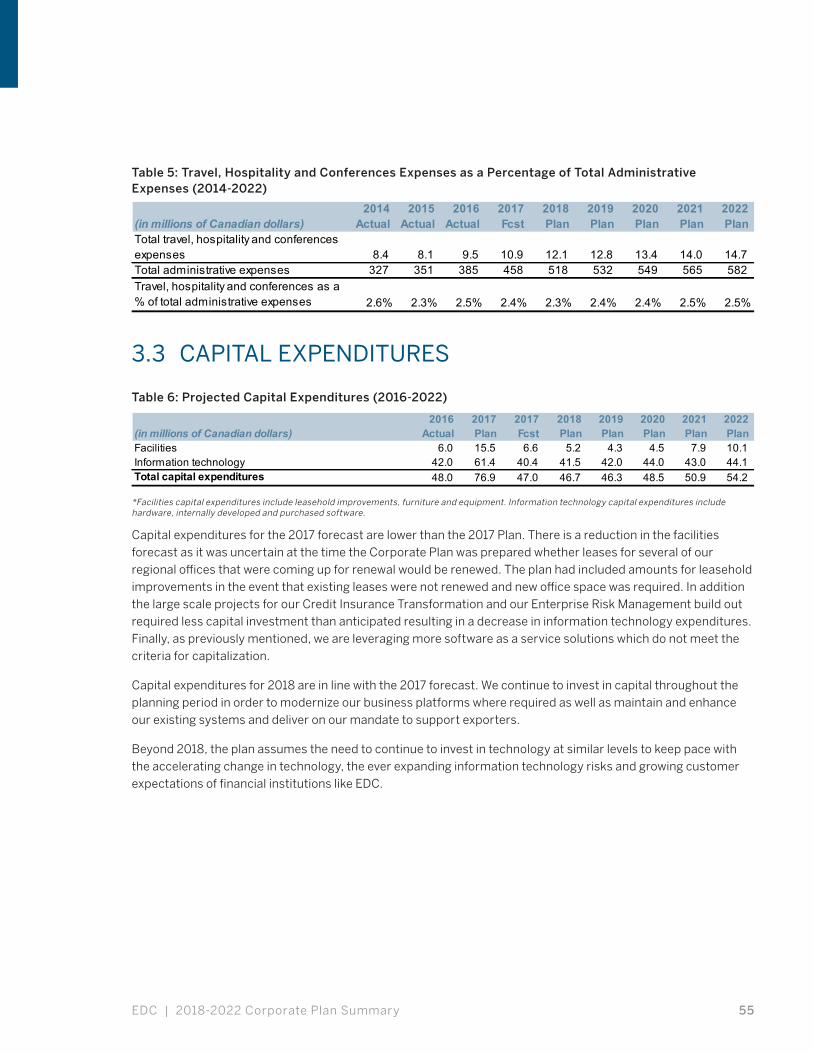
EDC | 2018-2022 Corporate Plan Summary 55
Table 5: Travel, Hospitality and Conferences Expenses as a Percentage of Total Administrative Expenses (2014-2022)
2014 2015 2016 2017 2018 2019 2020 2021 2022(in millions of Canadian dollars) Actual Actual Actual Fcst Plan Plan Plan Plan PlanTotal travel, hospitality and conferences expensesTotal administrative expensesTravel, hospitality and conferences as a% of total administrative expenses
565 582 8.4 8.1 9.5 10.9 12.1 12.8 13.4 14.0 14.7
2.4% 2.4% 2.5% 2.5%
327 351 385
2.6% 2.3% 2.5% 2.4% 2.3%
458 518 532 549
3.3 CAPITAL EXPENDITURES
Table 6: Projected Capital Expenditures (2016-2022)
2016 2017 2017 2018 2019 2020 2021 2022(in millions of Canadian dollars) Actual Plan Fcst Plan Plan Plan Plan PlanFacilitiesInformation technologyTotal capital expenditures
44.0 43.0 44.1 48.0 76.9 47.0 46.7 46.3 48.5 50.9 54.2 42.0 61.4 40.4 41.5 42.0
6.0 15.5 6.6 5.2 4.3 4.5 7.9 10.1
*Facilities capital expenditures include leasehold improvements, furniture and equipment. Information technology capital expenditures include hardware, internally developed and purchased software.
Capital expenditures for the 2017 forecast are lower than the 2017 Plan. There is a reduction in the facilities forecast as it was uncertain at the time the Corporate Plan was prepared whether leases for several of our regional offices that were coming up for renewal would be renewed. The plan had included amounts for leasehold improvements in the event that existing leases were not renewed and new office space was required. In addition the large scale projects for our Credit Insurance Transformation and our Enterprise Risk Management build out required less capital investment than anticipated resulting in a decrease in information technology expenditures. Finally, as previously mentioned, we are leveraging more software as a service solutions which do not meet the criteria for capitalization.
Capital expenditures for 2018 are in line with the 2017 forecast. We continue to invest in capital throughout the planning period in order to modernize our business platforms where required as well as maintain and enhance our existing systems and deliver on our mandate to support exporters.
Beyond 2018, the plan assumes the need to continue to invest in technology at similar levels to keep pace with the accelerating change in technology, the ever expanding information technology risks and growing customer expectations of financial institutions like EDC.
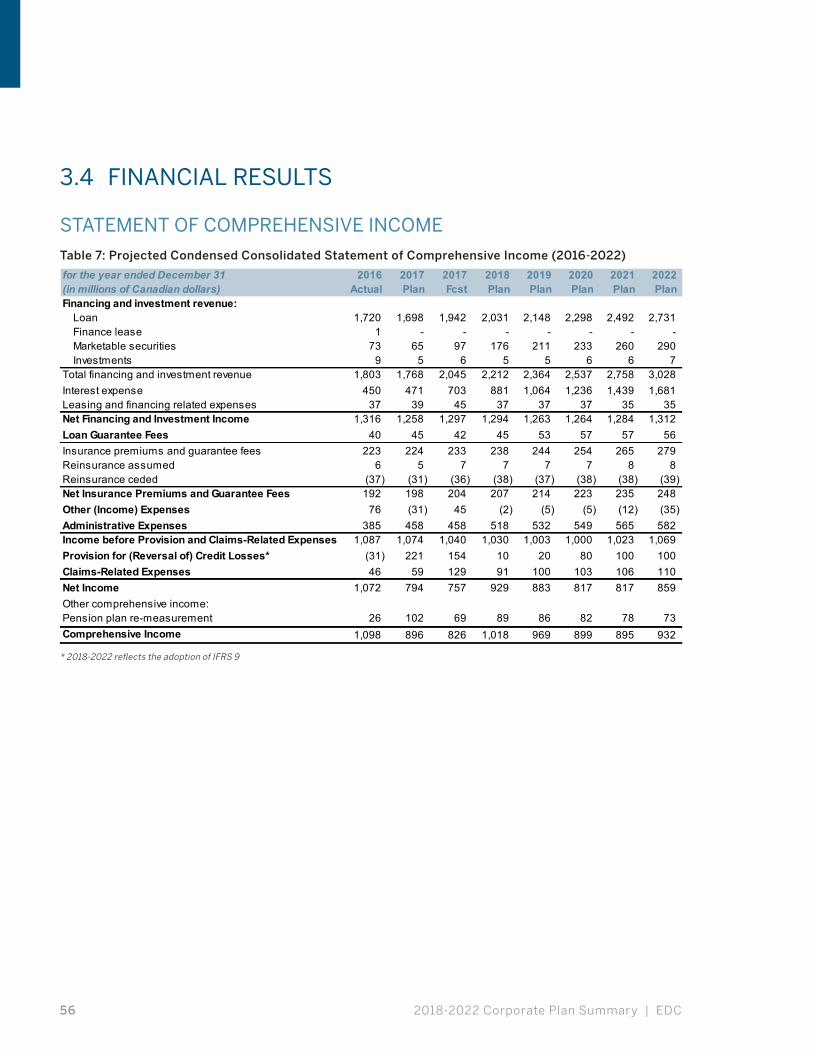
2018-2022 Corporate Plan Summary | EDC56
3.4 FINANCIAL RESULTS
STATEMENT OF COMPREHENSIVE INCOME
Table 7: Projected Condensed Consolidated Statement of Comprehensive Income (2016-2022)
for the year ended December 31 2016 2017 2017 2018 2019 2020 2021 2022(in millions of Canadian dollars) Actual Plan Fcst Plan Plan Plan Plan PlanFinancing and investment revenue:
LoanFinance lease Marketable securitiesInvestments
Total financing and investment revenueInterest expenseLeasing and financing related expensesNet Financing and Investment IncomeLoan Guarantee FeesInsurance premiums and guarantee feesReinsurance assumedReinsurance cededNet Insurance Premiums and Guarantee FeesOther (Income) ExpensesAdministrative ExpensesIncome before Provision and Claims-Related ExpensesProvision for (Reversal of) Credit Losses*Claims-Related ExpensesNet IncomeOther comprehensive income:Pension plan re-measurementComprehensive Income
26 102 69 89 86 82 78 73 1,098 896 826 1,018 969 899 895 932
46 59 129 91 100 103 106 110 1,072 794 757 929 883 817 817 859
1,087 1,074 1,040 1,030 1,003 1,000 1,023 1,069 (31) 221 154 10 20 80 100 100
76 (31) 45 (2) (5) (5) (12) (35) 385 458 458 518 532 549 565 582
(37) (31) (36) (38) (37) (38) (38) (39) 192 198 204 207 214 223 235 248
223 224 233 238 244 254 265 279 6 5 7 7 7 7 8 8
1,316 1,258 1,297 1,294 1,263 1,264 1,284 1,312 40 45 42 45 53 57 57 56
450 471 703 881 1,064 1,236 1,439 1,681 37 39 45 37 37 37 35 35
9 5 6 5 5 6 6 7 1,803 1,768 2,045 2,212 2,364 2,537 2,758 3,028
1 - - - - - - - 73 65 97 176 211 233 260 290
1,720 1,698 1,942 2,031 2,148 2,298 2,492 2,731
* 2018-2022 reflects the adoption of IFRS 9
EDC | 2018-2022 Corporate Plan Summary 57
2017 FORECAST VERSUS 2017 CORPORATE PLAN
We are forecasting net income of $757 million for 2017, a decrease of $37 million from the 2017 Corporate Plan. Items of note regarding this forecast are as follows:
• Other expense is forecast to be $45 million compared to income of $31 million in the 2017 Corporate Plan. The increase in other expense is mainly due to realized losses on loan asset sales that were not contemplated in the Plan, a reduction in the forecast for realized gains on investments and the volatility associated with our financial instruments carried at fair value.
• Claims-related expenses have increased by $70 million mainly due to higher than anticipated net claims paid for credit insurance products and the impact of the increase in the forecast for political risk insurance business facilitated on the allowance for insurance claims.
• We are projecting a provision charge of $154 million, $67 million lower when compared to the Corporate Plan. The decrease is mainly due to higher loan prepayments than contemplated in the Plan and risk transfer transactions in the mining sector that were undertaken in order to mitigate credit risk. The decrease in provision for credit losses from these items is tempered by downward credit migration in the aerospace and surface transportation sectors.
• Net financing and investment income has increased by $39 million when compared to the Plan mainly due to higher yields on loan disbursements in the second half of 2016 than anticipated in the Plan.
• Other comprehensive income has decreased by $33 million when compared to Corporate Plan as the 2017 forecast is projecting the discount rate to remain constant whereas we anticipated an increase in the 2017 Plan. The impact of the discount rate remaining flat is partially offset by a higher return on assets than projected in the Plan.
2018 CORPORATE PLAN VERSUS 2017 FORECAST
We are anticipating that interest rates will rise from 2018 to 2022, thereby increasing both loan revenue and interest expense. Over this time period, we are projecting net financing and investment income to remain consistent when compared to 2017. We are projecting a decrease in the overall yield on our loan portfolio as the forecast for the spreads on our new loans are lower than the spreads on the loans coming off our books. The impact of this decrease in yields is tempered by an increase in business facilitated in our financing and investments program by $8.4 billion over 2017.
The planned net income for 2018 is $929 million, which is an increase of $172 million from 2017.
• Provision for credit losses is projected to decrease primarily due to downward credit migration forecast for 2017, mainly in the aerospace and surface transportation sectors that is not anticipated to recur in 2018.
• Other income of $2 million is forecast for 2018 compared to other expense of $45 million in 2017 due to unrealized losses on our financial instruments during the first half of 2017 as previously discussed, and a decrease in the forecast for realized losses on loan asset sales.
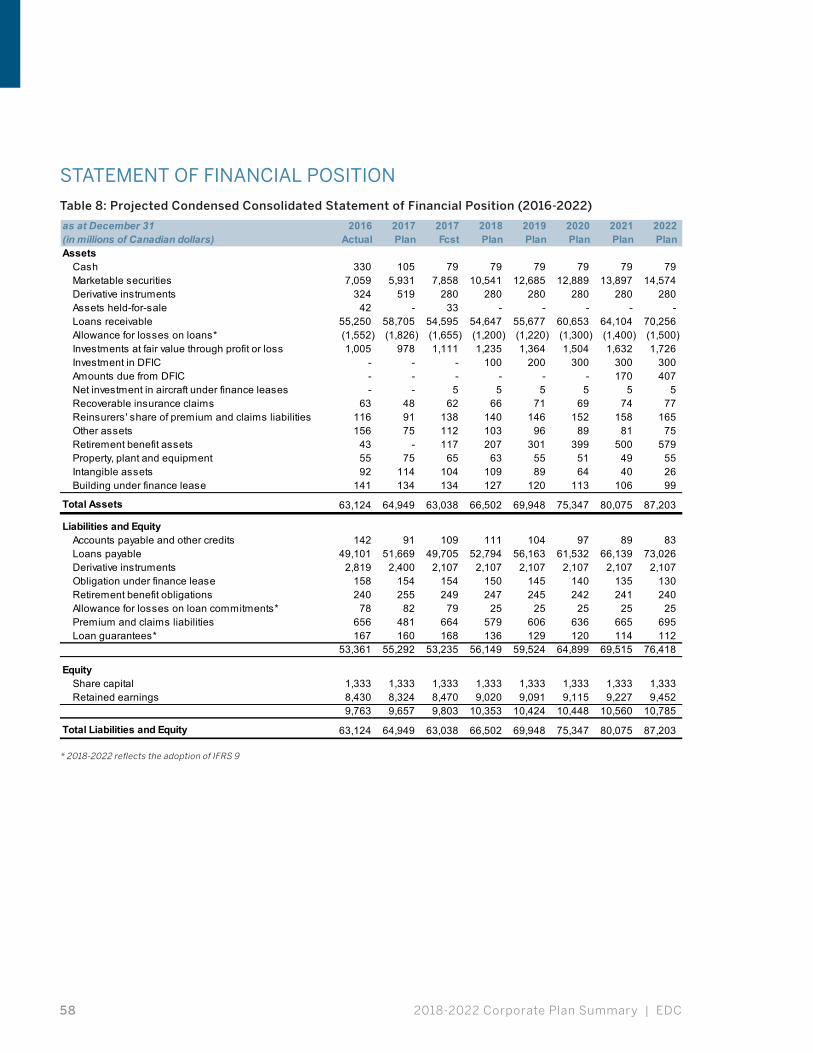
2018-2022 Corporate Plan Summary | EDC58
STATEMENT OF FINANCIAL POSITION
Table 8: Projected Condensed Consolidated Statement of Financial Position (2016-2022)
as at December 31 2016 2017 2017 2018 2019 2020 2021 2022(in millions of Canadian dollars) Actual Plan Fcst Plan Plan Plan Plan PlanAssets
CashMarketable securitiesDerivative instrumentsAssets held-for-saleLoans receivableAllowance for losses on loans*Investments at fair value through profit or lossInvestment in DFICAmounts due from DFICNet investment in aircraft under finance leasesRecoverable insurance claimsReinsurers' share of premium and claims liabilitiesOther assetsRetirement benefit assetsProperty, plant and equipmentIntangible assetsBuilding under finance lease
Total Assets
Liabilities and EquityAccounts payable and other creditsLoans payableDerivative instrumentsObligation under finance leaseRetirement benefit obligationsAllowance for losses on loan commitments*Premium and claims liabilities Loan guarantees*
EquityShare capitalRetained earnings
Total Liabilities and Equity
330 105 79 79 79 79 79 79 7,059 5,931 7,858 10,541 12,685 12,889 13,897 14,574
324 519 280 280 280 280 280 280 42 - 33 - - - - -
55,250 58,705 54,595 54,647 55,677 60,653 64,104 70,256 (1,552) (1,826) (1,655) (1,200) (1,220) (1,300) (1,400) (1,500) 1,005 978 1,111 1,235 1,364 1,504 1,632 1,726
- - - 100 200 300 300 300 - - - - - - 170 407 - - 5 5 5 5 5 5
63 48 62 66 71 69 74 77 116 91 138 140 146 152 158 165 156 75 112 103 96 89 81 75
43 - 117 207 301 399 500 579 55 75 65 63 55 51 49 55 92 114 104 109 89 64 40 26
141 134 134 127 120 113 106 99
63,124 64,949 63,038 66,502 69,948 75,347 80,075 87,203
142 91 109 111 104 97 89 83 49,101 51,669 49,705 52,794 56,163 61,532 66,139 73,026
2,819 2,400 2,107 2,107 2,107 2,107 2,107 2,107 158 154 154 150 145 140 135 130 240 255 249 247 245 242 241 240
78 82 79 25 25 25 25 25 656 481 664 579 606 636 665 695 167 160 168 136 129 120 114 112
53,361 55,292 53,235 56,149 59,524 64,899 69,515 76,418
1,333 1,333 1,333 1,333 1,333 1,333 1,333 1,333 8,430 8,324 8,470 9,020 9,091 9,115 9,227 9,452 9,763 9,657 9,803 10,353 10,424 10,448 10,560 10,785
63,124 64,949 63,038 66,502 69,948 75,347 80,075 87,203
* 2018-2022 reflects the adoption of IFRS 9
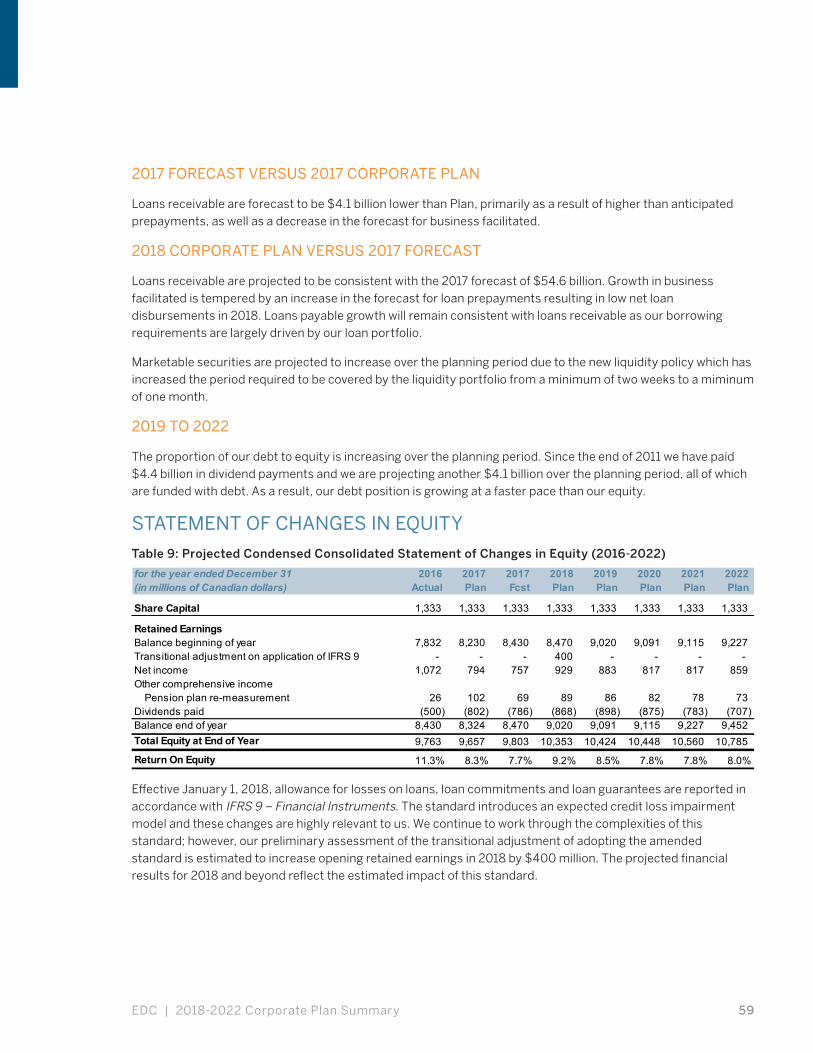
EDC | 2018-2022 Corporate Plan Summary 59
2017 FORECAST VERSUS 2017 CORPORATE PLAN
Loans receivable are forecast to be $4.1 billion lower than Plan, primarily as a result of higher than anticipated prepayments, as well as a decrease in the forecast for business facilitated.
2018 CORPORATE PLAN VERSUS 2017 FORECAST
Loans receivable are projected to be consistent with the 2017 forecast of $54.6 billion. Growth in business facilitated is tempered by an increase in the forecast for loan prepayments resulting in low net loan disbursements in 2018. Loans payable growth will remain consistent with loans receivable as our borrowing requirements are largely driven by our loan portfolio.
Marketable securities are projected to increase over the planning period due to the new liquidity policy which has increased the period required to be covered by the liquidity portfolio from a minimum of two weeks to a miminum of one month.
2019 TO 2022
The proportion of our debt to equity is increasing over the planning period. Since the end of 2011 we have paid $4.4 billion in dividend payments and we are projecting another $4.1 billion over the planning period, all of which are funded with debt. As a result, our debt position is growing at a faster pace than our equity.
STATEMENT OF CHANGES IN EQUITY
Table 9: Projected Condensed Consolidated Statement of Changes in Equity (2016-2022)
for the year ended December 31 2016 2017 2017 2018 2019 2020 2021 2022(in millions of Canadian dollars) Actual Plan Fcst Plan Plan Plan Plan Plan
Share Capital
Retained EarningsBalance beginning of yearTransitional adjustment on application of IFRS 9 - - - - - - - Net incomeOther comprehensive income
Pension plan re-measurementDividends paidBalance end of yearTotal Equity at End of Year
Return On Equity 7.8% 7.8% 8.0%11.3% 8.3% 7.7% 9.2% 8.5%
9,763 9,657 9,803 10,353 10,424 10,448 10,560 10,785
(875) (783) (707) 8,430 8,324 8,470 9,020 9,091 9,115 9,227 9,452 (500) (802) (786) (868) (898)
26 102 69 89 86 82 78 73
9,091 9,115 9,227 400
1,072 794 757 929 883 817 817 859
7,832 8,230 8,430 8,470 9,020
1,333 1,333 1,333 1,333 1,333 1,333 1,333 1,333
Effective January 1, 2018, allowance for losses on loans, loan commitments and loan guarantees are reported in accordance with IFRS 9 – Financial Instruments. The standard introduces an expected credit loss impairment model and these changes are highly relevant to us. We continue to work through the complexities of this standard; however, our preliminary assessment of the transitional adjustment of adopting the amended standard is estimated to increase opening retained earnings in 2018 by $400 million. The projected financial results for 2018 and beyond reflect the estimated impact of this standard.
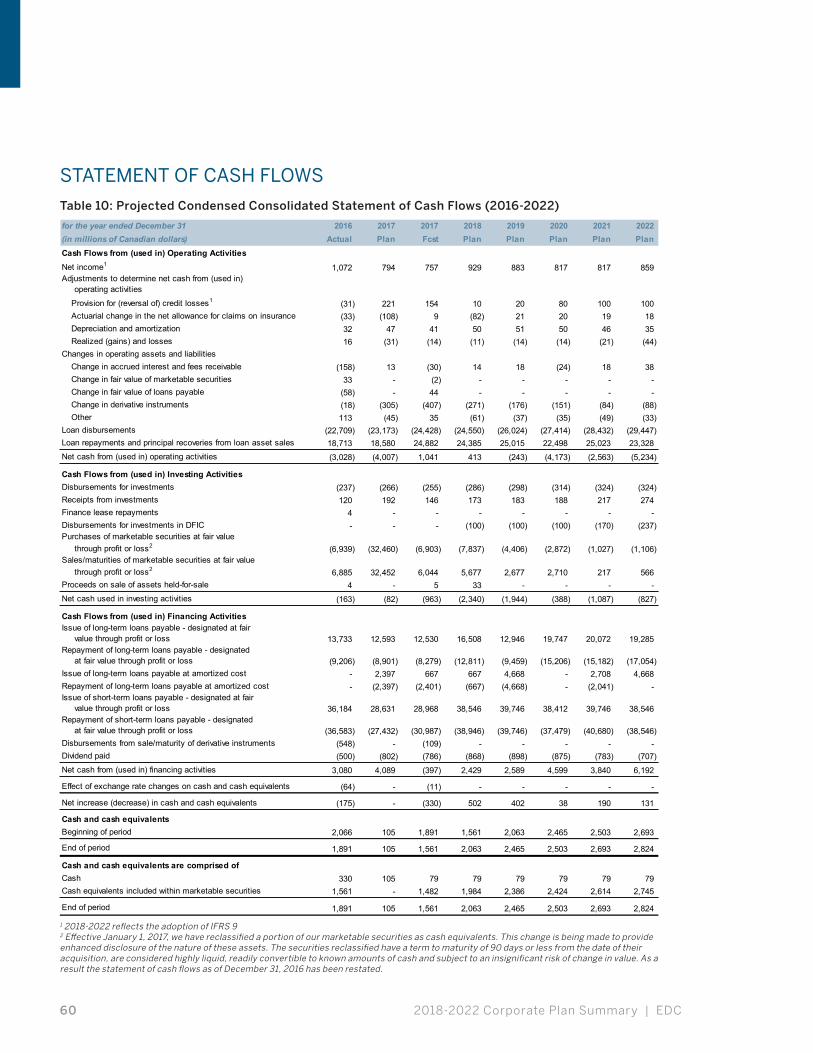
2018-2022 Corporate Plan Summary | EDC60
STATEMENT OF CASH FLOWS
Table 10: Projected Condensed Consolidated Statement of Cash Flows (2016-2022)
for the year ended December 31 2016 2017 2017 2018 2019 2020 2021 2022(in millions of Canadian dollars) Actual Plan Fcst Plan Plan Plan Plan PlanCash Flows from (used in) Operating ActivitiesNet income1
Adjustments to determine net cash from (used in) operating activities
Provision for (reversal of) credit losses1
Actuarial change in the net allowance for claims on insuranceDepreciation and amortizationRealized (gains) and losses
Changes in operating assets and liabilitiesChange in accrued interest and fees receivableChange in fair value of marketable securitiesChange in fair value of loans payableChange in derivative instrumentsOther
Loan disbursementsLoan repayments and principal recoveries from loan asset sales
Net cash from (used in) operating activities
Cash Flows from (used in) Investing ActivitiesDisbursements for investmentsReceipts from investmentsFinance lease repaymentsDisbursements for investments in DFICPurchases of marketable securities at fair value through profit or loss2
Sales/maturities of marketable securities at fair value through profit or loss2
Proceeds on sale of assets held-for-sale
Net cash used in investing activities
Cash Flows from (used in) Financing ActivitiesIssue of long-term loans payable - designated at fair value through profit or lossRepayment of long-term loans payable - designated at fair value through profit or lossIssue of long-term loans payable at amortized costRepayment of long-term loans payable at amortized costIssue of short-term loans payable - designated at fair value through profit or lossRepayment of short-term loans payable - designated at fair value through profit or lossDisbursements from sale/maturity of derivative instrumentsDividend paid
Net cash from (used in) financing activities
Effect of exchange rate changes on cash and cash equivalents
Net increase (decrease) in cash and cash equivalents
Cash and cash equivalentsBeginning of period
End of period
Cash and cash equivalents are comprised ofCashCash equivalents included within marketable securities
End of period
1,072 794 757 929 883 817 817 859
(31) 221 154 10 20 80 100 100 (33) (108) 9 (82) 21 20 19 18 32 47 41 50 51 50 46 35 16 (31) (14) (11) (14) (14) (21) (44)
(158) 13 (30) 14 18 (24) 18 38 33 - (2) - - - - -
(58) - 44 - - - - - (18) (305) (407) (271) (176) (151) (84) (88) 113 (45) 35 (61) (37) (35) (49) (33)
(22,709) (23,173) (24,428) (24,550) (26,024) (27,414) (28,432) (29,447) 18,713 18,580 24,882 24,385 25,015 22,498 25,023 23,328
(3,028) (4,007) 1,041 413 (243) (4,173) (2,563) (5,234)
(237) (266) (255) (286) (298) (314) (324) (324) 120 192 146 173 183 188 217 274
4 - - - - - - - - - - (100) (100) (100) (170) (237)
(6,939) (32,460) (6,903) (7,837) (4,406) (2,872) (1,027) (1,106)
6,885 32,452 6,044 5,677 2,677 2,710 217 566 4 - 5 33 - - - -
(163) (82) (963) (2,340) (1,944) (388) (1,087) (827)
13,733 12,593 12,530 16,508 12,946 19,747 20,072 19,285
(9,206) (8,901) (8,279) (12,811) (9,459) (15,206) (15,182) (17,054) - 2,397 667 667 4,668 - 2,708 4,668 - (2,397) (2,401) (667) (4,668) - (2,041) -
36,184 28,631 28,968 38,546 39,746 38,412 39,746 38,546
(36,583) (27,432) (30,987) (38,946) (39,746) (37,479) (40,680) (38,546) (548) - (109) - - - - - (500) (802) (786) (868) (898) (875) (783) (707)
3,080 4,089 (397) 2,429 2,589 4,599 3,840 6,192
(64) - (11) - - - - -
(175) - (330) 502 402 38 190 131
2,066 105 1,891 1,561 2,063 2,465 2,503 2,693
1,891 105 1,561 2,063 2,465 2,503 2,693 2,824
330 105 79 79 79 79 79 79 1,561 - 1,482 1,984 2,386 2,424 2,614 2,745
1,891 105 1,561 2,063 2,465 2,503 2,693 2,824
1 2018-2022 reflects the adoption of IFRS 9 2 Effective January 1, 2017, we have reclassified a portion of our marketable securities as cash equivalents. This change is being made to provide enhanced disclosure of the nature of these assets. The securities reclassified have a term to maturity of 90 days or less from the date of their acquisition, are considered highly liquid, readily convertible to known amounts of cash and subject to an insignificant risk of change in value. As a result the statement of cash flows as of December 31, 2016 has been restated.
EDC | 2018-2022 Corporate Plan Summary 61
ACCOUNTING POLICIES AND FUTURE ACCOUNTING CHANGES
The accounting policies used in the preparation of this Financial Plan are in accordance with International Financial Reporting Standards (IFRS). The earnings of the corporation and its subsidiary are not subject to the requirements of the Income Tax Act.
AMENDED AND EVOLVING STANDARDS
The International Accounting Standards Board (IASB) has a number of projects underway, some of which will affect the standards relevant to EDC.
IFRS 16 – Leases – In January 2016, the IASB released the new Leases Standard requiring lessees to recognize assets and liabilities for the rights and obligations created by leases. The standard is expected to have a minimal impact on EDC’s financial statements and is effective for reporting periods beginning on or after January 1, 2019. The impact of this standard has not been incorporated in the Corporate Plan.
IFRS 17 – Insurance Contracts – In May 2017, the IASB issued IFRS 17 which establishes recognition, measurement, presentation, and disclosure requirements of insurance contacts. The standard ensures entities provide relevant information that faithfully represents those contracts. The standard is expected to have a significant impact on our financial statements and is effective for reporting periods beginning on or after January 1, 2021. The impact of this standard has not been incorporated in the Corporate Plan.
RISK MANAGEMENT
For a comprehensive discussion on our risk management, please refer to pages 68-76 of our 2016 Annual Report.
2018-2022 Corporate Plan Summary | EDC62
3.5 CAPITAL MANAGEMENT
CAPITAL ADEQUACY POLICY (CAP)
As a financial institution, EDC efficiently manages its capital through the Board-approved CAP in order to be able to meet the demands of current and future business while maintaining the ability to withstand future, unpredictable risks. This is a key governance mechanism for both management and the shareholder.
A key principle of our CAP is the establishment of a target solvency standard for EDC that determines the level of capital that is required to cover our exposures even in exceptional circumstances. As a corporation, we target the maintenance of a AA solvency rating, consistent with the level targeted by leading financial institutions. Maintaining a AA target solvency rating ensures that our capital position is strong enough to enable us to remain a self-sustaining Crown corporation and to contribute, in a positive manner, to Canada’s bottom line. Our capital position is also subject to downside vulnerabilities, and a AA target provides an appropriate level of resilience to the risks we take on in order to fulfill our mandate.
As was mentioned last year, EDC developed a new capital management framework under the Internal Capital Adequacy Assessment Process (ICAAP) which came into effect on December 31, 2016. This was complemented by an initiative led by the Department of Finance, in tandem with the financial Crowns, to develop a common capital and dividend framework. This lead to the introduction of capital set aside for pension plan risk, the introduction of correlation in the modeling of credit risk, a redefinition of a business/strategic risk component, and a redefinition of capital supply more in line with industry standards.

EDC | 2018-2022 Corporate Plan Summary 63
Table 11: Projected Capital Position (2017-2022)
2017 2018 2019 2020 2021 2022(in millions of Canadian dollars) Fcst Plan Plan Plan Plan PlanCredit riskMarket riskOperational riskTotal pillar I risks
Strategic riskPension plan riskTotal pillar II risks
Total economic capital
Capital reserved for strategic initiativesCapital reserved to withstand a stressed periodTotal capital demand
Supply of capital
Capital surplus/ (deficit)
EDC target rating
EDC implied solvency rating AAA AAA AAA AAA AAA AAA
AA AA AA AA AA AA
4,339 4,490 4,373 3,915 3,533 3,178
5,464 5,863 6,051 6,533 7,027 7,607
9,803 10,353 10,424 10,448 10,560 10,785
- - - - - - - - - - - -
944 980 997 1,041 1,086 1,139
5,464 5,863 6,051 6,533 7,027 7,607
452 488 505 549 594 647 492 492 492 492 492 492
238 238 238 238 238 238 4,520 4,883 5,054 5,492 5,941 6,468
3,325 3,669 3,951 4,373 4,840 5,352 957 976 865 881 863 878
In order to better understand the drivers behind EDC’s capital demand from a macro-economic perspective, the following two tables show a historical breakdown along both a geographical and industry lens. The redistribution of risk from both a geographical and industry perspective at year-end 2016 was driven by the new capital methodology.
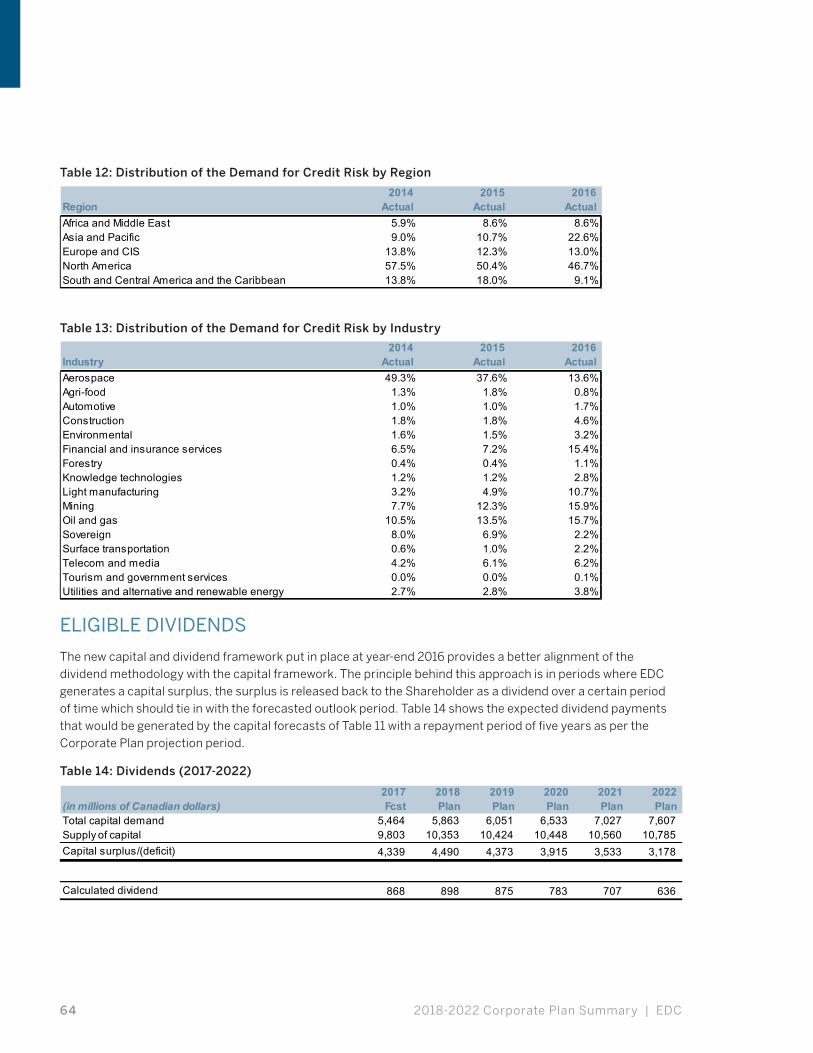
2018-2022 Corporate Plan Summary | EDC64
Table 12: Distribution of the Demand for Credit Risk by Region
2014 2015 2016Region Actual Actual ActualAfrica and Middle EastAsia and PacificEurope and CISNorth AmericaSouth and Central America and the Caribbean 13.8% 18.0% 9.1%
13.8% 12.3% 13.0%57.5% 50.4% 46.7%
5.9% 8.6% 8.6%9.0% 10.7% 22.6%
Table 13: Distribution of the Demand for Credit Risk by Industry
2014 2015 2016Industry Actual Actual ActualAerospaceAgri-foodAutomotiveConstructionEnvironmentalFinancial and insurance servicesForestryKnowledge technologiesLight manufacturingMiningOil and gasSovereignSurface transportationTelecom and mediaTourism and government servicesUtilities and alternative and renewable energy
0.0% 0.0% 0.1%2.7% 2.8% 3.8%
0.6% 1.0% 2.2%4.2% 6.1% 6.2%
10.5% 13.5% 15.7%8.0% 6.9% 2.2%
3.2% 4.9% 10.7%7.7% 12.3% 15.9%
0.4% 0.4% 1.1%1.2% 1.2% 2.8%
1.6% 1.5% 3.2%6.5% 7.2% 15.4%
1.0% 1.0% 1.7%1.8% 1.8% 4.6%
49.3% 37.6% 13.6%1.3% 1.8% 0.8%
ELIGIBLE DIVIDENDS
The new capital and dividend framework put in place at year-end 2016 provides a better alignment of the dividend methodology with the capital framework. The principle behind this approach is in periods where EDC generates a capital surplus, the surplus is released back to the Shareholder as a dividend over a certain period of time which should tie in with the forecasted outlook period. Table 14 shows the expected dividend payments that would be generated by the capital forecasts of Table 11 with a repayment period of five years as per the Corporate Plan projection period.
Table 14: Dividends (2017-2022)
2017 2018 2019 2020 2021 2022(in millions of Canadian dollars) Fcst Plan Plan Plan Plan PlanTotal capital demandSupply of capitalCapital surplus/(deficit)
Calculated dividend
5,464 5,863 6,051 6,533 7,027 7,607 10,785
4,339 4,490 4,373 3,915 3,533 3,178 9,803 10,353 10,424 10,448 10,560
636 868 898 875 783 707
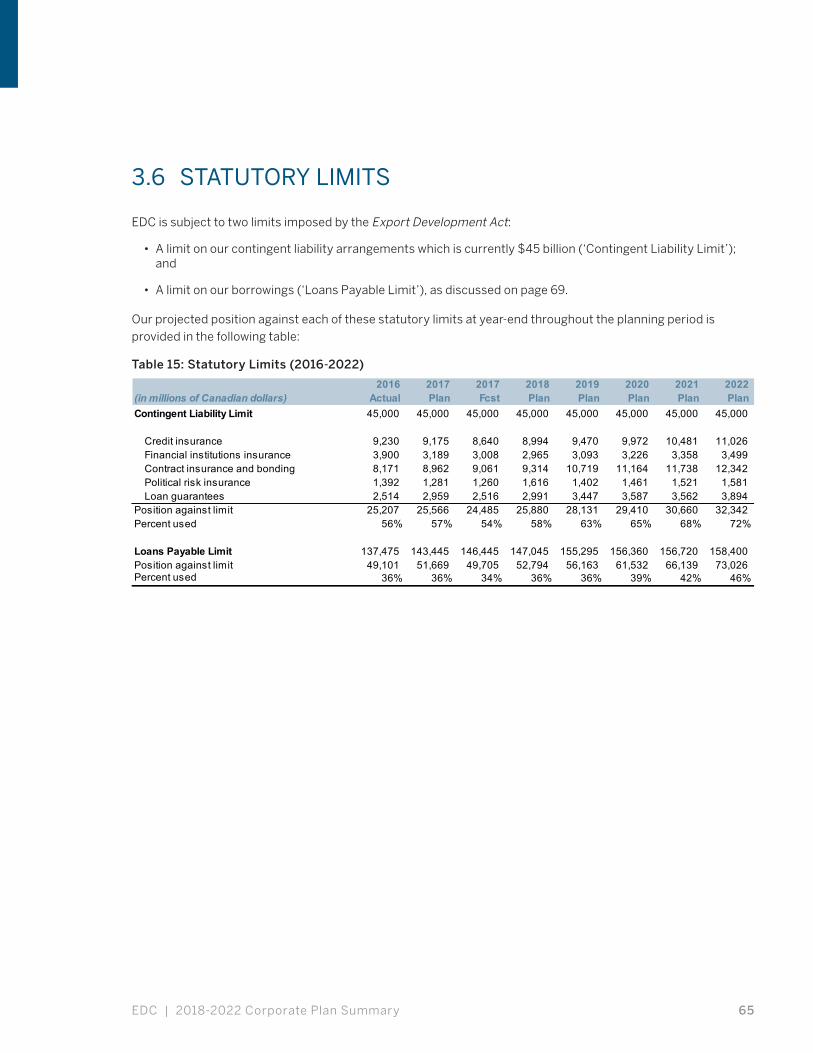
EDC | 2018-2022 Corporate Plan Summary 65
3.6 STATUTORY LIMITS
EDC is subject to two limits imposed by the Export Development Act:
• A limit on our contingent liability arrangements which is currently $45 billion (‘Contingent Liability Limit’); and
• A limit on our borrowings (‘Loans Payable Limit’), as discussed on page 69.
Our projected position against each of these statutory limits at year-end throughout the planning period is provided in the following table:
Table 15: Statutory Limits (2016-2022)
2016 2017 2017 2018 2019 2020 2021 2022(in millions of Canadian dollars) Actual Plan Fcst Plan Plan Plan Plan PlanContingent Liability Limit
Credit insuranceFinancial institutions insuranceContract insurance and bondingPolitical risk insuranceLoan guarantees
Position against limitPercent used
Loans Payable LimitPosition against limitPercent used
45,000 45,000 45,000 45,000 45,000 45,000 45,000 45,000
9,230 9,175 8,640 8,994 9,470 9,972 10,481 11,026 3,900 3,189 3,008 2,965 3,093 3,226 3,358 3,499 8,171 8,962 9,061 9,314 10,719 11,164 11,738 12,342 1,392 1,281 1,260 1,616 1,402 1,461 1,521 1,581 2,514 2,959 2,516 2,991 3,447 3,587 3,562 3,894
25,207 25,566 24,485 25,880 28,131 29,410 30,660 32,342 56% 57% 54% 58% 63% 65% 68% 72%
36% 36% 34% 36% 36% 39% 42% 46%
137,475 143,445 146,445 147,045 155,295 156,360 156,720 158,400 49,101 51,669 49,705 52,794 56,163 61,532 66,139 73,026
2018-2022 Corporate Plan Summary | EDC66
3.7 ASSET/LIABILITY MANAGEMENT AND BORROWING STRATEGIES
In accordance with the Export Development Act and the Financial Administration Act, we raise our funding requirements in international and domestic capital markets by borrowing, which includes issuing bonds and commercial paper.
ASSET/LIABILITY AND MARKET RISK MANAGEMENT
We manage our exposures to interest rate, foreign exchange and credit risks arising from our Treasury operations through a policy framework, including risk and liquidity limits. Our policies are consistent with industry practices, approved by our Board of Directors and are compliant with the Minister of Finance’s Financial Risk Management Guidelines for Crown Corporations.
Market risks to which we are exposed include movements in interest rates and the impact they have on our book of assets and our liability positions, as well as foreign exchange risk as we report our financial results and maintain our capital position in Canadian dollars, whereas our asset book and much of our liabilities are in U.S. dollars or other currencies.
Credit risk from Treasury activities arises from two sources: marketable securities and derivatives. In each case, there is a risk that the counterparty will not repay in accordance with contractual terms. The Board-approved Market Risk Management Policy establishes minimum counterparty credit rating requirements and maximum exposure limits for the management of credit risk. We also use other credit mitigation techniques to assist in credit exposure management. EDC has a collateral program in which Treasury swap counterparties pledge highly rated sovereign debt from any of Canada, the United States, Great Britain, France and/or Germany, which typically offset a major portion of our credit exposure.
We continually monitor our exposure to movements in interest rates and foreign exchange rates as well as counterparty credit exposures. Positions against policy limits are reported on a monthly basis and any policy breach is immediately reported directly to the Chair of the Board of Directors. Our Asset Liability Committee meets, at least quarterly, to review current and future compliance with the corporation’s Market Risk Management policies. Our market risk positions are reported quarterly to the Risk Management Committee of the Board of Directors.
BORROWING STRATEGIES
STATUTORY BORROWING AUTHORITIES
EDC’s funding activities are governed by sections 12, 13 and 14 of the Export Development Act and section 127 of the Financial Administration Act. The activities must also comply with the Minister of Finance’s Financial Risk Management Guidelines for Crown Corporations.
EDC’s funding activities will also be governed by section 4 of the Borrowing Authority Act once this Act comes into force. Under this Act, borrowings by agent corporations, including EDC, in conjunction with borrowings by the Minister of Finance must not at any time exceed CAD 1.168 trillion. EDC will report its borrowings to the Minister of Finance to comply with the Act.
EDC | 2018-2022 Corporate Plan Summary 67
The Export Development Act permits us to borrow and have outstanding loans payable up to a maximum of 15 times the aggregate of our current paid in capital and retained earnings as determined by the audited financial statements for the previous year. Based on the 2017 forecast, the maximum borrowing limit allowable under this Act for 2018 is estimated at $147 billion, compared to forecast loans payable at the end of 2018 of $52.8 billion.
In accordance with subsection 127(3) of the Financial Administration Act, EDC requires the approval of the Minister of Finance to enter into any particular transaction to borrow money, including the time and the terms and conditions of the transaction. We obtain Minister of Finance approval annually for our capital and money markets borrowing plans. Annual Board resolutions permit us to operate within the authorities prescribed by the Minister.
Occasionally, as a result of unforeseen financial market conditions or unexpected variances in approved corporate activity, there may be a need to amend the terms and conditions of the borrowing plans. In such instances, we will continue to seek the approval of the Minister of Finance and report on any associated changes in the Corporate Plan.
Should market conditions warrant, we could also request access to the Consolidated Revenue Fund (CRF). Minister of Finance authority to access the CRF is sought as part of the annual short-term and long-term borrowing approval process.
EDC may be called upon to respond to unanticipated events and may need to borrow sums of money beyond its annual borrowing plan. Under section 127(3) of the Financial Administration Act, EDC may seek additional borrowing authority from the Minister of Finance provided its total indebtedness outstanding at any time in respect of such borrowings does not exceed any statutory limit.
DEVELOPMENT FINANCE INITIATIVE
Pursuant to the corporation’s expanded mandate under section 10(1)(c) of the amended Export Development Act, the Development Finance Institute Canada (DFIC) Inc. has been incorporated as a wholly owned subsidiary of EDC. EDC will capitalize DFIC with CAD 100 million in each of 2018, 2019 and 2020. EDC may provide debt financing to DFIC. EDC Treasury will leverage its expertise to undertake all borrowing, investing, hedging and foreign exchange activities on behalf of DFIC.
BORROWING APPROACH
The objective of our funding programs is to ensure that commitments are met within the parameters of our Liquidity Policy and Risk Management Guidelines. Funding requirements are determined from a base amount as established in the Corporate Plan, adding a buffer for increased needs due to stressed market conditions or additional new business demand.
We issue commercial paper (CP) to meet operating requirements and may, in cases of restricted capital markets access, issue CP to fund long-term requirements for short durations. We issue capital market debt to meet requirements for maturing debt, our loan asset portfolio, the liquidity portfolio, DFI related funding and future lending activities. The Treasury team seeks to maximize market access and flexibility, price debt issues fairly in the primary market and closely monitor secondary market performance to minimize debt service costs. The team also seeks to take advantage of opportunities to raise funds in currencies which match the currencies of our assets.
2018-2022 Corporate Plan Summary | EDC68
Derivatives are used as part of the asset/liability management process. Our policies prohibit the issuance of any financial instrument, derivative, or structured note whose value and hence financial risk cannot be calculated, monitored and managed on a timely basis.
The execution of the borrowing and liquidity strategies is monitored on a daily basis by the Treasury team’s management. Monthly reports are provided to senior management and quarterly reports are provided to the Audit Committee of the Board.
SOURCES OF FINANCING
MONEY MARKETS BORROWING PROGRAM
We issue commercial paper in the money markets, in various currencies under multiple platforms for cash management purposes to fund our short-term financial commitments as well as to manage interruptions in capital markets access and unpredictable cash flow demands.
The Liquidity Policy requires the liquidity portfolio to meet anticipated cash requirements. In 2018, our liquidity policy will increase the period required to be covered by the liquidity portfolio, from a minimum of two weeks to a minimum of one month, on a daily basis during a liquidity event. Forecast cash requirements will be calculated using a one month rolling forecast which includes operations, loan disbursements, a portion of undrawn revolver commitments, and short- and long-term debt maturities. The target size of the USD component of our liquidity portfolio will be U.S. $7.5 billion. This target is based on a forecasted cash requirement under the policy which averages U.S. $7.0 billion. We will also maintain a CAD component of the liquidity portfolio with a target size of CAD $300 - 500 million. In addition, a daily minimum U.S. $2.0 billion of unused CP capacity will be required.
CAPITAL MARKETS BORROWING PROGRAM
The capital markets borrowing program diversifies its funding sources by offering debt securities to investors worldwide. Typical capital markets instruments include, but are not limited to: benchmark global bonds, plain vanilla bonds, structured and medium-term notes.
Structured and medium-term notes may be used to smooth the maturity profile, respond to investor demand or access local currency funding in priority emerging markets. These notes can be issued in a variety of maturities including maturities of under one year as well as longer-dated issues with callable features. Longer-dated callable instruments are swapped into floating or fixed rate obligations. The mix of funding is guided by numerous factors including relative cost, market conditions and the profile of the loan assets portfolio.
TOTAL BORROWINGS – NEW AND OUTSTANDING
2017 BORROWINGS
As at August 31, 2017, we have issued U.S. $6.55 billion in long term debt compared to the Minister of Finance approved 2017 maximum of U.S. $14.3 billion. Commercial paper outstanding amounted to U.S. $6.38 billion as at August 31, 2017 compared to the Minister of Finance authorized 2017 maximum of U.S. $14.0 billion. 2017 long term borrowing is forecast to be CAD $1.8 billion lower than the 2017 Plan due to lower than anticipated net loan disbursements. 2017 short-term borrowing outstanding at year end is forecast to be CAD $0.8 billion lower than the 2017 Plan reflecting lower net disbursements partially offset by prefunding of the 2018 increase in the Liquidity Portfolio.
EDC | 2018-2022 Corporate Plan Summary 69
In 2017, the liquidity portfolio is forecast to maintain an average balance of CAD $5.9 billion, with a minimum balance of CAD $5.4 billion and a maximum balance of CAD $7.4 billion.
2018 BORROWINGS
Money Market Borrowings (short-term borrowings)
Unpredictable cash flow demands most often result from undrawn revolver commitments, estimated at U.S. $14.3 billion at December 31, 2018. Revolver commitments range in size from approximately U.S. $600 thousand to U.S. $500 million, can provide for same day advances and can be highly concentrated among certain industries and individual borrowers. Additional committed facilities which have not yet been drawn are forecast to total U.S. $6.6 billion at the end of 2018.
In 2018, the liquidity portfolio is forecast to maintain an average balance of CAD $9.8 billion, with a minimum balance of CAD $7.4 billion and a maximum balance of CAD $10.1 billion. The entire liquidity portfolio can be accessed during a liquidity event. At December 31, 2018, short term borrowings outstanding are projected to be CAD $400 million lower than the forecast December 31, 2017 term borrowings outstanding reflecting fluctuations in cash management requirements.
Capital Market Borrowings (long-term borrowings)
The Corporate Plan projects a baseline borrowing requirement of U.S. $12.9 billion (CAD $17.2 billion equivalent) with potential additional long-term requirements of U.S. $3.0 billion. The baseline borrowing requirement is U.S. $1.6 billion higher than the 2017 plan requirement primarily due to higher debt maturities in 2018 as well as the increased level of liquidity requested by the Minister, both of which will require issuance of long term debt.
Total Outstanding Borrowings
The aggregate principal amount outstanding of borrowings will not at any time in 2018 exceed CAD $54.9 billion, which is well below the maximum statutory limit of fifteen times the current paid in capital and retained earnings (equivalent to CAD $147 billion estimated as of December 31, 2018).
PRIMARY USES OF FINANCING
Refinancing of Maturing Debt – Maturing debt is refinanced through new issuance.
Change in Marketable Securities – Primarily funding the increase in the Liquidity Porfolio due to the revised Liquidity Policy.
Increased Lending Activity (Term Loan and Revolver New Business) – Positive net loan disbursements are forecast in 2018.
CP Outstanding – Decrease in the level of CP outstanding
Development Finance Institute Canada Inc. – Funding the initial capitalization.
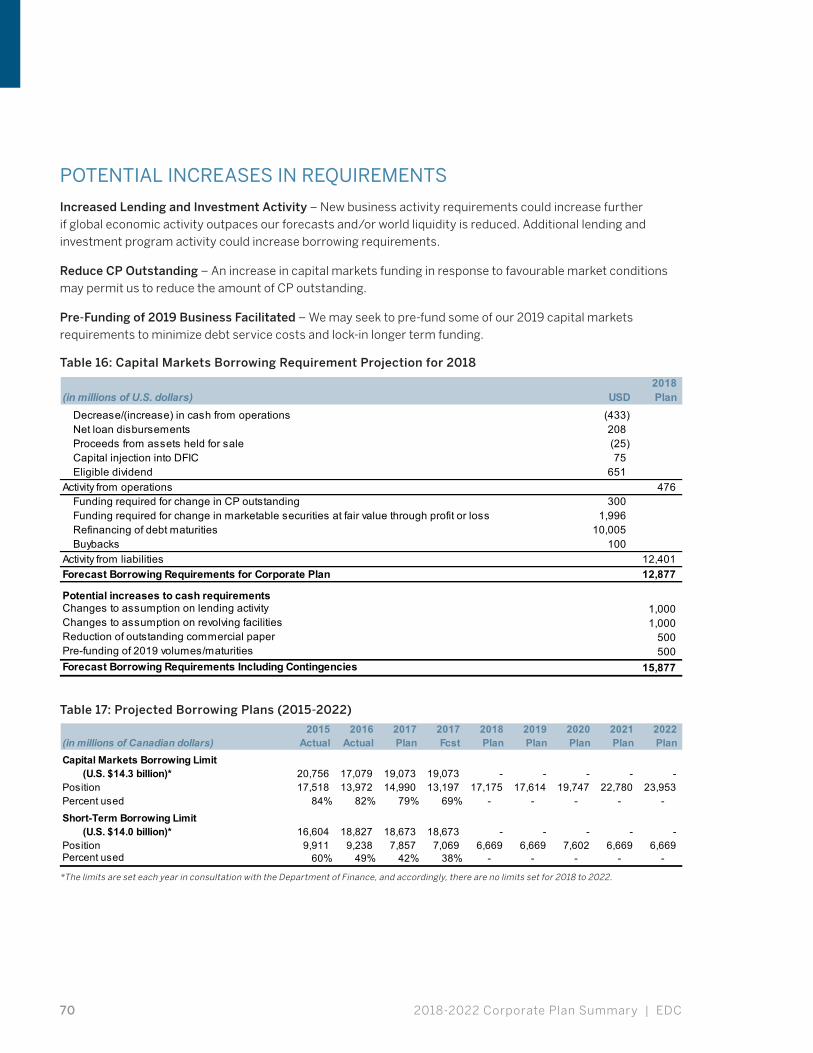
2018-2022 Corporate Plan Summary | EDC70
POTENTIAL INCREASES IN REQUIREMENTS
Increased Lending and Investment Activity – New business activity requirements could increase further if global economic activity outpaces our forecasts and/or world liquidity is reduced. Additional lending and investment program activity could increase borrowing requirements.
Reduce CP Outstanding – An increase in capital markets funding in response to favourable market conditions may permit us to reduce the amount of CP outstanding.
Pre-Funding of 2019 Business Facilitated – We may seek to pre-fund some of our 2019 capital markets requirements to minimize debt service costs and lock-in longer term funding.
Table 16: Capital Markets Borrowing Requirement Projection for 2018
2018(in millions of U.S. dollars) Plan
Decrease/(increase) in cash from operationsNet loan disbursementsProceeds from assets held for saleCapital injection into DFICEligible dividend
Activity from operationsFunding required for change in CP outstandingFunding required for change in marketable securities at fair value through profit or lossRefinancing of debt maturitiesBuybacks
Activity from liabilitiesForecast Borrowing Requirements for Corporate Plan
Potential increases to cash requirementsChanges to assumption on lending activityChanges to assumption on revolving facilitiesReduction of outstanding commercial paperPre-funding of 2019 volumes/maturitiesForecast Borrowing Requirements Including Contingencies
1,000 1,000
500 500
15,877
100 12,401 12,877
300 1,996
10,005
(25) 75
651 476
USD(433) 208
Table 17: Projected Borrowing Plans (2015-2022)
2015 2016 2017 2017 2018 2019 2020 2021 2022(in millions of Canadian dollars) Actual Actual Plan Fcst Plan Plan Plan Plan PlanCapital Markets Borrowing Limit
(U.S. $14.3 billion)*PositionPercent used
Short-Term Borrowing Limit(U.S. $14.0 billion)*
PositionPercent used
20,756 17,079 19,073 19,073 - - - - - 23,953
84% 82% 79% 69% - - - - - 17,518 13,972 14,990 13,197 17,175 17,614 19,747 22,780
- - 9,911 9,238 7,857 7,069 6,669 6,669 7,602 6,669 6,669
16,604 18,827 18,673 18,673 -
42% 38% -
- -
- - - - 60% 49%
*The limits are set each year in consultation with the Department of Finance, and accordingly, there are no limits set for 2018 to 2022.
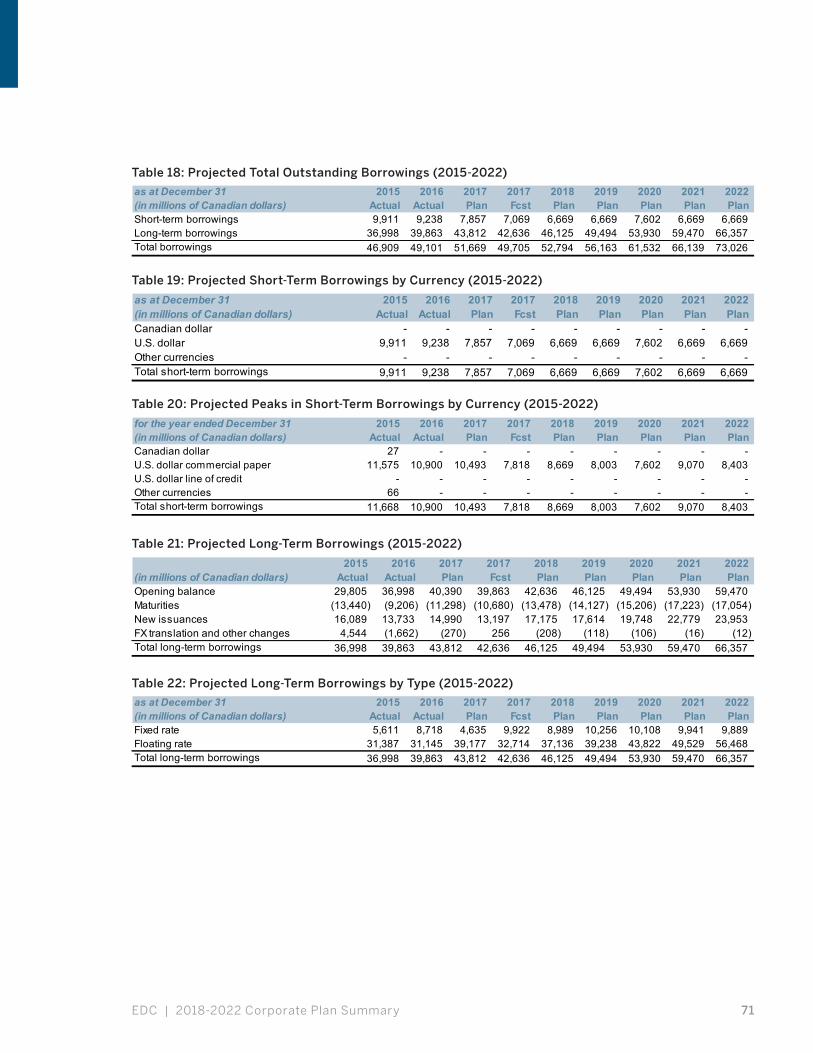
EDC | 2018-2022 Corporate Plan Summary 71
Table 18: Projected Total Outstanding Borrowings (2015-2022)
as at December 31 2015 2016 2017 2017 2018 2019 2020 2021 2022(in millions of Canadian dollars) Actual Actual Plan Fcst Plan Plan Plan Plan PlanShort-term borrowingsLong-term borrowingsTotal borrowings 56,163 61,532 66,139 73,026
36,998 39,863 43,812 46,909 49,101 51,669 49,705 52,794
42,636 46,125 9,911 9,238 7,857 7,069 6,669 6,669 7,602 6,669 6,669
49,494 53,930 59,470 66,357
Table 19: Projected Short-Term Borrowings by Currency (2015-2022)
as at December 31 2015 2016 2017 2017 2018 2019 2020 2021 2022(in millions of Canadian dollars) Actual Actual Plan Fcst Plan Plan Plan Plan PlanCanadian dollarU.S. dollarOther currenciesTotal short-term borrowings 6,669 7,602 6,669 6,669 9,911 9,238 7,857 7,069 6,669
6,669 7,602 6,669 6,669 - - - - - - - - -
9,911 9,238 7,857 7,069 6,669 - - - - - - - - -
Table 20: Projected Peaks in Short-Term Borrowings by Currency (2015-2022)
for the year ended December 31 2015 2016 2017 2017 2018 2019 2020 2021 2022(in millions of Canadian dollars) Actual Actual Plan Fcst Plan Plan Plan Plan PlanCanadian dollarU.S. dollar commercial paperU.S. dollar line of creditOther currenciesTotal short-term borrowings
- 11,668 10,900 10,493 7,818 8,669 8,003 7,602 9,070 8,403
66 - - - -
8,003 7,602 9,070
- - -
8,403 - - - - - - - - -
11,575 10,900 10,493 7,818 8,669 27 - - - - - - - -
Table 21: Projected Long-Term Borrowings (2015-2022)
2015 2016 2017 2017 2018 2019 2020 2021 2022(in millions of Canadian dollars) Actual Actual Plan Fcst Plan Plan Plan Plan PlanOpening balance MaturitiesNew issuances FX translation and other changesTotal long-term borrowings
(12) 36,998 39,863 43,812 42,636 46,125 49,494 53,930 59,470 66,357
4,544 (1,662) (270) 256 (208)
(14,127) (15,206) (17,223)
(118) (106) (16)
(17,054) 16,089 13,733 14,990 13,197 17,175 17,614 19,748 22,779 23,953
(13,440) (9,206) (11,298) (10,680) (13,478) 29,805 36,998 40,390 39,863 42,636 46,125 49,494 53,930 59,470
Table 22: Projected Long-Term Borrowings by Type (2015-2022)
as at December 31 2015 2016 2017 2017 2018 2019 2020 2021 2022(in millions of Canadian dollars) Actual Actual Plan Fcst Plan Plan Plan Plan PlanFixed rateFloating rateTotal long-term borrowings 49,494 53,930 59,470 66,357
31,387 31,145 39,177 36,998 39,863 43,812 42,636 46,125
32,714 37,136 5,611 8,718 4,635 9,922 8,989 10,256 10,108 9,941 9,889
39,238 43,822 49,529 56,468
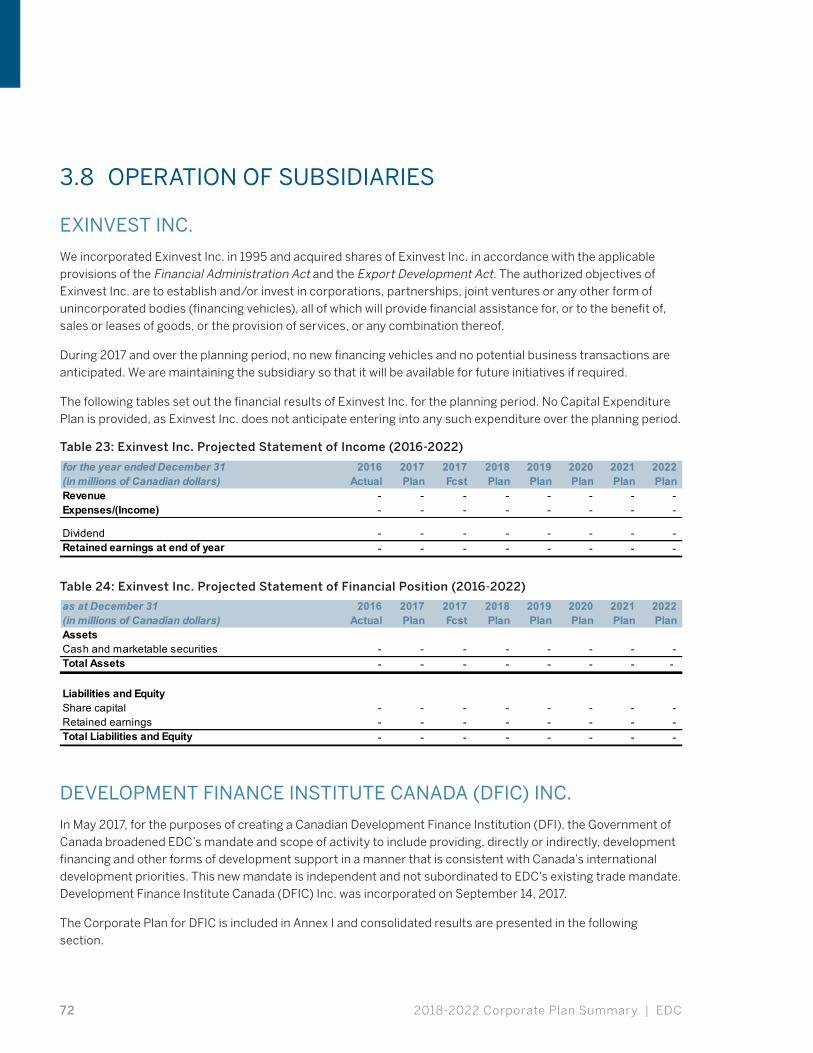
2018-2022 Corporate Plan Summary | EDC72
3.8 OPERATION OF SUBSIDIARIES
EXINVEST INC.
We incorporated Exinvest Inc. in 1995 and acquired shares of Exinvest Inc. in accordance with the applicable provisions of the Financial Administration Act and the Export Development Act. The authorized objectives of Exinvest Inc. are to establish and/or invest in corporations, partnerships, joint ventures or any other form of unincorporated bodies (financing vehicles), all of which will provide financial assistance for, or to the benefit of, sales or leases of goods, or the provision of services, or any combination thereof.
During 2017 and over the planning period, no new financing vehicles and no potential business transactions are anticipated. We are maintaining the subsidiary so that it will be available for future initiatives if required.
The following tables set out the financial results of Exinvest Inc. for the planning period. No Capital Expenditure Plan is provided, as Exinvest Inc. does not anticipate entering into any such expenditure over the planning period.
Table 23: Exinvest Inc. Projected Statement of Income (2016-2022)
for the year ended December 31 2016 2017 2017 2018 2019 2020 2021 2022(in millions of Canadian dollars) Actual Plan Fcst Plan Plan Plan Plan PlanRevenueExpenses/(Income)
DividendRetained earnings at end of year - - - - - - - -
- - - - - - - -
- - - - - - - - - - - - - - - -
Table 24: Exinvest Inc. Projected Statement of Financial Position (2016-2022)
as at December 31 2016 2017 2017 2018 2019 2020 2021 2022(in millions of Canadian dollars) Actual Plan Fcst Plan Plan Plan Plan PlanAssetsCash and marketable securitiesTotal Assets -
Liabilities and EquityShare capitalRetained earningsTotal Liabilities and Equity
- - - - - - - - - - - - - - -
- - - - - - - - - - -
- - - - - - - - - - - - -
DEVELOPMENT FINANCE INSTITUTE CANADA (DFIC) INC.
In May 2017, for the purposes of creating a Canadian Development Finance Institution (DFI), the Government of Canada broadened EDC’s mandate and scope of activity to include providing, directly or indirectly, development financing and other forms of development support in a manner that is consistent with Canada’s international development priorities. This new mandate is independent and not subordinated to EDC’s existing trade mandate. Development Finance Institute Canada (DFIC) Inc. was incorporated on September 14, 2017.
The Corporate Plan for DFIC is included in Annex I and consolidated results are presented in the following section.
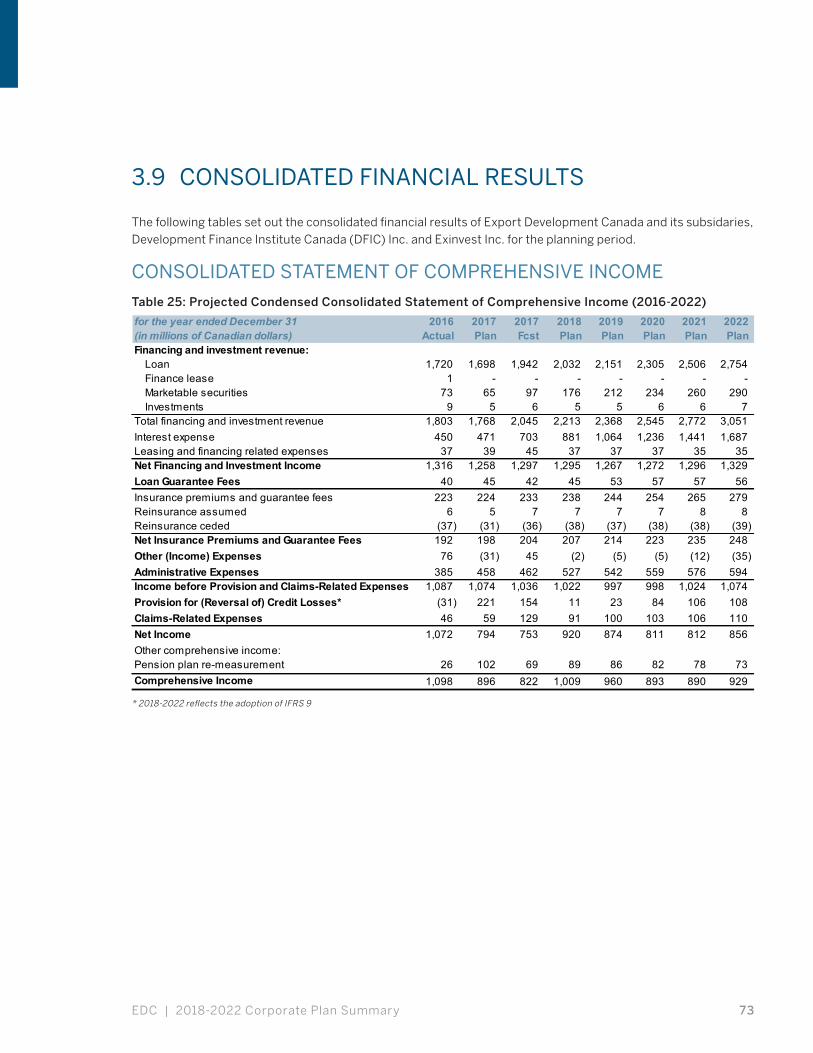
EDC | 2018-2022 Corporate Plan Summary 73
3.9 CONSOLIDATED FINANCIAL RESULTS
The following tables set out the consolidated financial results of Export Development Canada and its subsidaries, Development Finance Institute Canada (DFIC) Inc. and Exinvest Inc. for the planning period.
CONSOLIDATED STATEMENT OF COMPREHENSIVE INCOME
Table 25: Projected Condensed Consolidated Statement of Comprehensive Income (2016-2022)
for the year ended December 31 2016 2017 2017 2018 2019 2020 2021 2022(in millions of Canadian dollars) Actual Plan Fcst Plan Plan Plan Plan PlanFinancing and investment revenue:
LoanFinance lease Marketable securitiesInvestments
Total financing and investment revenueInterest expenseLeasing and financing related expensesNet Financing and Investment IncomeLoan Guarantee FeesInsurance premiums and guarantee feesReinsurance assumedReinsurance cededNet Insurance Premiums and Guarantee FeesOther (Income) ExpensesAdministrative ExpensesIncome before Provision and Claims-Related ExpensesProvision for (Reversal of) Credit Losses*Claims-Related ExpensesNet IncomeOther comprehensive income:Pension plan re-measurementComprehensive Income
26 102 69 89 86 82 78 73 1,098 896 822 1,009 960 893 890 929
46 59 129 91 100 103 106 110 1,072 794 753 920 874 811 812 856
1,087 1,074 1,036 1,022 997 998 1,024 1,074 (31) 221 154 11 23 84 106 108
76 (31) 45 (2) (5) (5) (12) (35) 385 458 462 527 542 559 576 594
(37) (31) (36) (38) (37) (38) (38) (39) 192 198 204 207 214 223 235 248
223 224 233 238 244 254 265 279 6 5 7 7 7 7 8 8
1,316 1,258 1,297 1,295 1,267 1,272 1,296 1,329 40 45 42 45 53 57 57 56
450 471 703 881 1,064 1,236 1,441 1,687 37 39 45 37 37 37 35 35
9 5 6 5 5 6 6 7 1,803 1,768 2,045 2,213 2,368 2,545 2,772 3,051
1 - - - - - - - 73 65 97 176 212 234 260 290
1,720 1,698 1,942 2,032 2,151 2,305 2,506 2,754
* 2018-2022 reflects the adoption of IFRS 9

2018-2022 Corporate Plan Summary | EDC74
CONSOLIDATED STATEMENT OF FINANCIAL POSITION
Table 26: Projected Condensed Consolidated Statement of Financial Position (2016-2022)
as at December 31 2016 2017 2017 2018 2019 2020 2021 2022(in millions of Canadian dollars) Actual Plan Fcst Plan Plan Plan Plan PlanAssets
CashMarketable securitiesDerivative instrumentsAssets held-for-saleLoans receivableAllowance for losses on loans*Investments at fair value through profit or lossNet investment in aircraft under finance leasesRecoverable insurance claimsReinsurers' share of premium and claims liabilitiesOther assetsRetirement benefit assetsProperty, plant and equipmentIntangible assetsBuilding under finance lease
Total Assets
Liabilities and EquityAccounts payable and other creditsLoans payableDerivative instrumentsObligation under finance leaseRetirement benefit obligationsAllowance for losses on loan commitments*Premium and claims liabilities Loan guarantees*
EquityShare capitalRetained earnings
Total Liabilities and Equity
330 105 79 79 79 79 79 79 7,059 5,931 7,858 10,585 12,739 12,907 13,897 14,574
324 519 280 280 280 280 280 280 42 - 33 - - - - -
55,250 58,705 54,595 54,687 55,796 60,900 64,528 70,901 (1,552) (1,826) (1,655) (1,201) (1,224) (1,309) (1,415) (1,522) 1,005 978 1,111 1,236 1,369 1,516 1,657 1,771
- - 5 5 5 5 5 5 63 48 62 66 71 69 74 77
116 91 138 140 146 152 158 165 156 75 108 103 96 89 81 75
43 - 117 207 301 399 500 579 55 75 65 64 56 52 49 55 92 114 104 111 92 67 43 29
141 134 134 127 120 113 106 99
63,124 64,949 63,034 66,489 69,926 75,319 80,042 87,167
142 91 109 111 104 97 89 83 49,101 51,669 49,705 52,794 56,163 61,532 66,139 73,026
2,819 2,400 2,107 2,107 2,107 2,107 2,107 2,107 158 154 154 150 145 140 135 130 240 255 249 247 245 242 241 240
78 82 79 25 25 25 25 25 656 481 664 579 606 636 665 695 167 160 168 136 129 120 114 112
53,361 55,292 53,235 56,149 59,524 64,899 69,515 76,418
1,333 1,333 1,333 1,333 1,333 1,333 1,333 1,333 8,430 8,324 8,466 9,007 9,069 9,087 9,194 9,416 9,763 9,657 9,799 10,340 10,402 10,420 10,527 10,749
63,124 64,949 63,034 66,489 69,926 75,319 80,042 87,167
* 2018-2022 reflects the adoption of IFRS 9
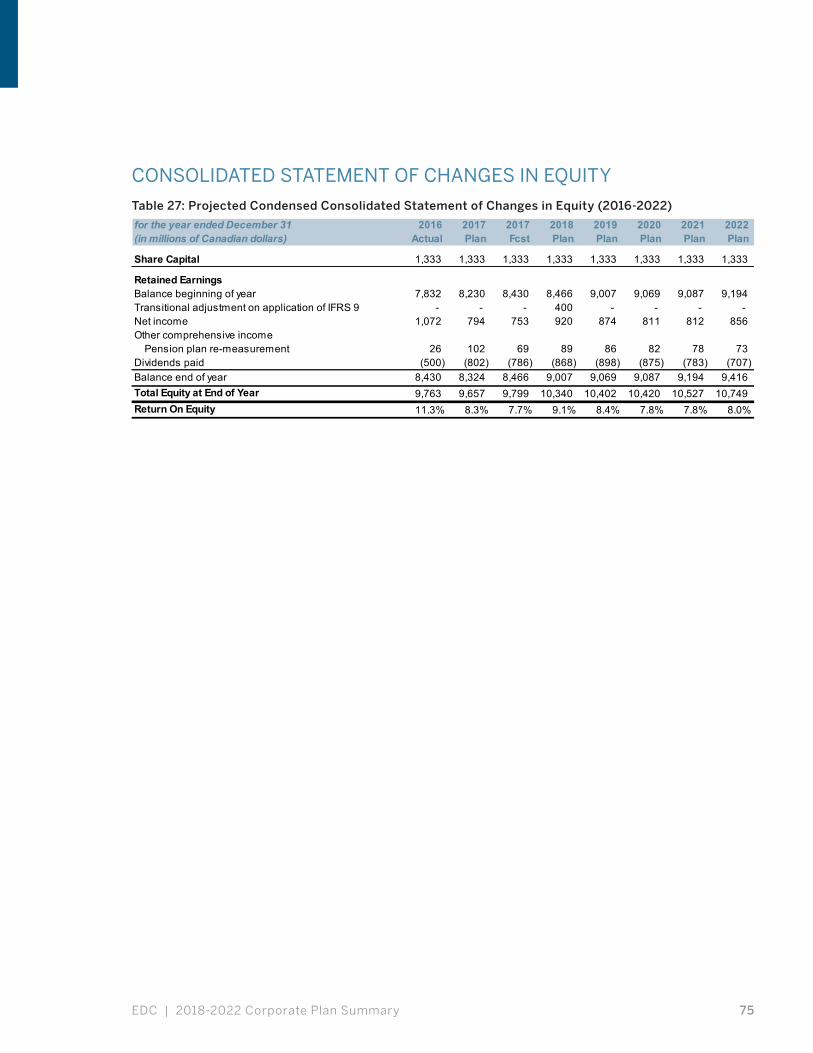
EDC | 2018-2022 Corporate Plan Summary 75
CONSOLIDATED STATEMENT OF CHANGES IN EQUITY
Table 27: Projected Condensed Consolidated Statement of Changes in Equity (2016-2022)
for the year ended December 31 2016 2017 2017 2018 2019 2020 2021 2022(in millions of Canadian dollars) Actual Plan Fcst Plan Plan Plan Plan Plan
Share Capital
Retained EarningsBalance beginning of yearTransitional adjustment on application of IFRS 9 - - - - - - - Net incomeOther comprehensive income
Pension plan re-measurementDividends paidBalance end of yearTotal Equity at End of YearReturn On Equity
1,333 1,333 1,333 1,333 1,333 1,333 1,333 1,333
9,007 9,069 9,087 9,194 400
1,072 794 753 920 874 811 812 856
7,832 8,230 8,430 8,466
26 102 69 89 86 82 78 73 (875) (783) (707)
8,430 8,324 8,466 9,007 9,069 9,087 9,194 9,416 (500) (802) (786) (868) (898)
9,763 9,657 9,799 10,340 10,402 10,420 10,527 10,749 7.8% 7.8% 8.0%11.3% 8.3% 7.7% 9.1% 8.4%

2018-2022 Corporate Plan Summary | EDC76
CONSOLIDATED STATEMENT OF CASH FLOWS
Table 28: Projected Condensed Consolidated Statement of Cash Flows (2016-2022)
for the year ended December 31 2016 2017 2017 2018 2019 2020 2021 2022(in millions of Canadian dollars) Actual Plan Fcst Plan Plan Plan Plan PlanCash Flows from (used in) Operating ActivitiesNet income1
Adjustments to determine net cash from (used in) operating activities
Provision for (reversal of) credit losses1
Actuarial change in the net allowance for claims on insuranceDepreciation and amortizationRealized (gains) and losses
Changes in operating assets and liabilitiesChange in accrued interest and fees receivableChange in fair value of marketable securitiesChange in fair value of loans payableChange in derivative instrumentsOther
Loan disbursementsLoan repayments and principal recoveries from loan asset sales
Net cash from (used in) operating activities
Cash Flows from (used in) Investing ActivitiesDisbursements for investmentsReceipts from investmentsFinance lease repaymentsPurchases of marketable securities at fair value through profit or loss2
Sales/maturities of marketable securities at fair value through profit or loss2
Proceeds on sale of assets held-for-sale
Net cash used in investing activities
Cash Flows from (used in) Financing ActivitiesIssue of long-term loans payable - designated at fair value through profit or lossRepayment of long-term loans payable - designated at fair value through profit or lossIssue of long-term loans payable at amortized costRepayment of long-term loans payable at amortized costIssue of short-term loans payable - designated at fair value through profit or lossRepayment of short-term loans payable - designated at fair value through profit or lossDisbursements from sale/maturity of derivative instrumentsDividend paid
Net cash from (used in) financing activities
Effect of exchange rate changes on cash and cash equivalents
Net increase (decrease) in cash and cash equivalents
Cash and cash equivalentsBeginning of periodEnd of period
Cash and cash equivalents are comprised ofCashCash equivalents included within marketable securitiesEnd of period
1,072 794 753 920 874 811 812 856
(31) 221 154 11 23 84 106 108
(33) (108) 9 (82) 21 20 19 18 32 47 41 50 51 51 47 36 16 (31) (14) (11) (14) (14) (21) (44)
(158) 13 (30) 14 18 (24) 18 38 33 - (2) - - - - -
(58) - 44 - - - - - (18) (305) (407) (271) (176) (151) (84) (88) 113 (45) 39 (68) (39) (34) (51) (36)
(22,709) (23,173) (24,428) (24,591) (26,105) (27,549) (28,621) (29,690) 18,713 18,580 24,882 24,386 25,018 22,505 25,037 23,351
(3,028) (4,007) 1,041 358 (329) (4,301) (2,738) (5,451)
(237) (266) (255) (287) (302) (322) (337) (344) 120 192 146 173 183 188 217 274
4 - - - - - - -
(6,939) (32,460) (6,903) (7,837) (4,406) (2,872) (1,027) (1,106)
6,885 32,452 6,044 5,677 2,677 2,710 217 566 4 - 5 33 - - - -
(163) (82) (963) (2,241) (1,848) (296) (930) (610)
13,733 12,593 12,530 16,508 12,946 19,747 20,072 19,285
(9,206) (8,901) (8,279) (12,811) (9,459) (15,206) (15,182) (17,054) - 2,397 667 667 4,668 - 2,708 4,668 - (2,397) (2,401) (667) (4,668) - (2,041) -
36,184 28,631 28,968 38,546 39,746 38,412 39,746 38,546
(36,583) (27,432) (30,987) (38,946) (39,746) (37,479) (40,680) (38,546) (548) - (109) - - - - - (500) (802) (786) (868) (898) (875) (783) (707)
3,080 4,089 (397) 2,429 2,589 4,599 3,840 6,192
(64) - (11) - - - - -
(175) - (330) 546 412 2 172 131
2,066 105 1,891 1,561 2,107 2,519 2,521 2,693
1,891 105 1,561 2,107 2,519 2,521 2,693 2,824
330 105 79 79 79 79 79 79 1,561 - 1,482 2,028 2,440 2,442 2,614 2,745
1,891 105 1,561 2,107 2,519 2,521 2,693 2,824
1 2018-2022 reflects the adoption of IFRS 9 2 Effective January 1, 2017, we have reclassified a portion of our marketable securities as cash equivalents. This change is being made to provide enhanced disclosure of the nature of these assets. The securities reclassified have a term to maturity of 90 days or less from the date of their acquisition, are considered highly liquid, readily convertible to known amounts of cash and subject to an insignificant risk of change in value. As a result the statement of cash flows as of December 31, 2016 has been restated.
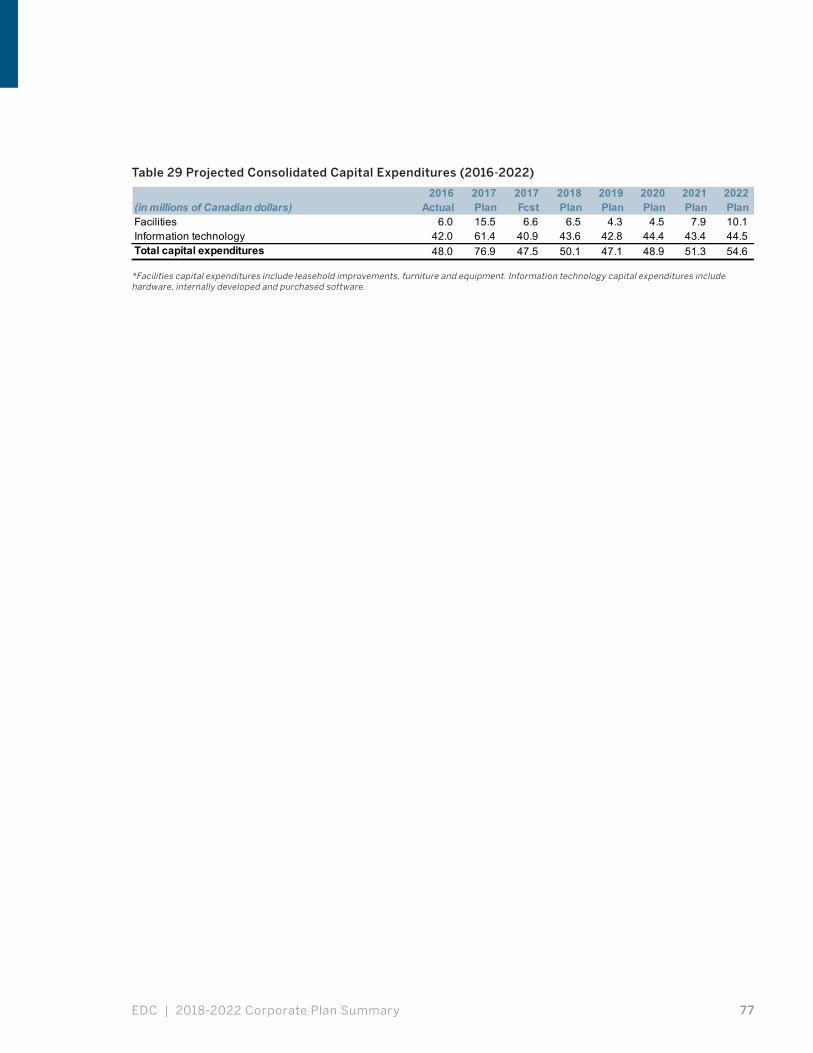
EDC | 2018-2022 Corporate Plan Summary 77
Table 29 Projected Consolidated Capital Expenditures (2016-2022)
2016 2017 2017 2018 2019 2020 2021 2022(in millions of Canadian dollars) Actual Plan Fcst Plan Plan Plan Plan PlanFacilitiesInformation technologyTotal capital expenditures
44.4 43.4 44.5 48.0 76.9 47.5 50.1 47.1 48.9 51.3 54.6 42.0 61.4 40.9 43.6 42.8
6.0 15.5 6.6 6.5 4.3 4.5 7.9 10.1
*Facilities capital expenditures include leasehold improvements, furniture and equipment. Information technology capital expenditures include hardware, internally developed and purchased software.
78 2018-2022 Corporate Plan Summary | EDC
Export Development Canada (EDC) is a Crown corporation which provides trade finance and risk management services to facilitate the trade and investment activities of Canadian companies.
This reference guide is intended to complement the information provided in the Business Strategy by providing additional background, including information relating to EDC’s:
• Mandate and Operating Principles, as prescribed under the Export Development Act and the strategic framework outlined in the Corporate Plan 2018-2022.
• Legislative Powers and Obligations, as prescribed under the Export Development Act and the Financial Administration Act.
• Managerial and Organizational Structure, the executive team manages the operations of EDC within the strategic goals and objectives as laid out in the Corporate Plan.
• Board and Committee Structure, the Board plays a pivotal role in setting the strategic direction of EDC and in ensuring that public policy objectives are met by EDC in the most effective manner. The Board also reviews the development and refinement of the various financial services, approves certain loans, insurance and guarantee contracts, authorizes funding transactions, and monitors EDC’s performance.
This information has been provided in accordance with the Treasury Board of Canada’s Guidelines for the Preparation of Corporate Plans.
MANDATE AND OPERATING PRINCIPLES
MANDATE
EDC’s mandate is to support and develop, directly or indirectly, Canada’s export trade and Canadian capacity to engage in that trade and respond to international business opportunities. EDC is also mandated to provide, directly or indirectly, development financing and other forms of development support in a manner that is consistent with Canada’s international development priorities.
OPERATING PRINCIPLES
EDC’s decision-making on key corporate initiatives is focused on improving Canada’s trade and investment performance while continuing to improve the responsiveness and resilience of the organization.
EDC’s goal is to create benefits for Canada. Our ability to fulfill this goal requires us to deploy our resources - our people and their unique talents, our financial capital and our technology - in an optimal manner. In doing so we ensure that in our key decisions we balance the value of our services to Canadian businesses, our ability to manage risk and our long term financial sustainability.
APPENDIX I: EXPORT DEVELOPMENT CANADA CORPORATE OVERVIEW

79EDC | 2018-2022 Corporate Plan Summary
LEGISLATIVE POWERS AND OBLIGATIONS
LEGISLATIVE POWERS
The Export Development Act (The Act) and subsequent regulations, as amended from time to time, provide the legislative basis for EDC’s activities. Section 10 of the Act outlines the powers that EDC may exercise in pursuit of its mandate. Transactions supported under Section 10 are considered to be Corporate Account transactions as they are funded and supported by the corporation’s own balance sheet and income generating capacity, and not through annual appropriations.
In addition to its Corporate Account activities, under Section 23 of the Act, EDC may be authorized by the Minister for International Trade, with the concurrence of the Minister of Finance to undertake certain transactions of a financial nature to support and develop Canada’s export trade. While EDC strives to find ways to structure transactions under its Corporate Account, there are a number of factors which might lead EDC to refer a transaction to Canada Account. For instance, the transaction could exceed EDC’s exposure guideline for a particular country or involve markets or borrowers representing exceptionally high risks, amounts or financing terms in excess of what EDC would normally undertake. The monies required to discharge Canada Account transactions are made available from the consolidated Revenue Fund.
The Act limits Canada Account’s outstanding commitments to borrowers and liabilities under contracts of insurance and other agreements to an aggregate of $20 billion. In March 2014, after five years of temporary domestic powers granted to EDC in the 2009 budget in response to the financial crisis, new Regulations Amending the Export Development Canada Exercise of Certain Powers Regulations came into force. They define how EDC can deploy its capabilities in support of transactions in Canada. These regulations will be subject to a review by the Government of Canada three years after their entry into force.

80 2018-2022 Corporate Plan Summary | EDC
LEGISLATIVE OBLIGATIONS
Section 25 of the Act requires that the Minister of International Trade, in consultation with the Minister of Finance, initiate an independent review of the provisions and operation of the Act every 10 years. The 2008 review concluded in July 2010 with the passage of the Budget Implementation Act, which amends the Export Development Act to enable the corporation to open offices in foreign markets, and clarifies existing asset management powers for EDC’s corporate account and the Canada Account. The next review is scheduled to commence in 2018. To respond to private insurers about EDC’s role in the short-term credit insurance market that arose in the review process, the government has established a credit insurance advisory group with a view to promoting partnership and reinsurance support for both domestic and short-term export credit insurance.
In addition to the Legislative Review, a special examination is mandated at least every ten years under the Financial Administration Act (FAA) and a report on the findings must be submitted to the Board of Directors. The last special examination was conducted in 2008 and the next special examination will be completed in 2018.
The Act also stipulates that an audit of the design and implementation of EDC’s Environmental Review Directive (the Environment Audit) must be undertaken by the Office of the Auditor General (OAG) every five years. The 2014 review was presented to the EDC’s Board of Directors and was tabled in Parliament [a copy of the review is available at http://www.oag-bvg.gc.ca].
ACCOUNTABILITY TO PARLIAMENT
The Government of Canada primarily regulates Crown corporations through their enabling legislation and through the FAA. EDC is currently listed under Part I of Schedule III to the FAA, and as such is required to, among other things:
• Submit an Annual Report, a Corporate Plan and an Operating Budget to the responsible Minister;
• Make public the quarterly financial report within 60 days of quarter-end; and
• Undergo regular audits by the OAG.
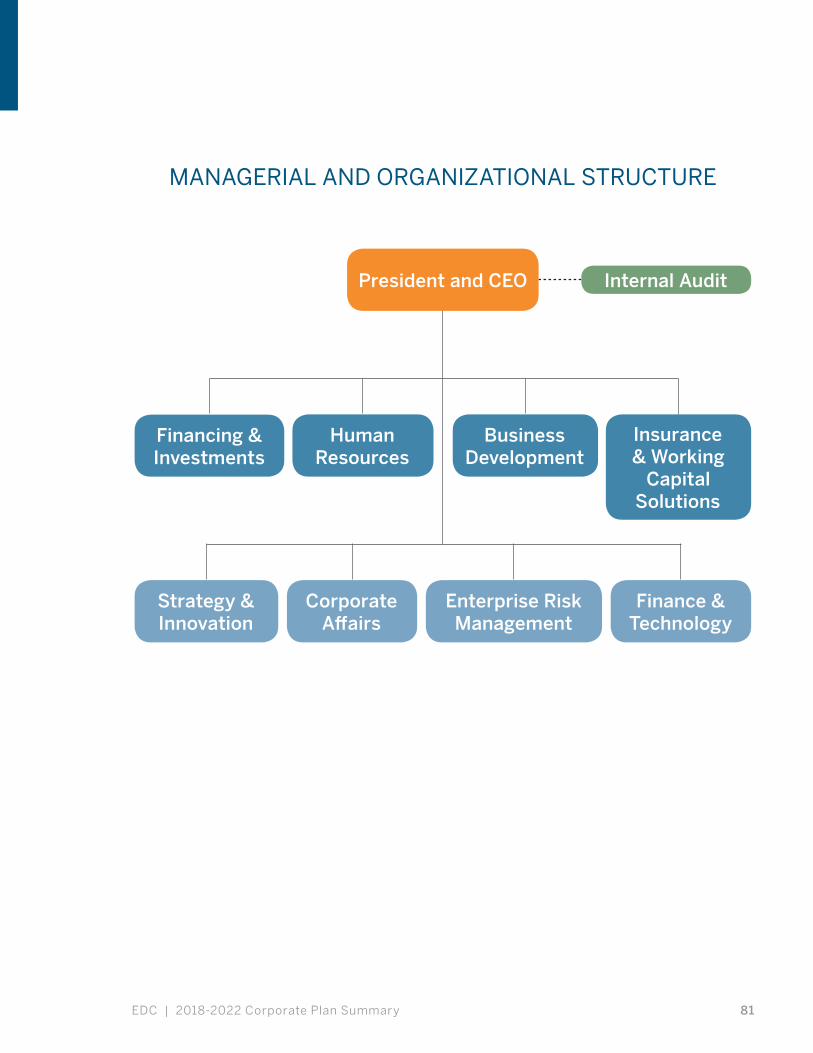
81EDC | 2018-2022 Corporate Plan Summary
MANAGERIAL AND ORGANIZATIONAL STRUCTURE
President and CEO
Enterprise Risk Management
Internal Audit
Business Development
Financing & Investments
Insurance & Working
Capital Solutions
Human Resources
Corporate Affairs
Strategy & Innovation
Finance & Technology

82 2018-2022 Corporate Plan Summary | EDC
BOARD AND COMMITTEE STRUCTURE
Executive Committee
• Handling of urgent matters between Board meetings
• Authority to exercise certain Board powers
Chair of the Board
Board of Directors
Audit Committee
• Financial and management control systems
• Financial reporting
• Corporate financing
• Approval of certain major expenditures
• Internal and external audit matters, including audits of the Directive on the environment, and special examinations
• Dividend: review eligibility
Risk Management Committee
• Oversight of management of credit, market and other enterprise risks and of overall capital adequacy relative to EDC’s risk profile and Corporate Plan Objectives
• Recommendations to the Board re risk management and capital adequacy policies and strategies
• Ethical compliance, including Compliance Officer oversight
• Environmental compliance
• Review of proposed transactions, and policy limit increases for recommendation to Board
Nominating and Corporate Governance Committee
• Appointment process for CEO, Board Chairperson, and Directors
• Board and Committees effectiveness
• Governance Survey
Human Resources Committee
• HR strategic planning
• Compensation policy and budgets
• Succession planning, including approval of or recommendations to the Board re certain senior appointments
• President’s objectives, recommendations re performance, salary and benefits
• Design and compliance of EDC pension plans
• Oversight of pension plan administration
Business Development and Strategy Committee
• Input into strategic policy direction, including recommendations to the Board re: Corporate Plan
• Oversight of analysis of market conditions, and responses
• Monitors performance as against business strategies and policies including review of Canadian Benefits Framework

83EDC | 2018-2022 Corporate Plan Summary
To achieve success, we must understand the needs of Canadian exporters and respond to these needs with products and services that can help them export. Often, we have a product or service within our existing toolkit that meets their requirements. In the cases where we don’t, we look for new ways to provide solutions to meet their needs, or refer them to one of our partners with complementary services who can address their specific challenge.
SOLUTIONS
EDC provides financing and insurance solutions to help Canadian companies of any size respond to international business opportunities. EDC works together with private and public-sector financial institutions to create greater capacity for Canadian companies to engage in trade and investment.
EDC’s financing and insurance solutions are intended to add capacity where and when it is needed. We provide a range of services to help exporters in a variety of areas.
FINANCING SOLUTIONS
In today’s competitive global market, companies with international customers need to have readily available export financing to fill orders, open an international office or even provide financing options to customers outside Canada. EDC offers a variety of solutions, including bank guarantees and loans so that Canadian companies have the financing they need to grow.
EXPORT GUARANTEE PROGRAM
EDC can provide a risk-sharing guarantee to a Canadian company’s financial institution encouraging them to provide additional financing—helping the company access the working capital they need to grow.
BUYER FINANCING
Providing financing options to a potential customer can be the key to a successful sales pitch. Buyer Financing can help give a Canadian company a competitive advantage by providing their customers with flexible payment options. EDC has guarantee solutions for transactions under $10 million.
STRUCTURED AND PROJECT FINANCE
If a Canadian company with revenues of more than $50 million and operations outside of Canada needs structured financing to execute a large-scale global project that clearly demonstrates benefits to Canada, EDC’s Structured and Project Finance program may be able to help raise the needed financing. EDC can act as a partner in international financing syndicates to advise, arrange and underwrite financing. The team can also provide support for a project’s technical, environmental and social or documentation needs.
DIRECT LENDING
Direct Lending helps Canadian companies with financing by way of a secured loan made directly to the company in support of its international investment or directly to their foreign affiliate, secured by the foreign assets.
APPENDIX II: OVERVIEW OF EDC’S FINANCING AND INSURANCE SOLUTIONS

84 2018-2022 Corporate Plan Summary | EDC
INVESTMENTS
EDC is an investor in direct late venture and growth capital investments and partners with private sector funds, both domestically and internationally. This program is focused on providing international growth capital to small and medium-sized companies with private equity to support and grow in the global marketplace. International fund investments are leveraged to identify opportunities to connect Canadian companies with international buyers.
INSURANCE SOLUTIONS
EDC has a range of insurance solutions to help exporters protect their international business whether they have one contract, one customer or want support for their entire book of business.
Our insurance can also help companies access the working capital they need and protect their assets as they grow their international sales.
ACCOUNTS RECEIVABLE INSURANCE
Accounts Receivable Insurance (ARI) is EDC’s trade credit insurance option for Canadian companies looking to insure all of their U.S. and international sales against non-payment. It is an ideal option if companies need the security of knowing they will be protected if any of their U.S. or international customers can’t pay. In many markets, Accounts Receivable Insurance can also be extended to a company’s foreign affiliates.
TRADE PROTECT
Trade Protect is an online solution that’s ideal for Canadian companies looking to insure their receivables for up to $500,000 per customer against non-payment. Companies can get insurance for one or several customers and all transactions, regardless of how small, can be considered.
CONTRACT FRUSTRATION INSURANCE
Contract Frustration Insurance insures companies for up to 90 per cent of eligible losses resulting from political and commercial risks such as customer bankruptcy or contract cancellation on a single contract.
85EDC | 2018-2022 Corporate Plan Summary
POLITICAL RISK INSURANCE
Emerging markets present great opportunities to grow a company’s business, diversify their customer base and increase sales. In some markets, however, political upheaval can happen overnight, leaving companies exposed to a broad range of risks that could threaten their international business. EDC’s Political Risk Insurance provides flexible solutions that can protect against risks such as safeguarding the value of a company’s overseas assets and non-payment or contract cancellation by a foreign government buyer.
BONDING & GUARANTEE SOLUTIONS
Posting bonds and letters of guarantee are a necessary part of exporting— customers can demand bonds at almost any stage of the contract – and issuing bonds can be expensive and risky, since financial institutions typically freeze operating lines or ask for collateral equivalent to the amount of the bond. With the protection offered by EDC’s bonding and guarantee solutions, a company’s bank may choose to drop its collateral requirements, helping companies free up much-needed working capital.
ACCOUNT PERFORMANCE SECURITY GUARANTEE
EDC can provide a 100 per cent irrevocable guarantee to a Canadian company’s bank for their contractual and financial letter of guarantee needs. With an Account Performance Security Guarantee in place, the bank is assured it will receive full payment for any calls against a company’s guarantees. This means that additional collateral is probably not required, allowing companies to focus their cash flow on other business priorities.
SURETY BOND INSURANCE
A surety company can issue a contractual or performance bond on a company’s behalf. EDC’s Surety Bond Insurance can protect the surety company in the event of a call, encouraging them to provide the company with the bonding capacity they need to sell internationally.
FOREIGN EXCHANGE FACILITY GUARANTEE
EDC’s Foreign Exchange Facility Guarantee encourages a company’s foreign exchange provider to forego the need for collateral when they sign a foreign exchange contract to lock in exchange rates. This means companies can mitigate fluctuations in exchange rates without tying up their cash flow.

86 2018-2022 Corporate Plan Summary | EDC
ANNEX I
DEVELOPMENT FINANCE INSTITUTE CANADA (DFIC) INC.
INSTITUT DE FINANCEMENT DU DÉVELOPPEMENT CANADA (IFDC) INC.
CORPORATE PLAN 2018-2022

EDC | 2018-2022 Corporate Plan Summary 87
TABLE OF CONTENTS
Introduction: Delivering on a New Mandate 88
Chapter 1: The Planning Environment 89
1.1 The Global Development Outlook 89
1.2 The Importance of the Private Sector 89
1.3 The Role of Development Finance Institutions 90
1.4 An Evolving Development Finance Landscape 90
1.5 The Canadian Context 91
1.6 A Model to Deliver Results 92
Chapter 2: DFIC’s Business Strategy 93
2.1 Introduction 93
2.2 Foundations of a Successful DFI Strategy 93
2.3 Key Priorities 93
2.4 Delivering on our Objectives: Design and Capabilities 96
2.5 A Phased Implementation 100
2.6 Transparency and Disclosure 101
2.7 Measuring Success 102
Chapter 3: DFIC Financial Plan 103
3.1 Introduction 103
3.2 Key Business Assumptions 103
3.3 Administrative Expenses 104
3.4 Capital Expenditures 105
3.5 Financial Results 106
3.6 Capital Management 109
3.7 Borrowing Strategy 109
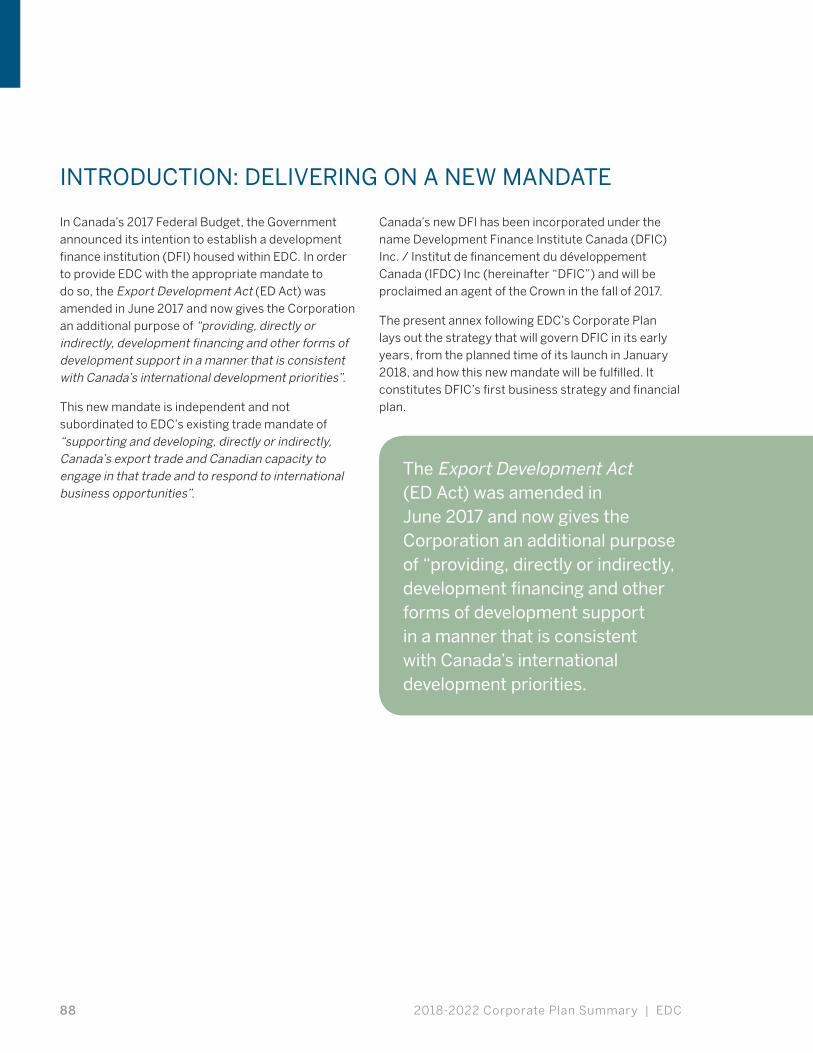
2018-2022 Corporate Plan Summary | EDC88
INTRODUCTION: DELIVERING ON A NEW MANDATE
In Canada’s 2017 Federal Budget, the Government announced its intention to establish a development finance institution (DFI) housed within EDC. In order to provide EDC with the appropriate mandate to do so, the Export Development Act (ED Act) was amended in June 2017 and now gives the Corporation an additional purpose of “providing, directly or indirectly, development financing and other forms of development support in a manner that is consistent with Canada’s international development priorities”.
This new mandate is independent and not subordinated to EDC’s existing trade mandate of “supporting and developing, directly or indirectly, Canada’s export trade and Canadian capacity to engage in that trade and to respond to international business opportunities”.
Canada’s new DFI has been incorporated under the name Development Finance Institute Canada (DFIC) Inc. / Institut de financement du développement Canada (IFDC) Inc (hereinafter “DFIC”) and will be proclaimed an agent of the Crown in the fall of 2017.
The present annex following EDC’s Corporate Plan lays out the strategy that will govern DFIC in its early years, from the planned time of its launch in January 2018, and how this new mandate will be fulfilled. It constitutes DFIC’s first business strategy and financial plan.
The Export Development Act (ED Act) was amended in June 2017 and now gives the Corporation an additional purpose of “providing, directly or indirectly, development financing and other forms of development support in a manner that is consistent with Canada’s international development priorities.
EDC | 2018-2022 Corporate Plan Summary 89
CHAPTER 1: THE PLANNING ENVIRONMENT
1.1 THE GLOBAL DEVELOPMENT OUTLOOK
Global poverty rates have generally declined over the past 25 years. However the situation varies considerably region by region and, due to population growth, the absolute number of people living under the poverty line has declined at a lesser pace. More than 800 million people were estimated to live under the poverty line in 2015, of which the large majority are in Sub-Saharan Africa and South Asia (source: United Nations).
As powerful agents of change, women have the ability to transform their households, their societies, and their economies. Yet women in most in most countries earn on average only 60 to 75 per cent of men’s wages. Greater gender equality and the empowerment of women can deliver strong economic growth and help cut down extreme poverty. Evidence shows that inclusive growth, development, and sustainable peace are not possible unless women are valued and empowered.
Climate change can often be a cause or an aggravating factor for poverty. The SDGs recognize this by including Climate Action as a top-level objective. The international community coalesced around a common agenda with the designing of the Paris agreement on Climate Change, also in the fall of 2015.
In the fall of 2015, the international community adopted a new set of global Sustainable Development Goals (SDGs), the central piece of the 2030 Agenda for Sustainable Development that sets the stage for the continued fight against poverty. These new goals put emphasis on a development model where all sources of financing are mobilized to contribute to sustainable economic growth, including from the private sector. While it is recognized that Official Development Assistance (ODA) has helped produce significant development gains over the past several decades, it is clear that meeting the SDGs will require more resources than the public sector alone can provide, and that the private sector therefore has a central role to play.
1.2 THE IMPORTANCE OF THE PRIVATE SECTOR
There is wide consensus in the development community that the private sector is a driving force behind economic growth and is essential to achieving meaningful development outcomes that raise people out of poverty. More than 9 out of 10 jobs in low and middle income countries are created by the private sector. Private financial flows now dwarf ODA. But they are not evenly distributed, and do not necessarily go where the impact on development, or the needs, are highest.
The Addis Ababa Action Agenda – a foundation for implementing the 2030 Agenda – recognizes that both public and private investment have key roles to play and highlights private business activity, investment and innovation as major drivers of productivity, inclusive economic growth and job creation. Canada was an active partner in developing this Agenda, playing a leading role in promoting the importance of leveraging private sources of finance for development.
It is widely recognized that the private sector can play a significant role in advancing the economic empowerment of women in developing countries. For instance, seventy per cent of women-owned small and medium-sized businesses in developing countries are either shut out by financial institutions or are unable to receive financing on adequate terms to meet their needs. Mobilizing capital towards enterprises that contribute to women economic empowerment, such as women-led enterprises, would help building economies that work for everyone.
There is also an increasing recognition that mobilizing private capital will be critical to address the challenges posed by climate change in developing countries and to close the $70 billion annual climate financing gap identified by the World Bank. Private sector solutions to help businesses transition to clean energy and building local capacity and linking small businesses to global sources of technology, finance, and expertise will be essential.
2018-2022 Corporate Plan Summary | EDC90
1.3 THE ROLE OF DEVELOPMENT FINANCE INSTITUTIONS
International donors are acting to optimize the contribution of private investment to development – with DFIs often being the most visible form of support. DFIs respond to the specific challenges faced by companies operating in developing countries in getting much-needed access to the financing required to grow their business – financing that they cannot obtain from traditional financial services providers. DFIs focus on achieving measurable development benefits by promoting economic growth and job creation, while also striving to contribute to the improvement of Environmental, Social and Governance (ESG) standards in the private sector.
DFIs are generally expected to be self-sustaining over time given their focus on sustainable business ventures. DFIs complement, not substitute, private investment and ODA. They act as an important link between public policy and developing programming on the one hand, and the private sector on the other, by providing an innovative, cost-effective financing tool to support economic growth in developing countries.
Most G7 countries and many other OECD countries have had bilateral DFIs for several years, sometimes decades, and have the ability to successfully deploy a wide range of instruments in support of their international development priorities, through both public and private sector channels. Canada will now also be present across these various channels.
Since 2002 total annual commitments by all DFIs have grown from $10 billion to around $70 billion in 2014 – an increase of 600 percent, spurred in part by new capital replenishment from their owners and retained profits. Official Development Assistance (ODA) grew by just 50 percent during the same period: from $88.6 billion in 2002 to $137.2 billion in 2014 (CSIS/ODI report “DFIs come of age” October 2016).
1.4 AN EVOLVING DEVELOPMENT FINANCE LANDSCAPE
The development finance landscape is undergoing significant changes. The Agenda 2030 and the Paris Agreement on Climate Change have played an important role in triggering renewed analysis of the effectiveness of existing tools and of their respective roles, including of DFIs.
Many different types of organizations are active providing development finance to the private sector: national development agencies, multilateral institutions, bilateral DFIs, private foundations, impact investors, and civil society organizations. While they all share a common goal of bringing about positive social and economic change in the developing countries where they work, they are all driven by different mandates and have different solutions to offer. These organizations, which are focused on development outcomes, work alongside pure commercial organizations also present in all markets such as local and international commercial banks and private equity firms.
As a result, there are considerable amounts of capital available in the market, seeking opportunities that match each organization’s priorities. This has resulted in some sectors and regions in a de facto competition between players, as they are attracted to what are perceived as the better transactions. This is pointing to a bottleneck: a shortage of capabilities to develop and manage projects that will attract investors. This plays out in every segment of the market, but is particularly acute in higher risk environments.
At the same time, the diversity of objectives and solutions available in development finance offers a great opportunity: by working together, each leveraging their own strengths and capabilities, they can develop a wider range of solutions and develop successful initiatives where each one individually would not have been able to.
EDC | 2018-2022 Corporate Plan Summary 91
1.5 THE CANADIAN CONTEXT
DFIC will complement the Government of Canada’s new Feminist International Assistance Policy, which stresses the need for new tools and approaches, including by engaging the private sector in developing countries:
To expand the scope and improve the effectiveness of our international assistance, Canada will increase and diversify the range of mechanisms for working with the private sector to support sustainable development. This means transforming the current service-provider role of the private sector into one in which the sector becomes an investing partner in the achievement of development results.
The establishment of DFIC comes at a critical time to support new policy directions of the Government of Canada. Prior to the creation of DFIC, Canada had a track record of largely concessional innovative development finance structures, but lacked a tool to provide commercial financing support to private sector companies in developing countries for the purposes of achieving development outcomes. Canada has long given consideration to the creation of a DFI to complement its international assistance capabilities. The Canadian government conducted in-depth due diligence in Canada and beyond to gauge the needs of the market and understand the lessons to be learned from organizations active in this space. A thorough analysis of the options led to the decision by the government to create a development finance institution housed within EDC (see “model” in next section).
The Feminist International Assistance Policy speaks to the creation of DFIC, and how it will contribute to the policy’s priorities:
Canada’s new, Montréal-headquartered DFI will play a critical role in facilitating greater private-sector investment in developing countries where access to capital is limited. By doing so, the new institution will help to create jobs, promote economic growth and reduce poverty in developing countries.
In line with the government’s feminist approach to international assistance, the new institution can help ensure that women entrepreneurs – whose success can lift up entire communities but who often find it difficult to access financing – are not left behind.
DFIC can also be instrumental in advancing the Government of Canada’s approach to combating climate change through investments in mitigation and adaptation. As part of climate finance commitments under the Paris Agreement on Climate Change, Canada has pledged $2.65 billion over five years to help developing countries transition to low-carbon, climate resilient economies.
The creation of DFIC is a strong message that Canada is taking concrete steps to diversify its action for development, and become a player in the field of private sector development finance in which it was until now not present. It also responds to the wishes of many Canadian stakeholders active in development, who have advocated for the creation of a similar instrument. This includes organizations with very different mandates but who see a convergence of interests and needs: many civil society organizations have long identified the need to better integrate the role of the private sector in their work, and developed partnerships and programs to do so; Canadian businesses active in developing countries are often at the leading edge of Canadian initiatives to develop sustainable local business ventures; impact investors have accumulated valuable expertise in what it takes for local businesses to be successful.
Collectively, they represent a wealth of complementary expertise and skills, which the Canadian DFI can aspire to work with.

2018-2022 Corporate Plan Summary | EDC92
1.6 A Model to Deliver Results
The choice of EDC to house the DFI, over the creation of a new standalone crown corporation, was driven by reasons of effectiveness and impact. EDC has demonstrated its ability to run an efficient and innovative organization. It has a number of the core capabilities required to run a successful DFI such as experience structuring transactions in challenging jurisdictions, broad financial expertise across several ranges of products, strong partner networks around the world including developing countries and a proven track record in the area of Corporate Social Responsibility.
DFIC will also benefit from the corporate services of EDC, and avoid their duplication in a new organization (see below “organizational model and capabilities”). As a result, setting up DFIC as a subsidiary of EDC will enable a much quicker implementation and will be more cost-efficient than setting up an entirely new organization.
While it is important to leverage the synergies between DFIC and EDC, it is equally important to ensure that a clear distinction is established between the two organizations, which are governed by different mandates and will have different go-to-market strategies.
DFIC will build its own capabilities to suit its development purpose, and will leverage EDC capabilities primarily for expertise and general corporate services. It will have its own decision-making capabilities, based on a set of criteria that align with its development objectives. It will also create its own brand and will seek to develop its own identity in the markets where it operates which will be clearly differentiated from EDC’s.
EDC | 2018-2022 Corporate Plan Summary 93
CHAPTER 2: DFIC’S BUSINESS STRATEGY
2.1 INTRODUCTION
Development finance is a multi-faceted space which involves many different types of organizations with different mandates, priorities and objectives. As a new entrant in this market, DFIC needs to define a market positioning which will make it relevant, impactful and a contributor to Canada’s long term development assistance objectives and priorities. The outcome will be a DFI that reflects Canada’s strengths while accomplishing its development mission.
2.2 FOUNDATIONS OF A SUCCESSFUL DFI STRATEGY
In preparing for the launch of DFIC, EDC engaged in extensive analysis of the development finance market and consulted with a broad range of organizations operating in it, including existing DFIs - both multilateral and bilateral, civil society organizations and businesses. This work helped identify the many challenges facing DFIs and factors that will contribute to the successful entry of DFIC.
DFIC will build its success on a coherent strategy that balances multiple dimensions: a clear identification of the development outcomes it is seeking; a clear set of priorities and criteria to guide its action and decisions, that align well with the Government of Canada’s; the ability to define its own value proposition and differentiate its action from that of other organizations, primarily other DFIs; the ability to leverage partnerships, both in Canada and abroad; effective governance and decision-making; the financial expertise to grow a financially sustainable portfolio, built on successful businesses in developing countries; and a well-managed appetite for risk.
2.3 KEY PRIORITIES
Working with the other government departments, EDC conducted a strategic planning exercise to more fully articulate a long term vision and priorities for DFIC to build upon the Government’s initial guidance. Building
on EDC’s and Canada’s strengths, the aspiration of DFIC is to differentiate itself by its ability to innovate, to be nimble in its operations and achieve demonstrable development impact. This section presents how it intends to achieve this aspiration.
OVERARCHING PRIORITIES
DFIC’s primary objective is to achieve meaningful and demonstrable development impact by contributing to sustainable development and reducing poverty. It will do so by focusing its action on three main themes: economic development through job creation, women economic empowerment, and climate change mitigation. DFIC’s approach will be supported by an assessment and measurement framework and scorecard built around these themes and drawing from the current best practices and experiences of existing organizations. The framework is described later in this chapter (Ensuring Development Impacts).
Achieving lasting, sustainable development impacts through the private sector requires that the entrepreneurs and business initiatives supported by DFIC be themselves financially successful in the long term. The financial sustainability of DFIC’s portfolio is therefore an indication of its success in achieving durable development impact.
DFIC will seek to be additional to the work of the private sector. “Additionality” is generally defined as the provision of a service not readily available from private sector providers. It is further broken down into financial and value additionality. Financial additionality refers to the nature of the financial transaction itself, while value additionality considers qualitative benefits – such as ESG practices - provided to the beneficiary alongside the financial transaction. DFIC will monitor the evolution of best practices and draw from them to adopt a relevant and effective approach to additionality in its decision-making process.
2018-2022 Corporate Plan Summary | EDC94
DFIC will have an important objective of seeking to mobilize private sector capacity through its action. Mobilization is the ability to attract into a transaction - or a type of transactions - private sector organizations that would otherwise not be willing to take the risks involved. Mobilization can be achieved in many different ways. To achieve it, DFIC will explore innovative structures, leverage partnerships and seek to attract private sector companies by demonstrating the feasibility of doing sound business in challenging jurisdictions. DFIC will seek to fully understand the impact and effectiveness of its action, and adopt a flexible approach to transaction structuring in order to maximize them.
DFIC is mandated by the Government to become financially self-sustaining over time. It will seek to build a balanced portfolio, one that allows it to meet that objective, while also engaging in innovative, high impact transactions.
PARTNERSHIPS
Partnerships will be critical to the success of a new organization. A DFI cannot – and should not - be successful in isolation. DFIC’s partnership strategy will be multifaceted.
First, DFIC will work closely with the Government of Canada to ensure overall coherence and maximize opportunities for synergies and collaboration. DFIC programs will complement and not substitute ODA Programs. Where relevant, DFIC will work with other government entities - such as Global Affairs Canada, including the Trade Commissioner Service and development focal points, Finance Canada and the International Development Research Centre (IDRC) - to coordinate action and share expertise for greater impact in target markets.
DFIC will also work with Canadian business and civil society organizations, each according to their respective strengths, to identify opportunities to deploy capacities in a complementary fashion, and leverage different sets of expertise.
Last, DFIC will work with selected international partners (including other DFIs and impact investors)
to develop joint strategies and offerings, share intelligence and promote the coherence of action for development.
BUSINESS PRIORITIES
DFIC developed its initial strategy by considering where and how it would be most effective to deliver on its high level objectives and on the strategic priorities laid out by the Canadian Government, and in particular contributing to the success of the local private sector, to women economic empowerment and to addressing Canada’s commitment to global efforts to address climate change. Working with local Small and Medium size Enterprises (SMEs) will be an important factor in achieving these objectives.
WHERE TO OPERATE
To fulfill their development goals and remain additional, DFIs operate in potentially challenging markets. This requires a deep knowledge and skill set, which can only be acquired and maintained through a certain degree of specialization. As a result, most DFIs focus on specific geographic areas and sectors in which they build expertise that allows them to make a difference.
Based on the guidance received from the Government, on our analysis of Canadian strengths and on the feedback received from a broad range of stakeholders, we have identified areas for initial focus, which will be further confirmed and refined as we prepare to launch DFIC and underwrite transactions in early 2018. They will continue to be assessed and reevaluated as DFIC grows and gains first hand market experience.
DFIC will require a very solid understanding of how business is done in the markets in which it operates in order to be effective at identifying, analyzing and developing quality business opportunities. The necessary expertise must be built within the organization itself, as well as leveraged from trusted partners active in those markets. Many aspects of transactional due diligence are specific to a given market and/or sector. They include understanding the legal and regulatory environment as well as business practices, and being keenly aware of the local
EDC | 2018-2022 Corporate Plan Summary 95
networks and relations. There is a considerable benefit to building up expertise over time - both in-house and through partners – as this will significantly enhance the effectiveness of the organization and its chances of success. Critically, it will help avoid making mistakes that could be financially costly and potentially damaging to the reputation of DFIC and Canada.
• Geographic focus: DFIC intends to initially conduct proactive business origination where it can rapidly ramp-up business development, thanks to the market knowledge and networks that Canadian players collectively represent.
At the current stage of planning, based on the feedback received and on an assessment of Canada’s strengths, DFIC expects to initially conduct proactive business origination in select markets in Latin America and the Caribbean. In addition to being markets where Canada has a strong presence, Latin America and the Caribbean are relatively less targeted by European DFIs, despite significant issues of poverty, income disparity and gender inequality. Within those markets, particular attention will be given to poorer regions and those insufficiently served by private sector financial service providers, for instance outside the larger urban areas.
In addition to this initial focus, DFIC will consider opportunities in countries in Sub-Saharan Africa where Canada also has a strong collective presence and where needs are high.
Generally, in selecting priority markets, DFIC will pay particular attention to the capacity-building initiatives led by the Canadian government or Canadian civil society, since a successful private sector is dependent on the local business environment and the existence of adequate governance and regulatory frameworks.
• Sector focus: Canada has strong competitive advantages in a number of sectors. DFIC will be most impactful if it initially proactively targets, and builds expertise in, a small set of priority sectors. Based on market analysis and stakeholder feedback, DFIC will initially concentrate its business origination efforts on sectors that align well with core priorities of Canada. They are broad sectors which will allow DFIC to build a diversified portfolio and demonstrate its ability to make a difference.
• Green growth: Canada’s broad expertise in clean technologies and services is a strong asset that aligns well with its international commitments. DFIC’s activities in this area are expected to focus on access to clean energy, climate change mitigation and water related initiatives, but will also consider other types of environmentally-friendly business opportunities. Investment in environmentally-friendly solutions can often have a significant direct or indirect positive impact on the lives of women and youth.
• Financial Services: sound, inclusive, and sustainable financial markets are essential to building shared prosperity and eradicating poverty. DFIC will contribute to financial inclusion by focusing on strengthening and collaborating with local financial institutions in developing countries. Through them DFIC will pay particular attention to reaching small and medium size enterprises, and to business initiatives that provide women with the access to financial services they lack.
• Agri-business: DFIC has made agribusiness a priority because of its potential for broad development impact, especially in job creation. It also offers significant opportunities to advance women economic empowerment. DFIC will seek business opportunities across the agribusiness supply chain—from production to distribution, including enabling infrastructure —to help boost production, increase liquidity, improve logistics and distribution.
• Target segments: in keeping with the priorities of the government’s Feminist International Assistance Policy, DFIC will pay particular attention to local SMEs, notably women-owned businesses and those that empower women.
For women to participate equally in contributing to economic growth, they must also have greater access to and control over assets such as land, housing and capital, as well as labour rights and social protections from precarious work situations. Limited access to financial services—such as banking, credit and insurance—makes it difficult for poor households to recover from events such as a poor harvest or a health crisis. This limited access to vital financial services also results in lost economic opportunities, particularly for small and medium-sized enterprises owned by women (Source: Feminist International Assistance Policy).
2018-2022 Corporate Plan Summary | EDC96
Beyond ownership, the benefits derived by private businesses in ensuring greater gender equality will be a strong area of focus in developing successful transactions.
When businesses address implicit bias and unsafe working conditions, when they ensure equal pay and provide family-friendly policies and flexible work options for women employees and when they allow increased participation of women in business decision making, productivity improves (Source: Feminist International Assistance Policy).
• A strong product offering: DFIC will initially focus its efforts on lending, guarantees and equity investments. It will be able to draw from EDC’s technical expertise to deliver industry-leading solutions and, over time, create a strong base for innovation in the field. In the longer term, as its portfolio grows, DFIC will consider offering other financial solutions in which EDC also has strong expertise to draw from and are relevant to the needs in the development finance market, such as political risk insurance or other forms of risk mitigation or credit enhancement.
THE ROLE OF CANADIAN PRIVATE SECTOR ENTITIES
DFIC’s mandate is to generate positive development impacts and contribute to reducing poverty. While its mandate does not include a requirement to generate benefits for Canada, DFIC will give consideration to business opportunities involving Canadian companies and other Canadian organizations. EDC heard clearly through its engagement with stakeholders that development focus and business involvement are not mutually exclusive, and can on the contrary work very effectively together. In the spirit of collaboration and of leveraging Canada’s best, DFIC will explore opportunities to work with Canadian businesses as well as innovative financiers whose capabilities, experience and knowledge of local markets can help identify impactful business opportunities and contribute to achieving DFIC’s long term development goals.
DFIC will also work with the Canadian government as it implements a more integrated and innovative approach to its international assistance, as presented in the FIAP. It will in particular consider how a better
coherence between development and other objectives such as trade can benefit the developing countries it is active in.
Better integration of development and other objectives, such as trade, can have positive economic effects for developing countries—and for Canada. As a trading nation, Canada’s economic strength depends on diversifying trade and identifying new markets for its goods and services. The same holds true for many developing countries (Source: Feminist International Assistance Policy).
2.4 DELIVERING ON OUR OBJECTIVES: DESIGN AND CAPABILITIES
In order to deliver on DFIC’s ambitious objectives of contributing to sustainable development and poverty reduction, EDC is building an organization that has the right capabilities. These efforts are guided by the following principles:
• DFIC will support impactful sustainable development through financing and investment that is additional and mobilizes private sector capacity;
• Development impact will be embedded within the organization’s management practices and capabilities
• As a separate institution and a subsidiary of EDC, DFIC will leverage EDC’s capabilities where possible;
• DFIC will seek to differentiate itself by its ability to be responsive to the speed of commercial business
• DFIC will be collaborative and leverage partnerships with government, the private sector and civil society organizations;
• DFIC will need to have the right functions, processes and controls required of a fully functional financial institution;
• The design of DFIC will be scalable, and be able to accompany the growth of the organization.

EDC | 2018-2022 Corporate Plan Summary 97
BUILDING A FINANCIAL INSTITUTION: NECESSARY COMPONENTS
The provision of financial services is subject to a number of important constrains and requirements, that fundamentally differentiate the services of a DFI from those of non-repayable international development assistance programs. They include:
• A rigorous, well-tuned approach to risk management, for both financial and non-financial risks. This includes of course credit risk, under its various facets: single obligor, industry, country, concentration. But it also includes such risks as currency, political, environmental, and reputational. DFIC will develop a comprehensive risk management framework that will enable it to be responsive to its clients’ needs in challenging environments by adequately assessing and understanding risks.
• Because DFI’s tend to commit to their clients for the long term, it is important that the monitoring and management of risks continue over the lifetime of assets; it is also important that, in the event that a client does not meet its obligations, adequate mechanisms be in place to resolve issues and maintain the viability of DFIC.
• Sound risk management practices call for the existence of clear control mechanisms. DFIC will be built according to the principles of “three lines of defense”, a core principle for financial institutions which calls for a clear separation of function between proponents of business transactions, those who approve them and those who ultimately oversee the effectiveness of processes and controls. This will require the establishment of specific functions and processes that ensure that decisions involve the appropriate balances and controls.
• Financial management capabilities that govern how DFIC manages its capital and liquidity.
• Managing a financial institution requires following a wide array of rules and disciplines. DFIC will need a comprehensive compliance framework, suited to the nature and volume of its activities. Attention will in particular be given to information
and privacy, ethical conduct, and anti-money laundering and terrorist financing. The compliance framework will continue to be developed as DFIC grows and diversifies its activities. In building Canada’s DFI, EDC recognizes the potentially problematic area of businesses domiciled in offshore financial centres. DFIC will study the practices of other DFIs with regard to the use of offshore financial centres to develop a balanced and responsible approach that protects its ability to support the private sector and respect host country laws where business operates.
GOVERNANCE: AN OVERVIEW
As a separate legal entity, DFIC will have a governance framework geared towards delivering on its specific mandate in an effective way.
DFIC will have its own Board of Directors, which will be appointed by EDC’s Board of Directors. EDC will ensure that DFIC’s Board members have the appropriate competencies to oversee the activities of DFIC and the fulfillment of its mandate. It is important that DFIC directors represent a range of expertise, including in the areas specific to the mandate of DFIC (development and/or businesses in developing countries, environmental and social including gender) and in matters of management of a financial institution operating in a complex space (strategy, financial and business risk management, compliance, program integrity, corporate organization and governance).
To complement the expertise of DFIC’s Board and given the complexity of the development finance landscape, DFIC will appoint an Advisory Council in consultation with the Minister of International Trade and the Minister of International Development. The role of the Council will be to offer guidance to DFIC with strategic intelligence and advice in the areas pertinent to DFIC’s field of activity, such as: priority sectors and regions of activity, development impact framework, opportunities for innovative approaches to development finance, monitoring and evaluation, transparency, disclosure and reporting, grievance mechanism(s), stakeholder management and engagement, sustainability goals.
2018-2022 Corporate Plan Summary | EDC98
The Advisory Council will be designed to reflect the diversity of the field and of the stakeholder community. Its members will be selected based on their expertise and credibility in the field of development finance and/or of development through the private sector. They will be drawn from different categories representing the breadth of stakeholders; particular attention will be given to achieving an appropriate gender balance and official language capacity in its membership.
In order to lead DFIC, a Managing Director will be appointed, and will report directly to DFIC’s Board of Directors. The Managing Director will play a critical role in steering DFIC to success in its early years, refining and leading the execution of its strategy, hiring and leading the staff and ensuring DFIC has the required capabilities to be successful.
ORGANIZATIONAL MODEL AND CAPABILITIES
The organizational model chosen by the government is that of a separate organization governed by a separate mandate and leveraging the capabilities of EDC in order to generate efficiencies and allow DFIC to be implemented effectively and rapidly. This will be particularly important in the areas specific to the successful management of a financial institution, such as financial and risk management, compliance, program development and integrity.
An in-depth analysis was conducted to determine in greater detail the most effective model following this broad design principle. Particular attention was given to where DFIC will need dedicated capabilities, where it will be able to share services with EDC, and how to ensure that these services best suit the need of DFIC. The principles outlined at the beginning of this section helped guide this design work.
The model that was developed will be anchored by a dedicated DFIC team, which will deliver its core functions. This core team will be based in Montreal, in offices which are currently being sourced. Dedicated capabilities will be built within DFIC in two main areas: corporate functions and transaction management. These functions are in the process of being defined in greater detail.
Other functions will be drawn from EDC under a shared services model, governed by Service Level Agreements (SLAs) between EDC and DFIC. This approach will allow DFIC to benefit from a critical mass and depth of expertise available at EDC while achieving cost efficiencies.
PEOPLE
DFIC will seek to identify the best talent available to deliver on its objectives. Recruitment will focus on the unique blend of experience and capabilities that reflect the objectives and priorities of DFIC. It will seek to hire professionals that can, collectively, deliver innovative financial solutions to help create the desired development impact, notably alleviating poverty, contributing to women economic empowerment and addressing climate change. The people DFIC hires, its leadership and the environment generated by its mandate and operations will all contribute to the development of a distinct corporate culture.
DFIC will offer an Employee Value Proposition that will ensure it can attract and retain the talent it needs. It will draw from EDC’s best practices in human resources management, including its code of conduct for employees.
The performance of DFIC employees will be measured and assessed against DFIC’s specific mandate and objectives, and particularly its ability to achieve development impacts. This principle was brought up by many stakeholders in our consultation and is very consistent with EDC’s culture of performance and of alignment of personal accountability with corporate success.
ENSURING DEVELOPMENT IMPACTS
The primary mission of DFIC is to contribute to the economic and social development of the communities and countries in which it is active, through the private sector it supports. While simple to state, this objective represents a challenge for all institutions involved in development, and DFIs are no exception.
EDC | 2018-2022 Corporate Plan Summary 99
The subject matter is complex. Many different models exist to identify, assess and measure the impact of initiatives seeking to promote development and reduce poverty. Many of the organizations we have consulted in building DFIC admit to the challenge, and no organization claims to have a perfect model. For DFIs, the challenge is increased by the natural tension existing between the simultaneous pursuit of development impacts and financial sustainability.
As a new entrant in the market, DFIC has the opportunity to learn from what others have done. Conscious of the difficulty to build a Development Impact Framework from the ground up, EDC has retained the services of a consulting firm specialized in the field, and with considerable experience working with DFIs, and tasked it with a primary mission to conduct a thorough analysis of a variety of existing DFIs’ development impact practices.
On the basis of the outcomes of this study, EDC will before the end of 2017 develop a framework for DFIC to assess the business opportunities it considers, and measure the actual impact of transactions it has concluded. The framework will be integrated into the decision-making processes of DFIC and DFIC staff training. Development impact considerations will be embedded throughout DFIC’s corporate practices.
More details on the approach DFIC will adopt, and the general principles it will follow are provided later in this chapter (Measuring Success).
BUILDING MONITORING AND EVALUATION CAPABILITIES
The monitoring and evaluation of the performance and impact of transactions over their lifetime is a critical aspect of DFIs’ activities and an important contributor to their credibility. It allows them to provide quality reporting on the non-financial value of investments, and to learn from their own activities. It requires resources and methodology.
DFIC will develop a system for monitoring and evaluating development impacts. In building this system, it will need to make sure that it is cost-efficient and practical from the perspective of its clients.
The ability of private sector clients in developing countries to provide consistent and reliable data is a well-known challenge to organizations active in development finance. Guidance received to date indicates that choosing reporting indicators that also constitute useful intelligence for a client to manage its business can considerably improve the collection of data and its quality.
Finally, DFIC will design a process to ensure a feedback loop (lessons learned) from its monitoring and evaluation practices back into the institution. In this manner, lessons from past individual transactions can inform decision-making and the design of future transactions.
A STRONG ENVIRONMENTAL SOCIAL AND GOVERNANCE PRACTICE
In addition to ensuring that their support of entrepreneurs in developing countries leads to meaningful and measurable impact, DFIs pay particular attention to the practices and capabilities of their clients in the areas of ESG practices.
In doing so, not only do they ensure that the companies they work with meet some key standards, they also help them achieve higher standards, and become examples of good practices in their community.
ESG expertise is a core function within DFIs and is in most cases fully embedded in their transactional teams. Based on the benchmarking conducted of other DFIs, and the input from many stakeholders, DFIC will build its own, dedicated ESG practice. In addition, it will draw from EDC’s depth of expertise in Corporate Social Responsibility and build upon its best practices.
2018-2022 Corporate Plan Summary | EDC100
TECHNICAL ADVISORY SERVICES
DFI financial services are typically complemented by technical advisory services, delivered on a cost-sharing or grant basis (i.e. technical assistance). Their purpose is to improve the ESG practices of the businesses with which DFIs work. Technical advisory services are considered particularly important to achieve positive outcomes in some of the key areas identified as priorities for DFIC, such as women economic empowerment and gender equality, and the success of SMEs.
DFIC will not provide grant-based technical assistance from its own resources or have dedicated resources to administer these services. However, technical assistance funds have been set aside within Global Affairs Canada, who will work closely with DFIC over the next year to formulate an arrangement to provide technical advisory services in a streamlined fashion, through consultancies to businesses supported by DFIC.
BUILDING A DISTINCT DFI BRAND
EDC has begun working with communications specialists to develop a distinct DFIC brand that will help establish a strong, recognizable identify in the market. The brand will be different from EDC’s and will, like EDC’s, reflect values of reliability and professionalism.
The brand will be supported by a dedicated DFIC website designed to connect to its clients, partners and stakeholders.
2.5 A PHASED IMPLEMENTATION
DFIC has set the ambitious objective of becoming a recognized innovator in development finance. It will start its operations with the backing of a strong parent (EDC), the depth of expertise of the Canadian government, and will work to leverage the support and know-how of a wide range of Canadian civil society and private sector organizations.
Developing to reach its full potential will however take time. The growth strategy of DFIC in its initial years is to focus on learning, experimenting and on building strong foundations.
2018 - launch: DFIC is scheduled to be launched in January 2018, with basic capabilities and infrastructure. 2018 will be a learning and foundational year, both from an organizational and business perspective.
• Organization: DFIC will continue building its capabilities and staff, with a strong focus on training and team building. It is anticipated that initial staff will come from various organizations, and ensuring cohesion and alignment of purpose will be important for future successes. As it begins operations, DFIC will also need to create, consolidate, adjust and improve its internal processes, with a focus on alignment with its objectives and scorecard. The head office of DFIC will be located in Montreal once adequate facilities have been set up, which is anticipated to occur mid-year.
• Business: in its first year in the market, DFIC will need to build a network of trusted partners in the areas where it wants to focus, and generate a pipeline of quality opportunities. By all accounts, the gestation of development finance transactions takes considerable time. DFIC will need to begin establishing itself as a credible organization, both with partners and with potential clients, and early signals will be important.
EDC | 2018-2022 Corporate Plan Summary 101
2019 - affirming DFIC’s identity: as DFIC and its staff gain experience, it will seek to take increasing levels of leadership and initiative in transaction development and underwriting. The goal is for those transactions to begin demonstrating the DFIC’s innovative capabilities, as well as its ability to deliver according to predictable and competitive time frames, in an industry where slow response times is often pointed to as a significant shortcoming.
This period will constitute a new level of learning for the organization as a whole, as it grows its portfolio while managing its existing assets. This is also the year in which DFIC will publish its first annual report, and strengthen its reporting and evaluation practices.
2020 and beyond: as a two-year old institution, DFIC will still be on a steep learning curve for a number of years. Over the remainder of this 5-year planning period, DFIC will need to achieve a number of important objectives:
• Continue diversifying and consolidating its portfolio of transactions, towards financial sustainability. This will require in particular balancing its investment and lending activities. It is generally recognized that equity investments, whether direct or in funds, can generate greater development impacts if well-structured and managed. While equity can also generate greater financial returns in the long run, it is more costly to initially underwrite and has a much longer return cycle. The DFI will therefore initially rely on a greater proportion of debt transactions, to help generate revenue early on.
• As it matures, DFIC will need to keep adjusting its organization to its business activity, with a focus on improving the effectiveness of its processes and its overall productivity. It will in particular need to adapt and strengthen its information technology platform to manage its growing portfolio.
• During these years, DFIC is expected to be in a leading position for a growing proportion of the transactions it enters into, and to demonstrate its ability to develop innovative structures and solutions.
2.6 TRANSPARENCY AND DISCLOSURE
In order to respond to both high and diverse expectations, regular and continuous engagement with stakeholders will be critical as we launch operations and throughout the life of this new organization. Transparency through disclosure of information will constitute an important tool to meet those expectations. DFIC aims to be as transparent as possible without compromising commercially sensitive information from clients. A dedicated website for DFIC will be a key tool for making information available to stakeholders. This will include providing clarity on the criteria and processes that DFIC will follow to decide on business transactions, such as its development impact assessment criteria, and ESG standards.
Post commitment, and during the length of its involvement, DFIC will provide regular updates to stakeholders on individual transactions, outlining its key developmental and ESG benefits, including gender equality and empowerment, sharing the lessons learned and telling the story of the communities and individuals impacted.
To meet the anticipated demand for a transparent operation, DFIC will develop a regular cadence of stakeholder sessions to directly seek views and test ideas, and to complement the guidance received from the Advisory Council. In developing its internal centre of expertise on development finance, DFIC will collaborate with, and be informed by partnerships with others, in academia and professional organizations, both in Canada and abroad.
DFIC will for instance seek to convene discussions with stakeholders on women economic empowerment, and contribute to identifying innovative ways in which private sector activities can best achieve outcomes in this domain.
2018-2022 Corporate Plan Summary | EDC102
2.7 MEASURING SUCCESS
DFIC is designing a corporate scorecard that will keep it focused on its key objectives. There will be several components to this scorecard. This section reviews the approach adopted to design these various components.
DEVELOPMENT IMPACT
As mentioned previously (Ensuring Development Impact) DFIC’s impact scorecard will be based on the best practices of existing DFIs, and built around key principles. It takes into account the input and guidance we have received from many stakeholders.
At the core will be clear identification of the type of change DFIC wants to bring about, and how it correlates with SDGs. We anticipate that three SDGs will be particularly relevant to DFIC, its strategic direction and that of the government: SDG 5 – gender equality, SDG 8 – decent work and economic growth, and SDG 13 – climate action.
The more detailed indicators used by DFIC will be determined with the following criteria in mind:
• for coherence of purpose, priority sectors of action will be determined on the basis of their inherent positive impacts;
• They will be aligned with current best practices of the international community, such as the Harmonized Indicators for Private Sector Operations (HIPSO – a joint initiative of 25 International Financial Institutions, including DFIs);
• Chosen indicators will measure what matters; they will be based on the known availability of consistent and reliable data across sectors and geographies, in order to support comparability and consistency of action;
• They will take into account the constraints of DFI clients in matters of administration and reporting, with the goal for the chosen indicators to also serve the needs of the clients in building better, more sustainable businesses;
• Indicators will need to be based on data that can be measured in a cost-effective way
The details of the future corporate scorecard will be determined with the help of an external consultant in the fall of 2017. It will be anchored around three themes that align well with the SDGs, for which specific indicators and methodologies suitable for private sector activity will be identified:
• Local economic impact, through job creation
• Women economic empowerment
• Climate change mitigation
Recognizing that indicators must be limited in number and aligned to the Government’s development agenda, attention will also be given to indicators that are of more general value, are commonly used by other development finance institutions and that can be enduring. The impact assessment and measurement framework will include a pre-investment screening tool that will allow the comparison between different opportunities and help direct decisions to the most impactful ones. It will also identify the information required by DFIC to measure the impact of its active transactions, and where it will be sourced.
NON-QUANTITATIVE BENEFITS
In addition to quantitative metrics, DFIC will ensure it understands and evaluates the qualitative effects of its action, and reports on it.
ADDITIONALITY AND MOBILIZATION
DFIC will include in its decision-making, but also track, the way it ensures that its action is additional to that of the private sector It will also measure the extent to which its action has led to the deployment of private sector capacity. It will continue assessing the effectiveness of its tracking methodologies and be an active participant in the development of best international practices.
FINANCIAL SUCCESS AND SUSTAINABILITY
As a self-sustaining financial institution, DFIC will report regularly to the government of Canada, through EDC’s regular reporting, on its financial performance and that of its portfolio.
EDC | 2018-2022 Corporate Plan Summary 103
CHAPTER 3: DFIC FINANCIAL PLAN
3.1 INTRODUCTION
Key items to highlight in the Financial Plan are as follows:
• DFIC will initially be funded by capital injected by its parent company, Export Development Canada (“EDC”). Injections of $100 million are forecast to occur in 2018, 2019 and 2020.
• We are projecting a net loss of $9 million in 2018 which will gradually reduce to a loss of $3 million by 2022.
• Loans receivable are projected to grow from $40 million in 2018 to over $600 million by the end of the plan period.
• Investments are projected to grow to $45 million by the end of the plan period.
EDC will engage in any borrowing, investing and hedging activities on behalf of DFIC.
In the Financial Plan, we will first present the key business assumptions which were used to derive our projected financial results followed by a discussion of our projected operating expenses and planned capital expenditures. Projected financial statements are also included.
3.2 KEY BUSINESS ASSUMPTIONS
A series of key assumptions, including business facilitated, risk profile of business facilitated, foreign exchange and interest rates, all of which have an impact on our business activity and financial performance, drive the Financial Plan. Using these assumptions, which align with our business strategy and economic outlook, projected financial statements are developed for the planning period, including a forecast to the end of the current fiscal year. Any changes to our business strategy or to the underlying assumptions may materially affect the projections over the planning period.
BUSINESS FACILITATED
2018 PLAN
We are projecting business facilitated to be $55 million in the first year of DFIC operations.
2019 TO 2022 PLAN
We are projecting year over year growth of business facilitated in our financing and investments program to be in the range of 28 per cent to 100 per cent between 2019 and 2022, as market awareness of DFIC increases and early business development efforts start to deliver benefits.
RISK PROFILE OF BUSINESS FACILITATED
We are projecting that the financing and investment business undertaken by DFIC will be 100% non-investment grade. The risk profile of the financing portfolio is one of the key drivers of both the provision for credit losses and capital demand for credit risk.

2018-2022 Corporate Plan Summary | EDC104
FOREIGN EXCHANGE
The Financial Plan uses a year-to-date average rate as the U.S. dollar foreign exchange rate assumption for the remainder of 2017 and all subsequent years. This methodology removes the volatility associated with yearly dollar fluctuations and ensures more comparable projections. The rate used in this Plan, based on the average rate for the period January 2017 through June 2017, is U.S. $0.75.
INTEREST RATES
This forecast is based on Bloomberg financial market data, and is driven by supply and demand as well as market expectations for interest rates.
3.3 ADMINISTRATIVE EXPENSES
Table 1: Projected Administrative Expenses (2017-2022)
2017 2018 2019 2020 2021 2022(in millions of Canadian dollars) Fcst Plan Plan Plan Plan PlanSalaries and benefitsAdministration costsProfessional servicesMarketing and communicationsOther
Total administrative expenses
2.5 2.5
4.4 9.4 9.6 10.3 10.7 11.5
0.6 1.7 2.0 2.3 1.3 1.3 0.4 0.7 1.1 1.3
1.6 1.7 1.6 1.1 1.0 1.0 1.0 1.1 1.5 1.7 1.7 1.7 0.3 4.2 3.8 4.0 4.3 4.9
We are targeting administrative expenses of $9.4 million for 2018. Items of significance in our administrative expense projections for 2018 and beyond are as follows:
• Salaries and benefits as we onboard new employees to support DFIC’s business.
• Administration costs represent expenses incurred by EDC in respect of services that it will provide to DFIC under Service Level Agreements.
• Professional services are mainly consulting fees to start up and continuously improve operations, as well as legal costs to investigate new markets and develop transaction documentation standards.
• Marketing and communications costs will be incurred as we build brand awareness and create business opportunities in support of sustainable development in emerging economies. Also included are costs to report back to key stakeholders on the activities of DFIC.

EDC | 2018-2022 Corporate Plan Summary 105
Table 2: Travel and Hospitality Expenses (2017-2022)
2017 2018 2019 2020 2021 2022(in thousands of Canadian dollars) Fcst Plan Plan Plan Plan PlanTravelHospitalityConferences
Total 120 545 491 612 633 664
- 100 100 100 100 100 10 10 11 12 13 14
110 435 380 500 520 550
Table 3: Travel and Hospitality Expenses as a Percentage of Total Administrative Expenses (2017-2022)
2017 2018 2019 2020 2021 2022(in thousands of Canadian dollars) Fcst Plan Plan Plan Plan PlanTotal travel and hospitality expensesTotal administrative expenses
Travel and hospitality as a % of total administrative expenses 2.7% 5.8% 5.1% 5.9% 5.9% 5.8%
4,403 9,441 9,573 10,298 10,666 11,539 120 545 491 612 633 664
3.4 CAPITAL EXPENDITURES
Table 4: Projected Capital Expenditures (2017-2022)
2017 2018 2019 2020 2021 2022(in millions of Canadian dollars) Fcst Plan Plan Plan Plan PlanFacilities*Information technology
Total capital expenditures
- 1.3 - - - -
0.4
0.5 2.1 0.8 0.4 0.4 0.4
0.5 3.4 0.8 0.4 0.4
* Facilities capital expenditures include leasehold improvements and furniture and equipment. Information technology capital expenditures include hardware, internally developed and purchased software.
Facilities expenditures of $1.3 million are included in the 2018 plan for leasehold improvements and purchases related to the opening of DFIC’s office in Montreal.
Capital expenditures for information technology are projected to be $0.5 million for 2017 and $2.1 million for 2018 as we invest in the configuration of systems to be used by DFIC and for purchases, enhancements and licenses of required technology.
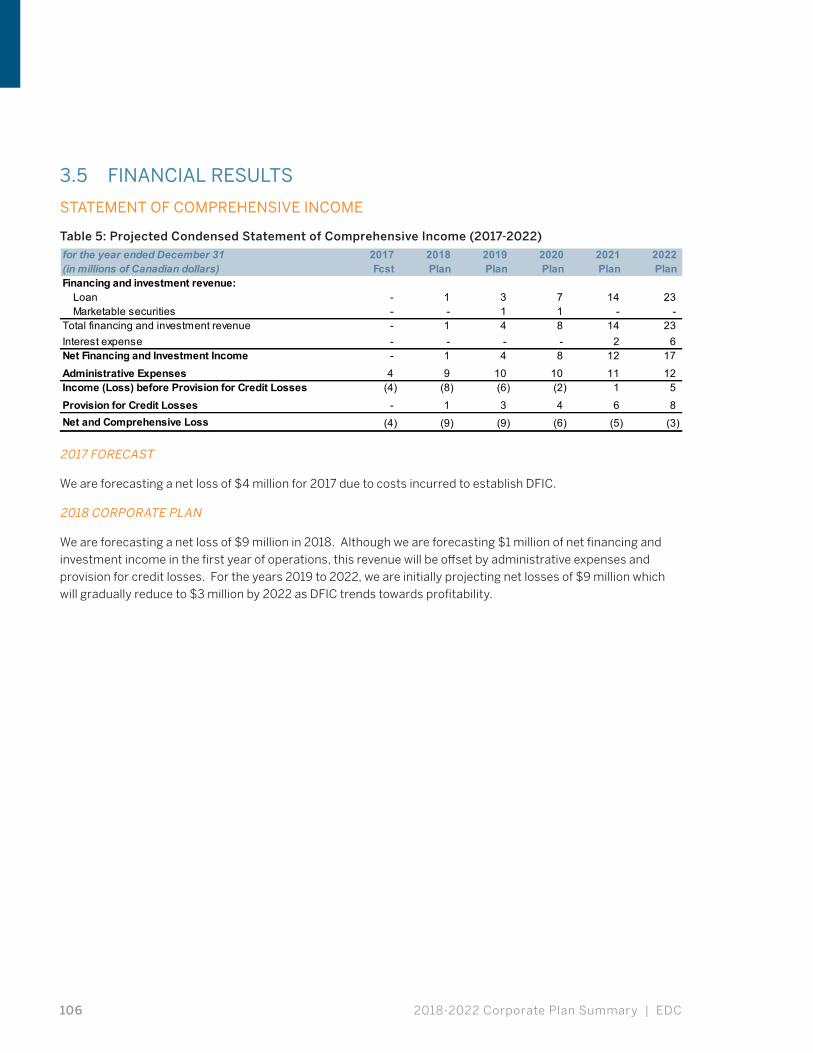
2018-2022 Corporate Plan Summary | EDC106
3.5 FINANCIAL RESULTS
STATEMENT OF COMPREHENSIVE INCOME
Table 5: Projected Condensed Statement of Comprehensive Income (2017-2022)
for the year ended December 31 2017 2018 2019 2020 2021 2022(in millions of Canadian dollars) Fcst Plan Plan Plan Plan PlanFinancing and investment revenue:
LoanMarketable securities
Total financing and investment revenueInterest expenseNet Financing and Investment Income 9 Administrative ExpensesIncome (Loss) before Provision for Credit LossesProvision for Credit LossesNet and Comprehensive Loss (5) (3) (4) (9) (9) (6)
6 8 - 1 3 4
11 12 (4) (8) (6) (2) 1 5 4 9 10 10
12 17 - 1 4 8
14 23 - - - - 2 6 1 - 4 8
- - - - 1 1 23 - 1 3 7 14
2017 FORECAST
We are forecasting a net loss of $4 million for 2017 due to costs incurred to establish DFIC.
2018 CORPORATE PLAN
We are forecasting a net loss of $9 million in 2018. Although we are forecasting $1 million of net financing and investment income in the first year of operations, this revenue will be offset by administrative expenses and provision for credit losses. For the years 2019 to 2022, we are initially projecting net losses of $9 million which will gradually reduce to $3 million by 2022 as DFIC trends towards profitability.
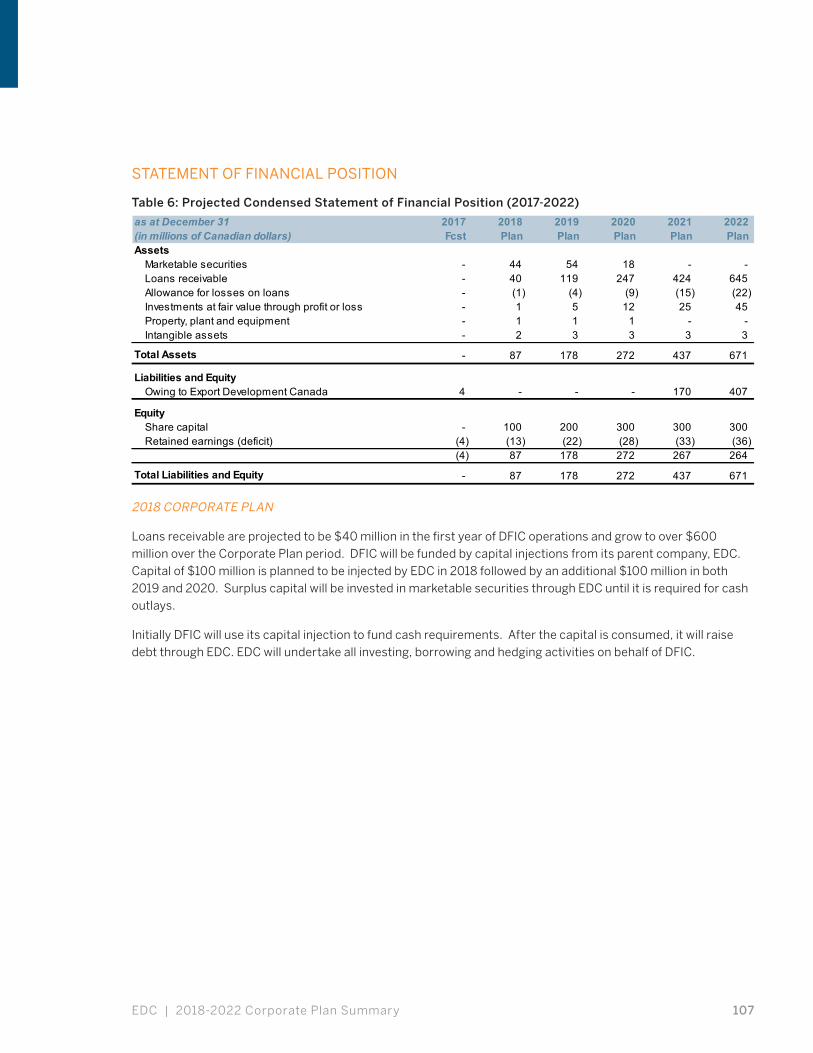
EDC | 2018-2022 Corporate Plan Summary 107
STATEMENT OF FINANCIAL POSITION
Table 6: Projected Condensed Statement of Financial Position (2017-2022)
as at December 31 2017 2018 2019 2020 2021 2022(in millions of Canadian dollars) Fcst Plan Plan Plan Plan PlanAssets
Marketable securitiesLoans receivableAllowance for losses on loansInvestments at fair value through profit or lossProperty, plant and equipmentIntangible assets
Total Assets
Liabilities and EquityOwing to Export Development Canada
EquityShare capitalRetained earnings (deficit)
Total Liabilities and Equity 437 671 - 87 178 272
(33) (36) (4) 87 178 272 267 264 (4) (13) (22) (28)
- 100 200 300 300 300
4 - - - 170 407
437 671 - 87 178 272
3 3 - 2 3 3 - 1 1 1 - -
(15) (22) - 1 5 12 25 45 - (1) (4) (9) - 40 119 247 424 645
- - - 44 54 18
2018 CORPORATE PLAN
Loans receivable are projected to be $40 million in the first year of DFIC operations and grow to over $600 million over the Corporate Plan period. DFIC will be funded by capital injections from its parent company, EDC. Capital of $100 million is planned to be injected by EDC in 2018 followed by an additional $100 million in both 2019 and 2020. Surplus capital will be invested in marketable securities through EDC until it is required for cash outlays.
Initially DFIC will use its capital injection to fund cash requirements. After the capital is consumed, it will raise debt through EDC. EDC will undertake all investing, borrowing and hedging activities on behalf of DFIC.

2018-2022 Corporate Plan Summary | EDC108
STATEMENT OF CHANGES IN EQUITY
Table 7: Projected Condensed Statement of Changes in Equity (2017-2022)
for the year ended December 31 2017 2018 2019 2020 2021 2022(in millions of Canadian dollars) Fcst Plan Plan Plan Plan PlanShare Capital - 100 200 300 300 300
Retained Earnings (Deficit)Balance beginning of year - (4) (13) (22) (28) (33) Net loss (4) (9) (9) (6) (5) (3) Balance end of year (4) (13) (22) (28) (33) (36) Total Equity (Deficit) at End of Year (4) 87 178 272 267 264
Return on Equity -21.7% -6.8% -2.7% -1.9%n/a -1.1%
STATEMENT OF CASH FLOWS
Table 8: Projected Condensed Statement of Cash Flows (2017-2022)
for the year ended December 31 2017 2018 2019 2020 2021 2022(in millions of Canadian dollars) Fcst Plan Plan Plan Plan PlanCash Flows from (used in) Operating ActivitiesNet lossAdjustments to determine net cash from (used in) operating activities
Provision for credit lossesDepreciation and amortization
Changes in operating assets and liabilitiesLoan disbursementsLoan repaymentsNet cash used in operating activities
Cash Flows used in Investing ActivitiesDisbursements for investmentsNet cash used in investing activities
Cash Flows from Financing ActivitiesAmounts borrowed from Export Development CanadaCapital injectionNet cash from financing activities
Net increase (decrease) in cash and cash equivalents
Cash and cash equivalentsBeginning of periodEnd of period
Cash and cash equivalents are comprised ofCashCash equivalents included within marketable securitiesEnd of period
- - - 44 54 18 - - - 44 54 18
- -
- - - - - -
- 44 54 18
(18) -
- - 44 54 18 -
- 44 10 (36)
170 237 - 100 100 100
170 237 - 100 100 100 - - - - - -
(13) (20) (1) - (4) (8) - (1) (4) (8) (13) (20)
(175) (217) - (55) (86) (128)
(189) (243) - 1 3 7 14 23 - (41) (81) (135)
(2) (3) 4 (7) (2) 1 1 1 - - - 1 6 8 - 1 3 4
(5) (3) (4) (9) (9) (6)
EDC | 2018-2022 Corporate Plan Summary 109
ACCOUNTING POLICIES AND FUTURE ACCOUNTING CHANGES
The accounting policies used in the preparation of this Financial Plan are in accordance with International Financial Reporting Standards (IFRS) currently in effect. The earnings of the corporation are not subject to the requirements of the Income Tax Act.
AMENDED AND EVOLVING STANDARDS
The International Accounting Standards Board (IASB) has a number of projects underway, some of which will affect the standards relevant to DFIC.
IFRS 16 – Leases – In January 2016, the IASB released the new Leases Standard requiring lessees to recognize assets and liabilities for the rights and obligations created by leases. The standard is expected to impact DFIC’s financial statements and is effective for reporting periods beginning on or after January 1, 2019.
3.6 CAPITAL MANAGEMENT
CAPITAL ADEQUACY POLICY
For the initial years of operations it is anticipated that the supply of capital (i.e. the capital injection) will meet all of the operating needs of the corporation. During that period, DFIC will develop a capital management framework.
3.7 BORROWING STRATEGY
BORROWING AUTHORITY
Pursuant to EDC’s expanded mandate under section 10(1)(c) of the amended Export Development Act, EDC has incorporated Development Finance Institute Canada as a wholly owned subsidiary of EDC. DFIC will not borrow money in the markets and will, when required, borrow from EDC who is permitted to borrow money under section 12 of the Export Development Act.
BORROWING STRATEGY
EDC will capitalize DFIC with CAD 100 million in each of 2018, 2019 and 2020. EDC will provide debt financing to DFIC once the CAD 300 million injection has been fully utilized. EDC Treasury will leverage its expertise to undertake all borrowing, investing, hedging and foreign exchange activities on behalf of DFIC.


EDC is the owner of trademarks and official marks. Any use of an EDC trademark or official mark without written permission is strictly prohibited. All other trademarks appearing in this document are the property of their respective owners. The information presented is subject to change without notice. EDC assumes no responsibility for inaccuracies contained herein. Copyright © 2018 Export Development Canada. All rights reserved.