Embed Size (px)
Citation preview
SINDH UNIVERSITYRESEARCHJOURNAL (SCIENCESERIES)
Statistical Analysis of Extremes of Temperature, Precipitation and Humidity in Swat Region
U. H. BANGASH++, M. IRFAN, M. M. ALAM*
Civil Engineering Department, Iqra National University Peshawar, Pakistan
Received 24th May 2018 and Revised 28th October2018
1. INTRODUCTION A. Different Weather Parameters.
This thesis will cover study of basic statics of
precipitation, temperature and humidity of each station in valley of swat. This thesis will cover normal and
extremes of precipitation, temperature and humidity
from one region to another in swat region. The annual
precipitation in Pakistan in which area of jocabad,
nushki and pangur receive precipitation 125-250 mm.
Quetta, Multan, Kalat, D.I khan and Karachi receives
precipitation 250-375mm. Zhob,Sahiwal and Peshawar
receive precipitation 375-500mm. Rawalpindi,
Sargodha,Lahore and Parachinar receive precipitation
500-750mm. Islamabad, Chitral and Gilgit receive
precipitation above 750mm. Maximum Temperature in
Pakistan in which Sindh and south Punjab maximum
temperature is 32 -36°C.Kirthar region of Baluchistan, makran coastal region, Baluchistan plateau of south
west of Pakistan, central Punjab , central and south
Khyber Pakhtunkhwa and Fata maximum temperature
is 28-32°C. Azad Kashmir, upper Khyber Pakhtunkhwa,
Quetta and Chaman of Baluchistan maximum
temperature is 24-28°C. Nanga parbat, kaghan, kalam of
Khyber Pakhtunkhwa maximum temperature is 18-
24°C.
Fig 1. Precipitation Map of Pakistan
Fig 2. Maximum Temperature Map of Pakistan
SindhUniv. Res. Jour. (Sci. Ser.) Vol.50(004) 495-506 (2018)
Abstract: If a specific area (station) data cannot be obtained due to natural disaster, Meteorological instrument limitations and
instability in that area (terrorist attack swat 2009).We need a solid equation to calculate the missing values. Climate change is
important factors now a day extreme events of precipitation and temperature are increasing for that purpose we need an equations of
extreme.11 year (2006-2016) data of daily basis temperature, precipitation and humidity of three stations Saidu Sharif, Malam Jabba
and Kalam is collected quality and controlled of data maintained by removing errors in data. The result is divided in two parts basic
statistics of each individual station and dependence structure among different stations. Basic Statics consist of mean, standard
deviation, Skewness, kurtosis, histograms and percentiles curves for better understanding of statistical behavior of data of each
station. Dependence structure among different station consist Q-Q Plots to verify normality of data. Points closed to reference line
means data is normally distributed and give more accurate linear regression model. Correlation and extreme correlation are developed
to analyze the strength of relation among different station. Coefficient of determination and extreme coefficient of determination
guide us to check the accuracy and validity of linear regression model. Linear regression equations of normal and extreme
temperature, precipitation and humidity are developed from linear regression models. These linear regression equations of normal,
upper extreme (90%) and lower extreme (10%) used to compute the missing data of one station from data of another station. It does
not give us the actual temperature, precipitation and humidity actually happens at that day but closest to the actual value.
Keywords: Skewness, Kurtosis, histogram, linear regression, Q-Q Plots.
http://doi.org/10.26692/sujo/2018.12.0080
++Corresponding author: Usama Habib Bangash [email protected] [email protected] [email protected]
*Civil Engineering Department University of Engineering and Technology City University Peshawar
Minimum Temperature in Pakistan in which Sindh,
Makran coastal region and Rahim Yar Khan of Punjab
shows minimum temperature 20-24°C.From Kirthar
range, Central Punjab, upper Punjab, central Khyber Pakhtunkhwa, south Khyber Pakhtunkhwa and Fata
minimum temperature is 16-20°C.Upper Khyber
Pakhtunkhwa, Baluchistan plateau south east region of
Pakistan and Azad Kashmir minimum temperature is 8-
12°C. Quetta, Chaman and Gilgit shows minimum
temperature less than 8°.C
Fig 3. Minimum Temperature of Pakistan
B. About Swat Area.
Swat is topographically mountainous area. It can be
further subdivided in two region swat Kohistan and swat
valley. Swat Kohistan is the mountainous region of swat
and upper area of Swat River. Swat valley is further
subdivided in two lower Swat and upper Swat .Kalam station is located in Khyber Pakhtunkhwa of Pakistan
between latitude is 35’50’’, longitude 72’59’’ and
elevation of 2103.01 meter. The study area is
surrounded by upper dir in the west, lower swat in
south, Kohistan in east, Ghizer district in north and
chitral in south west. Catchment whole area of kalam is
approximately 2032 square kilometer. (H.mateeul
2008).Saidu Sharif station is located in Khyber
pakhtunkhwa of Pakistan between latitude is 34’44’’,
longitude is 72’21’’ and elevation of 961 meter. The
study area is surrounded by kalam in north, Shanglain
east, lower dir in west and Malakand division in
south.Malam Jabba hill station is located in Khyber
Pakhtunkhwa of Pakistan between latitude of 35’49’’,
longitude is 72’54’’ and elevation is 2590.67 meter. The
study area is surrounded by kalam in north, Shanglain
east, lower dir in west and Malakand division in south.The whole catchment of swat valley belong to
tributaries of Indus River. Swat River joins the Kabul
River then from Kabul River it reaches to Indus River.
The distance between Saidu Sharif to malamjabba
station is 48 km.The distance between stations of kalam
to SaiduSharif is 102 Kilometer. The distance between
kalam to malam Jabba station is 126 Kilometer.
Fig 4. Physical characteristic of Saidu Sharif and Malam Jabba
C. Temperature and Precipitation of Swat region.
The swat is climatically the subtropical and moist
temperate zone with heavy rain fall and snow. This area
has pleasant summer and severe winter. The summer of
swat is moderate and short. Lower swat valley like
SaiduSharif show warm but cool in upper north part like
kalam. Kalam mean annual minimum temperature is-
4°C and mean annual maximum temperature is
24°C.Kalam maximum relative humidity 100% and minimum relative humidity is 31%.Kalam receives
annual precipitation of 900mm (millimeter).SaiduSharif
annual minimum temperature is 2°C and mean annual
maximum temperature is 31°C.Saidu Sharif maximum
relative humidity 100% and minimum relative humidity
is 30%.Saidu Sharif receives annual precipitation of 849
(millimeter).Malam Jabba mean annual minimum
temperature -2°C and mean annual maximum
temperature 21°C. Malam Jabba maximum relative
humidity 100% and minimum relative humidity is
31%.Saidu Sharif receives annual precipitation of
1971mm (millimeter).According to Peshawar
meteorological department Khyber Pakhtunkhwa
Pakistan 2016.
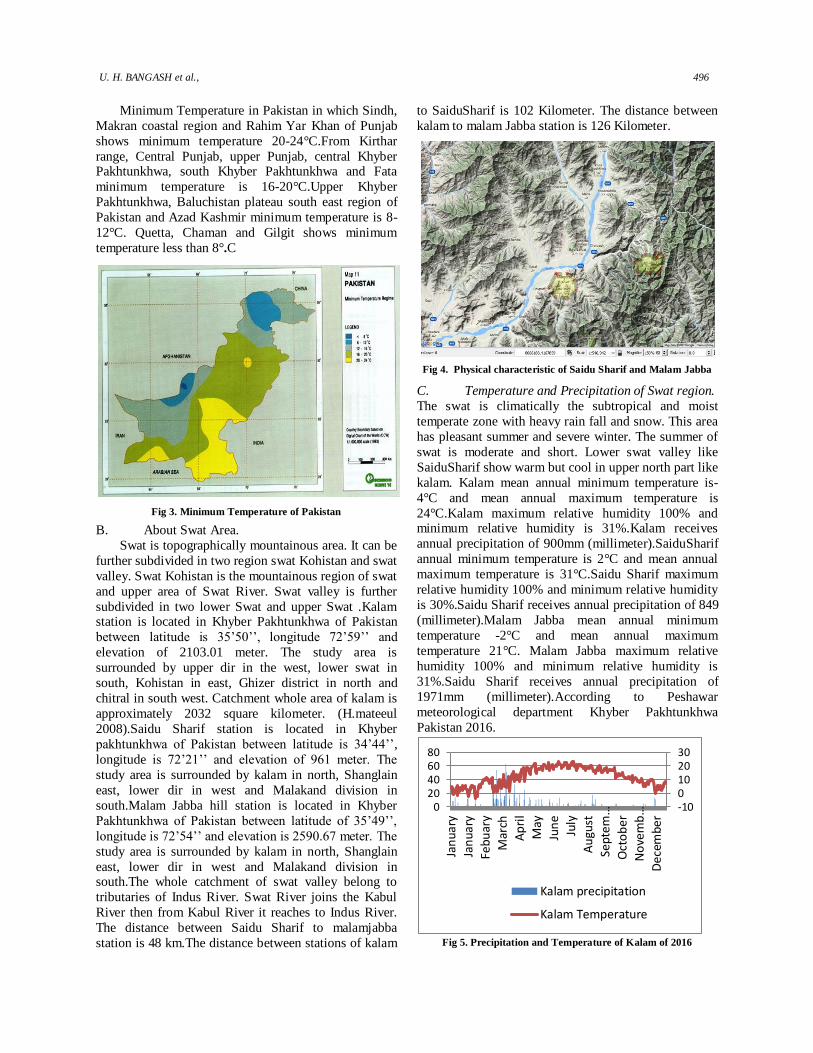
Fig 5. Precipitation and Temperature of Kalam of 2016
-100102030
020406080
Jan
uar
y
Jan
uar
y
Feb
uar
y
Mar
ch
Ap
ril
May
Jun
e
July
Au
gust
Septem
…
Oct
ob
er
Novemb…
Dec
embe
r
Kalam precipitation
Kalam Temperature
U. H. BANGASH et al., 496
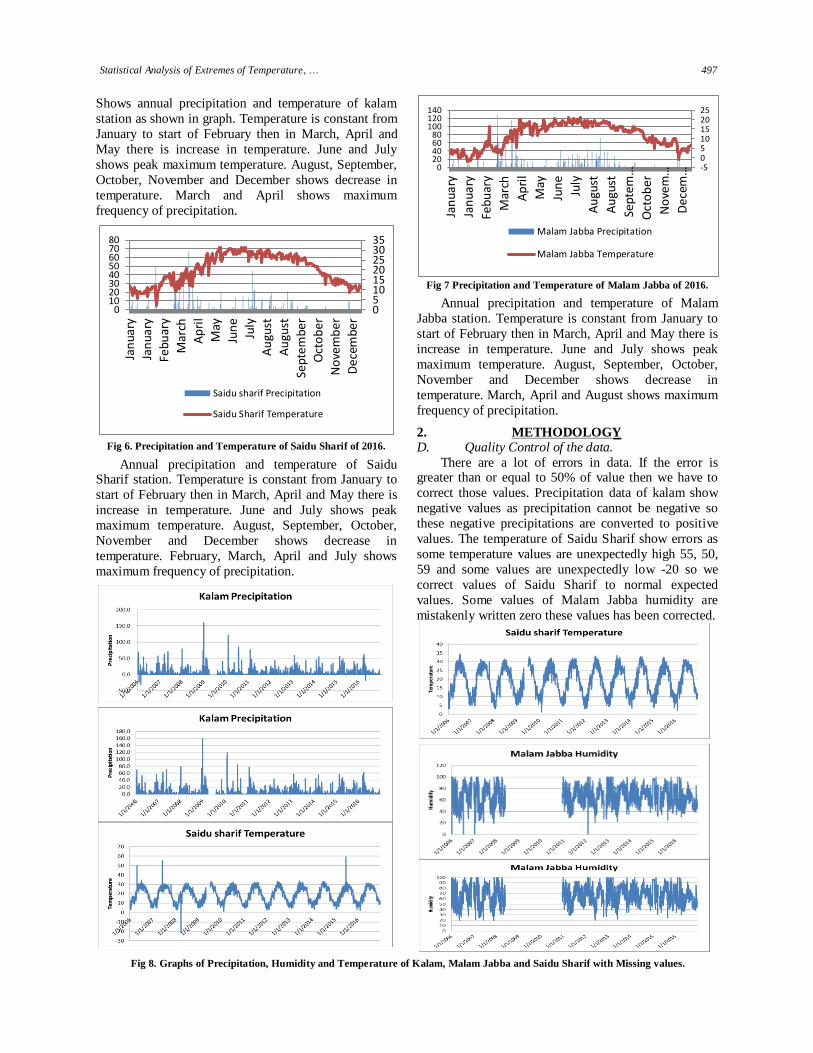
Shows annual precipitation and temperature of kalam
station as shown in graph. Temperature is constant from
January to start of February then in March, April and
May there is increase in temperature. June and July
shows peak maximum temperature. August, September,
October, November and December shows decrease in
temperature. March and April shows maximum
frequency of precipitation.
Fig 6. Precipitation and Temperature of Saidu Sharif of 2016.
Annual precipitation and temperature of Saidu Sharif station. Temperature is constant from January to
start of February then in March, April and May there is
increase in temperature. June and July shows peak
maximum temperature. August, September, October,
November and December shows decrease in
temperature. February, March, April and July shows
maximum frequency of precipitation.
Fig 7 Precipitation and Temperature of Malam Jabba of 2016.
Annual precipitation and temperature of Malam
Jabba station. Temperature is constant from January to
start of February then in March, April and May there is
increase in temperature. June and July shows peak
maximum temperature. August, September, October,
November and December shows decrease in
temperature. March, April and August shows maximum
frequency of precipitation.
2. METHODOLOGY D. Quality Control of the data.
There are a lot of errors in data. If the error is greater than or equal to 50% of value then we have to
correct those values. Precipitation data of kalam show
negative values as precipitation cannot be negative so
these negative precipitations are converted to positive
values. The temperature of Saidu Sharif show errors as
some temperature values are unexpectedly high 55, 50,
59 and some values are unexpectedly low -20 so we
correct values of Saidu Sharif to normal expected
values. Some values of Malam Jabba humidity are
mistakenly written zero these values has been corrected.
05101520253035
01020304050607080
Jan
uary
Jan
uary
Feb
uar
y
Mar
ch
Ap
ril
May
Jun
e
July
Au
gust
Au
gust
Sep
tem
ber
Oct
ob
er
No
vem
ber
Dec
embe
r
Saidu sharif Precipitation
Saidu Sharif Temperature
-50510152025
020406080
100120140
Jan
uar
y
Jan
uar
y
Feb
uar
y
Mar
ch
Ap
ril
May
Jun
e
July
Au
gust
Au
gust
Septem…
Oct
ob
er
Novem…
Decem
…
Malam Jabba Precipitation
Malam Jabba Temperature
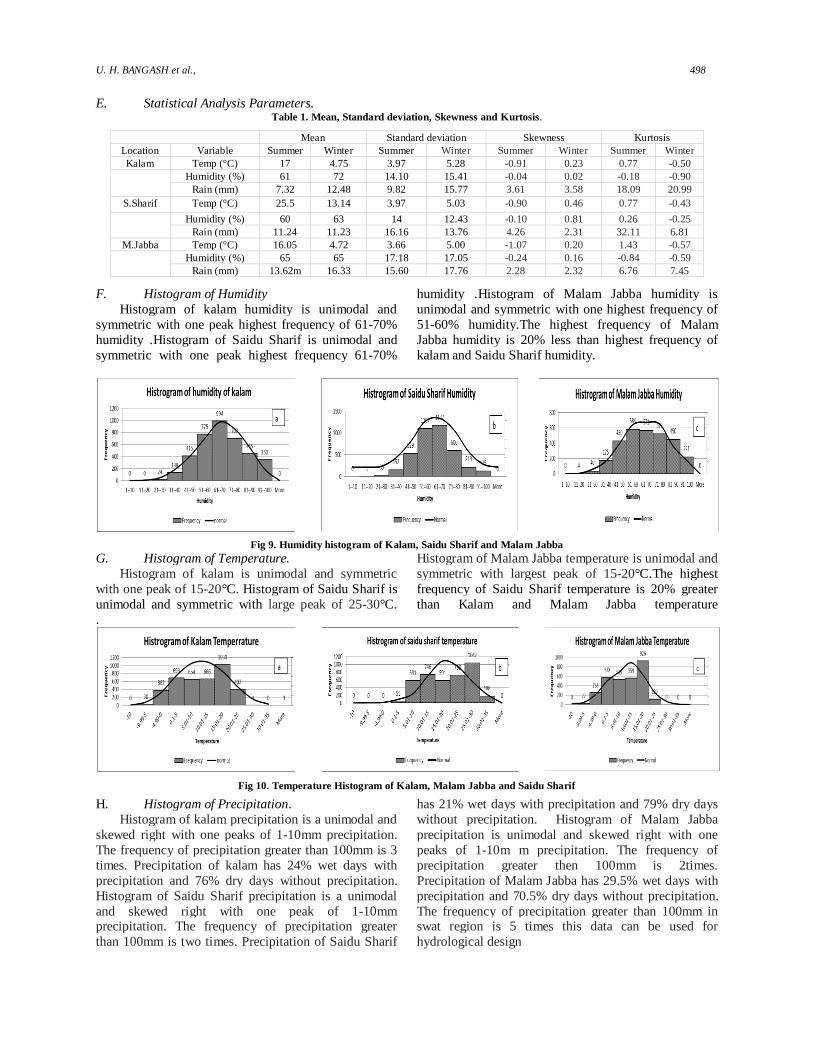
Fig 8. Graphs of Precipitation, Humidity and Temperature of Kalam, Malam Jabba and Saidu Sharif with Missing values.
Statistical Analysis of Extremes of Temperature, … 497
E. Statistical Analysis Parameters. Table 1. Mean, Standard deviation, Skewness and Kurtosis.
Mean Standard deviation Skewness Kurtosis
Location Variable Summer Winter Summer Winter Summer Winter Summer Winter
Kalam Temp (°C) 17 4.75 3.97 5.28 -0.91 0.23 0.77 -0.50
Humidity (%) 61 72 14.10 15.41 -0.04 0.02 -0.18 -0.90
Rain (mm) 7.32 12.48 9.82 15.77 3.61 3.58 18.09 20.99
S.Sharif Temp (°C) 25.5 13.14 3.97 5.03 -0.90 0.46 0.77 -0.43
Humidity (%) 60 63 14 12.43 -0.10 0.81 0.26 -0.25
Rain (mm) 11.24 11.23 16.16 13.76 4.26 2.31 32.11 6.81
M.Jabba Temp (°C) 16.05 4.72 3.66 5.00 -1.07 0.20 1.43 -0.57
Humidity (%) 65 65 17.18 17.05 -0.24 0.16 -0.84 -0.59
Rain (mm) 13.62m 16.33 15.60 17.76 2.28 2.32 6.76 7.45
F. Histogram of Humidity
Histogram of kalam humidity is unimodal and
symmetric with one peak highest frequency of 61-70%
humidity .Histogram of Saidu Sharif is unimodal and
symmetric with one peak highest frequency 61-70%
humidity .Histogram of Malam Jabba humidity is
unimodal and symmetric with one highest frequency of
51-60% humidity.The highest frequency of Malam
Jabba humidity is 20% less than highest frequency of
kalam and Saidu Sharif humidity.
Fig 9. Humidity histogram of Kalam, Saidu Sharif and Malam Jabba
G. Histogram of Temperature.
Histogram of kalam is unimodal and symmetric
with one peak of 15-20°C. Histogram of Saidu Sharif is
unimodal and symmetric with large peak of 25-30°C.
Histogram of Malam Jabba temperature is unimodal and
symmetric with largest peak of 15-20°C.The highest
frequency of Saidu Sharif temperature is 20% greater
than Kalam and Malam Jabba temperature
.
Fig 10. Temperature Histogram of Kalam, Malam Jabba and Saidu Sharif
H. Histogram of Precipitation.
Histogram of kalam precipitation is a unimodal and
skewed right with one peaks of 1-10mm precipitation.
The frequency of precipitation greater than 100mm is 3
times. Precipitation of kalam has 24% wet days with
precipitation and 76% dry days without precipitation.
Histogram of Saidu Sharif precipitation is a unimodal
and skewed right with one peak of 1-10mm precipitation. The frequency of precipitation greater
than 100mm is two times. Precipitation of Saidu Sharif
has 21% wet days with precipitation and 79% dry days
without precipitation. Histogram of Malam Jabba
precipitation is unimodal and skewed right with one
peaks of 1-10m m precipitation. The frequency of
precipitation greater then 100mm is 2times.
Precipitation of Malam Jabba has 29.5% wet days with
precipitation and 70.5% dry days without precipitation.
The frequency of precipitation greater than 100mm in swat region is 5 times this data can be used for
hydrological design
U. H. BANGASH et al., 498
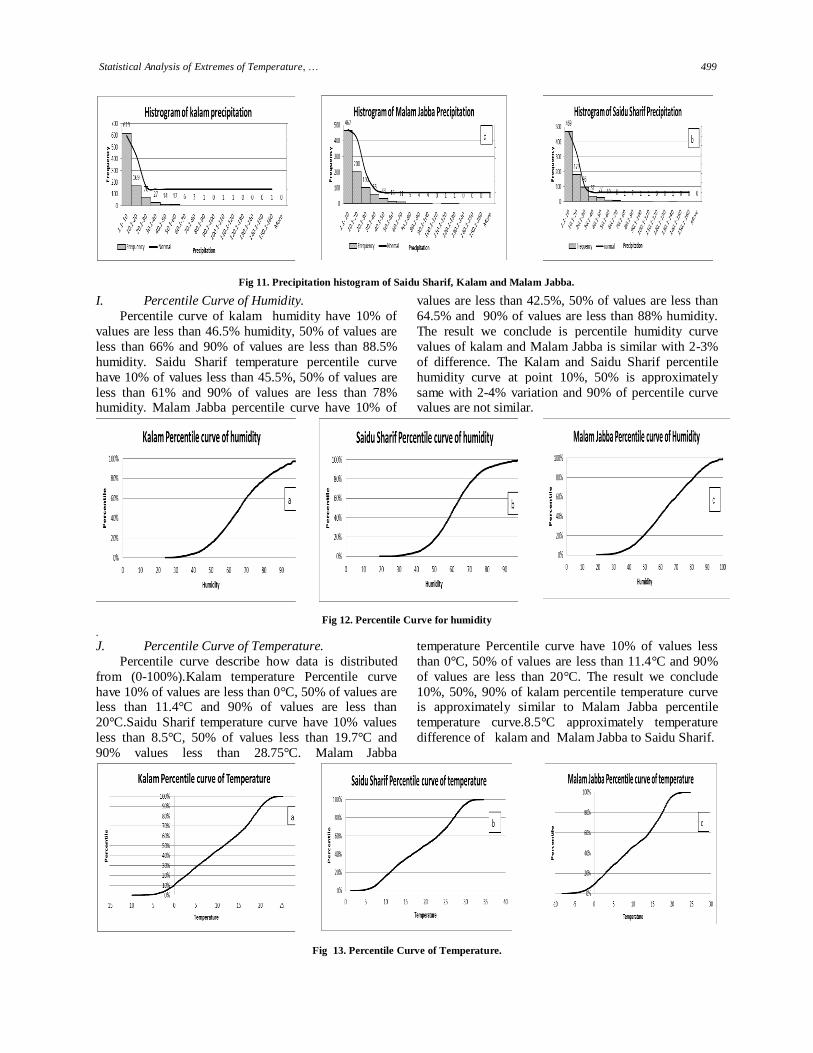
Fig 11. Precipitation histogram of Saidu Sharif, Kalam and Malam Jabba.
I. Percentile Curve of Humidity.
Percentile curve of kalam humidity have 10% of
values are less than 46.5% humidity, 50% of values are
less than 66% and 90% of values are less than 88.5%
humidity. Saidu Sharif temperature percentile curve
have 10% of values less than 45.5%, 50% of values are
less than 61% and 90% of values are less than 78% humidity. Malam Jabba percentile curve have 10% of
values are less than 42.5%, 50% of values are less than
64.5% and 90% of values are less than 88% humidity.
The result we conclude is percentile humidity curve
values of kalam and Malam Jabba is similar with 2-3%
of difference. The Kalam and Saidu Sharif percentile
humidity curve at point 10%, 50% is approximately
same with 2-4% variation and 90% of percentile curve values are not similar.
Fig 12. Percentile Curve for humidity
.
J. Percentile Curve of Temperature.
Percentile curve describe how data is distributed
from (0-100%).Kalam temperature Percentile curve
have 10% of values are less than 0°C, 50% of values are less than 11.4°C and 90% of values are less than
20°C.Saidu Sharif temperature curve have 10% values
less than 8.5°C, 50% of values less than 19.7°C and
90% values less than 28.75°C. Malam Jabba
temperature Percentile curve have 10% of values less
than 0°C, 50% of values are less than 11.4°C and 90%
of values are less than 20°C. The result we conclude
10%, 50%, 90% of kalam percentile temperature curve is approximately similar to Malam Jabba percentile
temperature curve.8.5°C approximately temperature
difference of kalam and Malam Jabba to Saidu Sharif.
Fig 13. Percentile Curve of Temperature.
Statistical Analysis of Extremes of Temperature, … 499
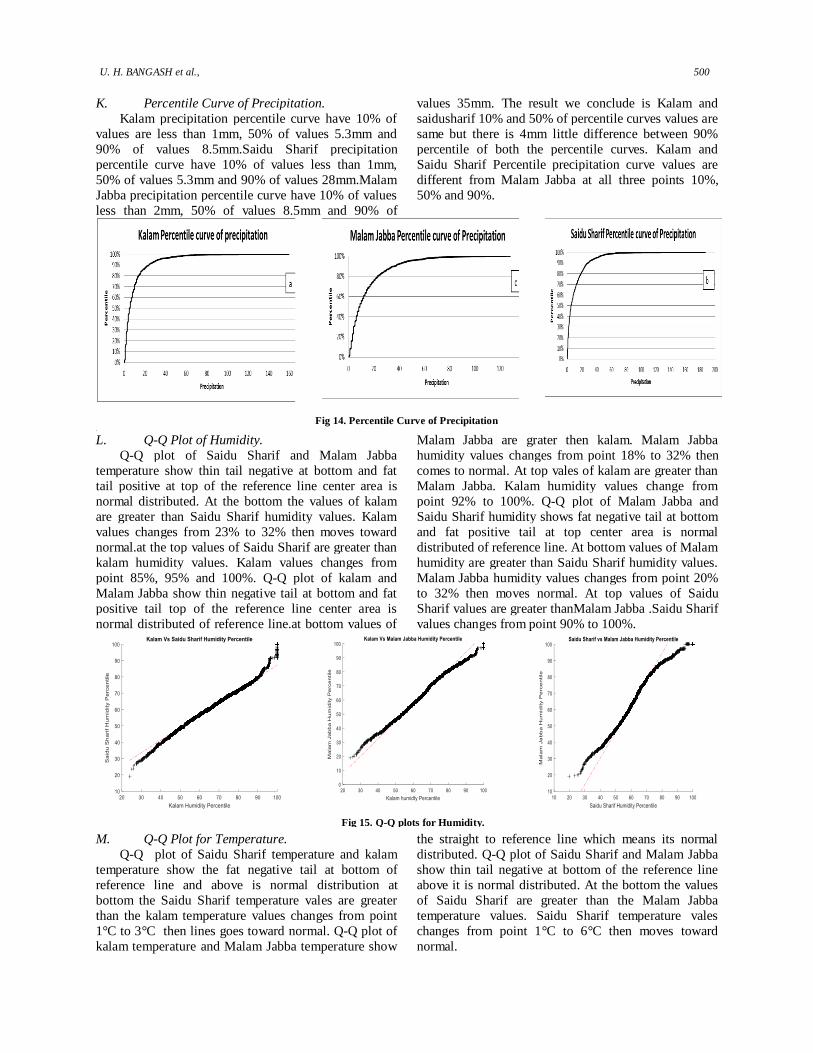
K. Percentile Curve of Precipitation.
Kalam precipitation percentile curve have 10% of
values are less than 1mm, 50% of values 5.3mm and
90% of values 8.5mm.Saidu Sharif precipitation
percentile curve have 10% of values less than 1mm,
50% of values 5.3mm and 90% of values 28mm.Malam
Jabba precipitation percentile curve have 10% of values
less than 2mm, 50% of values 8.5mm and 90% of
values 35mm. The result we conclude is Kalam and
saidusharif 10% and 50% of percentile curves values are
same but there is 4mm little difference between 90%
percentile of both the percentile curves. Kalam and
Saidu Sharif Percentile precipitation curve values are
different from Malam Jabba at all three points 10%,
50% and 90%.
Fig 14. Percentile Curve of Precipitation.
L. Q-Q Plot of Humidity.
Q-Q plot of Saidu Sharif and Malam Jabba
temperature show thin tail negative at bottom and fat
tail positive at top of the reference line center area is
normal distributed. At the bottom the values of kalam
are greater than Saidu Sharif humidity values. Kalam
values changes from 23% to 32% then moves toward
normal.at the top values of Saidu Sharif are greater than
kalam humidity values. Kalam values changes from
point 85%, 95% and 100%. Q-Q plot of kalam and
Malam Jabba show thin negative tail at bottom and fat
positive tail top of the reference line center area is
normal distributed of reference line.at bottom values of
Malam Jabba are grater then kalam. Malam Jabba
humidity values changes from point 18% to 32% then
comes to normal. At top vales of kalam are greater than
Malam Jabba. Kalam humidity values change from
point 92% to 100%. Q-Q plot of Malam Jabba and
Saidu Sharif humidity shows fat negative tail at bottom
and fat positive tail at top center area is normal
distributed of reference line. At bottom values of Malam
humidity are greater than Saidu Sharif humidity values.
Malam Jabba humidity values changes from point 20%
to 32% then moves normal. At top values of Saidu
Sharif values are greater thanMalam Jabba .Saidu Sharif
values changes from point 90% to 100%.
M. Q-Q Plot for Temperature.
Q-Q plot of Saidu Sharif temperature and kalam
temperature show the fat negative tail at bottom of
reference line and above is normal distribution at
bottom the Saidu Sharif temperature vales are greater
than the kalam temperature values changes from point
1°C to 3°C then lines goes toward normal. Q-Q plot of
kalam temperature and Malam Jabba temperature show
the straight to reference line which means its normal
distributed. Q-Q plot of Saidu Sharif and Malam Jabba
show thin tail negative at bottom of the reference line
above it is normal distributed. At the bottom the values
of Saidu Sharif are greater than the Malam Jabba
temperature values. Saidu Sharif temperature vales
changes from point 1°C to 6°C then moves toward
normal.
Fig 15. Q-Q plots for Humidity.
U. H. BANGASH et al., 500
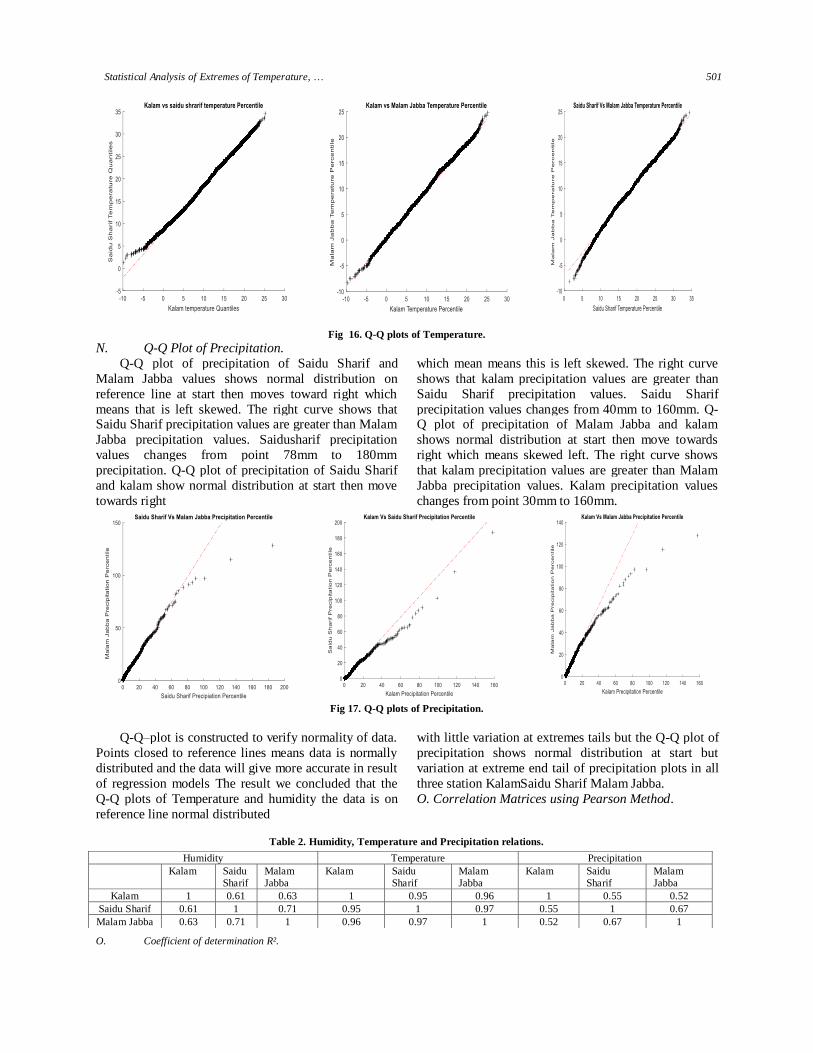
Fig 16. Q-Q plots of Temperature.
N. Q-Q Plot of Precipitation.
Q-Q plot of precipitation of Saidu Sharif and
Malam Jabba values shows normal distribution on
reference line at start then moves toward right which
means that is left skewed. The right curve shows that Saidu Sharif precipitation values are greater than Malam
Jabba precipitation values. Saidusharif precipitation
values changes from point 78mm to 180mm
precipitation. Q-Q plot of precipitation of Saidu Sharif
and kalam show normal distribution at start then move
towards right
which mean means this is left skewed. The right curve
shows that kalam precipitation values are greater than
Saidu Sharif precipitation values. Saidu Sharif
precipitation values changes from 40mm to 160mm. Q-Q plot of precipitation of Malam Jabba and kalam
shows normal distribution at start then move towards
right which means skewed left. The right curve shows
that kalam precipitation values are greater than Malam
Jabba precipitation values. Kalam precipitation values
changes from point 30mm to 160mm.
Fig 17. Q-Q plots of Precipitation.
Q-Q–plot is constructed to verify normality of data.
Points closed to reference lines means data is normally
distributed and the data will give more accurate in result
of regression models The result we concluded that the
Q-Q plots of Temperature and humidity the data is on
reference line normal distributed
with little variation at extremes tails but the Q-Q plot of
precipitation shows normal distribution at start but
variation at extreme end tail of precipitation plots in all
three station KalamSaidu Sharif Malam Jabba.
O. Correlation Matrices using Pearson Method.
Table 2. Humidity, Temperature and Precipitation relations.
O. Coefficient of determination R².
Humidity Temperature Precipitation
Kalam Saidu
Sharif
Malam
Jabba
Kalam Saidu
Sharif
Malam
Jabba
Kalam Saidu
Sharif
Malam
Jabba
Kalam 1 0.61 0.63 1 0.95 0.96 1 0.55 0.52
Saidu Sharif 0.61 1 0.71 0.95 1 0.97 0.55 1 0.67
Malam Jabba 0.63 0.71 1 0.96 0.97 1 0.52 0.67 1
Statistical Analysis of Extremes of Temperature, … 501
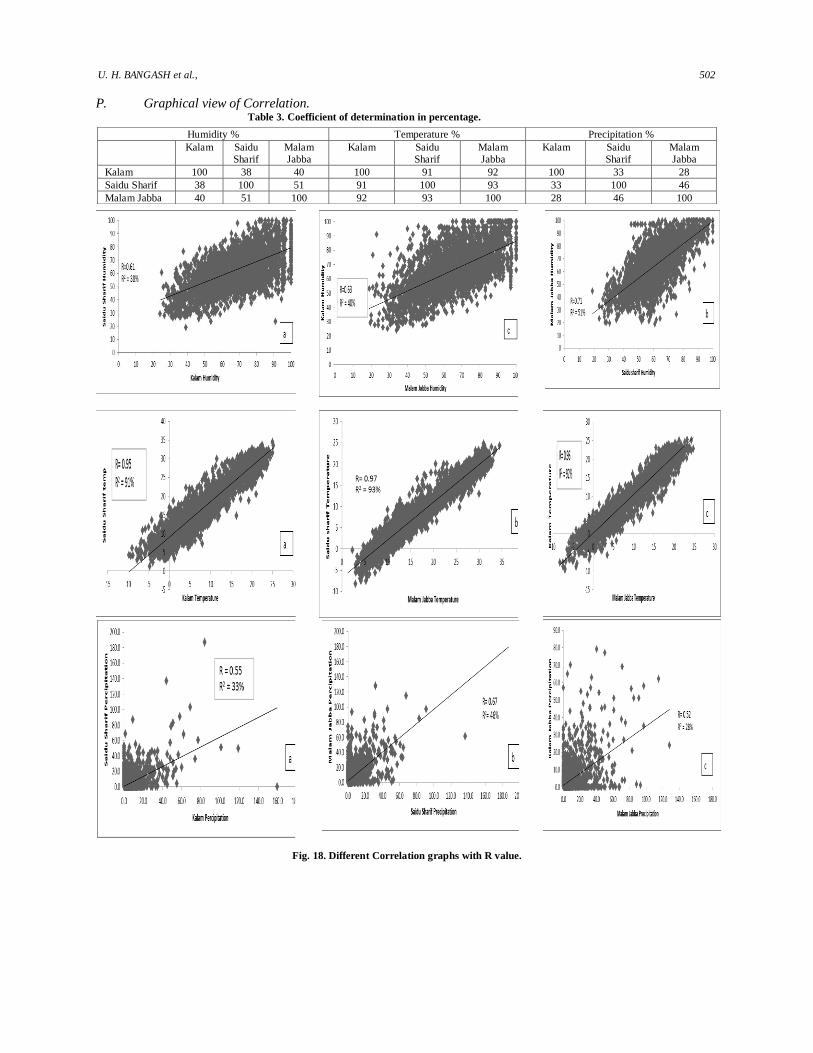
P. Graphical view of Correlation. Table 3. Coefficient of determination in percentage.
Fig. 18. Different Correlation graphs with R value.
Humidity % Temperature % Precipitation %
Kalam Saidu
Sharif
Malam
Jabba
Kalam Saidu
Sharif
Malam
Jabba
Kalam Saidu
Sharif
Malam
Jabba
Kalam 100 38 40 100 91 92 100 33 28
Saidu Sharif 38 100 51 91 100 93 33 100 46
Malam Jabba 40 51 100 92 93 100 28 46 100
U. H. BANGASH et al., 502
3. RESULTS AND CONSCULSION Q. Linear Regression Equations.
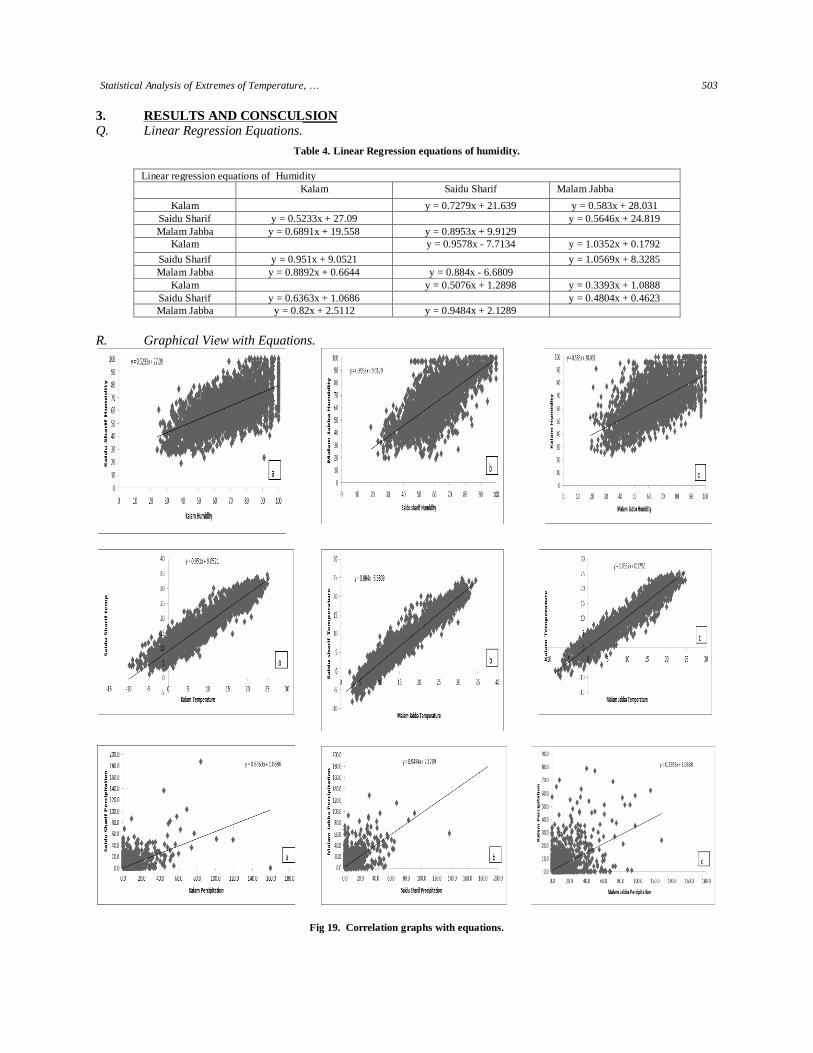
Table 4. Linear Regression equations of humidity.
Linear regression equations of Humidity
Kalam Saidu Sharif Malam Jabba
Kalam y = 0.7279x + 21.639 y = 0.583x + 28.031
Saidu Sharif y = 0.5233x + 27.09 y = 0.5646x + 24.819
Malam Jabba y = 0.6891x + 19.558 y = 0.8953x + 9.9129
Kalam y = 0.9578x - 7.7134 y = 1.0352x + 0.1792
Saidu Sharif y = 0.951x + 9.0521 y = 1.0569x + 8.3285
Malam Jabba y = 0.8892x + 0.6644 y = 0.884x - 6.6809
Kalam y = 0.5076x + 1.2898 y = 0.3393x + 1.0888
Saidu Sharif y = 0.6363x + 1.0686 y = 0.4804x + 0.4623
Malam Jabba y = 0.82x + 2.5112 y = 0.9484x + 2.1289
R. Graphical View with Equations.
Fig 19. Correlation graphs with equations.
Statistical Analysis of Extremes of Temperature, … 503
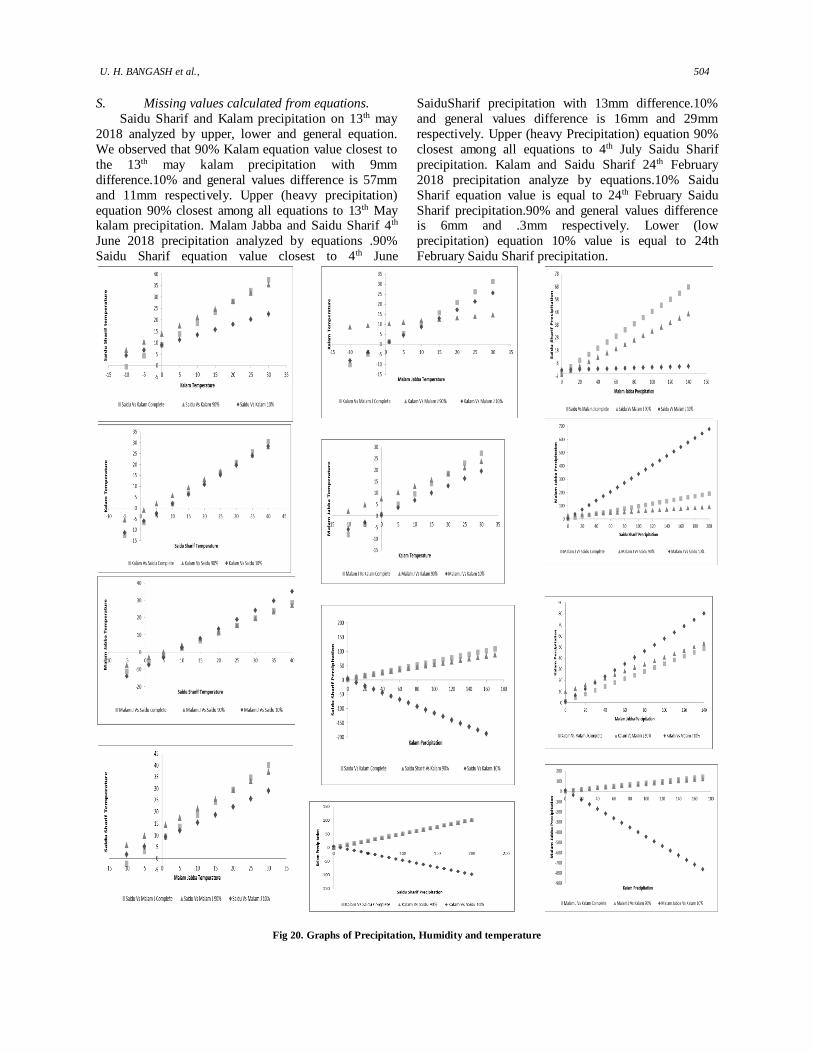
S. Missing values calculated from equations.
Saidu Sharif and Kalam precipitation on 13th may
2018 analyzed by upper, lower and general equation.
We observed that 90% Kalam equation value closest to
the 13th may kalam precipitation with 9mm
difference.10% and general values difference is 57mm
and 11mm respectively. Upper (heavy precipitation)
equation 90% closest among all equations to 13th May kalam precipitation. Malam Jabba and Saidu Sharif 4th
June 2018 precipitation analyzed by equations .90%
Saidu Sharif equation value closest to 4th June
SaiduSharif precipitation with 13mm difference.10%
and general values difference is 16mm and 29mm
respectively. Upper (heavy Precipitation) equation 90%
closest among all equations to 4th July Saidu Sharif
precipitation. Kalam and Saidu Sharif 24th February
2018 precipitation analyze by equations.10% Saidu
Sharif equation value is equal to 24th February Saidu
Sharif precipitation.90% and general values difference is 6mm and .3mm respectively. Lower (low
precipitation) equation 10% value is equal to 24th
February Saidu Sharif precipitation.
Fig 20. Graphs of Precipitation, Humidity and temperature
U. H. BANGASH et al., 504
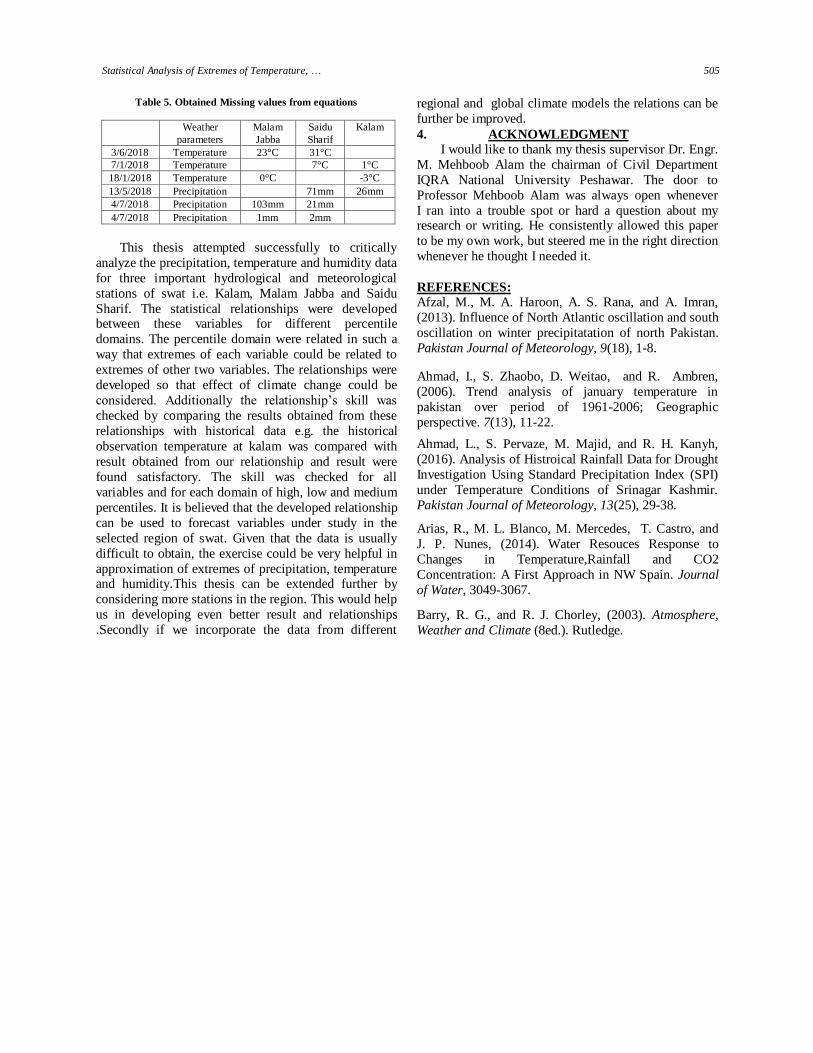
Table 5. Obtained Missing values from equations
Weather
parameters
Malam
Jabba
Saidu
Sharif
Kalam
3/6/2018 Temperature 23°C 31°C
7/1/2018 Temperature 7°C 1°C
18/1/2018 Temperature 0°C -3°C
13/5/2018 Precipitation 71mm 26mm
4/7/2018 Precipitation 103mm 21mm
4/7/2018 Precipitation 1mm 2mm
This thesis attempted successfully to critically
analyze the precipitation, temperature and humidity data
for three important hydrological and meteorological
stations of swat i.e. Kalam, Malam Jabba and Saidu
Sharif. The statistical relationships were developed between these variables for different percentile
domains. The percentile domain were related in such a
way that extremes of each variable could be related to
extremes of other two variables. The relationships were
developed so that effect of climate change could be
considered. Additionally the relationship’s skill was
checked by comparing the results obtained from these
relationships with historical data e.g. the historical
observation temperature at kalam was compared with
result obtained from our relationship and result were
found satisfactory. The skill was checked for all
variables and for each domain of high, low and medium
percentiles. It is believed that the developed relationship
can be used to forecast variables under study in the
selected region of swat. Given that the data is usually
difficult to obtain, the exercise could be very helpful in
approximation of extremes of precipitation, temperature and humidity.This thesis can be extended further by
considering more stations in the region. This would help
us in developing even better result and relationships
.Secondly if we incorporate the data from different
regional and global climate models the relations can be
further be improved.
4. ACKNOWLEDGMENT I would like to thank my thesis supervisor Dr. Engr.
M. Mehboob Alam the chairman of Civil Department
IQRA National University Peshawar. The door to
Professor Mehboob Alam was always open whenever
I ran into a trouble spot or hard a question about my research or writing. He consistently allowed this paper
to be my own work, but steered me in the right direction
whenever he thought I needed it.
REFERENCES: Afzal, M., M. A. Haroon, A. S. Rana, and A. Imran,
(2013). Influence of North Atlantic oscillation and south
oscillation on winter precipitatation of north Pakistan.
Pakistan Journal of Meteorology, 9(18), 1-8.
Ahmad, I., S. Zhaobo, D. Weitao, and R. Ambren,
(2006). Trend analysis of january temperature in
pakistan over period of 1961-2006; Geographic
perspective. 7(13), 11-22.
Ahmad, L., S. Pervaze, M. Majid, and R. H. Kanyh,
(2016). Analysis of Histroical Rainfall Data for Drought
Investigation Using Standard Precipitation Index (SPI)
under Temperature Conditions of Srinagar Kashmir.
Pakistan Journal of Meteorology, 13(25), 29-38.
Arias, R., M. L. Blanco, M. Mercedes, T. Castro, and
J. P. Nunes, (2014). Water Resouces Response to
Changes in Temperature,Rainfall and CO2
Concentration: A First Approach in NW Spain. Journal
of Water, 3049-3067.
Barry, R. G., and R. J. Chorley, (2003). Atmosphere,
Weather and Climate (8ed.). Rutledge.
Statistical Analysis of Extremes of Temperature, … 505