Embed Size (px)
Citation preview
SUMIDA CORPORATION
FY2017 Full-Year Business Performance &
New Mid-term Business Plan (2018-2021)
February 14, 2018
Today’s Speakers
2Copyright© 2016 SUMIDA CORPORATION. All rights reserved.
Representative Executive Officer and CEO
Shigeyuki Yawata
Representative Executive Officer and President
Tomoharu Suseki
Representative Executive Officer and CFO
Yoshiyuki Honda
Today’s Program
Copyright© 2015 SUMIDA CORPORATION. All rights reserved. 3
1.Summary
CEO Shigeyuki Yawata
2.FY2017 Q4 and Full-Year Consolidated Financial Results
CFO Yoshiyuki Honda
3. Master Plan Stage Ⅲ (2018-2021) Mid-Term Business Plan
President Tomoharu Suseki
CFO Yoshiyuki Honda
4. Q & A Session
Copyright© 2018 SUMIDA CORPORATION. All rights reserved. 4
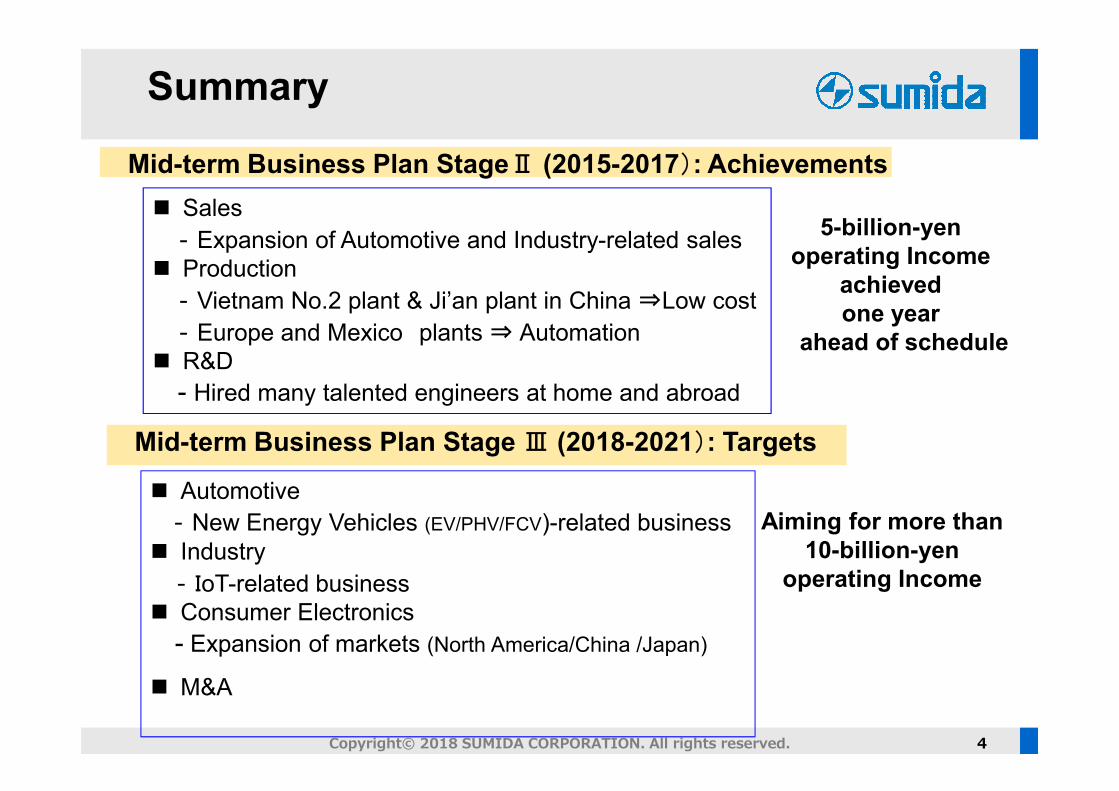
Mid-term Business Plan StageⅡ (2015-2017): Achievements
Mid-term Business Plan Stage Ⅲ (2018-2021): Targets
� Sales
‐Expansion of Automotive and Industry-related sales
� Production
‐Vietnam No.2 plant & Ji’an plant in China ⇒Low cost
‐Europe and Mexico plants ⇒ Automation
� R&D
- Hired many talented engineers at home and abroad
5-billion-yen
operating Income
achieved
one year
ahead of schedule
� Automotive
‐New Energy Vehicles (EV/PHV/FCV)-related business
� Industry
‐IoT-related business
� Consumer Electronics
- Expansion of markets (North America/China /Japan)
� M&A
Aiming for more than
10-billion-yen
operating Income
Summary
FY2017 Q4 and Full Year
Consolidated Financial Results
Yoshiyuki HondaCFO
5 Copyright© 2018 SUMIDA CORPORATION. All rights reserved.
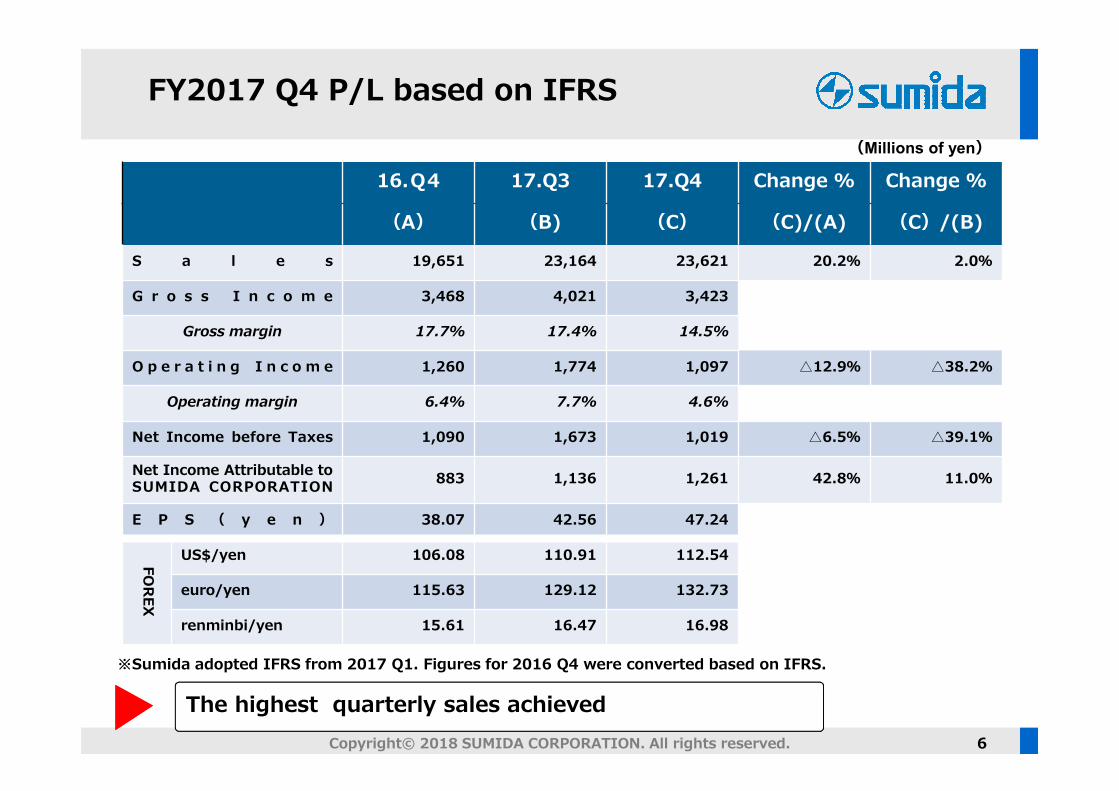
(Millions of yen)
FY2017 Q4 P/L based on IFRS
16.Q4 17.Q3 17.Q4 Change % Change %
(A) (B) (C) (C)/(A) (C)/(B)
S a l e s 19,651 23,164 23,621 20.2% 2.0%
G r o s s I n c o m e 3,468 4,021 3,423
Gross margin 17.7% 17.4% 14.5%
O p e r a t i n g I n c o m e 1,260 1,774 1,097 △12.9% △38.2%
Operating margin 6.4% 7.7% 4.6%
Net Income before Taxes 1,090 1,673 1,019 △6.5% △39.1%
Net Income Attributable toSUMIDA CORPORATION 883 1,136 1,261 42.8% 11.0%
E P S ( y e n ) 38.07 42.56 47.24
FOR
EX
US$/yen 106.08 110.91 112.54
euro/yen 115.63 129.12 132.73
renminbi/yen 15.61 16.47 16.98
6
The highest quarterly sales achieved
※Sumida adopted IFRS from 2017 Q1. Figures for 2016 Q4 were converted based on IFRS.
Copyright© 2018 SUMIDA CORPORATION. All rights reserved.
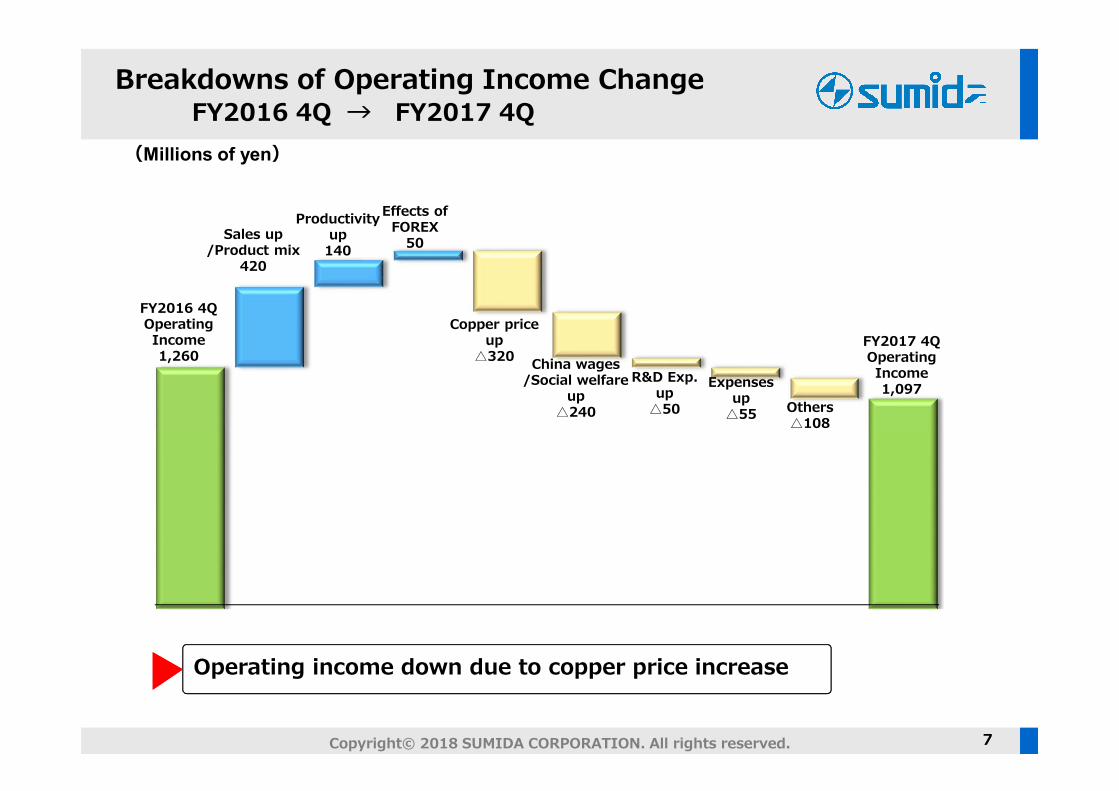
Breakdowns of Operating Income Change FY2016 4Q → FY2017 4Q
7
(Millions of yen)
Operating income down due to copper price increase
FY2016 4QOperating Income1,260
Sales up/Product mix
420
Productivity up
140
China wages/Social welfare
up△240
Effects of FOREX
50
Copper priceup
△320
Expensesup
△55
R&D Exp.up
△50 Others△108
FY2017 4QOperating Income1,097
Copyright© 2018 SUMIDA CORPORATION. All rights reserved.

(Millions of yen)
FY2017 Full Year P/L based on IFRS
FY2016 FY2017 Change %
(A) (C) (C)/(A)S a l e s 81,052 90,153 11.2%
G r o s s I n c o m e 14.861 15,134
Gross margin 18.3% 16.8%
O p e r a t i n g I n c o m e 6,270 6,217 △0.8%
Operating margin 7.7% 6.9%
Net Income before Taxes 5,469 5,697 4.2%
Net Income Attributable toS U M I D A C O R P O R AT I O N 3,666 4,504 22.9%
E P S ( y e n ) 157.97 176.41
FOR
EX
US$/yen 109.31 112.28
euro/yen 120.75 126.21
renminbi/yen 16.51 16.54
8
The highest sales achieved※※Sumida adopted IFRS from 2017 Q1. Figures for 2016 Q4 were converted based on IFRS.
Copyright© 2018 SUMIDA CORPORATION. All rights reserved.
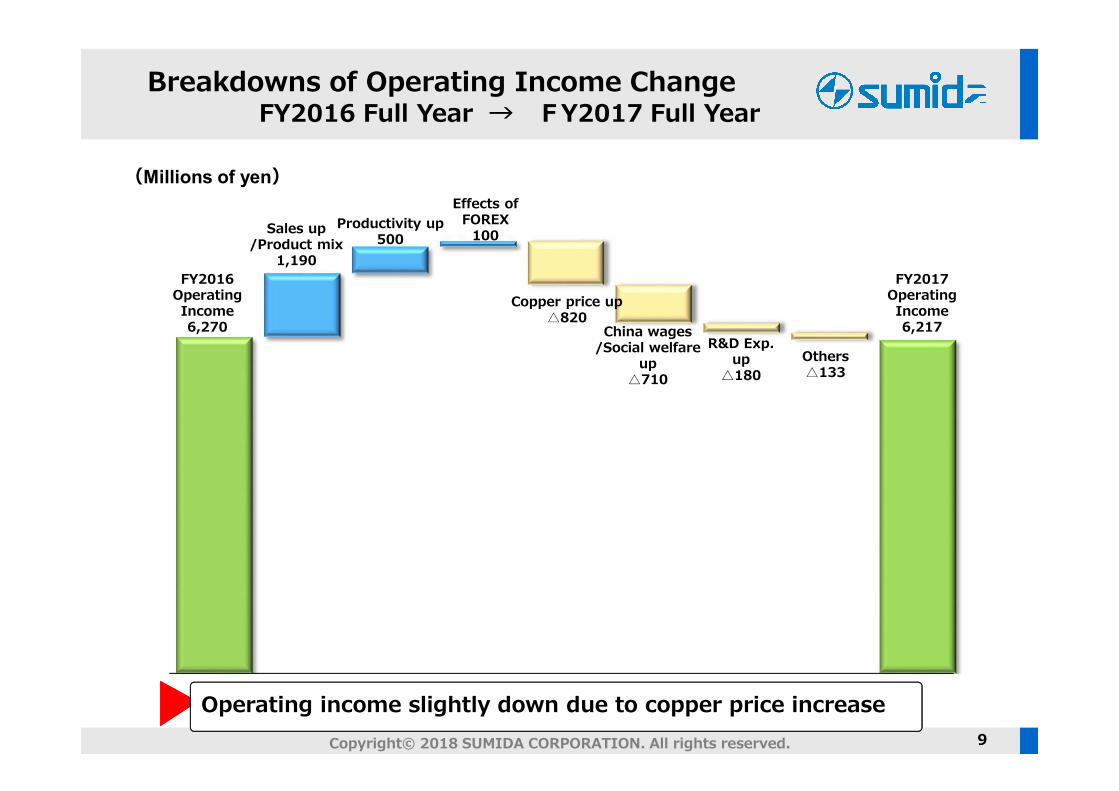
Copper price up△820
9
FY2016Operating Income6,270
Effects of FOREX
100
(Millions of yen)
FY2017Operating Income6,217
Others△133
Productivity up500
Sales up/Product mix
1,190
China wages/Social welfare
up△710
R&D Exp.up
△180
Copyright© 2018 SUMIDA CORPORATION. All rights reserved.
Breakdowns of Operating Income ChangeFY2016 Full Year → FY2017 Full Year
Operating income slightly down due to copper price increase
10
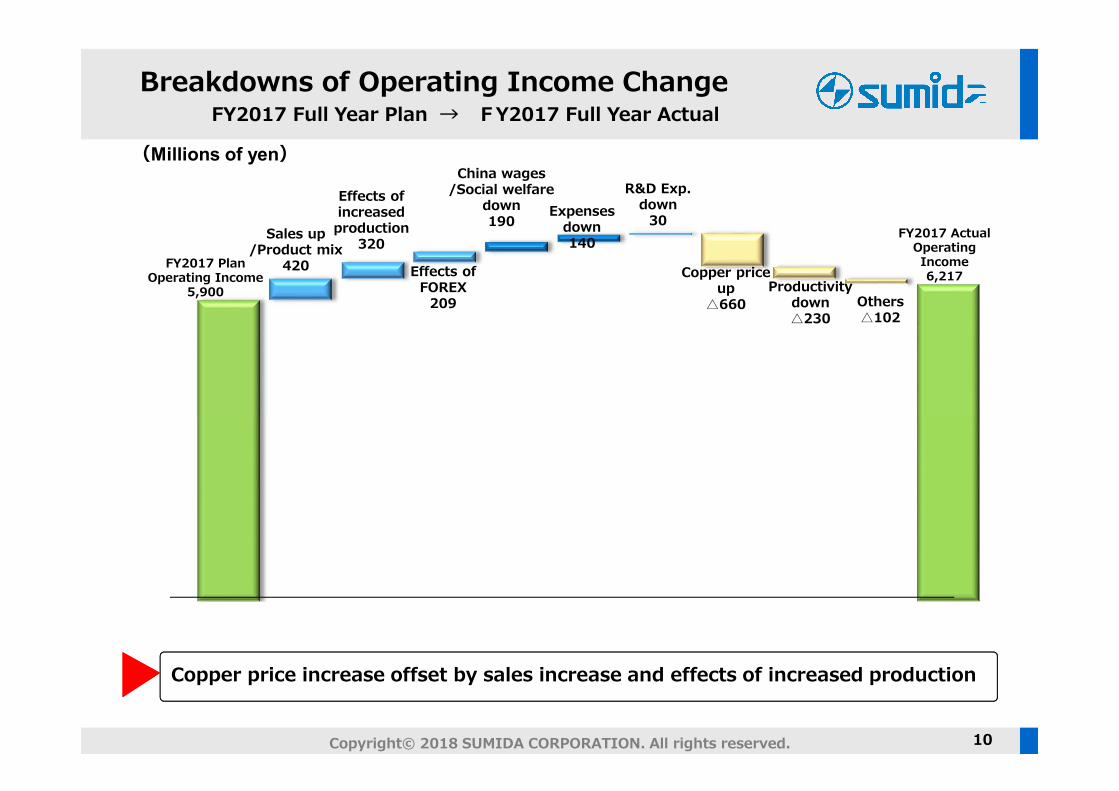
(Millions of yen)
Copper price increase offset by sales increase and effects of increased production
FY2017 PlanOperating Income
5,900
Sales up/Product mix
420
Effects of increased production
320
China wages/Social welfare
down190
Effects of FOREX
209
Copper priceup
△660
Expensesdown140
R&D Exp.down
30
Others△102
FY2017 ActualOperating Income6,217
Copyright© 2018 SUMIDA CORPORATION. All rights reserved.
Productivitydown△230
Breakdowns of Operating Income ChangeFY2017 Full Year Plan → FY2017 Full Year Actual
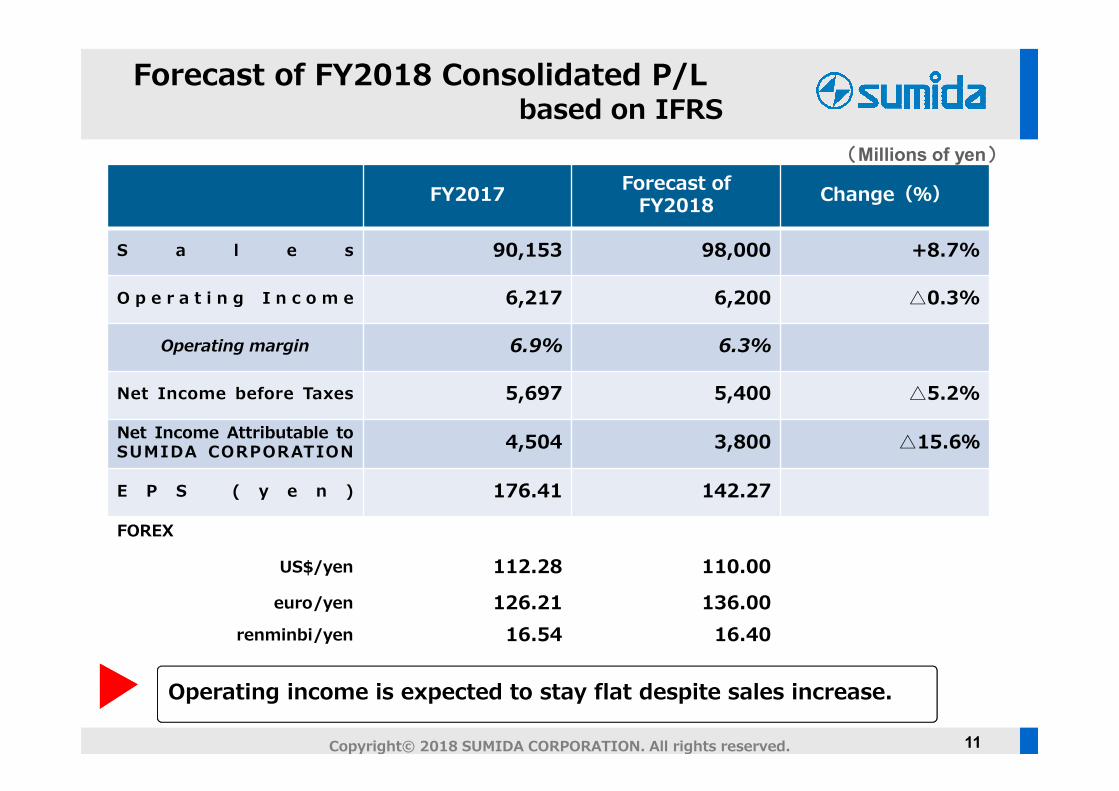
Forecast of FY2018 Consolidated P/Lbased on IFRS
FY2017 Forecast of FY2018 Change(%)
S a l e s 90,153 98,000 +8.7%
O p e r a t i n g I n c o m e 6,217 6,200 △0.3%
Operating margin 6.9% 6.3%
Net Income before Taxes 5,697 5,400 △5.2%
Net Income Attributable toSUMIDA CORPORATION 4,504 3,800 △15.6%
E P S ( y e n ) 176.41 142.27
FOREX
US$/yen 112.28 110.00
euro/yen 126.21 136.00renminbi/yen 16.54 16.40
(Millions of yen)
11
Operating income is expected to stay flat despite sales increase.
Copyright© 2018 SUMIDA CORPORATION. All rights reserved.
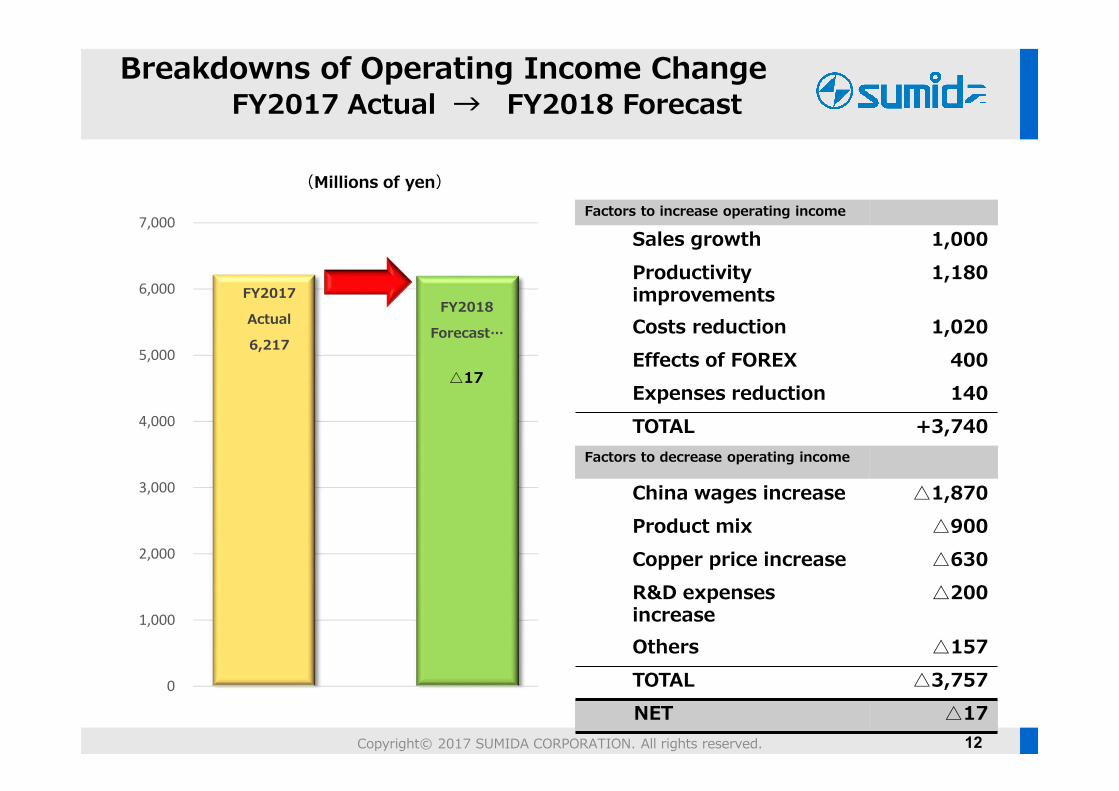
FY2017
Actual
6,217
FY2018
Forecast…
0
1,000
2,000
3,000
4,000
5,000
6,000
7,000
△17
Factors to increase operating income
Sales growth 1,000Productivityimprovements
1,180
Costs reduction 1,020Effects of FOREX 400Expenses reduction 140TOTAL +3,740
Factors to decrease operating income
China wages increase △1,870Product mix △900Copper price increase △630R&D expenses increase
△200
Others △157TOTAL △3,757NET △17
12
Breakdowns of Operating Income ChangeFY2017 Actual → FY2018 Forecast
Copyright© 2017 SUMIDA CORPORATION. All rights reserved.
(Millions of yen)
Master Plan Stage Ⅲ (2018-2021)
Mid-Term Business Plan
Feb 14, 2018 IR Briefing Session
Tomoharu Suseki, PresidentYoshiyuki Honda, CFO
13Copyright© 2018 SUMIDA CORPORATION. All rights reserved.
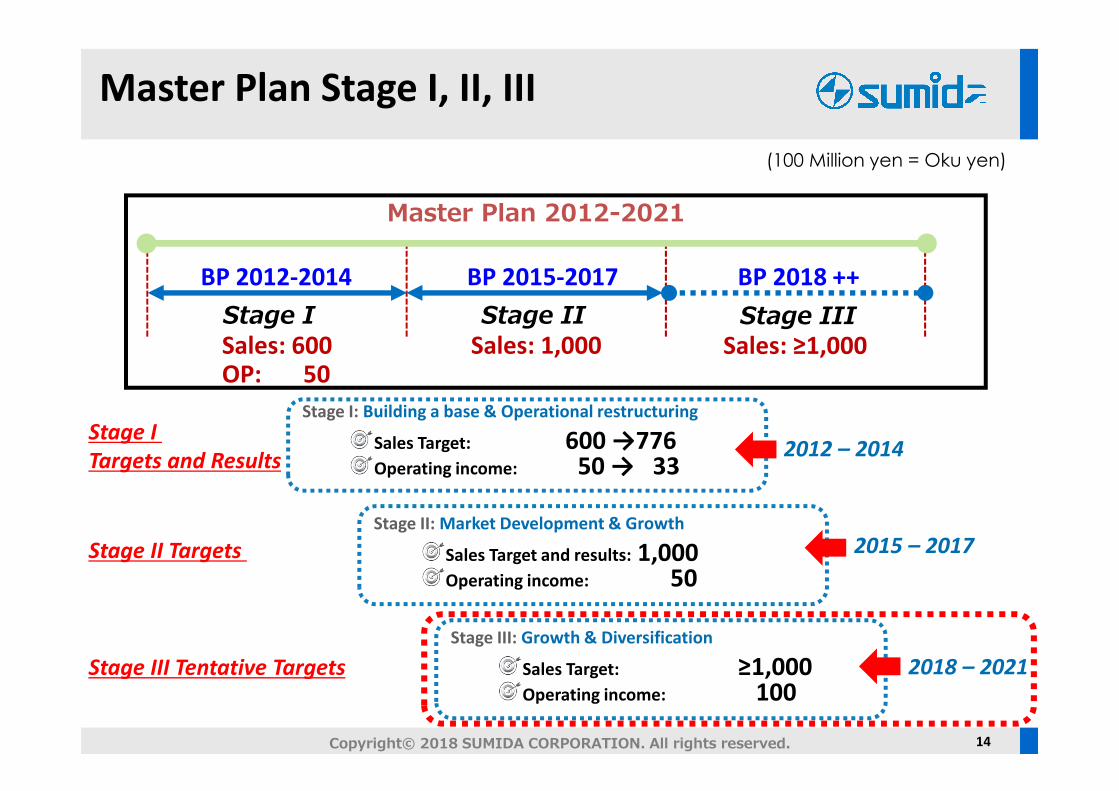
Master Plan Stage I, II, III
14
Stage I: Building a base & Operational restructuring
Sales Target: 600 →776Operating income: 50 → 33
Stage II: Market Development & Growth
Sales Target and results: 1,000Operating income: 50
Stage III: Growth & Diversification
Sales Target: ≥1,000Operating income: 100
2015 – 2017
BP 2012-2014
Stage II Stage IIIBP 2015-2017 BP 2018 ++
Stage ISales: 1,000 Sales: ≥1,000Sales: 600
OP: 50
2012 – 2014
Master Plan 2012-2021
Stage I
Targets and Results
Stage II Targets
Stage III Tentative Targets 2018 – 2021
(100 Million yen = Oku yen)
Copyright© 2018 SUMIDA CORPORATION. All rights reserved.
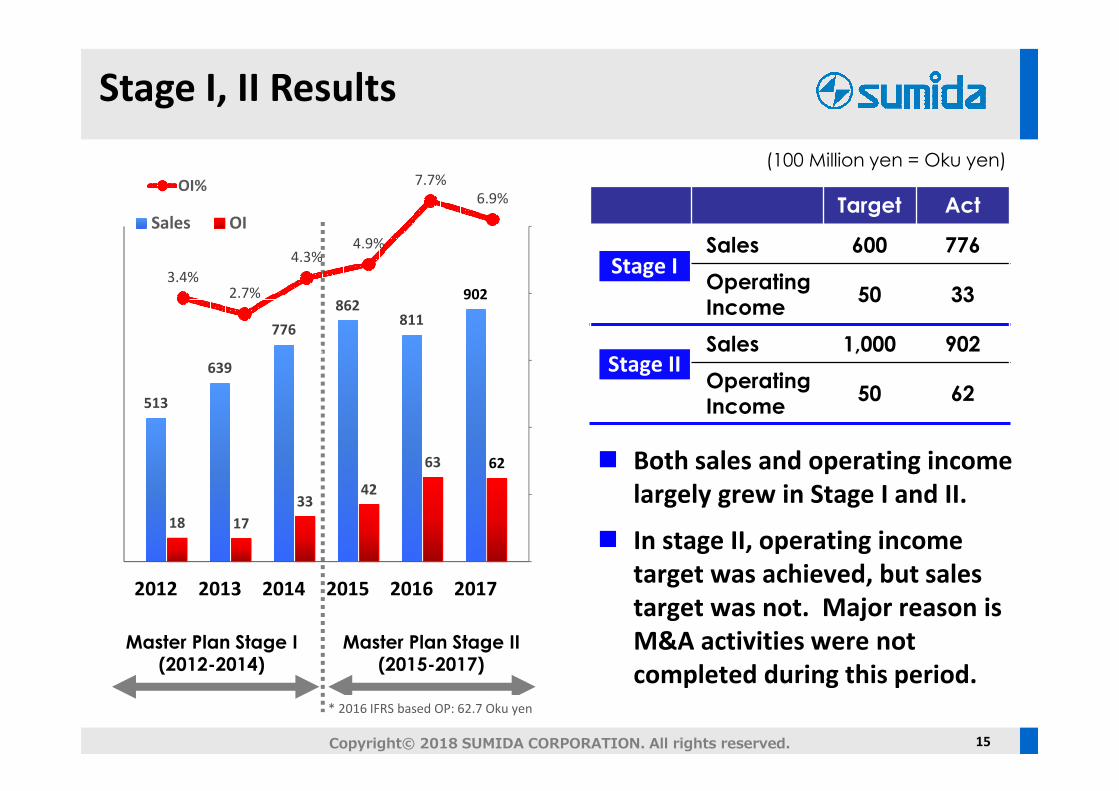
Stage I, II Results
15
* 2016 IFRS based OP: 62.7 Oku yen
Target Act
Sales 600 776
Operating
Income50 33
Sales 1,000 902
Operating
Income50 62
Stage I
Stage II
Master Plan Stage I(2012-2014)
Master Plan Stage II (2015-2017)
(100 Million yen = Oku yen)
3.4%2.7%
4.3%4.9%
7.7%
6.9%
0.02
0.04
0.06
0.08
2012 2013 2014 2015 2016 2017
OI%
513
639
776
862 811
902
18 17
33 42
63 62
0
50
100
150
200
250
0.00
300.00
600.00
900.00
1,200.00
2012 2013 2014 2015 2016 2017
Sales OI
� Both sales and operating income
largely grew in Stage I and II.
� In stage II, operating income
target was achieved, but sales
target was not. Major reason is
M&A activities were not
completed during this period.
Copyright© 2018 SUMIDA CORPORATION. All rights reserved.
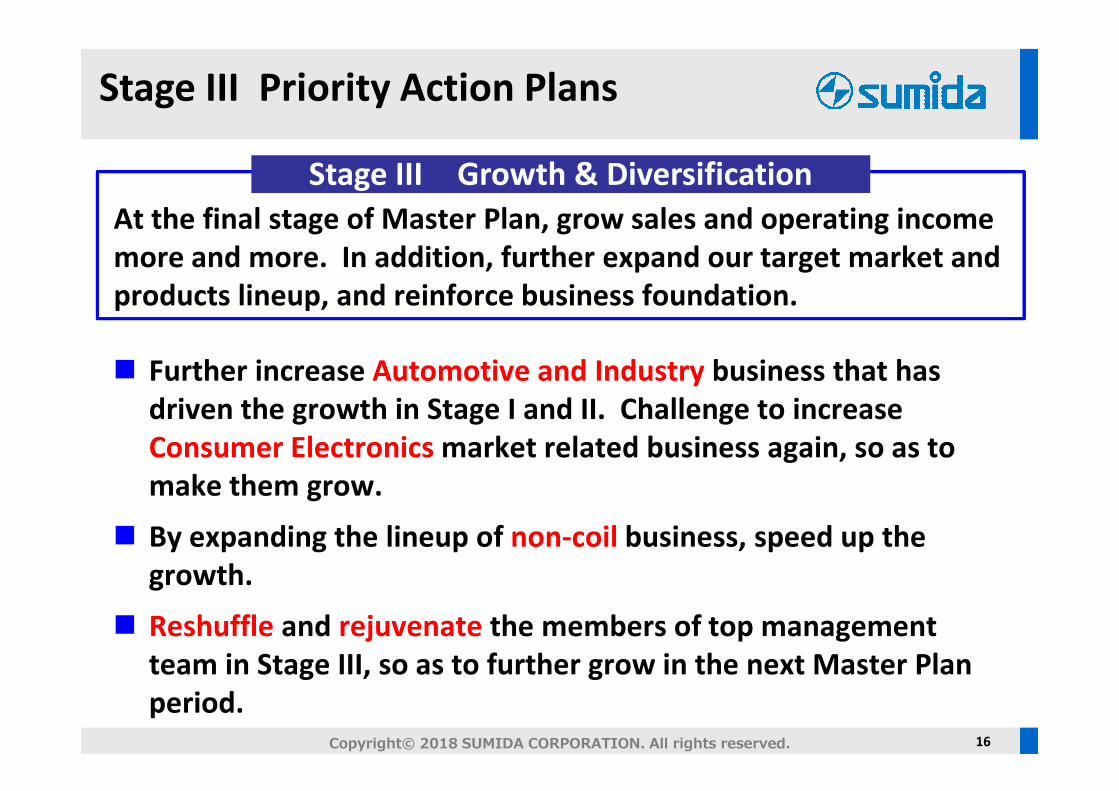
Stage III Priority Action Plans
16
At the final stage of Master Plan, grow sales and operating income
more and more. In addition, further expand our target market and
products lineup, and reinforce business foundation.
Stage III Growth & Diversification
� Further increase Automotive and Industry business that has
driven the growth in Stage I and II. Challenge to increase
Consumer Electronics market related business again, so as to
make them grow.
� By expanding the lineup of non-coil business, speed up the
growth.
� Reshuffle and rejuvenate the members of top management
team in Stage III, so as to further grow in the next Master Plan
period.Copyright© 2018 SUMIDA CORPORATION. All rights reserved.
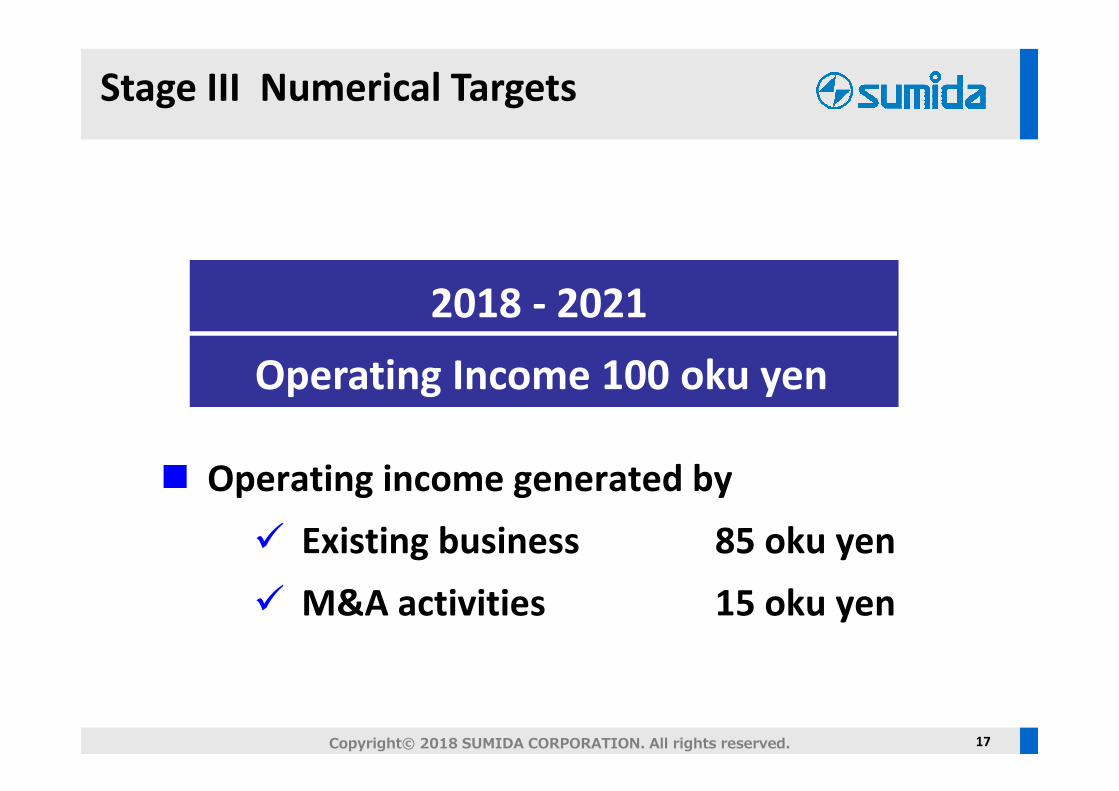
Stage III Numerical Targets
17
� Operating income generated by
� Existing business 85 oku yen
� M&A activities 15 oku yen
Operating Income 100 oku yen
2018 - 2021
Copyright© 2018 SUMIDA CORPORATION. All rights reserved.
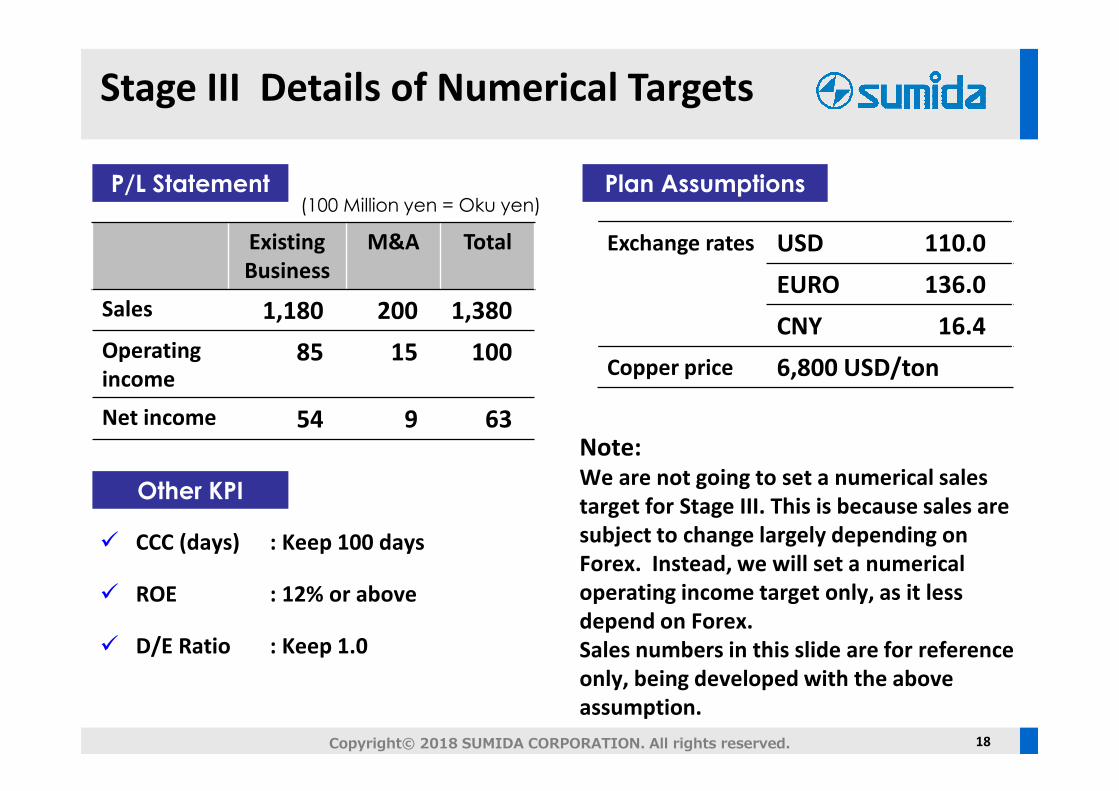
Stage III Details of Numerical Targets
18
Note:We are not going to set a numerical sales
target for Stage III. This is because sales are
subject to change largely depending on
Forex. Instead, we will set a numerical
operating income target only, as it less
depend on Forex.
Sales numbers in this slide are for reference
only, being developed with the above
assumption.
(100 Million yen = Oku yen)
Other KPI
P/L Statement
Existing
Business
M&A Total
Sales 1,180 200 1,380
Operating
income85 15 100
Net income 54 9 63
� CCC (days) : Keep 100 days
� ROE : 12% or above
� D/E Ratio : Keep 1.0
Exchange rates USD 110.0
EURO 136.0
CNY 16.4
Copper price 6,800 USD/ton
Plan Assumptions
Copyright© 2018 SUMIDA CORPORATION. All rights reserved.
64.4%
16.2%
19.4%
Automotive Industry
Consumer Elec
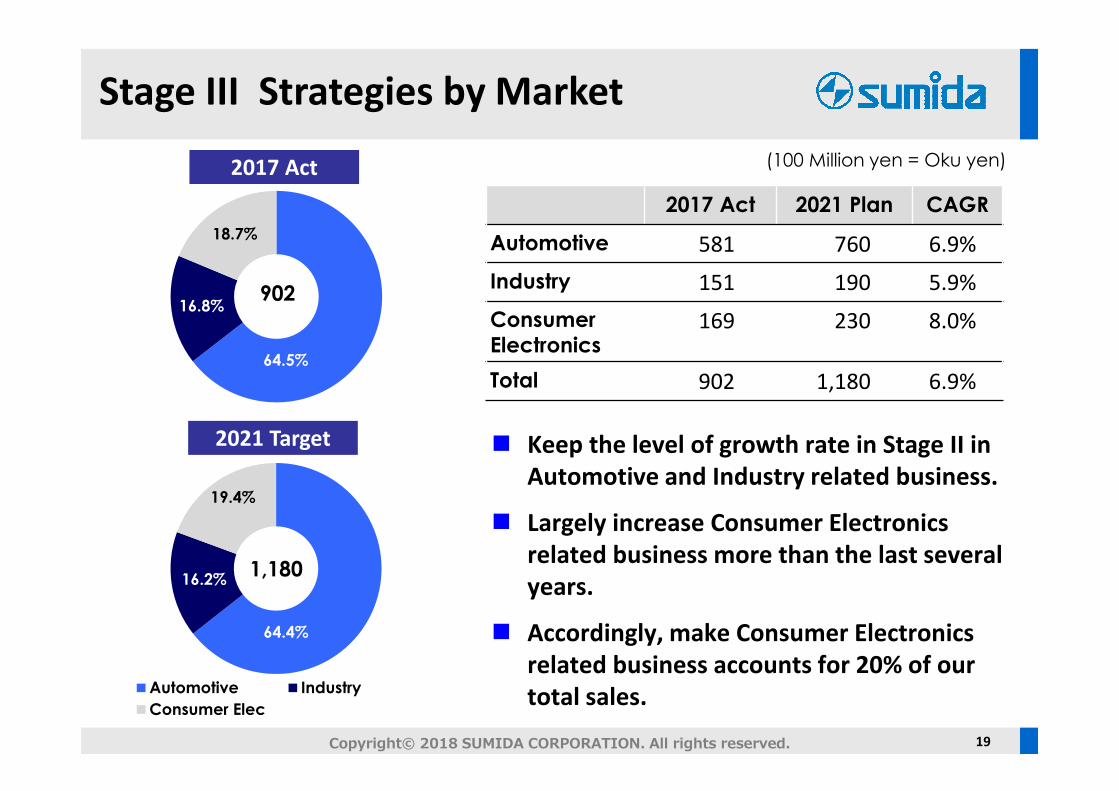
Stage III Strategies by Market
19
2017 Act
2021 Target
64.5%
16.8%
18.7%
1,180
2017 Act 2021 Plan CAGR
Automotive 581 760 6.9%
Industry 151 190 5.9%
Consumer
Electronics169 230 8.0%
Total 902 1,180 6.9%
� Keep the level of growth rate in Stage II in
Automotive and Industry related business.
� Largely increase Consumer Electronics
related business more than the last several
years.
� Accordingly, make Consumer Electronics
related business accounts for 20% of our
total sales.
(100 Million yen = Oku yen)
902
Copyright© 2018 SUMIDA CORPORATION. All rights reserved.
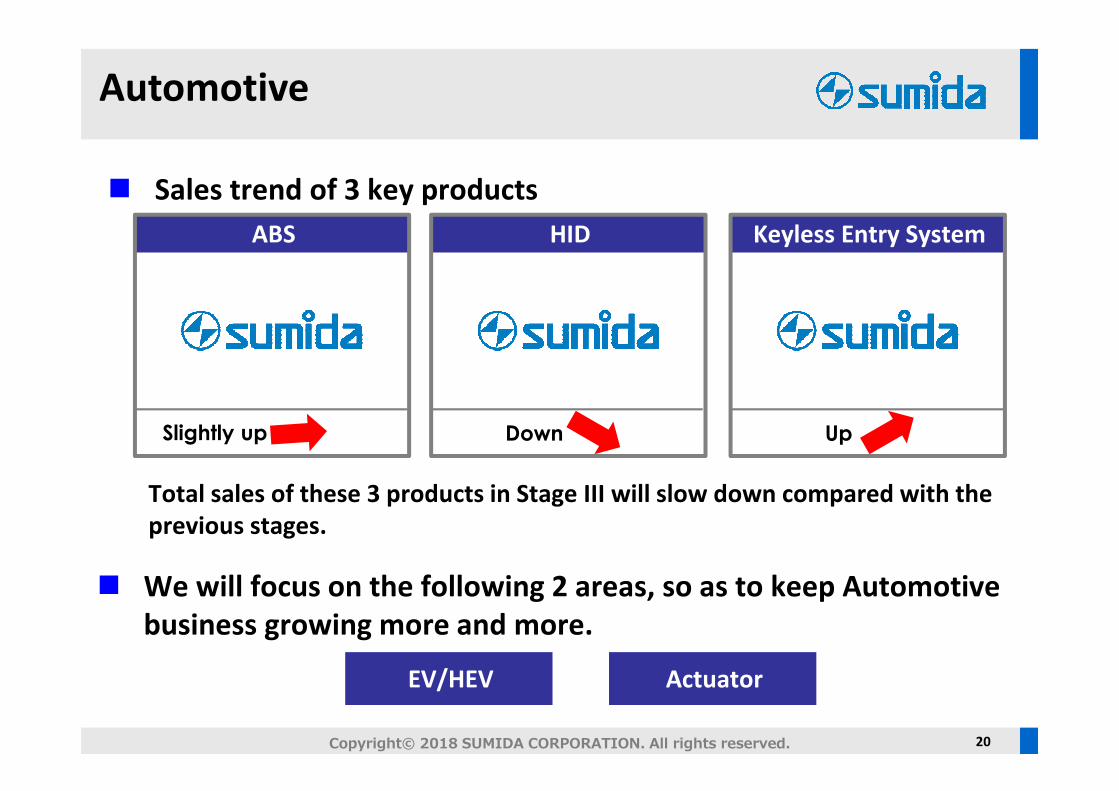
Automotive
20
� Sales trend of 3 key products
ABS HID Keyless Entry System
� We will focus on the following 2 areas, so as to keep Automotive
business growing more and more.
Total sales of these 3 products in Stage III will slow down compared with the
previous stages.
Slightly up Down Up
EV/HEV Actuator
Copyright© 2018 SUMIDA CORPORATION. All rights reserved.
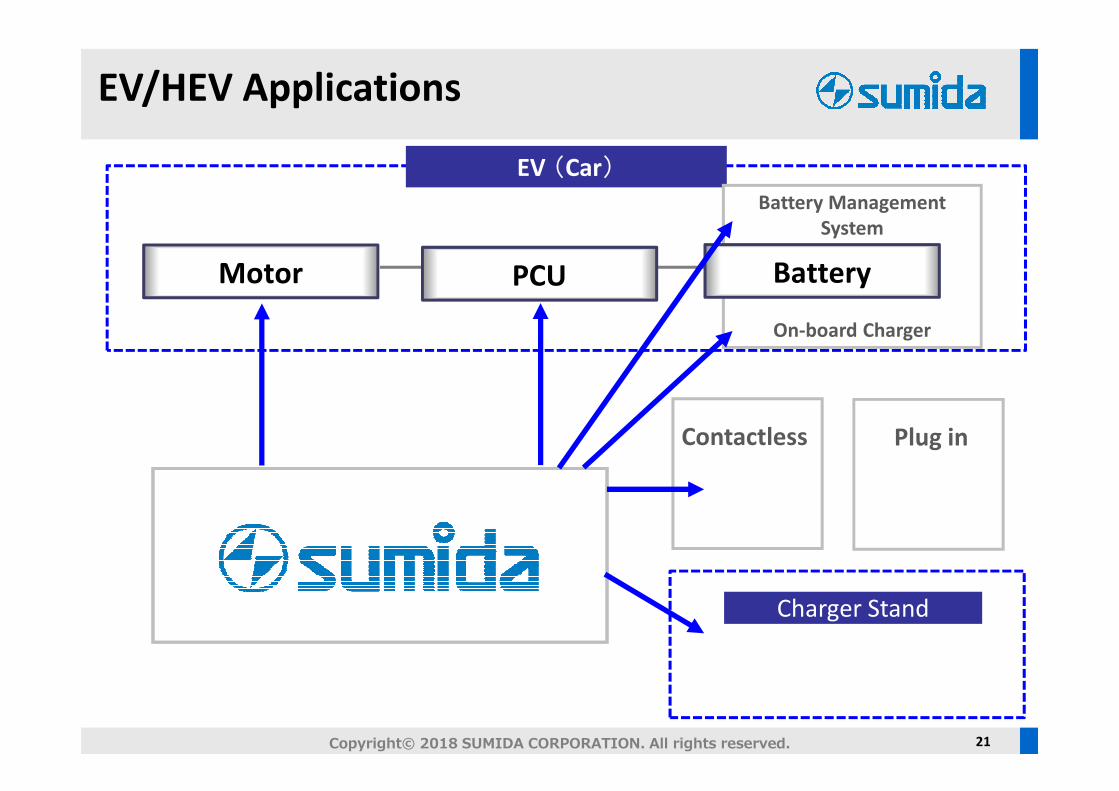
EV/HEV Applications
21
Charger Stand
EV (Car)Battery Management
System
On-board Charger
Motor BatteryPCU
Contactless Plug in
Copyright© 2018 SUMIDA CORPORATION. All rights reserved.
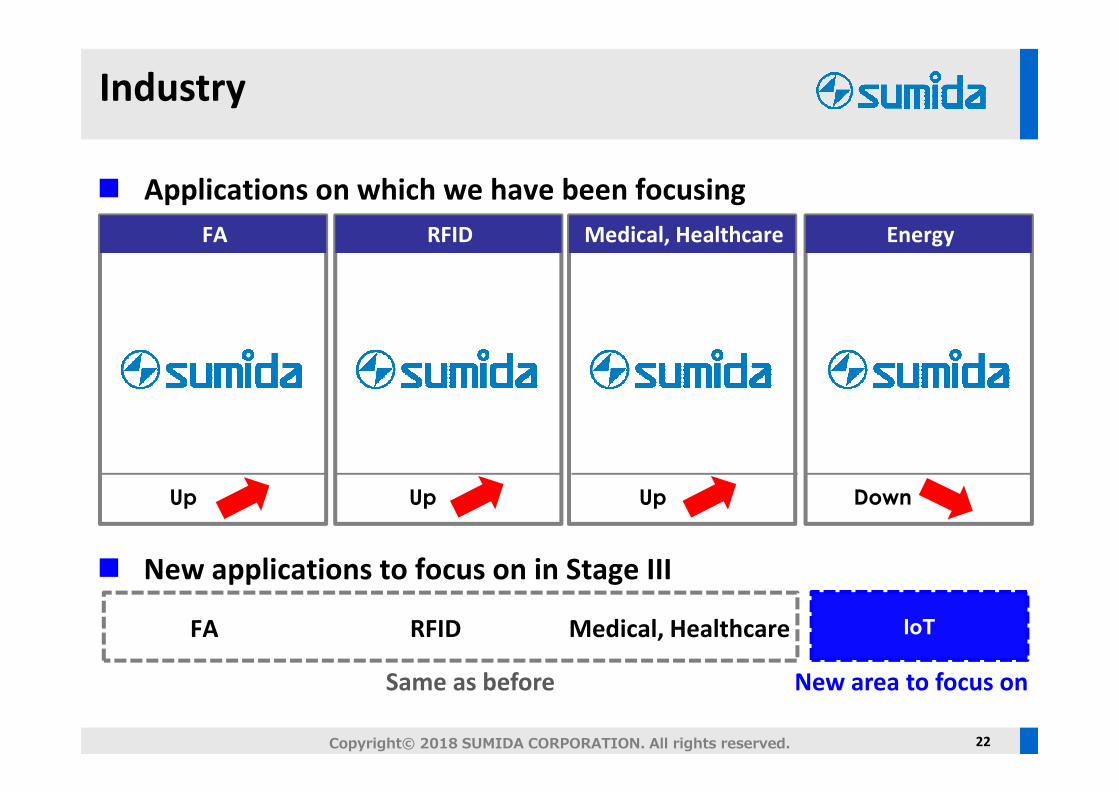
Industry
22
� Applications on which we have been focusing
� New applications to focus on in Stage III
FA RFID Medical, Healthcare
Same as before New area to focus on
FA RFID EnergyMedical, Healthcare
Up Up Up Down
IoT
Copyright© 2018 SUMIDA CORPORATION. All rights reserved.
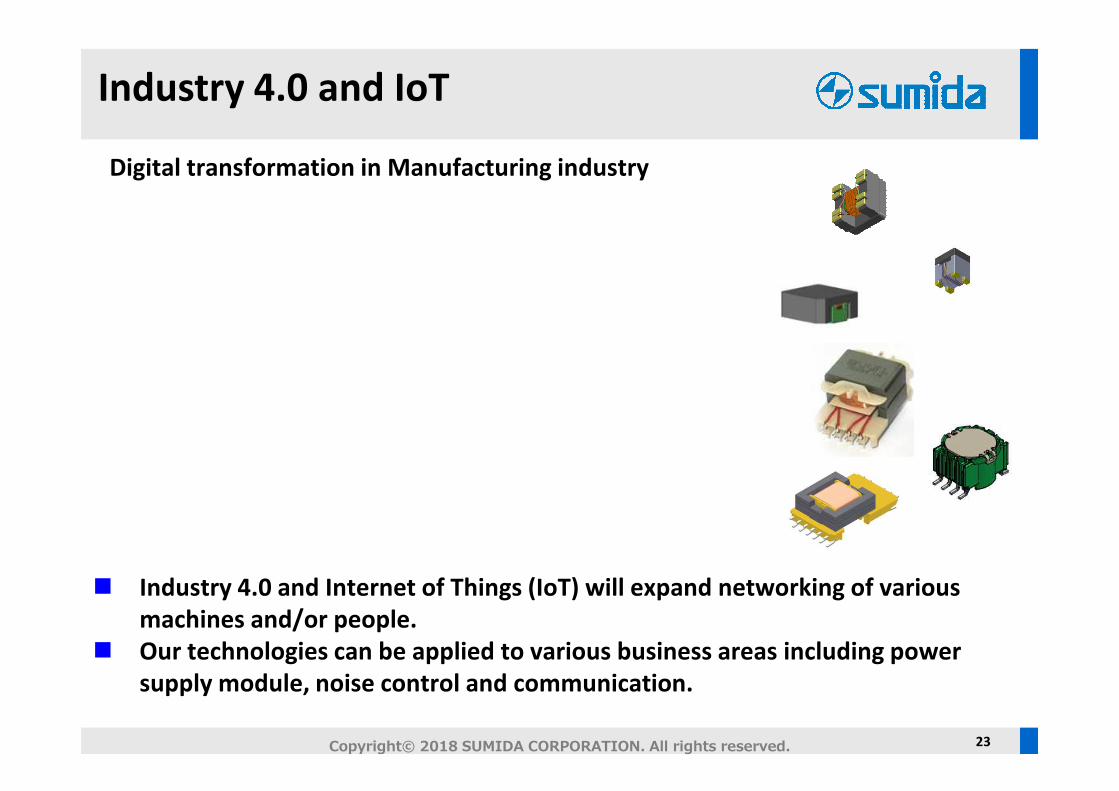
Industry 4.0 and IoT
23
Digital transformation in Manufacturing industry
� Industry 4.0 and Internet of Things (IoT) will expand networking of various
machines and/or people.
� Our technologies can be applied to various business areas including power
supply module, noise control and communication.
Copyright© 2018 SUMIDA CORPORATION. All rights reserved.
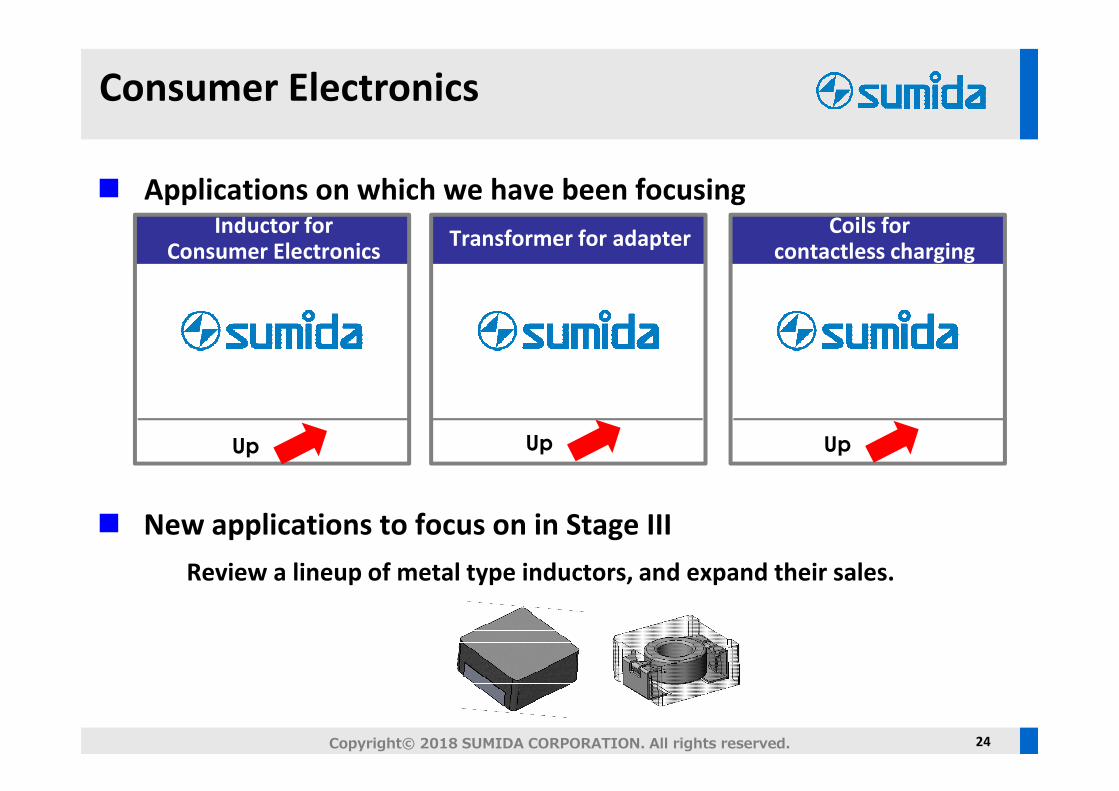
Consumer Electronics
24
� Applications on which we have been focusing
� New applications to focus on in Stage III
Review a lineup of metal type inductors, and expand their sales.
Inductor forConsumer Electronics
Transformer for adapterCoils for
contactless charging
Up Up Up
Copyright© 2018 SUMIDA CORPORATION. All rights reserved.
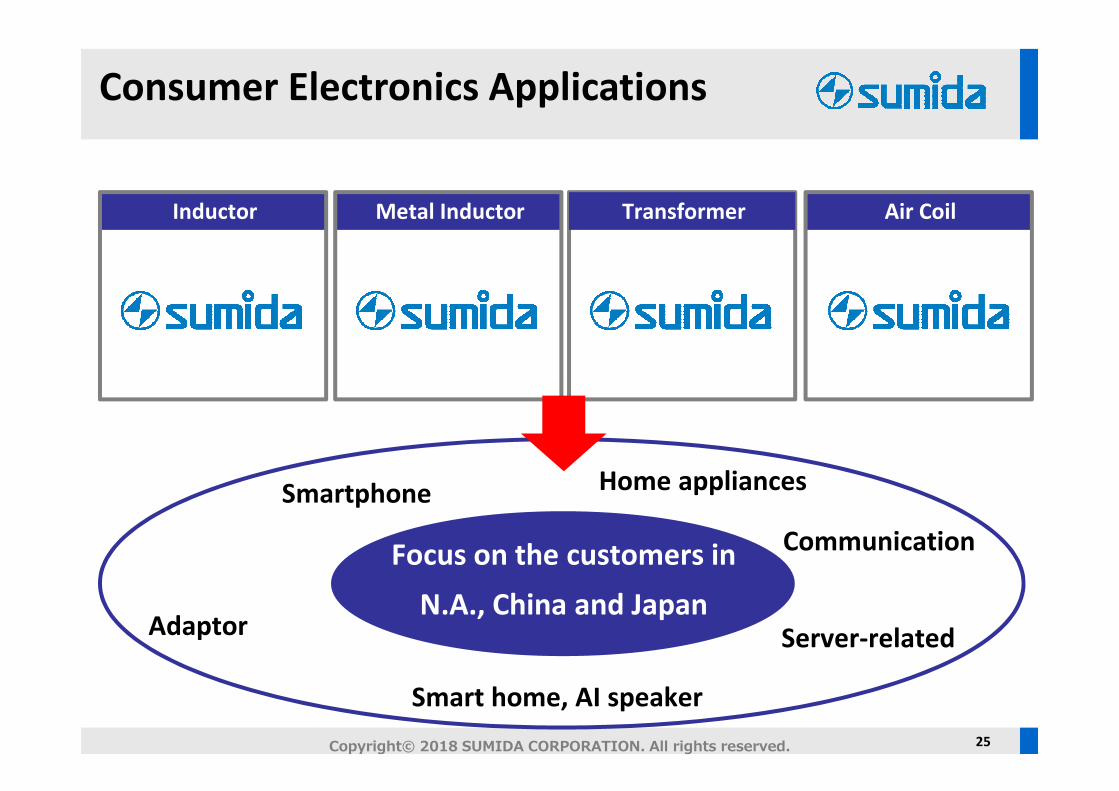
Consumer Electronics Applications
25
Inductor Metal Inductor
Smartphone
Air CoilTransformer
Adaptor
Communication
Server-related
Smart home, AI speaker
Focus on the customers in
N.A., China and Japan
Home appliances
Copyright© 2018 SUMIDA CORPORATION. All rights reserved.
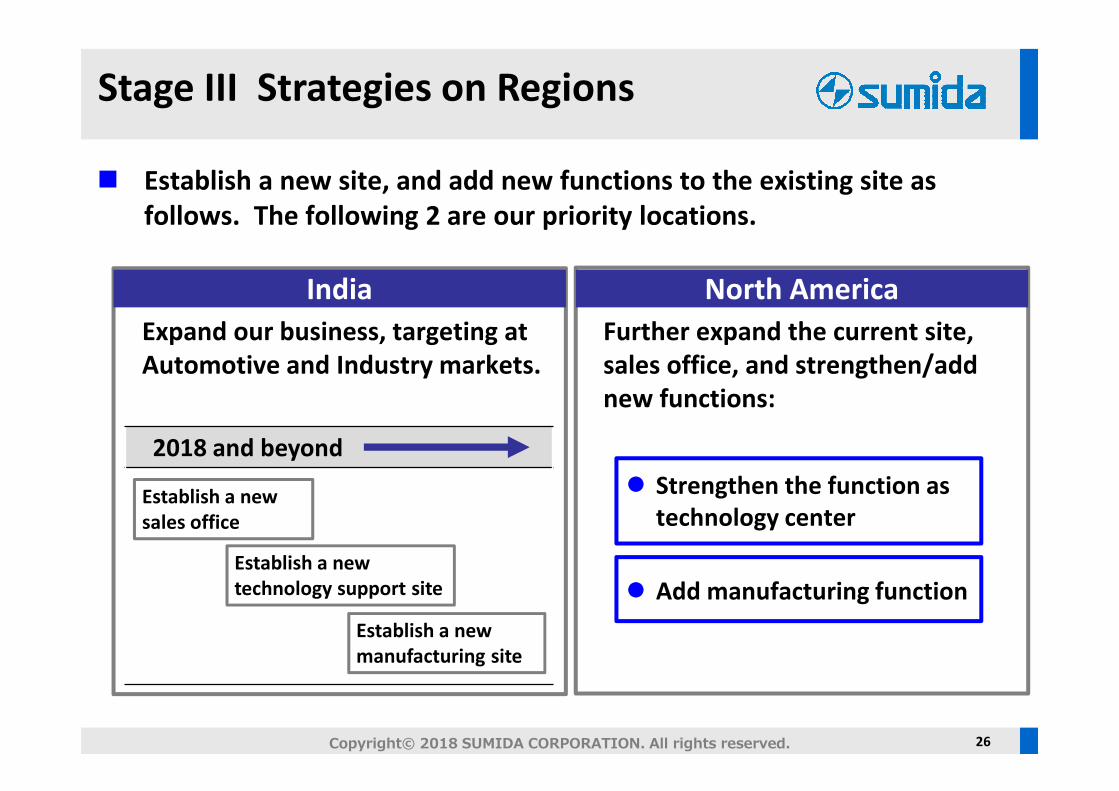
Stage III Strategies on Regions
26
� Establish a new site, and add new functions to the existing site as
follows. The following 2 are our priority locations.
India North America
Expand our business, targeting at
Automotive and Industry markets.
Further expand the current site,
sales office, and strengthen/add
new functions:
2018 and beyond
Establish a new
sales office
Establish a new
technology support site
Establish a new
manufacturing site
� Strengthen the function as
technology center
� Add manufacturing function
Copyright© 2018 SUMIDA CORPORATION. All rights reserved.
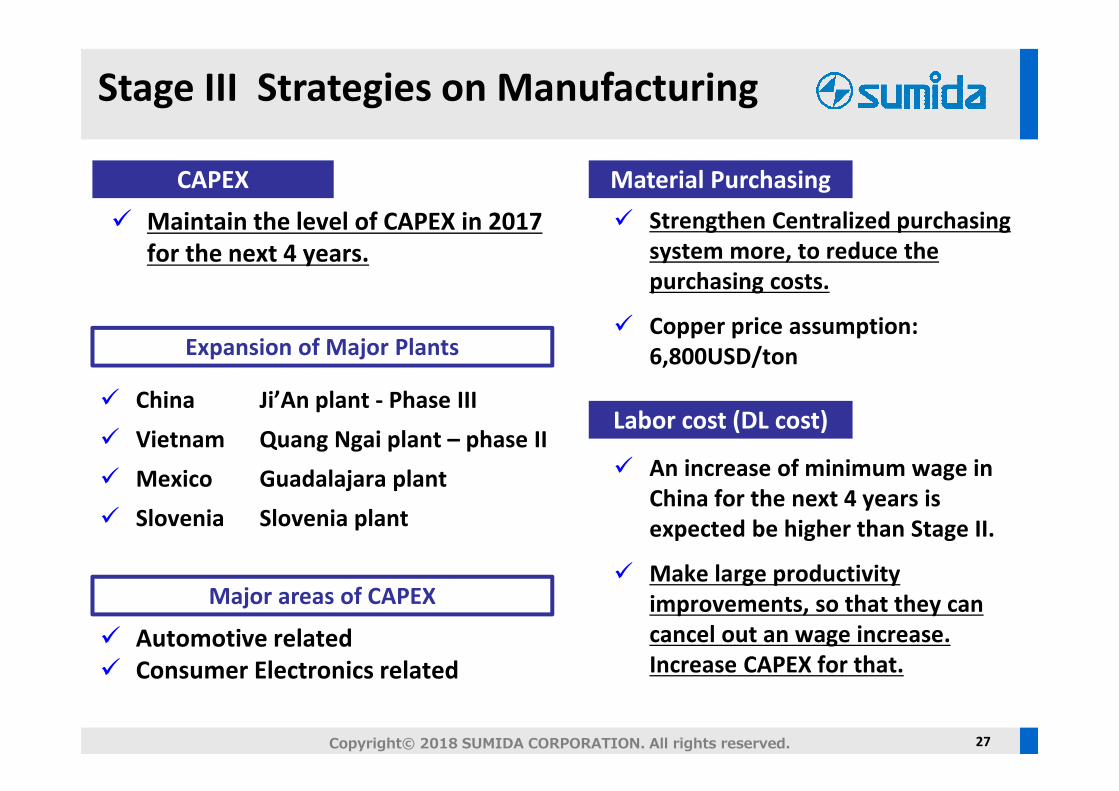
Stage III Strategies on Manufacturing
27
� Maintain the level of CAPEX in 2017
for the next 4 years.
Expansion of Major Plants
� China Ji’An plant - Phase III
� Vietnam Quang Ngai plant – phase II
� Mexico Guadalajara plant
� Slovenia Slovenia plant
� Strengthen Centralized purchasing
system more, to reduce the
purchasing costs.
� Copper price assumption:
6,800USD/ton
� An increase of minimum wage in
China for the next 4 years is
expected be higher than Stage II.
� Make large productivity
improvements, so that they can
cancel out an wage increase.
Increase CAPEX for that.
Major areas of CAPEX
� Automotive related
� Consumer Electronics related
CAPEX Material Purchasing
Labor cost (DL cost)
Copyright© 2018 SUMIDA CORPORATION. All rights reserved.
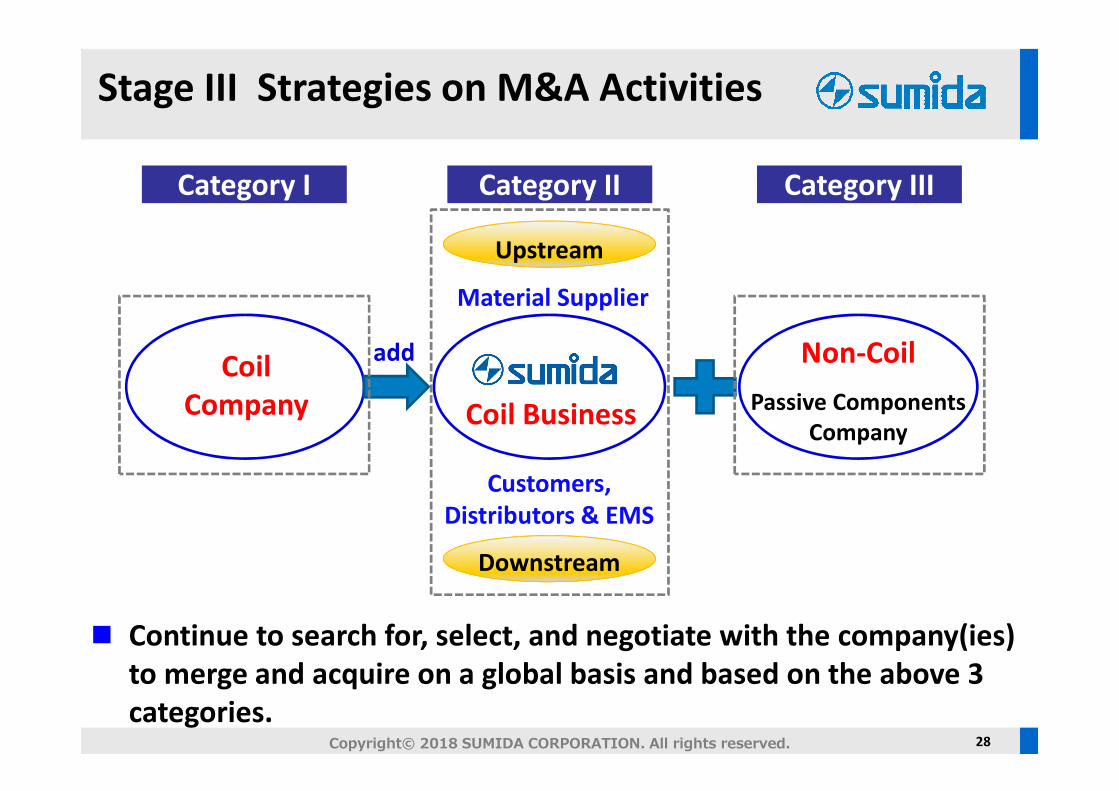
Stage III Strategies on M&A Activities
28
� Continue to search for, select, and negotiate with the company(ies)
to merge and acquire on a global basis and based on the above 3
categories.
Coil
Company Coil Business
Non-Coil
Passive Components
Company
Customers,
Distributors & EMS
Downstream
add
Upstream
Material Supplier
Category I Category II Category III
Copyright© 2018 SUMIDA CORPORATION. All rights reserved.
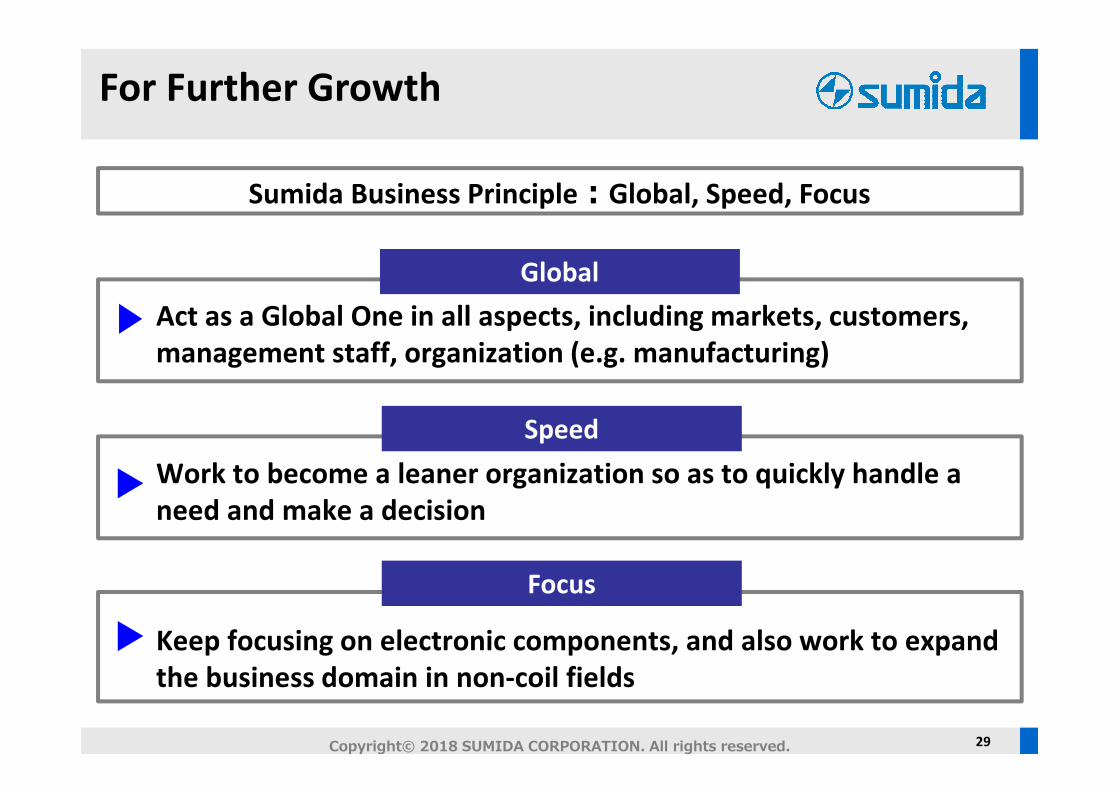
Act as a Global One in all aspects, including markets, customers,
management staff, organization (e.g. manufacturing)
Global
For Further Growth
29
Work to become a leaner organization so as to quickly handle a
need and make a decision
Speed
Keep focusing on electronic components, and also work to expand
the business domain in non-coil fields
Focus
Sumida Business Principle:Global, Speed, Focus
Copyright© 2018 SUMIDA CORPORATION. All rights reserved.

30Copyright© 2018 SUMIDA CORPORATION. All rights reserved.
Stage Ⅲ Finance Strategies
(Millions of yen)
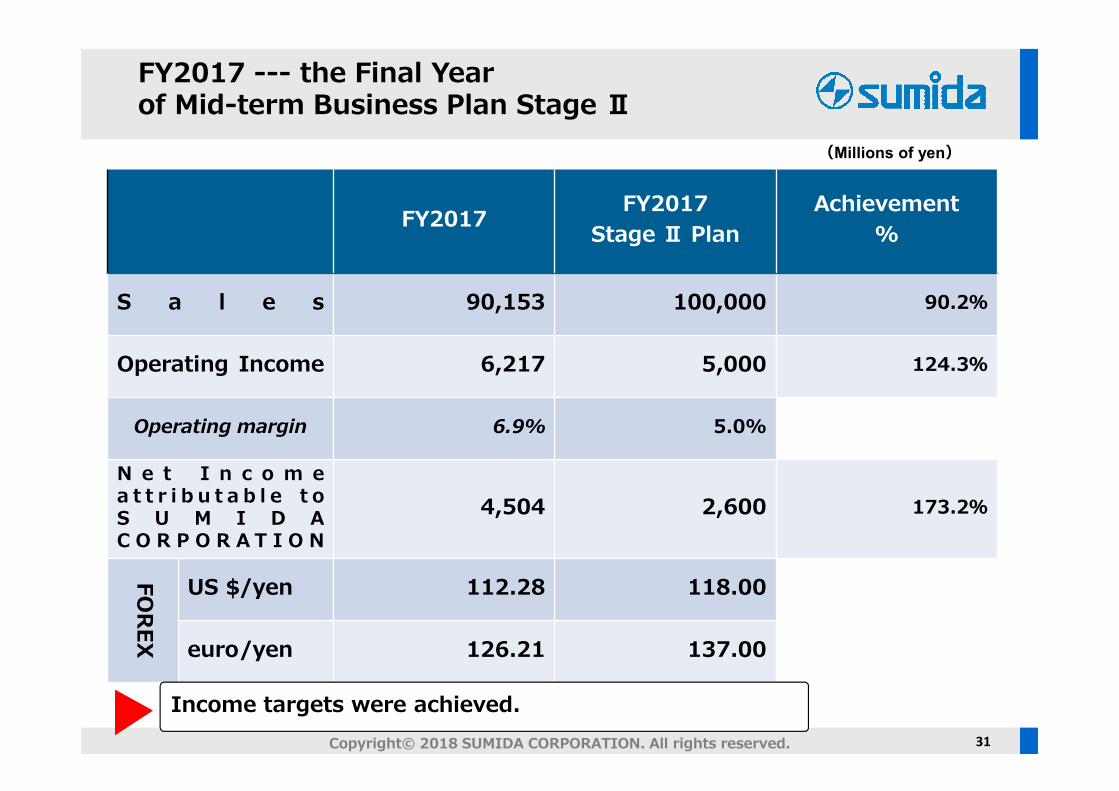
FY2017 --- the Final Year of Mid-term Business Plan Stage Ⅱ
FY2017 FY2017Stage Ⅱ Plan
Achievement %
S a l e s 90,153 100,000 90.2%
Operating Income 6,217 5,000 124.3%
Operating margin 6.9% 5.0%
N e t I n c o m ea t t r i b u t a b l e t oS U M I D AC O R P O R A T I O N
4,504 2,600 173.2%
FOR
EX
US $/yen 112.28 118.00
euro/yen 126.21 137.00
Income targets were achieved.Copyright© 2018 SUMIDA CORPORATION. All rights reserved. 31
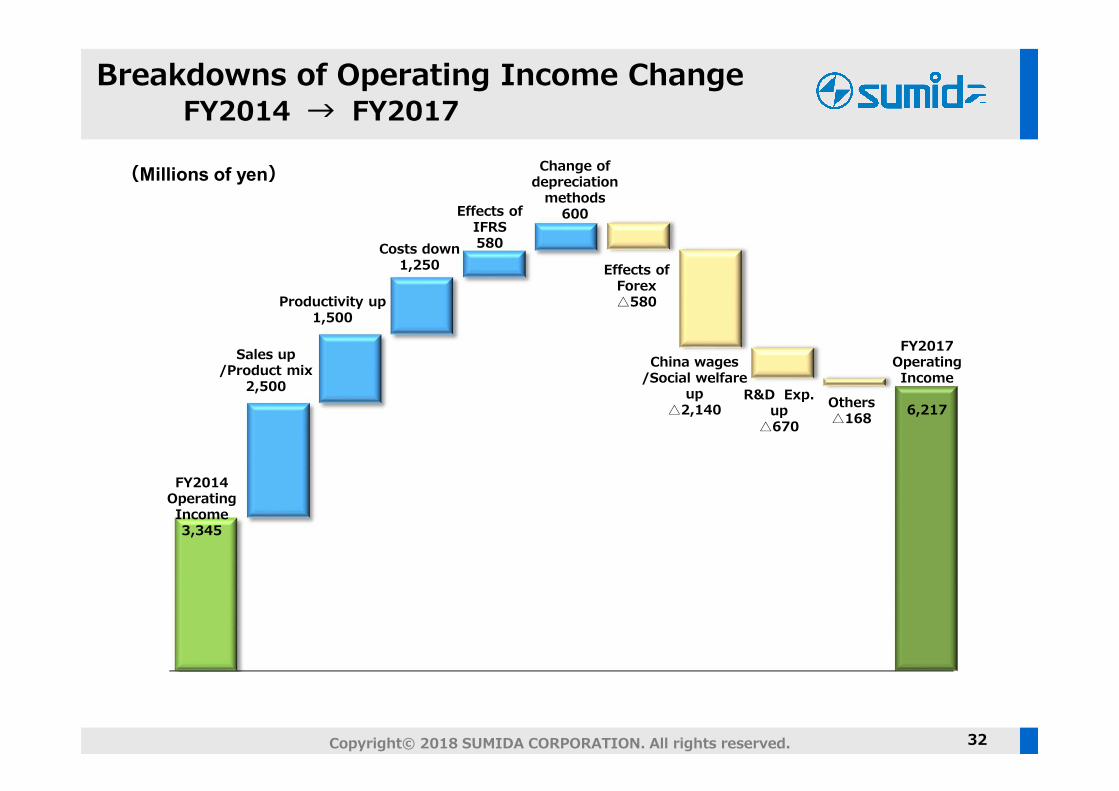
Breakdowns of Operating Income ChangeFY2014 → FY2017
Change of depreciation
methods600
32
FY2014Operating Income3,345
Effects of Forex△580
(Millions of yen)
FY2017Operating Income
6,217Others△168
Productivity up1,500
Sales up/Product mix
2,500China wages
/Social welfareup
△2,140R&D Exp.
up△670
Copyright© 2018 SUMIDA CORPORATION. All rights reserved.
Costs down1,250
Effects of IFRS580

FY2017(Actual)
FY2017(Plan)
CCC 100 days 100 days
ROE (3 year average) 15.5% more than 12%
Sales Profit Ratio 3.5% 2.6%
Sales/Total Assets 1.2 1.2
Total Assets/Net Equity 3.6 3.7
(Net D/E Rtio) (1.0) (1.5)
33
Monitoring Targets/Components of ROE
Copyright© 2018 SUMIDA CORPORATION. All rights reserved.
FY2017 FY2021 Targets CAGR
Sales 902億円 1,380億円 11.2%
Operating Income 62億円 100億円 12.6%
Net Income attributable to SUMIDA CORPORATION
45億円 63億円 8.7%
《Forex assumptions》
米ドル/円 112.28円 110.00円
ユーロ/円 126.21円 136.00円
⼈⺠元/円 16.54円 16.40円
34
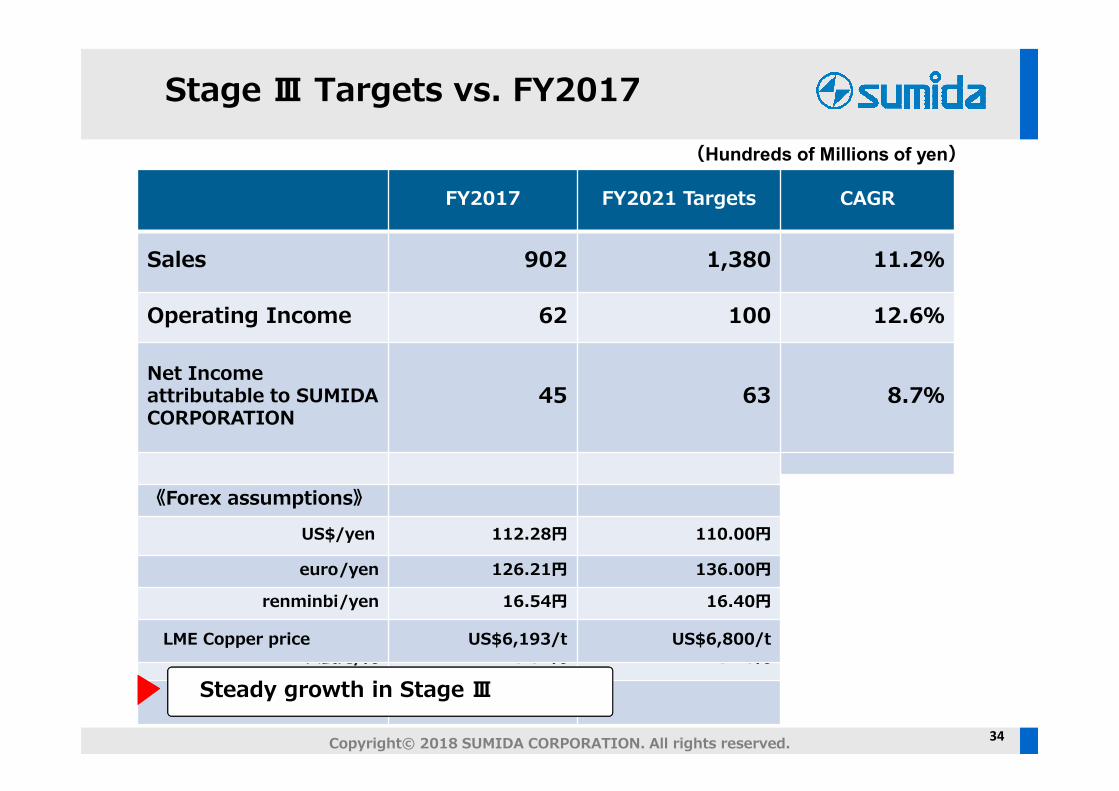
Stage Ⅲ Targets vs. FY2017
Steady growth in Stage Ⅲ
Copyright© 2018 SUMIDA CORPORATION. All rights reserved.
FY2017 FY2021 Targets CAGR
Sales 902 1,380 11.2%
Operating Income 62 100 12.6%
Net Income attributable to SUMIDA CORPORATION
45 63 8.7%
《Forex assumptions》US$/yen 112.28円 110.00円
euro/yen 126.21円 136.00円
renminbi/yen 16.54円 16.40円
LME Copper price US$6,193/t US$6,800/t
(Hundreds of Millions of yen)
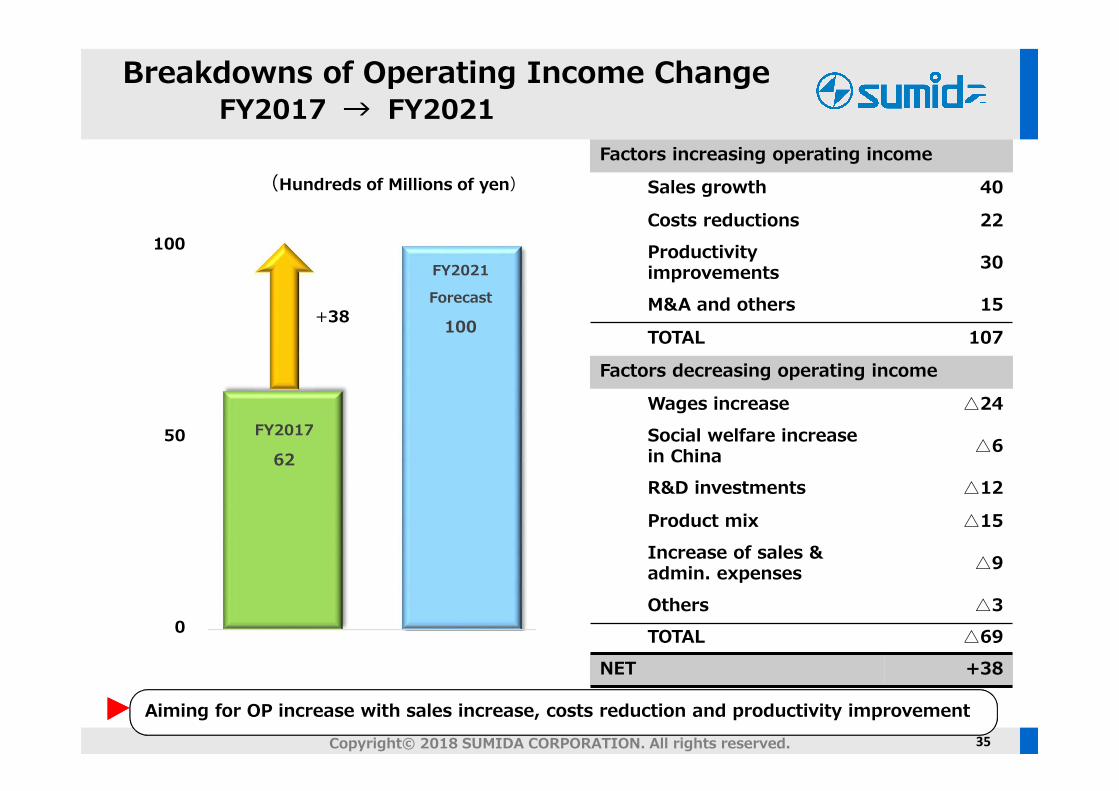
Breakdowns of Operating Income ChangeFY2017 → FY2021
FY2017
62
FY2021
Forecast
100
0
50
100
+38
Factors increasing operating income
Sales growth 40
Costs reductions 22Productivityimprovements 30
M&A and others 15
TOTAL 107
Factors decreasing operating income
Wages increase △24Social welfare increase in China △6
R&D investments △12
Product mix △15Increase of sales & admin. expenses △9
Others △3TOTAL △69
NET +38
35
(Hundreds of Millions of yen)
Aiming for OP increase with sales increase, costs reduction and productivity improvementCopyright© 2018 SUMIDA CORPORATION. All rights reserved.
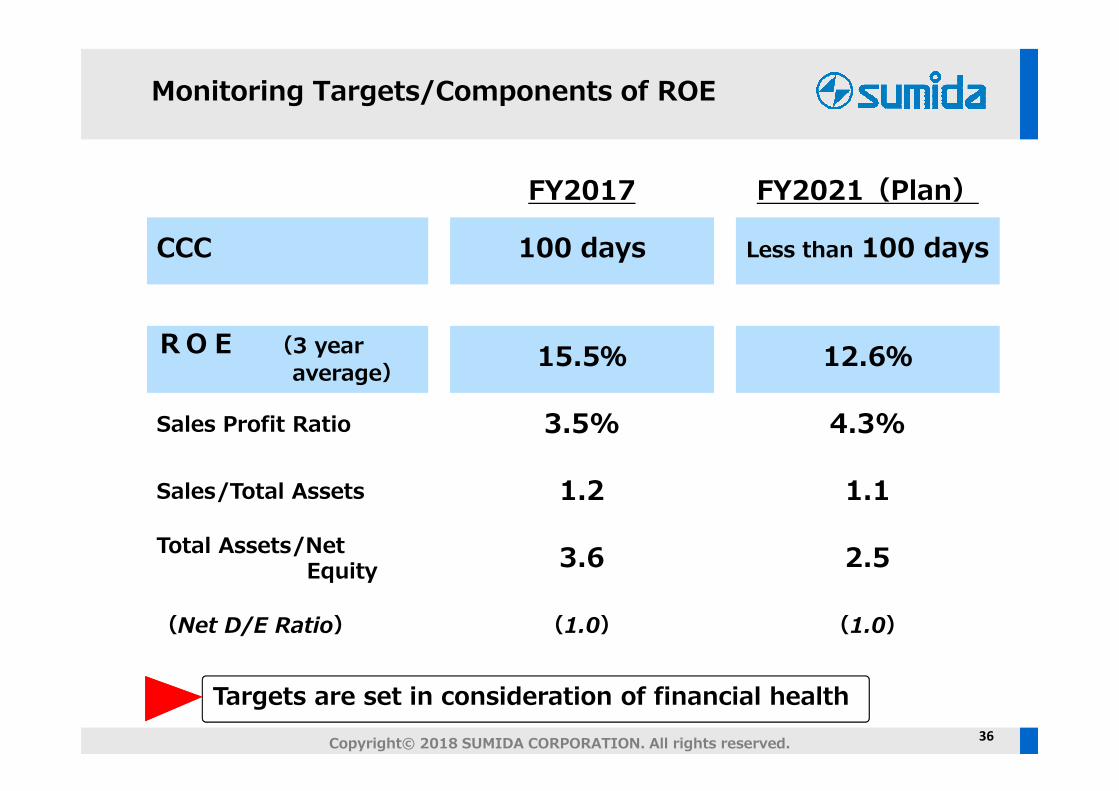
FY2017 FY2021(Plan)
CCC 100 days Less than 100 days
ROE (3 year average) 15.5% 12.6%
Sales Profit Ratio 3.5% 4.3%
Sales/Total Assets 1.2 1.1
Total Assets/Net Equity 3.6 2.5
(Net D/E Ratio) (1.0) (1.0)
36
Monitoring Targets/Components of ROE
Targets are set in consideration of financial healthCopyright© 2018 SUMIDA CORPORATION. All rights reserved.

37
Total CAPEX in Stage Ⅲ (2018-2021)
TOTAL CAPEX
For the coming 4 years(2018-2021)
For the past 4 years(2014-2017) Growth
%2017
350 〜 390 238 +50%〜
+60%
88
【Estimated CAPEX Plan】2018 2019 2020 2021
100 80〜95 80〜95 80〜95
Copyright© 2018 SUMIDA CORPORATION. All rights reserved.
(Hundreds of Millions of yen)
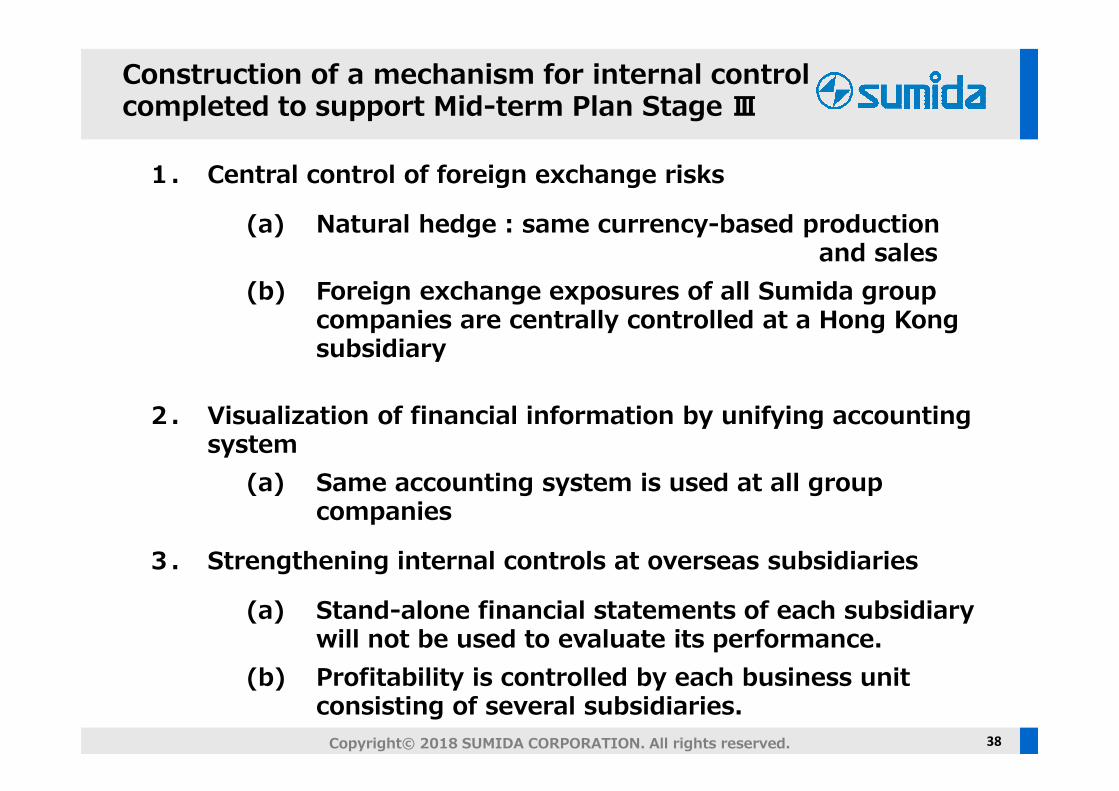
1. Central control of foreign exchange risks
(a) Natural hedge : same currency-based production and sales
(b) Foreign exchange exposures of all Sumida group companies are centrally controlled at a Hong Kong subsidiary
2. Visualization of financial information by unifying accountingsystem
(a) Same accounting system is used at all group companies
3. Strengthening internal controls at overseas subsidiaries
(a) Stand-alone financial statements of each subsidiarywill not be used to evaluate its performance.
(b) Profitability is controlled by each business unit consisting of several subsidiaries.
38
Construction of a mechanism for internal controlcompleted to support Mid-term Plan Stage Ⅲ
Copyright© 2018 SUMIDA CORPORATION. All rights reserved.
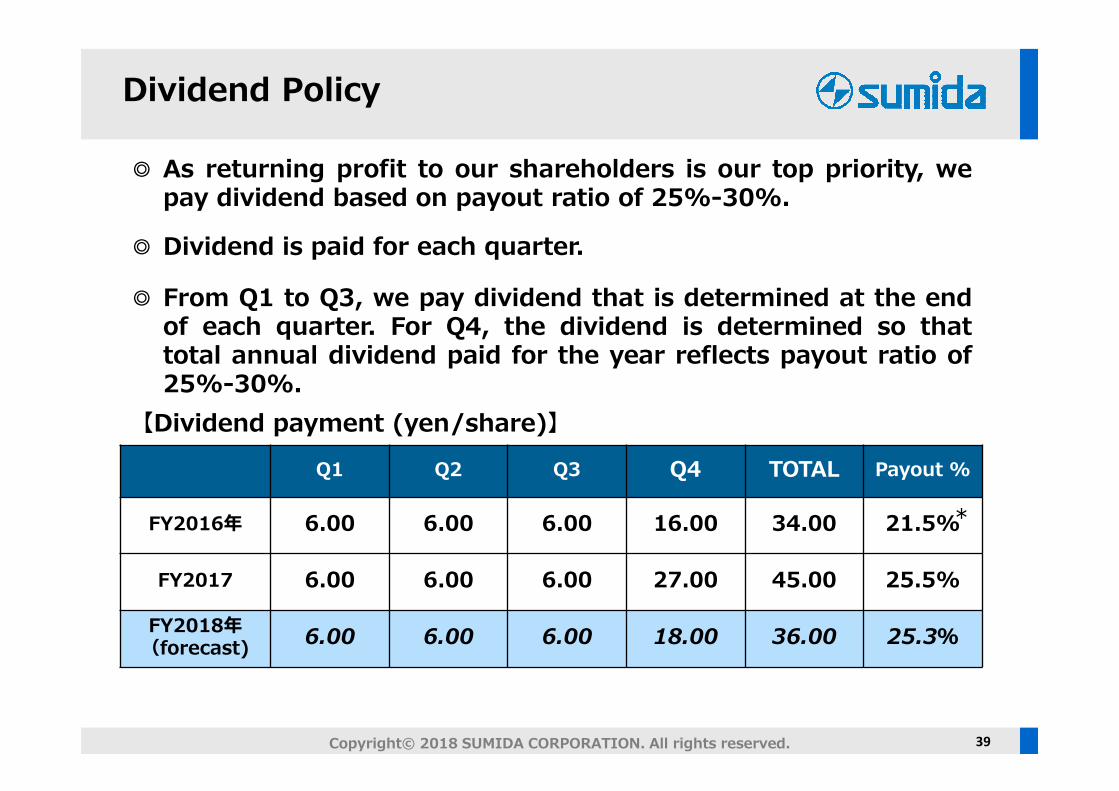
Dividend Policy
◎ As returning profit to our shareholders is our top priority, wepay dividend based on payout ratio of 25%-30%.
◎ Dividend is paid for each quarter.
◎ From Q1 to Q3, we pay dividend that is determined at the endof each quarter. For Q4, the dividend is determined so thattotal annual dividend paid for the year reflects payout ratio of25%-30%.
【Dividend payment (yen/share)】Q1 Q2 Q3 Q4 TOTAL Payout %
FY2016年 6.00 6.00 6.00 16.00 34.00 21.5%
FY2017 6.00 6.00 6.00 27.00 45.00 25.5%
FY2018年(forecast) 6.00 6.00 6.00 18.00 36.00 25.3%
39Copyright© 2018 SUMIDA CORPORATION. All rights reserved.
*
Disclaimer Regarding Forward Looking Statements
Copyright© 2012 SUMIDA CORPORATION. All rights reserved. 40
Sumida Corporation (referred to as "Sumida") makes this document available for informational
purposes only. This document contains certain “forward-looking statements” which reflect
management’s current views and the assumptions made with respect to specific future events
and financial performance. Such statements are based on currently available information, and
by their nature are subject to various risks and uncertainties that could cause actual results to
differ materially from those projected or implied in “forward-looking statements” and from
historical trends.
These risks include but are not limited to domestic and global economic business conditions,
successful execution of our strategy and our ability to realise the resulting benefits, our ability
to develop and market new products, changes in legislation, legal claims, changes in exchange
and interest rates, changes in tax rates, actuarial assumptions, raw materials and employee
costs, our ability to restructure our operations, the rate of technological changes, political,
economic and other developments in countries where Sumida operates, industry consolidation
and competition. As a result, Sumida’s actual future results may differ materially from the plans,
goals and expectations set forth in such forward-looking statements. Sumida is under no
obligation to, and expressly disclaims any obligations to, update or alter its forward-looking
statements, whether as a result of new information, subsequent or otherwise.
Sumida is under no liability of any person in respect of any loss and damage which may be
suffered or incurred or which may arise directly or indirectly in respect of information contained.
All rights, including, but not limited to the copyright, reserved. No part of this document may be
reproduced in any means without the prior written permission of Sumida.