Embed Size (px)
Citation preview

1 April 2019
Prepared For and Submitted To
National Marine Fisheries Service Office of Protected Resources
Prepared By
Department of the Navy
In accordance with
50 CFR §218.75(d), § 218.95(e), § 218.145(f), and § 218.155(f)
2018 U.S. Navy Annual Marine Species
Monitoring Report for the Pacific:
A Multi-Range-Complex Monitoring Report
for Hawaii-Southern California Training and Testing (HSTT),
Mariana Islands Training and Testing (MITT),
Northwest Training and Testing (NWTT),
and the Gulf of Alaska Temporary Maritime Activities Area (GOA TMAA)

Citation for this report is as follows: DoN (Department of the Navy). 2019. 2018 U.S. Navy Annual Marine Species Monitoring
Report for the Pacific: A Multi-Range-Complex Monitoring Report For Hawaii-Southern
California Training and Testing (HSTT), Mariana Islands Training and Testing (MITT), Northwest
Training and Testing (NWTT), and the Gulf of Alaska Temporary Maritime Activities Area (GOA
TMAA). Prepared by the Department of the Navy. Prepared for and submitted to National
Marine Fisheries Service, Silver Spring, Maryland. 1 April 2019.
List of Contributors (Main Document):
Kristen Ampela (HDR, Inc.), Cathy E. Bacon (HDR, Inc.), Andrea Balla-Holden (U.S. Pacific
Fleet), Mark Deakos (HDR, Inc.), Dagmar Fertl (HDR, Inc.), Chip Johnson (U.S. Pacific Fleet),
Julie A. Rivers (U.S. Pacific Fleet), Jessica Chen (Naval Facilities Engineering Command,
Pacific), and Robert K. Uyeyama (Naval Facilities Engineering Command, Pacific).
List of Contributors (Technical Reports) (Alphabetized by organization):
David B. Anderson, Robin W. Baird, Colin J. Cornforth, Sabre D. Mahaffy, Daniel L. Webster,
Kimberly A. Wood (Cascadia Research Collective); Jessica Aschettino, and Mark Deakos
(HDR, Inc.); Thomas Jefferson (HDR, Inc., and Clymene Enterprises); Tara Leota (Kaua‘i Sea
Rider Adventures); Erin A. Falcone, Erin L. Keene, Brenda K. Rone, and Gregory S. Schorr
(Marine Ecology and Telemetry Research); Benjamin Bartley, and Emily Oliveira (McLaughlin
Research Corporation); Gabriela C. Alongi, Cameron R. Martin, Stephen W. Martin, and Brian
M. Matsuyama (National Marine Mammal Foundation); Angela Bostwick (Naval Facilities
Engineering Command, Pacific); Nancy DiMarzio, Tom Fetherston, Susan M. Jarvis, and David
J. Moretti (Naval Undersea Warfare Center Division Newport); David D. Huff Joseph M. Smith,
Candice K. Emmons, and M. Bradley Hanson (NOAA-NWFSC); T. Todd Jones, Allan D. Ligon,
Summer L. Martin, Erin M. Oleson, and Adam C. Ü (NOAA Fisheries-PIFSC); Marie C. Hill and
Alexander R. Gaos (NOAA Fisheries-PIFSC and Joint Institute for Marine and Atmospheric
Research, Research Corporation of the University of Hawaii); Karen K. Martien, and Kelly M.
Robertson (NOAA-SWFSC); C. Scott Baker, Tomas Follett, Craig Hayslip, Ladd M. Irvine,
Barbara A. Lagerquist, Bruce R. Mate, Daniel M. Palacios, Debbie Steel, and Martha H. Winsor
(Oregon State University); Simone Baumann-Pickering, Alba Solsona Berga, Kaitlin Frasier,
John A. Hildebrand, Natalie Posdaljian, Macey Rafter, Emily Reagan, Ally C. Rice, Ana Širović,
Bruce J. Thayre, Jennifer S. Trickey, and Sean M. Wiggins (Scripps Institution of
Oceanography); Brandon L. Southall (Southall Environmental Associates, Inc.); Leslie Bolick,
Jessica Carilli, Douglas Fenner, Tyler A. Helble, E. Elizabeth Henderson, Roanne A. Manzano-
Roth, Donald E. Marx, Jr., and Stephen H. Smith (Space and Naval Warfare Systems Center
Pacific); Tenaya Norris (The Marine Mammal Center); and Marc. O. Lammers (Oceanwide
Science Institute).
Photograph Credit:
Blainville’s beaked whale (Mesoplodon densirostris) photographed off Kauai by Mark Deakos
under NMFS Permit #14451.
DoN | 2018 All-Range Pacific Annual Monitoring Report EXECUTIVE SUMMARY
1 April 2019 | ES-1
Executive Summary
The United States (U.S.) Navy conducts training and testing activities in the Pacific study areas
described in the following Environmental Impact Statement/Overseas Environmental Impact
Statement (EIS/OEIS) documents: Hawaii-Southern California Training and Testing (HSTT)
(Department of Navy [DoN] 2013a, 2018a, Mariana Islands Training and Testing (MITT) (DoN
2015a), Northwest Training and Testing (NWTT) (DoN 2015b), and the Gulf of Alaska Navy
Training Activities (DoN 2011a, 2016a). The ranges covered by these documents include the
Hawaii Range Complex (HRC), Southern California Range Complex (SOCAL), Mariana Islands
Range Complex (MIRC), Northwest Training Range Complex (NWTRC) including the Naval Sea
Systems Command’s Naval Undersea Warfare Center Keyport Range Complex (Keyport Range
Complex), and the Gulf of Alaska Temporary Maritime Activities Area (GOA TMAA).
To authorize these actions, the National Marine Fisheries Service (NMFS) under the Marine
Mammal Protection Act (MMPA) issued 5-year Final Rules for HSTT (NMFS 2013a, 2014b,
2018a), MITT (NMFS 2015a), NWTT (NMFS 2015e), and GOA TMAA (NMFS 2017b); Letters of
Authorization (LOA) under the MMPA to Commander, U.S. Pacific Fleet and Commander, Naval
Sea Systems Command for HSTT (NMFS 2013b, 2013c, 2014c, 2014d, 2018c, 2018d), MITT
(NMFS 2015b, 2016), NWTT (NMFS 2015f, 2015g), and GOA TMAA (NMFS 2017a); and
Biological Opinions (BOs) under the Endangered Species Act for HSTT (NMFS 2013f, 2014a,
2015d, 2018b), MITT (NMFS 2015c, 2017d), NWTT (NMFS 2015h), and the GOA TMAA
(NMFS 2017c).
The U.S. Navy is required by the Final Rules, LOAs, and BOs above to implement marine
species monitoring. The regulations issued with the Final Rules for HSTT, MITT, NWTT, and
GOA TMAA require the U.S. Navy to submit an annual monitoring report, as specified at 50
Code of Federal Regulations § 218.75(d) (HSTT), § 218.95(e) (MITT), § 218.145(f) (NWTT),
and § 218.155(f) (GOA TMAA).
This monitoring report was prepared in accordance with the annual monitoring reporting
requirements for 2018, as described in these regulations. It presents NMFS and the public with
results and progress made during the period of 1 January 2018 to 31 December 2018. The
marine species monitoring described herein was conducted in accordance with project
objectives listed on the U.S. Navy’s Marine Species Monitoring website:
http://www.navymarinespeciesmonitoring.us/regions/pacific/current-projects/.
These MMPA authorizations were issued for a period of 5 years. The MITT, NWTT, and GOA
TMAA monitoring programs are currently within the second set of 5-year authorizations and
environmental planning documentation for the U.S. Navy, and that of HSTT transitioned in
December 2018 to the third set of authorizations (NMFS 2018a, 2018b, 2018c, 2018d).
Monitoring goals for these study areas are framed in terms of progress made on question-based
scientific objectives and programmatic Intermediate Scientific Objectives.
These objectives are considered within the conceptual framework that was developed in
consultation with the project’s Scientific Advisory Group (DoN 2011b). This conceptual

DoN | 2018 All-Range Pacific Annual Monitoring Report EXECUTIVE SUMMARY
1 April 2019 | ES-2
framework is centered on gathering monitoring information within the categories of “occurrence,
exposure, response, and consequences” as a progression of knowledge about marine species
and their interaction with U.S. Navy training and testing activities.
Highlights of current scientific progress over the course of this reporting period include the
following:
Abundance estimation using a dive-counting passive acoustic approach at bottom-
instrumented Navy training ranges indicated that numbers of Blainville’s beaked whales
at PMRF remained stable from 2015 to 2018, and numbers of Cuvier’s beaked whales at
SOAR between August 2010 and July 2018 appeared to be stable or slightly increasing.
Confirmed that a biopsy sample collected at PMRF in FY17 was from a hybrid melon-
headed whale/rough-toothed dolphin, the first-known hybrid of these two species.
Analyses of survey data collected at Farallon de Medinilla confirmed the documentation
of one colony of ESA-listed Acropora globiceps, as well as describing six colonies of
Pavona cf. diflluens (i.e., similar to ESA-listed P. diffluens, though the Pacific variant is
specifically excluded in the ESA listing). Analysis also suggest that several undescribed
species of scleractinian corals may occur at FDM.
Mitochondrial DNA haplotype frequencies of humpbacks on the west coast showed
previously undescribed differentiation between the California and Oregon feeding
aggregations, with Oregon animals appearing more similar to the NWA/SBC aggregation
of SPLASH. Haplotypic composition of California whales was most similar to Central
America, while the Oregon whales were most similar in haplotypic composition to those
found off Mexico.
Detected a new beaked whale FM pulse type in SOCAL, BW35, thought to be produced
by a Hubbs’ beaked whale.
Satellite tagging and photo-identification indicated high site fidelity within the Southern
California Bight (SCB)—Cuvier’s beaked whales on SOAR, and fin whales in the greater
SCB.
Analyzed acoustic towed-array data collected four times per year during 52 California
Cooperative Oceanic Fisheries Investigations (CalCOFI) survey cruises from 2004 to
2018; an unsupervised learning algorithm was applied to these data to distinguish
between impulse signals associated with echosounders, vessel propeller cavitation, and
beaked whale and dolphin echolocation clicks based on differences in their acoustic
spectra.
Initiated one of the first studies of at-sea distribution and foraging behavior of Guadalupe
fur seals using satellite tags; land- and vessel-based population surveys at San Benito
Archipelago and Guadalupe Island (GI), México, were also conducted. Preliminary
analysis indicated that adult and juvenile females exhibited more “resident” foraging
behavior and remained close and returned to GI, while juvenile males dispersed away
from the Island.

DoN | 2018 All-Range Pacific Annual Monitoring Report EXECUTIVE SUMMARY
1 April 2019 | ES-3
Examined blue and fin whale movements in relation to three environmental indices (the
Oceanic Niño Index, the Pacific Decadal Oscillation index, and the North Pacific Gyre
Oscillation index; results suggest that the anomalous warm-water events of 2014 and
2015 had different impacts on blue and fin whales.
Identified ecological relationships that help explain the spatial and temporal movement
patterns by tracked blue and fin whales in the eastern North Pacific from satellite-
determined and bathymetric measurements
Geographic differences in clicks from Blainville’s beaked whales from different
geographic regions analyzed, with the resulting hypotheses that population differences
may underlie call variability, and that this species also produces the BW38 signal.
With regard to these conceptual framework categories, several projects in CY2018 in HSTT
(HRC and SOCAL), demonstrated progress beyond the conceptual category for monitoring of
occurrence, and estimated the exposure of these animals to mid-frequency active sonar (MFAS)
and explosives, assessed animals’ responses to underwater noise generated by U.S. Navy
training and testing activities, and made strides toward assessing any population consequences
resulting from these activities by investigating population trends.
DoN | 2018 All-Range Pacific Annual Monitoring Report EXECUTIVE SUMMARY
1 April 2019 | ES-4
This page intentionally left blank.
DoN | 2018 All-Range Pacific Annual Monitoring Report TABLE OF CONTENTS
1 April 2019 | i
Table of Contents
Executive Summary ................................................................................................................. 1
Acronyms and Abbreviations ............................................................................................... viii
1. Introduction ....................................................................................................................... 1
1.1 INTEGRATED COMPREHENSIVE MONITORING PROGRAM AND STRATEGIC PLANNING
PROCESS ..................................................................................................................... 2
1.2 REPORT OBJECTIVES .................................................................................................... 4
2. Marine Species Monitoring in the Pacific ........................................................................ 6
2.1 2018 MONITORING GOALS AND IMPLEMENTATION ........................................................... 6
2.1.1 Timeline of Monitoring Efforts ..............................................................................25
2.2 RESULTS .....................................................................................................................45
2.2.1 Conceptual Framework Category 1. Occurrence .................................................45
2.2.1.1 MONITORING QUESTION: What species of marine mammals occur in the nearshore (within small-boat survey range) and offshore areas of the MITT study area? ....................... 46
2.2.1.2 MONITORING QUESTION: What is the habitat use of cetaceans in the nearshore and offshore areas of the MITT study area? [PROJECT M1] ........................................................ 47
2.2.1.3 MONITORING QUESTION: What is the seasonal occurrence and movements of baleen whales in the nearshore and offshore areas of the MITT study area? [PROJECT M1] ........................................................................................................................ 51
2.2.1.4 MONITORING QUESTION: What is the abundance and population structure of marine mammals in the MITT study area? [PROJECTS M1, M4] ....................................................... 52
2.2.1.6 MONITORING QUESTION: Are there locations of greater cetacean and/or sea turtle concentration in the MITT study area? [PROJECT M2] .......................................................... 56
2.2.1.7 MONITORING QUESTION: What is the occurrence of ESA-listed corals around FDM? [Project M3] ............................................................................................................................. 58
2.2.1.8 MONITORING QUESTION: What are the spatial-movement and habitat-use patterns (e.g., island-associated or open-ocean, restricted ranges vs. large ranges) of species that are exposed to MFAS, and how do these patterns influence exposure and potential responses? [PROJECT H4] ...................................................................................... 60
2.2.1.9 MONITORING QUESTION: What are the occurrence, movement patterns, and residency patterns of multiple humpback whale Distinct Population Segments within Navy Pacific Ocean at-sea ranges (SOCAL, HRC, NWTT, GOA)? [PROJECTS H6, S7, N1, G2] .................................................................................................................................... 68
2.2.1.10 MONITORING QUESTION: What is the seasonal occurrence and abundance/density of beaked whales and ESA-listed baleen whales within the Navy's Southern California Range Complex? [Projects S1 and S3] ................................................................................... 73
2.2.1.11 MONITORING QUESTION: What are the baseline population demographics, vital rates, and movement patterns for designated key species in the Southern California range complex? [PROJECT S2] .............................................................................................. 77
2.2.1.12 MONITORING QUESTION: What are the movement patterns, occurrence, and residence times of blue and fin whales within Navy training and testing areas along the U.S. West Coast as compared to other areas visited by tagged whales outside of Navy training and testing areas? [PROJECT S4/N4] ....................................................................... 81
DoN | 2018 All-Range Pacific Annual Monitoring Report TABLE OF CONTENTS
1 April 2019 | ii
2.2.1.13 MONITORING QUESTION: What are the residency time/occupancy patterns of blue whales within NMFS-designated Biologically Important Areas (BIAs) for this species along the U.S. West Coast? [PROJECT S4/N3] ..................................................................... 85
2.2.1.14 MONITORING QUESTION: Are there bathymetric, annual oceanographic conditions (e.g., sea surface temperature, frontal zones, etc.), and/or climatic and ocean variations (e.g., global warming, North Pacific Gyre Oscillation [NPGO], Pacific Decadal Oscillation [PDO], El Niño/La Niña events, etc.) that can help explain blue and fin whale affinity for any identified areas of high residency along the U.S. West Coast? [PROJECT S4/N4] ................................................................................................................... 90
2.2.1.15 MONITORING QUESTION: What is the ambient and anthropogenic soundscape in SOCAL? [PROJECT S5] ......................................................................................................... 95
2.2.1.16 MONITORING QUESTION: What is the at-sea distribution of Guadalupe fur seals as they travel through the offshore waters of the Southern California Range Complex and Northwest Training and Testing area? [PROJECTS S6 and N4] ............................................ 95
2.2.1.17 MONITORING QUESTION: What is the occurrence, spatial and temporal distribution of salmonids in proximity to NWTT? [PROJECT N2] .............................................................. 98
2.2.1.18 MONITORING QUESTION: What are the seasonal and annual occurrence patterns of Southern Resident killer whales relative to offshore Navy training ranges? [PROJECT N5] ........................................................................................................................................... 98
2.2.1.19 MONITORING QUESTION: What is the occurrence of marine mammals and anthropogenic noise in the Gulf of Alaska? [PROJECT G1] ................................................... 99
2.2.2 Conceptual Framework Category 2. Exposure .....................................................99
2.2.2.1 MONITORING QUESTION: What is the exposure of cetaceans and sea turtles to explosives and/or sonar in the MITT study area? [PROJECT M1] ........................................ 101
2.2.2.2 MONITORING QUESTION: What is the exposure of sea turtles to explosives and/or sonar in the MITT study area? [PROJECT M2] ..................................................................... 101
2.2.2.3 MONITORING QUESTION: What in-water impacts to corals from ordnance are observable at FDM? [PROJECT M3] .................................................................................... 103
2.2.2.4 MONITORING QUESTION: What is the occurrence and estimated received levels of MFAS on 'blackfish', humpback, minke, sperm and Blainville's beaked whales within the PMRF instrumented range? [PROJECT H1] ................................................................... 103
2.2.2.5 MONITORING QUESTION: What is the effectiveness of Navy lookouts on Navy surface ships and what species are sighted during sonar training events? [PROJECT H3] ......................................................................................................................................... 106
2.2.2.6 MONITORING QUESTION: What are the occurrence of and estimated received levels of MFAS on ‘blackfish’ and rough-toothed dolphins within the PMRF instrumented range? [PROJECT H5] .......................................................................................................... 108
2.2.3 Conceptual Framework Category 3. Response .................................................. 111
2.2.3.1 MONITORING QUESTION: What, if any, are the short-term behavioral responses of ‘blackfish’ and humpback, minke, sperm, and Blainville’s beaked whales when exposed to MFAS/explosions at different levels/conditions at PMRF? [PROJECT H1] ........ 111
2.2.4 Conceptual Framework Category 4. Consequences .......................................... 112
2.2.4.1 MONITORING QUESTIONS: What are the long-term trends in occurrence of marine mammals (e.g., minke, humpback, fin, Bryde’s, Blainville’s) on the PMRF range? [PROJECT H2]; and, Does exposure to sonar or explosives impact the long-term fitness and survival of individuals or the population, species, or stock (with initial focus on Cuvier’s beaked whales)? [PROJECT S2] ....................................................................... 112
3. Adaptive Management and Yearly Monitoring Goals .................................................. 115
4. Literature Cited .............................................................................................................. 122
DoN | 2018 All-Range Pacific Annual Monitoring Report TABLE OF CONTENTS
1 April 2019 | iii
List of Technical Reports Supporting This Annual Report
ODONTOCETE STUDIES ON THE PACIFIC MISSILE RANGE FACILITY IN AUGUST 2017:
SATELLITE-TAGGING, PHOTO-IDENTIFICATION, AND PASSIVE ACOUSTIC
MONITORING FINAL REPORT [BAIRD ET AL. 2018A]
ODONTOCETE STUDIES ON THE PACIFIC MISSILE RANGE FACILITY IN AUGUST 2018:
SATELLITE-TAGGING, PHOTO-IDENTIFICATION, AND PASSIVE ACOUSTIC
MONITORING. FINAL REPORT [BAIRD ET AL. 2018B]
CHARACTERIZING THE DISTRIBUTION OF ESA LISTED SALMONIDS IN THE
NORTHWEST TRAINING AND TESTING AREA WITH ACOUSTIC AND POP-UP
SATELLITE TAGS [HUFF AND SMITH 2019]
PRELIMINARY PROGRESS REPORT ON SOUTHERN CALIFORNIA BEAKED WHALE
OCCURRENCE FROM TOWED ARRAY SURVEYS [FRASIER ET AL. 2019]
FIVE YEARS OF WHALE PRESENCE IN THE SOCAL RANGE COMPLEX 2013-2017
[BAUMANN-PICKERING ET AL. 2018B]
FARALLON DE MEDINILLA 2017 SPECIES LEVEL CORAL REEF SURVEY REPORT
[CARILLI ET AL. 2018B]
MARINE MAMMAL MONITORING ON NAVY RANGES (M3R) ON THE SOUTHERN
CALIFORNIA ANTI-SUBMARINE WARFARE RANGE (SOAR) AND THE PACIFIC
MISSILE RANGE FACILITY (PMRF) 2018 [DIMARZIO ET AL. 2019]
CETACEAN MONITORING IN THE MARIANA ISLANDS RANGE COMPLEX, AUGUST-
SEPTEMBER 2018 [HILL ET AL. 2019]
PACIFIC ISLANDS FISHERIES SCIENCE CENTER MARIANA ARCHIPELAGO CETACEAN
SURVEYS: A REVIEW OF AVAILABLE DATA AND ANALYSES THROUGH MARCH
2018 [HILL ET AL. 2018C]
SSC PACIFIC FY18 ANNUAL REPORT ON PMRF MARINE MAMMAL MONITORING [C.R.
MARTIN ET AL. 2019]
CRUISE REPORT, MARINE SPECIES MONITORING & LOOKOUT EFFECTIVENESS STUDY
SUBMARINE COMMANDERS COURSE, FEBRUARY 2018 HAWAII RANGE
COMPLEX [OLIVEIRA ET AL. 2019]
SEA TURTLE TAGGING IN THE MARIANA ISLANDS TRAINING AND TESTING (MITT)
STUDY AREA [S.L. MARTIN ET AL. 2019]
HUMPBACK WHALE TAGGING IN SUPPORT OF MARINE MAMMAL MONITORING
ACROSS MULTIPLE NAVY TRAINING AREAS IN THE PACIFIC OCEAN: FINAL
REPORT FOR THE HAWAIIAN BREEDING AREA IN SPRING 2018, INCLUDING
HISTORICAL DATA FROM PREVIOUS TAGGING EFFORTS [MATE ET AL. 2018A]
BALEEN WHALE TAGGING IN SUPPORT OF MARINE MAMMAL MONITORING ACROSS
MULTIPLE NAVY TRAINING AREAS COVERING THE YEARS 2104, 2015, 2016, AND
2017 [MATE ET AL. 2018B]

DoN | 2018 All-Range Pacific Annual Monitoring Report TABLE OF CONTENTS
1 April 2019 | iv
HUMPBACK WHALE TAGGING IN SUPPORT OF MARINE MAMMAL MONITORING
ACROSS MULTIPLE NAVY TRAINING AREAS IN THE PACIFIC OCEAN: FINAL
REPORT FOR FEEDING AREAS OFF THE US WEST COAST IN SUMMER-FALL
2017, INCLUDING HISTORICAL DATA FROM PREVIOUS TAGGING EFFORTS
[MATE ET AL. 2018C]
HUMPBACK WHALE TAGGING IN SUPPORT OF MARINE MAMMAL MONITORING
ACROSS MULTIPLE NAVY TRAINING AREAS IN THE PACIFIC OCEAN:
PRELIMINARY SUMMARY OF FIELD TAGGING EFFORT IN HAWAII IN MARCH 2018
[MATE ET AL. 2018D]
HUMPBACK WHALE TAGGING IN SUPPORT OF MARINE MAMMAL MONITORING
ACROSS MULTIPLE NAVY TRAINING AREAS IN THE PACIFIC OCEAN:
PRELIMINARY SUMMARY OF FIELD TAGGING EFFORTS OFF THE PACIFIC
NORTHWEST IN SUMMER 2018 [MATE ET AL. 2019]
PASSIVE ACOUSTIC MONITORING FOR MARINE MAMMALS IN THE SOCAL RANGE
COMPLEX MARCH 2017–JULY 2018 [RICE ET AL. 2019]
SUMMARY OF FIVE YEARS OF AMBIENT AND ANTHROPOGENIC SOUND IN THE SOCAL
RANGE COMPLEX 2012 – 2017 [WIGGINS ET AL. 2018]
DISTRIBUTION AND DEMOGRAPHICS OF CUVIER’S BEAKED WHALES AND FIN WHALES
IN THE SOUTHERN CALIFORNIA BIGHT [SCHORR ET AL. 2018B]
GUADALUPE FUR SEAL POPULATION CENSUS AND TAGGING IN SUPPORT OF MARINE
MAMMAL MONITORING ACROSS MULTIPLE NAVY TRAINING AREAS IN THE
PACIFIC OCEAN [NORRIS 2019]
ASSESSING EXPOSURE AND RESPONSE OF ODONTOCETES EXPOSED TO MID-
FREQUENCY ACTIVE SONAR: SUBMARINE COMMAND COURSES AT THE
PACIFIC MISSILE RANGE FACILITY FROM 2016 THROUGH 2018. INTERIM
PROGRESS REPORT [BAIRD ET AL. 2019]
GEOGRAPHIC DIFFERENCES IN BLAINVILLE’S BEAKED WHALE (MESOPLODON
DENSIROSTRIS) ECHOLOCATION CLICKS [BAUMANN-PICKERING ET AL. 2018D]
EMMONS, C.K., M.B. HANSON, AND M.O. LAMMERS. 2019. MONITORING THE
OCCURRENCE OF SOUTHERN RESIDENT KILLER WHALES, OTHER MARINE
MAMMALS, AND ANTHROPOGENIC SOUND IN THE PACIFIC NORTHWEST.
[EMMONS ET AL. 2019]

DoN | 2018 All-Range Pacific Annual Monitoring Report TABLE OF CONTENTS
1 April 2019 | v
Figures
Figure 1. 2018 Monitoring goals in all Pacific range complexes. Primary research-and-development and demonstration-validation (DEMVAL) investments for tools and techniques supported by ONR Marine Mammal and Biology and Living Marine Resource programs. ........................................................................................................ 8
Figure 2. Numbers of monitoring questions and goals in all Pacific range complexes that address the four progressive Conceptual Framework Categories for monitoring knowledge outlined by the Scientific Advisory Group. .................................................... 10
Figure 3. Timeline of 2018 projects in the Mariana Islands Training and Testing Study Area. ............................................................................................................................. 26
Figure 4. Timeline of 2018 projects in the Hawaii Range Complex. ....................................... 29
Figure 5. Timeline of 2018 projects in the Southern California Range Complex. ................... 33
Figure 6. High-frequency Acoustic Recording Package locations in the Southern California Range Complex [Projects S1 and S6] ............................................................ 35
Figure 7. Timeline of 2018 projects in the Northwest Training and Testing Study Area. ........ 39
Figure 8. Timeline of 2018 Gulf of Alaska Temporary Maritime Activities Area monitoring projects. ......................................................................................................................... 42
Figure 9. High-frequency Acoustic Recording Package locations in the Gulf of Alaska Temporary Maritime Activities Area. [Project G1] .......................................................... 44
Figure 10. Cetacean species discovery curve (cumulative number (No.) species encountered over cumulative distance surveyed (km)) for Pacific Islands Fisheries Science Center’s Cetacean Research Program small-boat surveys off the 3-Islands area, Rota, and Guam (2010–February 2018). .................................................. 47
Figure 11. Tracks and cetacean encounter locations during the Pacific Islands Fisheries Science Center’s Cetacean Research Program small-boat surveys of the southernmost Mariana Archipelago (2010–2018). ......................................................... 51
Figure 12. The cumulative number of individual non-calf humpback whales sighted in each year (2007, 2015–2018) versus the cumulative number of distinctive individuals. .................................................................................................................... 53
Figure 13. Marine turtle surveys and satellite tag deployment locations in the Mariana Islands Training and Testing (MITT) Study Area. ........................................................... 55
Figure 14. Migration of hawksbill turtles from Tinian to Guam and Pohnpei. (A) A 61.7 cm hawksbill turtle (Argos ID: 85493) was tagged 20 August 2013 at Fleming Point, Tinian. (B) A 72.3 cm hawksbill turtle (Argos ID: 138963) was tagged 21 July 2014 at Fleming Point, Tinian. ................................................................................................ 57
Figure 15. Examples of ESA-listed corals observed. ............................................................... 59
Figure 16. Landscape image of H5W showing extensive coral bleaching. ............................... 59
Figure 17. Search effort (red lines) and odontocete sightings (white squares) during 15 days of effort in August 2018. ........................................................................................ 61
Figure 18. Filtered Argos locations from a satellite-tagged rough-toothed dolphin over a five-day period, 9–14 August 2018. The PMRF boundary is outlined in red. .................. 63
Figure 19. Movements of a satellite-tagged melon-headed whale over a 9.4-day period from 7 to 17 August 2018. ............................................................................................. 65
Figure 20. Filtered Argos locations (yellow squares) and Fastloc-GPS locations (white circles) from a satellite tagged short-finned pilot whale (GmTag214) for the period where both location types were received, over a nine-day period from 19-27 August 2018. ................................................................................................................. 67
DoN | 2018 All-Range Pacific Annual Monitoring Report TABLE OF CONTENTS
1 April 2019 | vi
Figure 21. Satellite-monitored tracks for humpback whales tagged off Maui, Hawaii, in March 2018 (17 DM tags, 5 DUR+ tags). The black polygons delineate the Exclusive Economic Zone (EEZ) for US waters From: Mate et al. 2018a [Project H6] 69
Figure 22. Satellite-monitored tracks in Area W188B for humpback whales tagged off Maui, Hawaii, in March 2018 (left panel), and off Maui and Kauai from 1995 to 2015 (right panel). ......................................................................................................... 70
Figure 23. Satellite-monitored tracks for humpback whales tagged by OSU off California in 2004–2005 and 2017, Oregon in 2016 and 2017, and Southeast Alaska in 2014–2015. ................................................................................................................... 72
Figure 24. In this example from CalCOFI 2009 data, the unsupervised learning algorithm has reviewed detections in a five-minute time window and automatically identified three distinct, recurrent signal types based on spectral features without prior knowledge of the expected categories. .......................................................................... 75
Figure 25. Categories of marine mammal and anthropogenic signals detected in the CalCOFI towed array dataset from 2008 to 2014. .......................................................... 76
Figure 26. Cuvier's beaked whale and fin whale sightings from surveys conducted in 2018. The black polygon west of San Clemente Island is the SOAR range boundary. ...................................................................................................................... 78
Figure 27. Filtered tracklines of a satellite-tagged Baird's beaked whale during the 2018 monitoring effort. ........................................................................................................... 79
Figure 28. Filtered tracklines of a satellite-tagged Risso’s dolphin during the 2018 monitoring effort. From: Schorr et al. 2018b [Project S2] ............................................... 80
Figure 29. Satellite-monitored tracks for blue whales tagged off southern and central California during July and/or August, 2014 to 2017, with different tagging years being shown in different colors. ..................................................................................... 82
Figure 30. Satellite-monitored tracks for fin whales tagged off southern and central California during July and/or August, 2014 to 2017. ....................................................... 84
Figure 31. Satellite-monitored tracks of blue whales in the Santa Barbara Channel and San Miguel BIA (partially located in the PT MUGU range), by tagging year (2014–2017). ............................................................................................................................ 86
Figure 32. Satellite-monitored tracks of blue whales in the San Diego BIA (located in the SOCAL range), by tagging year (2014–2017). No blue whales tagged in 2016 were tracked in the San Diego BIA. ........................................................................................ 87
Figure 33. Satellite-monitored tracks of blue whales in the Santa Monica Bay to Long Beach BIA (partially located in the SOCAL range), by tagging year (2014–2017). ......... 88
Figure 34. Satellite-monitored tracks of blue whales in the Point Conception/Arguello BIA (partially located in the PT MUGU range), by tagging year (2014–2017). ...................... 89
Figure 35. Accepted SSSM locations for blue whales colored by behavioral mode for each year in the study. .................................................................................................. 91
Figure 36. Time series of monthly values of the Oceanic Niño Index (ONI; top panel), the Pacific Decadal Oscillation (PDO; middle panel), and the North Pacific Gyre Oscillation (NPGO; bottom panel) for the period January 2013–December 2017. ......... 93
Figure 37. Filtered Argos tracks for Guadalupe fur seals: (a) 15 adult females, (b) 10 juvenile females, and (c) 10 juvenile males. .................................................................. 97
Figure 38. Salmon weights, lengths, and depths of capture from a pilot study conducted during summer of 2018 that demonstrated the feasibility of capturing and tagging salmon at sea using available small platforms. .............................................................. 98

DoN | 2018 All-Range Pacific Annual Monitoring Report TABLE OF CONTENTS
1 April 2019 | vii
Figure 39. U.S. Navy underwater explosive operation sites off Guam. .................................. 102
Figure 40. Minke whale tracks within the study area, before, during, and after the portion of the February 2018 SCC that utilized hull-mounted MFAS. ....................................... 104
Figure 41. Timeline overview (in 5-minute bins) of ship-whale geometries and cumulative received levels for minke whale track 2 during the February 2018 SCC. ..................... 105
Figure 42. Sighting and Resighting Locations During the February 2018 SCC. ..................... 107
Figure 43. Locations of short-finned pilot whale GmTag214 before (white), during (red), and after (yellow) MFAS use, during August 2018. ...................................................... 109
Figure 44. Locations of rough-toothed dolphin SbTag017 before (white), during (red), and after (yellow) MFAS exposure associated with the February 2016 SCC. ..................... 110
Figure 45. Mean monthly abundance of Blainville’s beaked whales at PMRF, based on passive acoustic monitoring data collected from 2015 through 2018. .......................... 112
Figure 46. Corrected mean monthly abundance of Cuvier’s beaked whales at SOAR, based on passive acoustic monitoring data collected from August 2010 through July 2018. Upper and lower confidence intervals are also shown, calculated from the monthly CVs. ......................................................................................................... 113
Tables
Table 1. Monitoring goals and accomplishments for training ranges in second cycle of 5-year authorizations (MITT, HSTT [HRC and SOCAL], NWTT, and GOA TMAA). ....... 12
Table 2. Summary of cetacean encounters during 2010–2018 small-boat surveys conducted by the Pacific Islands Fisheries Science Center’s Cetacean Research Program off the Islands area, Rota, and Guam including the number (No.) of encounters, the encounter rate (number of encounters/100 km of on-effort trackline), the median and range of the best group size estimates from the field, the numbers of photos and biopsy samples collected, the number of satellite tags deployed, the number of acoustic recordings made, the median and range of encounter location depth (m), and the median and range of distance from shore (km). .............................................................................................................................. 49
Table 3. Summary of cetacean encounters during the 2015 Mariana Archipelago Cetacean Survey conducted by the Pacific Islands Fisheries Science Center’s Cetacean Research Program including the number (No.) of encounters, the median and range of the best group size estimates from the field, the numbers of photos and biopsy samples collected, the number of satellite tags deployed, the number of acoustic recordings made, the number of single-species acoustic recordings, the median and range of encounter location depth (m), and the median and range of distance from shore distance (km). ........................................................... 50
Table 4. The total number of distinct individuals for each species encountered during PIFSC CRP 2010 – 2018 small-boat surveys (Hill et al. 2018) and reported large-scale ship-based line-transect survey abundance estimates (CV = coefficient of variation) (Fulling et al. 2011). ....................................................................................... 53
Table 5. 2019 Monitoring projects for Pacific Navy Ranges: HSTT (HRC and SOCAL), MITT, NWTT, GOA TMAA. .......................................................................................... 116
Appendix
Appendix A. Animal Tracking Tag Types
DoN | 2018 All-Range Pacific Annual Monitoring Report
ERROR! NO TEXT OF SPECIFIED STYLE IN DOCUMENT.
1 April 2019 | viii
Acronyms and Abbreviations
ADB advanced dive behavior
ALSK Alaska Downwelling Coastal Province
AMR Adaptive Management Review
ARS Area Restricted Searching
ASW anti-submarine warfare
BIA Biologically Important Area
BO Biological Opinion
BRS behavioral response study
BW beaked whale
CA core area(s)
CCAL California Current Province
CalCOFI California Cooperative Oceanic Fisheries Investigations
CFC Conceptual Framework Category
CFR Code of Federal Regulations
CHL chlorophyll-a concentration
cm centimeter(s)
CNMI Commonwealth of the Northern Mariana Islands
CRC Cascadia Research Collective
CRP Cetacean Research Program
cSEL cumulative sound exposure level
CY calendar year
d day(s)
dB re 1µPa decibel(s) referenced to 1 microPascal
dB re 1µPa2s decibel(s) re 1 microPascal-squared-second
DCLTDE Detection, Classification, Localization, Tracking, and Density Estimate
DDG guided missile destroyer
°C degrees Celsius
DEMVAL Demonstration-Validation
DM dive monitoring
DNA deoxyribonucleic acid
DoN Department of Navy
DPS Distinct Population Segment
DUR dive duration monitoring
DUR+ dive duration monitoring plus
EIS Environmental Impact Statement
ESA Endangered Species Act
FDM Farallon de Medinilla
FM frequency-modulated
FY fiscal year
GFS Guadalupe fur seals
GI Guadalupe Island
GOA Gulf of Alaska
GPS Global Positioning System
GUCA Gulf of California Province
HARP High-frequency Acoustic Recording Package
hr hour(s)
HR home range(s)
HRC Hawaii Range Complex
hSSSM hierarchical switching state-space models
HSTT Hawaii-Southern California Training and Testing
Hz Hertz
ICI inter-click interval
ICMP Integrated Comprehensive Monitoring Program
IPI interpulse intervals
ISO Intermediate Scientific Objective
kHz kilohertz
KIWB kernel interpolation with barriers
km kilometer(s)
km2 square kilometer(s)
LFAS low-frequency active sonar
LIMPET Low Impact Minimally Percutaneous Electronic Transmitter
LO location-only
LOA Letters of Authorization
LTSA Long-Term Spectral Average(s)
m meter(s)

DoN | 2018 All-Range Pacific Annual Monitoring Report
ERROR! NO TEXT OF SPECIFIED STYLE IN DOCUMENT.
1 April 2019 | ix
MACS Mariana Archipelago Cetacean Survey
M3R Marine Mammal Monitoring on U.S. Navy Ranges
MarEcoTel Marine Ecology and Telemetry Research
MFAS mid-frequency active sonar
mg m-3 milligrams per cubic meter
MIRC Mariana Islands Range Complex
MISTCS Mariana Islands Sea Turtle and Cetacean Survey
MITT Mariana Islands Training and Testing
MMO marine mammal observer
MMPA Marine Mammal Protection Act
mtDNA mitochondrial DNA
NISE Naval Innovative Science and Engineering
NMFS National Marine Fisheries Service
NPGO North Pacific Gyre Oscillation
NUWC Naval Undersea Warfare Center
NWFSC Northwest Fisheries Science Center
NWTRC Northwest Training Range Complex
NWTT Northwest Training and Testing
NOAA National Oceanic and Atmospheric Administration
OBRS opportunistic behavioral response study
OEIS Overseas Environmental Impact Statement
ONI Oceanic Niño Index
ONR Office of Naval Research
OSU Oregon State University
PAM passive acoustic monitoring
PCoD Population Consequences of Disturbance
PDO Pacific Decadal Oscillation
Photo-ID photo-identification
PIFSC Pacific Islands Fisheries Science Center
PIPAN Pacific Islands Passive Acoustic Network
PIT Passive Integrated Transponder
PMRF Pacific Missile Range Facility
PNEC North Pacific Equatorial Countercurrent Province
PQED Pacific Equatorial Divergence Province
PT MUGU Point Mugu Sea Range
PWDIST pairwise distance between SSSM locations (data variable)
RHIB rigid-hulled inflatable boat
RL received level(s)
SCB Southern California Bight
SCC Submarine Command Course
SCL straight-carapace-length
SCORE Southern California Offshore Range
SD standard deviation
SIO Scripps Institution of Oceanography
SOAR Southern California Offshore Antisubmarine Warfare Range
SOCAL Southern California Range Complex
SPL sound pressure level
SPOT smart position and temperature
SRKW Southern Resident killer whale
SSC Pacific Space and Naval Warfare Systems Center Pacific
SSSM switching state-space model
SST sea surface temperature
TMAA Temporary Maritime Activities Area
UNDET underwater detonation/demolition
U.S. United States
WC Wildlife Computers
W237 Warning Area 237

DoN | 2018 All-Range Pacific Annual Monitoring Report
ERROR! NO TEXT OF SPECIFIED STYLE IN DOCUMENT.
1 April 2019 | x
This page intentionally left blank.

DoN | 2018 All-Range Pacific Annual Monitoring Report INTRODUCTION
1 April 2019 | 1
1. Introduction
The United States (U.S.) Navy conducts training and testing activities in the Pacific study areas
described in the following Environmental Impact Statement/Overseas Environmental Impact
Statement (EIS/OEIS) documents: Hawaii-Southern California Training and Testing (HSTT)
(Department of Navy [DoN] 2013a, 2018a, Mariana Islands Training and Testing (MITT) (DoN
2015a), Northwest Training and Testing (NWTT) (DoN 2015b), and the Gulf of Alaska Navy
Training Activities (DoN 2011a, 2016a). The ranges covered by these documents include the
Hawaii Range Complex (HRC), Southern California Range Complex (SOCAL), Mariana Islands
Range Complex (MIRC), Northwest Training Range Complex (NWTRC) including the Naval Sea
Systems Command’s Naval Undersea Warfare Center Keyport Range Complex (Keyport Range
Complex), and the Gulf of Alaska Temporary Maritime Activities Area (GOA TMAA).
To authorize these actions, the National Marine Fisheries Service (NMFS) under the Marine
Mammal Protection Act (MMPA) issued 5-year Final Rules for HSTT (NMFS 2013a, 2014b,
2018a), MITT (NMFS 2015a), NWTT (NMFS 2015e), and GOA TMAA (NMFS 2017b); Letters of
Authorization (LOA) under the MMPA to Commander, U.S. Pacific Fleet and Commander, Naval
Sea Systems Command for HSTT (NMFS 2013b, 2013c, 2014c, 2014d, 2018c, 2018d), MITT
(NMFS 2015b, 2016), NWTT (NMFS 2015f, 2015g), and GOA TMAA (NMFS 2017a); and
Biological Opinions (BOs) under the Endangered Species Act for HSTT (NMFS 2013f, 2014a,
2015d, 2018b), MITT (NMFS 2015c, 2017d), NWTT (NMFS 2015h), and the GOA TMAA
(NMFS 2017c).
The U.S. Navy is required by the Final Rules, LOAs, and BOs above to implement marine
species monitoring. The regulations issued with the Final Rules for HSTT, MITT, NWTT, and
GOA TMAA require the U.S. Navy to submit an annual monitoring report, as specified at 50
Code of Federal Regulations § 218.75(d) (HSTT), § 218.95(e) (MITT), § 218.145(f) (NWTT),
and § 218.155(f) (GOA TMAA).
This monitoring report was prepared in accordance with the annual monitoring reporting
requirements for 2018, as described in these regulations. It presents NMFS and the public with
results and progress made during the period of 1 January 2018 to 31 December 2018. The
marine species monitoring described herein was conducted in accordance with project
objectives listed on the U.S. Navy’s Marine Species Monitoring website:
http://www.navymarinespeciesmonitoring.us/regions/pacific/current-projects/.
These MMPA authorizations were issued for a period of 5 years. The MITT, NWTT, and GOA
TMAA monitoring programs are currently within the second set of 5-year authorizations and
environmental planning documentation for the U.S. Navy, and that of HSTT transitioned in
December 2018 to the third set of authorizations (NMFS 2018a, 2018b, 2018c, 2018d).
Monitoring goals for these study areas are framed in terms of progress made on question-based
scientific objectives and programmatic Intermediate Scientific Objectives (ISOs).
The regulations cited above associated with the authorizations for HSTT, MITT, NWTT, and
GOA TMAA (i.e., 50 CFR § 218.75(d), § 218.95(e), § 218.145(f), and § 218.155(f), respectively)

DoN | 2018 All-Range Pacific Annual Monitoring Report INTRODUCTION
1 April 2019 | 2
have in common an option for satisfying the monitoring report requirement with a multi-range-
complex report. Therefore, monitoring results from all Pacific U.S. Navy ranges, (i.e., HSTT,
MITT, NWTT, and GOA TMAA), are treated in this report in an integrated fashion in order to
allow comparison across ranges and a cumulative view of progress made on monitoring goals
across ranges. This report is the fourth such “multi-range”-complex annual monitoring report
(see DoN 2016a, 2017, 2018b).
1.1 Integrated Comprehensive Monitoring Program and
Strategic Planning Process
Integrated Comprehensive Monitoring Program
The U.S. Navy’s Integrated Comprehensive Monitoring Program (ICMP) (DoN 2010b) provides
the overarching framework for coordination of the U.S. Navy’s marine species monitoring efforts
and serves as a planning tool to focus U.S. Navy monitoring priorities pursuant to ESA and
MMPA requirements. The purpose of the ICMP is to coordinate monitoring efforts across all
regions and to allocate the most appropriate level and type of monitoring effort for each range
complex based on a set of standardized objectives, regional expertise, and resource availability.
Although the ICMP does not identify specific fieldwork or individual projects, it is designed to
provide a flexible, scalable, and adaptable framework using adaptive management and strategic
planning processes that periodically assess progress and reevaluate objectives.
Monitoring addresses the ICMP top-level goals through a collection of specific regional and
ocean basin studies based on scientific objectives, rather than objectives defined as a given
quantity of monitoring effort. The reporting requirements and the adaptive management process
serve as the basis for evaluating performance and compliance, primarily considering the quality
of the work and results produced, as well as peer review and publications, and public
dissemination of information, reports, and data. Details of the current ICMP are available online
at http://www.navymarinespeciesmonitoring.us/.
Adaptive Management Review
The ICMP is evaluated through the Adaptive Management Review (AMR) process to (1) assess
progress, (2) provide a matrix of goals and objectives, and (3) make recommendations for
refinement and analysis of monitoring and mitigation techniques. This process includes
conducting an annual AMR meeting at which the U.S. Navy and NMFS jointly consider the prior-
year goals, monitoring results, and related scientific advances to determine if monitoring plan
modifications are warranted to more effectively address program goals. Modifications to the
ICMP that result from annual AMR discussions are incorporated by an addendum or revision to
the ICMP as needed.
Strategic Planning Process, Scientific Advisory Group, and the Conceptual Framework Categories
The Strategic Planning Process for Marine Species Monitoring (Chief of Naval Operations 2013)
serves to guide the investment of resources to most efficiently address ICMP objectives and
Intermediate Scientific Objectives (ISOs) developed through this process. The monitoring

DoN | 2018 All-Range Pacific Annual Monitoring Report INTRODUCTION
1 April 2019 | 3
program has evolved and improved as a result of the AMR process through incorporation of the
following changes:
Developed a Conceptual Framework based on recommendations from the Scientific
Advisory Group (DoN 2011b). The Conceptual Framework Categories (CFC) are
centered on gathering information within the categories of “occurrence, exposure,
response, and consequences” as a progression of knowledge about marine species and
their interaction with U.S. Navy training and testing activities.
Shifted focus to projects based on scientific objectives that facilitate generation of
statistically meaningful results upon which natural resources management decisions
may be based (rather than objectives defined by level of effort)
Focused on priority species or areas of interest as well as best opportunities to address
specific monitoring objectives in order to maximize return on investment.
Increased transparency of the program and management standards, improving
collaboration among participating researchers, and improving accessibility to data and
information resulting from monitoring activities.
Under the Strategic Planning Process, ISOs serve as the basis for developing and executing
new monitoring projects across U.S. Navy training and testing areas in the Atlantic and Pacific
Oceans. Implementation of the Strategic Planning Process involves coordination among fleets,
system commands, Chief of Naval Operations Energy and Environmental Readiness Division,
NMFS, and the Marine Mammal Commission with five primary steps:
Identify overarching ISOs. Through the adaptive management process, the U.S. Navy
coordinates with NMFS as well as the Marine Mammal Commission to review and revise
the list of ISOs that are used to guide development of individual monitoring projects.
(The current list of thirteen ISOs applied for this monitoring report is included in Figure
1, located in Section 2.1).
Develop individual monitoring project concepts. Solicit input from the scientific
community in terms of potential monitoring projects that address one or more of the
ISOs. This can be accomplished through a variety of forums, including professional
societies, regional scientific advisory groups, and contractor support.
Evaluate, prioritize, and select monitoring projects. U.S. Navy technical experts and
program managers review and evaluate all monitoring project concepts and develop a
prioritized ranking. The goal is to establish a suite of monitoring projects that address a
cross-section of ISOs spread over a variety of range complexes.
Execute and manage selected monitoring projects. Individual projects are initiated
through appropriate funding mechanisms and include clearly defined objectives and
deliverables (e.g., data, reports, publications).
Report and evaluate progress and results. Progress on individual monitoring projects
is updated through the Navy Marine Species Monitoring Program website as well as
annual monitoring reports submitted to NMFS. Both internal review and discussions with
DoN | 2018 All-Range Pacific Annual Monitoring Report INTRODUCTION
1 April 2019 | 4
NMFS through the adaptive management process are used to evaluate progress toward
addressing the primary objectives of the ICMP and serve to periodically recalibrate the
focus of the monitoring program.
The collaborative framework of this process is designed to integrate various elements for
developing, evaluating, and selecting monitoring projects across all areas where the U.S. Navy
conducts training and testing activities. These elements include the following:
ICMP top-level goals
Scientific Advisory Group recommendations
Integration of regional scientific expert input
Ongoing AMR dialog between NMFS and the U.S. Navy
Lessons learned from past and future monitoring at U.S. Navy training and testing
ranges; and
Leveraging of research and lessons learned from other U.S. Navy-funded science
programs.
The Strategic Planning Process will continue to shape the future of the U.S. Navy Marine
Species Monitoring Program and serve as the primary decision-making tool for guiding
investments.
1.2 Report Objectives
This document has been prepared in accordance with the reporting requirements of 50 CFR
§ 218.75(d), § 218.95(e), § 218.145(f), and § 218.155(f) for presenting NMFS and the public
with results and progress made during the period of 1 January 2018 to 31 December 2018 in
marine species monitoring in HSTT, MITT, NWTT, and GOA TMAA. Reviewers may review
prior-year reports and associated publications that are available on the website at
http://www.navymarinespeciesmonitoring.us/.
This report implements the option in these regulations to prepare a multi-Range-Complex report
that describes progress of knowledge made with respect to monitoring plan study questions
across multiple training and testing ranges, with similar study questions treated together so that
progress on each topic may be summarized across multiple ranges (see DoN 2016b, 2017,
2018b). These results are intended to iteratively inform future cycles of the ICMP AMR and
Strategic Planning Processes and provide a comprehensive view of monitoring in the Pacific
Ocean. Detailed technical reports for the individual monitoring projects are provided as
supporting documents to this report (Baird et al. 2018a, 2018b, 2019; Baumann-Pickering et al.
2018b, 2018d; Carilli et al. 2018b; DiMarzio et al. 2019; Emmons et all 2019; Frasier et al. 2019;
Hill et al. 2018c, 2019; Huff and Smith 2019; C.R. Martin et al. 2019; S.L. Martin et al. 2019;
Mate et al. 2018a, 2018b, 2018c, 2018d, 2019; Norris 2019; Oliveira et al. 2019; Rice et al.
2019; Schorr et al. 2018b; Wiggins et al. 2018).
DoN | 2018 All-Range Pacific Annual Monitoring Report INTRODUCTION
1 April 2019 | 5
This page intentionally left blank.
DoN | 2018 All-Range Pacific Annual Monitoring Report MARINE SPECIES MONITORING IN THE PACIFIC
1 April 2019 | 6
2. Marine Species Monitoring in the Pacific
2.1 2018 Monitoring Goals and Implementation
The U.S. Navy training ranges in the Pacific are located in the HSTT Study Area, MITT Study
Area, NWTT Study Area, and GOA TMAA. The ranges vary in terms of monitoring goals
implemented for protected marine species including marine mammals and sea turtles, in
support of each study area’s MMPA and ESA requirements (NMFS 2013a, 2013b, 2013c,
2013f, 2014a, 2014b, 2014c, 2014d, 2015a, 2015b, 2015c, 2015d, 2015e, 2015f, 2015g, 2015h,
2016, 2017a, 2017b, 2017c, 2017d, 2018a, 2018b, 2018c, 2018d).
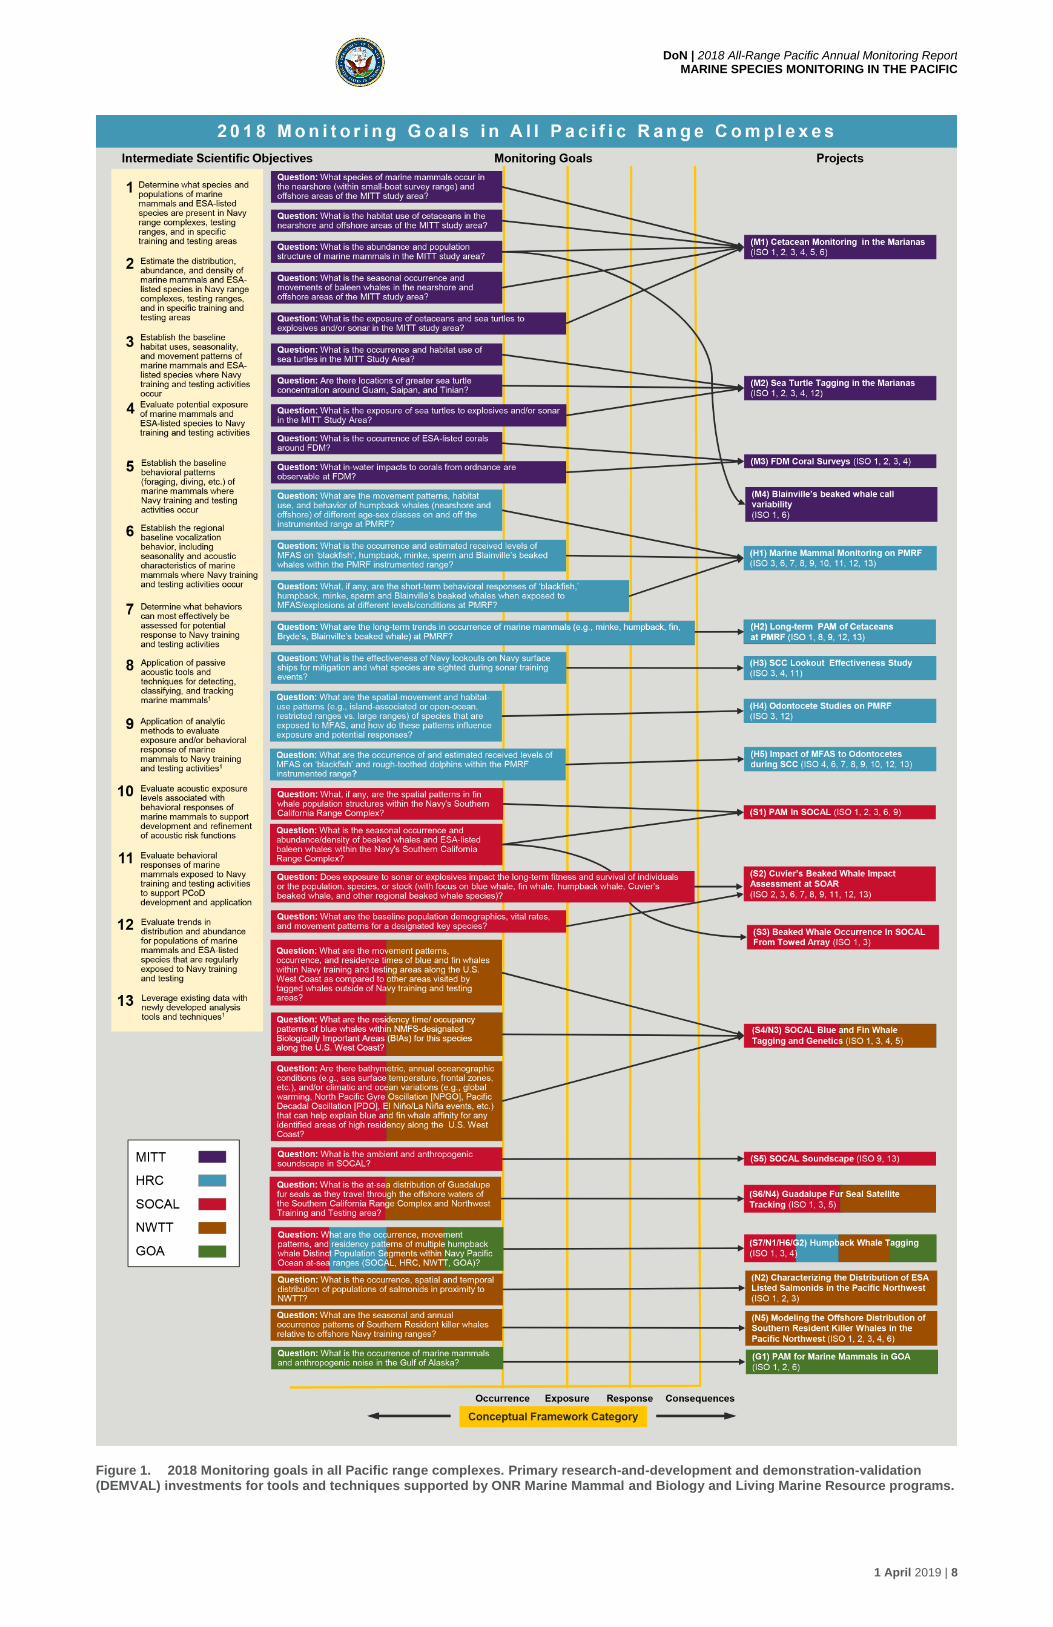
Figures 1 and 2 provide an overview of all monitoring projects and goals across all the Pacific
ranges. Figure 1 shows the distribution of monitoring questions and study objectives with
respect to monitoring projects and Conceptual Framework Categories (CFCs) (i.e., occurrence,
exposure, response, consequences), as well as to illustrate which ISOs are addressed by each
monitoring project. Figure 2 illustrates the relative number of monitoring questions associated
with each CFC, and how this varies by range. Although the CFC of consequences is considered
a complex field of new science best supported by research and development efforts through the
Office of Naval Research (ONR), rather than by MMPA compliance monitoring, one monitoring
question each for HRC and SOCAL projects was related to population trends of species at
range complexes. Because of their connection to population trends--although not comparable to
the fully realized modeling of population consequences--these were tabulated in Figure 2 under
consequences.
Current monitoring goals are framed in terms of progress made on scientific monitoring
questions and ISOs, and shown paired with cumulative accomplishments in Table 1.
DoN | 2018 All-Range Pacific Annual Monitoring Report MARINE SPECIES MONITORING IN THE PACIFIC
1 April 2019 | 7
This page intentionally left blank.
DoN | 2018 All-Range Pacific Annual Monitoring Report MARINE SPECIES MONITORING IN THE PACIFIC
1 April 2019 | 8
Figure 1. 2018 Monitoring goals in all Pacific range complexes. Primary research-and-development and demonstration-validation (DEMVAL) investments for tools and techniques supported by ONR Marine Mammal and Biology and Living Marine Resource programs.

DoN | 2018 All-Range Pacific Annual Monitoring Report MARINE SPECIES MONITORING IN THE PACIFIC
1 April 2019 | 9
This page intentionally left blank.

DoN | 2018 All-Range Pacific Annual Monitoring Report MARINE SPECIES MONITORING IN THE PACIFIC
1 April 2019 | 10
Figure 2. Numbers of monitoring questions and goals in all Pacific range complexes that address the four progressive Conceptual Framework Categories for monitoring knowledge outlined by the Scientific Advisory Group. Additional Navy-funded effort under Response (not represented here) has been conducted in SOCAL under the ONR Marine Mammal and Biology and Living Marine Resource programs.

DoN | 2018 All-Range Pacific Annual Monitoring Report MARINE SPECIES MONITORING IN THE PACIFIC
1 April 2019 | 11
This page intentionally left blank.

DoN | 2018 All-Range Pacific Annual Monitoring Report MARINE SPECIES MONITORING IN THE PACIFIC
1 April 2019 | 12
Table 1. Monitoring goals and accomplishments for training ranges in second cycle of 5-year authorizations (MITT, HSTT [HRC and SOCAL], NWTT, and GOA TMAA).
Project (Technical report for 2018)
Conceptual Framework
Category
Intermediate Scientific Objectives (Numbered as per Figure 1)
Monitoring Questions Accomplishments1
MITT
[M1] Cetacean Monitoring
(Hill et al. 2018c, 2019)
(This project includes “Small-Vessel Visual Surveys” and “Acoustic Analysis of High-frequency Acoustic Recording
Package Data”)
Occurrence, Exposure
#1: Determine what species and populations of marine mammals and ESA-listed species are present in Navy range complexes, testing ranges, and in specific training and testing
areas.
#2: Estimate the distribution, abundance, and density of marine mammals and sea turtles in Navy range complexes, testing ranges, and in specific training and testing areas.
#3: Establish the baseline habitat uses, seasonality, and movement patterns of marine mammals and ESA-listed species where Navy training and testing activities occur.
#4: Evaluate potential exposure of marine mammals and ESA-listed species to Navy training and testing activities.
#5: Establish the baseline behavioral patterns (foraging, diving, etc.) of marine mammals where Navy training and testing activities
occur.
#6: Establish the regional baseline vocalization behavior, including seasonality and acoustic characteristics) of marine mammals where Navy training and testing activities occur.
#8: Application of passive acoustic tools and techniques for detecting, classifying, and tracking marine mammals2.
What species of marine mammals occur in the nearshore (within small-boat survey range) and offshore areas of the MITT study area?
What is the habitat use of cetaceans in the nearshore and offshore areas
of the MITT study area?
What is the abundance and population structure of marine
mammals in the MITT study area?
What is the seasonal occurrence and movements of baleen whales in the nearshore and offshore areas of the MITT study area?
What is the exposure of cetaceans and sea turtles to explosives and/or sonar in the MITT study area?
In 2018:
Satellite-tag data suggest that short-finned pilot whales tagged off Guam and Rota had a home range that
extended to the north beyond FDM and to the south beyond Guam to Santa Rosa Reef (Hill et al. 2018a, 2019).
Continued analysis: photo-ID and recapture analysis for abundance estimation will be conducted for the southern Archipelago with reporting expected in 2019.
Published “Short‐finned pilot whales (Globicephala macrorhynchus) of the Mariana Archipelago: Individual affiliations, movements, and spatial use” (Hill et al. 2018a) and “Clicks of dwarf sperm whales (Kogia sima)”
(Merkens et al. 2018) in Marine Mammal Science .
Evaluated population structure, range, and habitat use from analyses of photo-identification, genetic, satellite telemetry, and acoustic datasets for each cetacean species collected during small-boat surveys in the Mariana Archipelago from 2010–2018 (Hill et al. 2018c).
In 2017:
The humpback whale catalog from winter surveys increased the number of individuals to 35 non-calves. Matches from 2017 included three resights, one from 2007, another from 2015, and the third seen in 2016 with calf. Genetic haplotype-based population analysis for this species from biopsied tissue samples ongoing.
For the first time in the month of May, a Bryde’s whale was encountered off the west side of Saipan. All other sightings have occurred during the months of August and September (Hill et al. 2016a, 2017).
Photo-id and satellite tag data suggest that the population of short-finned pilot whales in the Marianas may include groups of individuals that are more island-associated within the southern portion of the archipelago, as well as those that are intermittent visitors to the nearshore waters of Guam, Rota, Saipan and Tinian.
Acoustic analysis of beaked whale call variability from PIFSC-funded HARPs and kernel density estimates from tagging telemetry are ongoing 2016–2017, with reporting expected in 2018.
In 2016:
Began efforts to coordinate matching of individually-identifying fluke photographs from the winter survey effort in Saipan to various western Pacific catalogs. Initial matches made with: previous years (2015) in this survey series, Marpi Reef CNMI from 2007 MISTCS survey, two matches to Ogasawara (both in 2004), and two matches to the Commander Islands, one of which matches to Okinawa. Presented this work at the International Whaling Commission meeting, “Are humpback whales (Megaptera novaeangliae) breeding and calving in the Mariana Islands?” (Hill et al. 2016b).
Satellite tags deployed on two sperm whales and a pantropical spotted dolphin for the first time in the Marianas. Dwarf sperm whales encountered for the first time off Guam.
DoN | 2018 All-Range Pacific Annual Monitoring Report MARINE SPECIES MONITORING IN THE PACIFIC
1 April 2019 | 13
Project (Technical report for 2018)
Conceptual Framework
Category
Intermediate Scientific Objectives (Numbered as per Figure 1)
Monitoring Questions Accomplishments1
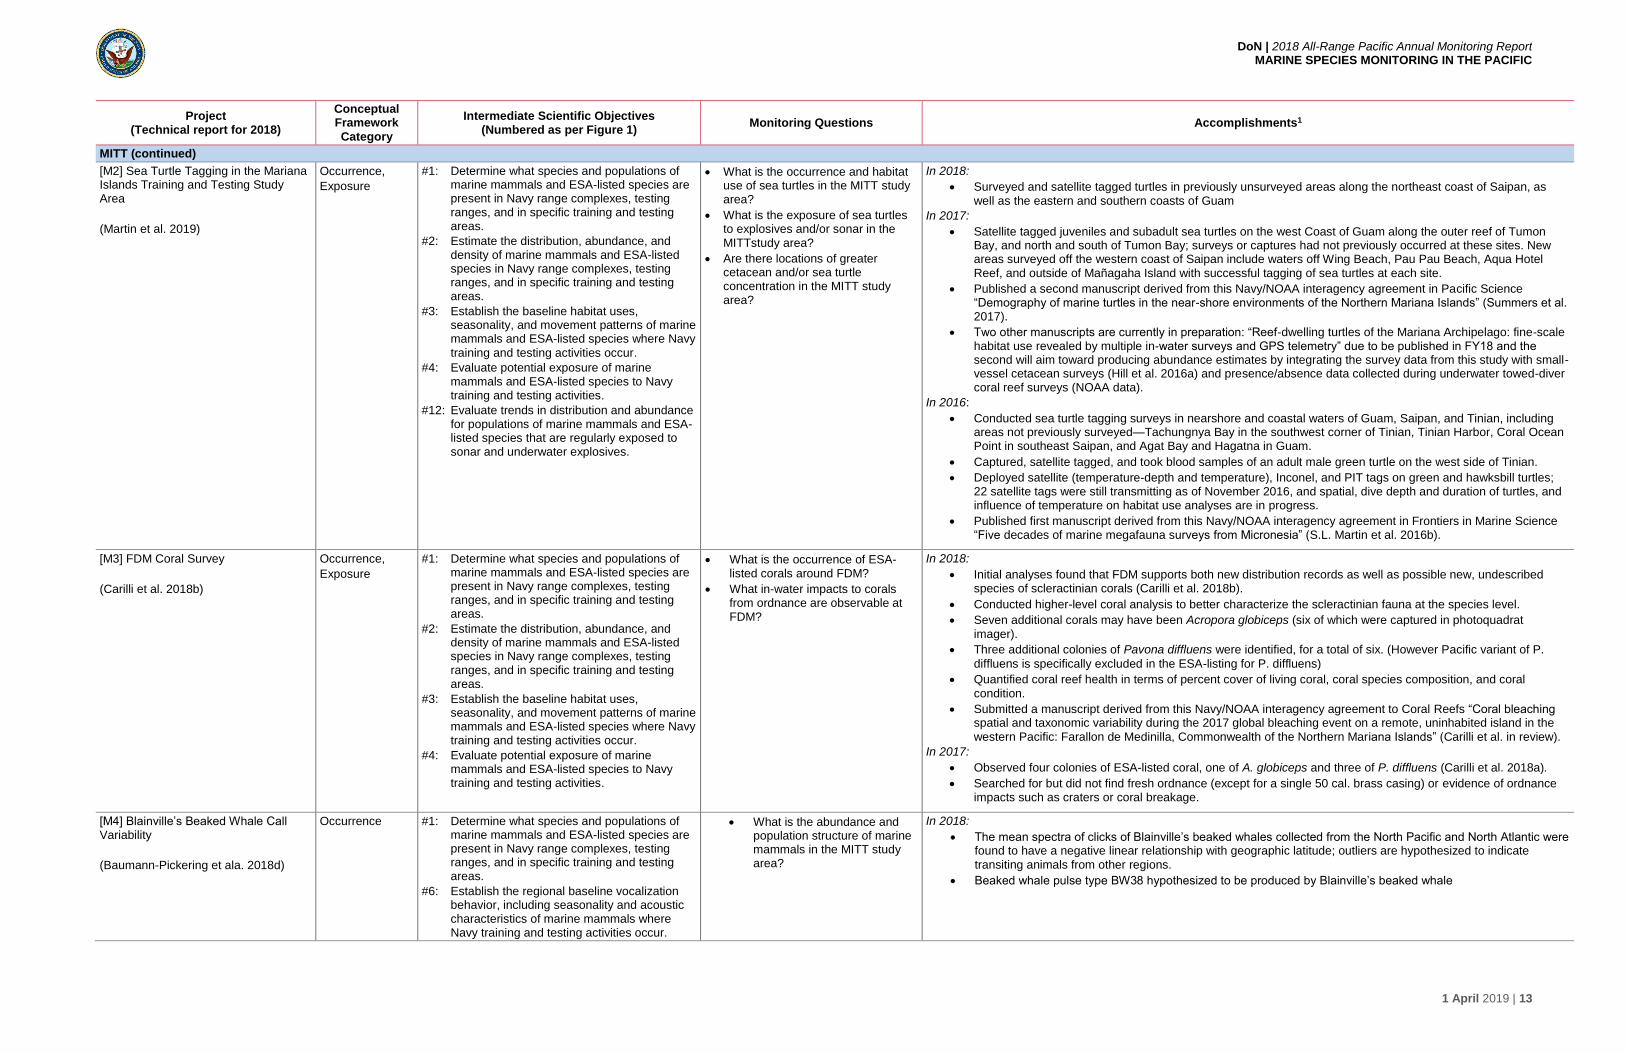
MITT (continued)
[M2] Sea Turtle Tagging in the Mariana Islands Training and Testing Study Area
(Martin et al. 2019)
Occurrence,
Exposure
#1: Determine what species and populations of marine mammals and ESA-listed species are present in Navy range complexes, testing ranges, and in specific training and testing areas.
#2: Estimate the distribution, abundance, and density of marine mammals and ESA-listed species in Navy range complexes, testing ranges, and in specific training and testing areas.
#3: Establish the baseline habitat uses, seasonality, and movement patterns of marine mammals and ESA-listed species where Navy
training and testing activities occur.
#4: Evaluate potential exposure of marine mammals and ESA-listed species to Navy training and testing activities.
#12: Evaluate trends in distribution and abundance for populations of marine mammals and ESA-listed species that are regularly exposed to sonar and underwater explosives.
What is the occurrence and habitat use of sea turtles in the MITT study area?
What is the exposure of sea turtles to explosives and/or sonar in the
MITTstudy area?
Are there locations of greater cetacean and/or sea turtle concentration in the MITT study area?
In 2018:
Surveyed and satellite tagged turtles in previously unsurveyed areas along the northeast coast of Saipan, as
well as the eastern and southern coasts of Guam
In 2017:
Satellite tagged juveniles and subadult sea turtles on the west Coast of Guam along the outer reef of Tumon Bay, and north and south of Tumon Bay; surveys or captures had not previously occurred at these sites. New areas surveyed off the western coast of Saipan include waters off Wing Beach, Pau Pau Beach, Aqua Hotel
Reef, and outside of Mañagaha Island with successful tagging of sea turtles at each site.
Published a second manuscript derived from this Navy/NOAA interagency agreement in Pacific Science “Demography of marine turtles in the near-shore environments of the Northern Mariana Islands” (Summers et al. 2017).
Two other manuscripts are currently in preparation: “Reef-dwelling turtles of the Mariana Archipelago: fine-scale habitat use revealed by multiple in-water surveys and GPS telemetry” due to be published in FY18 and the second will aim toward producing abundance estimates by integrating the survey data from this study with small-vessel cetacean surveys (Hill et al. 2016a) and presence/absence data collected during underwater towed-diver coral reef surveys (NOAA data).
In 2016:
Conducted sea turtle tagging surveys in nearshore and coastal waters of Guam, Saipan, and Tinian, including areas not previously surveyed—Tachungnya Bay in the southwest corner of Tinian, Tinian Harbor, Coral Ocean Point in southeast Saipan, and Agat Bay and Hagatna in Guam.
Captured, satellite tagged, and took blood samples of an adult male green turtle on the west side of Tinian.
Deployed satellite (temperature-depth and temperature), Inconel, and PIT tags on green and hawksbill turtles; 22 satellite tags were still transmitting as of November 2016, and spatial, dive depth and duration of turtles, and influence of temperature on habitat use analyses are in progress.
Published first manuscript derived from this Navy/NOAA interagency agreement in Frontiers in Marine Science “Five decades of marine megafauna surveys from Micronesia” (S.L. Martin et al. 2016b).
[M3] FDM Coral Survey
(Carilli et al. 2018b)
Occurrence,
Exposure
#1: Determine what species and populations of marine mammals and ESA-listed species are present in Navy range complexes, testing ranges, and in specific training and testing areas.
#2: Estimate the distribution, abundance, and density of marine mammals and ESA-listed species in Navy range complexes, testing ranges, and in specific training and testing areas.
#3: Establish the baseline habitat uses, seasonality, and movement patterns of marine mammals and ESA-listed species where Navy training and testing activities occur.
#4: Evaluate potential exposure of marine mammals and ESA-listed species to Navy training and testing activities.
What is the occurrence of ESA-listed corals around FDM?
What in-water impacts to corals from ordnance are observable at FDM?
In 2018:
Initial analyses found that FDM supports both new distribution records as well as possible new, undescribed species of scleractinian corals (Carilli et al. 2018b).
Conducted higher-level coral analysis to better characterize the scleractinian fauna at the species level.
Seven additional corals may have been Acropora globiceps (six of which were captured in photoquadrat
imager).
Three additional colonies of Pavona diffluens were identified, for a total of six. (However Pacific variant of P.
diffluens is specifically excluded in the ESA-listing for P. diffluens)
Quantified coral reef health in terms of percent cover of living coral, coral species composition, and coral
condition.
Submitted a manuscript derived from this Navy/NOAA interagency agreement to Coral Reefs “Coral bleaching spatial and taxonomic variability during the 2017 global bleaching event on a remote, uninhabited island in the
western Pacific: Farallon de Medinilla, Commonwealth of the Northern Mariana Islands” (Carilli et al. in review).
In 2017:
Observed four colonies of ESA-listed coral, one of A. globiceps and three of P. diffluens (Carilli et al. 2018a).
Searched for but did not find fresh ordnance (except for a single 50 cal. brass casing) or evidence of ordnance impacts such as craters or coral breakage.
[M4] Blainville’s Beaked Whale Call Variability
(Baumann-Pickering et ala. 2018d)
Occurrence #1: Determine what species and populations of marine mammals and ESA-listed species are present in Navy range complexes, testing ranges, and in specific training and testing areas.
#6: Establish the regional baseline vocalization behavior, including seasonality and acoustic characteristics of marine mammals where Navy training and testing activities occur.
What is the abundance and population structure of marine mammals in the MITT study area?
In 2018:
The mean spectra of clicks of Blainville’s beaked whales collected from the North Pacific and North Atlantic were found to have a negative linear relationship with geographic latitude; outliers are hypothesized to indicate
transiting animals from other regions.
Beaked whale pulse type BW38 hypothesized to be produced by Blainville’s beaked whale
DoN | 2018 All-Range Pacific Annual Monitoring Report MARINE SPECIES MONITORING IN THE PACIFIC
1 April 2019 | 14
Project (Technical report for 2018)
Conceptual Framework
Category
Intermediate Scientific Objectives (Numbered as per Figure 1)
Monitoring Questions Accomplishments1
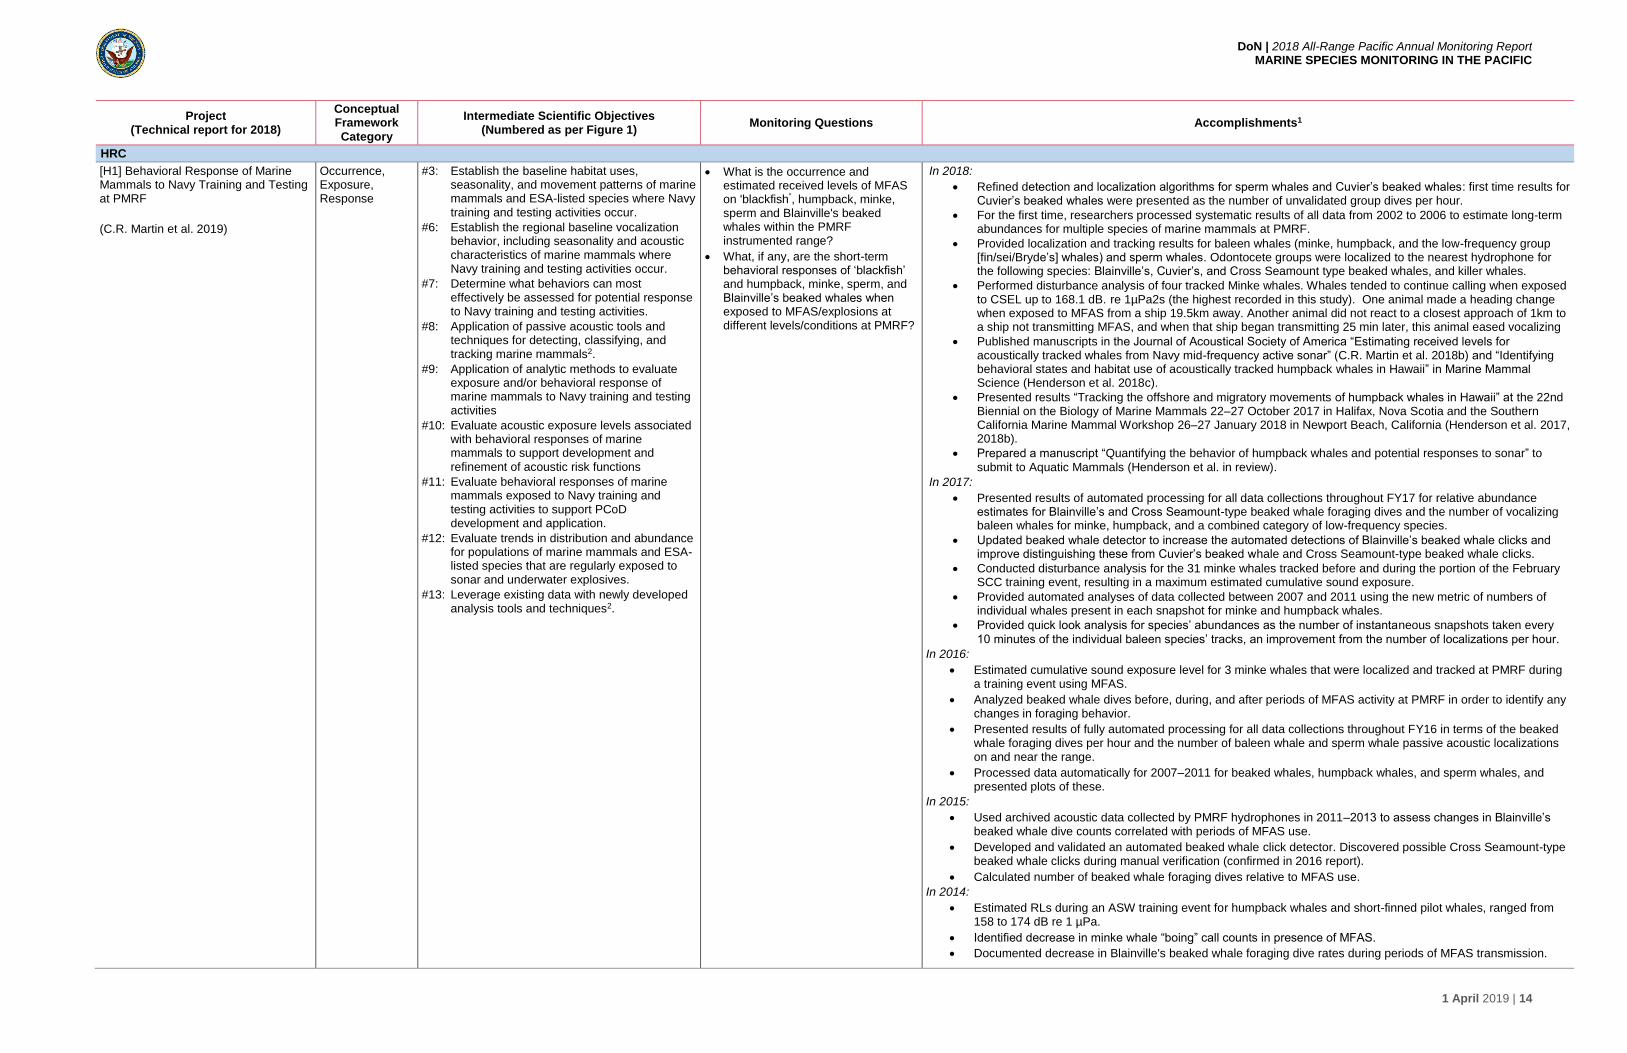
HRC
[H1] Behavioral Response of Marine Mammals to Navy Training and Testing at PMRF
(C.R. Martin et al. 2019)
Occurrence, Exposure, Response
#3: Establish the baseline habitat uses, seasonality, and movement patterns of marine mammals and ESA-listed species where Navy
training and testing activities occur.
#6: Establish the regional baseline vocalization behavior, including seasonality and acoustic characteristics of marine mammals where Navy training and testing activities occur.
#7: Determine what behaviors can most effectively be assessed for potential response to Navy training and testing activities.
#8: Application of passive acoustic tools and techniques for detecting, classifying, and tracking marine mammals2.
#9: Application of analytic methods to evaluate exposure and/or behavioral response of marine mammals to Navy training and testing activities
#10: Evaluate acoustic exposure levels associated with behavioral responses of marine mammals to support development and
refinement of acoustic risk functions
#11: Evaluate behavioral responses of marine mammals exposed to Navy training and testing activities to support PCoD development and application.
#12: Evaluate trends in distribution and abundance for populations of marine mammals and ESA-listed species that are regularly exposed to sonar and underwater explosives.
#13: Leverage existing data with newly developed analysis tools and techniques2.
What is the occurrence and estimated received levels of MFAS on 'blackfish”, humpback, minke, sperm and Blainville's beaked whales within the PMRF instrumented range?
What, if any, are the short-term behavioral responses of ‘blackfish’ and humpback, minke, sperm, and Blainville’s beaked whales when exposed to MFAS/explosions at different levels/conditions at PMRF?
In 2018:
Refined detection and localization algorithms for sperm whales and Cuvier’s beaked whales: first time results for Cuvier’s beaked whales were presented as the number of unvalidated group dives per hour.
For the first time, researchers processed systematic results of all data from 2002 to 2006 to estimate long-term abundances for multiple species of marine mammals at PMRF.
Provided localization and tracking results for baleen whales (minke, humpback, and the low-frequency group [fin/sei/Bryde’s] whales) and sperm whales. Odontocete groups were localized to the nearest hydrophone for the following species: Blainville’s, Cuvier’s, and Cross Seamount type beaked whales, and killer whales.
Performed disturbance analysis of four tracked Minke whales. Whales tended to continue calling when exposed to CSEL up to 168.1 dB. re 1µPa2s (the highest recorded in this study). One animal made a heading change when exposed to MFAS from a ship 19.5km away. Another animal did not react to a closest approach of 1km to a ship not transmitting MFAS, and when that ship began transmitting 25 min later, this animal eased vocalizing
Published manuscripts in the Journal of Acoustical Society of America “Estimating received levels for acoustically tracked whales from Navy mid-frequency active sonar” (C.R. Martin et al. 2018b) and “Identifying behavioral states and habitat use of acoustically tracked humpback whales in Hawaii” in Marine Mammal Science (Henderson et al. 2018c).
Presented results “Tracking the offshore and migratory movements of humpback whales in Hawaii” at the 22nd Biennial on the Biology of Marine Mammals 22–27 October 2017 in Halifax, Nova Scotia and the Southern California Marine Mammal Workshop 26–27 January 2018 in Newport Beach, California (Henderson et al. 2017, 2018b).
Prepared a manuscript “Quantifying the behavior of humpback whales and potential responses to sonar” to
submit to Aquatic Mammals (Henderson et al. in review).
In 2017:
Presented results of automated processing for all data collections throughout FY17 for relative abundance estimates for Blainville’s and Cross Seamount-type beaked whale foraging dives and the number of vocalizing baleen whales for minke, humpback, and a combined category of low-frequency species.
Updated beaked whale detector to increase the automated detections of Blainville’s beaked whale clicks and improve distinguishing these from Cuvier’s beaked whale and Cross Seamount-type beaked whale clicks.
Conducted disturbance analysis for the 31 minke whales tracked before and during the portion of the February SCC training event, resulting in a maximum estimated cumulative sound exposure.
Provided automated analyses of data collected between 2007 and 2011 using the new metric of numbers of individual whales present in each snapshot for minke and humpback whales.
Provided quick look analysis for species’ abundances as the number of instantaneous snapshots taken every
10 minutes of the individual baleen species’ tracks, an improvement from the number of localizations per hour.
In 2016:
Estimated cumulative sound exposure level for 3 minke whales that were localized and tracked at PMRF during a training event using MFAS.
Analyzed beaked whale dives before, during, and after periods of MFAS activity at PMRF in order to identify any changes in foraging behavior.
Presented results of fully automated processing for all data collections throughout FY16 in terms of the beaked whale foraging dives per hour and the number of baleen whale and sperm whale passive acoustic localizations on and near the range.
Processed data automatically for 2007–2011 for beaked whales, humpback whales, and sperm whales, and presented plots of these.
In 2015:
Used archived acoustic data collected by PMRF hydrophones in 2011–2013 to assess changes in Blainville’s beaked whale dive counts correlated with periods of MFAS use.
Developed and validated an automated beaked whale click detector. Discovered possible Cross Seamount-type beaked whale clicks during manual verification (confirmed in 2016 report).
Calculated number of beaked whale foraging dives relative to MFAS use.
In 2014:
Estimated RLs during an ASW training event for humpback whales and short-finned pilot whales, ranged from 158 to 174 dB re 1 µPa.
Identified decrease in minke whale “boing” call counts in presence of MFAS.
Documented decrease in Blainville's beaked whale foraging dive rates during periods of MFAS transmission.

DoN | 2018 All-Range Pacific Annual Monitoring Report MARINE SPECIES MONITORING IN THE PACIFIC
1 April 2019 | 15
Project (Technical report for 2018)
Conceptual Framework
Category
Intermediate Scientific Objectives (Numbered as per Figure 1)
Monitoring Questions Accomplishments1
HRC (continued)
[H2] Long-term Trends in Abundance of Marine Mammals at PMRF
(DiMarzio et al. 2019)
(This is a joint project with [S3] “Cuvier’s Beaked Whale Impact Assessment at SOAR”)
Occurrence, Exposure, Response,
Consequences
#1: Determine what species and populations of marine mammals and ESA-listed species are present in Navy range complexes, testing ranges, and in specific training and testing areas.
#8: Application of passive acoustic tools and techniques for detecting, classifying, and tracking marine mammals2.
#9: Application of analytic methods to evaluate exposure and/or behavioral response of marine mammals to Navy training and testing activities.
#12: Evaluate trends in distribution and abundance for populations of marine mammals and ESA-listed species that are regularly exposed to
sonar and underwater explosives.
#13: Leverage existing data with newly developed analysis tools and techniques2.
What are the long-term trends in occurrence of marine mammals (e.g., minke, humpback, fin, Bryde’s,
Blainville’s) on the PMRF range?
In 2018:
Configured the system to enable uninterrupted, continuous archiving of the M3R.
Analyzed the first extended beaked whale detection achieved for PMRF from February 2017 through April 2018.
Abundance estimates for Blainville’s beaked whale at PMRF: remained stable from 2015 to 2018.
Ongoing analysis of the extended archive covering the period April 2018 through January 2019, final report is
expected during the FY19 reporting period.
In 2017:
Obtained the first extended PAM data archive at PMRF: six months of continuous data were recorded and analyzed for Blainville’s beaked whale abundance and added to previous estimates.
Incorporated automated sonar detector performing on streaming data into the M3R software at PMRF, and detection reports were integrated into the M3R data archives.
Archived automated time-tagged cetacean detections and localizations on streaming data at PMRF.
Determined no decline in beaked whale abundance at PMRF from 2010 to 2017.
In 2016:
Compared beaked whale detection archives from both SSC Pacific and M3R algorithms and determined
baseline abundance at PMRF.
Completed packet recorder interface and new disk-handling utilities; implemented sample rate decimation and
undertaking testing.
Determined no change in the population trend line of beaked whales over the 5-year period, 2010–2014.
In 2015:
Upgraded hardware/software for M3R Linux-based cluster signal processor at PMRF, which includes a full range
of broadband recording and integrated data archives.
Conducted initial analysis of beaked whale detection archives to establish methods and baseline abundance at PMRF and SCORE.
[H3] Navy Civilian Marine Mammal Observers on DDGs
(Oliveira et al. 2019)
Occurrence, Exposure
#3: Establish the baseline habitat uses, seasonality, and movement patterns of marine mammals and ESA-listed species where Navy training and testing activities occur.
#4: Evaluate potential exposure of marine mammals and ESA-listed species to Navy training and testing activities.
#11: Evaluate behavioral responses of marine mammals exposed to Navy training and testing activities to support PCoD development and application.
What is the effectiveness of Navy lookouts on Navy surface ships for mitigation and what species are sighted during sonar training events?
In 2018:
Conducted MMO surveys 10–16 February 2018 to record marine species during a SCC training event.
Collected data to assess the effectiveness of the Navy lookout team and to characterize the possible exposure
of marine species to MFAS.
Released formal Navy message to senior Navy commands requesting additional MMO opportunities.
In 2017:
Embark was scheduled in February 2017 and MMO boarded the DDG but, due to emergent mechanical difficulties of the ship; the ship did not participate in the training event and the embark was cancelled.
In 2014–2016:
Employed MMOs on U.S. Navy warships during a total of five training events: one SCC event in 2015 and one in 2016, and one Koa Kai and two SCC events in 2014 (Vars et al. 2016).
Recorded marine mammal and sea turtle sighting data to determine which species and populations are exposed to U.S. Navy training events.
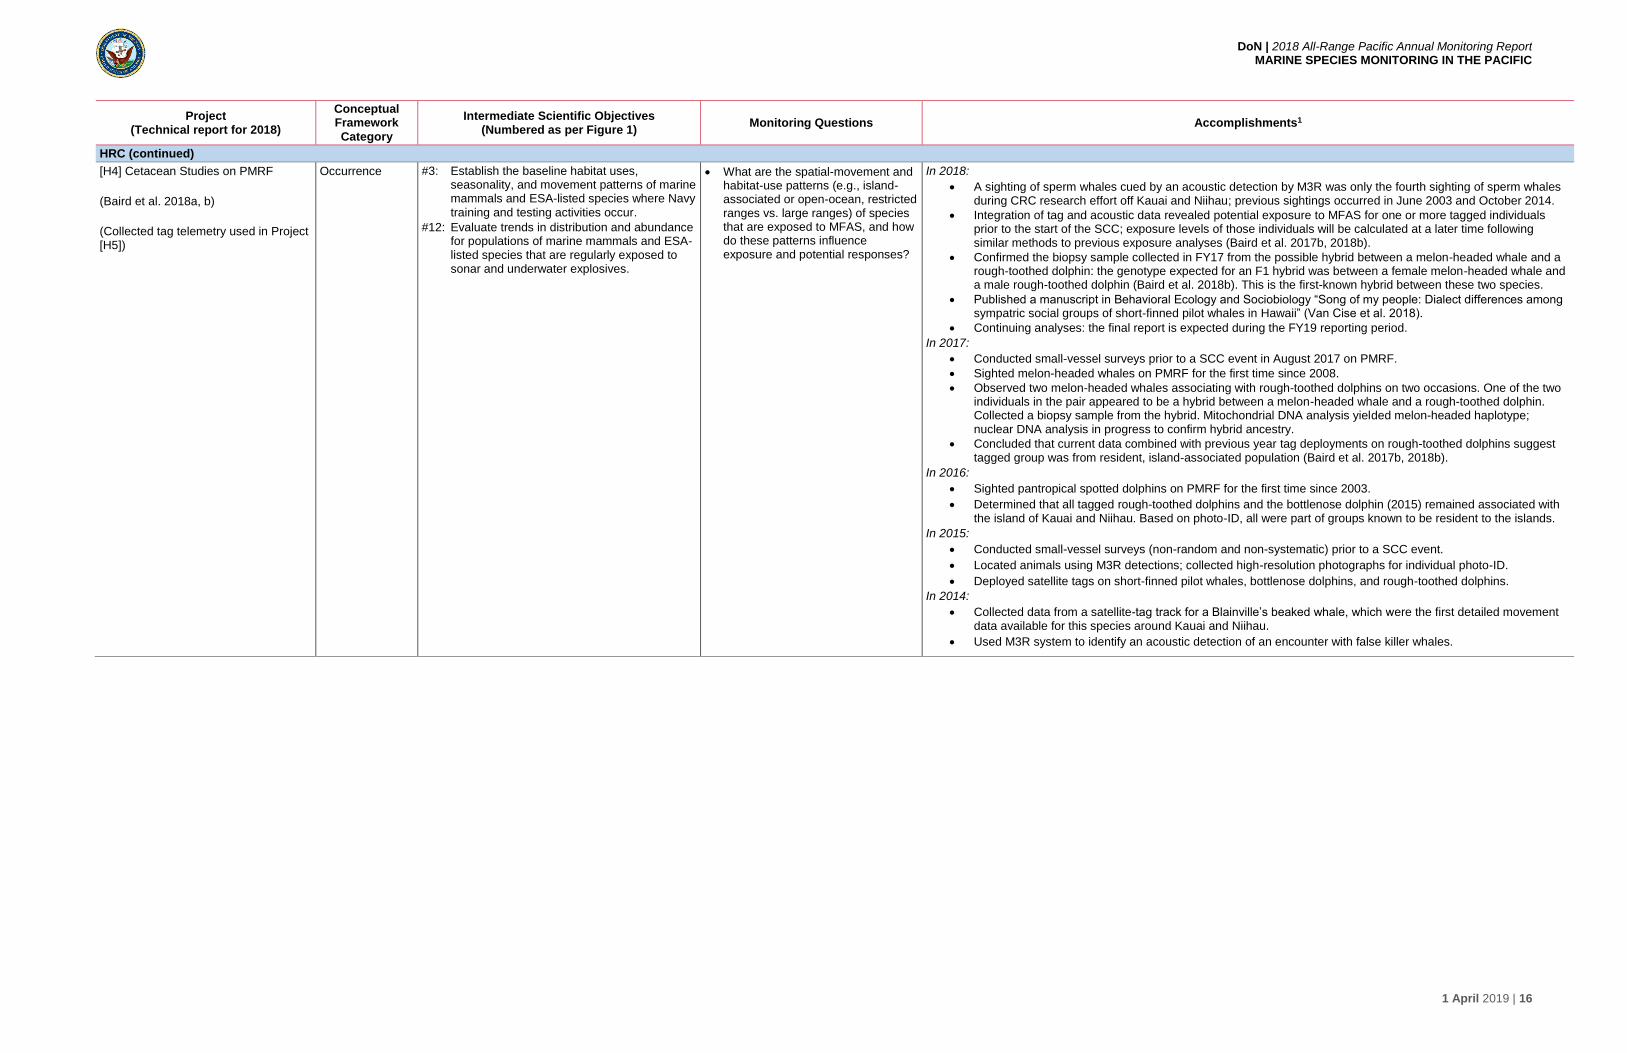
DoN | 2018 All-Range Pacific Annual Monitoring Report MARINE SPECIES MONITORING IN THE PACIFIC
1 April 2019 | 16
Project (Technical report for 2018)
Conceptual Framework
Category
Intermediate Scientific Objectives (Numbered as per Figure 1)
Monitoring Questions Accomplishments1
HRC (continued)
[H4] Cetacean Studies on PMRF
(Baird et al. 2018a, b)
(Collected tag telemetry used in Project [H5])
Occurrence #3: Establish the baseline habitat uses, seasonality, and movement patterns of marine mammals and ESA-listed species where Navy
training and testing activities occur.
#12: Evaluate trends in distribution and abundance for populations of marine mammals and ESA-listed species that are regularly exposed to sonar and underwater explosives.
What are the spatial-movement and habitat-use patterns (e.g., island-associated or open-ocean, restricted ranges vs. large ranges) of species that are exposed to MFAS, and how do these patterns influence exposure and potential responses?
In 2018:
A sighting of sperm whales cued by an acoustic detection by M3R was only the fourth sighting of sperm whales during CRC research effort off Kauai and Niihau; previous sightings occurred in June 2003 and October 2014.
Integration of tag and acoustic data revealed potential exposure to MFAS for one or more tagged individuals prior to the start of the SCC; exposure levels of those individuals will be calculated at a later time following similar methods to previous exposure analyses (Baird et al. 2017b, 2018b).
Confirmed the biopsy sample collected in FY17 from the possible hybrid between a melon-headed whale and a rough-toothed dolphin: the genotype expected for an F1 hybrid was between a female melon-headed whale and a male rough-toothed dolphin (Baird et al. 2018b). This is the first-known hybrid between these two species.
Published a manuscript in Behavioral Ecology and Sociobiology “Song of my people: Dialect differences among sympatric social groups of short-finned pilot whales in Hawaii” (Van Cise et al. 2018).
Continuing analyses: the final report is expected during the FY19 reporting period.
In 2017:
Conducted small-vessel surveys prior to a SCC event in August 2017 on PMRF.
Sighted melon-headed whales on PMRF for the first time since 2008.
Observed two melon-headed whales associating with rough-toothed dolphins on two occasions. One of the two individuals in the pair appeared to be a hybrid between a melon-headed whale and a rough-toothed dolphin. Collected a biopsy sample from the hybrid. Mitochondrial DNA analysis yielded melon-headed haplotype; nuclear DNA analysis in progress to confirm hybrid ancestry.
Concluded that current data combined with previous year tag deployments on rough-toothed dolphins suggest tagged group was from resident, island-associated population (Baird et al. 2017b, 2018b).
In 2016:
Sighted pantropical spotted dolphins on PMRF for the first time since 2003.
Determined that all tagged rough-toothed dolphins and the bottlenose dolphin (2015) remained associated with the island of Kauai and Niihau. Based on photo-ID, all were part of groups known to be resident to the islands.
In 2015:
Conducted small-vessel surveys (non-random and non-systematic) prior to a SCC event.
Located animals using M3R detections; collected high-resolution photographs for individual photo-ID.
Deployed satellite tags on short-finned pilot whales, bottlenose dolphins, and rough-toothed dolphins.
In 2014:
Collected data from a satellite-tag track for a Blainville’s beaked whale, which were the first detailed movement data available for this species around Kauai and Niihau.
Used M3R system to identify an acoustic detection of an encounter with false killer whales.

DoN | 2018 All-Range Pacific Annual Monitoring Report MARINE SPECIES MONITORING IN THE PACIFIC
1 April 2019 | 17
Project (Technical report for 2018)
Conceptual Framework
Category
Intermediate Scientific Objectives (Numbered as per Figure 1)
Monitoring Questions Accomplishments1
HRC (continued)
[H5] Estimation of Received Levels of MFAS on Marine Mammals at PMRF
(Baird et al. 2019)
Occurrence, Exposure
#4: Evaluate potential exposure of marine mammals and ESA-listed species to Navy training and testing activities.
#6: Establish the regional baseline vocalization behavior, including seasonality and acoustic characteristics of marine mammals where
Navy training and testing activities occur.
#7: Determine what behaviors can most effectively be assessed for potential response
to Navy training and testing activities.
#8: Application of passive acoustic tools and techniques for detecting, classifying, and tracking marine mammals2.
#9: Application of analytic methods to evaluate exposure and/or behavioral response of marine mammals to Navy training and testing activities.
#10: Evaluate acoustic exposure levels associated with behavioral responses of marine mammals to support development and refinement of acoustic risk functions.
#12: Evaluate trends in distribution and abundance for populations of marine mammals and ESA-listed species that are regularly exposed to
sonar and underwater explosives.
#13: Leverage existing data with newly developed
analysis tools and techniques2.
What is the occurrence and estimated received levels of MFAS on ‘blackfish’ and rough-toothed dolphins within the PMRF instrumented range?
In 2018:
Analyzed exposure and response of tagged whales on or around PMRF prior to SCCs in February 2016, August 2017, and August 2018.
Estimated MFAS exposure levels for satellite-tagged whales on PMRF.
Ongoing analyses: data from eight satellite tags deployed on odontocetes prior to the SCC events held in February 2016, August 2017 and August 2018. Analyses to estimate received levels are currently underway and a final report on these analyses will be available later in 2019.
In 2017:
In August 2017, prior to the tagging field effort, a second Wildlife Mote receiving station was installed near the instrumented range at PMRF for enhancing the quantity of satellite-tag data. The new station was installed on Niihau, providing complementary coverage to the one previously installed February 2016 at Makaha Ridge in Kauai.
No cetaceans tagged off PMRF in summer 2017 prior to the August Navy training event remained in the area by the time event commenced. Analyses are deferred until after tagging off PMRF in summer 2018.
In 2016:
Conducted vessel-based field efforts on three occasions between July 2013 and February 2015 that
corresponded with MFAS use during SCCs (Baird et al. 2017a).
Estimated MFAS exposure levels for satellite-tagged individuals in February 2011, February 2012 and February
2013.
[H6/S7/N1/G2] Humpback Whale Tagging in Support of Marine Mammal Monitoring Across Multiple Navy Training Areas in the Pacific
Ocean
(Mate et al. 2018a, 2018c, 2018d, 2019)
This project is also a component of SOCAL, NWTT, and GOA tagging, S7,
N1, and G2)
See project N1/H6/S7/G2 (below, in NWTT)

DoN | 2018 All-Range Pacific Annual Monitoring Report MARINE SPECIES MONITORING IN THE PACIFIC
1 April 2019 | 18
Project (Technical report for 2018)
Conceptual Framework
Category
Intermediate Scientific Objectives (Numbered as per Figure 1)
Monitoring Questions Accomplishments1
SOCAL
[S1] Passive Acoustic Monitoring in SOCAL
(Baumann-Pickering et al. 2018b; Rice
et al. 2019)
Occurrence #1: Determine what species and populations of marine mammals and ESA-listed species are present in Navy range complexes, testing ranges, and in specific training and testing areas.
#2: Estimate the distribution, abundance, and density of marine mammals and ESA-listed species in Navy range complexes, testing ranges, and in specific training and testing areas.
#3: Determine what species and populations of marine mammals and ESA-listed species are exposed to Navy training and testing activities.
#6: Establish the regional baseline vocalization behavior, including seasonality and acoustic characteristics of marine mammals where Navy training and testing activities occur.
#9: Application of analytic methods to evaluate exposure and/or behavioral response of marine mammals to Navy training and testing activities.
What is the seasonal occurrence and abundance of beaked whales and ESA-listed baleen whales within the Navy's Southern California Range Complex?
In 2018:
Deployed a new array of HARPs in the San Diego Trough during the summer and fall of 2017 (Rice et al. 2019).
Analyzed data recorded by HARPs deployed at Sites E, H, N, and HP between March 2017 and July 2018 (Rice et al. 2019).
Detected a new beaked whale FM pulse type, BW35, thought to be produced by Hubbs’ beaked whale at site E and site H (Rice et al. 2019).
Performed a comprehensive acoustic analysis of data collected between January 2013 and June 2017 at sites H, M, N, and P (Baumann-Pickering et al. 2018b).
Conducted analyses using automated detectors for whale sound sources across the five years (2013–2017) (Baumann-Pickering et al. 2018b).
Analyzed seasonal occurrence, interannual variability, and relative abundance of calls for fin whales, blue whales, Cuvier’s beaked whales that were consistently identified in the data over the 5-year period (2013–2017) (Baumann-Pickering et al. 2018b).
Presented this work at the 6th International Meeting on the Effects of Sounds in the Ocean on Marine Mammals, The Hague, The Netherlands “Impact of mid-frequency active sonar on beaked whale echolocation from long-term passive acoustic recordings” (Baumann-Pickering et al. 2018c).
In 2017:
Analyzed fin whale song patterns from HARP data collected at four sites (Sites C, H, P, and Q) in the SCB
between 2005 and 2014 (Širović et al. 2018).
Preliminary results indicated that the fin whale songs recorded between 2009 and 2010 across all four sites had the same doublet IPIs corresponding to “short doublet” song likely attributed to resident population (Širović et al. 2018).
Conducted PAM from April 2016 to June 2017 to detect marine mammals and anthropogenic sounds using
HARPs at three locations (Sites H, N and P) within SOCAL (Rice et al. 2018a).
Analyzed ambient noise and the presence of MFAS and explosions detected at all three sites (Rice et al.
2018a).
Performed data analysis using automated computer algorithms and detected blue whale call types B and D, and fin whale 20 Hz calls (Rice et al. 2018a).
Detected frequency-modulated echolocation pulses from Cuvier’s beaked whales at sites H and N. Additional beaked whale-like frequency modulated pulse type, BW43, possibly produced by Perrin’s beaked whale
(Baumann-Pickering et al. 2014), was detected infrequently during winter at site N (Rice et al. 2018a).
In 2016:
Conducted PAM from June 2015 to April 2016 to detect marine mammal and anthropogenic sounds using HARPs at three locations within SOCAL (Rice et al. 2017).
Described differences between recording sites in the occurrence of blue whale B calls and D calls, and fin whale 20-Hz calls.
In 2014–2016:
Deployed HARPs at three locations in SOCAL to record marine mammal sounds and anthropogenic noise (Debich et al. 2015b).
Continued refining understanding of fin whale population in SOCAL although analysis of fin whale song patterns identified songs from resident and “transient” (pan-Pacific) populations of fin whales.
Continued analysis of seasonal presence of fin, blue, and Cuvier’s beaked whales, and the “BW43” beaked whale call (possibly Perrin’s beaked whale).
Began new effort to characterize SOCAL regional Cuvier’s beaked whale densities based on passive acoustic data.
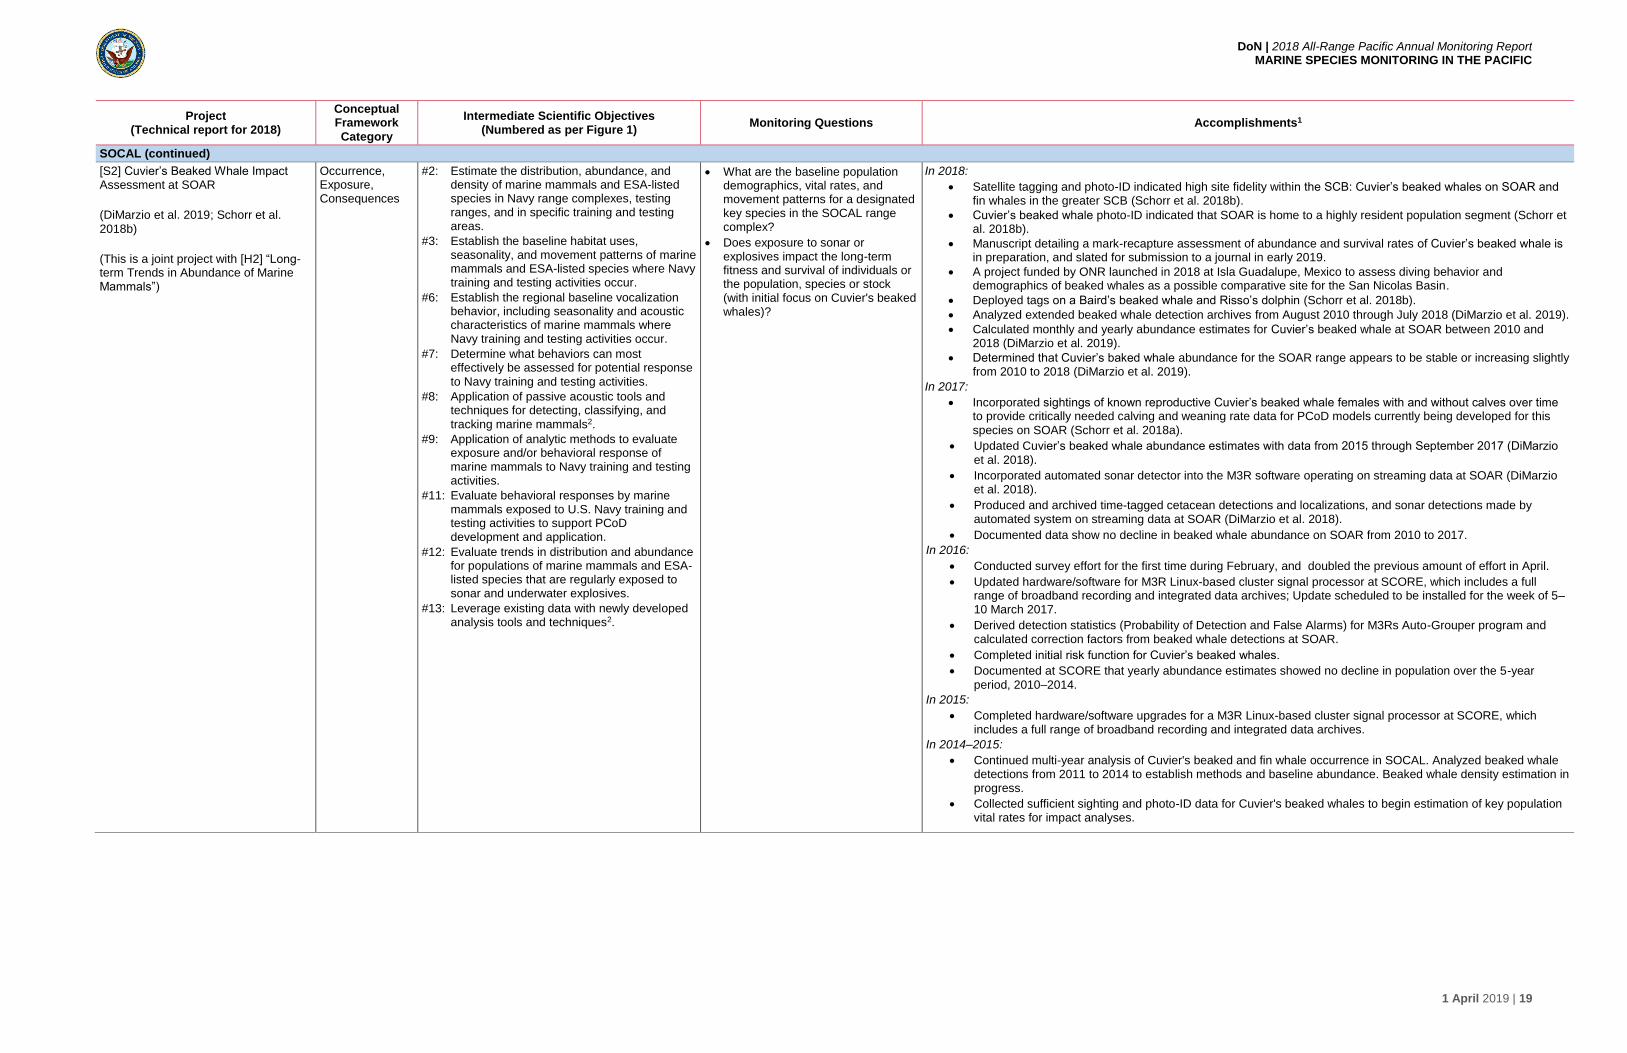
DoN | 2018 All-Range Pacific Annual Monitoring Report MARINE SPECIES MONITORING IN THE PACIFIC
1 April 2019 | 19
Project (Technical report for 2018)
Conceptual Framework
Category
Intermediate Scientific Objectives (Numbered as per Figure 1)
Monitoring Questions Accomplishments1
SOCAL (continued)
[S2] Cuvier’s Beaked Whale Impact Assessment at SOAR
(DiMarzio et al. 2019; Schorr et al.
2018b)
(This is a joint project with [H2] “Long-term Trends in Abundance of Marine Mammals”)
Occurrence, Exposure, Consequences
#2: Estimate the distribution, abundance, and density of marine mammals and ESA-listed species in Navy range complexes, testing ranges, and in specific training and testing areas.
#3: Establish the baseline habitat uses, seasonality, and movement patterns of marine mammals and ESA-listed species where Navy training and testing activities occur.
#6: Establish the regional baseline vocalization behavior, including seasonality and acoustic characteristics of marine mammals where Navy training and testing activities occur.
#7: Determine what behaviors can most effectively be assessed for potential response
to Navy training and testing activities.
#8: Application of passive acoustic tools and techniques for detecting, classifying, and
tracking marine mammals2.
#9: Application of analytic methods to evaluate exposure and/or behavioral response of marine mammals to Navy training and testing activities.
#11: Evaluate behavioral responses by marine mammals exposed to U.S. Navy training and testing activities to support PCoD development and application.
#12: Evaluate trends in distribution and abundance for populations of marine mammals and ESA-listed species that are regularly exposed to sonar and underwater explosives.
#13: Leverage existing data with newly developed analysis tools and techniques2.
What are the baseline population demographics, vital rates, and movement patterns for a designated key species in the SOCAL range complex?
Does exposure to sonar or explosives impact the long-term fitness and survival of individuals or the population, species or stock (with initial focus on Cuvier's beaked whales)?
In 2018:
Satellite tagging and photo-ID indicated high site fidelity within the SCB: Cuvier’s beaked whales on SOAR and fin whales in the greater SCB (Schorr et al. 2018b).
Cuvier’s beaked whale photo-ID indicated that SOAR is home to a highly resident population segment (Schorr et al. 2018b).
Manuscript detailing a mark-recapture assessment of abundance and survival rates of Cuvier’s beaked whale is in preparation, and slated for submission to a journal in early 2019.
A project funded by ONR launched in 2018 at Isla Guadalupe, Mexico to assess diving behavior and demographics of beaked whales as a possible comparative site for the San Nicolas Basin.
Deployed tags on a Baird’s beaked whale and Risso’s dolphin (Schorr et al. 2018b).
Analyzed extended beaked whale detection archives from August 2010 through July 2018 (DiMarzio et al. 2019).
Calculated monthly and yearly abundance estimates for Cuvier’s beaked whale at SOAR between 2010 and 2018 (DiMarzio et al. 2019).
Determined that Cuvier’s baked whale abundance for the SOAR range appears to be stable or increasing slightly from 2010 to 2018 (DiMarzio et al. 2019).
In 2017:
Incorporated sightings of known reproductive Cuvier’s beaked whale females with and without calves over time to provide critically needed calving and weaning rate data for PCoD models currently being developed for this
species on SOAR (Schorr et al. 2018a).
Updated Cuvier’s beaked whale abundance estimates with data from 2015 through September 2017 (DiMarzio
et al. 2018).
Incorporated automated sonar detector into the M3R software operating on streaming data at SOAR (DiMarzio et al. 2018).
Produced and archived time-tagged cetacean detections and localizations, and sonar detections made by automated system on streaming data at SOAR (DiMarzio et al. 2018).
Documented data show no decline in beaked whale abundance on SOAR from 2010 to 2017.
In 2016:
Conducted survey effort for the first time during February, and doubled the previous amount of effort in April.
Updated hardware/software for M3R Linux-based cluster signal processor at SCORE, which includes a full range of broadband recording and integrated data archives; Update scheduled to be installed for the week of 5–10 March 2017.
Derived detection statistics (Probability of Detection and False Alarms) for M3Rs Auto-Grouper program and calculated correction factors from beaked whale detections at SOAR.
Completed initial risk function for Cuvier’s beaked whales.
Documented at SCORE that yearly abundance estimates showed no decline in population over the 5-year
period, 2010–2014.
In 2015:
Completed hardware/software upgrades for a M3R Linux-based cluster signal processor at SCORE, which includes a full range of broadband recording and integrated data archives.
In 2014–2015:
Continued multi-year analysis of Cuvier's beaked and fin whale occurrence in SOCAL. Analyzed beaked whale detections from 2011 to 2014 to establish methods and baseline abundance. Beaked whale density estimation in progress.
Collected sufficient sighting and photo-ID data for Cuvier's beaked whales to begin estimation of key population vital rates for impact analyses.

DoN | 2018 All-Range Pacific Annual Monitoring Report MARINE SPECIES MONITORING IN THE PACIFIC
1 April 2019 | 20
Project (Technical report for 2018)
Conceptual Framework
Category
Intermediate Scientific Objectives (Numbered as per Figure 1)
Monitoring Questions Accomplishments1
SOCAL (continued)
[S3] Beaked Whale Occurrence In SOCAL using Towed Array
[This project formerly titled “Marine Mammal Sightings during CalCOFI Cruises” from 2004-2017]
(Frasier et al. 2019)
Occurrence #1: Determine what species and populations of marine mammals and ESA-listed species are present in Navy range complexes, testing ranges, and in specific training and testing areas.
#3: Establish the baseline habitat uses, seasonality, and movement patterns of marine mammals and ESA-listed species where Navy training and testing activities occur..
What is the seasonal occurrence and density of beaked whales within the Navy's Southern California
Range Complex?
In 2018:
Analyzed towed-array data collected four times per year during 52 CalCOFI survey cruises 2004–2018 (Frasier et al. 2019).
Implemented an unsupervised learning algorithm to distinguish between impulse signals associated with echosounders, vessel propeller cavitation, and beaked whale and dolphin echolocation clicks based on differences in their acoustic spectra (Frasier et al. 2019).
Screened towed–array data which contained acoustic detections of a variety of odontocete species’ signals (Frasier et al. 2019).
Ongoing analysis: identification of beaked whale events from beaked whale signals (Frasier et al. 2019).
In 2017:
Reported on visual and acoustic monitoring for marine mammals aboard CalCOFI cruises during July and November 2016, and January, April, and August 2017.
20 species identified during on-effort observations.
In 2016:
Performed visual and acoustic monitoring for cetaceans during 18 CalCOFI cruises from February 2012 to April 2016 in the SCB to collect distribution, abundance, and seasonal and inter-annual patterns of density.
18 species identified and varied by season, 1,027 sonobuoy deployments and 478 towed-array deployments
during 334 days at sea and 2,034 observation hr on effort.
In 2015:
Performed visual and acoustic monitoring for marine mammals aboard CalCOFI cruises in 2014 and 2015.
Platform provides an opportunity to assess the full range of marine mammal species present in SOCAL.
Habitat modeling underway to predict marine mammal presence in SOCAL.
In 2014:
Gathered sufficient data for generation of species-specific seasonal densities and abundance trends at finer spatial and temporal scales than standard NMFS U.S. West Coast surveys, which are performed every 3 to 6 years.

DoN | 2018 All-Range Pacific Annual Monitoring Report MARINE SPECIES MONITORING IN THE PACIFIC
1 April 2019 | 21
Project (Technical report for 2018)
Conceptual Framework
Category
Intermediate Scientific Objectives (Numbered as per Figure 1)
Monitoring Questions Accomplishments1
SOCAL (continued)
[S4/N3] Blue and Fin Whale Tagging and Genetics
(Mate et al. 2018b)
(This project is also a component of
NWTT tagging, N3)
Occurrence #1: Determine what species and populations of marine mammals and ESA-listed species are present in Navy range complexes, testing ranges, and in specific training and testing areas.
#3: Establish the baseline habitat uses, seasonality, and movement patterns of marine mammals and ESA-listed species where Navy training and testing activities occur.
#4: Evaluate potential exposure of marine mammals and ESA-listed species to Navy training and testing activities..
#5: Establish the baseline behavioral patterns (foraging, diving, etc.) of marine mammals where Navy training and testing activities
occur.
What are the movement patterns, occurrence, and residence times of blue and fin whales within Navy training and testing areas along the U.S. West Coast as compared to other areas visited by tagged whales outside of Navy training and testing
areas?
What are the residency time/occupancy patterns of blue whales within NMFS-designated Biologically Important Areas (BIAs) for this species along the U.S. West Coast?
Are there bathymetric, annual oceanographic conditions (e.g., sea surface temperature, frontal zones, etc.), and/or climatic and ocean variations (e.g., global warming, North Pacific Gyre Oscillation [NPGO], Pacific Decadal Oscillation [PDO], El Niño/La Niña events, etc.) that can help explain blue and fin whale affinity for any identified areas of high residency along the U.S. West Coast?
In 2018:
Conducted inter-annual comparisons of tracking results between 2014, 2015, 2016, and 2017.
Analyzed dive characteristic data obtained from DM tags used in 2016 and 2017 and compared to ADB data from 2014 and 2015.
Characterized whale tracking data in the context of environmental conditions (i.e., depth, slope, SST, and distance to shore) and a comparison between the four years 2014–2017).
Conducted genetic analysis of biopsy samples from all four years, including sex determination, individual identification, species and stock identification, as well as results from the photo-ID of tagged and untagged whales.
Results indicated that blue and fin whales have distinct ecological optima that likely are reflections of different
prey resource utilization in much of their range. Blue and fin whale range and movement patterns in CCAL are
predicted to change, given that the euphausiid and pelagic schooling fish prey they forage upon respond strongly
to decadal variability.
Examined whale movements in relation to three environmental indices (the ONI, the PDO index, and the NPGO index.
Results suggest that the anomalous warm-water events of 2014 and 2015 had different impacts on blue and fin whales: blue whale foraging effort was lowest in 2014 and 2015, while during the 2015–2016 El Niño fin whale foraging effort appeared worse.
In 2017:
Conducted analyses on blue, fin, and humpback whale tracking results which included tag deployments from 2016 and tracking information through 8 April 2017.
Analyzed dive characteristic data obtained from DM tags used in 2016 and compared 2016 data to ADB data from 2014 and 2015.
Genetic analysis of biopsy samples to determine sex of individuals, individual identification, and species and stock identification was conducted for all three years (2014–2016).
In 2016:
Analyzed genetic samples from blue whales and fin whales biopsied to determine sex of the individuals.
Used mtDNA sequences to define haplotypes for stock analysis and to confirm species identification.
In 2015:
Analyzed genetic samples from blue whales and fin whales biopsied in 2014 and 2015 to determine sex of the individuals.
Used mtDNA sequences to define haplotypes for stock analysis and to confirm species identification.
In 2014:
Analyzed data from ADB tags and identified strong and consistent diel feeding patterns in blue whales.
[S5] SOCAL Soundscape Study
(Wiggins et al. 2018)
Occurrence #9: Application of analytic methods to evaluate exposure and/or behavioral response of marine mammals to Navy training and testing
activities.
#13: Leverage existing data with newly developed analysis tools and techniques2.
What is the ambient and anthropogenic soundscape in SOCAL?
In 2018:
Re-processed ambient soundscape SPLs, analyzed and displayed using new and improved techniques, including calculating long (multi-year) spectrograms, sound pressure spectrum level percentiles, and average SPLs over the five-year recording period (June 2012 to June 2017).
Detected MFAS throughout the five year period, with the highest cumulative sound exposure levels and number of packet detections at the site south of San Clemente Island (N) and the fewest at the shallow near-shore site (P).
Detected explosions at all three sites (H, N and P) throughout the five-year period showed a general decrease in activity over time and with the highest number at the site (H) in the western San Nicolas Basin.
In 2017:
Analyzed metrics characterizing the underwater soundscape in the SOCAL range, based on multi-year recordings by HARPs of ambient biological, abiotic, and anthropogenic sound.

DoN | 2018 All-Range Pacific Annual Monitoring Report MARINE SPECIES MONITORING IN THE PACIFIC
1 April 2019 | 22
Project (Technical report for 2018)
Conceptual Framework
Category
Intermediate Scientific Objectives (Numbered as per Figure 1)
Monitoring Questions Accomplishments1
SOCAL (continued)
[S6/N4] Guadalupe Fur Seal Satellite Tracking
(Norris 2019)
(This project is also a component of
NWTT tagging, N4)
Occurrence #1: Determine what species and populations of marine mammals and ESA-listed species are present in Navy range complexes, testing ranges, and in specific training and testing areas.
#4: Establish the baseline habitat uses, seasonality, and movement patterns of marine mammals and ESA-listed species where Navy training and testing activities occur.
#5: Establish the baseline behavioral patterns (foraging, diving, etc.) of marine mammals where Navy training and testing activities occur.
What is the at-sea distribution of Guadalupe fur seals as they travel through the offshore waters of the Southern California Range Complex and Northwest Training and Testing area?
In 2018:
Initiated one of the first studies of at-sea distribution and foraging behavior of Guadalupe fur seals; conducted land- and vessel-based population surveys at San Benito Archipelago, Mexico from 11 to 14 July 2018 and GI, Mexico from 30 July to 4 August 2018.
Tracked satellite-tagged individuals in November 2018: 15 adult female, 10 juvenile female, and 10 juvenile male Guadalupe fur seals at Punta Sur, GI.
Analyzed Guadalupe fur seal densities, abundance estimates, dive characteristic data, and distance traveled.
Preliminary analyses indicate adult and juvenile females exhibited more “resident” foraging behavior and remained close and returned to GI, while juvenile males dispersed away from the Island.
Analyses of dive characteristic data are ongoing; final report expected in FY19.
[S7/N1/G2/H6] Humpback Whale Tagging in Support of Marine Mammal Monitoring Across Multiple Navy Training Areas in the Pacific Ocean
(Mate et al. 2018a, 2018c, 2018d,
2019)
This project is also a component of HRC, NWTT, and GOA tagging, H6, N1, and G2)
See project N1/H6/S7/G2 (below, in NWTT)
NWTT
[N1/H6/S7/G2] Humpback Whale Tagging in Support of Marine Mammal Monitoring Across Multiple Navy Training Areas in the Pacific Ocean
(Mate et al. 2018a, 2018c, 2018d,
2019)
This project is also a component of SOCAL tagging, S7, H6, and G2)
Occurrence #1: Determine what species and populations of marine mammals and ESA-listed species are present in Navy range complexes, testing ranges, and in specific training and testing areas.
#3: Establish the baseline habitat uses, seasonality, and movement patterns of marine mammals and ESA-listed species where Navy
training and testing activities occur.
#4: Evaluate potential exposure of marine mammals and ESA-listed species to Navy training and testing activities.
What are the occurrence, movement patterns, and residency patterns of multiple humpback whale Distinct Population Segments within Navy Pacific Ocean at-sea ranges (SOCAL, HRC, NWTT, GOA)?
In 2018:
Tracked humpback whales tagged off Maui along entire migratory path to Prince of Wales Island in Southeast Alaska; Haida Gwaii, the northern Pacific coast of Canada and Queen Charlotte Sound; the Aleutian Island chain and Bering Sea (Mate et al. 2018a).
Tagged humpback whales off Hawaii in spring of 2018 (Mate et al. 2018a), and off California and Oregon in summer-fall of 2017 (Mate et al. 2018c).
Tagged humpback whales off Washington and Oregon in August and September 2018 (Mate et al. 2018d), and a detailed analysis of these tag data will be available in a future report.
Applied SSSMs and hSSSMs to the Argos locations in order to examine home ranges, dive behavior, and ecological relationships.
Analyzed historical humpback whale tag data collected by OSU from 1997 to 2016 in California, Oregon, Southeast Alaska, and the Aleutian Islands in relation to U.S. Navy training and testing areas in the Pacific (Mate et al. 2018c).
Analysis of humpback whale mtDNA haplotypes showed significant differences between the tagging samples from California and Oregon, indicating a degree of differentiation between feeding areas. Oregon now shows a closer affinity with the Southern British Columbia/Washington feeding area (Mate et al. 2018c).
Tagged humpback whales had extended residencies in the Navy ranges: NWTT for Oregon whales, PT MUGU for California whales.
Ongoing analyses: genetic sex determination, population identity, individual identification, dive characteristic
data, and species and stock identification. The final report is expected during the FY19 reporting period.
In 2017:
Photo-ID and matching of photographs of tagged whales to existing photo-ID databases is ongoing. Continued genetic analysis of biopsy samples to determine sex of individuals, individual identification, and species and stock identification and will be presented in the final report (Mate et al. 2017b).

DoN | 2018 All-Range Pacific Annual Monitoring Report MARINE SPECIES MONITORING IN THE PACIFIC
1 April 2019 | 23
Project (Technical report for 2018)
Conceptual Framework
Category
Intermediate Scientific Objectives (Numbered as per Figure 1)
Monitoring Questions Accomplishments1
NWTT (continued)
[N2] Modeling Distribution of ESA-Listed Salmonids in the Pacific Northwest
(Huff and Smith 2019)
Occurrence #1: Determine what species and populations of marine mammals and ESA-listed species are present in Navy range complexes, testing ranges, and in specific training and testing areas.
#2: Estimate the distribution, abundance, and density of marine mammals and ESA-listed species in Navy range complexes, testing ranges, and in specific training and testing areas.
#3: Establish the baseline habitat uses, seasonality, and movement patterns of marine mammals and ESA-listed species where Navy
training and testing activities occur.
What is the occurrence, spatial and temporal distribution of populations of salmonids in proximity to
NWTT?
In 2018:
Conducted a pilot study to demonstrate the feasibility of capturing, tagging, and releasing salmonids at sea;
captured, weighed, measured, and tagged two species of salmonids in June and August 2018 at various depths
along the coastal shelf of Washington in the vicinity of NWTT. Successful capture of 45 salmonids of appropriate
size for tagging was demonstrated, with lessons learned that are expected to increase catch rate in 2019.
Field work is planned for May 2019 to capture, tag, and release ESA-listed fish species, including Chinook
salmon, steelhead, and bull trout.
[N3/S4] Blue and Fin Whale Tagging and Genetics
(Mate et al. 2018b)
(This project is also a component of
SOCAL tagging, S4)
See project S5/N3 (above, in SOCAL)
[N4/S6] Guadalupe Fur Seal Satellite Tracking
(Norris 2019)
This project is also a component of SOCAL tagging, S6
See project S7/N4 (above, in SOCAL)
[N5] Modeling the Offshore Distribution of Southern Resident Killer Whales in the Pacific Northwest
(Emmons et al. 2019)
Occurrence
#1: Determine what species and populations of marine mammals and ESA-listed species are present in Navy range complexes, testing ranges, and in specific training and testing areas.
#2: Estimate the distribution, abundance, and density of marine mammals and ESA-listed species in Navy range complexes, testing ranges, and in specific training and testing areas.
#3: Establish the baseline habitat uses, seasonality, and movement patterns of marine mammals and ESA-listed species where Navy training and testing activities occur.
#4: Establish the baseline habitat uses, seasonality, and movement patterns of marine mammals and ESA-listed species where Navy
training and testing activities occur.
#6: Establish the regional baseline vocalization behavior, including seasonality and acoustic characteristics of marine mammals where Navy training and testing activities occur
What are the seasonal and annual occurrence patterns of Southern Resident killer whales relative to offshore Navy training ranges?
In 2019:
Acoustic data analyzed for EARs deployed 2008-2017. NRKW were the most detected killer whale ecotype, followed by transients and SRKW, with a peak in the spring for all ecotypes. Most detections of SRKW were at nearshore sites except for increased detections at the Cape Flattery Offshore site during late spring to early summer.
MFAS was rarely detected at 13 of 19 recorder sites, with fewer detections (<1% of days) at nearshore sites. Of these detections, the highest occurrence of MFA was during February and March followed by May, and this overlaps with the occurrence of the three killer whale communities monitored.
In 2017:
Completed review of acoustic data for 13 EARs recovered along the U.S. West Coast from 2011 to 2016. Over a third of the monitoring days were from sites within NWTRC W237.
Updated annual predictive maps of the acoustic recorder detections, using detections for most years from 2011 through summer 2016
Updated acoustic detection probability using data from two additional winter cruises (2015, 2016).
Conducted a simulation study to evaluate the effectiveness of alternative sampling designs with respect to acoustic recorder presence. Evaluated how densities of recorders affected the probability of detecting whales on daily time steps.
In 2015/2016:
Deployed satellite tags (SPOT5) on SRKW in Puget Sound and coastal waters of Washington and Oregon between 2012 and 2016; however further SRKW tagging halted indefinitely by NMFS in 2016.
Collected individual-ID photos and samples of prey remains, feces, mucus and regurgitation.
Compiled all locations for satellite-tagged SRKW recorded through 2015; created duration-of-occurrence and state-space models to identify areas of high use and travel corridors.
Summarized detections for most years from fall 2006 through summer 2015 from an enhanced array of passive acoustic recorders (EARs) deployed off the coasts of California, Oregon, and Washington.
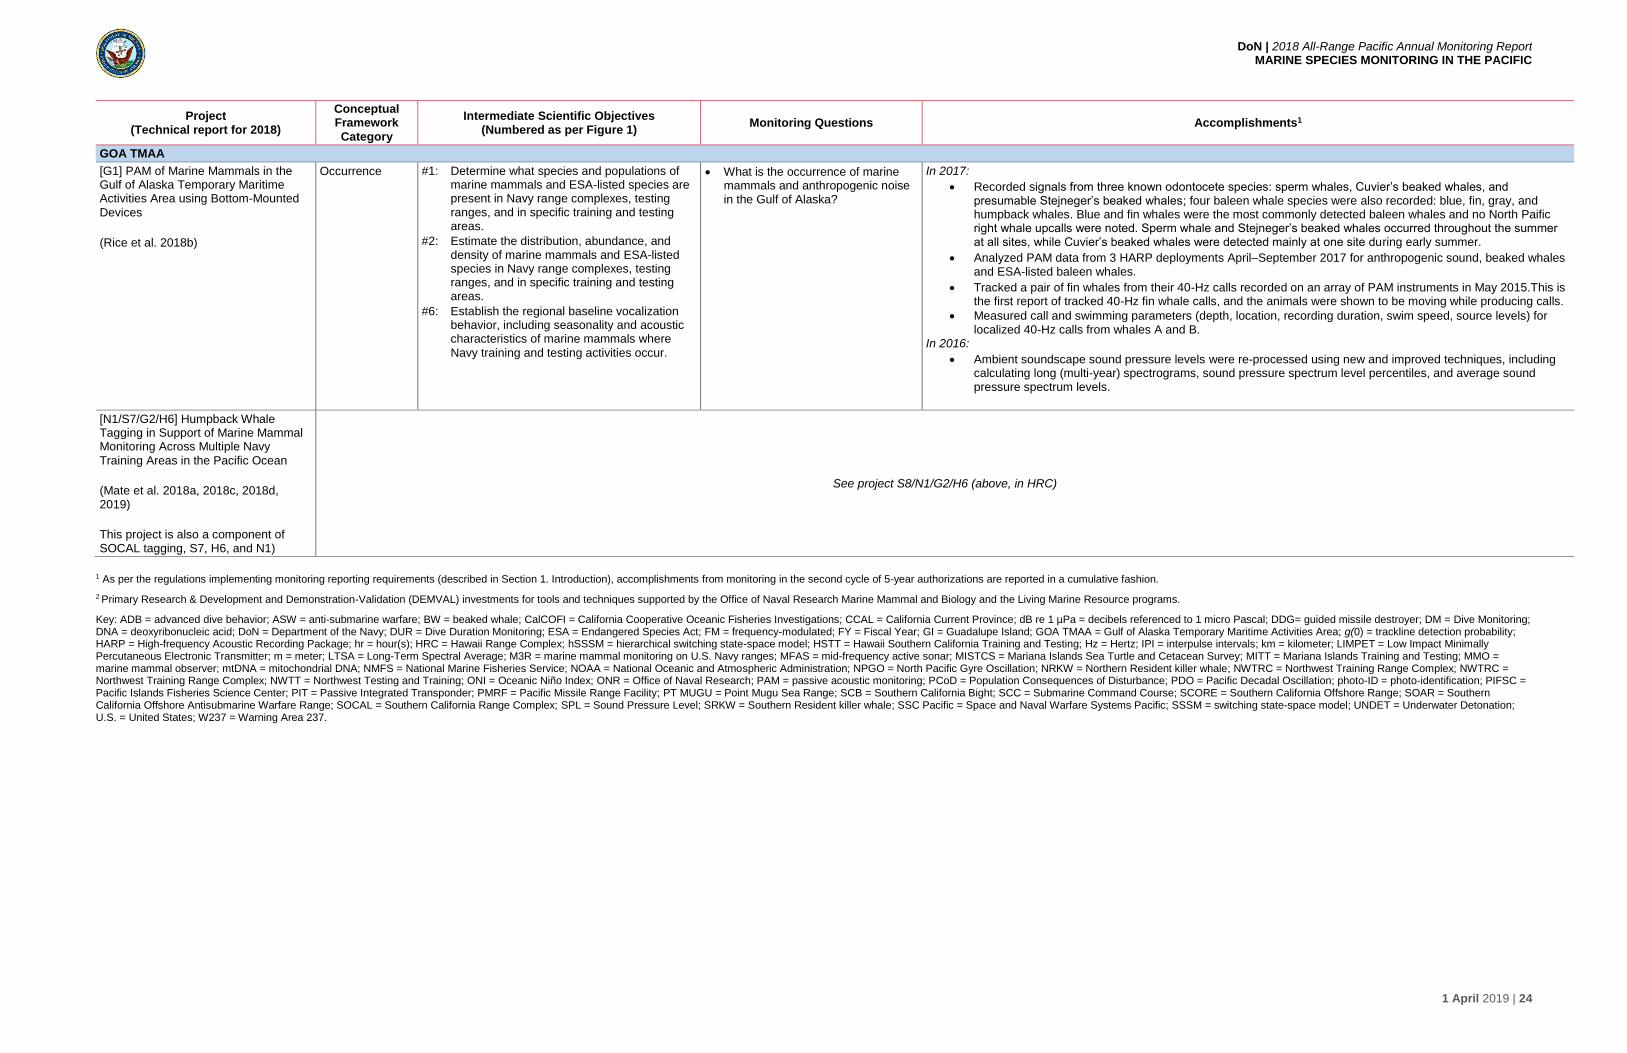
DoN | 2018 All-Range Pacific Annual Monitoring Report MARINE SPECIES MONITORING IN THE PACIFIC
1 April 2019 | 24
Project (Technical report for 2018)
Conceptual Framework
Category
Intermediate Scientific Objectives (Numbered as per Figure 1)
Monitoring Questions Accomplishments1
GOA TMAA
[G1] PAM of Marine Mammals in the Gulf of Alaska Temporary Maritime Activities Area using Bottom-Mounted
Devices
(Rice et al. 2018b)
Occurrence #1: Determine what species and populations of marine mammals and ESA-listed species are present in Navy range complexes, testing ranges, and in specific training and testing areas.
#2: Estimate the distribution, abundance, and density of marine mammals and ESA-listed species in Navy range complexes, testing ranges, and in specific training and testing areas.
#6: Establish the regional baseline vocalization behavior, including seasonality and acoustic characteristics of marine mammals where
Navy training and testing activities occur.
What is the occurrence of marine mammals and anthropogenic noise in the Gulf of Alaska?
In 2017:
Recorded signals from three known odontocete species: sperm whales, Cuvier’s beaked whales, and presumable Stejneger’s beaked whales; four baleen whale species were also recorded: blue, fin, gray, and humpback whales. Blue and fin whales were the most commonly detected baleen whales and no North Paific right whale upcalls were noted. Sperm whale and Stejneger’s beaked whales occurred throughout the summer at all sites, while Cuvier’s beaked whales were detected mainly at one site during early summer.
Analyzed PAM data from 3 HARP deployments April–September 2017 for anthropogenic sound, beaked whales and ESA-listed baleen whales.
Tracked a pair of fin whales from their 40-Hz calls recorded on an array of PAM instruments in May 2015.This is the first report of tracked 40-Hz fin whale calls, and the animals were shown to be moving while producing calls.
Measured call and swimming parameters (depth, location, recording duration, swim speed, source levels) for localized 40-Hz calls from whales A and B.
In 2016:
Ambient soundscape sound pressure levels were re-processed using new and improved techniques, including calculating long (multi-year) spectrograms, sound pressure spectrum level percentiles, and average sound pressure spectrum levels.
[N1/S7/G2/H6] Humpback Whale Tagging in Support of Marine Mammal Monitoring Across Multiple Navy
Training Areas in the Pacific Ocean
(Mate et al. 2018a, 2018c, 2018d, 2019)
This project is also a component of SOCAL tagging, S7, H6, and N1)
See project S8/N1/G2/H6 (above, in HRC)
1 As per the regulations implementing monitoring reporting requirements (described in Section 1. Introduction), accomplishments from monitoring in the second cycle of 5-year authorizations are reported in a cumulative fashion.
2 Primary Research & Development and Demonstration-Validation (DEMVAL) investments for tools and techniques supported by the Office of Naval Research Marine Mammal and Biology and the Living Marine Resource programs.
Key: ADB = advanced dive behavior; ASW = anti-submarine warfare; BW = beaked whale; CalCOFI = California Cooperative Oceanic Fisheries Investigations; CCAL = California Current Province; dB re 1 µPa = decibels referenced to 1 micro Pascal; DDG= guided missile destroyer; DM = Dive Monitoring; DNA = deoxyribonucleic acid; DoN = Department of the Navy; DUR = Dive Duration Monitoring; ESA = Endangered Species Act; FM = frequency-modulated; FY = Fiscal Year; GI = Guadalupe Island; GOA TMAA = Gulf of Alaska Temporary Maritime Activities Area; g(0) = trackline detection probability; HARP = High-frequency Acoustic Recording Package; hr = hour(s); HRC = Hawaii Range Complex; hSSSM = hierarchical switching state-space model; HSTT = Hawaii Southern California Training and Testing; Hz = Hertz; IPI = interpulse intervals; km = kilometer; LIMPET = Low Impact Minimally Percutaneous Electronic Transmitter; m = meter; LTSA = Long-Term Spectral Average; M3R = marine mammal monitoring on U.S. Navy ranges; MFAS = mid-frequency active sonar; MISTCS = Mariana Islands Sea Turtle and Cetacean Survey; MITT = Mariana Islands Training and Testing; MMO = marine mammal observer; mtDNA = mitochondrial DNA; NMFS = National Marine Fisheries Service; NOAA = National Oceanic and Atmospheric Administration; NPGO = North Pacific Gyre Oscillation; NRKW = Northern Resident killer whale; NWTRC = Northwest Training Range Complex; NWTRC = Northwest Training Range Complex; NWTT = Northwest Testing and Training; ONI = Oceanic Niño Index; ONR = Office of Naval Research; PAM = passive acoustic monitoring; PCoD = Population Consequences of Disturbance; PDO = Pacific Decadal Oscillation; photo-ID = photo-identification; PIFSC = Pacific Islands Fisheries Science Center; PIT = Passive Integrated Transponder; PMRF = Pacific Missile Range Facility; PT MUGU = Point Mugu Sea Range; SCB = Southern California Bight; SCC = Submarine Command Course; SCORE = Southern California Offshore Range; SOAR = Southern California Offshore Antisubmarine Warfare Range; SOCAL = Southern California Range Complex; SPL = Sound Pressure Level; SRKW = Southern Resident killer whale; SSC Pacific = Space and Naval Warfare Systems Pacific; SSSM = switching state-space model; UNDET = Underwater Detonation; U.S. = United States; W237 = Warning Area 237.

DoN | 2018 All-Range Pacific Annual Monitoring Report MARINE SPECIES MONITORING IN THE PACIFIC
1 April 2019 | 25
2.1.1 Timeline of Monitoring Efforts
In this sub-section, a graphical timeline of monitoring projects is presented for each range,
covering the 2018 monitoring year. The timelines include monitoring projects as well as notable
items (e.g., results and outcomes). Each timeline graphic is followed by a description of each
monitoring project; the corresponding monitoring project in the timeline can be identified by the
numbered code at the beginning of the project title, which begins with a one-letter abbreviation
of the range/study area (e.g., M = MITT; H = HRC; S = SOCAL; N = NWTT; G = GOA TMAA).
MITT
A timeline of all U.S. Pacific Fleet-funded monitoring tasks implemented in the MITT in 2018 is
illustrated in Figure 3. Detailed project summaries follow below.

DoN | 2018 All-Range Pacific Annual Monitoring Report MARINE SPECIES MONITORING IN THE PACIFIC
1 April 2019 | 26
Figure 3. Timeline of 2018 projects in the Mariana Islands Training and Testing Study Area.

DoN | 2018 All-Range Pacific Annual Monitoring Report MARINE SPECIES MONITORING IN THE PACIFIC
1 April 2019 | 27
[M1] Cetacean Monitoring in the Mariana Islands Range Complex, August-September 2018 [Hill et al. 2018c, 2019; Baumann-Pickering et al. 2018d]
In an effort to develop a basic record of the occurrence, abundance, and structure of cetacean
populations in the Mariana Archipelago, the Pacific Islands Fisheries Science Center’s
(PIFSC’s) Cetacean Research Program (CRP) conducted visual surveys for cetaceans in the
waters surrounding Guam and the southernmost islands of the Commonwealth of the Northern
Mariana Islands (CNMI) (Saipan, Tinian, Aguijan, Rota) during 2010–2018. These non-
systematic visual surveys were conducted aboard small boats, and satellite tagging and biopsy
collection for genetic analysis was performed.
Hill et al. (2018c) summarized the 2010–2018 data by evaluating population structure, range,
and habitat use from analyses of photo-identification (photo-ID), genetic, satellite telemetry, and
acoustic datasets, including bottom-moored HARPs and the 2015 Mariana Archipelago
Cetacean Survey (MACS), a large ship survey around all islands in the Mariana Archipelago
north of Farallon de Medinilla (FDM). The authors also summarized the ability to perform future
analyses across the data thus far collected with each species, such as population abundance
using mark-recapture, and identified remaining data gaps in cetacean occurrence in the
Marianas.
This project also provided analyses of data from PIFSC-deployed bottom-moored passive
acoustic recorders (HARPs). Baumann-Pickering (2018) utilized detections from these devices
for a comparison of Blainville’s Beaked whale call variability in different areas of the Pacific and
Atlantic. Clustering of these signals was performed using an unsupervised learning algorithm to
characterize call variability across these recording sites.
[M2] Sea Turtle Tagging in the Mariana Islands Training and Testing (MITT) [Martin et al. 2019]
During the period of August 1-12, 2018, sea turtle surveys and in-water captures for the purpose
of satellite tagging were conducted in the nearshore and coastal waters of Guam and Saipan. In
2018, survey efforts were conducted in areas never before surveyed, including the northeast
coast of Saipan, and the eastern and southern coasts of Guam. This research was conducted
by PIFSC Marine Turtle Biology and Assessment Program in a collaborative effort with the U.S.
Pacific Fleet, Naval Base Guam, Guam Division of Aquatic and Wildlife Resources, and CNMI
Department of Lands and Natural Resources.
[M3] FDM Coral Survey [Carilli et al. 2018b]
Coral reef habitat dive surveys were performed at FDM from 27 September to 1 October 2017
by two ecologists to address requirements of the MITT biological opinion (NMFS 2015c). The
primary objectives of the field survey were to quantify the abundance and location around the
island of ESA-listed corals, quantify coral reef health and species composition, and compile
observations of ordnance impacts. Secondary objectives were to record incidental observations

DoN | 2018 All-Range Pacific Annual Monitoring Report MARINE SPECIES MONITORING IN THE PACIFIC
1 April 2019 | 28
of any other ESA-listed species encountered. In 2018 georeferenced photoquadrat images
collected by the divers were processed to identify corals to species, with a focus on identifying
ESA-listed species (Carilli et al. 2018b).
[M4] Blainville’s beaked whale call variability analysis [Baumann-Pickering et al. 2018d]
NMFS PIFSC (Honolulu, HI), and University of California San Diego’s Scripps Institution of
Oceanography (SIO) in (La Jolla, CA) collaborated to study the variability of clicks in Blainville’s
beaked in various sites in the North Pacific and North Atlantic in an analysis that included
recordings from the Marianas. The HARPs in the Marianas were deployed off Saipan, Tinian,
and Pagan. This collection of Blainville’s beaked whale clicks were analyzed to develop
hypotheses for variability between geographic regions, and to evaluate the hypothesis that other
unidentified beaked whale calls might be attributed to this species.
HSTT
Monitoring in HRC and SOCAL is presented individually in the immediately following sections.
HRC
A timeline of all U.S. Pacific Fleet-funded monitoring tasks implemented in the HRC in 2018 is
illustrated in Figure 4. Detailed project summaries follow.

DoN | 2018 All-Range Pacific Annual Monitoring Report MARINE SPECIES MONITORING IN THE PACIFIC
1 April 2019 | 29
Figure 4. Timeline of 2018 projects in the Hawaii Range Complex.

DoN | 2018 All-Range Pacific Annual Monitoring Report MARINE SPECIES MONITORING IN THE PACIFIC
1 April 2019 | 30
[H1] SSC Pacific FY17 Annual Report on PMRF Marine Mammal Monitoring [C.R. Martin et al. 2019]
Since 2003, marine mammal activity has been acoustically monitored using bottom-mounted
hydrophone arrays of the U.S. Navy’s Pacific Missile Range Facility (PMRF) (C.R. Martin et al.
2017, 2018a), and associated training exercise data products on ship positions and MFAS.
During 2018, research efforts continued at the Space and Naval Warfare Systems Center
Pacific (SSC Pacific) Detection, Classification, Localization, Tracking, and Density Estimate
(DCLTDE) Laboratory to detect and localize several species of marine mammals and to
estimate received levels (RLs) from mid-frequency active sonar (MFAS) transmissions from
these collected acoustic data, using automated algorithms (C.R. Martin et al. 2019).
A disturbance analysis is currently being conducted to determine whether whale tracks overlap
with MFAS transmissions and close proximity of ships (even when not transmitting MFAS). This
approach represents an opportunistic behavioral response study (OBRS). When overlap occurs,
a variety of metrics are calculated/estimated, such as whale orientations and distances relative
to all ships. When ships are known to be transmitting sonar, propagation modeling is utilized to
calculate cumulative sound exposure level (cSEL) by an animal from multiple ships over the
duration it was acoustically tracked. A recently developed semi-automated disturbance-analysis
process was performed for species whose calls can be localized and confidently tracked (i.e.,
minke [Balaenoptera acutorostrata], humpback [Megaptera novaeangliae], and low-frequency
baleen whales). In addition to studying the behavior of individual whales in response to ships
and MFAS, the impact of the training events on the overall occurrence and abundance of vocal
animals before, during, and after the training event can be examined.
In 2018 detection and localization algorithms for sperm whales (Physeter macrocephalus) and
Cuvier’s beaked whales (Ziphius cavirostris) were refined. Also data from 2002-2018 were
processed to estimate long-term abundances for multiple species of marine mammals.
In February 2018 vessel-based tagging and photo-ID of humpback whales was conducted off
Kauai, Hawaii deploy satellite tags and active high-frequency pinger tags developed in-house
(DCLTDE). Primary goals included quantifying call rates on the range to inform density
estimation and validate localization models for acoustic detections on PMRF hydrophones and
opportunistically assessing any behavioral responses that may occur to MFAS during and after
the tagging effort.
[H2] Long-term Passive Acoustic Monitoring of Cetaceans at PMRF and SCORE [DiMarzio et al. 2019]
PAM data collected from range hydrophones at PMRF and Southern California Offshore
Antisubmarine Warfare Range [SOAR]) were analyzed to study abundance patterns of beaked
whales (Blainville’s beaked whale at PMRF, and Cuvier’s beaked whale at SOAR) utilizing a
dive counting method (DiMarzio et al. 2019). Potential impacts on these metrics by MFAS were
also examined.
The performer, NUWC Division Newport, is tasked to provide and maintain a Marine Mammal
Monitoring on U.S. Navy Ranges (M3R) system, that can be run with minimal operator
intervention to collect passive acoustic detection archives on a nearly continuous basis (see

DoN | 2018 All-Range Pacific Annual Monitoring Report MARINE SPECIES MONITORING IN THE PACIFIC
1 April 2019 | 31
also Project S2). These archive files provide an electronic record of marine mammal acoustic
activity and sonar activity, as well as marine mammal localization data from multiple algorithms.
[H3] Navy Civilian Marine Mammal Observers on DDGs [Oliveira et al. 2019]
Since 2014, marine mammal observers (MMOs) have embarked on U.S. Navy guided missile
destroyer (DDG) warships during SCC training events (in February 2014, 2015, 2016, and
2018), and Koa Kai events (January 2014) (Dickenson et al. 2014; Shoemaker et al. 2014; Vars
et al. 2016; Watwood et al. 2016; Oliveira et al. 2019). During these embarks, MMOs follow a
systematic protocol to collect data (sighting and weather information) that will be pooled with
other embarks for future analysis of the effectiveness of U.S. Navy lookouts observing from the
pilot house or the bridge wings. In 2018, an embark was conducted during 10–16 February.
[H4] Odontocete Studies on the Pacific Missile Range Facility in August 2018: Satellite-tagging, Photo-identification, and Passive Acoustic Monitoring [Baird et al. 2018a, b]
This long-term marine mammal monitoring project has been conducted since 2011, and
leverages earlier surveys through 2003, by Cascadia Research Collective (CRC) and SSC
Pacific, utilizing combined vessel-based field efforts and PAM on and around PMRF. In 2018,
efforts occurred immediately prior to an SCC event to allow for assessment of exposure and
response of satellite-tagged individuals to MFAS.
Surveys were conducted in conjunction with the M3R PAM system streaming from the
instrumented PMRF Range (Moretti 2017; DiMarzio et al. 2018, 2019). M3R detections were
used to direct the boat located animals for satellite-tag deployment, and visual observations
provided validation of acoustic detections. The goal was to obtain information on spatial
movements and habitat-use patterns of cetaceans that are exposed to MFAS on and around
PMRF before, during, and after the SCC; using satellite tag tracks (see Baird et al. 2018a, b).
Tagged animals that overlap in space and time with training events can be utilized for MFAS
exposure analysis (Project [H5], below.). Fastloc-GPS-dive tags were used for the first time in
the August 2018 season.
[H5] Impact of MFAS to Odontocetes during SCC, 2016–2018 [Baird et al. 2019]
Since 2011, a study to estimate the received level of MFAS by cetaceans during Navy training
has been conducted on and around the PMRF in association with scheduled SCCs (Baird et al.
2017a; 2018a, b). These efforts have used a combination of satellite tagging, acoustic
detections by the hydrophones at PMRF, and Navy data on times and locations of MFAS and
ship tracks, to address the questions of exposure, and response of odontocetes to MFAS.
Analyses incorporate location data from odontocetes that are satellite tagged a few days prior to
an SCC, and remain on or around PMRF during the SCC. An interim progress report (Baird et
al. 2019) was provided as a status update on the analyses of exposure and response of data
obtained from tagging efforts on or around PMRF prior to SCCs in February 2016, August 2017,
and August 2018. The methods for estimating MFAS exposure levels for satellite-tagged
individuals are described in Baird et al. (2017a).

DoN | 2018 All-Range Pacific Annual Monitoring Report MARINE SPECIES MONITORING IN THE PACIFIC
1 April 2019 | 32
[H6] Humpback Whale Tagging in Support of Marine Mammal Monitoring Across Multiple Navy Training Areas in the Pacific Ocean [Mate et al. 2018a, c, d]
Researchers from the Marine Mammal Research Institute of Oregon State University (OSU),
instrumented humpback whales in California, Oregon, and Hawaii with long-duration satellite-
tracked dive monitoring tags, and conducted genetic analyses on tissue collected during tag
placement. The objective of this project was to elucidate what portion of each humpback whale
distinct population segment (DPS) used Navy at-sea ranges in the North Pacific, as well as the
proportion of time the whales spent in these areas. Humpback whales were tagged off Hawaii in
spring of 2018 (Mate et al. 2018a, 2018d) and off California and Oregon in summer-fall of 2017
(Mate et al. 2017b, 2018c). Tag data were examined to describe home ranges, dive behavior,
and ecological relationships. In addition to the 2017–2018 tag data, historical humpback whale
tag data collected by OSU from 1997 to 2016 in California, Oregon, Southeast Alaska, and the
Aleutian Islands were analyzed in relation to U.S. Navy training and testing areas in the Pacific.
Additional tagging of humpback whales took place off Washington and Oregon in August and
September 2018 (Mate et al. 2019), and a detailed analysis of these tag data will be available in
a future report.
This is the same project conducted for SOCAL, NWTT, and GOA [S7, N1 and G2].
SOCAL
A timeline of all U.S. Pacific Fleet-funded monitoring tasks implemented in SOCAL in 2018 is
illustrated in Figure 5. Detailed project summaries follow.
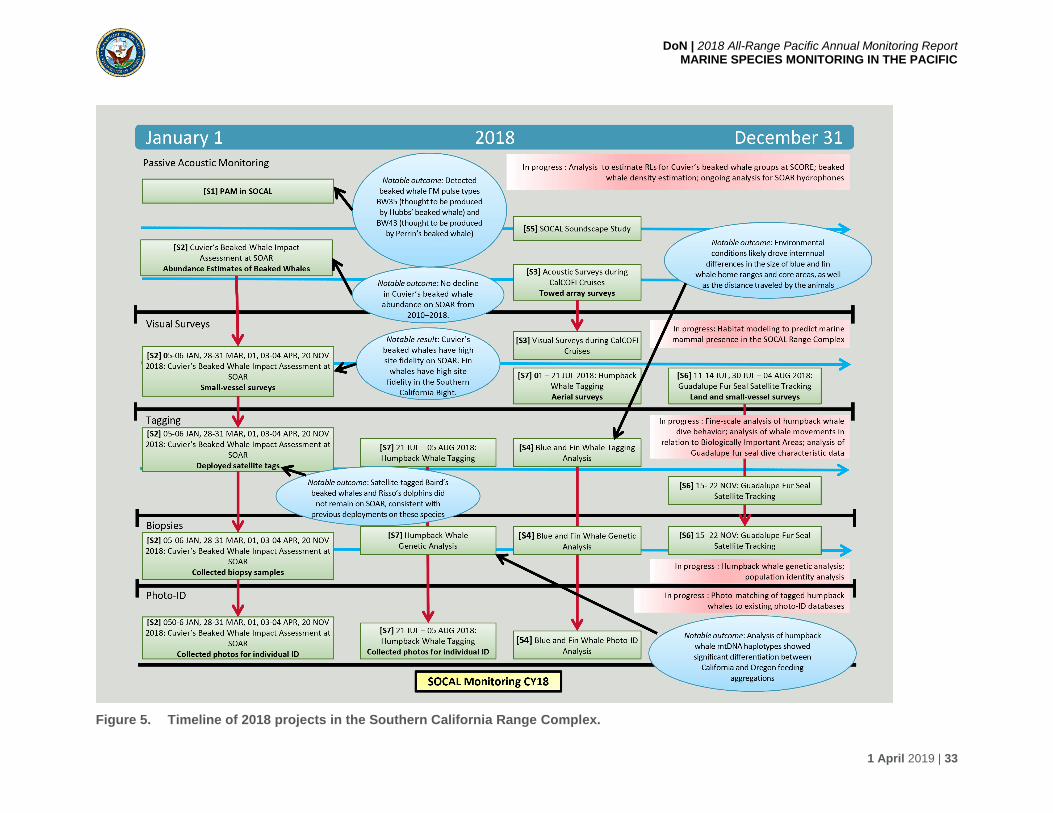
DoN | 2018 All-Range Pacific Annual Monitoring Report MARINE SPECIES MONITORING IN THE PACIFIC
1 April 2019 | 33
Figure 5. Timeline of 2018 projects in the Southern California Range Complex.

DoN | 2018 All-Range Pacific Annual Monitoring Report MARINE SPECIES MONITORING IN THE PACIFIC
1 April 2019 | 34
[S1] Passive Acoustic Monitoring in SOCAL [Rice et al. 2019; Baumann-Pickering et al. 2018b]
The University of California San Diego’s Scripps Institution of Oceanography (SIO) in La Jolla,
California studies marine mammal presence and acoustic behavior near naval training areas.
The range of work includes analyses of whale calls and echolocation clicks (of particular interest
are blue whales [Balaenoptera musculus], fin whales, and Cuvier’s beaked whales); collection of
anthropogenic signals (including sonar, shipping noise, etc.); impact of MFAS on whale calling
behavior; beaked whale population density; and fin whale population structure.
Broadband PAM data have been collected in the SOCAL region since 2006 using High-
frequency Acoustic Recording Packages (HARPs).
Rice et al. (2019) analyzed data collected during March 2017 through July 2018 from HARPs
deployed at three locations near San Clemente Island: one to the northwest (site E), one to the
west (site H), and one to the southwest (site N) (Figure 6). Additionally, a northeast-to-
southwest trending array of nine HARPs was deployed in the San Diego Trough during the
summer and fall of 2017; data from site HP are included in this report. Only a select sub-set of
species was analyzed, which included blue whales, fin whales, and beaked whales.
Baumann-Pickering et al. (2018b) analyzed collected from January 2013 to June 2017 from
HARPs deployed at three locations near San Clemente Island: one to the northwest (Site M),
Site H, Site N, and one to the west of La Jolla, California (Site P). The seasonal occurrence,
interannual variability, and relative abundance of calls for blue whales, fin whales, and beaked
whales were assessed.
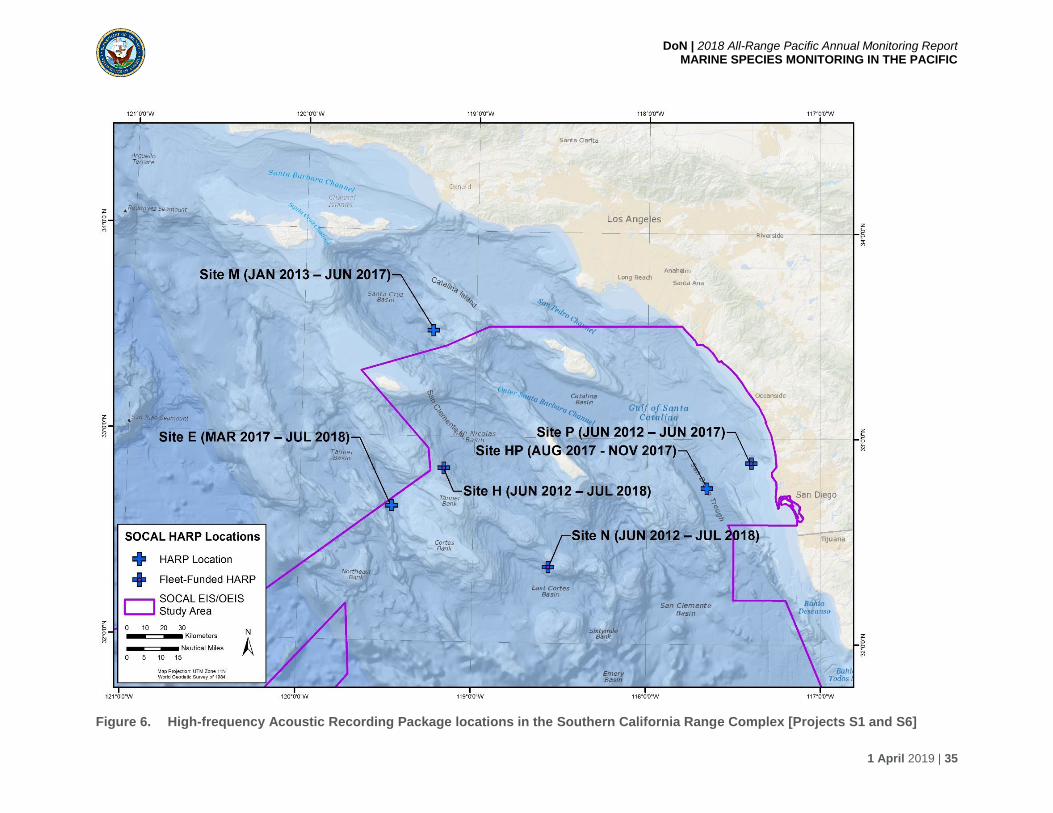
DoN | 2018 All-Range Pacific Annual Monitoring Report MARINE SPECIES MONITORING IN THE PACIFIC
1 April 2019 | 35
Figure 6. High-frequency Acoustic Recording Package locations in the Southern California Range Complex [Projects S1 and S6]

DoN | 2018 All-Range Pacific Annual Monitoring Report MARINE SPECIES MONITORING IN THE PACIFIC
1 April 2019 | 36
[S2] Cuvier's Beaked Whale Impact Assessment at the Southern California Offshore Antisubmarine Warfare Range (SOAR) [Schorr et al. 2018b; DiMarzio et al. 2019]
Visual and tagging surveys by small boat were performed by MarEcoTel at SOAR in 2018 as
part of an ongoing, long-term study to elucidate population size and trends of beaked whales
and fin whales that use the Range. Group sizes of Cuvier’s beaked whales was collected for
use in abundance and density estimation on SOAR (DiMarzio et al. 2019; see Project H2). In
2018, dive-reporting satellite tags (LIMPET SPLASH10-A, see Appendix A) were also deployed
on beaked whales and other odontocete species in order to study their distribution and diving
behavior, and to assess any behavioral changes associated with MFAS use. Staff from the
NUWC M3R program monitored SOAR hydrophones and directed the RHIB into areas where
marine mammal vocalizations were detected. NUWC continued an ongoing project to develop
estimates of abundance of Cuvier’s beaked whales at SOAR, including investigating monthly
and annual trends (see Project H2).
[S3] Beaked Whale Occurrence In SOCAL From Towed Passive Acoustic Data (formally Marine Mammal Surveys on CalCOFI Cruises) [Frasier et al. 2019]
The California Cooperative Oceanic Fisheries Investigations (CalCOFI) cruises, a joint agency
field effort, have been conducted off southern California since the 1950’s, and represent the
only continuous, seasonal marine mammal information available for southern California. More
information on the overall history of the CalCOFI program is available at: http://www.calcofi.net/.
Beginning in 2004, the Chief of Naval Operations Environmental Readiness Division funded the
collection of marine mammal visual and passive acoustic data during regularly scheduled
CalCOFI cruises, which occur four times per year. For the marine species monitoring program,
U.S. Pacific Fleet specifically funded visual and acoustic marine mammal data collection in
2013, 2014, 2015, and continuing from 2016 through 2018 (Campbell et al. 2014, 2015; Debich
et al. 2017; Hildebrand et al. 2018). Each CalCOFI cruise consists of sampling the same survey
tracklines including coverage offshore (>185 km). Visual and acoustic data are used to
characterize spatial and temporal distribution and habitat use patterns, seasonal and inter-
annual patterns of density, and abundance of cetaceans in the Southern California Bight (SCB).
In 2018, this project transitioned from focus on visual data to a focus on beaked whale
detections from towed array data. The goal is to qualitatively assess beaked whale occurrence
across the entire CalCOFI survey area based on location and season. From 2004 to 2018,
passive acoustic data were collected using a shipboard towed array four times per year during
52 CalCOFI cruises. In 2018, a subset of these data was examined for odontocete
vocalizations, in order to assess beaked whale occurrence in SOCAL. An automated detection
algorithm is currently in development to distinguish beaked whale echolocation clicks from
delphinid vocalizations and impulse signals associated with echosounders (Frasier et al. 2019).
[S4] Blue & Fin Whale Tagging and Analysis in Support of Marine Mammal Monitoring Across Multiple Navy Training Areas [Mate et al. 2018b]
OSU’s Marine Mammal Institute conducted a four-year tagging and tracking study on eastern
North Pacific blue and fin whales in the offshore areas of SOCAL from 2014 to 2017 (Mate et al.
2015, 2016, 2017a, 2018b). The purpose of this study was to characterize the movement
patterns, occurrence, and residence times of these whales within U.S. Navy training and testing
areas, as well as Biologically Important Areas (BIAs), along the U.S. West Coast. Whale
movements were also examined in relation to three environmental indices (the Oceanic Niño
DoN | 2018 All-Range Pacific Annual Monitoring Report MARINE SPECIES MONITORING IN THE PACIFIC
1 April 2019 | 37
Index (ONI), the Pacific Decadal Oscillation [PDO] index, and the North Pacific Gyre Oscillation
[NPGO] index) in order to characterize the influence of oceanographic and climatic events on
the distribution and movement behavior of the tracked whales over the four years of the project.
A Bayesian SSSM was applied to tag data to classify tracks as “transiting” or “Area Restricted
Searching” (ARS), a proxy for foraging behavior. Application of the SSSM also put tracks in a
biogeographic context and identified high-use areas in relation to bathymetric, oceanographic,
and climatic variables. Three types of Argos (satellite-monitored) tags were deployed: LO tags,
DM tags; and pop-off Advanced Dive Behavior (ADB) tags (see Appendix A). In 2018, a
detailed analysis was performed on data from tags deployed in 2017, and interannual
comparisons were made using results from 2014–2017. Tissue samples collected from blue and
fin whales tagged in 2014, 2015, 2016, and 2017 were also used for deoxyribonucleic acid
(DNA) profiling, including sex identification, sequencing of mitochondrial DNA (mtDNA) control
region haplotypes, and genotyping microsatellite loci. The DNA profiles were used to confirm
species identification and individual identity, and to investigate population structure (Mate et al.
2018b).
This is the same project completed for NWTT [N3].
[S5] SOCAL Soundscape Study [Wiggins et al. 2018]
Passive acoustic data collected June 2012 through June 2017 from the U.S. Navy-funded
HARP deployments (sites H, N, and P) by SIO were analyzed for metrics characterizing the
underwater soundscape in the SOCAL range (Figure 6) The underwater soundscape is
comprised of ambient (including whale vocalizations) and anthropogenic sound. Data
processing of the low-frequency ambient soundscape included calculating long (multi-year)
spectrograms, sound pressure spectrum level percentiles, and average sound pressure
spectrum levels. Detections of sounds over the 5-year recording period were summarized.
[S6] Guadalupe Fur Seal Satellite Tracking [Norris 2019]
In November 2018, Guadalupe fur seals (GFS) (Arctocephalus townsendi) were captured at
Punta Sur, Guadalupe Island (GI), Mexico, and instrumented with satellite-monitored telemetry
tags (SPLASH10-F, WC; see Appendix A) in order to characterize their at-sea distribution and
foraging behavior. Plastic identification tags were also attached to each animal for purposes of
individual identification if resighted. Weights, morphometric measurements, blood, fur, vibrissa,
and mucosal samples were collected from all satellite-tagged animals for health and trophic
ecology studies. Visual surveys of GFS were conducted at the San Benito Archipelago, Mexico,
from 11 to 14 July 2018, and from 30 July to 04 August 2018 at GI, in order to assess current
population size. Surveys were conducted on foot and from a small vessel. All adults, juveniles,
and pups were counted, and juveniles were assigned to demographic groups by experienced
observers. Two dedicated observers counted pups only, and pup counts were repeated or
averaged for sections of the coastline with significant differences between the two counters. A
correction factor based on substrate type was applied to account for animals missed during
visual surveys.
This is the same project conducted for NWTT [N4].

DoN | 2018 All-Range Pacific Annual Monitoring Report MARINE SPECIES MONITORING IN THE PACIFIC
1 April 2019 | 38
[S7] Humpback Whale Tagging in Support of Marine Mammal Monitoring Across Multiple Navy Training Areas in the Pacific Ocean [Mate et al. 2018a, c, d]
This is the same project completed for HRC, refer to Project H6.
NWTT
A timeline of all U.S. Pacific Fleet-funded monitoring tasks implemented in the NWTT in 2018 is
illustrated in Figure 7. See below for detailed project summaries.

DoN | 2018 All-Range Pacific Annual Monitoring Report MARINE SPECIES MONITORING IN THE PACIFIC
1 April 2019 | 39
Figure 7. Timeline of 2018 projects in the Northwest Training and Testing Study Area.
DoN | 2018 All-Range Pacific Annual Monitoring Report MARINE SPECIES MONITORING IN THE PACIFIC
1 April 2019 | 40
[N1] Humpback Whale Tagging in Support of Marine Mammal Monitoring Across Multiple Navy Training Areas in the Pacific Ocean [Mate et al. 2018a, c, d]
This is the same project completed for HRC, refer to Project H6.
[N2] Modeling Distribution of ESA-Listed Salmonids in the Pacific Northwest [Huff and Smith 2019]
This project leverages work funded by the U.S. Navy and NMFS Northwest Fisheries Science
Center (NWFSC). Salmon (Oncorhynchus spp.) are an important component of the diet of
endangered Southern Resident killer whales (SRKWs). The overlap of SRKWs and salmonids
in space and time affects the distribution and effort expended by foraging killer whales, and the
resulting impact on salmonid survival. In order to better understand the distribution of salmon in
the eastern North Pacific, Huff and Smith (2019) conducted a pilot study to test fish capture and
tag implanting at sea on salmonids between the Columbia River mouth and Grey’s Harbor,
Washington on five days in June 2018 and two in August 2018. Archival tags were deployed on
salmonids to demonstrate success capturing and tagging salmon, and to work through logistical
and technical considerations prior to the planned tagging season in May 2019. The project will
continue in fiscal year (FY)19 and include the following: capture, tag, and release salmonids;
determine the occurrence and timing of salmonids within the Navy training ranges; describe the
influence of environmental covariates on salmonid occurrence; and describe the occurrence of
salmonids in relation to SRKW distribution. The goal of this study is to use a combination of
acoustic and pop-up satellite tagging technology to provide critical information on spatial and
temporal distribution of salmonids to inform salmon management, U.S. Navy training activities,
and SRKW conservation.
[N3] Baleen (Blue & Fin) Whale Tagging and Analysis in Support of Marine Mammal Monitoring Across Multiple Navy Training Areas [Mate et al. 2018b]
This is the same project completed for SOCAL, refer to Project S4.
[N4] Guadalupe Fur Seal Satellite Tracking [Norris 2019]
This is the same project completed for SOCAL, refer to Project S6.
[N5] Modeling the Offshore Distribution of Southern Resident Killer Whales in the Pacific Northwest [Emmons et al., 2019]
Passive acoustic monitoring has been conducted along the U.S. west coast, from Central
California to Cape Flattery, to monitor movements of endangered Southern resident killer
whales (SRKW). Between 2008 and 2017, four to seventeen Ecological Acoustic Recorders
(EARs) have been deployed, depending on the year and available funding. EARs were
programmed to record on a 5-10% duty cycle depending on the year of deployment, resulting in
30-90 seconds of continuous recording every 300-600 seconds with a sampling rate of 25 kHz.
Data was reviewed both visually and aurally and both the biological and anthropogenic sound
sources present in the frequency range monitored were classified manually. Other marine
mammal calls were identified in including other ecotypes of killer whales, sperm whales, and
humpback whales, as well as Mid frequency active sonar (MFA) and explosive sounds

DoN | 2018 All-Range Pacific Annual Monitoring Report MARINE SPECIES MONITORING IN THE PACIFIC
1 April 2019 | 41
GOA TMAA
A timeline of all U.S. Pacific Fleet-funded monitoring tasks implemented in the GOA TMAA in
2018 is illustrated in Figure 8. See below for detailed project summaries.
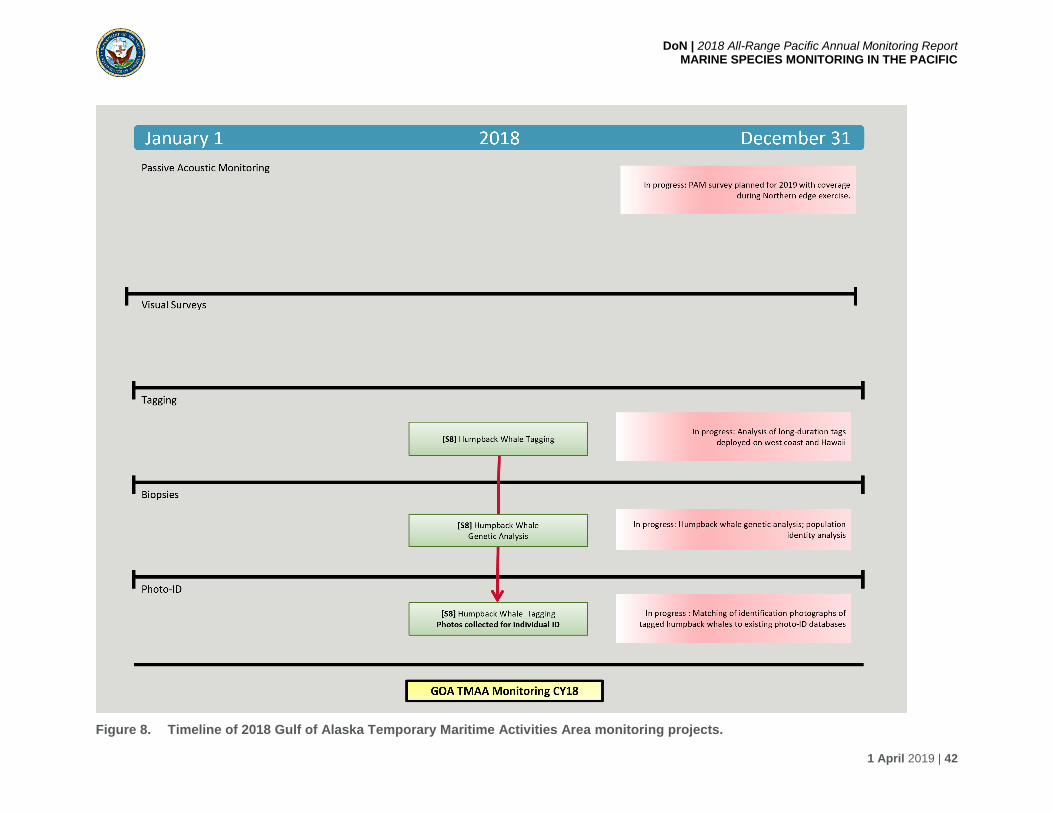
DoN | 2018 All-Range Pacific Annual Monitoring Report MARINE SPECIES MONITORING IN THE PACIFIC
1 April 2019 | 42
Figure 8. Timeline of 2018 Gulf of Alaska Temporary Maritime Activities Area monitoring projects.

DoN | 2018 All-Range Pacific Annual Monitoring Report MARINE SPECIES MONITORING IN THE PACIFIC
1 April 2019 | 43
[G1] Passive Acoustic Monitoring of Marine Mammals in GOA TMAA using Bottom-Mounted Devices [Rice et al. 2018b]
U.S. Navy-funded HARP deployments by SIO in the GOA TMAA have taken place since 2011, using
two to five HARPs (Baumann-Pickering et al. 2012; Debich et al. 2013, 2014; Wiggins et al. 2017;
Wiggins and Hildebrand 2018; Rice et al. 2015, 2018b). Passive acoustic data were collected from
three deployment locations (sites CB, AB, and QN) in the GOA during May to September 2015 and
April to September 2017 (Figure 9). The three sites included a continental slope site in deep water
(site CB), a deep offshore site at Quinn Seamount (site QN), and a deep-water site between sites
CB and QN (site AB) (Figure 9). The HARPs were deployed in a seafloor mooring configuration (an
equilateral triangle approximately 1 km per side) with the hydrophones suspended at least 10 m
above the seafloor utilizing recorder clock synchrony to enable marine mammal call localization and
tracking. Each HARP sampled continuously at 200 kHz except QN01 which sampled at 320 kHz.The
reporting for the 2017 deployments were previously presented (Rice et al. 2018b) in last year’s
annual monitoring report, so does not appear on the above timeline for 2018. The next deployment
of PAM in GOA TMAA is scheduled for 2019.
[G2] Humpback Whale Tagging in Support of Marine Mammal Monitoring Across Multiple Navy Training Areas in the Pacific Ocean [Mate et al. 2018a, c, d]
This is the same project completed for HRC, SOCAL, and NWTT, refer to Project H6.

DoN | 2018 All-Range Pacific Annual Monitoring Report MARINE SPECIES MONITORING IN THE PACIFIC
1 April 2019 | 44
Figure 9. High-frequency Acoustic Recording Package locations in the Gulf of Alaska Temporary Maritime Activities Area. [Project G1]

DoN | 2018 All-Range Pacific Annual Monitoring Report MARINE SPECIES MONITORING IN THE PACIFIC
1 April 2019 | 45
2.2 Results
Cumulative results and key conclusions from the Pacific monitoring projects are summarized
below. Project results are organized by CFC: occurrence, exposure, response, and
consequences; then by monitoring questions or objectives and the projects that address these.
Within each CFC, the regions are presented sequentially, as MITT, HSTT (HRC and SOCAL),
NWTT, and GOA TMAA. During this monitoring year, only two projects addressed the fourth
CFC, the issue of population consequences.
2.2.1 Conceptual Framework Category 1. Occurrence
The following sections summarize progress made this monitoring year to address the
conceptual framework category of occurrence of protected marine species in the four Pacific
training and testing study areas: MITT, HSTT, NWTT, and GOA TMAA. Progress is treated by
means of monitoring questions and objectives related to occurrence, and within this grouping, is
ordered by range complex.
In 2018, substantial progress was made with respect to improving knowledge of the occurrence
of protected marine species throughout the U.S. Navy’s training and testing study areas.
Multiple monitoring projects have resulted in information on the abundance, spatial distribution,
movement patterns, and habitat use of protected marine species. Considerable information
about species occurrence is now available from U.S. Navy-funded monitoring efforts across all
four study areas (MITT, HSTT, NWTT, and GOA TMAA). Residency time and occupancy
patterns of marine species have also been addressed by monitoring projects falling within this
CFC. The knowledge gained in this category provides the U.S. Navy with starting points to
estimate potential takes of protected marine species from anthropogenic activities.
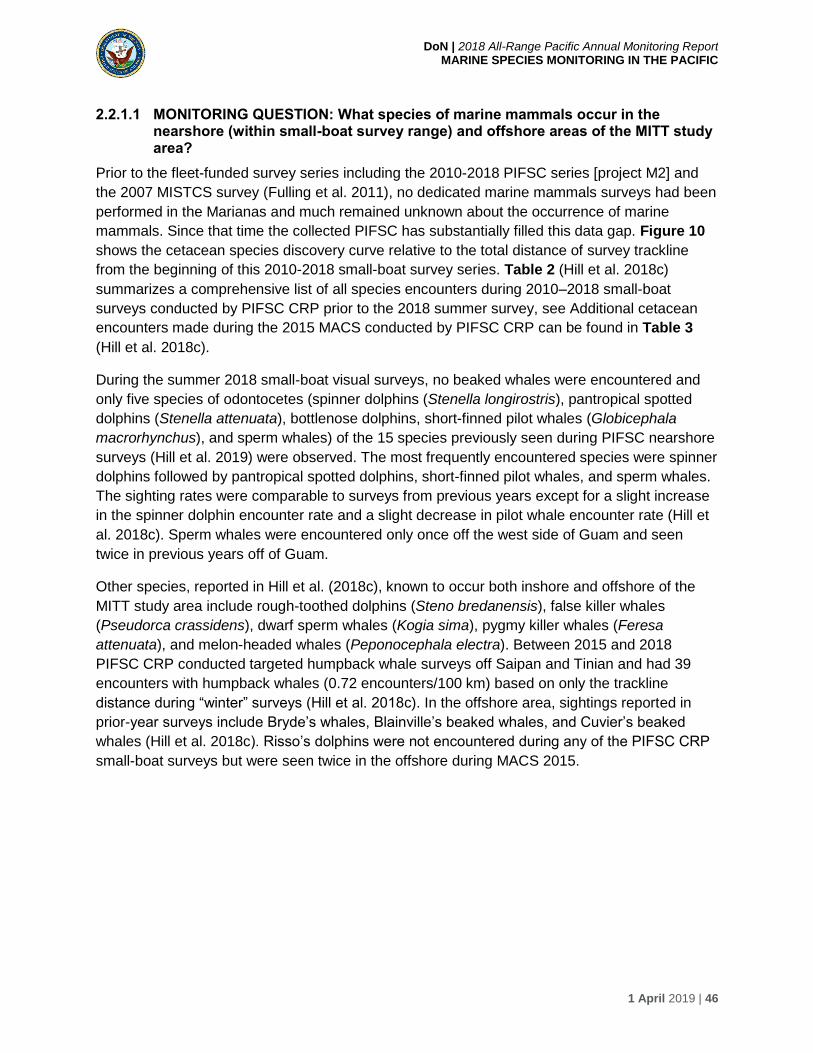
DoN | 2018 All-Range Pacific Annual Monitoring Report MARINE SPECIES MONITORING IN THE PACIFIC
1 April 2019 | 46
2.2.1.1 MONITORING QUESTION: What species of marine mammals occur in the nearshore (within small-boat survey range) and offshore areas of the MITT study area?
Prior to the fleet-funded survey series including the 2010-2018 PIFSC series [project M2] and
the 2007 MISTCS survey (Fulling et al. 2011), no dedicated marine mammals surveys had been
performed in the Marianas and much remained unknown about the occurrence of marine
mammals. Since that time the collected PIFSC has substantially filled this data gap. Figure 10
shows the cetacean species discovery curve relative to the total distance of survey trackline
from the beginning of this 2010-2018 small-boat survey series. Table 2 (Hill et al. 2018c)
summarizes a comprehensive list of all species encounters during 2010–2018 small-boat
surveys conducted by PIFSC CRP prior to the 2018 summer survey, see Additional cetacean
encounters made during the 2015 MACS conducted by PIFSC CRP can be found in Table 3
(Hill et al. 2018c).
During the summer 2018 small-boat visual surveys, no beaked whales were encountered and
only five species of odontocetes (spinner dolphins (Stenella longirostris), pantropical spotted
dolphins (Stenella attenuata), bottlenose dolphins, short-finned pilot whales (Globicephala
macrorhynchus), and sperm whales) of the 15 species previously seen during PIFSC nearshore
surveys (Hill et al. 2019) were observed. The most frequently encountered species were spinner
dolphins followed by pantropical spotted dolphins, short-finned pilot whales, and sperm whales.
The sighting rates were comparable to surveys from previous years except for a slight increase
in the spinner dolphin encounter rate and a slight decrease in pilot whale encounter rate (Hill et
al. 2018c). Sperm whales were encountered only once off the west side of Guam and seen
twice in previous years off of Guam.
Other species, reported in Hill et al. (2018c), known to occur both inshore and offshore of the
MITT study area include rough-toothed dolphins (Steno bredanensis), false killer whales
(Pseudorca crassidens), dwarf sperm whales (Kogia sima), pygmy killer whales (Feresa
attenuata), and melon-headed whales (Peponocephala electra). Between 2015 and 2018
PIFSC CRP conducted targeted humpback whale surveys off Saipan and Tinian and had 39
encounters with humpback whales (0.72 encounters/100 km) based on only the trackline
distance during “winter” surveys (Hill et al. 2018c). In the offshore area, sightings reported in
prior-year surveys include Bryde’s whales, Blainville’s beaked whales, and Cuvier’s beaked
whales (Hill et al. 2018c). Risso’s dolphins were not encountered during any of the PIFSC CRP
small-boat surveys but were seen twice in the offshore during MACS 2015.
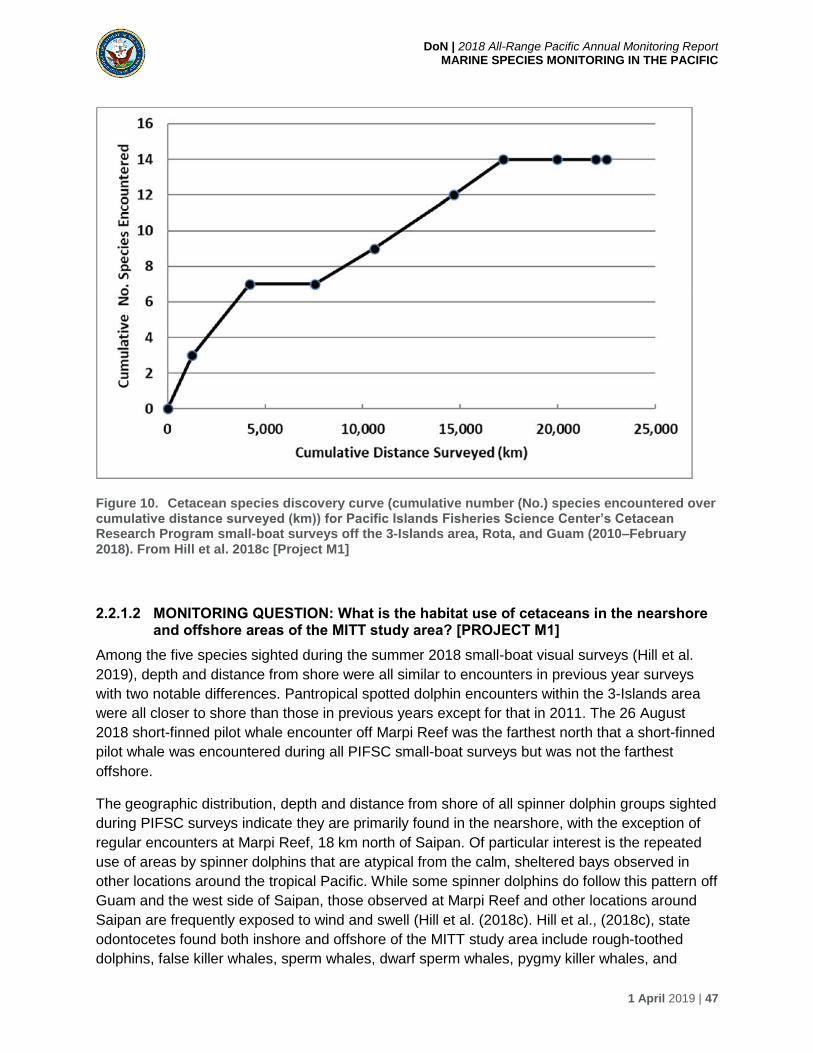
DoN | 2018 All-Range Pacific Annual Monitoring Report MARINE SPECIES MONITORING IN THE PACIFIC
1 April 2019 | 47
Figure 10. Cetacean species discovery curve (cumulative number (No.) species encountered over cumulative distance surveyed (km)) for Pacific Islands Fisheries Science Center’s Cetacean Research Program small-boat surveys off the 3-Islands area, Rota, and Guam (2010–February 2018). From Hill et al. 2018c [Project M1]
2.2.1.2 MONITORING QUESTION: What is the habitat use of cetaceans in the nearshore and offshore areas of the MITT study area? [PROJECT M1]
Among the five species sighted during the summer 2018 small-boat visual surveys (Hill et al.
2019), depth and distance from shore were all similar to encounters in previous year surveys
with two notable differences. Pantropical spotted dolphin encounters within the 3-Islands area
were all closer to shore than those in previous years except for that in 2011. The 26 August
2018 short-finned pilot whale encounter off Marpi Reef was the farthest north that a short-finned
pilot whale was encountered during all PIFSC small-boat surveys but was not the farthest
offshore.
The geographic distribution, depth and distance from shore of all spinner dolphin groups sighted
during PIFSC surveys indicate they are primarily found in the nearshore, with the exception of
regular encounters at Marpi Reef, 18 km north of Saipan. Of particular interest is the repeated
use of areas by spinner dolphins that are atypical from the calm, sheltered bays observed in
other locations around the tropical Pacific. While some spinner dolphins do follow this pattern off
Guam and the west side of Saipan, those observed at Marpi Reef and other locations around
Saipan are frequently exposed to wind and swell (Hill et al. (2018c). Hill et al., (2018c), state
odontocetes found both inshore and offshore of the MITT study area include rough-toothed
dolphins, false killer whales, sperm whales, dwarf sperm whales, pygmy killer whales, and

DoN | 2018 All-Range Pacific Annual Monitoring Report MARINE SPECIES MONITORING IN THE PACIFIC
1 April 2019 | 48
melon-headed whales. Between 2015 and 2018 PIFSC CRP conducted targeted humpback
whale surveys off Saipan and Tinian and had 39 encounters with humpback whales (0.72
encounters/100 km) based on only the trackline distance during “winter” surveys (Hill et al.
2018c). In the offshore area, sightings reported in prior year surveys include Bryde’s whales,
Blainville’s beaked whales, and Cuvier’s beaked whales (Hill et al. 2018c). Risso’s dolphins
were not encountered during any of the PIFSC CRP small-boat surveys but were seen twice in
the offshore during MACS 2015.
For a comprehensive list of all species encounters during 2010–2018 small-boat surveys
conducted by PIFSC CRP prior to the 2018 summer survey, see Table 2. Figure 11 shows all
small-boat survey tracklines and cetacean sightings during this period. Additional cetacean
encounters made during the 2015 Mariana Archipelago Cetacean Survey conducted by PIFSC
CRP can be found in Table 3.
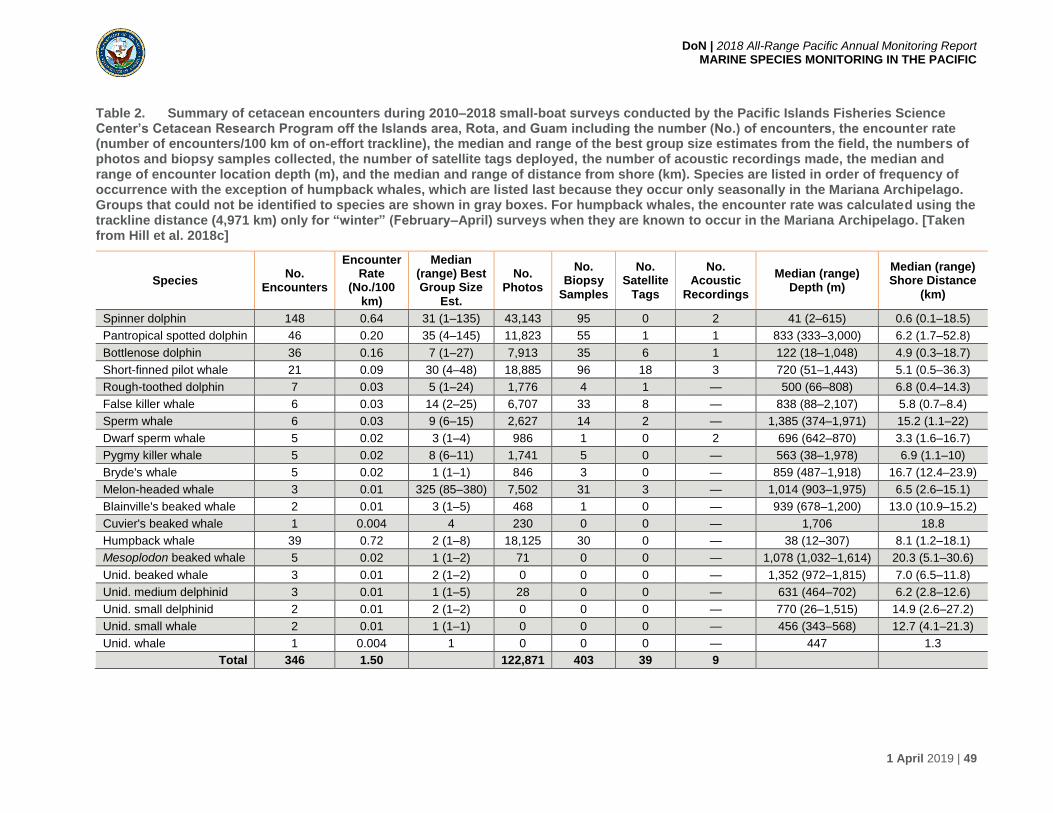
DoN | 2018 All-Range Pacific Annual Monitoring Report MARINE SPECIES MONITORING IN THE PACIFIC
1 April 2019 | 49
Table 2. Summary of cetacean encounters during 2010–2018 small-boat surveys conducted by the Pacific Islands Fisheries Science Center’s Cetacean Research Program off the Islands area, Rota, and Guam including the number (No.) of encounters, the encounter rate (number of encounters/100 km of on-effort trackline), the median and range of the best group size estimates from the field, the numbers of photos and biopsy samples collected, the number of satellite tags deployed, the number of acoustic recordings made, the median and range of encounter location depth (m), and the median and range of distance from shore (km). Species are listed in order of frequency of occurrence with the exception of humpback whales, which are listed last because they occur only seasonally in the Mariana Archipelago. Groups that could not be identified to species are shown in gray boxes. For humpback whales, the encounter rate was calculated using the trackline distance (4,971 km) only for “winter” (February–April) surveys when they are known to occur in the Mariana Archipelago. [Taken from Hill et al. 2018c]
Species No.
Encounters
Encounter Rate
(No./100
km)
Median (range) Best Group Size
Est.
No. Photos
No. Biopsy
Samples
No. Satellite
Tags
No. Acoustic
Recordings
Median (range) Depth (m)
Median (range) Shore Distance
(km)
Spinner dolphin 148 0.64 31 (1–135) 43,143 95 0 2 41 (2–615) 0.6 (0.1–18.5)
Pantropical spotted dolphin 46 0.20 35 (4–145) 11,823 55 1 1 833 (333–3,000) 6.2 (1.7–52.8)
Bottlenose dolphin 36 0.16 7 (1–27) 7,913 35 6 1 122 (18–1,048) 4.9 (0.3–18.7)
Short-finned pilot whale 21 0.09 30 (4–48) 18,885 96 18 3 720 (51–1,443) 5.1 (0.5–36.3)
Rough-toothed dolphin 7 0.03 5 (1–24) 1,776 4 1 — 500 (66–808) 6.8 (0.4–14.3)
False killer whale 6 0.03 14 (2–25) 6,707 33 8 — 838 (88–2,107) 5.8 (0.7–8.4)
Sperm whale 6 0.03 9 (6–15) 2,627 14 2 — 1,385 (374–1,971) 15.2 (1.1–22)
Dwarf sperm whale 5 0.02 3 (1–4) 986 1 0 2 696 (642–870) 3.3 (1.6–16.7)
Pygmy killer whale 5 0.02 8 (6–11) 1,741 5 0 — 563 (38–1,978) 6.9 (1.1–10)
Bryde's whale 5 0.02 1 (1–1) 846 3 0 — 859 (487–1,918) 16.7 (12.4–23.9)
Melon-headed whale 3 0.01 325 (85–380) 7,502 31 3 — 1,014 (903–1,975) 6.5 (2.6–15.1)
Blainville's beaked whale 2 0.01 3 (1–5) 468 1 0 — 939 (678–1,200) 13.0 (10.9–15.2)
Cuvier's beaked whale 1 0.004 4 230 0 0 — 1,706 18.8
Humpback whale 39 0.72 2 (1–8) 18,125 30 0 — 38 (12–307) 8.1 (1.2–18.1)
Mesoplodon beaked whale 5 0.02 1 (1–2) 71 0 0 — 1,078 (1,032–1,614) 20.3 (5.1–30.6)
Unid. beaked whale 3 0.01 2 (1–2) 0 0 0 — 1,352 (972–1,815) 7.0 (6.5–11.8)
Unid. medium delphinid 3 0.01 1 (1–5) 28 0 0 — 631 (464–702) 6.2 (2.8–12.6)
Unid. small delphinid 2 0.01 2 (1–2) 0 0 0 — 770 (26–1,515) 14.9 (2.6–27.2)
Unid. small whale 2 0.01 1 (1–1) 0 0 0 — 456 (343–568) 12.7 (4.1–21.3)
Unid. whale 1 0.004 1 0 0 0 — 447 1.3
Total 346 1.50
122,871 403 39 9

DoN | 2018 All-Range Pacific Annual Monitoring Report MARINE SPECIES MONITORING IN THE PACIFIC
1 April 2019 | 50
Table 3. Summary of cetacean encounters during the 2015 Mariana Archipelago Cetacean Survey conducted by the Pacific Islands Fisheries Science Center’s Cetacean Research Program including the number (No.) of encounters, the median and range of the best group size estimates from the field, the numbers of photos and biopsy samples collected, the number of satellite tags deployed, the number of acoustic recordings made, the number of single-species acoustic recordings, the median and range of encounter location depth (m), and the median and range of distance from shore distance (km). Species are listed in order of frequency of occurrence. Groups not identified to species are shown in gray. [Taken from Hill et al. 2018c]
Species No.
Encounters
Median (range) Best Group
Size Est.
No. Photos
No. Biopsy
Samples No. Tags
No. Acoustic
Recordings
Median (range) Depth (m)
Median (range) Shore Distance (km)
Spinner dolphin 12 22 (6–47) 467 12 0 7 27 (14–416) 0.2 (0.1–0.8)
Melon-headed whale 4 167 (90–268) 2,462 27 0 4 2,500 (1,562–3,383) 40.1 (18.0–71.3)
Rough-toothed dolphin 4 16 (12–27) 1,072 6 0 2 559 (30–1,955) 2.1 (0.4–16.3)
Bottlenose dolphin 3 10 (9–20) 45 2 0 2 671 (98–961) 2.9 (1.1–35)
Bryde's whale 3 2 (1–4) 785 0 0 2* 3,198 (844–3,762) 45.9 (9.0–71.0)
Sperm whale 3 1 (1–9) 461 1 0 2 2,594 (1,578–2,975) 31.6 (14.3–75.1)
Blainville's beaked whale 2 4 (3–4) 23 0 0 1 779 (267–1,290) 2.0 (0.5–3.5)
False killer whale 2 19 (6–31) 1,285 3 1 1 2,459 (2,457–2,461) 26.0 (12.5–39.5)
Risso's dolphin 2 3(1–5) 8 0 0 1 3,496 (2,594–4,398) 84.8 (75.1–94.5)
Mesoplodon beaked whale 5 1 8 0 0 1 1,294 (914–1,699) 3.5 (0.8–12.7)
Unid. large whale 2 1 0 0 0 — 2,734 (1,883–3,585) 39.6 (6.7–72.6)
Unid. rorqual 1 1 0 0 0 — 2,047 79.7
Unid. dolphin 1 2 0 0 0 — 399 37.5
Unid. small dolphin 1 17 0 0 0 — 6,298 67.1
Total 45
6,616 51 1 23

DoN | 2018 All-Range Pacific Annual Monitoring Report MARINE SPECIES MONITORING IN THE PACIFIC
1 April 2019 | 51
Figure 11. Tracks and cetacean encounter locations during the Pacific Islands Fisheries Science Center’s Cetacean Research Program small-boat surveys of the southernmost Mariana Archipelago (2010–2018). From Hill et al. 2018c [Project M1]
2.2.1.3 MONITORING QUESTION: What is the seasonal occurrence and movements of baleen whales in the nearshore and offshore areas of the MITT study area? [PROJECT M1]
There were no encounters of baleen whales during the 2018 summer small-boat visual surveys
(Hill et al. 2019). Hill et al. (2018c) described 2 species of baleen whales sighted in the Mariana
Archipelago, Bryde’s whale and humpback whale. Bryde’s whales were seen in all months of
the January–April Mariana Islands Sea Turtle and Cetacean Survey (MISTCS) survey (Fulling et
al. 2011), in May during MACS 2015, and in August–September during small-boat surveys and
are therefore likely to be in the Mariana Archipelago year-round.
Humpback whales only began to be encountered after initiation of dedicated small-boat winter
surveys off Saipan and Tinian between 2015 and 2018 by PIFSC CRP, which confirmed
humpback whales are using the Mariana Archipelago as a breeding ground during the winter,
though this species was not sighted during earlier winter surveys in nearby waters in 2010
(Ligon et al. 2011). The median depth at locations where humpback whales were encountered
was 1,078 m (range = 1,032–1,614 m) and the median distance from shore was 8.1 km (range
= 1.2–18.1 km) (Table 2). All of the humpback whale encounters were off Saipan in 2015–2018
with most at CK Reef or Marpi Reef. The humpback whale photo-identification catalog currently
comprises of 43 non-calf individuals, with flukes available for 29 of these, and new individuals
are identified each season. Seven individuals were re-sighted across years. Humpback whales
DoN | 2018 All-Range Pacific Annual Monitoring Report MARINE SPECIES MONITORING IN THE PACIFIC
1 April 2019 | 52
were acoustically detected within the Pacific Islands Passive Acoustic Network (PIPAN) data
from Saipan and Tinian in December–April in all years analyzed to date (2010–2013) (Oleson et
al. 2015).
2.2.1.4 MONITORING QUESTION: What is the abundance and population structure of marine mammals in the MITT study area? [PROJECTS M1, M4]
During the 2018 summer small-boat surveys, more photos for photo-identification and more
biopsy samples off Guam for genetic analyses were collected (Hill et al. 2019). The numbers of
distinct individuals cataloged for each species collected during 2010 and 2018 small-boat
surveys conducted by PIFSC CRP are listed in Table 4. No mark-recapture abundance
estimates exist to date but three species (spinner dolphins, bottlenose dolphins and short-finned
pilot whales) were considered candidates for analysis given the existing photo-identification
data, and five additional species (rough-toothed dolphins, false killer whales, sperm whales,
pygmy killer whales, and humpback whales) were considered good candidates for mark-
recapture analysis with additional data collected. Seven species (pantropical spotted dolphin,
dwarf sperm whale, Bryde’s whale, melon-headed whale, Blainville’s beaked whale, Cuvier’s
beaked whale, and Risso’s dolphin), were considered poor candidates for mark-recapture
methods of abundance and may instead be more suited for large-scale ship-based line-transect
survey methodology (Hill et al. 2018c). Abundance estimates using large-scale ship-based line-
transect survey methodology are reported in Table 4 for seven species within the Mariana
Archipelago (pantropical spotted dolphin, bottlenose dolphin, short-finned pilot whale, rough-
toothed dolphin, false killer whale, sperm whale, and melon-headed whale) (Fulling et al. 2011).
Unique full-fluke images exist for 29 humpback whales in Mariana Archipelago, seven of which
were encountered in more than one year. The cumulative number of humpback whales sighted
each year is still increasing relative to the cumulative number of distinctive individuals (Figure
12) indicating that the photo-identification catalog is still growing.
Clicks recorded from Blainville’s beaked whales from the Marianas (Saipan, Tinian and Pagan)
were compared to recordings of beaked whales from other areas of the North Pacific and North
Atlantic (Baumann-Pickering et al., 2018d). An unsupervised learning algorithm was utilized to
examine within-site and across-site variability, then recurrent mean spectra from each site were
compared. The peak frequency of mean spectra varied from 32 to 39 kHz, and this variability
was found to have a negative linear relationship with geographic latitude where the recording
was collected. Outliers from this trend were hypothesized to result from transiting individuals or
groups of animals from other regions. Call variability was hypothesized to result from
population-level differences that may be related to body size differences, or differences in prey
size. Additionally, the beaked whale pulse type known as BW38, recorded at both the equator
Pacific and Onslow Bay, was hypothesized to be generated by Blainville’s beaked whales.

DoN | 2018 All-Range Pacific Annual Monitoring Report MARINE SPECIES MONITORING IN THE PACIFIC
1 April 2019 | 53
Table 4. The total number of distinct individuals for each species encountered during PIFSC CRP 2010 – 2018 small-boat surveys (Hill et al. 2018) and reported large-scale ship-based line-transect survey abundance estimates (CV = coefficient of variation) (Fulling et al. 2011).
Species PIFSC CRP Cataloged Individuals
(Hill et al. 2018) Line-Transect Abundance
Estimate (Fulling et al. 2011)
Spinner dolphin 307 n/a
Pantropical spotted dolphin n/a 12,981 (CV = 0.70)
Bottlenose dolphin 61 122 (CV=0.99)
Short-finned pilot whale 206 909 (CV=0.68)
Rough-toothed dolphin 7 166 (CV=0.89)
False killer whale 57 637 (CV = 0.74)
Sperm whale 11 705 (CV = 0.60)
Dwarf sperm whale n/a n/a
Pygmy killer whale 8 n/a
Bryde's whale n/a n/a
Melon-headed whale 146 2,455 (CV = 0.702)
Blainville's beaked whale n/a n/a
Cuvier's beaked whale n/a n/a
Risso's dolphin not encountered n/a
Humpback whale 43 n/a
Figure 12. The cumulative number of individual non-calf humpback whales sighted in each year (2007, 2015–2018) versus the cumulative number of distinctive individuals. From Hill et al. 2018c [Project M1]
0
5
10
15
20
25
30
35
40
45
50
0 10 20 30 40 50 60
Cu
mu
lati
ve N
o. o
f D
isti
nct
ive
Ind
ivid
ual
s
Cumulative No. of Yearly Sightings

DoN | 2018 All-Range Pacific Annual Monitoring Report MARINE SPECIES MONITORING IN THE PACIFIC
1 April 2019 | 54
Hill et al. (2018c) concluded that insufficient data from photo-identification, genetics and satellite
tagging exist to assess population structure for pantropical spotted dolphins, rough-toothed
dolphins, false killer whales, sperm whales, dwarf sperm whales, pygmy killer whales, Bryde’s
whales, melon-headed whales, Blainville’s and Cuvier’s beaked whales, and Risso’s dolphins.
The photo-identification and genetic data together for spinner dolphins appear to support
designation of two demographically independent populations, one that includes the 3-Islands
area and Rota and the other around Guam. Although the sample size of biopsy samples from
the northern Mariana Archipelago is small, if there is a significant difference between the
northern and southern islands, it may be possible to detect additional population structure. Hill
et al. (2018c), based on previous work by Martien et al. (2014), determined that the common
bottlenose dolphin genetic data do not indicate the presence of population structure within the
southern Mariana Archipelago and that more samples would need to be collected from the
northern portions of the Archipelago and offshore. The encounter and photo-ID data show that
individual common bottlenose dolphins are moving between all of the southern islands (3-
Islands area, Rota, and Guam). Among short-finned pilot whales, the photo-ID and satellite-tag
data suggest that there is a connected population within the southern portion of the Archipelago
with groups of occasional visitors (Hill et al. 2018c), while the genetic data found strong
mitochondrial differentiation between short-finned pilot whales encountered off the 3-Islands
area and Guam and Rota (Martien et al. 2014). Among the eight individuals in the PIFSC CRP
pygmy killer whale catalog, six were part of the same group seen in 3 consecutive years off of
Guam, suggesting a strong affinity to Guam (Hill et al. 2018c).
Hill et al. (in prep) presented results from humpback whale fluke matching and genetic analysis
of biopsy samples from the winter season small-boat survey series. Five mitochondrial DNA
haplotypes (A-, A+, A3, E1, F2) are common in the North Pacific, whereas two (E5, E6), are
relatively more localized to the western North Pacific but are also present in other regions of the
North Pacific. Haplotype frequencies from these individuals showed the greatest identity with
the Ogasawara breeding ground and the Commander Islands feeding ground. Matching of fluke
images from the Mariana Archipelago photo-identification catalog to were made to existing
catalogs from the Philippines, Japan, and Russia revealing connectivity to all locations.
2.2.1.5 MONITORING QUESTION: What is the occurrence and habitat use of sea turtles
in the MITT Study Area? [PROJECT M2]
With assistance from regional partners, PIFSC Marine Turtle Biology and Assessment Program
conducted sea turtle surveys and in-water captures of green turtles and hawksbill turtles in
August 2018 (Figure 13) (S.L. Martin et al. 2019), with tags deployed on 13 green sea turtles of
different ages during the 5 d of field effort (Figure 13).
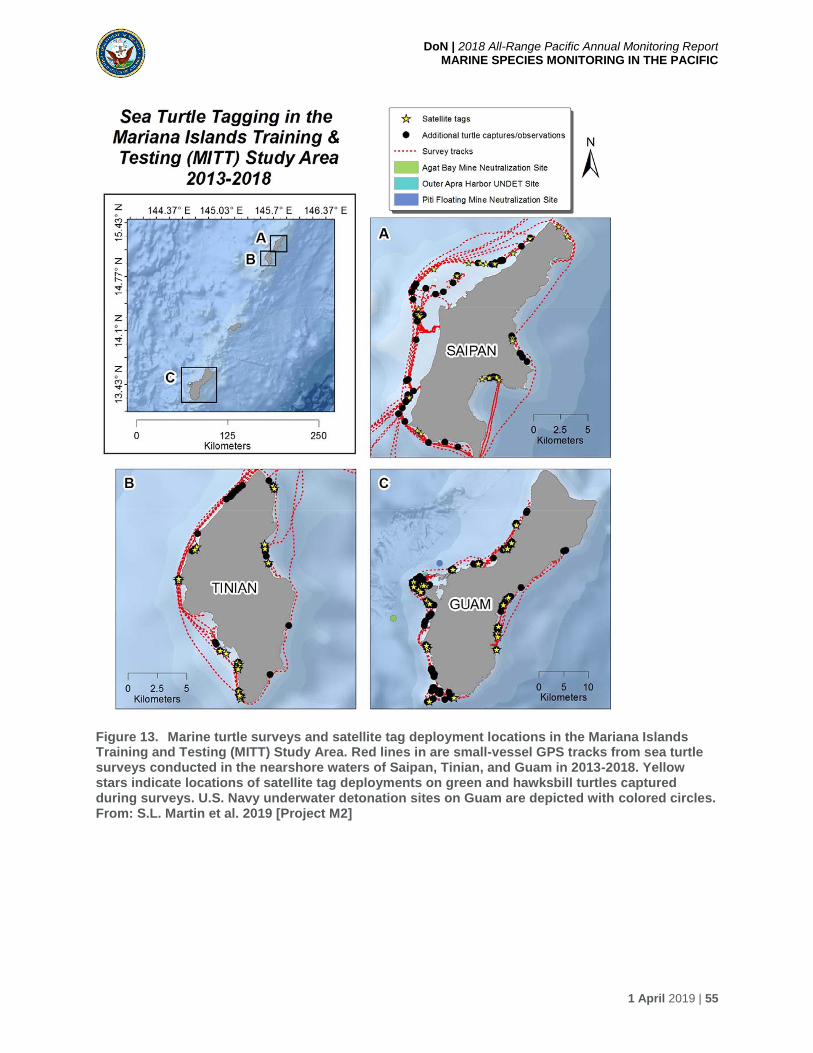
DoN | 2018 All-Range Pacific Annual Monitoring Report MARINE SPECIES MONITORING IN THE PACIFIC
1 April 2019 | 55
Figure 13. Marine turtle surveys and satellite tag deployment locations in the Mariana Islands Training and Testing (MITT) Study Area. Red lines in are small-vessel GPS tracks from sea turtle surveys conducted in the nearshore waters of Saipan, Tinian, and Guam in 2013-2018. Yellow stars indicate locations of satellite tag deployments on green and hawksbill turtles captured during surveys. U.S. Navy underwater detonation sites on Guam are depicted with colored circles. From: S.L. Martin et al. 2019 [Project M2]

DoN | 2018 All-Range Pacific Annual Monitoring Report MARINE SPECIES MONITORING IN THE PACIFIC
1 April 2019 | 56
Turtles were observed in most locations that the team has surveyed around Guam, Saipan, and
Tinian (Figure 13). Over the course of this multi-year project (2013–2018), 41 d were spent in
the field and 438 turtles encountered. Of the 139 total captures, 45 were captured but not
instrumented with a tag, and 94 turtles were captured and outfitted with a satellite tag
(30 Saipan, 24 Tinian, 30 Guam). 71 percent were identified as green turtles, 5 percent as
hawksbill turtles, and 24 percent as “unknown” species, but either green or hawksbill turtles.
The demographic data for green and hawksbill turtle captured from 2013 to 2018 are typical for
turtles throughout the Marianas Archipelago. The growth rate analysis from the capture-mark-
recapture data estimates residency time of 17 years (13–28, 95 percent CI) from recruitment to
maturity. Most of the turtles captured during these field efforts are juveniles and subadults,
which are on their developmental foraging grounds.
Tagged green and hawksbill turtles, mostly juveniles and sub-adults, spent most of their time in
waters shallower than 25 m and with temperatures of 28 to 31 degrees Celsius (°C). While both
species made dives to 100 m, hawksbill turtles spent more time in deeper and warmer waters
with longer dive durations than green turtles.
Data from satellite tags deployed in 2018 in Guam and Saipan will be analyzed in 2019 with
final analysis and reporting for 2013-2018 data expected in 2020.
2.2.1.6 MONITORING QUESTION: Are there locations of greater cetacean and/or sea turtle concentration in the MITT study area? [PROJECT M2]
Consistent with previous years of survey effort (e.g., Jones et al. 2013; S.L. Martin et al. 2016a;
Martin and Jones 2017), the areas of highest turtle density continue to be: 1) in Guam, the
waters inside Apra Harbor near San Luis, Gab Gab, out to Spanish Steps including Dadi and
Tipalao beaches outside of the harbor, as well as Cocos Lagoon and Achang Bay; (2) in
Saipan, the area stretching from the Balisa Channel to Managaha Island, as well as Lao Bay;
and (3) off the west coast of Tinian. Patch reef communities dominate these areas where turtles
both rest and feed. Based on KIWB estimates, tagged green and hawksbill turtles exhibit high
site fidelity and limited movements off Guam, Tinian, and Saipan. While most tagged individuals
remained within a 1 to 3 km2 area for the life of the tag, diversity exists in turtle movement
patterns, with several long-range movements. For example, one turtle tagged off Tinian moved
more than 2,000 km to Ant Atoll adjacent to Pohnpei, Federated States of Micronesia (Figure
14). In related work, from an analysis of over 500 in-water captures from 2006 to 2014,
Summers et al. (2017) suggest that turtles recruit to the nearshore waters of the Mariana
Islands around 34 to 36 centimeters (cm) straight-carapace-length (SCL) and depart to adult
foraging and nesting grounds around 78 to 81 cm SCL, remaining in the nearshore waters for
an estimated 17 years between recruitment and departure at maturity.
Data from satellite tags deployed in 2018 in Guam and Saipan will be analyzed in 2019 with
final analysis and reporting for 2013-2018 data expected in 2020.

DoN | 2017 All-Range Pacific Annual Monitoring Report MARINE SPECIES MONITORING IN THE PACIFIC
1 April 2019 | 57
Figure 14. Migration of hawksbill turtles from Tinian to Guam and Pohnpei. (A) A 61.7 cm hawksbill turtle (Argos ID: 85493) was tagged 20 August 2013 at Fleming Point, Tinian. (B) A 72.3 cm hawksbill turtle (Argos ID: 138963) was tagged 21 July 2014 at Fleming Point, Tinian. From: S.L. Martin et al. 2019 [Project M2]
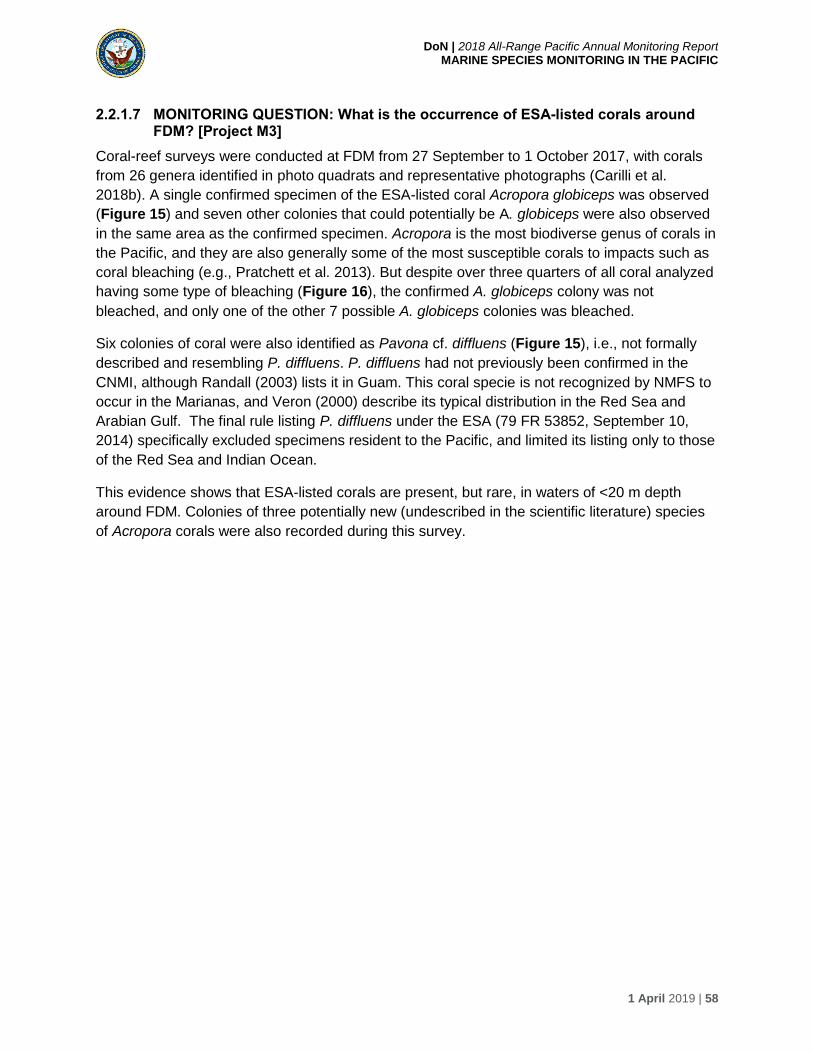
DoN | 2018 All-Range Pacific Annual Monitoring Report MARINE SPECIES MONITORING IN THE PACIFIC
1 April 2019 | 58
2.2.1.7 MONITORING QUESTION: What is the occurrence of ESA-listed corals around FDM? [Project M3]
Coral-reef surveys were conducted at FDM from 27 September to 1 October 2017, with corals
from 26 genera identified in photo quadrats and representative photographs (Carilli et al.
2018b). A single confirmed specimen of the ESA-listed coral Acropora globiceps was observed
(Figure 15) and seven other colonies that could potentially be A. globiceps were also observed
in the same area as the confirmed specimen. Acropora is the most biodiverse genus of corals in
the Pacific, and they are also generally some of the most susceptible corals to impacts such as
coral bleaching (e.g., Pratchett et al. 2013). But despite over three quarters of all coral analyzed
having some type of bleaching (Figure 16), the confirmed A. globiceps colony was not
bleached, and only one of the other 7 possible A. globiceps colonies was bleached.
Six colonies of coral were also identified as Pavona cf. diffluens (Figure 15), i.e., not formally
described and resembling P. diffluens. P. diffluens had not previously been confirmed in the
CNMI, although Randall (2003) lists it in Guam. This coral specie is not recognized by NMFS to
occur in the Marianas, and Veron (2000) describe its typical distribution in the Red Sea and
Arabian Gulf. The final rule listing P. diffluens under the ESA (79 FR 53852, September 10,
2014) specifically excluded specimens resident to the Pacific, and limited its listing only to those
of the Red Sea and Indian Ocean.
This evidence shows that ESA-listed corals are present, but rare, in waters of <20 m depth
around FDM. Colonies of three potentially new (undescribed in the scientific literature) species
of Acropora corals were also recorded during this survey.
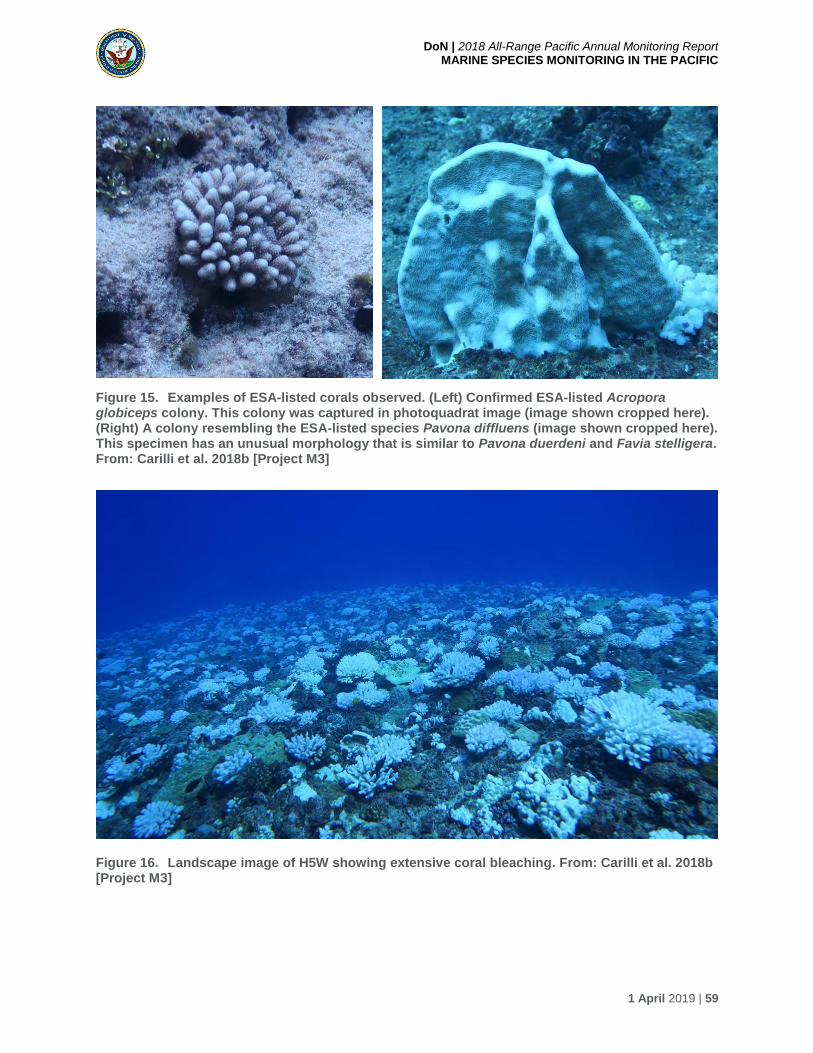
DoN | 2018 All-Range Pacific Annual Monitoring Report MARINE SPECIES MONITORING IN THE PACIFIC
1 April 2019 | 59
Figure 15. Examples of ESA-listed corals observed. (Left) Confirmed ESA-listed Acropora globiceps colony. This colony was captured in photoquadrat image (image shown cropped here). (Right) A colony resembling the ESA-listed species Pavona diffluens (image shown cropped here). This specimen has an unusual morphology that is similar to Pavona duerdeni and Favia stelligera. From: Carilli et al. 2018b [Project M3]
Figure 16. Landscape image of H5W showing extensive coral bleaching. From: Carilli et al. 2018b [Project M3]

DoN | 2018 All-Range Pacific Annual Monitoring Report MARINE SPECIES MONITORING IN THE PACIFIC
1 April 2019 | 60
2.2.1.8 MONITORING QUESTION: What are the spatial-movement and habitat-use patterns (e.g., island-associated or open-ocean, restricted ranges vs. large ranges) of species that are exposed to MFAS, and how do these patterns influence exposure and potential responses? [PROJECT H4]
During 6–20 August 2018, small-vessel visual surveys were confined to the southern-most part
of PMRF and areas south of PMRF, due to high seas associated with easterly trade winds
(Baird et al. 2018b). Most (79 percent) of the survey effort was conducted in waters less than
1,000 m in bottom depth, resulting in 57 sightings of seven species of odontocetes (rough-
toothed dolphins, bottlenose dolphins, short-finned pilot whales, spinner dolphins, melon-
headed whales, sperm whales, and spotted dolphins), 24 of them on PMRF (Figure 17).
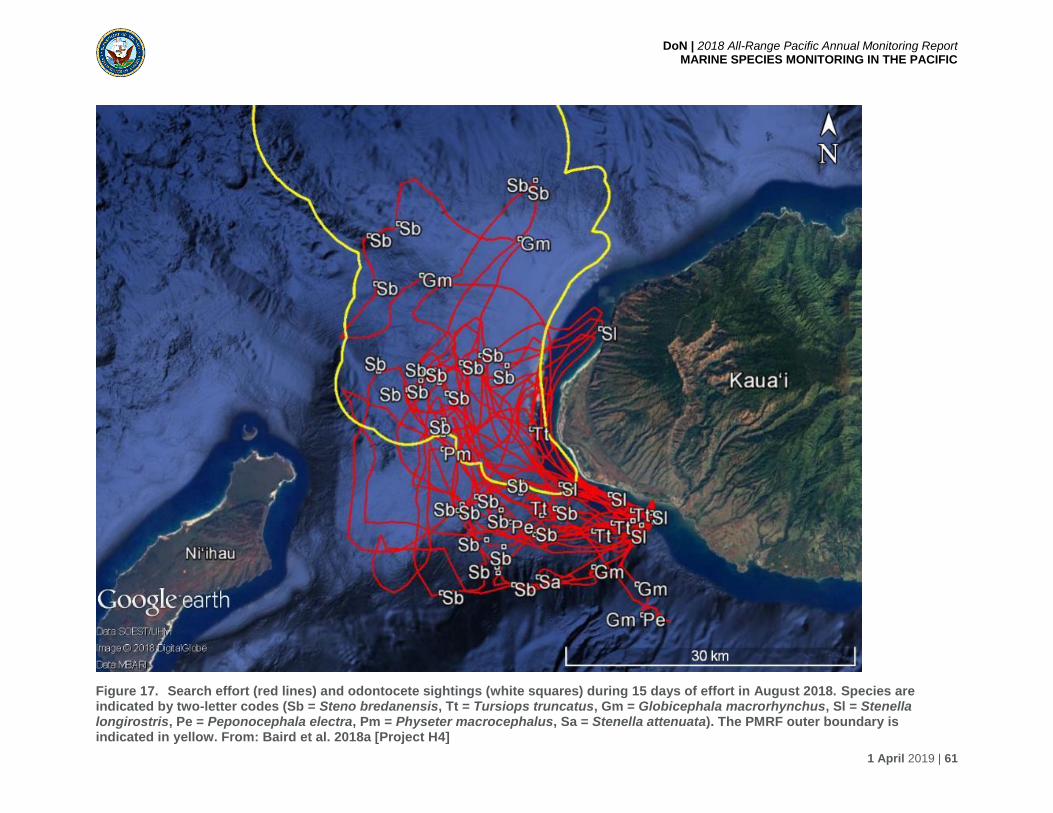
DoN | 2018 All-Range Pacific Annual Monitoring Report MARINE SPECIES MONITORING IN THE PACIFIC
1 April 2019 | 61
Figure 17. Search effort (red lines) and odontocete sightings (white squares) during 15 days of effort in August 2018. Species are indicated by two-letter codes (Sb = Steno bredanensis, Tt = Tursiops truncatus, Gm = Globicephala macrorhynchus, Sl = Stenella longirostris, Pe = Peponocephala electra, Pm = Physeter macrocephalus, Sa = Stenella attenuata). The PMRF outer boundary is indicated in yellow. From: Baird et al. 2018a [Project H4]
DoN | 2018 All-Range Pacific Annual Monitoring Report MARINE SPECIES MONITORING IN THE PACIFIC
1 April 2019 | 62
Rough-toothed dolphins were the most frequently sighted species (median depth 800 m), as in
previous surveys. Only one rough-toothed dolphin LO tag transmitted for 5 d and stopped
transmitting prior to the SCC (Figure 18).
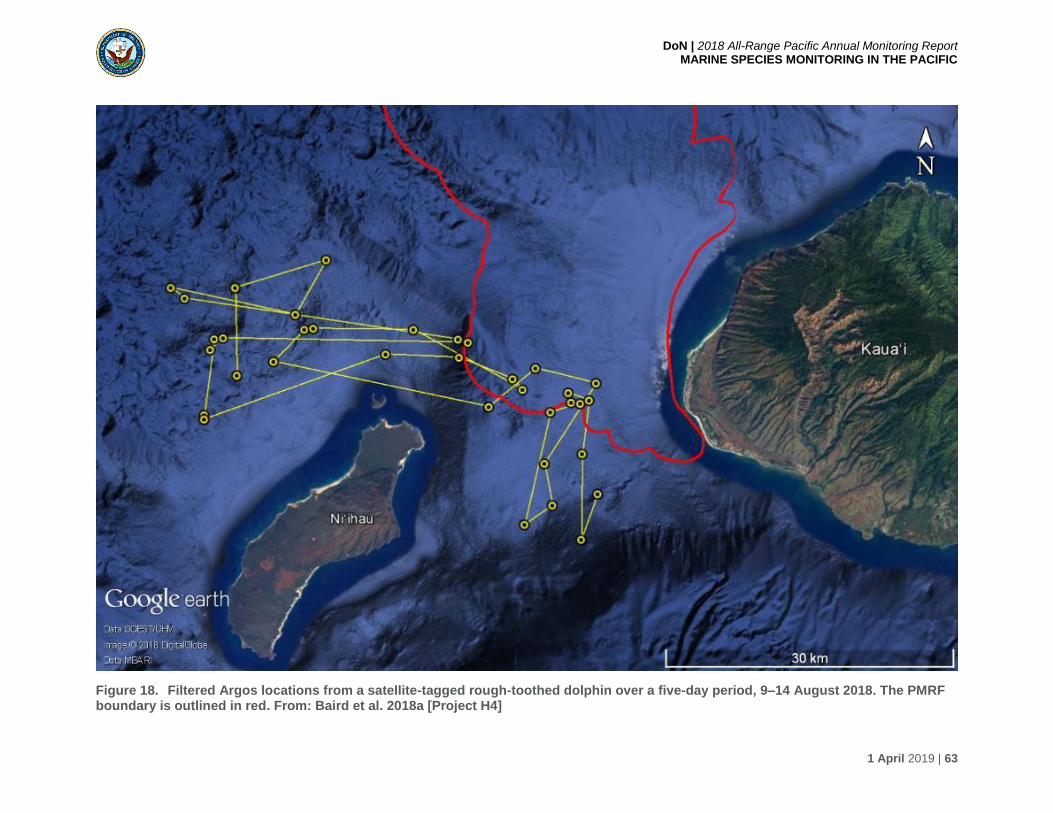
DoN | 2018 All-Range Pacific Annual Monitoring Report MARINE SPECIES MONITORING IN THE PACIFIC
1 April 2019 | 63
Figure 18. Filtered Argos locations from a satellite-tagged rough-toothed dolphin over a five-day period, 9–14 August 2018. The PMRF boundary is outlined in red. From: Baird et al. 2018a [Project H4]

DoN | 2018 All-Range Pacific Annual Monitoring Report MARINE SPECIES MONITORING IN THE PACIFIC
1 April 2019 | 64
Melon-headed whales (median depth 1,360 m), although seen twice on this survey, had only
been seen in two other years since 2003, three times over 6 d in 2008 and four times in 2017 so
have been relatively rarely encountered in this project. A tagged individual remained associated
with Kauai, Niihau, and the area to the south and southwest of Niihau (Figure 19).
Transmissions stopped prior to the SCC. One biopsied individual in August 2018 was
determined to be an F1 hybrid between a female melon-headed whale and a male rough-
toothed dolphin (Baird et al. 2018b).
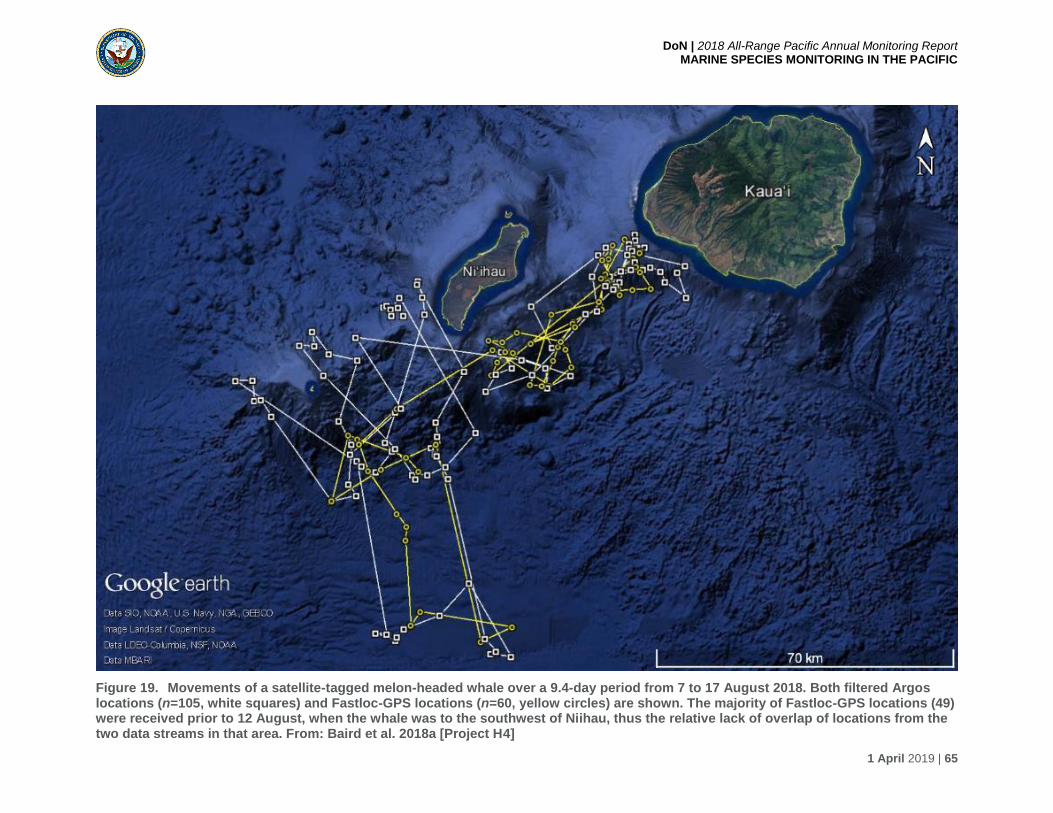
DoN | 2018 All-Range Pacific Annual Monitoring Report MARINE SPECIES MONITORING IN THE PACIFIC
1 April 2019 | 65
Figure 19. Movements of a satellite-tagged melon-headed whale over a 9.4-day period from 7 to 17 August 2018. Both filtered Argos locations (n=105, white squares) and Fastloc-GPS locations (n=60, yellow circles) are shown. The majority of Fastloc-GPS locations (49) were received prior to 12 August, when the whale was to the southwest of Niihau, thus the relative lack of overlap of locations from the two data streams in that area. From: Baird et al. 2018a [Project H4]
DoN | 2018 All-Range Pacific Annual Monitoring Report MARINE SPECIES MONITORING IN THE PACIFIC
1 April 2019 | 66
Short-finned pilot whales were encountered five times (median depth 1,500 m), with two
encounters on PMRF (Figure 20). These encounters represented 3 different groups. One group
consisted of individuals associated with a group strongly associated with Kauai and Niihau,
considered to be from an insular population (Baird et al. 2017c) but could not be approached for
tagging on two consecutive days. Methodologically, this was the first season the Fastloc GPS
tags were also utilized in addition to Argos tags The Fastloc tags produced more than twice as
many locations than Argos during the 10-d window, and behavior data coverage during that
period ranged from 77.4 to 99.3 percent. The transmitting pair was on or near PMRF during the
period of the SCC, so data should be available for analysis during 2019 to assess exposure and
response to MFAS (Figure 20). This group has been linked by association with individuals from
the resident eastern community of short-finned pilot whales. However, the tagged individuals
spent most of their time offshore and remained closely associated over the period of 14 and 37
d, when tags were transmitting (Figure 20). The other tagged pilot whale moved over a period
of 23 d from south of Kauai to north of Oahu, between Oahu and Molokai, and then into deep
water to the southwest of Oahu, before moving off Hawaii Island. This group was far to the
southeast of Kauai when the SCC started, thus it will not be possible to assess MFAS exposure
and response of this group.
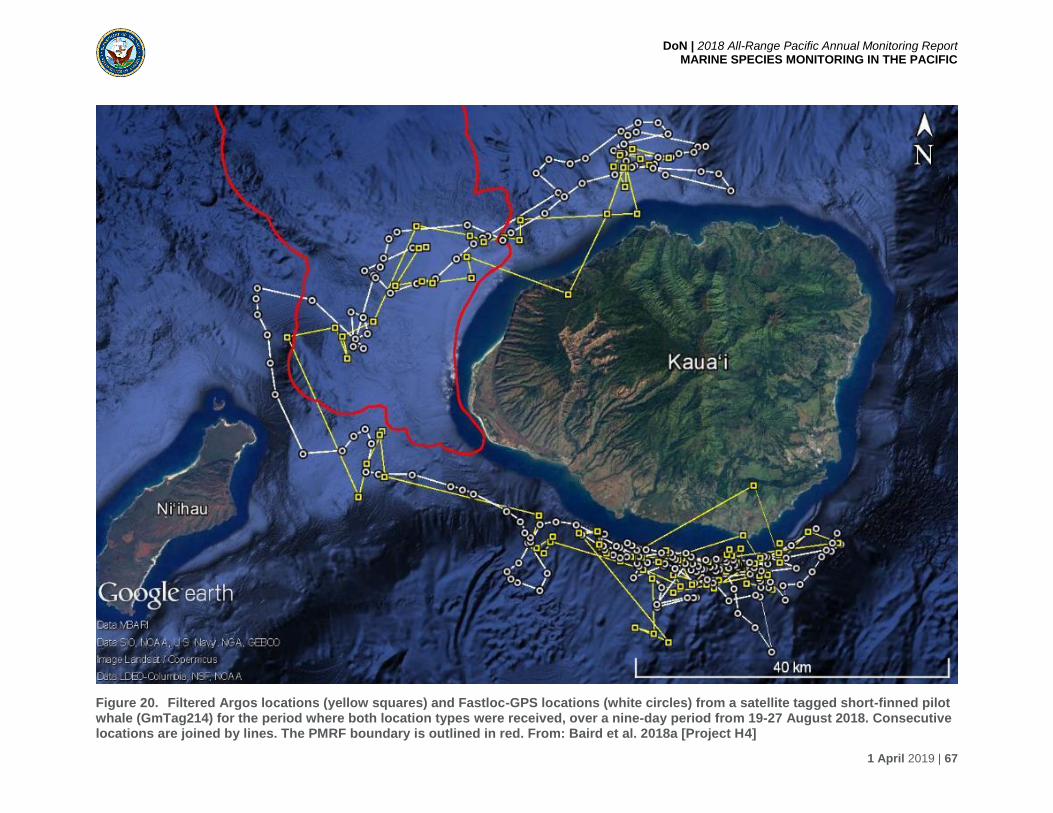
DoN | 2018 All-Range Pacific Annual Monitoring Report MARINE SPECIES MONITORING IN THE PACIFIC
1 April 2019 | 67
Figure 20. Filtered Argos locations (yellow squares) and Fastloc-GPS locations (white circles) from a satellite tagged short-finned pilot whale (GmTag214) for the period where both location types were received, over a nine-day period from 19-27 August 2018. Consecutive locations are joined by lines. The PMRF boundary is outlined in red. From: Baird et al. 2018a [Project H4]
DoN | 2018 All-Range Pacific Annual Monitoring Report MARINE SPECIES MONITORING IN THE PACIFIC
1 April 2019 | 68
Pantropical spotted dolphins (depth = 1,500 m) were seen once, only the twelfth sighting since
2003. Only one location was obtained from a location-depth satellite tag deployed. Four biopsy
samples will be used to assess whether the group is likely part of a pelagic population, as has
been evidenced for other groups of spotted dolphins off Kauai (Courbis et al. 2014; Baird et al.
2018b).
Common bottlenose dolphins were seen on six occasions (median depth 460 m). Spinner
dolphins were seen on eight occasions (median depth 84 m). No tags were deployed on either
bottlenose or spinner dolphins.
The one sperm whale sighting (depth = 800 m) was assisted by an acoustic detection report
from the M3R team. Based on visual sightings and acoustic triangulation, the sperm whale
group was likely spread over a wide area of at least 10 × 3 km. This was only the fourth sighting
of sperm whales since 2003.
2.2.1.9 MONITORING QUESTION: What are the occurrence, movement patterns, and residency patterns of multiple humpback whale Distinct Population Segments within Navy Pacific Ocean at-sea ranges (SOCAL, HRC, NWTT, GOA)? [PROJECTS H6, S7, N1, G2]
Hawaii
Twenty-five humpback whales (20 DM tags, 5 DUR+ tags) were tagged off Maui in March 2018
(Mate et al. 2018a). Argos locations were received from 22 of the 25 tags, with tracking periods
ranging from 1.1 to 160.0 d (mean = 25.8 d, standard deviation [SD] = 40.0 d, n = 17) for DM
tags, and ranging from 2.2 to 104.5 d (mean = 33.5 d, SD = 43.4 d, n = 5) for DUR+ tags. OSU
tagged 77 humpback whales in Hawaii prior to 2018, covering the period 1995 to 2000, and
2015. Of these, 61 were deployed off Maui (in 1997, 1998, 1999, 2000, and 2015); 10 were
deployed off Kauai (in 1995, 1996, and 1997); and 6 were deployed off Hawaii Island (in 1996).
Tracking data were obtained for 59 whales (the remaining tags provided no locations), with
tracking durations ranging from 0.04 to 152.8 d. The aggregate tracking results within Hawaii
support results of previous photo-ID studies and aerial surveys, showing high densities of
whales in the Maui Nui region (the inner waters of the “four-island region” of Maui, Molokai,
Lanai, and Kahoolawe), as well as Penguin Bank, and extensive interchange within the islands.
Because the Hawaii Range Complex (HRC) encompasses all the shallow habitat that
humpbacks in their wintering season prefer, the entire residency period of humpbacks in Hawaii
can be said to represent an overlap with a Navy training area. However, the preference of this
species to shallow nearshore waters that as a rule do not overlap with deeper waters utilized by
training exercises suggest that overlap of tag tracks with the entirety of the range complex
(HRC) may not be meaningful, and the primary purpose of the work in Hawaii is to illuminate
population structure in comparison to west coast areas through genetic analysis and
determining the migratory destinations after the animals leave Hawaii. Figure 21 shows
migratory paths and destinations of animals after leaving Hawaii; the inset shows the other west
coast Navy training study areas in white (GOA TMAA, NWTT, SOCAL).

DoN | 2018 All-Range Pacific Annual Monitoring Report MARINE SPECIES MONITORING IN THE PACIFIC
1 April 2019 | 69
Figure 21. Satellite-monitored tracks for humpback whales tagged off Maui, Hawaii, in March 2018 (17 DM tags, 5 DUR+ tags). The black polygons delineate the Exclusive Economic Zone (EEZ) for US waters From: Mate et al. 2018a [Project H6]

DoN | 2018 All-Range Pacific Annual Monitoring Report MARINE SPECIES MONITORING IN THE PACIFIC
1 April 2019 | 70
Figure 22. Satellite-monitored tracks in Area W188B for humpback whales tagged off Maui, Hawaii, in March 2018 (left panel), and off Maui and Kauai from 1995 to 2015 (right panel). From: Mate et al. 2018a [Project H6]

DoN | 2018 All-Range Pacific Annual Monitoring Report MARINE SPECIES MONITORING IN THE PACIFIC
1 April 2019 | 71
California, Oregon and Alaska
Fourteen humpback whales (7 DUR tags, 7 DM tags) were tagged in California in July and
August 2017, and five humpback whales (5 DUR tags) were tagged in Oregon in September
and October 2017. Argos locations were received from 18 of the 19 tags, with tracking periods
ranging from 0.3 to 150.4 d (mean = 40.8 d, SD = 37.9 d). Sixty-nine humpback whales were
tagged in previous (“historical”) seasons; 47 in Southeast Alaska in 1997, 2014, and 2015; 15 in
California in 2004 and 2005; five in the Aleutian Islands of Alaska in 2008; and two in Oregon in
2016. The distribution of tracked humpback whales aligned well with previously reported
humpback sightings, further supporting humpback whale affinity for continental shelf and shelf-
edge habitat. Of the Navy ranges considered (SOCAL, SOAR, Point Mugu Sea Range (PT
MUGU), NWTT, and GOA), NWTT was the most heavily used Navy training range by humpback
whales (Figure 23), with animals tagged in both California and Oregon having extended
residencies there, and whales tagged in Southeast Alaska migrating through the range.
Humpback whale locations occurred in NWTT from August through January. Warning Area 237
(W237) of the NWTT range was only used by whales tagged in Oregon, or migrating whales
from Southeast Alaska, with occurrences in November and December. Humpback whales
tagged in California were the only ones with extended residencies in PT MUGU; however,
migrating whales from Oregon and Southeast Alaska also had locations in the range as they
traveled south. Locations occurred within PT MUGU from July through December. SOCAL was
used by humpback whales tagged in California, as well as by migrating whales from Oregon
and Southeast Alaska for short periods of time. Locations occurred in SOCAL in the months of
November, December, and January. Only one humpback whale tagged in southern Oregon
transited through the SOAR range in November of 2005. No tagged humpback whales were
located in the GOA training range in any of the years covered in this report (1997–2017).

DoN | 2018 All-Range Pacific Annual Monitoring Report MARINE SPECIES MONITORING IN THE PACIFIC
1 April 2019 | 72
Figure 23. Satellite-monitored tracks for humpback whales tagged by OSU off California in 2004–2005 and 2017, Oregon in 2016 and 2017, and Southeast Alaska in 2014–2015. Inset shows full migration tracks. From: Mate et al. 2018c [Project S7]
DoN | 2018 All-Range Pacific Annual Monitoring Report MARINE SPECIES MONITORING IN THE PACIFIC
1 April 2019 | 73
2.2.1.10 MONITORING QUESTION: What is the seasonal occurrence and abundance/density of beaked whales and ESA-listed baleen whales within the Navy's Southern California Range Complex? [Projects S1 and S3]
Since 2013, vocalizations of blue whales, fin whales, and Cuvier’s beaked whales as well as
frequency-modulated (FM) pulse types BW35 and beaked whale (BW)43 possibly produced by
Hubbs’ (Mesoplodon carlhubbsi) and Perrin’s (M. perrini) beaked whales, respectively, have
been detected in acoustic recordings made by HARPs in SOCAL (e.g., Baumann-Pickering et
al. 2018a, b; Rice et al. 2019). The BW35 FM pulse type was detected for the first time during a
SOCAL monitoring period, during 2017 (Rice et al. 2019). No other beaked whale species were
acoustically detected during SOCAL since 2013 (Baumann-Pickering et al. 2018a, b; Rice et al.
2019).
During the March 2017 through July 2018 monitoring period, blue whale vocalizations (B and D
calls) were detected at all sites and were most prevalent during the summer and fall months.
Blue whale B calls were detected during summer through early winter, peaking at sites E and N
from September to December 2017 and in September at site H. Site E was determined to have
a second and larger peak in November. Very few B calls were detected after January 2018
(Rice et al. 2019). Site HP had a substantially lower number of B call detections than the other
analyzed sites (E, H, and N). During the 2013 through 2017 recording period, Site P had much
higher numbers of B calls than Site H and Site N during summer and fall of 2014, while the
numbers decreased dramatically during 2015 through 2017 (Baumann-Pickering et al. 2018b).
Site P had the highest density of blue whale B calls over the 5 years. Analysis of data recorded
during 2013 through 2017 revealed that Site H and Site N had relatively stable numbers of B
calls across the entire period, while detections at Site M were low in 2013 (Baumann-Pickering
et al. 2018b). The fall peak in B calls is consistent with earlier recordings at these sites (Kerosky
et al. 2013; Debich et al. 2015a, b; Širović et al. 2016; Rice et al. 2017, 2018a; Baumann-
Pickering et al. 2018b; Wiggins et al. 2018). No discernible diel pattern was evident for blue
whale B calls for either the 2017 through 2018 monitoring period or the 5-year period. Blue
whale D calls were detected from spring through winter (March through December), but were
most prevalent during the spring and summer. Analysis of data collected during 2017 through
2017 revealed a strong increase in D calls at sites H and N in 2017 with almost a complete
absence at site P during that time (Baumann-Pickering et al. 2018b). D calls were highest at
sites H and N in July 2017 and in July 2018 at site N (Baumann-Pickering et al. 2018b: Rice et
al. 2019). The lowest number of detections was at Site HP. At Site E, D calls were detected in
low numbers throughout most of the year. The spring/summer peak in blue whale D calls is
consistent with earlier recordings at these sites, including the analyses of data from 2013
through 2017 (Debich et al. 2015b; Rice et al. 2017, 2018a; Baumann-Pickering et al. 2018b;
Wiggins et al. 2018), however, there were more D calls at site N during this current monitoring
period than in previous recordings. Overall, D calls showed no clear diel pattern during neither
the March 2017 through July 2018 monitoring period nor the analysis of the 2013 through 2017
data (Rice et al. 2019; Baumann-Pickering et al. 2018b, respectively). However, it was noticed
that at site N during Spring 2017, an increase was observed in D calls around sunset and
sunrise, with a decrease during the night (Rice et al. 2019).
Fin whales were detected at all HARP sites; however, the highest values of the fin whale
acoustic index (representative of 20-Hz calls) were measured at Site E and the lowest at Site
DoN | 2018 All-Range Pacific Annual Monitoring Report MARINE SPECIES MONITORING IN THE PACIFIC
1 April 2019 | 74
HP during the current monitoring period. A peak in the fin whale acoustic index occurred in
December 2017 at Sites E and N. At Site H, the acoustic index increased from September to
November, when recording ended. The winter peak in the fin whale acoustic index is consistent
with earlier recordings at these sites (Debich et al. 2015a, b; Širović et al. 2016; Rice et al.
2017, 2018a; Baumann-Pickering et al. 2018b; Wiggins et al. 2019). Over the 5-year monitoring
period, the fin whale acoustic index at all sites peaked in late fall or early winter and usually low
during the summer (Baumann-Pickering et al. 2018b). The highest acoustic index was during
the winters of 2013/2014 and 2016/2017, and was generally low in the winter of 2015/2016. For
the 5-year analysis, Site H was found to have the highest fin whale acoustic index.
The Cuvier’s beaked whale was the most commonly detected beaked whale species and
occurred throughout the March 2017 through July 2018 deployment period. FM echolocation
pulses from Cuvier’s beaked whales were detected in high numbers at Site E and in much lower
number at Sites H and N. Detections peaked during Spring 2017 and 2018, and in Winter 2018
at Site E. Smaller peaks during these periods can also be seen at Sites H and N. The results at
these sites were similar to those in previous monitoring periods (Kerosky et al. 2013; Debich et
al. 2015a, 2015b; Širović et al. 2016; Baumann-Pickering et al. 2018b; Wiggins et al. 2019),
although there were fewer detections at Sites H and N than during recent monitoring periods
(Rice et al. 2017, 2018a). There was no discernible diel pattern for Cuvier’s beaked whale
detections during the recent monitoring period or for the 5-year analysis
For the 2013 through 2017 data, detections were highest during fall through spring with a
decline in presence during the summer (Baumann-Pickering et al. 2018b). Additionally, during
the 5-year data period, Cuvier’s beaked whale FM pulses were detected most commonly at Site
H and less so at sites M and N, and none at Site P.
The FM pulse type BW35, possibly produced by Hubbs’ beaked whales (Griffiths et al. 2018),
was detected only once at both Sites E and H (December 2017 and August 2017, respectively)
(Rice et al. 2019). It was not possible to determine if there was a diel pattern in detections due
to the sparsity of data.
The FM pulse type, BW43, possibly produced by Perrin’s beaked whales (Baumann-Pickering
et al. 2014) was detected. The 5-year analysis shows that BW43 pulses occurred during late fall
through spring, with a decrease in presence during the summer—a similar pattern evidenced for
Cuvier’s beaked whales (Baumann-Pickering et al. 2018b). Detections were not often made for
this species during either the March 2017 through July 2018 monitoring period or the 5-year
analysis. The BW43 pulse type was detected only occasionally at Site N throughout the March
2017 through July 2018 monitoring effort, with the majority of the detections made during Spring
2018. During the previous monitoring period, detections for BW43 were only at Site N and
during late fall and winter (Širović et al. 2016; Rice et al. 2017, 2018a). There were no
detections at Site H during this monitoring period as in years past (Širović et al. 2016; Rice et al.
2017, 2018a). Overall, however, results are consistent with previous reports (Kerosky et al.
2013; Debich et al. 2015a, b; Rice et al. 2018a). The 5-year analysis determined that BW43
pulses were most regularly detected at Site N and less often at Site H, with no detections at
Sites M and P. There was no discernible diel pattern for BW43 detections during the current

DoN | 2018 All-Range Pacific Annual Monitoring Report MARINE SPECIES MONITORING IN THE PACIFIC
1 April 2019 | 75
monitoring period, however, the 5-year period hints at a weak diel pattern, with more detections
at night.
In order to better characterize the seasonal occurrence of beaked whales in SOCAL, Frasier et
al. (2019) analyzed acoustic data collected by towed arrays during CalCOFI cruises from 2008
through 2014. The researchers implemented an unsupervised learning algorithm to distinguish
between impulse signals associated with the survey vessel echosounders, vessel propeller
cavitation, and beaked whale and dolphin echolocation clicks based on differences in their
acoustic spectra (Figure 24). This algorithm was tested on approximately one-half of the
available CalCOFI towed-array recordings (2008–2014), and reliably separated the four signal
types at the level of individual signals (Figure 25). This method distinguishes echosounders and
other false positives from the beaked whale detections, and true and false detections are
learned by the algorithm rather than dictated by pre-determined approximations. This is
particularly useful for towed-array data, which are collected in a complex, unpredictable, near-
surface acoustic environment. To date, researchers have used this algorithm to identify distinct
categories of signals within a subset of towed array detection data (Figure 25). A neural
network is in development using these categories to sequentially identify the false detections
across the entire dataset, and flag them for removal.
Figure 24. In this example from CalCOFI 2009 data, the unsupervised learning algorithm has reviewed detections in a five-minute time window and automatically identified three distinct, recurrent signal types based on spectral features without prior knowledge of the expected categories. Mean spectra of these types are shown on the left-most subplot including beaked whale echolocation clicks (blue), dolphin echolocation clicks (red), and echosounders (yellow). The center subplot shows the concatenated spectra of the detections associated with each type, with black lines delimiting the distinct groupings. The right-most plot shows the inter-click interval (ICI) calculated for each group. Peaks in ICI distributions represent typical cue rates for these signals. From: Frasier et al. 2019 [Project S4]

DoN | 2018 All-Range Pacific Annual Monitoring Report MARINE SPECIES MONITORING IN THE PACIFIC
1 April 2019 | 76
Figure 25. Categories of marine mammal and anthropogenic signals detected in the CalCOFI towed array dataset from 2008 to 2014. Black box on top row indicates marine mammal (dolphin and beaked whale echolocation click) categories. All other categories represent different types of echosounders and propeller noise, which often obscure other signals of interest within the dataset. From: Frasier et al. 2019 [Project S4]
DoN | 2018 All-Range Pacific Annual Monitoring Report MARINE SPECIES MONITORING IN THE PACIFIC
1 April 2019 | 77
2.2.1.11 MONITORING QUESTION: What are the baseline population demographics, vital rates, and movement patterns for designated key species in the Southern California range complex? [PROJECT S2]
During small-vessel surveys conducted at SOAR from January through November 2018, 263
sightings of 13 cetacean species were recorded, along with one sighting of a juvenile
loggerhead turtle (Caretta caretta) (Schorr et al. 2018b)1. During 10 days of survey effort at
SOAR, observers encountered 35 groups (88 individuals) of Cuvier’s beaked whales; all but one
sighting was in deep waters of the San Nicolas Basin (west of San Clemente Island), and one
was made to the north of the island in shelf-edge waters. Only one young Cuvier’s beaked
whale calf was sighted in 2018, associated with a female with no prior sighting history for the
area. Five adult females with prior calving histories were sighted in 2018 without calves in
attendance, information which contributes to a growing body of calving interval data from this
population. Two biopsy samples were collected from Cuvier’s beaked whales in 2018. One
sample was determined to be female, and the second was awaiting analysis at the time of
writing.
In 2018, more fin whales were sighted than in the previous two years combined, possibly due to
El Niño conditions in 2016 and 2017 (Figure 26, Schorr et al. 2018a). Photo-ID data were
received from a citizen-science group (HappyWhale program: https://happywhale.com/home) in
November 2018. Photo-matching for MarEcoTel’s 2017 study and HappyWhale’s catalog
revealed that all high-residency whales (n=37) were sighted off SOCAL, and 34 of these whales
were sighted exclusively in SOCAL. Three were sighted in both Southern and Central California,
although it should be noted that there is less survey effort conducted outside SOCAL. Nine
biopsy samples were collected from fin whales in 2018. All but one sample (collected in late
November) were genetically sexed; four were male and four were female.
Two depth-reporting satellite tags were deployed in 2018, one on a Baird’s beaked whale and
the other on a Risso’s dolphin. Transmission durations ranged from five to six days. Consistent
with previous tag deployments on Baird’s beaked whales (MarEcoTel, unpublished data, and
Stimpert et al. 2014), the Baird’s beaked whale tagged in July 2018 moved quickly through
SOAR and continued moving north and out of SOCAL (Figure 27). Baird’s beaked whales have
been photographically identified on three different occasions in three different years while on
SOAR. All sightings were made during the summer (July through September), suggesting that
this may be a time when Baird’s beaked whales are migrating through the area. The Risso’s
dolphin tagged in November 2018 remained in San Nicolas Basin for only a short time, and
shortly after tagging returned to the nearshore waters off Catalina Island (Figure 28).
Dive information from these tags is currently being analyzed and will be available in a future
report.
1 Sighting and photo-ID data reported here are combined with those from a complementary survey effort funded by the U.S. Navy’s Living Marine Resources (LMR) program.

DoN | 2018 All-Range Pacific Annual Monitoring Report MARINE SPECIES MONITORING IN THE PACIFIC
1 April 2019 | 78
Figure 26. Cuvier's beaked whale and fin whale sightings from surveys conducted in 2018. The black polygon west of San Clemente Island is the SOAR range boundary. From: Schorr et al. 2018b [Project S2]

DoN | 2018 All-Range Pacific Annual Monitoring Report MARINE SPECIES MONITORING IN THE PACIFIC
1 April 2019 | 79
Figure 27. Filtered tracklines of a satellite-tagged Baird's beaked whale during the 2018 monitoring effort. From: Schorr et al. 2018b [Project S2]
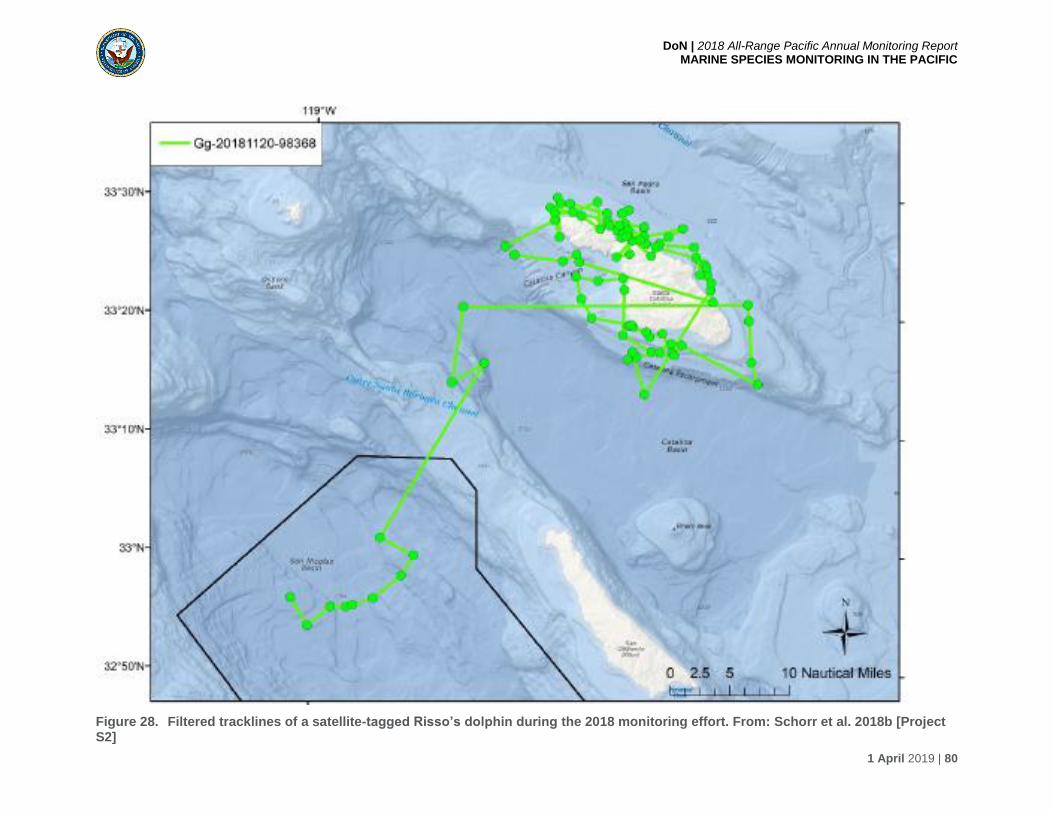
DoN | 2018 All-Range Pacific Annual Monitoring Report MARINE SPECIES MONITORING IN THE PACIFIC
1 April 2019 | 80
Figure 28. Filtered tracklines of a satellite-tagged Risso’s dolphin during the 2018 monitoring effort. From: Schorr et al. 2018b [Project S2]
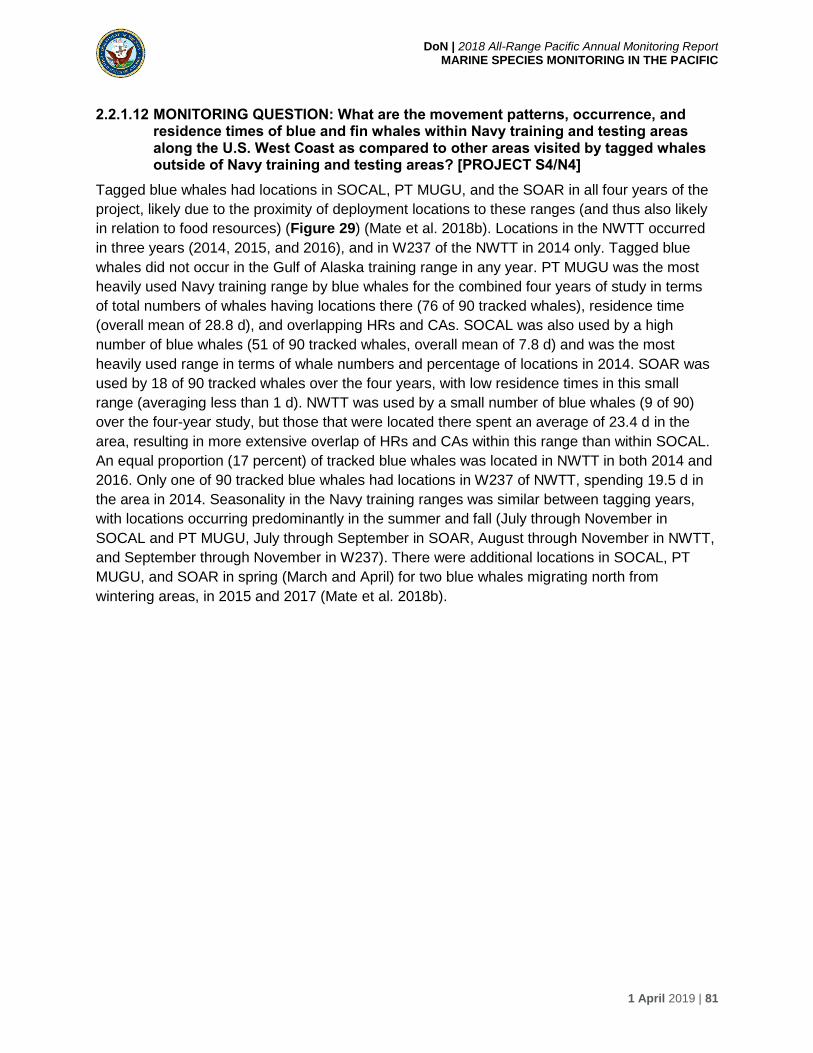
DoN | 2018 All-Range Pacific Annual Monitoring Report MARINE SPECIES MONITORING IN THE PACIFIC
1 April 2019 | 81
2.2.1.12 MONITORING QUESTION: What are the movement patterns, occurrence, and residence times of blue and fin whales within Navy training and testing areas along the U.S. West Coast as compared to other areas visited by tagged whales outside of Navy training and testing areas? [PROJECT S4/N4]
Tagged blue whales had locations in SOCAL, PT MUGU, and the SOAR in all four years of the
project, likely due to the proximity of deployment locations to these ranges (and thus also likely
in relation to food resources) (Figure 29) (Mate et al. 2018b). Locations in the NWTT occurred
in three years (2014, 2015, and 2016), and in W237 of the NWTT in 2014 only. Tagged blue
whales did not occur in the Gulf of Alaska training range in any year. PT MUGU was the most
heavily used Navy training range by blue whales for the combined four years of study in terms
of total numbers of whales having locations there (76 of 90 tracked whales), residence time
(overall mean of 28.8 d), and overlapping HRs and CAs. SOCAL was also used by a high
number of blue whales (51 of 90 tracked whales, overall mean of 7.8 d) and was the most
heavily used range in terms of whale numbers and percentage of locations in 2014. SOAR was
used by 18 of 90 tracked whales over the four years, with low residence times in this small
range (averaging less than 1 d). NWTT was used by a small number of blue whales (9 of 90)
over the four-year study, but those that were located there spent an average of 23.4 d in the
area, resulting in more extensive overlap of HRs and CAs within this range than within SOCAL.
An equal proportion (17 percent) of tracked blue whales was located in NWTT in both 2014 and
2016. Only one of 90 tracked blue whales had locations in W237 of NWTT, spending 19.5 d in
the area in 2014. Seasonality in the Navy training ranges was similar between tagging years,
with locations occurring predominantly in the summer and fall (July through November in
SOCAL and PT MUGU, July through September in SOAR, August through November in NWTT,
and September through November in W237). There were additional locations in SOCAL, PT
MUGU, and SOAR in spring (March and April) for two blue whales migrating north from
wintering areas, in 2015 and 2017 (Mate et al. 2018b).

DoN | 2018 All-Range Pacific Annual Monitoring Report MARINE SPECIES MONITORING IN THE PACIFIC
1 April 2019 | 82
Figure 29. Satellite-monitored tracks for blue whales tagged off southern and central California during July and/or August, 2014 to 2017, with different tagging years being shown in different colors. Tracks show northern- and southern-most destinations. From: Mate et al. 2018b [Project S4]

DoN | 2018 All-Range Pacific Annual Monitoring Report MARINE SPECIES MONITORING IN THE PACIFIC
1 April 2019 | 83
The only fin whale tagged in 2017 did not spend time in any Navy training ranges. For fin
whales tagged in 2014–2016, locations occurred in the PT MUGU and NWTT ranges in all three
years, but locations in SOCAL and SOAR occurred only in 2014 and 2015, and in W237 during
2015 and 2016 only (Figure 30) (Mate et al. 2018b). The GOA training range had no tagged fin
whale locations in any of the four years. PT MUGU was the most heavily used Navy training
range for fin whales in 2014–2016, in terms of number of whales having locations there as well
as HRs and CAs occurring there. SOCAL was the second most heavily used training range in
terms of number of fin whales as well as HR and CA overlap in 2014, but NWTT was the
second most heavily used range in 2015. Two fin whales were tracked in SOAR in both 2014
and 2015 but none had locations there in 2016. No fin whales tagged in 2016 had locations in
SOCAL, and only one fin whale crossed through NWTT in 2016. Two whales had locations in
W237 of NWTT in 2015, and one in 2016, but the latter only passed through the area briefly on
its way farther north. Fin whale use of SOAR, NWTT, and W237 occurred primarily in late
summer and fall, whereas fin whales could be found in PT MUGU during summer, fall, and
winter, and in SOCAL during all seasons (Mate et al. 2018b).

DoN | 2018 All-Range Pacific Annual Monitoring Report MARINE SPECIES MONITORING IN THE PACIFIC
1 April 2019 | 84
Figure 30. Satellite-monitored tracks for fin whales tagged off southern and central California during July and/or August, 2014 to 2017.From: Mate et al. 2018b [Project S4]

DoN | 2018 All-Range Pacific Annual Monitoring Report MARINE SPECIES MONITORING IN THE PACIFIC
1 April 2019 | 85
2.2.1.13 MONITORING QUESTION: What are the residency time/occupancy patterns of blue whales within NMFS-designated Biologically Important Areas (BIAs) for this species along the U.S. West Coast? [PROJECT S4/N3]
Of the six blue whale BIAs that overlap Navy training ranges, the Santa Barbara Channel and
San Miguel Island BIA (Figure 31) appeared to be the most important area to blue whales, in
terms of number of whales using the area, time spent there (with a maximum residency of
63.3 d), and number of overlapping core areas within the area (Mate et al. 2018b). This is due in
part to the proximity of deployment locations to this BIA, although the bathymetry, upwelling
patterns, and biological productivity in this area likely offer optimal foraging habitat for blue
whales off the U.S. West Coast, especially during strong upwelling years. There were
differences in BIA use between years; however, with the San Diego and the Santa Monica Bay
to Long Beach BIAs being the most heavily used in 2014 (Figures 32 and 33), and the Santa
Barbara Channel and San Miguel Island and the Point Conception/Arguello BIAs being the most
heavily used in 2015, 2016, and 2017 (Figures 31 and 34). The remaining two BIAs, San
Nicolas Island and Tanner-Cortes Banks, were used only minimally by blue whales in all four
years, with residencies ranging from <0.1 to 1.7 d for Tanner-Cortes Bank, and 0.1 to 0.3 d for
San Nicolas Island. The timing of blue whale occurrence in BIAs was similar between years,
taking place in summer and fall (July to November) (Mate et al. 2018b).
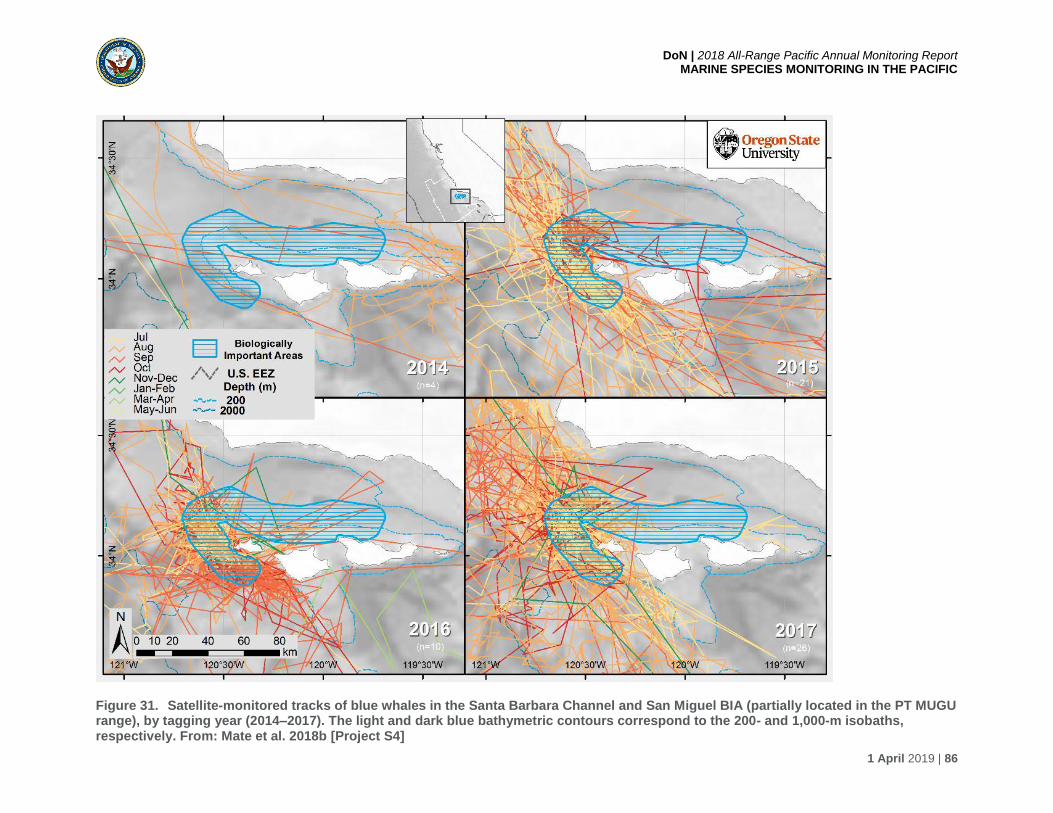
DoN | 2018 All-Range Pacific Annual Monitoring Report MARINE SPECIES MONITORING IN THE PACIFIC
1 April 2019 | 86
Figure 31. Satellite-monitored tracks of blue whales in the Santa Barbara Channel and San Miguel BIA (partially located in the PT MUGU range), by tagging year (2014–2017). The light and dark blue bathymetric contours correspond to the 200- and 1,000-m isobaths, respectively. From: Mate et al. 2018b [Project S4]
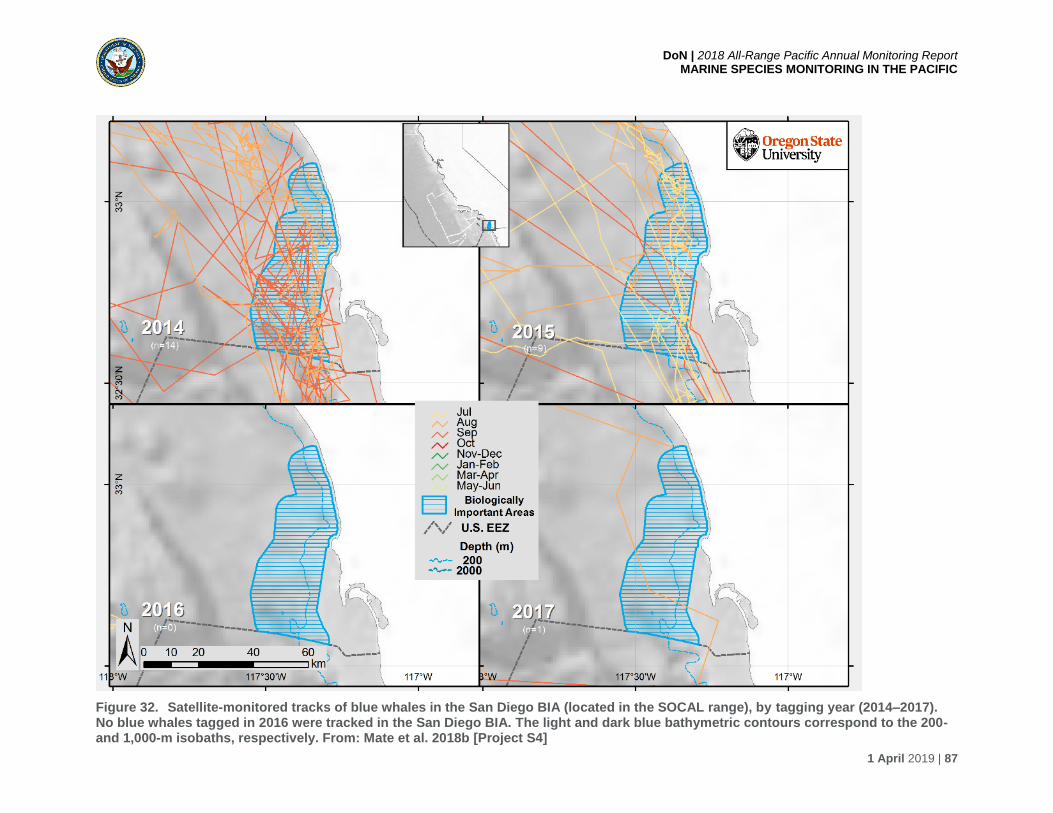
DoN | 2018 All-Range Pacific Annual Monitoring Report MARINE SPECIES MONITORING IN THE PACIFIC
1 April 2019 | 87
Figure 32. Satellite-monitored tracks of blue whales in the San Diego BIA (located in the SOCAL range), by tagging year (2014–2017). No blue whales tagged in 2016 were tracked in the San Diego BIA. The light and dark blue bathymetric contours correspond to the 200- and 1,000-m isobaths, respectively. From: Mate et al. 2018b [Project S4]

DoN | 2018 All-Range Pacific Annual Monitoring Report MARINE SPECIES MONITORING IN THE PACIFIC
1 April 2019 | 88
Figure 33. Satellite-monitored tracks of blue whales in the Santa Monica Bay to Long Beach BIA (partially located in the SOCAL range), by tagging year (2014–2017). The light and dark blue bathymetric contours correspond to the 200- and 1,000-m isobaths, respectively. From: Mate et al. 2018b [Project S4]

DoN | 2018 All-Range Pacific Annual Monitoring Report MARINE SPECIES MONITORING IN THE PACIFIC
1 April 2019 | 89
Figure 34. Satellite-monitored tracks of blue whales in the Point Conception/Arguello BIA (partially located in the PT MUGU range), by tagging year (2014–2017). The light and dark blue bathymetric contours correspond to the 200- and 1,000-m isobaths, respectively. From: Mate et al. 2018b [Project S4]
DoN | 2018 All-Range Pacific Annual Monitoring Report MARINE SPECIES MONITORING IN THE PACIFIC
1 April 2019 | 90
2.2.1.14 MONITORING QUESTION: Are there bathymetric, annual oceanographic conditions (e.g., sea surface temperature, frontal zones, etc.), and/or climatic and ocean variations (e.g., global warming, North Pacific Gyre Oscillation [NPGO], Pacific Decadal Oscillation [PDO], El Niño/La Niña events, etc.) that can help explain blue and fin whale affinity for any identified areas of high residency along the U.S. West Coast? [PROJECT S4/N4]
For the 27 blue whales tagged in 2017, SSSMs generated 25 regularized tracks and 1,664
locations, of which 900 (54.1 percent) were classified as ARS, 569 (34.2 percent) were
classified as uncertain, and 195 (11.7 percent) were classified as transiting (Mate et al. 2018b).
Average satellite-determined sea surface temperature (SST) where blue whales occurred in
2017 was 18.4°C, and average chlorophyll-a concentration (CHL) was 1.4 milligrams per cubic
meter [mg m-3]. Blue whales occurred in areas with an average depth of 1,260.3 m, average
distance to the continental shelf break of 32.7 km, and average distance to the nearest
shoreline of 63.3 km. Over the entire four years of the project, most SSSM locations for blue
whales occurred in the California Current Province (CCAL) (73.1 to 99.3 percent) and in the
North Pacific Equatorial Countercurrent Province (PNEC) (0.7 to 26.7 percent) (Figure 35). The
proportion of SSSM locations classified as ARS in CCAL (the only province consistently
occupied by both species in all years) during the summer–fall months (July to November), was
lower in 2014 and 2015 (11.2 and 18.4 percent of locations, respectively), while it was very high
in 2016 and 2017 (51 and 54.1 percent, respectively). In ARS, blue whales covered larger
distances between location pairs in 2014 and 2015 (mean pairwise distance between SSSM
locations [PWDIST] = 58.3 and 44.1 km, respectively), and substantially smaller distances in
2016 and 2017 (mean PWDIST = 21.6 and 30.5 km, respectively). Examination of
oceanographic conditions indicated that the little ARS activity in 2014 and 2015 occurred in the
warmest SSTs recorded by blue whales during the study (mean = 22.9 and 19.1°C,
respectively), compared to the more predominant ARS activity that was recorded in cooler
waters in 2016 and 2017 (mean = 16.3 and 18.0°C, respectively). Correspondingly, CHL values
where ARS activity took place in 2014 and 2015 were low (mean = 0.7 mg m-3 in both years)
compared to the more elevated values in 2016 and 2017 (mean = 1.7 and 1.5 mg m-3,
respectively). During 2016, ARS activity took place in shallower waters (mean = 640.1 m), in the
vicinity of the shelf break (mean = 13.3 km), and closer to shore (mean = 33.5 km) than in the
other years of the project (Mate et al. 2018b).
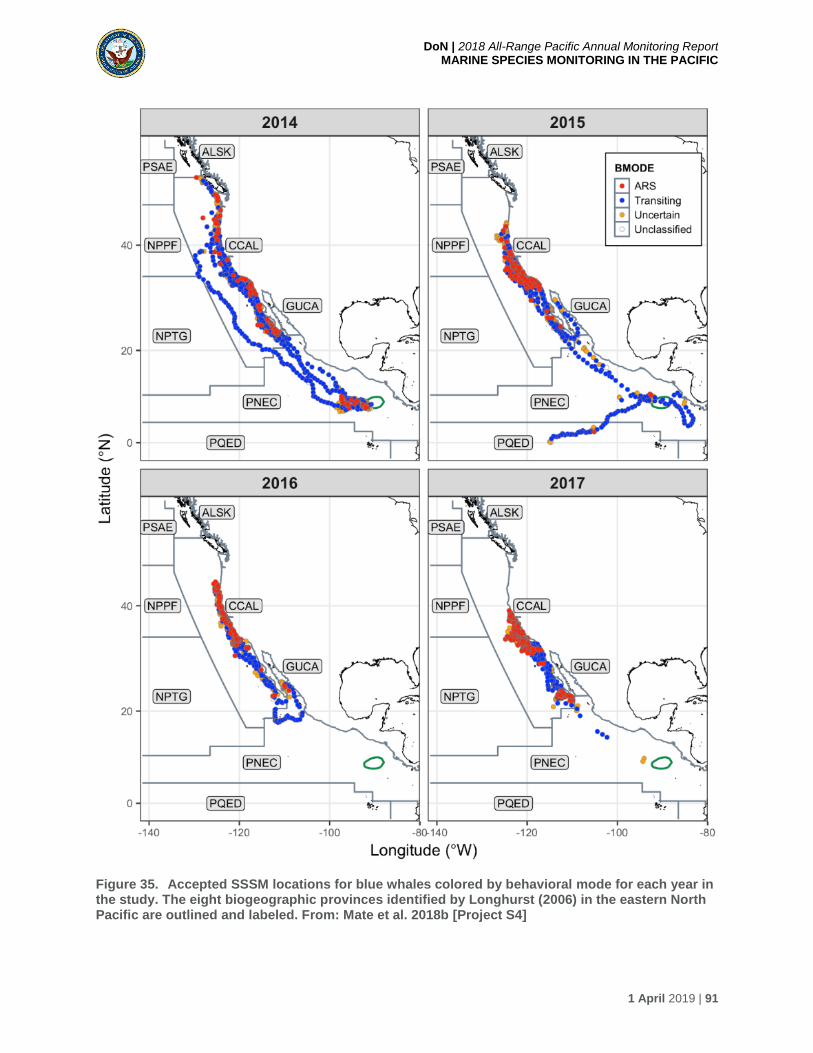
DoN | 2018 All-Range Pacific Annual Monitoring Report MARINE SPECIES MONITORING IN THE PACIFIC
1 April 2019 | 91
Figure 35. Accepted SSSM locations for blue whales colored by behavioral mode for each year in the study. The eight biogeographic provinces identified by Longhurst (2006) in the eastern North Pacific are outlined and labeled. From: Mate et al. 2018b [Project S4]

DoN | 2018 All-Range Pacific Annual Monitoring Report MARINE SPECIES MONITORING IN THE PACIFIC
1 April 2019 | 92
These inter-annual differences were likely in response to the strongly anomalous oceanographic
conditions that occurred during the first three years of the project, including: (a) warm SST
anomalies associated with the marine heat wave of 2013–2015, (b) warm SST anomalies
associated with the 2015–2016 El Niño event, and (c) cold SST anomalies associated with the
2016–2017 La Niña event (Figure 36) (Mate et al. 2018b). Although no major oceanographic
perturbations were reported in 2017, strongly negative NPGO sea-surface height anomalies
were persistent in the latter half of 2017, concomitant with cold ONI SST anomalies. Dramatic
biotic changes were documented across the food web and throughout the study area in 2014 to
2017 in response to these events, and they likely had an impact on the abundance, distribution,
species composition, and nutritional value of the whales’ euphausiid prey (Mate et al. 2018b).
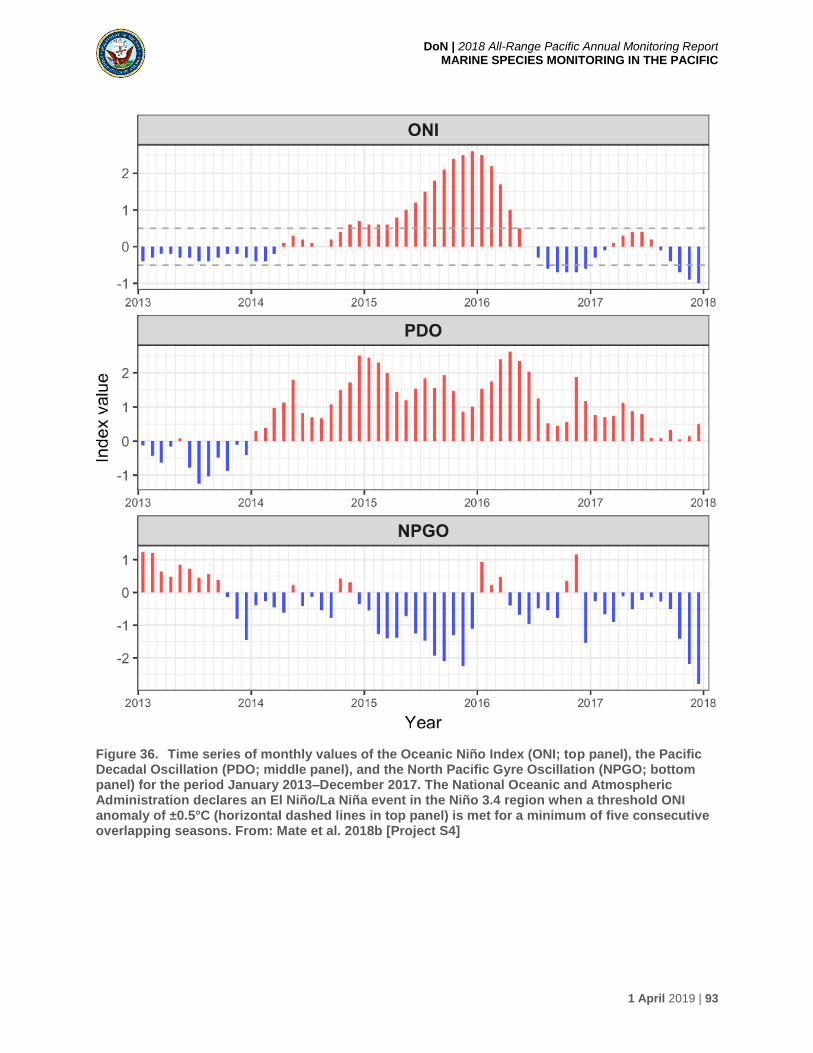
DoN | 2018 All-Range Pacific Annual Monitoring Report MARINE SPECIES MONITORING IN THE PACIFIC
1 April 2019 | 93
Figure 36. Time series of monthly values of the Oceanic Niño Index (ONI; top panel), the Pacific Decadal Oscillation (PDO; middle panel), and the North Pacific Gyre Oscillation (NPGO; bottom panel) for the period January 2013–December 2017. The National Oceanic and Atmospheric Administration declares an El Niño/La Niña event in the Niño 3.4 region when a threshold ONI anomaly of ±0.5°C (horizontal dashed lines in top panel) is met for a minimum of five consecutive overlapping seasons. From: Mate et al. 2018b [Project S4]

DoN | 2018 All-Range Pacific Annual Monitoring Report MARINE SPECIES MONITORING IN THE PACIFIC
1 April 2019 | 94
Only one fin whale was tagged in 2017, and its track was restricted, covering approximately 2
degrees of longitude (124–122°W) and 1 degree of latitude (36.9–37.9°N) off the coast of
central California between Santa Cruz and San Francisco (Mate et al. 2018b). Of 40 SSSM
locations in this track, 37 (92.5 percent) were classified as ARS, 3 (7.5 percent) were classified
as uncertain, and none were classified as transiting. The area where this fin whale occurred had
an average SST of 16.5°C, average CHL of 2.3 mg m-3, average depth of 470.7 m, average
distance to the continental shelf break of 6.6 km, and average distance to the nearest shoreline
of 34.6 km.
The geographic extent covered by the 28 fin whales tracked in the four years of this study was
smaller than that of the blue whales, but it also displayed marked inter-annual variability. Fin
whales were only present in two of the eight biogeographic provinces of the eastern North
Pacific considered here, CCAL (90 to 100 percent) and Alaska Downwelling Coastal Province
(ALSK; 0 to 10 percent). Also, while blue whales migrated in late fall and winter from CCAL to
lower-latitude provinces (PNEC, Gulf of California Province [GUCA], Pacific Equatorial
Divergence Province [PQED]), fin whales moved northward and remained in CCAL or visited
ALSK (reaching Haida Gwaii and Hecate Strait off British Columbia) (Mate et al 2018b). For the
first three years of the project (which were more appropriately comparable because of sample
size considerations), the proportion of fin whale SSSM locations classified as ARS in CCAL
during the summer-fall months was lowest (11.2 percent of locations) in 2015, intermediate
(18.8 percent) in 2014, and highest (34.9 percent) in 2016. Correspondingly, while in ARS
average PWDIST was highest in 2015 (59.0 km) and lower in 2014 and 2016 (49.6 and 38.3
km, respectively). Examination of oceanographic conditions indicated that the low ARS activity
in 2015 (during El Niño) occurred in the warmest SST recorded during the study (mean =
18.5°C), compared to the higher ARS activity that was recorded in cooler waters in 2014 (mean
= 16.7°C) and especially in 2016 (mean = 15.2°C). Correspondingly, CHL values where ARS
activity took place in 2015 were the lowest recorded (mean = 0.5 mg m-3) compared to the more
elevated values in 2014 or 2016 (mean = 1.1 and 1.9 mg m-3, respectively). During 2015, ARS
activity took place in deeper waters (mean = 2,465.3 m) and farther away from the shelf break
and the shore (mean = 61.9 and 84.9 km, respectively) than in 2014 or 2016 (Mate et al.
2018b).
These results suggest that the anomalous warm-water events of 2014 and 2015 had different
impacts on blue and fin whales. During the 2014 heat wave, blue whale foraging effort was
lowest, while during the 2015–2016 El Niño fin whale foraging effort appeared worse. Strong
upwelling pulses occurred at several coastal locations in spring-summer 2015 that supported
high biological productivity at these sites and, being found closer to shore, blue whales may
have benefited in the otherwise unfavorable conditions prevalent farther offshore as the El Niño
event unfolded. In 2016 (during La Niña), both species had high levels of ARS as they foraged
in habitats with the coolest SST and highest CHL recorded during the study. Foraging effort
during 2017 was similarly high for both species and occurred in cool and productive conditions
(although for fin whales this was based on only one track). Thus, despite partial geographic and
environmental overlap, blue and fin whales have distinct ecological optima that likely are
reflections of different prey resource utilization in much of their range. With the 2014 shift to a
warm PDO phase (and a negative NPGO phase; Figure 36), in the next decade blue and fin
DoN | 2018 All-Range Pacific Annual Monitoring Report MARINE SPECIES MONITORING IN THE PACIFIC
1 April 2019 | 95
whale range and movement patterns in CCAL might change, given that the euphausiid and
pelagic schooling fish prey they forage upon respond strongly to decadal variability. The
tracking data from this project are consistent with a northward range contraction for blue whales
and an expansion for fin whales (Mate et al. 2018b).
2.2.1.15 MONITORING QUESTION: What is the ambient and anthropogenic soundscape in SOCAL? [PROJECT S5]
The ambient soundscape in SOCAL varies by HARP site (Figure 6). Average monthly SPLs
were lowest at Site H (west of San Clemente Island; western San Nicolas Basin, shadowed
from distant shipping (McDonald et al. 2008) and highest at Site P (east of San Clemente
Island; shallow, nearshore waters), which is likely attributable to nearby vessel activity (Wiggins
et al. 2018).
Low-frequency (<50 Hz) peaks in SPLs at all sites during the fall were caused by blue whale
calls, whereas fin whale calls were responsible for the winter peaks. Fin whale call presence
decreased during the 5-year period. Blue whale B calls also were at lower levels, but the
decrease does not appear as much as for fin whale calls. These decreases were attributed as
likely responses to the 2014–2016 El Niño event.
MFAS activity was detected at all three HARP sites with episodes of high cSEL and high
numbers of packet and wave-train detections that typically occurred during major naval training
exercises. Detections of MFAS outside the periods of designated major exercises is likely
attributable to unit-level training. The highest cSEL and detections were at Site N (south of San
Clemente Island), Site H also had substantial MFA sonar present, while the fewest were at Site
P.
Explosions were detected at the three evaluated HARP sites, with a general decrease in activity
over the 5-year period. The highest detections of explosions were at Site H. Pinniped deterrents
(i.e., ‘seal bombs’) in fishing operations were the most likely source of the majority of explosions
because the explosions occurred at night (when Navy training with explosives does not occur)
with short-duration reverberations and moderate RLs (Wiggins et al. 2018).
2.2.1.16 MONITORING QUESTION: What is the at-sea distribution of Guadalupe fur seals as they travel through the offshore waters of the Southern California Range Complex and Northwest Training and Testing area? [PROJECTS S6 and N4]
A total of 35 GFS was instrumented with satellite tags: 15 adult females, 10 juvenile females,
and 10 juvenile males. The tracking period reported here was from mid-November 2018 to early
January 2019, although tags were still transmitting data at the time of writing (Norris 2019).
Tagged adult females remained within 800 km of the mainland coast, and primarily traveled
north of GI (Figure 37a). Eight adult females made multiple foraging trips during the tracking
period, and six of these animals traveled south or west of GI on at least one trip. Juvenile
females also primarily dispersed north of GI with shorter trip durations (Figure 37b). The other
eight juvenile females traveled approximately 800 to 1,250 km from the island (mean = 1,050,
SD = 54 km) and 1,350 to 3,250 km total (mean = 2,266, SD = 188 km). Only one of these
animals returned to GI after 51 days at sea. All of these animals remained within 500 km of the
mainland coast, and some also spent time in continental-shelf waters (seafloor depth <200 m).

DoN | 2018 All-Range Pacific Annual Monitoring Report MARINE SPECIES MONITORING IN THE PACIFIC
1 April 2019 | 96
Whereas some adult and juvenile females exhibited more “resident” foraging behavior
(remained close and returned to GI), all juvenile males dispersed more than 600 km from GI and
did not return to the island, excluding two short initial foraging trips made by two males (#76 and
#94, Figure 37c). There was little variability in juvenile males’ trip duration (mean = 36, SD = 2
d), distance from the island (mean = 1,003, SD = 64 km), and total distance traveled (mean =
2,016, SD = 114 km). Juvenile males also used habitat more than 500 km offshore of the
mainland coast, with two traveling more than 1,100 km south of the island. A more detailed
analysis of GFS movements in relation to the SOCAL and NWTT ranges will be available in a
future report.
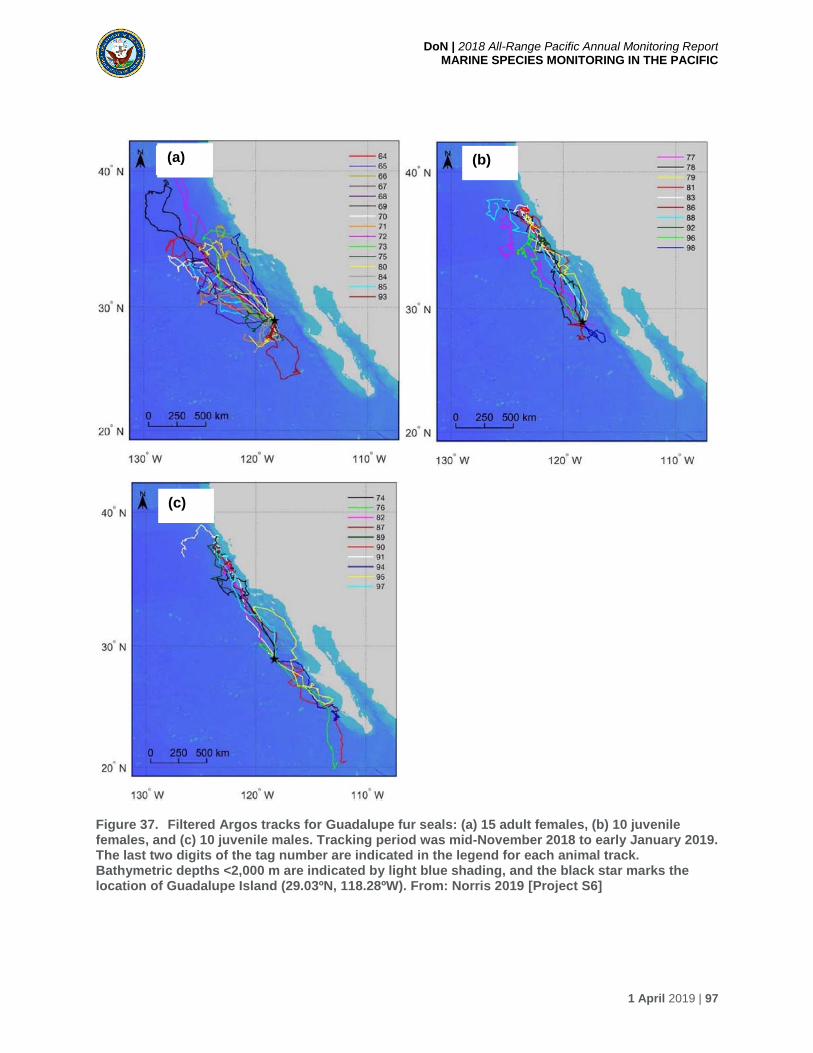
DoN | 2018 All-Range Pacific Annual Monitoring Report MARINE SPECIES MONITORING IN THE PACIFIC
1 April 2019 | 97
Figure 37. Filtered Argos tracks for Guadalupe fur seals: (a) 15 adult females, (b) 10 juvenile females, and (c) 10 juvenile males. Tracking period was mid-November 2018 to early January 2019. The last two digits of the tag number are indicated in the legend for each animal track. Bathymetric depths <2,000 m are indicated by light blue shading, and the black star marks the location of Guadalupe Island (29.03ºN, 118.28ºW). From: Norris 2019 [Project S6]
(a) (b)
(c)

DoN | 2018 All-Range Pacific Annual Monitoring Report MARINE SPECIES MONITORING IN THE PACIFIC
1 April 2019 | 98
2.2.1.17 MONITORING QUESTION: What is the occurrence, spatial and temporal distribution of salmonids in proximity to NWTT? [PROJECT N2]
A pilot study was conducted in June and August 2018 to test the feasibility of capturing and
tagging salmon at sea. Forty-five salmon (39 Chinook [Oncorhynchus tshawytscha] and 6 Coho
[O. kisutch]) were weighed, measured, and tagged at various depths along the coastal shelf of
Washington in the proximity of the NWTT study area (Figure 38) (Huff and Smith 2019). Hooks
were deployed for 12.8 hours (hr) across all of the sampling days (3.5 fish per hr).
Figure 38. Salmon weights, lengths, and depths of capture from a pilot study conducted during summer of 2018 that demonstrated the feasibility of capturing and tagging salmon at sea using available small platforms. From: Huff and Smith 2019 [Project N2]
During May of FY19, surveys are planned to capture, tag, and release salmonids with the
following objectives: determine the occurrence and timing of salmonids within the Navy training
ranges; describe the influence of environmental covariates on salmonid occurrence; and
describe the occurrence of salmonids in relation to SRKW distribution.
2.2.1.18 MONITORING QUESTION: What are the seasonal and annual occurrence patterns of Southern Resident killer whales relative to offshore Navy training ranges? [PROJECT N5]
Emmons et al. (2019) examined acoustic recordings from moored devices deployed 2008-2017.
Northern resident killer whales (NRKW) were most detected of the killer whales eco-types,
followed by transients and SRKW. There was a peak in occurrence in spring for all three

DoN | 2018 All-Range Pacific Annual Monitoring Report MARINE SPECIES MONITORING IN THE PACIFIC
1 April 2019 | 99
ecotypes at most sites. NRKW and transients were particularly prevalent on the Cape Flattery
Offshore recorder. There was a peak of SRKW at northern sites in April. Most detections of
SRKW were at nearshore sites except for increased detections at the Cape Flattery Offshore
site during late spring to early summer. Some of variability of occurrence between years may be
explained by warm water anomaly off Washington coast that formed in 2013 and persisted
through the end of 2015. MFAS was rarely detected at 13 of 19 recorder sites, with fewer
detections (<1% of days) at nearshore sites compared to mid-shelf and offshelf sites (3-8% of
days). The highest occurrence of MFA was during February and March followed by May, and
this overlaps with the occurrence of the three killer whale communities monitored.
2.2.1.19 MONITORING QUESTION: What is the occurrence of marine mammals and anthropogenic noise in the Gulf of Alaska? [PROJECT G1]
No new field work or analysis was performed in 2018. Cumulative results from previous years of
this project follow.
Acoustic data were recorded by HARPs deployed in the GOA TMAA at sites CB and QN from
May to September 2015, and at sites CB, AB, and QN (Figure 9) from April to September 2017.
These data were analyzed using scans of LTSAs and spectrograms for marine mammal and
anthropogenic sounds (Rice et al. 2018b). Four baleen whale species were recorded: blue, fin,
gray (Eschrichtius robustus), and humpback whales, and three odontocete species: sperm
whales, Cuvier’s beaked whales, and presumed Stejneger’s beaked whales (Mesoplodon
stejnegeri). No detections of North Pacific right whale (Eubalaena japonica) up calls occurred
during this monitoring period. Blue and fin whales were recorded at all sites, while gray whales
and humpbacks occurred in lower numbers at all sites. Blue whale B and D calls were most
prevalent during late summer and fin whale 20-Hz calls peaked in August and September, while
40-Hz calls were recorded at all sites throughout the recording period. Peaks in ambient sound
levels occurred in September at all sites due to the seasonal presence of blue and fin whales.
Gray whale M3 calls were detected in low numbers during July at sites CB and QN in 2015 and
during August at site CB; no M3 calls were detected at any site in 2017. Humpback whale calls
were detected in low numbers during summer months at sites CB and QN and were not
detected at site AB in 2017. Sperm whale clicks occurred throughout the summer at all sites, but
were most common at site CB. Cuvier’s beaked whales were most common at site AB during
early summer, with no detections occurring July to September while presumed Stejneger’s
beaked whales were most common throughout the summer at site CB.
Anthropogenic signals were also detected in the GOA TMAA during the 2015 and 2017
monitoring periods, including MFAS, low-frequency active sonar (LFAS), and explosions. The
few MFAS and LFAS events detected were concurrent with U.S. Navy training exercises in the
area. Explosions were detected in low numbers at all sites, but did not overlap with U.S. Navy
testing and training activities.
2.2.2 Conceptual Framework Category 2. Exposure
The following sections summarize progress made this monitoring year to address the issue of
exposure of protected marine species to anthropogenic noise generated by U.S. Navy training
and testing activities. Only projects conducted in HSTT, SOCAL, and MITT addressed this topic.

DoN | 2018 All-Range Pacific Annual Monitoring Report MARINE SPECIES MONITORING IN THE PACIFIC
1 April 2019 | 100
In HRC, the monitoring program invested in the installation two WC “Mote” satellite-tag-data
receiver stations with coverage over the waters at and adjacent to PMRF, in order to benefit
multiple monitoring projects. Two units are installed on Niihau (installed August 2017), as well
as at Makaha Ridge on Kauai (installed February 2016). The current projects that can
potentially benefit from the improved tag data collection capability these stations provide are:
[H2], [H5], [H6], and the Hawaii-portion of [N1].
Multiple monitoring projects in 2018 addressed questions of marine mammal exposure to
sound—specifically species that may be exposed to U.S. Navy sonar and underwater
detonation/demolitions (UNDETs). This work included tracking animal movements and habitat-
use patterns in the vicinity of training and testing ranges. Projects in several study areas
addressed the spatial and temporal overlap of animal distribution with areas typically used for
training and testing activities. One new project addressed the potential exposure of corals to
physical impacts from training ordnance.

DoN | 2018 All-Range Pacific Annual Monitoring Report MARINE SPECIES MONITORING IN THE PACIFIC
1 April 2019 | 101
2.2.2.1 MONITORING QUESTION: What is the exposure of cetaceans and sea turtles to explosives and/or sonar in the MITT study area? [PROJECT M1]
No information exists on the timing of specific explosives training off Guam during the 2018
surveys (Hill et al. 2019). Based on the locations of the explosives training areas (Figure 39),
and the locations of cetacean sightings and satellite-tag tracks, certain species may be
impacted by explosive activities. During the summer 2018 surveys, sperm whales and
pantropical spotted dolphins were encountered within 3 km of the Agat Bay UNDET site, and
the depths where pantropical spotted dolphins were encountered in previous surveys are similar
to that of the Agat Bay UNDET site (1,750 m). Twelve additional species have been identified
that could be exposed to underwater detonations (Hill et al. 2018a). These include bottlenose
dolphins, pantropical spotted dolphins, short-finned pilot whales, rough-toothed dolphins, false
killer whales, sperm whales, dwarf sperm whales, pygmy killer whales, Bryde’s whales, melon-
headed whales, Blainville’s beaked whales, and Cuvier’s beaked whales. Sea turtle exposure
was not addressed.
2.2.2.2 MONITORING QUESTION: What is the exposure of sea turtles to explosives and/or sonar in the MITT study area? [PROJECT M2]
Satellite tagging of sea turtles was conducted August 1-12, 2018.Tag tracks obtained in 2018
were not near UNDET areas. Final analysis and reporting for 2013-2018 data is expected in
2020. Interim results are summarized by S.L. Martin et al. (2019), reflect results from Martin and
Jones (2017). Tagging data reveal consistent patterns of movement and habitat use by turtles
near UNDET areas. While turtles are spending significant amounts of time in and moving
through areas within 1 to 2 km of Agat Bay Mine Neutralization Site, Piti Point Mine
Neutralization Site, and Outer Apra Harbor Underwater Detonation Site (Figure 39), there
continues to be no direct overlap of the turtles with those UNDET areas. The low frequency of
GPS locations obtained from these tags (often a maximum of one per day) could result in the
lack of direct overlap between these sites and turtle locations.

DoN | 2018 All-Range Pacific Annual Monitoring Report MARINE SPECIES MONITORING IN THE PACIFIC
1 April 2019 | 102
Figure 39. U.S. Navy underwater explosive operation sites off Guam. Circles represent the 640-m exclusion zones. Piti Mine Neutralization Area = 750 m depth, Outer Apra Harbor UNDET Area =38 m depth, Agat Bay UNDET Area = 1,750 m depth. From Hill et al. 2018c [Project M1]

DoN | 2018 All-Range Pacific Annual Monitoring Report MARINE SPECIES MONITORING IN THE PACIFIC
1 April 2019 | 103
2.2.2.3 MONITORING QUESTION: What in-water impacts to corals from ordnance are observable at FDM? [PROJECT M3]
Because of anomalously warm SSTs, on average 77.4 percent of corals surveyed had some
type of bleaching (Figure 16), whereas broken, diseased, or dead corals represented less than
1 percent of the corals observed. Only 22 percent of the corals were considered “healthy” due to
the widespread bleaching. Little evidence supported any adverse impacts to coral from U.S.
Navy training, including high-explosive impacts due to ordnance use around the island. Only
three fresh ordnance items were observed in 2017, but no blast pits, craters, or significant areas
of coral breakage. As noted in previous marine surveys between 1997 and 2003 at FDM
(e.g., Smith and Marx 2016), no significant impacts could be tied to bombing activities and many
ordnance items were even found to support scleractinian coral growth on them.
2.2.2.4 MONITORING QUESTION: What is the occurrence and estimated received levels of MFAS on 'blackfish', humpback, minke, sperm and Blainville's beaked whales within the PMRF instrumented range? [PROJECT H1]
C.R. Martin et al. (2019) estimated the long-term relative abundance results for baleen whales
at PMRF from February 2002 to August 2018. Results indicated that at any instant there was a
maximum of nine minke whales tracked at the same time, compared to one or two humpback
whales. From January 2011 to August 2018 there was a maximum of four low-frequency group
whales that occurred at the same time. Singing humpback whales and other vocalizing low-
frequency baleen whales had lower abundances compared to the minke whales. In addition,
one track from a low-frequency whale occurred in June 2018 and was manually validated to be
a Bryde’s whale. All baleen whales demonstrated seasonal occurrence between November and
March, except for a Bryde’s whale call detected in June 2018—suggesting they may occur on
the range year-around.
The long-term relative abundance results for Blainville’s beaked whales from January 2007 to
August 2018 revealed an average of 1.47 dives per hr, and a maximum of 5.2 dives per hr. Fully
validated Cross Seamount-type beaked whale dives occurred far less frequently than Blainville’s
beaked whale dives, resulting in typically less than 0.2 dives per hr. For the first time, Cuvier’s
beaked whale dives were analyzed and overall had a slightly higher number of group foraging
dives per hr than Cross Seamount-type beaked whales, typically between 0.1 and 0.3 dives per
hr. Sperm whale vocalizations were detected between September and May. However, the
number of localizations was highly variable over short periods of time. The number of fully
validated killer whale groups from January 2002 to August 2018 indicated sporadic presence,
with group counts varying from one to nine per month.
C.R. Martin et al. (2019) also reported localization and tracking results for baleen whales
(minke, humpback, and the low-frequency group [fin/sei/Bryde’s] whales) and sperm whales
using data from 6 February 2002 to 12 September 2006. Localization of odontocete groups to
the nearest hydrophone was performed for the following species: Blainville’s, Cuvier’s, and
Cross Seamount-type beaked whales, and killer whales.
Classified acoustic data from the February 2018 PMRF SCC were processed and analyzed for
hull-mounted MFAS exposures on minke, humpback, and low-frequency vocalizing whales
(C.R. Martin et al. 2019). Four individual minke whales were automatically tracked and

DoN | 2018 All-Range Pacific Annual Monitoring Report MARINE SPECIES MONITORING IN THE PACIFIC
1 April 2019 | 104
validated, and a cSEL was calculated over the duration of the animals’ tracks for all hull-
mounted MFAS transmissions (Figure 40). The highest cumulative received level was 168.1
decibels re 1 microPascal-squared-second (dB re 1µPa2s), which was observed for track 2 (light
blue, Figure 41). The disturbance analysis process was also performed for the other tracked
species (low-frequency baleen and humpback whales) during the February 2018 SCC;
however, no tracks from these species were within the hydrophone array during the training
event. (See Section 2.2.3.1. for results related to response to MFAS.)
Figure 40. Minke whale tracks within the study area, before, during, and after the portion of the February 2018 SCC that utilized hull-mounted MFAS. Four calling minke whales were tracked during this time. Track 1 is depicted in blue, track 2 in light blue, track 3 in green, and track 4 in red. Latitude is shown on the vertical axis, longitude on the horizontal axis and “h” represents each bottom mounted hydrophone. From C.R. Martin et al. 2019 [Project H1]
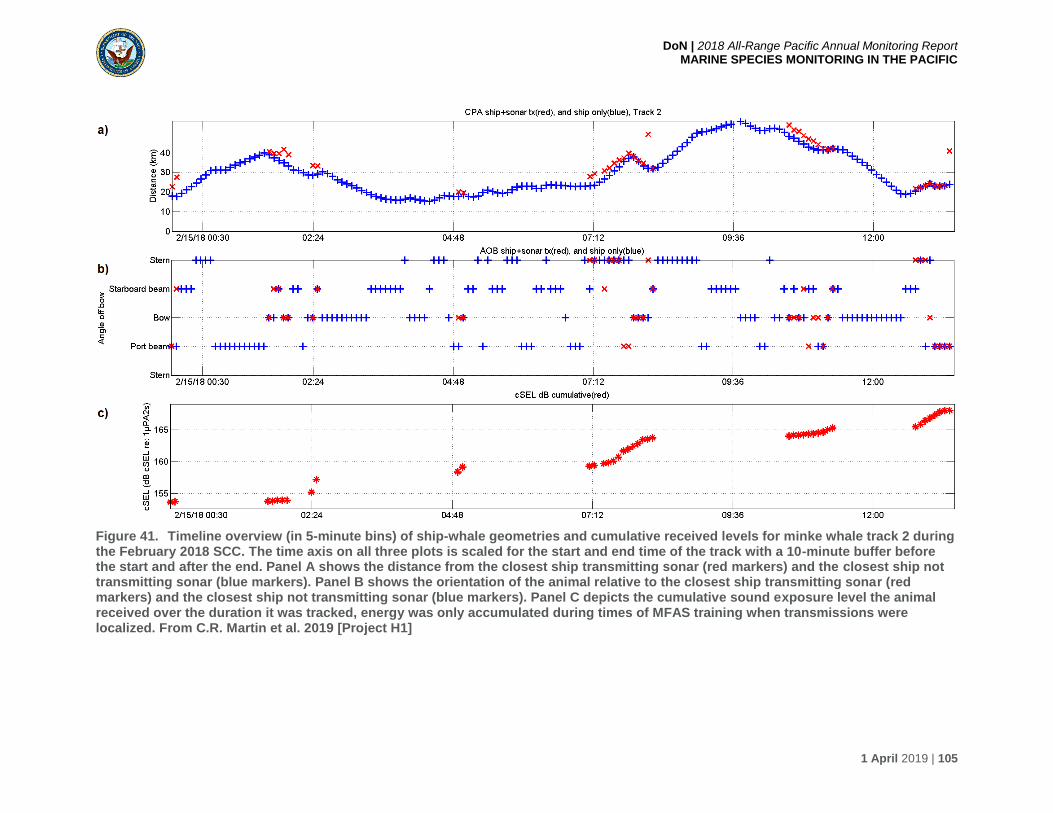
DoN | 2018 All-Range Pacific Annual Monitoring Report MARINE SPECIES MONITORING IN THE PACIFIC
1 April 2019 | 105
Figure 41. Timeline overview (in 5-minute bins) of ship-whale geometries and cumulative received levels for minke whale track 2 during the February 2018 SCC. The time axis on all three plots is scaled for the start and end time of the track with a 10-minute buffer before the start and after the end. Panel A shows the distance from the closest ship transmitting sonar (red markers) and the closest ship not transmitting sonar (blue markers). Panel B shows the orientation of the animal relative to the closest ship transmitting sonar (red markers) and the closest ship not transmitting sonar (blue markers). Panel C depicts the cumulative sound exposure level the animal received over the duration it was tracked, energy was only accumulated during times of MFAS training when transmissions were localized. From C.R. Martin et al. 2019 [Project H1]

DoN | 2018 All-Range Pacific Annual Monitoring Report MARINE SPECIES MONITORING IN THE PACIFIC
1 April 2019 | 106
Additionally, six humpback whales were satellite tagged as part of the vessel-based tagging and
photo-ID survey conducted off Kauai, Hawaii, 4–12 February 2018. Five of these six whales
were exposed to MFAS during the SCC, with a calculated maximum RL of 156 decibels
referenced to 1 microPascal (dB re 1µPa).
2.2.2.5 MONITORING QUESTION: What is the effectiveness of Navy lookouts on Navy surface ships and what species are sighted during sonar training events? [PROJECT H3]
Oliveira et al. (2019) reported that the majority of observation time of Navy lookouts in Hawaii
during 2018 was spent in Beaufort Sea state of 2, 3, or 4 (81 percent). Of the 22 unique
sightings (Figure 42) made by the MMO team during the seven days of effort, only two of these
sightings were also detected by the lookout team, though these include sightings beyond
mitigation range. No sightings were made by the lookout team that were not detected by the
MMO team. Confirmed species included humpback whales, short-finned pilot whales, and a
killer whale, accounting for 68 percent of all individuals sighted. The remainder of sightings
included unidentified large whales and unidentified dolphins. Four sightings occurred while
sonar was being transmitted from the ship. These included two unidentified large whale pairs, a
single humpback whale, and five unidentified dolphins. One large unidentified whale was
observed within the mitigation zone resulting in sonar being shut off and a ship course change.
The bearing and distance of a sighting to the ship during sonar transmission can be used to
determine the animals’ RLs of sound exposure. This is the eighteenth such survey to estimate
the effectiveness of Navy lookouts. Data is currently being compiled across all embarks in the
Pacific and Atlantic oceans for future analysis per this study’s design.
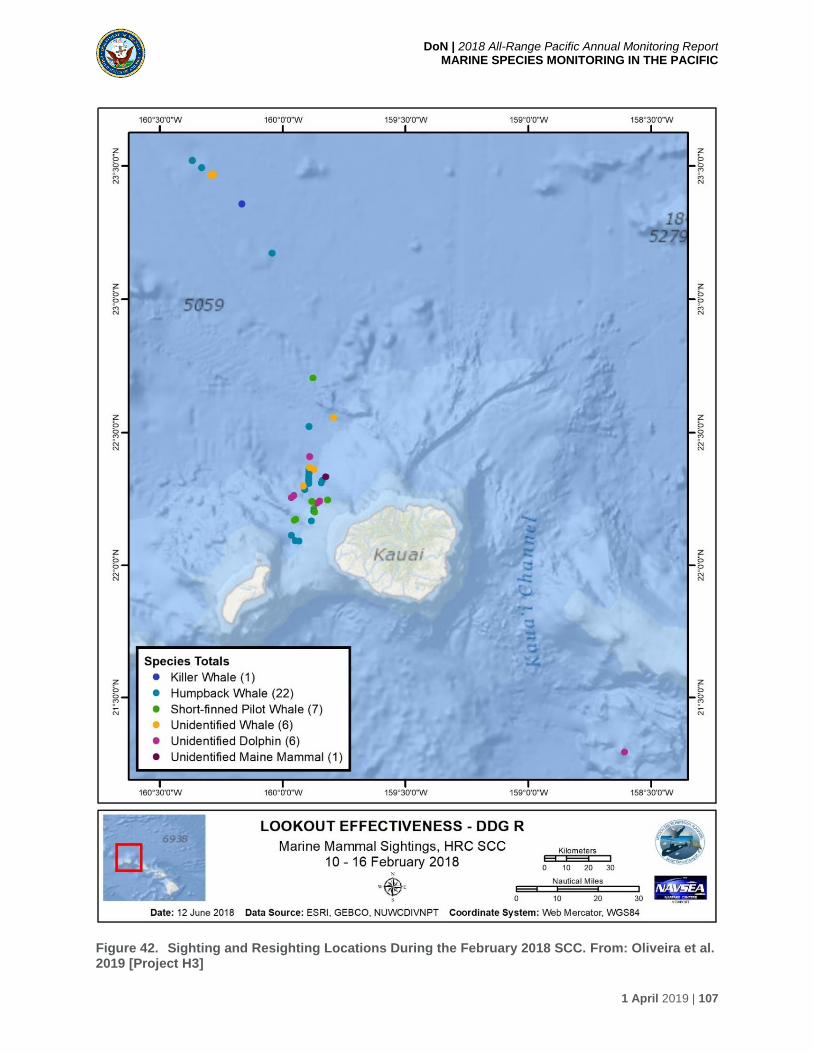
DoN | 2018 All-Range Pacific Annual Monitoring Report MARINE SPECIES MONITORING IN THE PACIFIC
1 April 2019 | 107
Figure 42. Sighting and Resighting Locations During the February 2018 SCC. From: Oliveira et al. 2019 [Project H3]
DoN | 2018 All-Range Pacific Annual Monitoring Report MARINE SPECIES MONITORING IN THE PACIFIC
1 April 2019 | 108
2.2.2.6 MONITORING QUESTION: What are the occurrence of and estimated received levels of MFAS on ‘blackfish’ and rough-toothed dolphins within the PMRF instrumented range? [PROJECT H5]
In an effort to continue assessing the exposure levels of marine mammals to MFAS, data are
being analyzed from eight satellite tags deployed on odontocetes prior to three SCC events held
in February 2016, August 2017, and August 2018, which are likely to have had some MFAS
exposure (Baird et al. 2019). These include three short-finned pilot whales, two rough-toothed
dolphins, two melon-headed whales, and one pantropical spotted dolphin. In addition to Argos
position data, one pilot whale tag provided Fastloc-GPS positions and dive data, and two rough-
toothed dolphin tags provided dive data. This project utilized Fastloc GPS tags for the first time,
in addition to standard Argos tags The Fastloc tags produced more than twice as many
locations than Argos during the 10-d window, and behavior data coverage during that period
ranged from 77.4 to 99.3 percent.
The short-finned pilot whales tagged represent individuals from two different communities, and
thus individuals in these groups likely have different prior exposure histories to MFAS. Exposure
for one pilot whale in 2018 spanned approximately 6 hr when the SCC was terminated
prematurely due to the approach of Hurricane Lane (Figure 43). Exposure to one rough-toothed
dolphin in 2016 spanned approximately 68 hr (Figure 44). Analyses to estimate RLs are
underway, and a final report on these analyses will be available later in 2019.

DoN | 2018 All-Range Pacific Annual Monitoring Report MARINE SPECIES MONITORING IN THE PACIFIC
1 April 2019 | 109
Figure 43. Locations of short-finned pilot whale GmTag214 before (white), during (red), and after (yellow) MFAS use, during August 2018. Locations shown are Fastloc-GPS locations. Consecutive locations are joined by a line. In this case the period of MFAS exposure spanned approximately 6 hr, as the SCC was terminated early due to the approach of Hurricane Lane. The PMRF outer boundary is shown in light blue. From Baird et al. 2019 [Project H5]
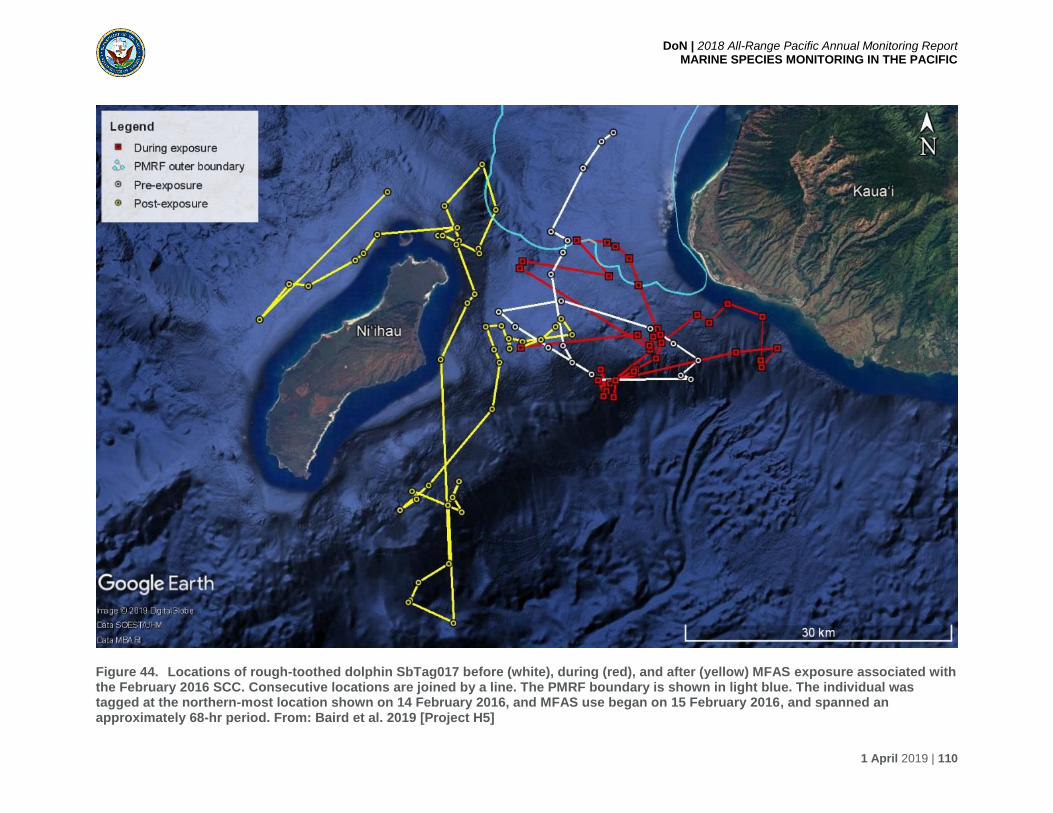
DoN | 2018 All-Range Pacific Annual Monitoring Report MARINE SPECIES MONITORING IN THE PACIFIC
1 April 2019 | 110
Figure 44. Locations of rough-toothed dolphin SbTag017 before (white), during (red), and after (yellow) MFAS exposure associated with the February 2016 SCC. Consecutive locations are joined by a line. The PMRF boundary is shown in light blue. The individual was tagged at the northern-most location shown on 14 February 2016, and MFAS use began on 15 February 2016, and spanned an approximately 68-hr period. From: Baird et al. 2019 [Project H5]

DoN | 2018 All-Range Pacific Annual Monitoring Report MARINE SPECIES MONITORING IN THE PACIFIC
1 April 2019 | 111
2.2.3 Conceptual Framework Category 3. Response
The following section summarizes progress made this monitoring year to address the issue of
response of protected marine species to anthropogenic noise generated by U.S. Navy training
and testing activities. Only one project, which was conducted in HRC, specifically addressed
this topic in 2018. Researchers analyzed behavioral responses based on data collected before,
during, and after a training event, and found differences in acoustic activity such as calling, dive
behavior, and directional changes in travel.
2.2.3.1 MONITORING QUESTION: What, if any, are the short-term behavioral responses of ‘blackfish’ and humpback, minke, sperm, and Blainville’s beaked whales when exposed to MFAS/explosions at different levels/conditions at PMRF? [PROJECT H1]
A disturbance analysis was performed for four minke whales tracked at PMRF during the
February 2018 SCC (C.R. Martin et al. 2019). Results indicated that minke whales tend to
continue calling when exposed to cSEL up to 168.1 dB re 1µPa2s, which was the highest
cumulative received level recorded for any of the four whales tracked. However, the animal
exposed to this sound level did exhibit an abrupt heading change when exposed to MFAS
emitted by a ship 19.5 km away (track 2 in light blue, Figure 40). For another minke whale track
analyzed during the SCC, an approaching ship that was not transmitting MFAS had a closest
point of approach of 1 km while the animal continued to vocalize at the nominal call rate
(approximately 400 to 500 seconds) with no change in heading for an additional 25 minutes. At
the onset of MFAS transmissions, this animal ceased vocalizing, a possible response to MFAS
exposure (track 1 in dark blue, Figure 40).
Six satellite tags were deployed on humpback whales prior to the February 2018 SCC, and five
of the six whales were exposed to MFAS during the event (C.R. Martin et al. 2019). The whales’
movements were somewhat different than those of whales tagged the previous year, with one
whale traveling to Oahu and others spending more time near Kauai before moving west to
Niihau. Although there were some bouts of extreme movements (e.g., rapid bursts and high
turning angles), only one statistically significant change in behavior was observed relative to
MFAS. At the onset of MFAS (max RL of 156 dB re 1µPa), a whale traveling north onto the
range changed direction and began traveling south, while executing a series of steep dives of
increasing depths. RLs estimated at the bottom of each dive indicated that levels were lower
during these deeper dives, possibly in an attempt to reduce RLs while moving away from the
source. Once MFAS stopped, dive behavior returned to normal and the whale returned to its
original northbound travel.
Results from 2018, combined with those from 2017, suggest that humpback whales spend little
time on or near the range, which would reduce their likelihood of exposure to ship movement or
MFAS. When exposed to MFAS, most whales did not appear to respond, and the one apparent
response ended as soon as the sonar ended and therefore did not lead to a long-duration
response.

DoN | 2018 All-Range Pacific Annual Monitoring Report MARINE SPECIES MONITORING IN THE PACIFIC
1 April 2019 | 112
2.2.4 Conceptual Framework Category 4. Consequences
The following section summarizes progress made this monitoring year to address potential
marine species population consequences caused by anthropogenic noise generated by U.S.
Navy training and testing activities. The U.S. Navy research and development efforts funded by
the ONR are the primary avenue for exploring the population consequences of disturbance
(PCoD), due to high technical risk and expected long-term project timescales. However, two
projects conducted in HSTT did investigate multi-year trends of abundance, which is a topic also
relevant to population consequences. As part of these projects, the abundance and density of
two beaked whale species were estimated over 4-year and 9-year periods, and no population-
level changes were detected for the time periods studied.
2.2.4.1 MONITORING QUESTIONS: What are the long-term trends in occurrence of marine mammals (e.g., minke, humpback, fin, Bryde’s, Blainville’s) on the PMRF range? [PROJECT H2]; and, Does exposure to sonar or explosives impact the long-term fitness and survival of individuals or the population, species, or stock (with initial focus on Cuvier’s beaked whales)? [PROJECT S2]
Acoustic data archived at PMRF from 2015 through 2018 were used to estimate abundance of
Blainville’s beaked whales using the dive-counting passive acoustic approach (DiMarzio et al.
2019). The calculated mean abundance per year of Blainville’s beaked whales detected on the
PMRF range for years 2015 through 2018 was between 4 and 12 individuals, and abundance
values from 2015 to 2018 appeared to be stable (DiMarzio et al. 2019). Seasonal abundance
peaked in June (with the highest mean value in June 2017 at 16.56 animals) and a smaller peak
in December (Figure 45). The lowest abundance values were in August and February, with the
lowest value being 2.57 animals in August 2016. No abundances were calculated for minke,
humpback, fin, or Bryde’s whales.
Figure 45. Mean monthly abundance of Blainville’s beaked whales at PMRF, based on passive acoustic monitoring data collected from 2015 through 2018. From: DiMarzio et al. 2019 [Project H3]

DoN | 2018 All-Range Pacific Annual Monitoring Report MARINE SPECIES MONITORING IN THE PACIFIC
1 April 2019 | 113
Abundance of Cuvier’s beaked whales at SOAR was estimated using the dive-counting passive
acoustic approach, based on archived PAM data collected from August 2010 through July 2018.
Monthly mean abundance peaked in January (at 34.45 animals) with a second peak in May (of
32.61 animals). Abundance was lowest in September (at 11.28 animals), with a smaller drop in
March (at 23.10 animals) (Figure 46). Between August 2010 and July 2018, abundance of
Cuvier’s beaked whales at SOAR appeared to be stable or slightly increasing. Data from July
through December 2018 are currently being processed and will be available in a future report.
Figure 46. Corrected mean monthly abundance of Cuvier’s beaked whales at SOAR, based on passive acoustic monitoring data collected from August 2010 through July 2018. Upper and lower confidence intervals are also shown, calculated from the monthly CVs. From: DiMarzio et al. 2019 [Project H3]

DoN | 2018 All-Range Pacific Annual Monitoring Report MARINE SPECIES MONITORING IN THE PACIFIC
1 April 2019 | 114
This page intentionally left blank.
DoN | 2018 All-Range Pacific Annual Monitoring Report ADAPTIVE MANAGEMENT AND YEARLY MONITORING GOALS
1 April 2019 | 115
3. Adaptive Management and Yearly Monitoring
Goals
The Strategic Planning process is used to set ISOs, identify potential species of interest at a
regional scale, and evaluate and select specific monitoring projects to fund or continue
supporting for a given FY. Continuing or new monitoring projects for calendar year 2019 are
listed in Table 5 and are also listed on the U.S. Navy’s Marine Species Monitoring website:
http://www.navymarinespeciesmonitoring.us/regions/pacific/current-projects/

DoN | 2018 All-Range Pacific Annual Monitoring Report ADAPTIVE MANAGEMENT AND YEARLY MONITORING GOALS
1 April 2019 | 116
Table 5. 2019 Monitoring projects for Pacific Navy Ranges: HSTT (HRC and SOCAL), MITT, NWTT, GOA TMAA.
Project Description Monitoring Questions Intermediate Scientific Objectives
(numbered as per Figure 12) Continuing or Proposed
New Start
Location: Hawaii Range Complex (HRC)
Title: Long Term
Acoustic Monitoring utilizing the instrumented range at PMRF
Methods: Analysis of
archived PMRF hydrophone recordings
Performer: SSC Pacific
and Naval Undersea Warfare Center Newport
What are the long-term trends in occurrence of marine mammals (e.g., minke, humpback, fin, Bryde's, Blainville's beaked whales) on the PMRF range?
#1: Determine what species and populations of marine mammals and ESA-listed species are present in Navy range complexes and
testing ranges.
#8: Application of passive acoustic tools and techniques for detecting, classifying, and tracking marine mammals1.
#9: Application of analytic methods to evaluate exposure and/or behavioral response of marine mammals to Navy training and testing activities.
#12: Evaluate trends in distribution and abundance for populations of protected species that are regularly exposed to sonar and underwater explosives.
#13: Assess existing data sets which could be utilized to address the current objectives1.
Continuing from FY15

DoN | 2018 All-Range Pacific Annual Monitoring Report ADAPTIVE MANAGEMENT AND YEARLY MONITORING GOALS
1 April 2019 | 117
Project Description Monitoring Questions Intermediate Scientific Objectives
(numbered as per Figure 12) Continuing or Proposed
New Start
Title: Estimation of
Received Levels of MFAS and Behavioral Response of Marine Mammals at PMRF
Methods: PAM (PMRF),
tagging (GPS LIMPET tags if available), photo-ID, biopsy, visual survey.
Performer: SSC Pacific;
Cascadia Research Collective, and HDR
What is the occurrence and estimated received levels of MFAS on 'blackfish,' humpback, minke, sperm and Blainville's beaked whales within the PMRF instrumented range
What are the spatial-movement and habitat-use patterns of species that are exposed to MFAS, and how do these patterns influence exposure and potential responses
What, if any, are the short-term behavioral responses of ‘blackfish’ and humpback, minke, sperm, and Blainville’s beaked whales when exposed to MFAS/explosions at different levels/conditions at PMRF
#3: Determine what species and populations of marine mammals and ESA-listed species are exposed to Navy training and testing activities.
#4: Establish the baseline habitat uses and movement patterns of marine mammals and sea turtles where Navy training and testing activities occur.
#6: Establish the regional baseline vocalization behavior, including seasonality and acoustic characteristics) of marine mammals where Navy training and testing activities occur.
#7: Determine what behaviors can most effectively be assessed for potential response to Navy training and testing activities.
#8: Application of passive acoustic tools and techniques for detecting,
classifying, and tracking marine mammals1.
#9: Application of analytic methods to evaluate exposure and/or behavioral response of marine mammals to Navy training and testing activities.
#10: Evaluate acoustic exposure levels associated with behavioral responses of marine mammals to support development and refinement of acoustic risk functions.
#12: Evaluate trends in distribution and abundance for populations of protected species that are regularly exposed to sonar and underwater explosives.
#13: Assess existing data sets which could be utilized to address the
current objectives1.
Continuing from FY15
Location: Hawaii Range Complex (HRC) (continued)
Title: Navy Civilian
Marine Mammal Observers on DDGs
Methods: Visual survey
embarked on DDG during training exercise
Performer: U.S. Navy
and HDR, Inc.
What is the effectiveness of Navy lookouts on Navy surface ships for mitigation and what species are sighted during sonar training events (This project spans all Navy at-sea ranges.)
#3: Determine what species and populations of marine mammals and ESA-listed species are exposed to Navy training and testing
activities.
#4: Establish the baseline habitat uses and movement patterns of marine mammals and sea turtles where Navy training and testing activities occur.
#11: Evaluate behavioral responses of marine mammals exposed to Navy training and testing activities to support PCoD development and application.
Continuing from FY10
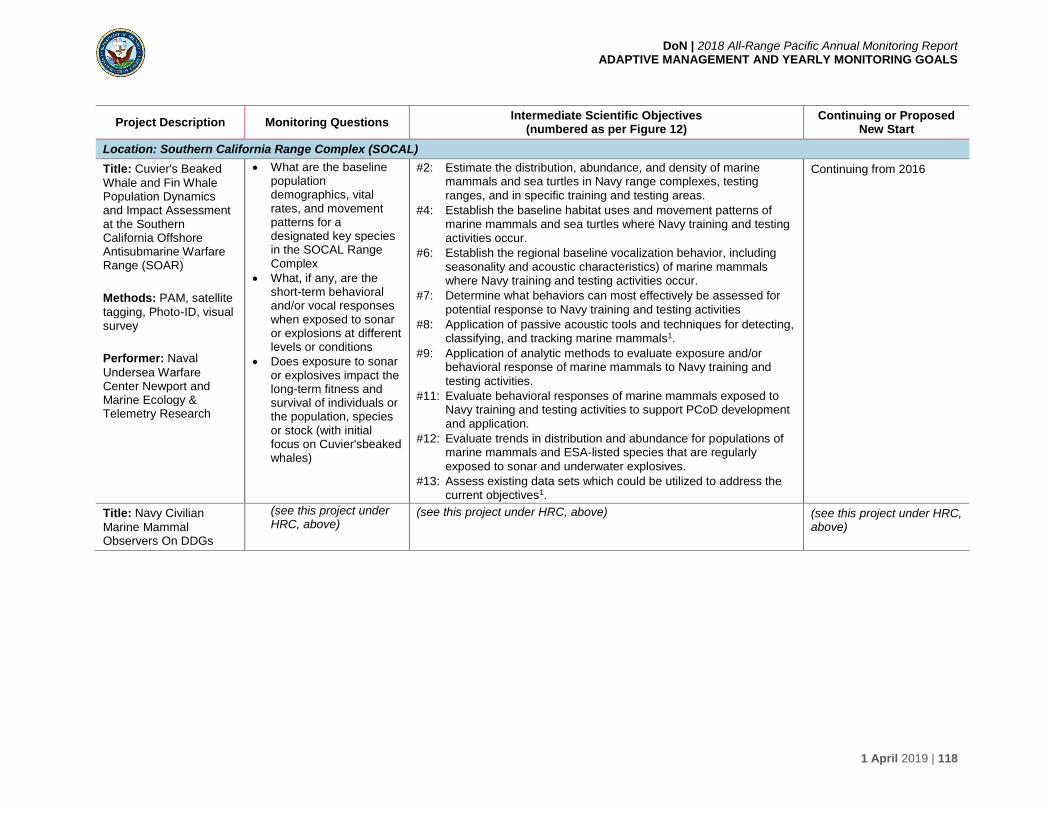
DoN | 2018 All-Range Pacific Annual Monitoring Report ADAPTIVE MANAGEMENT AND YEARLY MONITORING GOALS
1 April 2019 | 118
Project Description Monitoring Questions Intermediate Scientific Objectives
(numbered as per Figure 12) Continuing or Proposed
New Start
Location: Southern California Range Complex (SOCAL)
Title: Cuvier's Beaked
Whale and Fin Whale Population Dynamics and Impact Assessment at the Southern California Offshore Antisubmarine Warfare Range (SOAR)
Methods: PAM, satellite
tagging, Photo-ID, visual survey
Performer: Naval
Undersea Warfare Center Newport and Marine Ecology & Telemetry Research
What are the baseline population demographics, vital rates, and movement patterns for a designated key species in the SOCAL Range Complex
What, if any, are the short-term behavioral and/or vocal responses when exposed to sonar or explosions at different levels or conditions
Does exposure to sonar or explosives impact the long-term fitness and survival of individuals or the population, species or stock (with initial focus on Cuvier'sbeaked whales)
#2: Estimate the distribution, abundance, and density of marine mammals and sea turtles in Navy range complexes, testing
ranges, and in specific training and testing areas.
#4: Establish the baseline habitat uses and movement patterns of marine mammals and sea turtles where Navy training and testing activities occur.
#6: Establish the regional baseline vocalization behavior, including seasonality and acoustic characteristics) of marine mammals where Navy training and testing activities occur.
#7: Determine what behaviors can most effectively be assessed for
potential response to Navy training and testing activities
#8: Application of passive acoustic tools and techniques for detecting, classifying, and tracking marine mammals1.
#9: Application of analytic methods to evaluate exposure and/or behavioral response of marine mammals to Navy training and
testing activities.
#11: Evaluate behavioral responses of marine mammals exposed to Navy training and testing activities to support PCoD development
and application.
#12: Evaluate trends in distribution and abundance for populations of marine mammals and ESA-listed species that are regularly
exposed to sonar and underwater explosives.
#13: Assess existing data sets which could be utilized to address the current objectives1.
Continuing from 2016
Title: Navy Civilian
Marine Mammal Observers On DDGs
(see this project under HRC, above)
(see this project under HRC, above) (see this project under HRC, above)
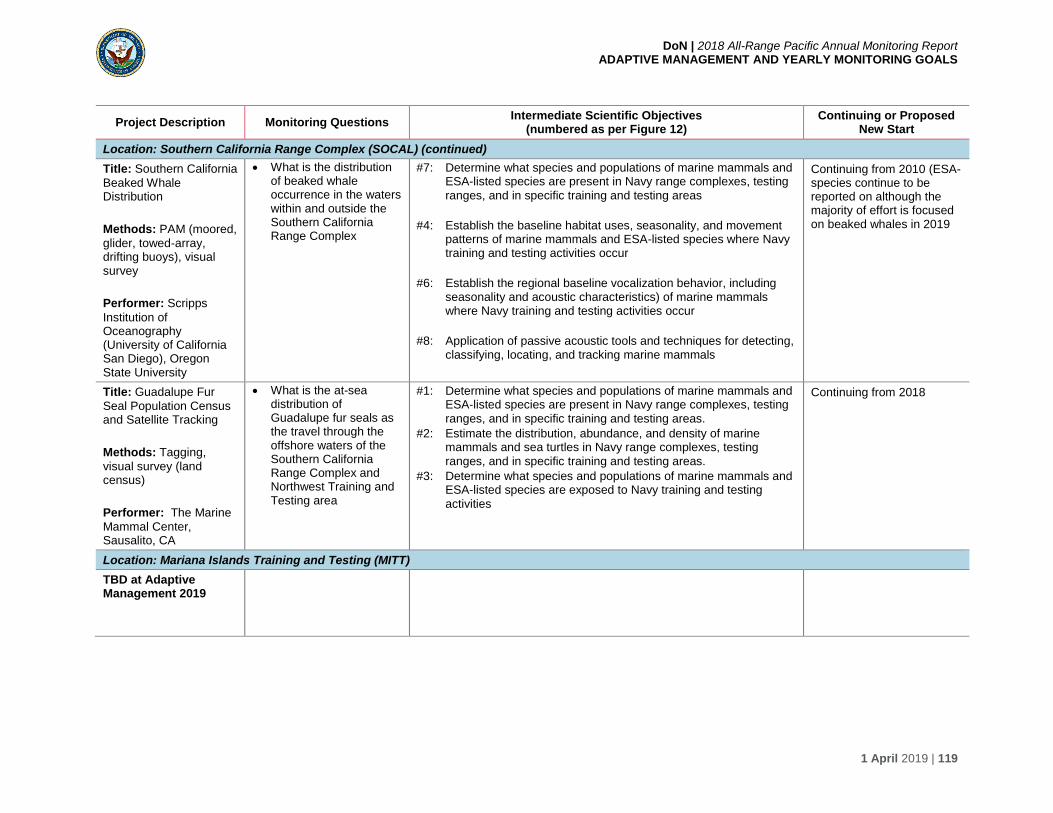
DoN | 2018 All-Range Pacific Annual Monitoring Report ADAPTIVE MANAGEMENT AND YEARLY MONITORING GOALS
1 April 2019 | 119
Project Description Monitoring Questions Intermediate Scientific Objectives
(numbered as per Figure 12) Continuing or Proposed
New Start
Location: Southern California Range Complex (SOCAL) (continued)
Title: Southern California
Beaked Whale Distribution
Methods: PAM (moored,
glider, towed-array, drifting buoys), visual survey
Performer: Scripps
Institution of Oceanography (University of California San Diego), Oregon State University
What is the distribution of beaked whale occurrence in the waters within and outside the Southern California Range Complex
#7: Determine what species and populations of marine mammals and ESA-listed species are present in Navy range complexes, testing
ranges, and in specific training and testing areas
#4: Establish the baseline habitat uses, seasonality, and movement patterns of marine mammals and ESA-listed species where Navy training and testing activities occur
#6: Establish the regional baseline vocalization behavior, including seasonality and acoustic characteristics) of marine mammals where Navy training and testing activities occur
#8: Application of passive acoustic tools and techniques for detecting, classifying, locating, and tracking marine mammals
Continuing from 2010 (ESA-species continue to be reported on although the majority of effort is focused on beaked whales in 2019
Title: Guadalupe Fur
Seal Population Census and Satellite Tracking
Methods: Tagging,
visual survey (land census)
Performer: The Marine
Mammal Center, Sausalito, CA
What is the at-sea distribution of Guadalupe fur seals as the travel through the offshore waters of the Southern California Range Complex and Northwest Training and Testing area
#1: Determine what species and populations of marine mammals and ESA-listed species are present in Navy range complexes, testing
ranges, and in specific training and testing areas.
#2: Estimate the distribution, abundance, and density of marine mammals and sea turtles in Navy range complexes, testing
ranges, and in specific training and testing areas.
#3: Determine what species and populations of marine mammals and ESA-listed species are exposed to Navy training and testing
activities
Continuing from 2018
Location: Mariana Islands Training and Testing (MITT)
TBD at Adaptive Management 2019

DoN | 2018 All-Range Pacific Annual Monitoring Report ADAPTIVE MANAGEMENT AND YEARLY MONITORING GOALS
1 April 2019 | 120
Project Description Monitoring Questions Intermediate Scientific Objectives
(numbered as per Figure 12) Continuing or Proposed
New Start
Location: Northwest Training and Testing (NWTT)
Title: Distribution of
Southern Resident Killer Whales and their Prey in the Pacific Northwest
Methods: Passive
acoustic monitoring, model development, visual survey, tagging, analysis of archival data.
Performer: National
Marine Fisheries Service Northwest Fisheries Science Center, Univ. of Washington (School of Aquatic and Fisheries Sciences), Cascadia Research Collective
What are the seasonal and annual occurrence patterns of Southern Resident killer whales relative to offshore Navy training ranges
What is the oceanic distribution and seasonal variability of ESA-listed salmonid species that may be important prey for the Southern Resident Killer Whale
#1: Determine what species and populations of marine mammals and ESA-listed species are present in Navy range complexes, testing
ranges, and in specific training and testing areas.
#2: Estimate the distribution, abundance, and density of marine mammals and sea turtles in Navy range complexes, testing ranges, and in specific training and testing areas.
#3: Determine what species and populations of marine mammals and ESA-listed species are exposed to Navy training and testing activities.
#4: Establish the baseline habitat uses and movement patterns of marine mammals and sea turtles where Navy training and testing activities occur.
#6: Establish the regional baseline vocalization behavior, including seasonality and acoustic characteristics) of marine mammals where Navy training and testing activities occur.
Continuing from 2014.
Title: Humpback Whale
Tagging in Support of Marine Mammal Monitoring Across Multiple Navy Training Areas in the Pacific Ocean
Methods: Satellite
tagging, photo-ID, biopsy, visual survey
Performer: Oregon
State University
What are the occurrence, movement patterns, and residency patterns of multiple humpback whale DPSs within Navy Pacific Ocean at-sea ranges (SOCAL, HRC, NWTT, GOA)
#1: Determine what species and populations of marine mammals and ESA-listed species are present in Navy range complexes, testing ranges, and in specific training and testing areas.
#3: Determine what species and populations of marine mammals and ESA-listed species are exposed to Navy training and testing
activities.
#4: Establish the baseline habitat uses and movement patterns of marine mammals and sea turtles where Navy training and testing
activities occur.
Continuing from 2017
Title: Guadalupe Fur
Seal Population Census and Satellite Tracking
(see this project under SOCAL, above)
(see this project under SOCAL, above) (see this project under SOCAL, above)

DoN | 2018 All-Range Pacific Annual Monitoring Report ADAPTIVE MANAGEMENT AND YEARLY MONITORING GOALS
1 April 2019 | 121
Project Description Monitoring Questions Intermediate Scientific Objectives
(numbered as per Figure 12) Continuing or Proposed
New Start
Location: Gulf of Alaska Temporary Maritime Activities Area (GOA TMAA)
Title: Passive Acoustic
Monitoring of Marine
Mammals in the Gulf of
Alaska Temporary
Maritime Activities Area
Methods: Passive
acoustic monitoring
Performer: TBD
What is the temporal occurrence of baleen whales and beaked whales in the GOA TMAA
#1: Determine what species and populations of marine mammals and ESA-listed species are present in Navy range complexes, testing
ranges, and in specific training and testing areas.
#6: Establish the regional baseline vocalization behavior, including seasonality and acoustic characteristics) of marine mammals where Navy training and testing activities occur.
Re-start in 2019 of PAM effort (continuing from 2011). Field work Spring 2019, with reporting expected in March 2020.
1 Primary Research & Development and Demonstration Validation (DEMVAL) investments for tools and techniques supported by Office of Naval Research Marine Mammal & Biology and Living Marine Resource programs. 2 Though as continuing from 2018, this project is conceptually a refinement and continuation of 2017 Project [N3], “Modeling the Offshore Distribution of Chinook Salmon in the Pacific Northwest.” The updated project retains substantially the same monitoring questions
Key: DDG = guided missile destroyer; ESA = Endangered Species Act; FY = Fiscal Year; GOA = Gulf of Mexico; GPS = Global Positioning System; HRC = Hawaii Range Complex; LIMPET = Low Impact Minimally Percutaneous Electronic Transmitter; MFAS = Mid-frequency active sonar; MITT = Mariana Islands Training and Testing; NMFS = National Marine Fisheries Service; NOAA = National Oceanic and Atmospheric Administration; NWTT = Northwest Testing and Training; PAM = Passive Acoustic Monitoring; PCoD = Population Consequences of Disturbance; photo-ID = photo identification; PMRF = Pacific Missile Range Facility; SOAR = Southern California Offshore Antisubmarine Warfare Range; SOCAL = Southern California; SSC = Space and Naval Warfare Systems Center; TBD= to be determined; TMAA = Temporary Maritime Activities Area.

DoN | 2018 All-Range Pacific Annual Monitoring Report LITERATURE CITED
1 April 2019 | 122
4. Literature Cited
Baird, R.W., S.W. Martin, R. Manzano-Roth, D.L. Webster, and B.L. Southall. 2017a. Assessing
Exposure and Response of Three Species of Odontocetes to Mid-frequency Active
Sonar during Submarine Commanders Courses at the Pacific Missile Range Facility:
August 2013 through February 2015. Prepared for Commander, U.S. Pacific Fleet.
Submitted to Naval Facilities Engineering Command, Pearl Harbor, Hawaii under
Contract N62470-15-D-8006, Task Order KB08 issued to HDR, Inc., Honolulu, Hawaii.
June 2017.
Baird, R.W., D.L. Webster, R. Morrissey, B.K. Rone, S.D. Mahaffy, A.M. Gorgone, D.B.
Anderson, E.E. Henderson, S.W. Martin, and D.J. Moretti. 2017b. Odontocete Studies
on the Pacific Missile Range Facility in February 2016: Satellite-tagging, Photo-
identification, and Passive Acoustic Monitoring. Prepared for Commander, U.S. Pacific
Fleet. Submitted to Naval Facilities Engineering Command Pacific, Pearl Harbor, Hawaii
under Contract No. N62470-10-D-3011, Task Order KB08 issued to HDR, Inc., Honolulu,
Hawaii. June 2017.
Baird, R.W., D.L. Webster, S.D. Mahaffy, A.M. Gorgone, E.M. Walters, and D.B. Anderson.
2017c. Studies of Dolphins and Whales On and Around the Pacific Missile Range
Facility Using Photo-identification and Satellite Tagging: Evidence for Resident and Non-
resident Species. Submitted to Naval Undersea Warfare Center, Newport, Rhode Island,
under Contract No. N66604-14-C0145 issued to Cascadia Research Collective,
Olympia, Washington. March 2017.
Baird, R.W., S.D. Mahaffy, D.L. Webster, B.D. Guenther, J.K. Lerma, C.J. Cornforth, and D.B.
Anderson. 2018a. Odontocete Studies on the Pacific Missile Range Facility in August
2018: Satellite Tagging, Photo-identification, and Passive Acoustic Monitoring. Interim
Field Survey Report. Prepared for Commander, U.S. Pacific Fleet. Submitted to Naval
Facilities Engineering Command Pacific, Pearl Harbor, Hawaii under Contract No.
N62470-15-D-8006, Task Order No. N6274218F0107 issued to HDR, Inc., Honolulu,
Hawaii. December 2018.
Baird, R.W., D.L. Webster, S.M. Jarvis, K.A. Wood, C.J. Cornforth, S.D. Mahaffy, K.K. Martien,
K.M. Robertson, D.B. Anderson, and D.J. Moretti. 2018b. Odontocete studies on the
Pacific Missile Range Facility in August 2017: Satellite-tagging, Photo-identification, and
Passive Acoustic Monitoring. Final Report. Prepared for Commander, U.S. Pacific Fleet.
Submitted to Naval Facilities Engineering Command Pacific, Pearl Harbor, Hawaii under
Contract No. N62470-15-D-8006, Task Order KB16 issued to HDR, Inc., Honolulu,
Hawaii. July 2018.
Baird, R.W., D.L. Webster, S.M. Jarvis, K.A. Wood, C.J. Cornforth, S.D. Mahaffy, K.K. Martien,
K.M. Robertson, D.B. Anderson, and D.J. Moretti. 2018a. Odontocete studies on the
Pacific Missile Range Facility in August 2017: Satellite-tagging, Photo-identification, and
Passive Acoustic Monitoring. Prepared for Commander, U.S. Pacific Fleet. Submitted to

DoN | 2018 All-Range Pacific Annual Monitoring Report LITERATURE CITED
1 April 2019 | 123
Naval Facilities Engineering Command Pacific, Pearl Harbor, Hawaii under Contract No.
N62470-15-D-8006, Task Order KB16 issued to HDR Inc., Honolulu, Hawaii. July 2018.
Baird, R.W., S.D. Mahaffy, D.L. Webster, B.D. Guenther, J.K. Lerma, C.J. Cornforth and D.B.
Anderson. 2018b. Odontocete studies on the Pacific Missile Range Facility in August
2018: Satellite Tagging, Photo-identification, and Passive Acoustic Monitoring. Interim
Field Survey Report. Prepared for Commander, U.S. Pacific Fleet. Submitted to Naval
Facilities Engineering Command Pacific, Pearl Harbor, Hawaii under Contract No.
N62470-15-D-8006, Task Order No. N6274218F0107 issued to HDR Inc., Honolulu,
Hawaii. December 2018.
Baird, R.W., S.W. Martin, E.E. Henderson, and B.L. Southall. 2019. Assessing Exposure and
Response of Odontocetes Exposed to Mid-Frequency Active Sonar: Submarine
Command Courses at the Pacific Missile Range Facility from 2016 through 2018. Interim
Progress Report. Prepared for Commander, U.S. Pacific Fleet. Submitted to Naval
Facilities Engineering Command Pacific, Pearl Harbor, Hawaii under Contract No.
N62470-15-D-8006, Task Order No. KB16 issued to HDR, Inc., Honolulu, Hawaii.
February 2019.
Baumann-Pickering, S., A. Širović, J.A. Hildebrand, A. Debich, R. Gottlieb, S. Johnson, S.
Kerosky, L. Roche, A.S. Berga, L. Wakefield, and S. Wiggins. 2012. Passive Acoustic
Monitoring for Marine Mammals in the Gulf of Alaska Temporary Maritime Activities Area
2011–2012. MPL Technical Memorandum 538. Marine Physical Laboratory, Scripps
Institution of Oceanography, University of California San Diego, La Jolla, California.
November 2012.
Baumann-Pickering, S., M.A. Roch, R.L. Brownell, Jr., A.E. Simonis, M.A. McDonald, A.
Solsona-Berga, E.M. Oleson, S.M. Wiggins, and J.A. Hildebrand. 2014. Spatio-temporal
patterns of beaked whale echolocation signals in the North Pacific. PLoS ONE
9:e86072.
Baumann-Pickering, S., A. Širović, J. Hildebrand, J.S. Trickey, A. Meyer-Löbbecke, A. Rice,
S.M. Wiggins, M.A. Roch, C.S. Oedekoven, and L. Thomas. 2018a. Progress Report:
Potential Impact of Mid-Frequency Active Sonar on Whales from Passive Acoustic
Monitoring. MPL Technical Memorandum 620. Marine Physical Laboratory, Scripps
Institution of Oceanography, University of California San Diego, La Jolla, California.
February 2018.
Baumann-Pickering, S., Rice, A.C., Trickey, J.S., Hildebrand, J.A., Wiggins, S.M., and Širović,
A. 2018b. Five Years of Whale Presence in the SOCAL Range Complex 2013-2017.
MPL Technical Memorandum 626. Marine Physical Laboratory, Scripps Institution of
Oceanography, University of California San Diego, La Jolla, California. July 2018.
Baumann-Pickering, S., J.S. Trickey, A. Širović, C.S. Oedekoven, J.A. Hildebrand, L. Thomas,
S.M. Wiggins, and M.A. Roch. 2018c. Impact of mid-frequency active sonar on beaked
whale echolocation from long-term passive acoustic recordings. Abstracts, ESOMM-

DoN | 2018 All-Range Pacific Annual Monitoring Report LITERATURE CITED
1 April 2019 | 124
2018, 6th International Meeting on the Effects of Sounds in the Ocean on Marine
Mammals, The Hague, The Netherlands, 9-14 September 2018.
Baumann-Pickering, S., Trickey, J.S., Oleson, E.M. 2018d. “Geographic differences in
Blainville’s beaked whale (Mesoplodon densirostris) echolocation clicks,” Marine
Physical Laboratory, Scripps Institution of Oceanography, University of California San
Diego, La Jolla, CA, MPL Technical Memorandum #630 under Cooperative Institute For
Marine Ecosystems and Climate Award NA15OAR4320071 for U.S. Navy, U.S. Pacific
Fleet, Pearl Harbor, HI.
Campbell, G., L. Roche, K. Whitaker, E. Vu, and J. Hildebrand. 2014. Marine Mammal
Monitoring on California Cooperative Oceanic Fisheries Investigation (CALCOFI)
Cruises: 2012-2013. MPL Technical Memorandum 549. Marine Physical Laboratory,
University of California San Diego, La Jolla, California. February 2014.
Campbell, G.S., L. Thomas, K. Whitaker, A.B. Douglas, J. Calambokidis, and J.A. Hildebrand.
2015. Inter-annual and seasonal trends in cetacean distribution, density and abundance
off southern California. Deep-Sea Research II 112:143–157.
Carilli, J., S.H. Smith, D. Marx, Jr., and L. Bolick. 2018a. Farallon de Medinilla 2017 Coral Reef
Survey Report. Submitted to Commander, U.S. Pacific Fleet Environmental Readiness
Division, Pearl Harbor by SPAWAR Systems Center Pacific, San Diego, California,.
June 2018.
Carilli J., S.H. Smith, D.E. Marx, Jr., L. Bolick, and D. Fenner. 2018b. Farallon de Medinilla 2017
Species Level Coral Reef Survey Report. SSC Pacific Technical Report 18-1079.
SPAWAR Systems Center Pacific, San Diego, California. August 2018.
Carilli, J.E., L. Bolick, D.E. Marx, Jr., S.H. Smith, and D. Fenner. In Review. Coral bleaching
variability during the 2017 global bleaching event on a remote, uninhabited island in the
western Pacific: Farallon de Medinilla, Commonwealth of the Northern Mariana Islands.
Coral Reefs.
Chief of Naval Operations. 2013. U.S. Navy Strategic Planning Process for Marine Species
Monitoring. Chief of Naval Operations, Arlington, Virginia.
Courbis, S., R.W. Baird, F. Cipriano, and D. Duffield. 2014. Multiple populations of pantropical
spotted dolphins in Hawaiian waters. Journal of Heredity 105: 627–641.
Debich, A.J., S. Baumann-Pickering, A. Širović, J. Hildebrand, J.S. Buccowich, R.S. Gottlieb,
A.N. Jackson, S.C. Johnson, L. Roche, J.T. Trickey, B. Thayre, L. Wakefield, and S.M.
Wiggins. 2013. Passive Acoustic Monitoring for Marine Mammals in the Gulf of Alaska
Temporary Maritime Activities Area 2012–2013. MPL Technical Memorandum 546.
Marine Physical Laboratory, University of California San Diego, La Jolla, California.
October 2013.
Debich, A.J., S. Baumann-Pickering, A. Širović, J.A. Hildebrand, A.L. Alldredge, R.S. Gottlieb,
S. Herbert, S.C. Johnson, L.K. Roche, B. Thayre, J.S. Trickey, and S.M. Wiggins. 2014.

DoN | 2018 All-Range Pacific Annual Monitoring Report LITERATURE CITED
1 April 2019 | 125
Passive Acoustic Monitoring for Marine Mammals in the Northwest Training Range
Complex 2012–2013. MPL Technical Memorandum 548. Marine Physical Laboratory,
Scripps Institution of Oceanography, University of California San Diego, La Jolla,
California. June 2014.
Debich, A.J., S. Baumann-Pickering, A. Širović, J.A. Hildebrand, A.L. Alldredge, R.S. Gottlieb,
S.T. Herbert, S.C. Johnson, A.C. Rice, L.K. Roche, B.J. Thayre, J.S. Trickey, L.M.W.
Varga, and S.M. Wiggins. 2015a. Passive Acoustic Monitoring for Marine Mammals in
the SOCAL Naval Training Area Dec 2012–Jan 2014. MPL Technical Memorandum 552.
Marine Physical Laboratory, Scripps Institution of Oceanography, University of California
San Diego, La Jolla, California. January 2015.
Debich, A.J., S. Baumann-Pickering, A. Širović, J.A. Hildebrand, S.T. Herbert, S.C Johnson,
A.C. Rice, J.S. Trickey, and S.M. Wiggins. 2015b. Passive Acoustic Monitoring for
Marine Mammals in the SOCAL Range Complex January–July 2014. MPL Technical
Memorandum 554. Marine Physical Laboratory, Scripps Institution of Oceanography,
University of California San Diego, La Jolla, California. February 2015.
Debich, A.J., B. Thayre, and J.A. Hildebrand. 2017. Marine Mammal Monitoring on California
Cooperative Oceanic Fisheries Investigation (CALCOFI) Cruises: Summary of Results
2012–2016. MPL Technical Memorandum 609. Marine Physical Laboratory, Scripps
Institution of Oceanography, University of California San Diego, La Jolla, California. April
2017.
Dickenson, N., T. Vars, M. Fagan, and J. Bredvik. 2014. Final Cruise Report, Marine Species
Monitoring and Lookout Effectiveness Study, Submarine Commanders Course, February
2014, Hawaii Range Complex. Prepared for Commander, U.S. Pacific Fleet by Naval
Undersea Warfare Center Division, Newport, Rhode Island; Naval Facilities Engineering
Command Pacific, Pearl Harbor, Hawaii; and Naval Facilities Engineering Command,
Southwest, San Diego, California. May 2014.
DiMarzio, N., B. Jones, D. Moretti, L. Thomas, and C. Oedekoven. 2018. M3R Monitoring on the
Southern California Offshore Range (SCORE) and the Pacific Missile Range Facility
(PMRF) 2017. Naval Undersea Warfare Center, Newport, Rhode Island. January 2018.
DiMarzio, N., T. Fetherston, and D. Moretti. 2019. Marine Mammal Monitoring on Navy Ranges
(M3R) on the Southern California Anti-Submarine Warfare Range (SOAR) and the
Pacific Missile Range Facility (PMRF). Naval Undersea Warfare Center, Newport,
Rhode Island. January 2019
DoN (Department of the Navy). 2010a. Mariana Islands Range Complex Environmental Impact
Statement/Overseas Environmental Impact Statement. Naval Facilities Engineering
Command Pacific EV21. Pearl Harbor, Hawaii. May 2010.
DoN (Department of the Navy). 2010b. United States Navy Integrated Comprehensive
Monitoring Program. 2010 Update. U.S. Navy, Chief of Naval Operations Environmental
Readiness Division, Washington, D.C. December 2010.
DoN | 2018 All-Range Pacific Annual Monitoring Report LITERATURE CITED
1 April 2019 | 126
DoN (Department of the Navy). 2011a. Gulf of Alaska Navy Training Activities Final
Environmental Impact Statement/Overseas Environmental Impact Statement.
Commander, U.S. Pacific Fleet N01CE1, Pearl Harbor, Hawaii. December 2011.
DoN (Department of the Navy). 2011b. Scientific Advisory Group for Navy Marine Species
Monitoring: Workshop Report and Recommendations. 10 October 2011, Arlington,
Virginia.
DoN (Department of the Navy). 2013a. Hawaii-Southern California Training and Testing
Activities Final Environmental Impact Statement/Overseas Environmental Impact
Statement. Naval Facilities Engineering Command, Pacific/EV21.CS, Pearl Harbor,
Hawaii. August 2013.
DoN (Department of the Navy). 2015a. Mariana Islands Training and Testing Activities Final
Environmental Impact Statement/Overseas Environmental Impact Statement. Naval
Facilities Engineering Command, Pacific/EV21. Pearl Harbor, Hawaii. May 2015.
DoN (Department of the Navy). 2015b. Northwest Training and Testing Activities Final
Environmental Impact Statement/Overseas Environmental Impact Statement. Naval
Facilities Engineering Command, Northwest/EV21.KK, Silverdale, Washington. October
2015.
DoN (Department of the Navy). 2016a. Gulf of Alaska Navy Training Activities Supplemental
Environmental Impact Statement/Overseas Environmental Impact Statement. Naval
Facilities Engineering Command, Northwest/EV21.AB, Silverdale, Washington. July
2016.
DoN (Department of the Navy). 2016b. 2015 U.S. Navy Annual Marine Species Monitoring
Report for the Pacific: A Multi-Range Complex Monitoring Report For Hawaii-Southern
California Training and Testing (HSTT), Mariana Islands Training and Testing (MITT),
Northwest Training and Testing (NWTT), and the Gulf of Alaska Temporary Maritime
Activities Area (GOA TMAA). Prepared for and submitted to National Marine Fisheries
Service, Silver Spring, Maryland. March 2016.
DoN (Department of the Navy). 2017. 2016 U.S. Navy Annual Marine Species Monitoring
Report for the Pacific: A Multi-Range Complex Monitoring Report For Hawaii-Southern
California Training and Testing (HSTT), Mariana Islands Training and Testing (MITT),
Northwest Training and Testing (NWTT), and the Gulf of Alaska Temporary Maritime
Activities Area (GOA TMAA). Prepared for and submitted to National Marine Fisheries
Service, Silver Spring, Maryland. April 2017.
DoN (Department of the Navy). 2018a. Hawaii-Southern California Training and Testing
Activities Final Environmental Impact Statement/Overseas Environmental Impact
Statement. Naval Facilities Engineering Command, Pacific/EV21CS, Pearl Harbor,
Hawaii. October 2018.
DoN (Department of the Navy). 2018b. 2017 U.S. Navy Annual Marine Species Monitoring
Report for the Pacific: A Multi-Range-Complex Monitoring Report For Hawaii-Southern
DoN | 2018 All-Range Pacific Annual Monitoring Report LITERATURE CITED
1 April 2019 | 127
California Training and Testing (HSTT), Mariana Islands Training and Testing (MITT),
Northwest Training and Testing (NWTT), and the Gulf of Alaska Temporary Maritime
Activities Area (GOA TMAA). Prepared for and submitted to National Marine Fisheries
Service, Silver Spring, Maryland. April 2018.
Emmons, C.K., M.B. Hanson, and M.O. Lammers. 2019. Monitoring the occurrence of southern
resident killer whales, other marine mammals, and anthropogenic sound in the Pacific
Northwest. Prepared for: U.S. Navy, U.S. Pacific Fleet (Pearl Harbor, HI). Prepared by:
National Oceanographic and Atmospheric Administration. Northwest Fisheries Science
Center under MIPR N00070-17-MP-4C419. 25 February 2019. 21 p. Frasier, K., M.
Rafter, J. Hildebrand, and S. Baumann-Pickering. 2019. Preliminary Progress Report on
Southern California Beaked Whale Occurrence from Towed Array Surveys. MPL
Technical Memorandum Marine Physical Laboratory, Scripps Institution of
Oceanography, University of California San Diego, La Jolla, California. January 2019.
Fulling, G.L., P.H. Thorson, and J. Rivers. 2011. Distribution and abundance estimates for
cetaceans in the waters off Guam and the Commonwealth of the Northern Mariana
Islands. Pacific Science 65:321–343.
Griffiths, E.T., J.L. Keating, J. Barlow, and J.E. Moore. 2018. Description of a new beaked whale
echolocation pulse type in the California Current. Marine Mammal Science.
doi:10.1111/mms.12560
Henderson, E.E., J. Aschettino, M. Deakos, G. Alongi, T. Leota, and D. Engelhaupt. 2017.
Tracking the offshore and migratory movements of humpback whales in Hawaii.
Abstracts, Twenty-second Biennial Conference on the Biology of Marine Mammals. 22–
27 October 2017. Halifax, Nova Scotia.
Henderson, E.E., J. Aschettino, M. Deakos, G. Alongi, T. Leota, and D. Engelhaupt. 2018b.
Tracking the offshore and migratory movements of humpback whales in Hawaii.
Abstracts, Southern California Marine Mammal Workshop 2018. 26-27 January 2018.
Newport Beach, California.
Henderson, E.E., T.A. Helble, G.R. Ierley, and S.W. Martin. 2018c. Identifying behavioral states
and habitat use of acoustically tracked humpback whales in Hawaii. Marine Mammal
Science 34:701–717.
Henderson, E.E., J. Aschettino, M. Deakos, G. Alongi, and T. Leota. In Review. Quantifying the
behavior of humpback whales and potential responses to sonar. Aquatic Mammals
Hildebrand, J.A., A.J. Debich, and B.J. Thayre. 2018. California Cooperative Fisheries
Investigation Marine Mammal Surveys for 2016–2017. MPL Technical Memorandum
621. Marine Physical Laboratory, Scripps Institution of Oceanography, University of
California San Diego, La Jolla, California. February 2018.
Hill M.C., A.D. Ligon, E.M. Oleson, K.K. Martien, P.A. Morin, F.I. Archer, S. Baumann-Pickering,
A.R. Bendlin, L. Dolar, K.P.B. Merkens, A. Milette-Winfree, A. Rice, K.M. Robertson, J.S.
Trickey, A.C. Ü., A.M. Van Cise , and S.M. Woodman. 2015. Cetacean Monitoring in the

DoN | 2018 All-Range Pacific Annual Monitoring Report LITERATURE CITED
1 April 2019 | 128
Mariana Islands Range Complex, 2014. PIFSC Data Report DR-15-003. Prepared for
the U.S. Pacific Fleet Environmental Readiness Office, Pearl Harbor, Hawaii by National
Marine Fisheries Service, Pacific Islands Fisheries Science Center, Honolulu, Hawaii.
March 2015.
Hill, M.C., E.M. Oleson, S. Baumann-Pickering, A.M. Van Cise, A.D. Ligon, A.R. Bendlin, A.C.
Ü, J.S. Trickey, and A.L. Bradford. 2016a. Cetacean Monitoring in the Mariana Islands
Range Complex, 2015. PIFSC Data Report DR-16-001. Prepared for the U.S. Pacific
Fleet Environmental Readiness Office, Pearl Harbor, Hawaii by National Marine
Fisheries Service, Pacific Islands Fisheries Science Center, Honolulu, Hawaii. February
2016.
Hill, M.C., A.L. Bradford, A.D. Ligon, A.C. Ü, J. Rivers, R.K. Uyeyama, R.L. Brownell, Jr., and
E.M. Oleson. 2016b. Are humpback whales (Megaptera novaeangliae) breeding and
calving in the Mariana Islands? Working Paper IWC SC/66b/O/O2 submitted to the
Scientific Committee of the International Whaling Commission, June 2016, Cambridge,
UK.
Hill, M.C., A.R. Bendlin, A.C. Ü, K.M. Yano, A.L. Bradford, A.D. Ligon, and E.M. Oleson. 2017.
Cetacean Monitoring in the Mariana Islands Range Complex, 2016. PIFSC Data Report
DR-17-002. Prepared for the U.S. Pacific Fleet Environmental Readiness Office, Pearl
Harbor, Hawaii by National Marine Fisheries Service, Pacific Islands Fisheries Science
Center, Honolulu, Hawaii. February 2017.
Hill, M.C., A.R. Bendlin, A.M. Van Cise, A. Milette‐Winfree, A.D. Ligon, A.C. Ü, M.H. Deakos,
and E.M. Oleson. 2018a. Short‐finned pilot whales (Globicephala macrorhynchus) of the
Mariana Archipelago: Individual affiliations, movements, and spatial use. Marine
Mammal Science. doi.org/10.1111/mms.12567
Hill M.C., A.L. Bradford, A.D. Ligon, A.C. Ü, and E.M. Oleson. 2018b. Cetacean Monitoring in
the Mariana Islands Range Complex, 2017. PIFSC Data Report DR-18-002. Prepared
for the U.S. Pacific Fleet Environmental Readiness Office, Pearl Harbor, Hawaii by
National Marine Fisheries Service, Pacific Islands Fisheries Science Center, Honolulu,
Hawaii. January 2018.
Hill M.C., E.M. Oleson, A.L. Bradford, K.K. Martien, D. Steel, and C.S. Baker. 2018c. Pacific
Islands Fisheries Science Center Mariana Archipelago Cetacean Surveys: A Review of
Available Data and Analyses through March 2018.. Prepared for the U.S. Pacific Fleet
Environmental Readiness Office, Pearl Harbor, Hawaii by National Marine Fisheries
Service, Pacific Islands Fisheries Science Center, Honolulu, Hawaii.
Hill M.C., A.D. Ligon, A.C. Ü, and E.M. Oleson. 2019. Cetacean Monitoring in the Mariana
Islands Range Complex, August–September 2018. Prepared for the U.S. Pacific Fleet
Environmental Readiness Office, Pearl Harbor, Hawaii by National Marine Fisheries
Service, Pacific Islands Fisheries Science Center, Honolulu, Hawaii.
DoN | 2018 All-Range Pacific Annual Monitoring Report LITERATURE CITED
1 April 2019 | 129
Hill, M.C., A.L. Bradford, D. Steel, C.S. Baker, A.D. Ligon, A.C. Ü, J.M.V. Acebes, O.A. Filatova,
N. Kobayashi, Y. Morimoto, H. Okabe, R. Okamoto, J. Rivers, T. Sato, O.V. Titova, R.K.
Uyeyama, and E.M. Oleson. In Prep. Found: a missing breeding ground for endangered
western North Pacific humpback whales in the Mariana Archipelago.
Huff, D.D., and J.M. Smith. 2019. Characterizing the Distribution of ESA Listed Salmonids in the
Northwest Training and Testing Area with Acoustic and Pop-up Satellite Tags. Prepared
for Commander, U.S. Pacific Fleet Environmental Readiness Division, Pearl Harbor,
Hawaii by National Marine Fisheries Service, Northwest Fisheries Science Center,
Seattle, Washington. January 2019.
Jones T.T., K.S. Van Houtan, B.L. Bostrom, P. Ostafichuk, J. Mikkelsen, E. Tezcan, M. Carey,
B. Imlach, and J. Seminoff. 2013. Calculating the ecological impacts of animal-borne
instruments on aquatic animals. Methods in Ecology and Evolution 4:1178–1186.
Kerosky, S.M., S. Baumann-Pickering, A. Širovic, J.S. Buccowich, A.J. Debich, Z. Gentes, R.S.
Gottlieb, S.C. Johnson, L.K. Roche, B. Thayre, L. Wakefield, S.M. Wiggins, and J.A.
Hildebrand. 2013. Passive Acoustic Monitoring for Marine Mammals in the SOCAL
Range Complex 2012. MPL Technical Memorandum 544. Marine Physical Laboratory,
Scripps Institution of Oceanography, University of California San Diego, La Jolla,
California. August 2013.
Ligon, A. D., Deakos, M. H. and Adam, C. U. (2011). Small-boat cetacean surveys off Guam
and Saipan, 30 Mariana Islands, February – March 2010. (pp. 34). Prepared for Pacific
Island Fisheries Science 31 Center.
Longhurst, A. 2006. Ecological Geography of the Sea, 2nd edn. Elsevier Science Publishers,
New York, New York.
Martien, K.K., M.C. Hill, A.M. Van Cise, K.M. Robertson, S.M. Woodman, L. Dolar, V.L. Pease,
and E.M. Oleson. 2014. Genetic Diversity and Population Structure in Four Species of
Cetaceans around the Mariana Islands. NOAA Technical Memorandum NMFS-SWFSC-
536. National Marine Fisheries Service, La Jolla, California. August 2014.
Martin, C., S. Martin, E. Henderson, T. Helble, R. Manzano-Roth, and B. Matsuyama. 2016a.
SPAWAR Systems Center Pacific FY15 Annual Report on PMRF Marine Mammal
Monitoring. Submitted to Commander, U.S. Pacific Fleet, Pearl Harbor, Hawaii by
National Marine Mammal Foundation, San Diego, California and SPAWAR Systems
Center Pacific, San Diego, California. March 2016.
Martin, C.R., S.W. Martin, E.E. Henderson, T.A. Helble, R.A. Manzano-Roth, B.M. Matsuyama,
and G.C. Alongi. 2017. SSC Pacific FY16 Annual Report on PMRF Marine Mammal
Monitoring. Submitted to Commander, U.S. Pacific Fleet, Pearl Harbor, Hawaii by
National Marine Mammal Foundation, San Diego, California and SPAWAR Systems
Center Pacific, San Diego, California. February 2017.
Martin, C.R., S.W. Martin, E.E. Henderson, T.A. Helble, R.A. Manzano-Roth, B.M. Matsuyama,
and G.C. Alongi. 2018a. SSC Pacific FY17 Annual Report on PMRF Marine Mammal

DoN | 2018 All-Range Pacific Annual Monitoring Report LITERATURE CITED
1 April 2019 | 130
Monitoring. Submitted to Commander, U.S. Pacific Fleet, Pearl Harbor, Hawaii by
National Marine Mammal Foundation, San Diego, California and SPAWAR Systems
Center Pacific, San Diego, California. July 2018.
Martin, C.R., S.W. Martin, and E.E. Henderson. 2018b. Estimating received levels for
acoustically tracked whales from Navy mid-frequency active sonar. Journal of the
Acoustical Society of America 144:1885–1886.
Martin, C.R., E.E. Henderson, S.W. Martin, T.A. Helble, R.A. Manzano-Roth, B.M. Matsuyama,
and G.C. Alongi. 2019. SSC Pacific FY18 Annual Report on PMRF Marine Mammal
Monitoring. Submitted to Commander, U.S. Pacific Fleet, Pearl Harbor, Hawaii by
National Marine Mammal Foundation, San Diego, California and SPAWAR Systems
Center Pacific, San Diego, California. January 2019.
Martin, S.L., and T.T. Jones. 2017. Sea Turtle Tagging in the Mariana Islands Training and
Testing (MITT) Study Area. Prepared for the U.S. Pacific Fleet Environmental Readiness
Office, Pearl Harbor, Hawaii by NOAA Fisheries, Marine Turtle Assessment Group,
Protected Species Division, Pacific Islands Fisheries Science Center, Honolulu, Hawaii.
June 2017.
Martin, S.L., and T.T. Jones. 2018. Sea Turtle Tagging in the Mariana Islands Training and
Testing (MITT) Study Area. PIFSC Data Report DR-18-001. Prepared for the U.S.
Pacific Fleet Environmental Readiness Office, Pearl Harbor, Hawaii by NOAA Fisheries,
Marine Turtle Assessment Group, Protected Species Division, Pacific Islands Fisheries
Science Center, Honolulu, Hawaii under Interagency Agreement NMFS-PIC-16-008.
January 2018.
Martin, S.L., A.R. Gaos, and T.T. Jones. 2019. Sea turtle tagging in the Mariana Islands
Training and Testing (MITT) study area. Prepared for the U.S. Pacific Fleet
Environmental Readiness Office, Pearl Harbor, Hawaii by NOAA Fisheries, Marine
Turtle Biology and Assessment Group, Protected Species Division, Pacific Islands
Fisheries Science Center, Honolulu, Hawaii under Interagency Agreement NMFS-PIC-
17-010.
Martin, S.L., K.S. Van Houtan, T.T. Jones, C.F. Aguon, J.T. Gutierrez, R.B. Tibbatts, S.B.
Wusstig, and J.D. Bass. 2016b. Five decades of marine megafauna surveys from
Micronesia. Frontiers in Marine Science 2:116. doi.org/10.3389/fmars.2015.00116
Mate, B., D.M. Palacios, L. Irvine, B. Lagerquist, T. Follett, M. Winsor, and C. Hayslip. 2015.
Baleen (Blue & Fin) Whale Tagging in Southern California in Support of Marine Mammal
Monitoring Across Multiple Navy Training Areas (SOCAL, NWTRC, GOA). Prepared for
U.S. Pacific Fleet. Submitted to Naval Facilities Engineering Command Pacific, Pearl
Harbor, Hawaii, under Contract No. N62470-10-3011, Task Orders JP03 and KB27,
issued to HDR, Inc., San Diego, California. July 2015.
Mate, B.R., D.M. Palacios, C.S. Baker, B.A. Lagerquist, L.M. Irvine, T. Follett, D. Steel, C.
Hayslip, and M.H. Winsor. 2016. Baleen (Blue & Fin) Whale Tagging and Analysis in
Support of Marine Mammal Monitoring Across Multiple Navy Training Areas. Preliminary

DoN | 2018 All-Range Pacific Annual Monitoring Report LITERATURE CITED
1 April 2019 | 131
Summary. Prepared for Commander, U.S. Pacific Fleet. Submitted to Naval Facilities
Engineering Command Pacific, Pearl Harbor, Hawaii under Contract No. N62470-10-D-
3011, Task Order KB29 and Contract No. N62470-15-8006, Task Order KB01 issued to
HDR, Inc., San Diego, California. July 2016.
Mate, B.R., D.M. Palacios, C.S. Baker, B.A. Lagerquist, L.M. Irvine, T. Follett, D. Steel, C.
Hayslip, and M.H. Winsor. 2017a. Baleen Whale Tagging in Support of Marine Mammal
Monitoring Across Multiple Navy Training Areas Covering the Years 2014, 2015, and
2016. Final Report. Prepared for Commander, U.S. Pacific Fleet. Submitted to Naval
Facilities Engineering Command Pacific, Pearl Harbor, Hawaii under Contract No.
N62470-10-D-3011, Task Order KB29 and Contract No. N62470-15-8006, Task Order
FNZ1 issued to HDR, Inc., San Diego, California. August 2017.
Mate, B.R., D.M. Palacios, C.S. Baker, L.M. Irvine, B.A. Lagerquist, T. Follett, D. Steel, and C.E.
Hayslip. 2017b. Humpback Whale Tagging in Support of Marine Mammal Monitoring
Across Multiple Navy Training Areas in the Pacific Ocean: Preliminary Summary of Field
Tagging Effort off the US West Coast in Summer-Fall 2017. Prepared for Commander,
U.S. Pacific Fleet. Submitted to Naval Facilities Engineering Command Southwest, San
Diego, California, under Cooperative Ecosystem Studies Unit, Department of the Navy
Cooperative Agreement No. N62473-17-2-0001. December 2017.
Mate, B.R., D.M. Palacios, C.S. Baker, B.A. Lagerquist, L.M. Irvine, T. Follett, D. Steel, C.E.
Hayslip, and M.H. Winsor. 2018a. Humpback Whale Tagging in Support of Marine
Mammal Monitoring Across Multiple Navy Training Areas in the Pacific Ocean: Final
Report for the Hawaiian Breeding Area in Spring 2018, Including Historical Data from
Previous Tagging Efforts. Prepared for Commander, U.S. Pacific Fleet, and
Commander, Naval Sea Systems Command. Submitted to Naval Facilities Engineering
Command Southwest, San Diego, California, under Cooperative Ecosystem Studies
Unit, Department of the Navy Cooperative Agreement No. N62473-17-2-0001. 13
December 2018.
Mate, B.R., D.M. Palacios, C.S. Baker, B.A. Lagerquist, L.M. Irvine, T. Follett, D. Steel, C.E.
Hayslip, and M.H. Winsor. 2018b. Baleen Whale Tagging in Support of Marine Mammal
Monitoring Across Multiple Navy Training Areas Covering the Years 2014, 2015, 2016,
and 2017. Final Report. Prepared for Commander, U.S. Pacific Fleet. Submitted to
Naval Facilities Engineering Command Southwest, San Diego, California under Contract
No. N62470-15-8006-17F4016 issued to HDR, Inc., San Diego, California. October
2018.
Mate, B.R., D.M. Palacios, C.S. Baker, B.A. Lagerquist, L.M. Irvine, T. Follett, D. Steel, C.E.
Hayslip, and M.H. Winsor. 2018c. Humpback Whale Tagging in Support of Marine
Mammal Monitoring Across Multiple Navy Training Areas in the Pacific Ocean: Final
Report for Feeding Areas off the US West Coast in Summer-Fall 2017, Including
Historical Data from Previous Tagging Efforts. Prepared for Commander, US Pacific
Fleet and Commander, Naval Sea Systems Command. Submitted to Naval Facilities
Engineering Command Southwest, San Diego, California, under Cooperative Ecosystem

DoN | 2018 All-Range Pacific Annual Monitoring Report LITERATURE CITED
1 April 2019 | 132
Studies Unit, Department of the Navy Cooperative Agreement No. N62473-17-2-0001.
19 October 2018.
Mate, B.R., D.M. Palacios, C.S. Baker, L.M. Irvine, B.A. Lagerquist, T. Follett, D. Steel, and C.E.
Hayslip. 2018d. Humpback Whale Tagging in Support of Marine Mammal Monitoring
Across Multiple Navy Training Areas in the Pacific Ocean: Preliminary Summary of Field
Tagging Effort in Hawaii in March 2018. Prepared for Commander, US Pacific Fleet and
Naval Sea Systems Command. Submitted to Naval Facilities Engineering Command
Southwest, San Diego, California, under Cooperative Ecosystem Studies Unit (CESU),
Department of the Navy (DON) Cooperative Agreement No. N62473-17-2-0001. 29 June
2018.
Mate, B.R., D.M. Palacios, C.S. Baker, B.A. Lagerquist, L.M. Irvine, T. Follett, and D. Steel.
2019. Humpback Whale Tagging in Support of Marine Mammal Monitoring Across
Multiple Navy Training Areas in the Pacific Ocean: Preliminary Summary of Field
Tagging Efforts off the Pacific Northwest in Summer 2018. Prepared for Commander,
U.S. Pacific Fleet, and Commander, Naval Sea Systems Command. Submitted to Naval
Facilities Engineering Command Southwest, San Diego, California, under Cooperative
Ecosystem Studies Unit, Department of the Navy Cooperative Agreement No. N62473-
17-2-0001. February 2019
McDonald, M.A., J.A. Hildebrand, S.M. Wiggins, and D. Ross. 2008. A 50 year comparison of
ambient ocean noise near San Clemente Island: A bathymetrically complex coastal
region off Southern California. Journal of the Acoustical Society of America 124:1985–
1992.
Merkens, K., D. Mann, V.M. Janik, D. Claridge, M. Hill, and E. Oleson. 2018. Clicks of dwarf
sperm whales (Kogia sima). Marine Mammal Science 34:963–978.
Moretti, D. 2017. Marine Mammal Monitoring on Navy Ranges (M3R) Passive Acoustic
Monitoring of Abundance on the Pacific Missile Range Facility (PMRF) and Southern
California Offshore Range (SCORE). Naval Undersea Warfare Center, Newport, Rhode
Island. March 2017.
NMFS (National Marine Fisheries Service). 2011a. Taking and Importing Marine Mammals; U.S.
Navy Training in the Gulf of Alaska Temporary Maritime Activities Area; Final Rule.
Federal Register 76:25480–25513. May 4, 2011.
NMFS (National Marine Fisheries Service). 2011b. Taking and Importing Marine Mammals;
Military Training Activities Conducted Within the Gulf of Alaska Temporary Maritime
Activities Area; Correction. Final Rule; Correction. Federal Register 76:27915–27918.
May 13, 2011.
NMFS (National Marine Fisheries Service). 2011c. Letter of Authorization for Navy Training
Exercises Conducted in the Gulf of Alaska Temporary Maritime Activities Area Study
Area. Period of May 17, 2011, through May 16, 2013. Prepared for U.S. Navy, Pacific
Fleet, Pearl Harbor, Hawaii by National Marine Fisheries Service, Office of Protected
Resources, Silver Spring, Maryland. May 2011.

DoN | 2018 All-Range Pacific Annual Monitoring Report LITERATURE CITED
1 April 2019 | 133
NMFS (National Marine Fisheries Service). 2011d. Biological Opinion for the LOA and U.S.
Navy's Training Activities on the Gulf of Alaska Temporary Maritime Training Area from
May 2011 to May 2013. Prepared for U.S. Navy, Pacific Fleet, Pearl Harbor, Hawaii, and
NOAA’s National Marine Fisheries Service, Office of Protected Resources’ Permits and
Conservation Division, by National Marine Fisheries Service, Office of Protected
Resources, Endangered Species Act Division, Silver Spring, Maryland. May 17, 2011.
NMFS (National Marine Fisheries Service). 2013a. Takes of Marine Mammals Incidental to
Specified Activities; U.S. Navy Training and Testing Activities in the Hawaii-Southern
California Training and Testing Study Area; Final Rule. Federal Register 78:78106–
78158. December 24, 2013.
NMFS (National Marine Fisheries Service). 2013b. Letter of Authorization for Navy Training
Exercises Conducted in the Hawaii-Southern California Training and Testing Study Area.
Period of December 26, 2013, through December 25, 2018. Prepared for U.S. Navy,
Pacific Fleet, Pearl Harbor, Hawaii by National Marine Fisheries Service, Office of
Protected Resources, Silver Spring, Maryland. December 13, 2013.
NMFS (National Marine Fisheries Service). 2013c. Letter of Authorization for Navy Testing
Exercises Conducted in the Hawaii-Southern California Training and Testing Study Area.
Period of December 26, 2013, through December 25, 2018. Prepared for U.S. Navy,
Naval Sea Systems Command, Washington Navy Yard, District of Columbia by National
Marine Fisheries Service, Office of Protected Resources, Silver Spring, Maryland.
December 13, 2013.
NMFS (National Marine Fisheries Service). 2013d. Letter of Authorization for Navy Training
Exercises Conducted in the Gulf of Alaska Temporary Maritime Activities Area Study
Area. Period of May 16, 2013, through May 4, 2016. Prepared for U.S. Navy, Pacific
Fleet, Pearl Harbor, Hawaii by National Marine Fisheries Service, Office of Protected
Resources, Silver Spring, Maryland. May 16, 2013.
NMFS (National Marine Fisheries Service). 2013e. Biological Opinion for the Gulf of Alaska
Temporary Maritime Training Area from May 2013 to May 2016. Prepared for U.S. Navy,
Pacific Fleet, Pearl Harbor, Hawaii, and NOAA’s National Marine Fisheries Service,
Office of Protected Resources’ Permits and Conservation Division, by National Marine
Fisheries Service, Office of Protected Resources, Endangered Species Act Division,
Silver Spring, Maryland. May 2013.
NMFS (National Marine Fisheries Service). 2013f. Biological Opinion and Conference Opinion
for the U.S. Navy’s Training Exercises and Testing Activities in the Hawaii-Southern
California Training and Testing Study Area from December 2013 through December
2018. FPR-2012-9026. Prepared for the U.S. Navy and NOAA’s National Marine
Fisheries Service, Office of Protected Resources’ Permits and Conservation Division, by
National Marine Fisheries Service, Office of Protected Resources, Endangered Species
Act Division, Silver Spring, Maryland. December 13, 2013.

DoN | 2018 All-Range Pacific Annual Monitoring Report LITERATURE CITED
1 April 2019 | 134
NMFS (National Marine Fisheries Service). 2014a. Biological Opinion and Conference Opinion
for the U.S. Navy's Training Exercises and Testing Activities in the Hawaii-Southern
California Training and Testing Study Area from December 2013 through December
2018. FPR-2012-9026. Prepared for U.S. Navy and NOAA’s National Marine Fisheries
Service, Office of Protected Resources’ Permits and Conservation Division, by National
Marine Fisheries Service, Office of Protected Resources, Endangered Species Act
Interagency Cooperation Division, Silver Spring, Maryland. April 23, 2014.
NMFS (National Marine Fisheries Service). 2014b. Takes of Marine Mammals Incidental to
Specified Activities; U.S. Navy Training and Testing Activities in the Hawaii-Southern
California Training and Testing Study Area; Correction. Final Rule; Correction. Federal
Register 79:26188–26189. May 7, 2014.
NMFS (National Marine Fisheries Service). 2014c. Letter of Authorization for Navy training
exercises conducted in the Hawaii-Southern California Training and Testing Study Area,
as modified May 7, 2014. Period of December 26, 2013, through December 25, 2018.
Prepared for U.S. Navy, Pacific Fleet, Pearl Harbor, Hawaii by National Marine Fisheries
Service, Office of Protected Resources, Silver Spring, Maryland. May 7, 2014.
NMFS (National Marine Fisheries Service). 2014d. Letter of Authorization for Navy testing
activities conducted in the Hawaii-Southern California Training and Testing Study Area,
as modified May 7, 2014. Period of December 26, 2013, through December 25, 2018.
Prepared for U.S. Navy, Pacific Fleet, Pearl Harbor, Hawaii by National Marine Fisheries
Service, Office of Protected Resources, Silver Spring, Maryland. May 7, 2014.
NMFS (National Marine Fisheries Service). 2015a. Takes of Marine Mammals Incidental to
Specified Activities; U.S. Navy Training and Testing Activities in the Mariana Islands
Training and Testing Study Area; Final Rule. Federal Register 80:46111–46171. August
3, 2015.
NMFS (National Marine Fisheries Service). 2015b. Letter of Authorization for Navy Training and
Testing Activities Conducted in the Mariana Islands Training and Testing Study Area.
Period of August 3, 2015, through August 3, 2020. Prepared for U.S. Navy, Pacific Fleet,
Pearl Harbor, Hawaii by National Marine Fisheries Service, Office of Protected
Resources, Silver Spring, Maryland. July 31, 2015.
NMFS (National Marine Fisheries Service). 2015c. Biological Opinion and Conference Report
for the U.S. Navy's Training Exercises and Testing Activities in the Mariana Islands
Training and Testing Study Area from August 2015 through August 2020. FPR-2014-
9070. Prepared for U.S. Navy and NOAA’s National Marine Fisheries Service, Office of
Protected Resources’ Permits and Conservation Division by National Marine Fisheries
Service, Office of Protected Resources, Endangered Species Act Division, Silver Spring,
Maryland. June 12, 2015.
NMFS (National Marine Fisheries Service). 2015d. Biological Opinion for the U.S. Navy's
Training Exercises and Testing Activities in the Hawaii-Southern California Training and
Testing Study Area from December 2013 through December 2018. FPR-2015-9111.
DoN | 2018 All-Range Pacific Annual Monitoring Report LITERATURE CITED
1 April 2019 | 135
Prepared for U.S. Navy and NOAA’s National Marine Fisheries Service, Office of
Protected Resources’ Permits and Conservation Division by National Marine Fisheries
Service, Office of Protected Resources, Endangered Species Act Interagency
Cooperation Division, Silver Spring, Maryland. April 2, 2015.
NMFS (National Marine Fisheries Service). 2015e. Takes of Marine Mammals Incidental to
Specified Activities; U.S. Navy Training and Testing Activities in the Northwest Training
and Testing Study Area; Final Rule. Federal Register 80:73556–73629. November 24,
2015.
NMFS (National Marine Fisheries Service). 2015f. Letter of Authorization for Navy Training
Activities Conducted in the Northwest Training and Testing Study Area. Period of
November 9, 2015, through November 8, 2020. Prepared for U.S. Navy, Pacific Fleet,
Pearl Harbor, Hawaii by National Marine Fisheries Service, Office of Protected
Resources, Silver Spring, Maryland. November 9, 2015.
NMFS (National Marine Fisheries Service). 2015g. Letter of Authorization for Navy Testing
Activities Conducted in the Northwest Training and Testing Study Area. Period of
November 9, 2015, through November 8, 2020. Prepared for Naval Sea Systems
Command, Washington Navy Yard, District of Columbia by National Marine Fisheries
Service, Office of Protected Resources, Silver Spring, Maryland. November 9, 2015.
NMFS (National Marine Fisheries Service). 2015h. Biological Opinion and Conference Report
for the U.S. Navy's Northwest Training and Testing Study Area from November 2015
through November 2020. FPR-2015-9110. Prepared for U.S. Navy, Pacific Fleet, Pearl
Harbor, Hawaii by National Marine Fisheries Service, Endangered Species Act Division,
Office of Protected Resources, Silver Spring, Maryland. November 9, 2015.
NMFS (National Marine Fisheries Service). 2016. Letter of Authorization for Navy Training and
Testing Activities Conducted in the Mariana Islands Training and Testing Study Area, as
modified August 31, 2016. Period of August 3, 2015, through August 3, 2020. Prepared
for U.S. Navy, Pacific Fleet, Pearl Harbor, Hawaii by National Marine Fisheries Service,
Office of Protected Resources, Silver Spring, Maryland. August 31, 2016.
NMFS (National Marine Fisheries Service). 2017a. Letter of Authorization for Navy Training
Exercises Conducted in the Gulf of Alaska Temporary Maritime Activities Area. Period of
April 26, 2017, through April 26, 2022. Prepared for U.S. Navy, Pacific Fleet, Pearl
Harbor, Hawaii by National Marine Fisheries Service, Office of Protected Resources,
Silver Spring, Maryland. April 26, 2017.
NMFS (National Marine Fisheries Service). 2017b. Taking of Marine Mammals Incidental to
Specified Activities; U.S. Navy Training Activities in the Gulf of Alaska Temporary
Maritime Activities Area; Final Rule. Federal Register 82:19530–19607. April 27, 2017.
NMFS (National Marine Fisheries Service). 2017c. Biological Opinion for the U.S. Navy's Gulf of
Alaska Training Activities from April 2017 to April 2022. FPR-2015-9118. Prepared for
U.S. Navy, Pacific Fleet, Pearl Harbor, Hawaii by National Marine Fisheries Service,
DoN | 2018 All-Range Pacific Annual Monitoring Report LITERATURE CITED
1 April 2019 | 136
Office of Protected Resources, Endangered Species Act Division, Silver Spring,
Maryland. April 19, 2017.
NMFS (National Marine Fisheries Service). 2017d. Biological Opinion for the U.S. Military
Mariana Islands Training and Testing Activities from August 2015 through August 2020.
FPR-2017-9215. Prepared for the U.S. Navy and NOAA’s National Marine Fisheries
Service, Office of Protected Resources’ Permits and Conservation Division, by National
Marine Fisheries Service, Office of Protected Resources, Endangered Species Act
Division, Silver Spring, Maryland. September 13, 2017.
NMFS (National Marine Fisheries Service). 2018a. Taking and Importing Marine Mammals;
Taking Marine Mammals Incidental to the U.S. Navy Training and Testing Activities in
the Hawaii-Southern California Training and Testing Study. Final Rule. Federal Register
83:66846–67031. December 27, 2018.
NMFS (National Marine Fisheries Service). 2018b. Biological Opinion for the U.S. Navy's
Training Exercises and Testing Activities in the Hawaii-Southern California Training and
Testing Study Area from December 2018 through December 2023. FPR-2018-9275.
Prepared for U.S. Navy and NOAA’s National Marine Fisheries Service, Office of
Protected Resources’ Permits and Conservation Division, by National Marine Fisheries
Service, Office of Protected Resources, Endangered Species Act Interagency
Cooperation Division, Silver Spring, Maryland. December 10, 2018.
NMFS (National Marine Fisheries Service). 2018c. Letter of Authorization for Navy Training
Exercises Conducted in the Hawaii-Southern California Training and Testing Study Area.
Period of December 21, 2018, through December 20, 2023. Prepared for U.S. Navy,
Pacific Fleet, Pearl Harbor, Hawaii by National Marine Fisheries Service, Office of
Protected Resources, Silver Spring, Maryland. December 19, 2018.
NMFS (National Marine Fisheries Service). 2018d. Letter of Authorization for Navy Testing
Activities Conducted in the Hawaii-Southern California Training and Testing Study Area.
Period of December 21, 2018, through December 20, 2023. Prepared for U.S. Navy,
Naval Sea Systems Command, Washington Navy Yard, District of Columbia, by National
Marine Fisheries Service, Office of Protected Resources, Silver Spring, Maryland.
December 19, 2018.
Norris, T. 2019. Guadalupe Fur Seal Population Census and Tagging in Support of Marine
Mammal Monitoring Across Multiple Navy Training Areas in the Pacific Ocean. Prepared
for Commander, U.S. Pacific Fleet, and Commander, Naval Sea Systems Command.
Submitted to Naval Facilities Engineering Command Southwest, San Diego, California,
under Cooperative Ecosystem Studies Unit, Department of the Navy Cooperative
Agreement No. N62473-18-2-004. January 2019.
Oleson, E.M., S. Baumann-Pickering, A. Sirovic, K.P. Merkens, L.M. Munger, J.S. Trickey, and
P. Fisher-Pool. 2015. Analysis of Long-term Acoustic Datasets for Baleen and Beaked
Whales Within the Mariana Islands Range Complex (MIRC) for 2010-2013. PIFSC Data
Report DR-15-002. Prepared for the U.S. Pacific Fleet Environmental Readiness Office,
DoN | 2018 All-Range Pacific Annual Monitoring Report LITERATURE CITED
1 April 2019 | 137
Pearl Harbor, Hawaii by National Marine Fisheries Service, Pacific Islands Fisheries
Science Center, Honolulu, Hawaii. February 2015.
Oliveira, E., T. Jefferson, B. Bartley, and A. Bostwick. 2019. Cruise Report, Marine Species
Monitoring & Lookout Effectiveness Study Submarine Commanders Course, February
2018 Hawaii Range Complex. Prepared for Commander, U.S. Pacific Fleet, Pearl
Harbor, Hawaii by McLaughlin Research Corporation, Middletown, Rhode Island; HDR,
Inc., Honolulu, Hawaii; and Naval Facilities Engineering Command Pacific, Pearl Harbor,
Hawaii. January 2019.
Pratchett, M.S., D. McCowan, J.A. Maynard, and S.F. Heron. 2013. Changes in bleaching
susceptibility among corals subject to ocean warming and recurrent bleaching in
Moorea, French Polynesia. PLoS ONE 8:e70443.
Randall, R.H. 2003. An annotated checklist of hydrozoan and scleractinian corals collected from
Guam and other Mariana Islands. Micronesica 35–36:121–137.
Rice, A.C., S. Baumann-Pickering, A. Širović, J.A. Hildebrand, A.M. Brewer, A.J. Debich, S.T.
Herbert, B.J. Thayre, J.S. Trickey, and S.M. Wiggins. 2015. Passive Acoustic Monitoring
for Marine Mammals in the Gulf of Alaska Temporary Maritime Activities Area 2014–
2015. MPL Technical Memorandum 600. Marine Physical Laboratory, Scripps Institution
of Oceanography, University of California San Diego, La Jolla, California. November
2015.
Rice, A.C., S. Baumann-Pickering, A. Širović, J.A. Hildebrand, A.J. Debich, A. Meyer-Löbbecke,
B.J. Thayre, J.S. Trickey, and S.M. Wiggins. 2017. Passive Acoustic Monitoring for
Marine Mammals in the SOCAL Range Complex June 2015–April 2016. MPL Technical
Memorandum 610. Marine Physical Laboratory, Scripps Institution of Oceanography,
University of California San Diego, La Jolla, California. February 2017.
Rice, A.C., S. Baumann-Pickering, A. Širović, J.A. Hildebrand, M. Rafter, A.J. Debich, B.J.
Thayre, J.S. Trickey, and S.M. Wiggins. 2018a. Passive Acoustic Monitoring for Marine
Mammals in the SOCAL Range Complex April 2016–June 2017. MPL Technical
Memorandum 618. Marine Physical Laboratory, Scripps Institution of Oceanography,
University of California San Diego, La Jolla, California. February 2018.
Rice, A.C., A. Solsona Berga, N. Posdaljian, M. Rafter, B.J. Thayre, J.S. Trickey, S.M.
Wiggins, S. Baumann-Pickering, A. Širović, and J.A. Hildebrand. 2018b. Passive
Acoustic Monitoring for Marine Mammals in the Gulf of Alaska Temporary Maritime
Activities Area May to September 2015 and April to September 2017. MPL Technical
Memorandum 627. Marine Physical Laboratory, Scripps Institution of Oceanography,
University of California San Diego, La Jolla, California. July 2018.
Rice, A.C., S. Baumann-Pickering, J.A. Hildebrand, M. Rafter, E. Regan, J.S. Trickey, and S.M.
Wiggins. 2019. Passive Acoustic Monitoring for Marine Mammals in the SOCAL Range
Complex March 2017 – July 2019. MPL Technical Memorandum 633. Marine Physical

DoN | 2018 All-Range Pacific Annual Monitoring Report LITERATURE CITED
1 April 2019 | 138
Laboratory, Scripps Institution of Oceanography, University of California San Diego, La
Jolla, California. January 2019.
Schorr, G.S., E.A. Falcone, B.K. Rone, and E.L. Keene. 2018a. Distribution and Demographics
of Cuvier’s Beaked Whales in the Southern California Bight. Interim Report under Award
#N66604-14-C-0145, submitted to Commander, U.S. Pacific Fleet, Pearl Harbor, Hawaii,
by Marine Ecology and Telemetry Research, Seabeck, Washington. January 2018.
Schorr, G.S., E.A. Falcone, B.K. Rone, and E.L. Keene. 2018b. Distribution and Demographics
of Cuvier’s Beaked Whales and Fin Whales in the Southern California Bight. Interim
Report under Award #N66604-18-Q-2187, submitted to Commander, U.S. Pacific Fleet,
Pearl Harbor, Hawaii, by Marine Ecology and Telemetry Research, Seabeck,
Washington. January 2019.
Shoemaker, M., T. Moll, K. Ampela, and T. Jefferson. 2014. Final Cruise Report, Marine
Species Monitoring & Lookout Effectiveness Study Koa Kai, January 2014, Hawaii
Range Complex. Prepared for Commander, U.S. Pacific Fleet, Pearl Harbor, Hawaii by
Naval Facilities Engineering Command Atlantic, Norfolk, Virginia; Naval Undersea
Warfare Center Division, Newport, Rhode Island; and HDR, Inc., San Diego, California.
May 2014.
Širović, A., S. Baumann-Pickering, J.A. Hildebrand, A.J. Debich, S.T. Herbert, A. Meyer-
Löbbecke, A. Rice, B. Thayre, J.S. Trickey, S.M. Wiggins, and M. Roch. 2016. Passive
Acoustic Monitoring for Marine Mammals in the SOCAL Range Complex July 2014–May
2015. MPL Technical Memorandum 607. Marine Physical Laboratory, Scripps Institution
of Oceanography, University of California San Diego, La Jolla, California. March 2016.
Širović, A., E. Wilson, and A. Rice. 2018. Spatial variability of fin whale song in the Southern
California Bight. Progress Report. MPL Technical Memorandum 617. Marine Physical
Laboratory, Scripps Institution of Oceanography, University of California San Diego, La
Jolla, California, February 2018.
Smith, S.H., and D.E. Marx. 2016. De-facto marine protection from a Navy bombing range:
Farallon De Medinilla, Mariana Archipelago, 1997 to 2012. Marine Pollution Bulletin
102:187–198.
Sprogis, K.R., H.C. Raudino, R. Rankin, C.D. MacLeod, and L. Bejder. 2016. Home range size
of adult Indo-Pacific bottlenose dolphins (Tursiops aduncus) in a coastal and estuarine
system is habitat and sex-specific. Marine Mammal Science 32:287–308.
SSC Pacific (Space and Naval Warfare Systems Center Pacific). 2017a. FDM 2017 Survey
Plan; SOW Task 1; Final. Space and Naval Warfare Systems Center Pacific, San Diego,
California. September 2017.
SSC Pacific (Space and Naval Warfare Systems Center Pacific). 2017b. FDM 2017 Field
Implementation Plan; SOW Task 2; Final. Space and Naval Warfare Systems Center
Pacific, San Diego, California. September 2017.

DoN | 2018 All-Range Pacific Annual Monitoring Report LITERATURE CITED
1 April 2019 | 139
Stimpert, A.K., S.L. DeRuiter, B.L. Southall, D.J. Moretti, E.A. Falcone, J.A. Goldbogen, A.
Friedlaender, G.S. Schorr, and J. Calambokidis. 2014. Acoustic and foraging behavior of
a Baird’s beaked whale, Berardius bairdii, exposed to simulated sonar. Scientific Reports
4:7031.
Summers, T.M., T.T. Jones, S.L. Martin, J.R. Hapdei, J.K. Ruak, and C.A. Lepczyk. 2017.
Demography of marine turtles in the near-shore environments of the Northern Mariana
Islands. Pacific Science 71:269–286.
Van Cise, A.M., S.D. Mahaffy, R.W. Baird, T.A. Mooney, and J. Barlow. 2018. Song of my
people: Dialect differences among sympatric social groups of short-finned pilot whales in
Hawai’i. Behavioral Ecology and Sociobiology 72:193.
Vars, T., S. Rider, C. Boerger, E. Roach, and T. Jefferson. 2016. Final Cruise Report, Marine
Species Monitoring & Lookout Effectiveness Study, Submarine Commanders Course,
February 2016, Hawaii Range Complex. Prepared for Commander, U.S. Pacific Fleet,
Pearl Harbor, Hawaii by Naval Undersea Warfare Center Division, Newport, Rhode
Island; Naval Facilities Engineering Command Pacific, Pearl Harbor, Hawaii; and HDR,
Inc., Honolulu, Hawaii. May 2016.
Veron, J.E., 2000. Corals of the World, vol. 1–3. Australian Institute of Marine Science,
Townsville, pp. 404-405.
Watwood, S., S. Rider, M. Richlen, and T. Jefferson. 2016. Final Cruise Report, Marine Species
Monitoring & Lookout Effectiveness Study, Submarine Commanders Course, February
2015, Hawaii Range Complex. Prepared for Commander, U.S. Pacific Fleet, Pearl
Harbor, Hawaii by Naval Undersea Warfare Center Division, Newport, Rhode Island;
Naval Facilities Engineering Command Pacific, Pearl Harbor, Hawaii; and HDR, Inc.,
Honolulu, Hawaii. January 2016.
Wiggins, S.M., and J.A. Hildebrand. 2018. Gulf of Alaska Fin Whale Calling Behavior Studied
with Acoustic Tracking. MPL Technical Memorandum 622. Marine Physical Laboratory,
Scripps Institution of Oceanography, University of California San Diego, La Jolla,
California. February 2018.
Wiggins, S.M., A.J. Debich, J.S. Trickey, A.C. Rice, B. Thayre, S. Baumann-Pickering, A.
Širović, and J.A. Hildebrand. 2017. Summary of Ambient and Anthropogenic Sound in
the Gulf of Alaska and Northwest Coast. MPL Technical Memorandum 611. Marine
Physical Laboratory, Scripps Institution of Oceanography, University of California San
Diego, La Jolla, California. March 2017.
Wiggins, S.M., B.J. Thayre, J.S. Trickey, A.C. Rice, S. Baumann-Pickering, A. Širović, M.A.
Roch, and J.A. Hildebrand. 2018. Summary of Five Years of Ambient and Anthropogenic
Sound in the SOCAL Range Complex 2012 – 2017. MPL Technical Memorandum 625.
Marine Physical Laboratory, Scripps Institution of Oceanography, University of California
San Diego, La Jolla, California. July 2018.
DoN | 2017 All-Range Pacific Annual Monitoring Report APPENDIX A
A Animal Telemetry Tag Types

DoN | 2017 All-Range Pacific Annual Monitoring Report APPENDIX A
This page intentionally left blank.

DoN | 2017 All-Range Pacific Annual Monitoring Report APPENDIX A
A-1
Table A-1. Table Summary of Animal Tracking Tag Types Used on Navy-Funded Monitoring Projects
Tag Name Acronym Project
# Use1
Advanced dive behavior
ADB S4, N3 Provides short-term, fine-scale dive profile information and Global Positioning System-quality locations.
Dive monitoring
DM S4, N3 Provides intermediate duration Argos tracking and data on dive behavior (duration, depth, number of feeding lunges per dive).
Dive duration monitoring
DUR,
DUR+
H6, S7, N1, G2
Provides data on longer-term movements and dive durations. DUR+ satellite tags are also equipped with accelerometers and lunge-detection software to monitor movement behavior.
Flipper
- M2 The most common tag used on sea turtles. Made from metal or plastic and attached by piercing through the skin of flipper. The tags usually have a unique number on one side, and a return address on the other (in case someone finds the turtle far away from where the turtle was tagged). This tag does not transmit data.
Location-only
LO H4, H5, S4, N3
Provides long-term tracking information via the Argos satellite system such as derived location, depth, temperature, light level, and wet/dry sensor. SPLASH and SPOT are specific types of location-only tags (see below).
Smart position and temperature
SPOT
SPOT311A
S4, H5, M2
Provides data on a variety of measurements, such as temperature, salinity, and depth.
SPLASH
SPLASH, SPLASH10, SPLASH10-F
SPLASH297A
M2, H1, H5, S2, S6
Provides horizontal movement and additional information such as vertical behavior (depth). The SPLASH10 tag includes sensors to measure depth, temperature, light level, and wet/dry periods (to determine surfacing). During the deployment, depth and temperature data are collected, analyzed, summarized, and compressed for transmission through the Argos satellites. The SPLASH10 tag is configured with 1 GB of non-volatile memory available for the archived data. The SPLASH10 tag must be recovered in order to retrieve the entire raw archived data set. The Low Impact Minimally Percutaneous Electronic Transmitter (LIMPET) configuration is sometimes mentioned in reference to SPLASH tag. The tag's small size allows for deployment high on the dorsal fin to enable frequent transmissions to Argos satellites. SPLASH10-F tags are also equipped with a Fastloc-GPS receiver that provides locations approaching the quality of those obtained from traditional GPS receivers, and can do so even when the tag is only at the surface for a very short period of time.
Passive integrated transponder
PIT M2 Tracks individual organisms (in this report, sea turtles) using electromagnetically-coded glass-encased microchips (i.e., reliable lifetime 'barcode' for an individual animal). Animal has to be caught and scanned; data is not transmitted.
1References: Hill et al. 2018; Martin and Jones 2018; Mate et al. 2017a, b; https://wildlifecomputers.com/
DoN | 2017 All-Range Pacific Annual Monitoring Report APPENDIX A
A-2
This page intentionally left blank.