Embed Size (px)
Citation preview
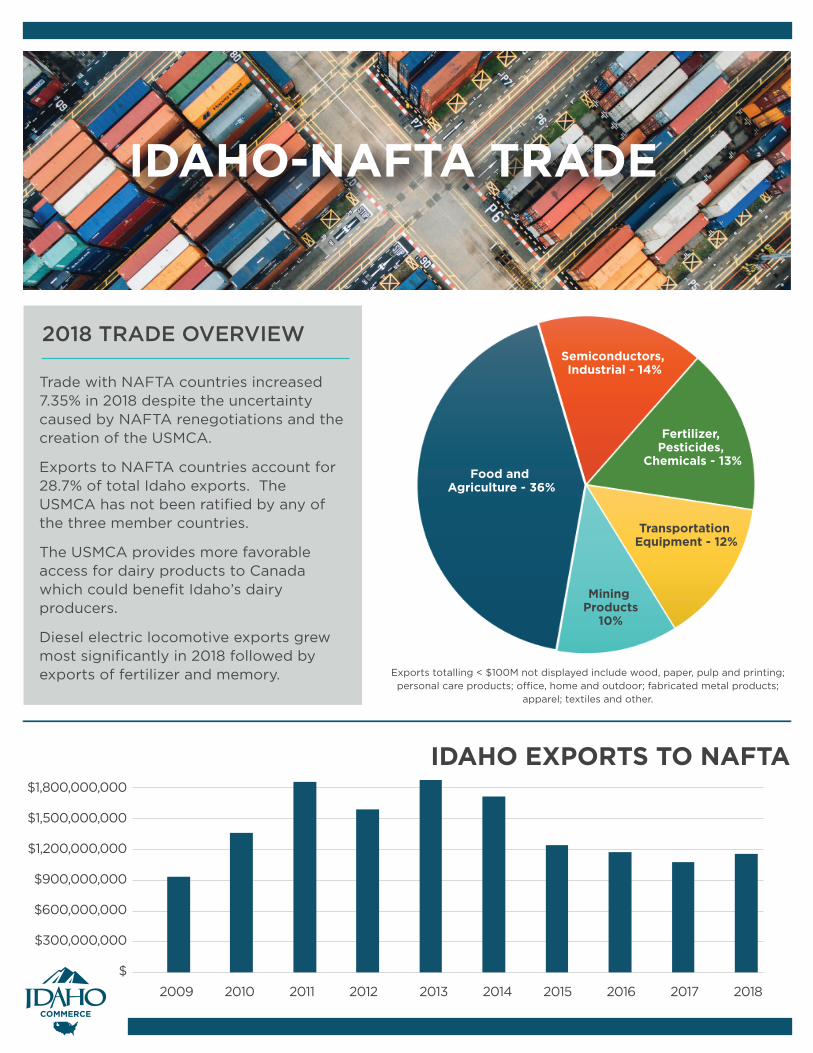
IDAHO-NAFTA TRADE
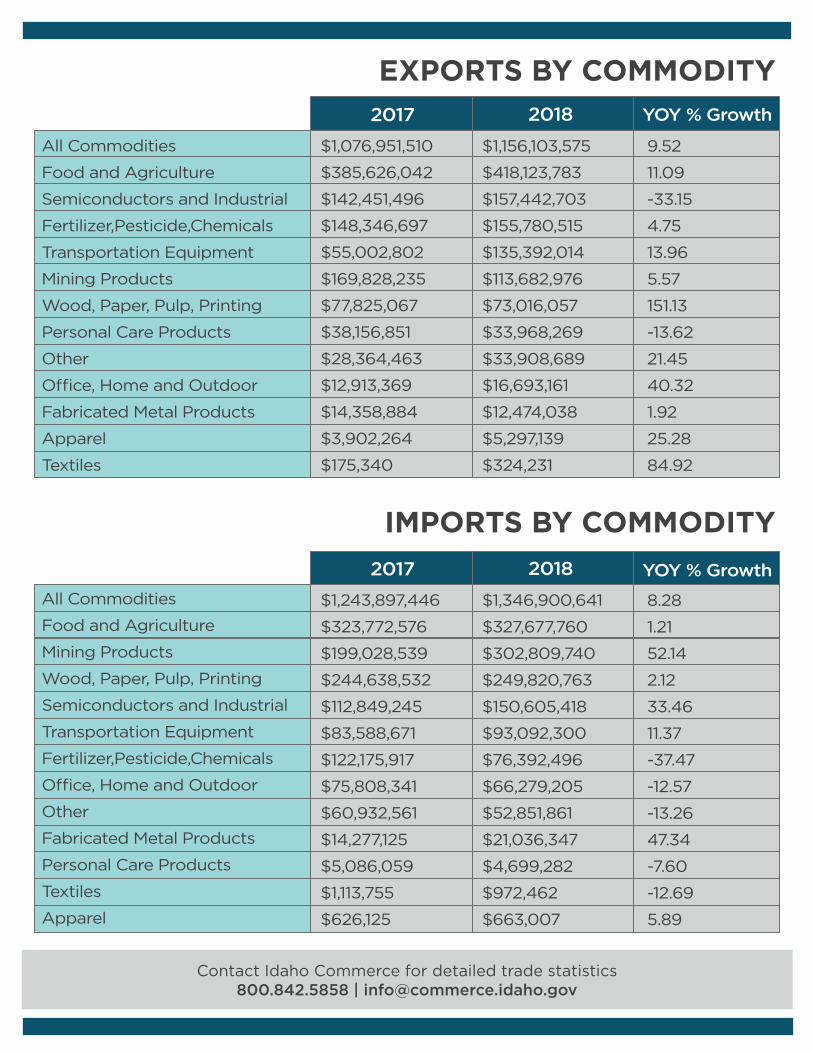
2018 TRADE OVERVIEW
Trade with NAFTA countries increased 7.35% in 2018 despite the uncertainty caused by NAFTA renegotiations and the creation of the USMCA.
Exports to NAFTA countries account for 28.7% of total Idaho exports. The USMCA has not been ratified by any of the three member countries.
The USMCA provides more favorable access for dairy products to Canada which could benefit Idaho’s dairy producers.
Diesel electric locomotive exports grew most significantly in 2018 followed by exports of fertilizer and memory.
IDAHO EXPORTS TO NAFTA$1,800,000,000
$1,500,000,000
$1,200,000,000
$900,000,000
$600,000,000
$300,000,000
$
2009 2010 2011 2012 2013 2014 2015 2016 2017 2018
Food and Agriculture - 36%
Mining Products
10%
Fertilizer, Pesticides,
Chemicals - 13%
Semiconductors, Industrial - 14%
Transportation Equipment - 12%
Exports totalling < $100M not displayed include wood, paper, pulp and printing; personal care products; o�ce, home and outdoor; fabricated metal products;
apparel; textiles and other.
EXPORTS BY COMMODITY
Contact Idaho Commerce for detailed trade statistics800.842.5858 | [email protected]
All Commodities
Food and Agriculture
Semiconductors and Industrial
Fertilizer,Pesticide,Chemicals
Transportation Equipment
Mining Products
Wood, Paper, Pulp, Printing
Personal Care Products
Other
O�ce, Home and Outdoor
Fabricated Metal Products
Apparel
Textiles
$1,076,951,510
$385,626,042
$142,451,496
$148,346,697
$55,002,802
$169,828,235
$77,825,067
$38,156,851
$28,364,463
$12,913,369
$14,358,884
$3,902,264
$175,340
$1,156,103,575
$418,123,783
$157,442,703
$155,780,515
$135,392,014
$113,682,976
$73,016,057
$33,968,269
$33,908,689
$16,693,161
$12,474,038
$5,297,139
$324,231
9.52
11.09
-33.15
4.75
13.96
5.57
151.13
-13.62
21.45
40.32
1.92
25.28
84.92
2017 2018 YOY % Growth
IMPORTS BY COMMODITY
All Commodities
Food and Agriculture
Mining Products
Wood, Paper, Pulp, Printing
Semiconductors and Industrial
Transportation Equipment
Fertilizer,Pesticide,Chemicals
O�ce, Home and Outdoor
Other
Fabricated Metal Products
Personal Care Products
Textiles
Apparel
$1,243,897,446
$323,772,576
$199,028,539
$244,638,532
$112,849,245
$83,588,671
$122,175,917
$75,808,341
$60,932,561
$14,277,125
$5,086,059
$1,113,755
$626,125
$1,346,900,641
$327,677,760
$302,809,740
$249,820,763
$150,605,418
$93,092,300
$76,392,496
$66,279,205
$52,851,861
$21,036,347
$4,699,282
$972,462
$663,007
8.28
1.21
52.14
2.12
33.46
11.37
-37.47
-12.57
-13.26
47.34
-7.60
-12.69
5.89
2017 2018 YOY % Growth


![INDIRECT EXPROPRIATION UNDER NAFTA AND DR-CAFTA: … · 2006] INDIRECT EXPROPRIATION UNDER NAFTA AND DR-CAFTA 933 NAFTA and DR-CAFTA. Part II explains how three earlier NAFTA tribunals](https://img.pdfslide.us/doc/110x75/5ec6d30ffb2475648e7b2fba/indirect-expropriation-under-nafta-and-dr-cafta-2006-indirect-expropriation-under.jpg)