Embed Size (px)
Citation preview
›2018 TD Securities Engineering & Construction Conference
›Sylvain Girard, EVP and CFO›March 27th, 2018
Forward-looking statementsReference in this presentation, and hereafter, to the “Company” or to “SNC-Lavalin” means, as the context may require, SNC-Lavalin Group Inc. and all or some of itssubsidiaries or joint arrangements, or SNC-Lavalin Group Inc. or one or more of its subsidiaries or joint arrangements.
Statements made in this presentation that describe the Company’s or management’s budgets, estimates, expectations, forecasts, objectives, predictions, projections of thefuture or strategies may be “forward-looking statements”, which can be identified by the use of the conditional or forward-looking terminology such as “aims”, “anticipates”,“assumes”, “believes”, “cost savings”, “estimates”, “expects”, “goal”, “intends”, “may”, “plans”, “projects”, “target”, “should”, “synergies”, “vision”, “will”, or the negative thereofor other variations thereon. Forward-looking statements also include any other statements that do not refer to historical facts. Forward-looking statements also includestatements relating to the following: (i) future capital expenditures, revenues, expenses, earnings, economic performance, indebtedness, financial condition, losses andfuture prospects; and (ii) business and management strategies and the expansion and growth of the Company’s operations. All such forward-looking statements are madepursuant to the “safe-harbour” provisions of applicable Canadian securities laws. The Company cautions that, by their nature, forward-looking statements involve risks anduncertainties, and that its actual actions and/or results could differ materially from those expressed or implied in such forward-looking statements, or could affect the extentto which a particular projection materializes. Forward-looking statements are presented for the purpose of assisting investors and others in understanding certain keyelements of the Company’s current objectives, strategic priorities, expectations and plans, and in obtaining a better understanding of the Company’s business andanticipated operating environment. Readers are cautioned that such information may not be appropriate for other purposes.
Forward-looking statements made in this presentation are based on a number of assumptions believed by the Company to be reasonable as at the date hereof. Theassumptions are set out throughout the Company’s 2017 Management Discussion and Analysis (MD&A). The 2018 outlook also assumes that the federal charges laidagainst the Company and its indirect subsidiaries SNC-Lavalin International Inc. and SNC-Lavalin Construction Inc. on February 19, 2015, will not have a significantadverse impact on the Company’s business in 2018. If these assumptions are inaccurate, the Company’s actual results could differ materially from those expressed orimplied in such forward-looking statements. In addition, important risk factors could cause the Company’s assumptions and estimates to be inaccurate and actual results orevents to differ materially from those expressed in or implied by these forward-looking statements. These risk factors are set out in the Company’s 2017 MD&A.
›The 2018 outlook referred to in this presentation is forward-looking information and is based on the methodology described in the Company’s 2017 MD&A under theheading “How We Budget and Forecast Our Results” and is subject to the risks and uncertainties described in the Company’s public disclosure documents. The purpose ofthe 2018 outlook is to provide the reader with an indication of management’s expectations, at the date of this presentation, regarding the Company’s future financialperformance and readers are cautioned that this information may not be appropriate for other purposes.
2
Non-IFRS financial measures and additional IFRS measures›The Company reports its financial results in accordance with IFRS. However, the following non-IFRS measures and additional IFRS measures are used by the Company:Adjusted net income from E&C, Adjusted diluted EPS from E&C, Adjusted net income from Capital, Adjusted diluted EPS from Capital, Adjusted consolidated diluted EPS,EBITDA, Adjusted E&C EBITDA, Segment EBIT and Revenue backlog. Additional details for these non-IFRS measures and additional measures can be found below and inSNC-Lavalin’s MD&A, which is available in the Investors section of the Company’s website at www.snclavalin.com. Non-IFRS financial measures do not have anystandardized meaning under IFRS and therefore may not be comparable to similar measures presented by other issuers. Management believes that, in addition toconventional measures prepared in accordance with IFRS, these non-IFRS measures provide additional insight into the Company’s financial results and certain investorsmay use this information to evaluate the Company’s performance from period to period. However, these non-IFRS financial measures have limitations and should not beconsidered in isolation or as a substitute for measures of performance prepared in accordance with IFRS.
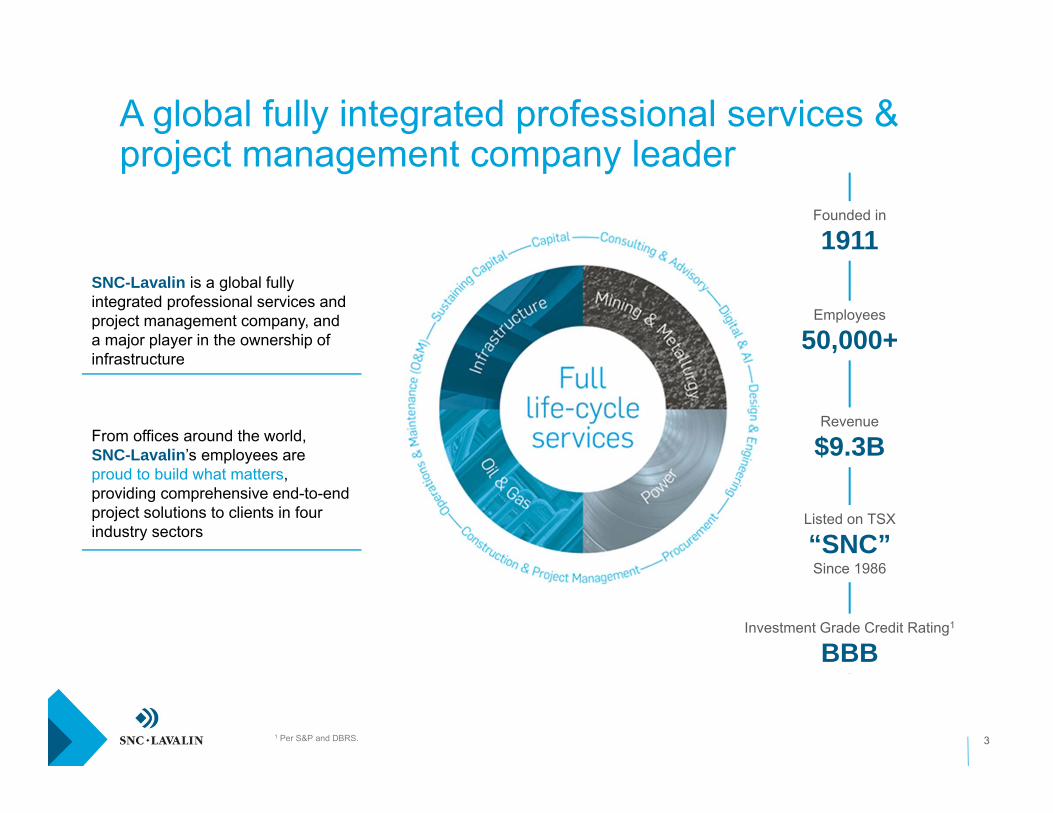
A global fully integrated professional services & project management company leader
3
SNC-Lavalin is a global fully integrated professional services and project management company, and a major player in the ownership of infrastructure
From offices around the world,SNC-Lavalin’s employees are proud to build what matters, providing comprehensive end-to-end project solutions to clients in four industry sectors
Founded in
1911
Employees
50,000+
Revenue
$9.3B
Listed on TSX
“SNC”Since 1986
Investment Grade Credit Rating1
BBB
1 Per S&P and DBRS.
4
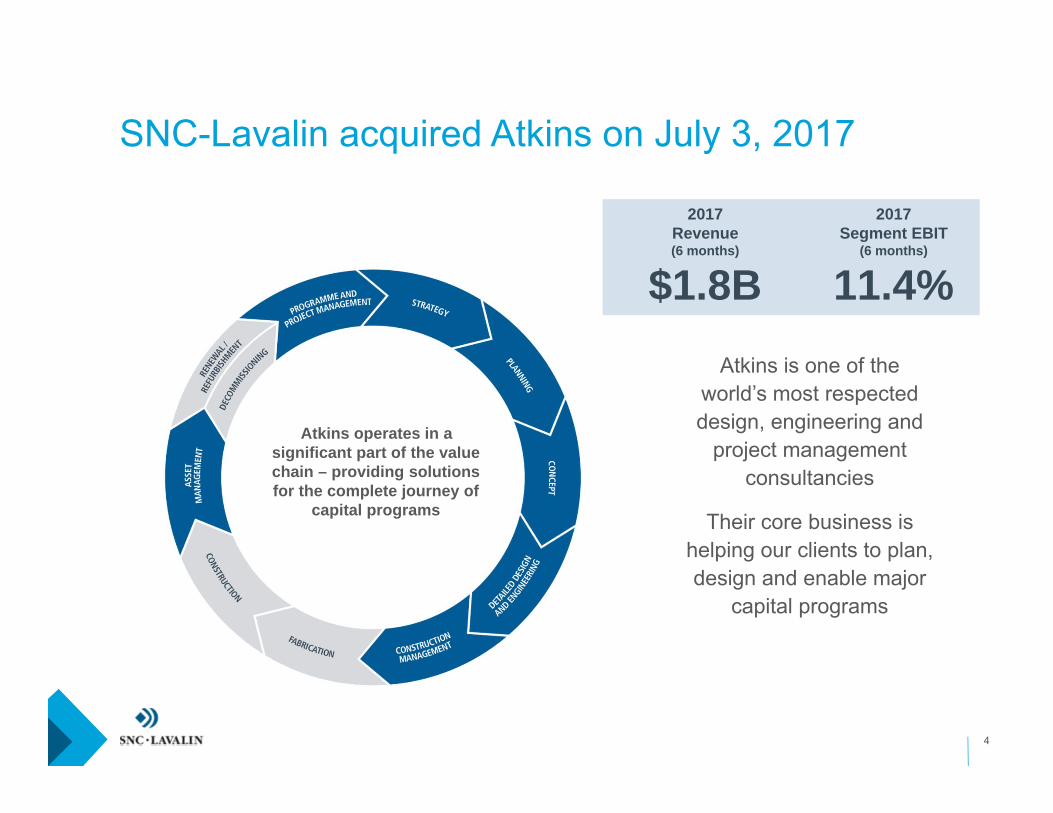
Atkins is one of the world’s most respected design, engineering and
project management consultancies
Their core business is helping our clients to plan, design and enable major
capital programs
›Atkins operates in a significant part of the value chain – providing solutions for the complete journey of
capital programs
2017Revenue(6 months)
$1.8B
2017Segment EBIT
(6 months)
11.4%
SNC-Lavalin acquired Atkins on July 3, 2017
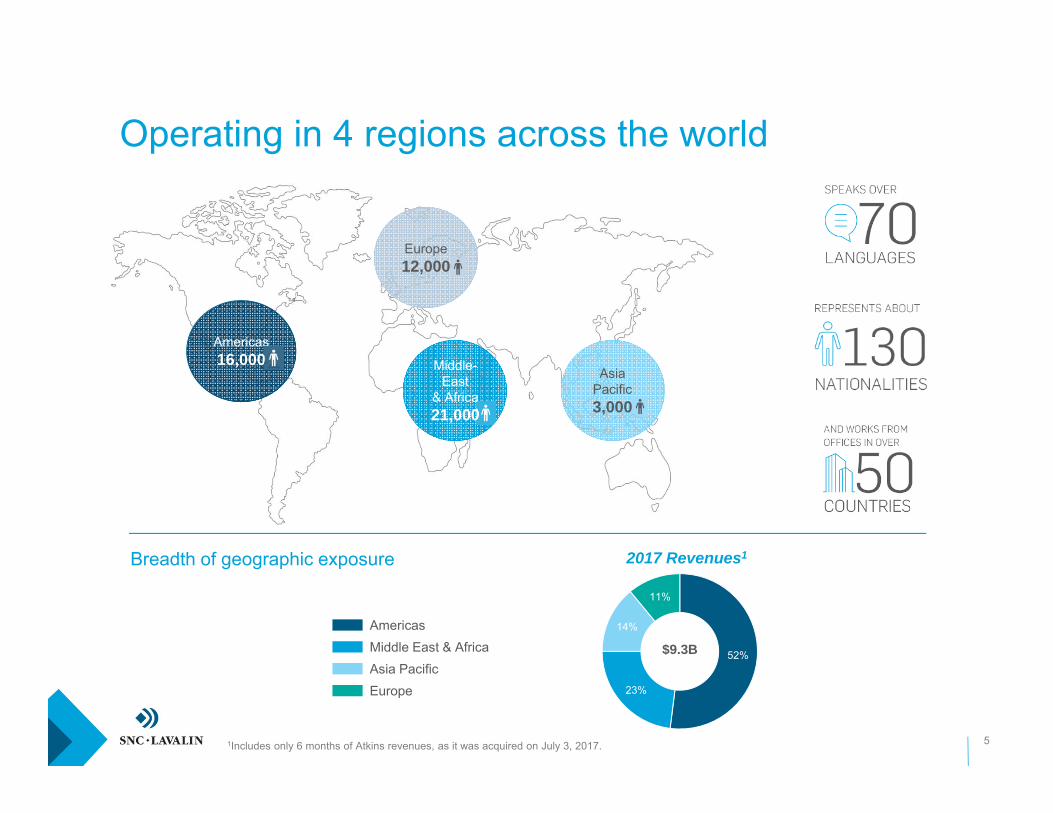
52%
23%
14%
11%
Operating in 4 regions across the world
5
Breadth of geographic exposure
Americas16,000
Europe12,000
Asia Pacific3,000
Middle-East
& Africa21,000
2017 Revenues1
$9.3B
Americas Middle East & AfricaAsia PacificEurope
1Includes only 6 months of Atkins revenues, as it was acquired on July 3, 2017.
31%
19%12%
4%
2%
32%
36%
23%
14%
5%
3%
19%
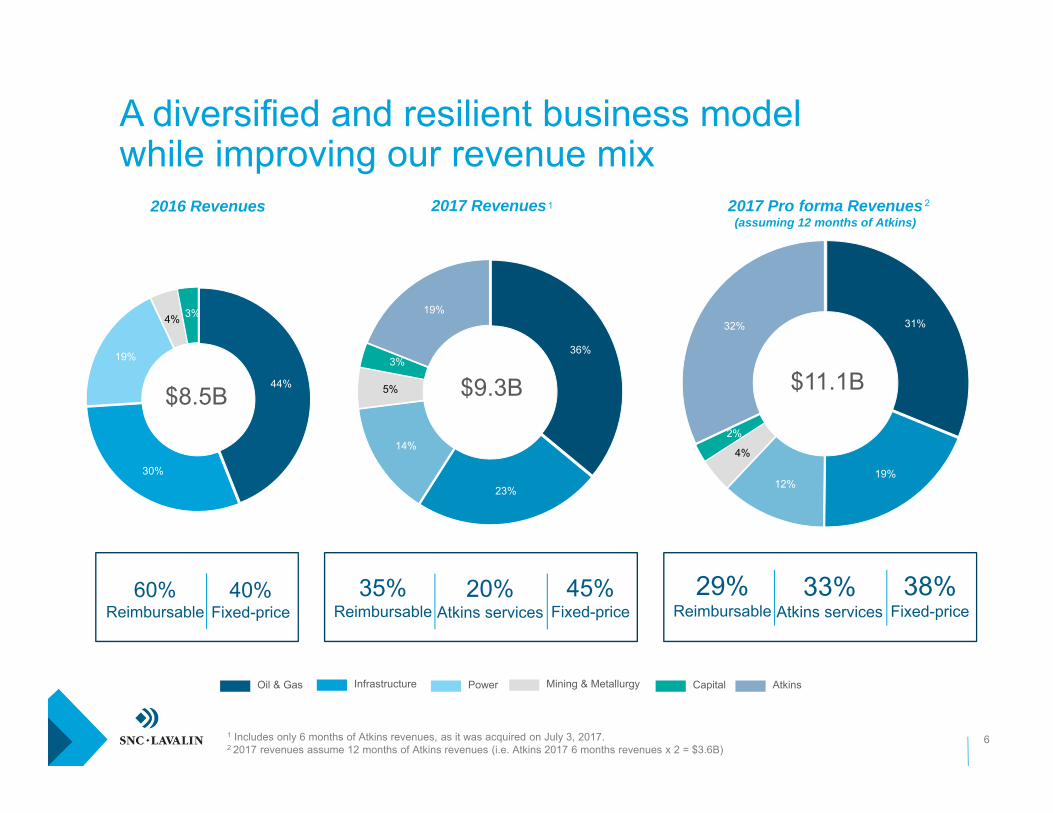
A diversified and resilient business modelwhile improving our revenue mix
6
2017 Revenues
Oil & Gas Infrastructure Power Mining & Metallurgy Capital
$9.3B
1
1 Includes only 6 months of Atkins revenues, as it was acquired on July 3, 2017.2 2017 revenues assume 12 months of Atkins revenues (i.e. Atkins 2017 6 months revenues x 2 = $3.6B)
Atkins
44%
30%
19%
4% 3%
2016 Revenues 2017 Pro forma Revenues (assuming 12 months of Atkins)
2
$8.5B $11.1B
29%Reimbursable
33%Atkins services
38%Fixed-price
35%Reimbursable
20%Atkins services
45%Fixed-price
60%Reimbursable
40%Fixed-price
7
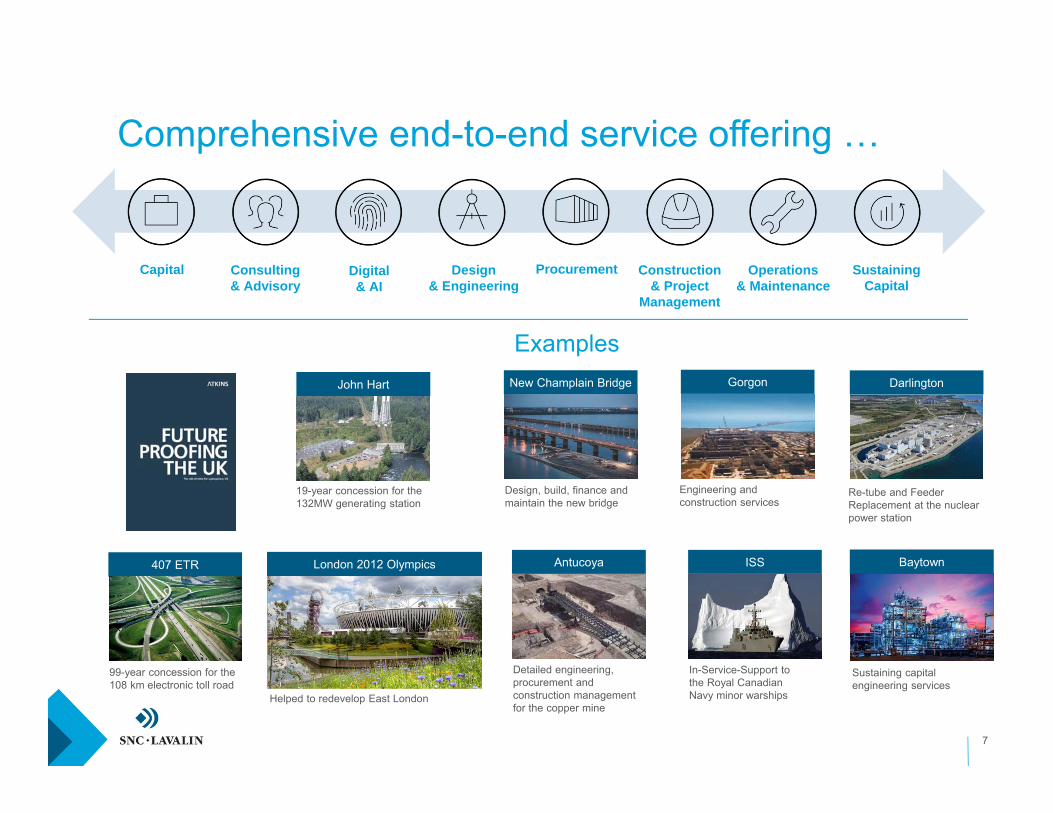
Comprehensive end-to-end service offering …
Capital Consulting& Advisory
Procurement Construction& Project
Management
Operations& Maintenance
Design& Engineering
Sustaining Capital
Digital& AI
John Hart
19-year concession for the 132MW generating station
407 ETR
99-year concession for the 108 km electronic toll road
Darlington
Re-tube and Feeder Replacement at the nuclear power station
New Champlain Bridge
Design, build, finance and maintain the new bridge
Gorgon
Engineering and construction services
Antucoya
Detailed engineering, procurement and construction management for the copper mine
Helped to redevelop East London
London 2012 Olympics ISS
In-Service-Support to the Royal Canadian Navy minor warships
Baytown
Sustaining capital engineering services
Examples
8
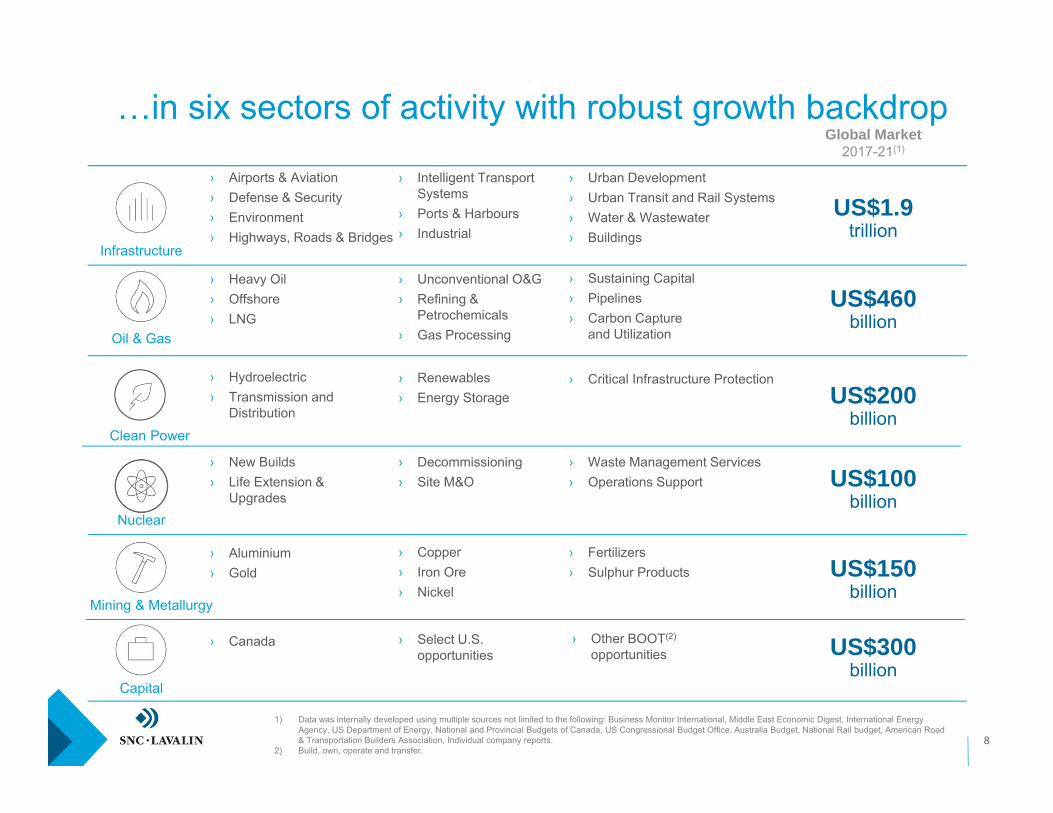
US$300billion
US$150billion
US$100billion
US$460billion
US$1.9trillion
…in six sectors of activity with robust growth backdropGlobal Market
2017-21(1)
› Airports & Aviation› Defense & Security› Environment› Highways, Roads & Bridges
› Urban Development› Urban Transit and Rail Systems› Water & Wastewater › Buildings
› Intelligent Transport Systems
› Ports & Harbours› Industrial
› Heavy Oil› Offshore› LNG
› Unconventional O&G› Refining &
Petrochemicals› Gas Processing
› Sustaining Capital› Pipelines› Carbon Capture
and Utilization
› New Builds› Life Extension &
Upgrades
› Hydroelectric› Transmission and
Distribution
› Renewables› Energy Storage
› Aluminium› Gold
› Copper› Iron Ore› Nickel
› Fertilizers› Sulphur Products
› Canada
1) Data was internally developed using multiple sources not limited to the following: Business Monitor International, Middle East Economic Digest, International Energy Agency, US Department of Energy, National and Provincial Budgets of Canada, US Congressional Budget Office, Australia Budget, National Rail budget, American Road & Transportation Builders Association, Individual company reports.
2) Build, own, operate and transfer.
Infrastructure
Oil & Gas
Clean Power
Mining & Metallurgy
Capital
› Select U.S. opportunities
› Other BOOT(2)
opportunities
Nuclear
› Decommissioning› Site M&O
› Waste Management Services› Operations Support
US$200billion
› Critical Infrastructure Protection
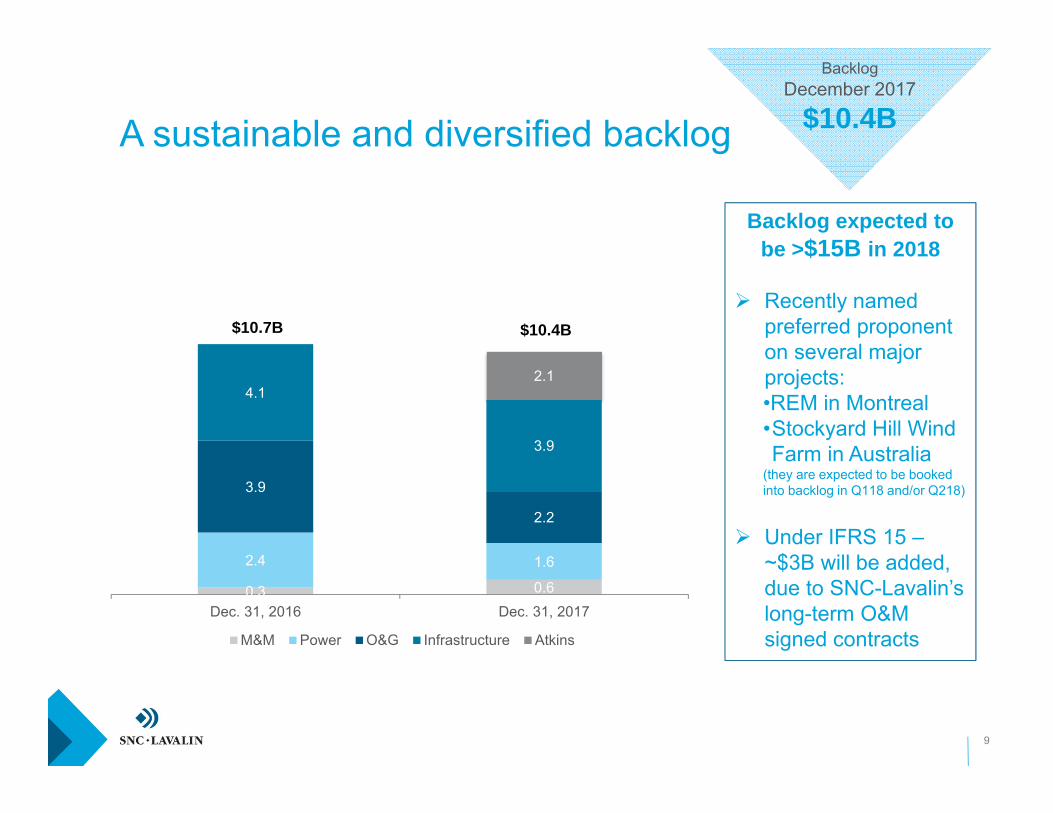
0.3 0.6
2.4 1.6
3.9
2.2
4.1
3.9
2.1
Dec. 31, 2016 Dec. 31, 2017
M&M Power O&G Infrastructure Atkins
9
A sustainable and diversified backlog
BacklogDecember 2017
$10.4B
$10.7B $10.4B
Backlog expected to be >$15B in 2018
Recently named preferred proponent on several major projects:•REM in Montreal•Stockyard Hill Wind Farm in Australia
(they are expected to be booked into backlog in Q118 and/or Q218)
Under IFRS 15 –~$3B will be added, due to SNC-Lavalin’s long-term O&M signed contracts
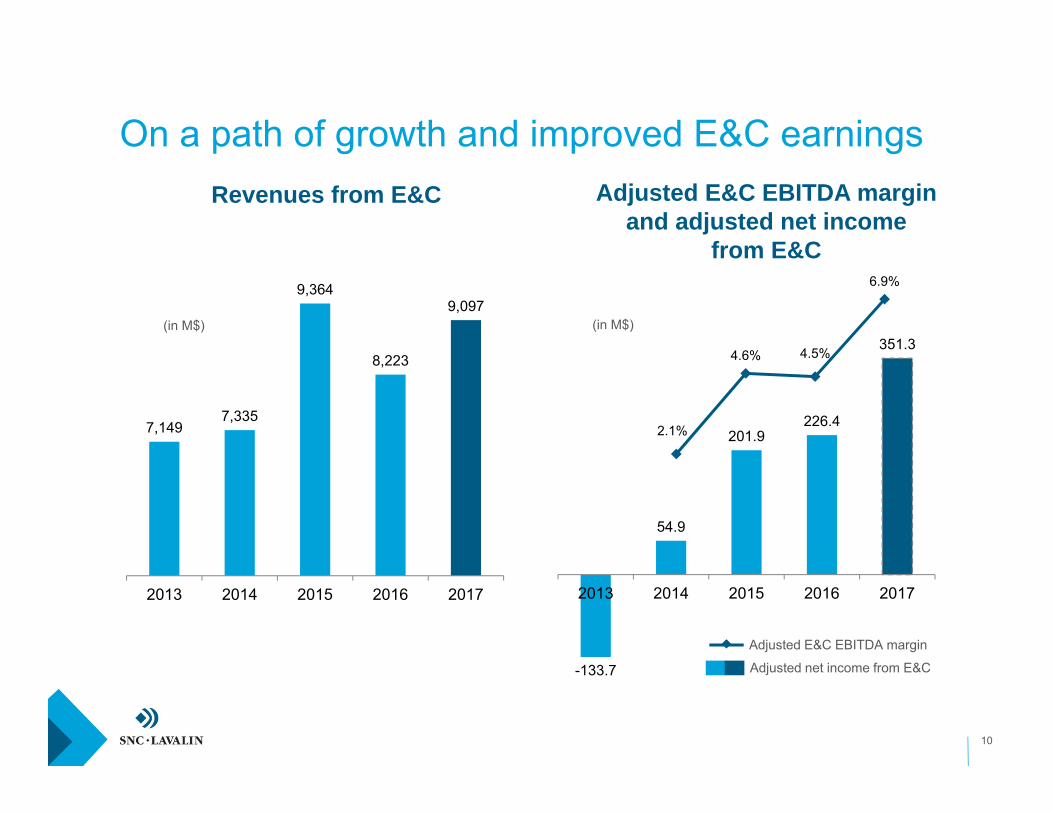
7,1497,335
9,364
8,223
9,097
2013 2014 2015 2016 2017
(in M$)
On a path of growth and improved E&C earnings
10
-133.7
54.9
201.9226.4
351.3
2013 2014 2015 2016 2017
(in M$)
Revenues from E&C Adjusted E&C EBITDA margin and adjusted net income
from E&C
2.1%
4.6% 4.5%
6.9%
Adjusted net income from E&C
Adjusted E&C EBITDA margin
11
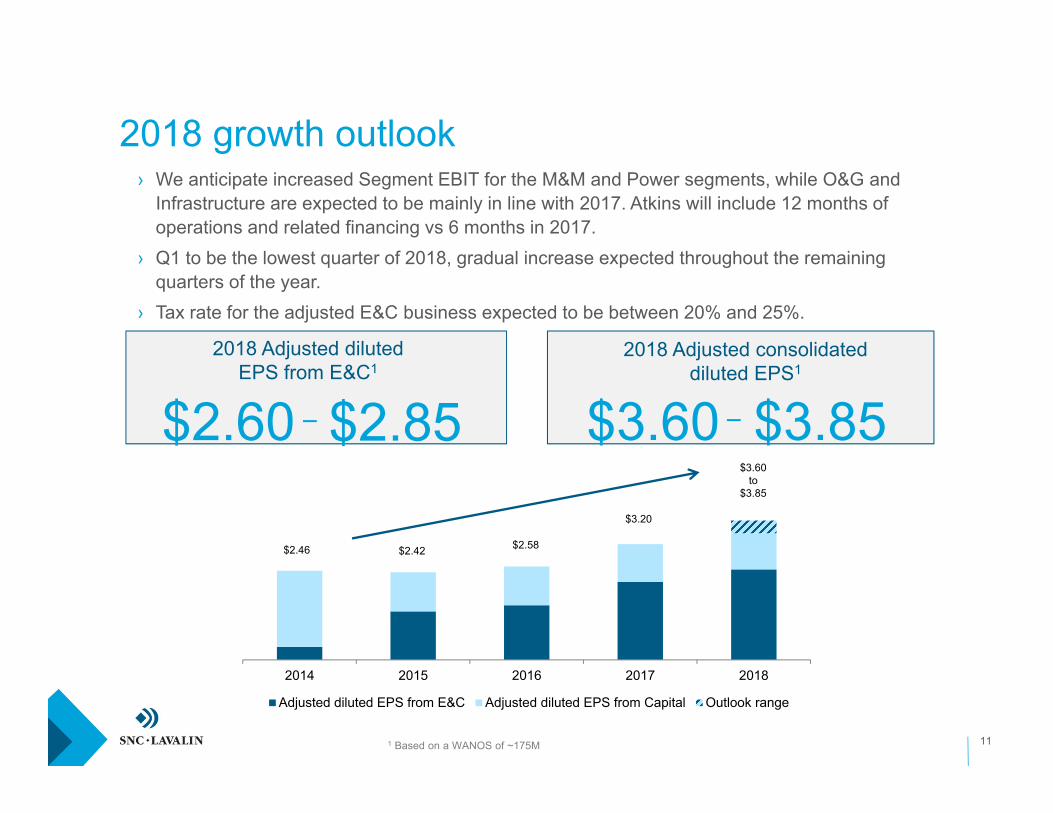
2018 Adjusted dilutedEPS from E&C1
$2.60 $2.85
2018 growth outlook› We anticipate increased Segment EBIT for the M&M and Power segments, while O&G and
Infrastructure are expected to be mainly in line with 2017. Atkins will include 12 months of operations and related financing vs 6 months in 2017.
› Q1 to be the lowest quarter of 2018, gradual increase expected throughout the remaining quarters of the year.
› Tax rate for the adjusted E&C business expected to be between 20% and 25%.
2018 Adjusted consolidateddiluted EPS1
$3.60 $3.85
2014 2015 2016 2017 2018
Adjusted diluted EPS from E&C Adjusted diluted EPS from Capital Outlook range
$2.46 $2.42 $2.58
$3.20
$3.60to
$3.85
1 Based on a WANOS of ~175M
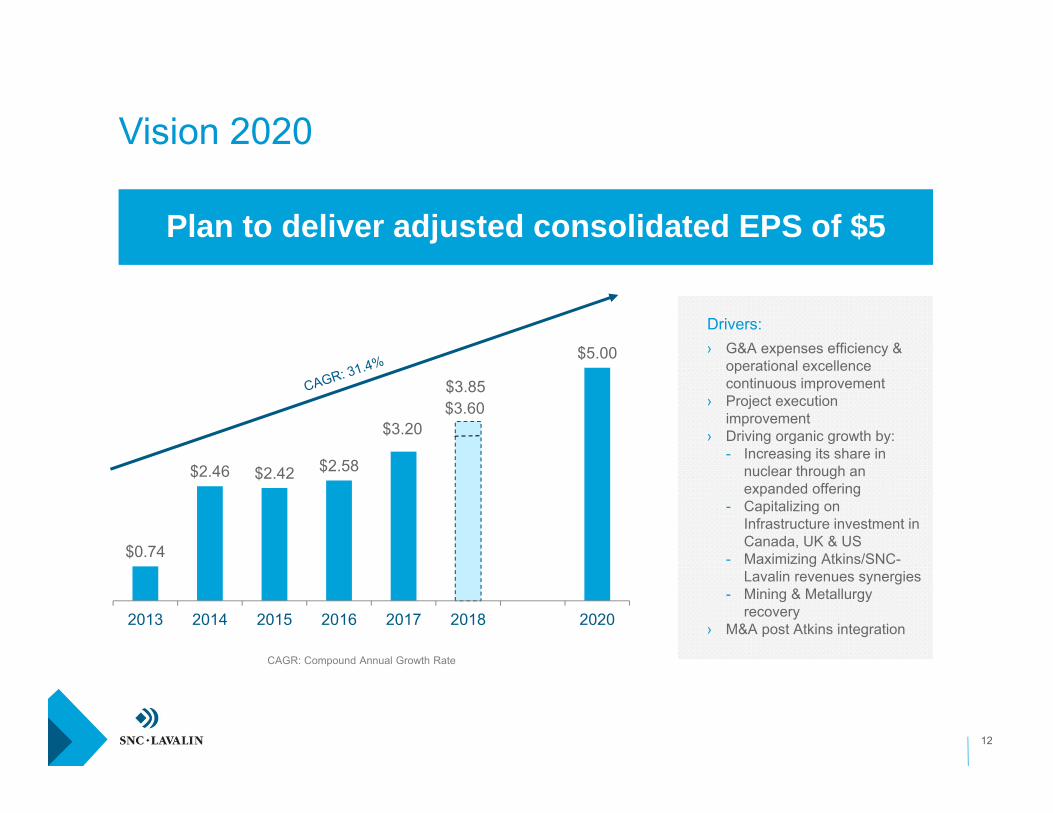
Plan to deliver adjusted consolidated EPS of $5
12
CAGR: Compound Annual Growth Rate
Drivers:› G&A expenses efficiency &
operational excellence continuous improvement
› Project execution improvement
› Driving organic growth by:- Increasing its share in
nuclear through an expanded offering
- Capitalizing on Infrastructure investment in Canada, UK & US
- Maximizing Atkins/SNC-Lavalin revenues synergies
- Mining & Metallurgy recovery
› M&A post Atkins integration
$0.74
$2.46 $2.42 $2.58
$3.20
$3.85
$5.00
2013 2014 2015 2016 2017 2018 2020
$3.60
Vision 2020
13
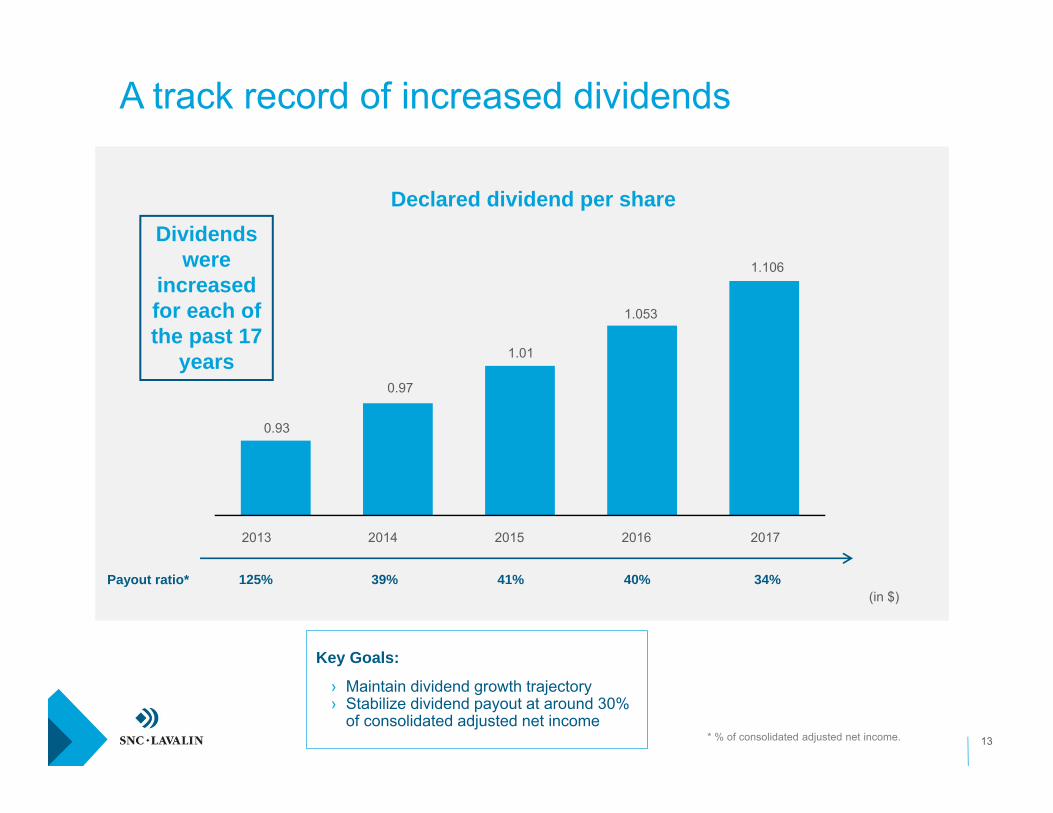
1.053
20152014
1.01
0.97
0.93
2013
1.106
20172016
Payout ratio* 125% 40%41%39% 34%(in $)
A track record of increased dividends
Dividends were
increased for each of the past 17
years
Declared dividend per share
* % of consolidated adjusted net income.
Key Goals:
› Maintain dividend growth trajectory› Stabilize dividend payout at around 30%
of consolidated adjusted net income

14
1 The Integrity Regime, in effect since July 2015, bars companies and their related legal entities from bidding on government contracts if they are charged with or convicted of certain criminal or administrative charges
September 2016Reached a compliance agreement with the Commissioner of Canada Elections in relation to an investigation by the Commissioner into certain reimbursements
September 2016Reached a compliance agreement with the Commissioner of Canada Elections in relation to an investigation by the Commissioner into certain reimbursements
5
December 2015SNC-Lavalin announces the first-ever administrative agreement with the Government of Canada under the Integrity Regime1
December 2015SNC-Lavalin announces the first-ever administrative agreement with the Government of Canada under the Integrity Regime1
February 2015Received Authorization From AMF to Contract With Public Authorities in Quebec
February 2015Received Authorization From AMF to Contract With Public Authorities in Quebec
October 2015Reached a settlement with the African Development Bank Group (AfDB) regarding allegations of sanctionable practices
October 2015Reached a settlement with the African Development Bank Group (AfDB) regarding allegations of sanctionable practices
21 3
May 2016Participation in the Quebec government's Voluntary Reimbursement Program. The program was put into force by the Government of Quebec in November 2015
May 2016Participation in the Quebec government's Voluntary Reimbursement Program. The program was put into force by the Government of Quebec in November 2015
4
Our ethics and compliance
program is an integral part ofdaily activities
Fostering an ethical culture to prevent the likelihood of wrongdoing and compliance violations from occurring
Providing internal controls and other sources to identify misconduct and evaluate adherence
Involving measures to take corrective action in response to misconduct
1)Feb-15
2)Oct-15
3)Dec-15
4)May-16
5)Sep-16
Ethics & compliance integrated in the way we work
December 2017Reached an agreement with all the public bodies of Quebec that have received its offer under the Voluntary Reimbursement Program
December 2017Reached an agreement with all the public bodies of Quebec that have received its offer under the Voluntary Reimbursement Program
6
6)Dec-17
Ethics & compliance update
February 2018Based on the consultation conducted in fall 2017, the Government of Canada intends to introduce legislation for Canadian Deferred Prosecution Agreements, to be implemented through Judicial Remediation Orders
February 2018Based on the consultation conducted in fall 2017, the Government of Canada intends to introduce legislation for Canadian Deferred Prosecution Agreements, to be implemented through Judicial Remediation Orders
77)
Feb-18

15
Investment in the global infrastructure sector is expected to grow, with the North American market particularly attractive
SNC-Lavalin: a unique platform to invest in the high growth infrastructure and power sector
1
2
4
3
6
5
Why
SN
C-L
aval
in
Leading international E&C firm of scale, the largest E&C firm in Canada and globally recognised
Optimally placed to capture market growth due to its diversified sector mix, extensive international presence and its competitive advantage from its presence across the value chain
SNC-Lavalin provides high visibility of revenues driven by a diversified backlog and complemented by a portfolio of prime infrastructure concessions which provide stable cashflows
Established track record of financial performance and strong balance sheet discipline that consistently delivers shareholder returns (strong track record of increased dividends)
Experienced management who have developed SNC-Lavalin into a well respected global brand and fostered a culture of Ethics excellence

16
SNC-Lavalin: a discounted share priceSNC-Lavalin Peers
GroupAverage1
PeersGroup incl.
Canadian peersAverage2
Share price3 $55.37
Less H4074 (25.91)
Less Other Concessions4
(2.82)
Adjusted E&C price $26.64
2018 adjusted EPS from E&C consensus4
$2.74
E&C P/E multiple 9.7 14.3 14.9
1 Includes Fluor, Jacobs, Wood, Balfour Beatty, WorleyParsons, CB&I and Aecom2 Incudes peers group + WSP and Stantec3 Close as at March 23, 20184 Street consensus as at March 23, 2018
SNC-Lavalin’s E&C P/E multiple ~ 5 times lower than peers

Appendix
18
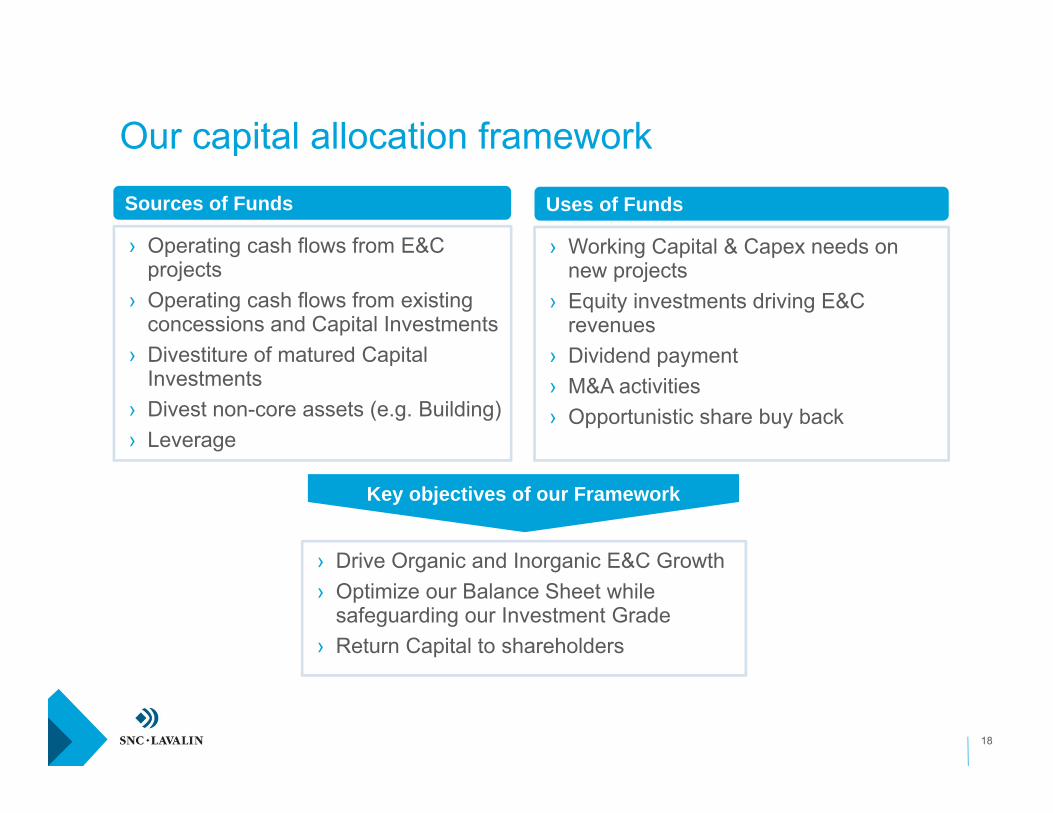
› Operating cash flows from E&C projects
› Operating cash flows from existing concessions and Capital Investments
› Divestiture of matured Capital Investments
› Divest non-core assets (e.g. Building)› Leverage
Sources of Funds
› Working Capital & Capex needs on new projects
› Equity investments driving E&C revenues
› Dividend payment› M&A activities› Opportunistic share buy back
Uses of Funds
› Drive Organic and Inorganic E&C Growth› Optimize our Balance Sheet while
safeguarding our Investment Grade› Return Capital to shareholders
Key objectives of our Framework
Our capital allocation framework
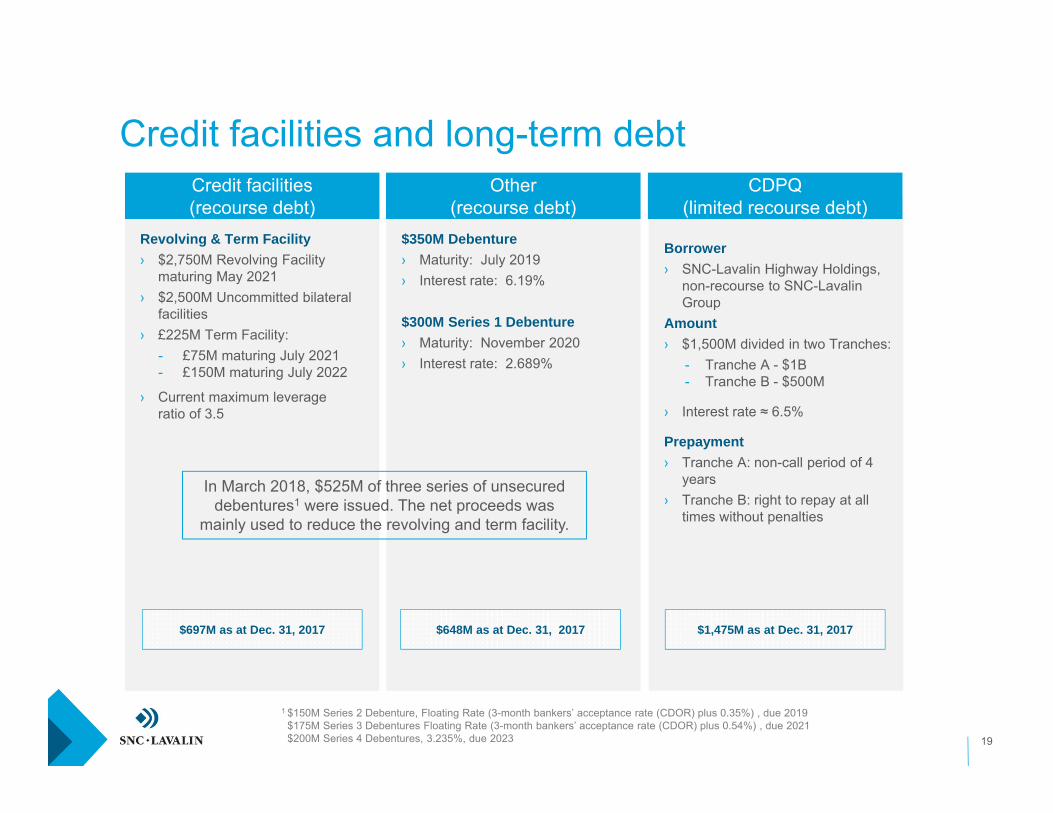
$350M Debenture› Maturity: July 2019› Interest rate: 6.19%
$300M Series 1 Debenture› Maturity: November 2020› Interest rate: 2.689%
Borrower› SNC-Lavalin Highway Holdings,
non-recourse to SNC-Lavalin Group
Amount› $1,500M divided in two Tranches:
- Tranche A - $1B- Tranche B - $500M
› Interest rate ≈ 6.5%
Prepayment› Tranche A: non-call period of 4
years› Tranche B: right to repay at all
times without penalties
19
Revolving & Term Facility› $2,750M Revolving Facility
maturing May 2021› $2,500M Uncommitted bilateral
facilities› £225M Term Facility:
- £75M maturing July 2021- £150M maturing July 2022
› Current maximum leverage ratio of 3.5
$648M as at Dec. 31, 2017
Credit facilities(recourse debt)
Other(recourse debt)
CDPQ(limited recourse debt)
Credit facilities and long-term debt
$697M as at Dec. 31, 2017 $1,475M as at Dec. 31, 2017
In March 2018, $525M of three series of unsecured debentures1 were issued. The net proceeds was
mainly used to reduce the revolving and term facility.
1 $150M Series 2 Debenture, Floating Rate (3-month bankers’ acceptance rate (CDOR) plus 0.35%) , due 2019$175M Series 3 Debentures Floating Rate (3-month bankers’ acceptance rate (CDOR) plus 0.54%) , due 2021$200M Series 4 Debentures, 3.235%, due 2023
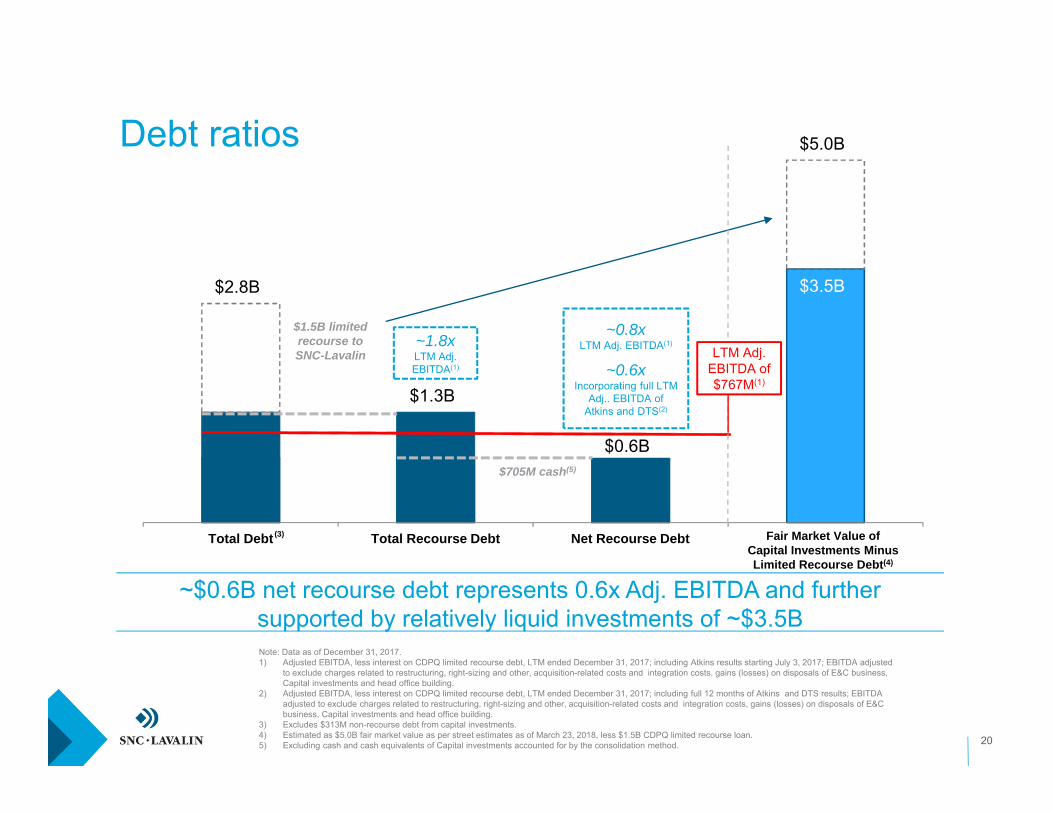
$3.5B $2.8B
$1.3B
$0.6B
$5.0B
Total Debt Total Recourse Debt Net Recourse Debt
20
$1.5B limited recourse to SNC-Lavalin
$705M cash(5)
~$0.6B net recourse debt represents 0.6x Adj. EBITDA and further supported by relatively liquid investments of ~$3.5B
LTM Adj. EBITDA of $767M(1)
Fair Market Value of Capital Investments Minus Limited Recourse Debt(4)
Note: Data as of December 31, 2017.1) Adjusted EBITDA, less interest on CDPQ limited recourse debt, LTM ended December 31, 2017; including Atkins results starting July 3, 2017; EBITDA adjusted
to exclude charges related to restructuring, right-sizing and other, acquisition-related costs and integration costs, gains (losses) on disposals of E&C business, Capital investments and head office building.
2) Adjusted EBITDA, less interest on CDPQ limited recourse debt, LTM ended December 31, 2017; including full 12 months of Atkins and DTS results; EBITDA adjusted to exclude charges related to restructuring, right-sizing and other, acquisition-related costs and integration costs, gains (losses) on disposals of E&C business, Capital investments and head office building.
3) Excludes $313M non-recourse debt from capital investments.4) Estimated as $5.0B fair market value as per street estimates as of March 23, 2018, less $1.5B CDPQ limited recourse loan.5) Excluding cash and cash equivalents of Capital investments accounted for by the consolidation method.
~1.8xLTM Adj. EBITDA(1)
~0.8xLTM Adj. EBITDA(1)
~0.6xIncorporating full LTM
Adj.. EBITDA of Atkins and DTS(2)
(3)
Debt ratios
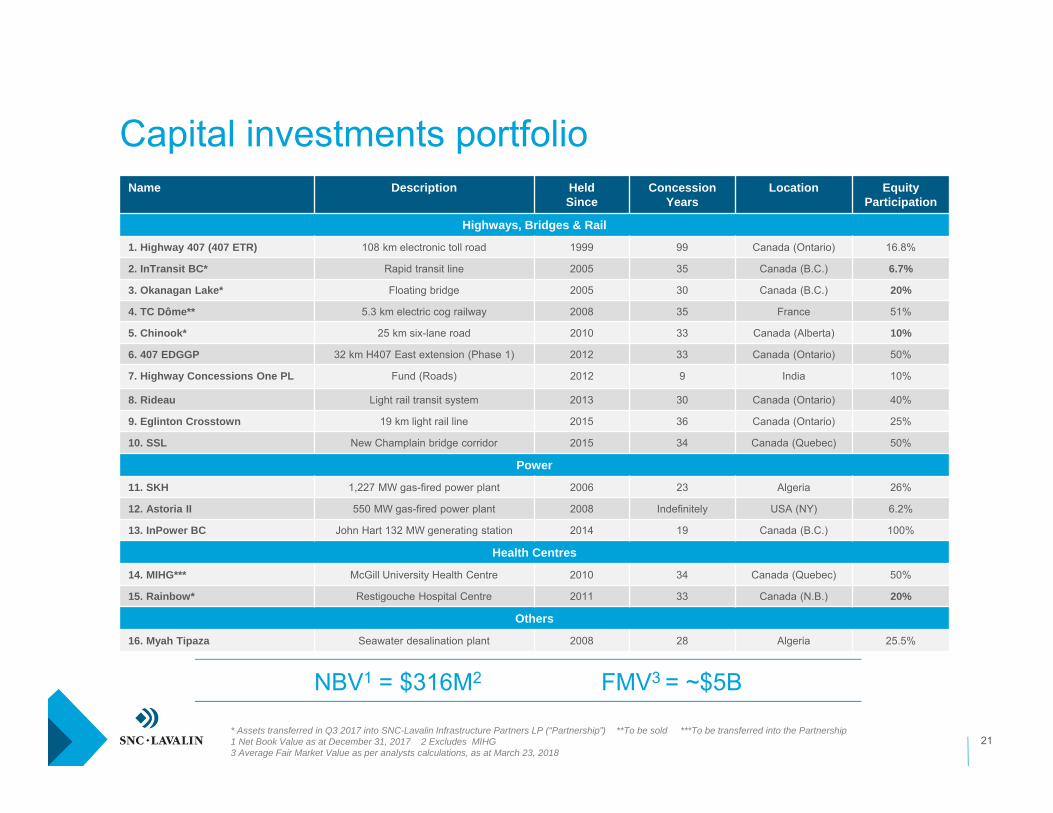
Name Description HeldSince
ConcessionYears
Location EquityParticipation
Highways, Bridges & Rail
1. Highway 407 (407 ETR) 108 km electronic toll road 1999 99 Canada (Ontario) 16.8%
2. InTransit BC* Rapid transit line 2005 35 Canada (B.C.) 6.7%
3. Okanagan Lake* Floating bridge 2005 30 Canada (B.C.) 20%
4. TC Dôme** 5.3 km electric cog railway 2008 35 France 51%
5. Chinook* 25 km six-lane road 2010 33 Canada (Alberta) 10%
6. 407 EDGGP 32 km H407 East extension (Phase 1) 2012 33 Canada (Ontario) 50%
7. Highway Concessions One PL Fund (Roads) 2012 9 India 10%
8. Rideau Light rail transit system 2013 30 Canada (Ontario) 40%
9. Eglinton Crosstown 19 km light rail line 2015 36 Canada (Ontario) 25%
10. SSL New Champlain bridge corridor 2015 34 Canada (Quebec) 50%
Power
11. SKH 1,227 MW gas-fired power plant 2006 23 Algeria 26%
12. Astoria II 550 MW gas-fired power plant 2008 Indefinitely USA (NY) 6.2%
13. InPower BC John Hart 132 MW generating station 2014 19 Canada (B.C.) 100%
Health Centres
14. MIHG*** McGill University Health Centre 2010 34 Canada (Quebec) 50%
15. Rainbow* Restigouche Hospital Centre 2011 33 Canada (N.B.) 20%
Others
16. Myah Tipaza Seawater desalination plant 2008 28 Algeria 25.5%
Capital investments portfolio
NBV1 = $316M2 FMV3 = ~$5B
* Assets transferred in Q3 2017 into SNC-Lavalin Infrastructure Partners LP (“Partnership”) **To be sold ***To be transferred into the Partnership1 Net Book Value as at December 31, 2017 2 Excludes MIHG 3 Average Fair Market Value as per analysts calculations, as at March 23, 2018
21
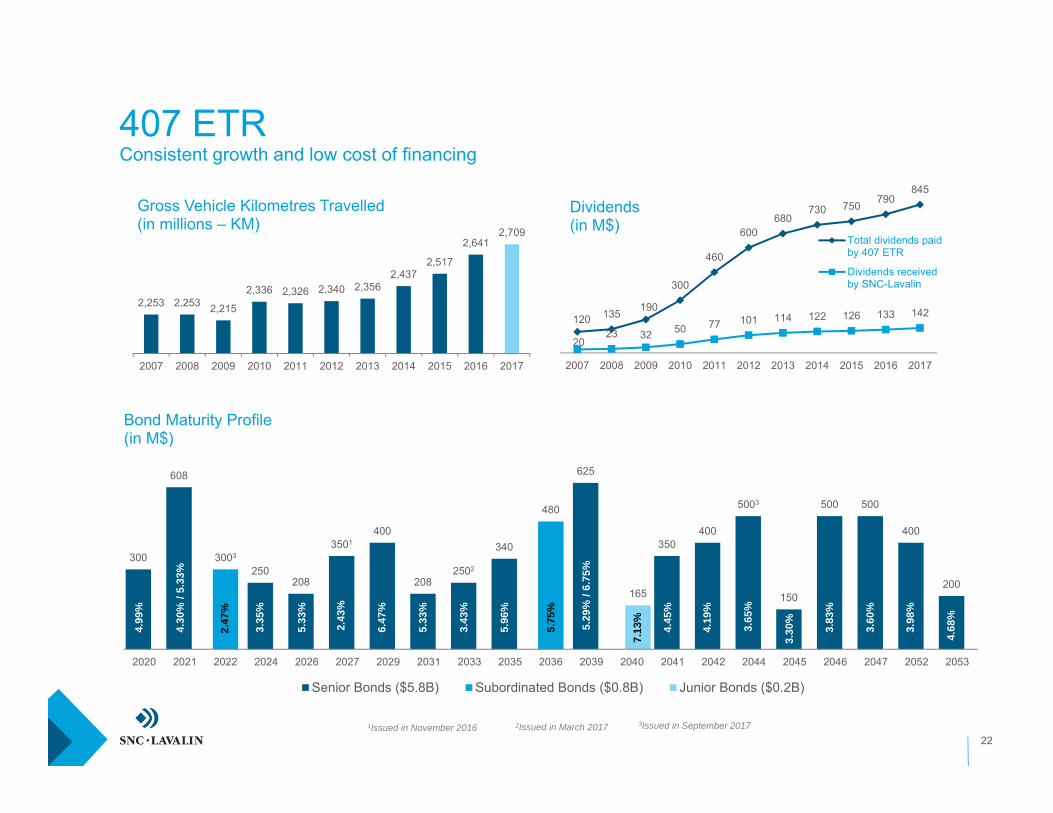
407 ETRConsistent growth and low cost of financing
22
120 135 190
300
460
600680
730 750 790845
2023 32 50 77 101 114 122 126 133 142
2007 2008 2009 2010 2011 2012 2013 2014 2015 2016 2017
Dividends (in M$)
Total dividends paidby 407 ETR
Dividends receivedby SNC-Lavalin
300
608
250208
3501400
2082502
340
625
350400
5003
150
500 500
400
200
3003
480
165
2020 2021 2022 2024 2026 2027 2029 2031 2033 2035 2036 2039 2040 2041 2042 2044 2045 2046 2047 2052 2053
Bond Maturity Profile(in M$)
Senior Bonds ($5.8B) Subordinated Bonds ($0.8B) Junior Bonds ($0.2B)
4.99
%
4.30
% /
5.33
%
3.35
%
5.33
%
6.47
%
5.33
%
5.96
%
5.75
%
7.13
%
4.45
%
4.19
%
3.30
%
3.83
%
3.98
%
4.68
%
3.60
%
5.29
% /
6.75
%
2.43
%
2,253 2,253 2,215
2,336 2,326 2,340 2,3562,437
2,517
2,6412,709
2007 2008 2009 2010 2011 2012 2013 2014 2015 2016 2017
Gross Vehicle Kilometres Travelled(in millions – KM)
1Issued in November 2016 2Issued in March 2017
3.43
%
2.47
%
3.65
%
3Issued in September 2017
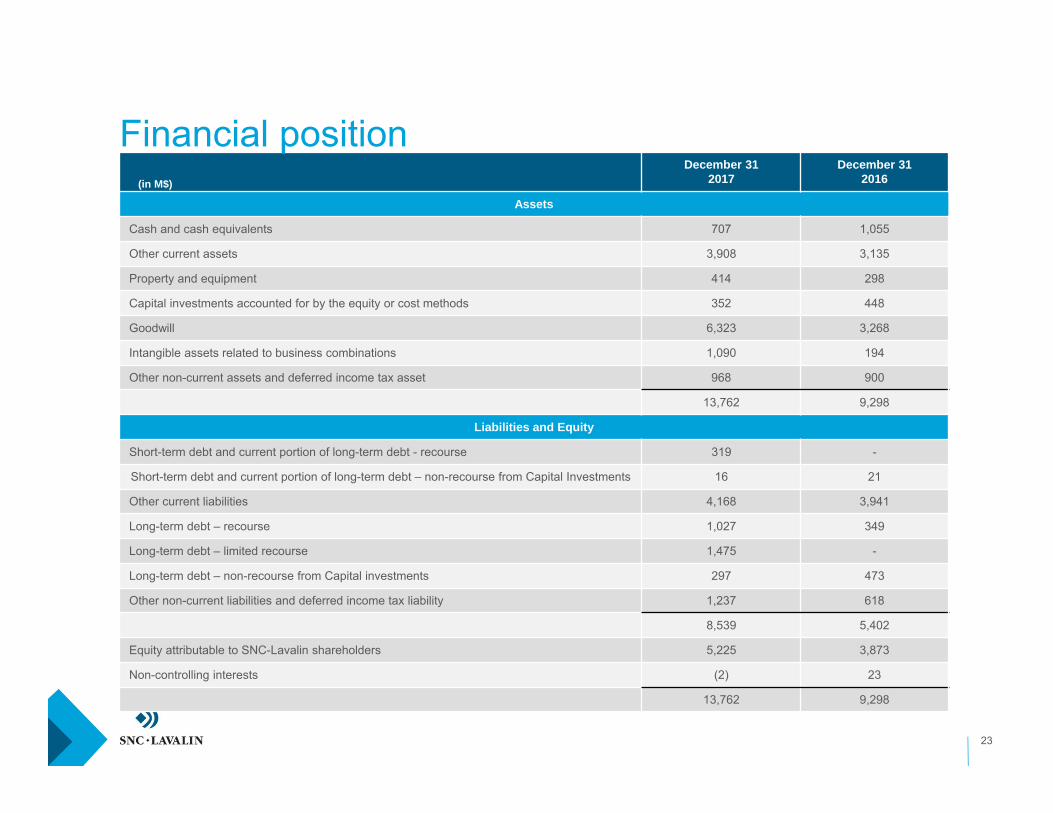
December 312017
December 312016
Assets
Cash and cash equivalents 707 1,055
Other current assets 3,908 3,135
Property and equipment 414 298
Capital investments accounted for by the equity or cost methods 352 448
Goodwill 6,323 3,268
Intangible assets related to business combinations 1,090 194
Other non-current assets and deferred income tax asset 968 900
13,762 9,298
Liabilities and Equity
Short-term debt and current portion of long-term debt - recourse 319 -
Short-term debt and current portion of long-term debt – non-recourse from Capital Investments 16 21
Other current liabilities 4,168 3,941
Long-term debt – recourse 1,027 349
Long-term debt – limited recourse 1,475 -
Long-term debt – non-recourse from Capital investments 297 473
Other non-current liabilities and deferred income tax liability 1,237 618
8,539 5,402
Equity attributable to SNC-Lavalin shareholders 5,225 3,873
Non-controlling interests (2) 23
13,762 9,298
Financial position
23
(in M$)
Our values
24
Our values are the essence of our Company’s identity. They represents how we act, speak and behave together, and how we engage with our clients and stakeholders.
SAFETY› We put safety at the heart of everything we do, to safeguard people, assets and the
environment
INTEGRITY› We do the right thing, no matter what, and are accountable for our actions
COLLABORATION› We work together and embrace each other’s unique contribution to deliver amazing results
for all
INNOVATION› We redefine engineering by thinking boldly, proudly and differently
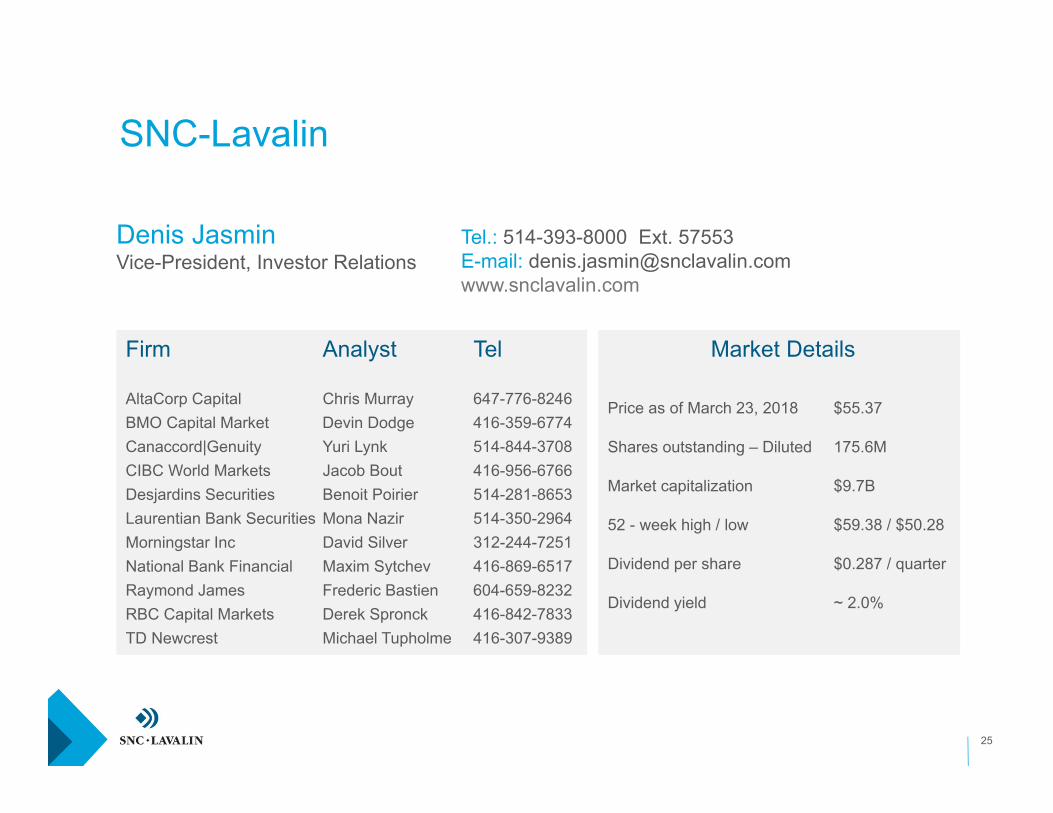
Firm Analyst Tel
AltaCorp Capital Chris Murray 647-776-8246BMO Capital Market Devin Dodge 416-359-6774Canaccord|Genuity Yuri Lynk 514-844-3708CIBC World Markets Jacob Bout 416-956-6766Desjardins Securities Benoit Poirier 514-281-8653Laurentian Bank Securities Mona Nazir 514-350-2964Morningstar Inc David Silver 312-244-7251National Bank Financial Maxim Sytchev 416-869-6517Raymond James Frederic Bastien 604-659-8232RBC Capital Markets Derek Spronck 416-842-7833TD Newcrest Michael Tupholme 416-307-9389
Price as of March 23, 2018 $55.37
Shares outstanding – Diluted 175.6M
Market capitalization $9.7B
52 - week high / low $59.38 / $50.28
Dividend per share $0.287 / quarter
Dividend yield ~ 2.0%
25
Tel.: 514-393-8000 Ext. 57553E-mail: [email protected]
SNC-Lavalin
Denis JasminVice-President, Investor Relations
Market Details