Embed Size (px)
Citation preview
#Obsepub2018 Report21th Edition – January 2019
2
Methodological reminder
Official revenues from SRI & UDECAM members
Total market estimation done by PwC
Qualitative interviews
1
2
3
1. Digital Advertising Market growth
2. Focus : Search and others channels
3. Focus : Display & Social Display split by formats & purchase type
4. Focus : Mobile Search & Display
5. Conclusion & Key facts
10YearsChallenge
Digital Ad-Trust Label update
3
Agenda
#
4
01
FASTER DIGITAL ADVERTISING MARKET
GROWTH IN 2018
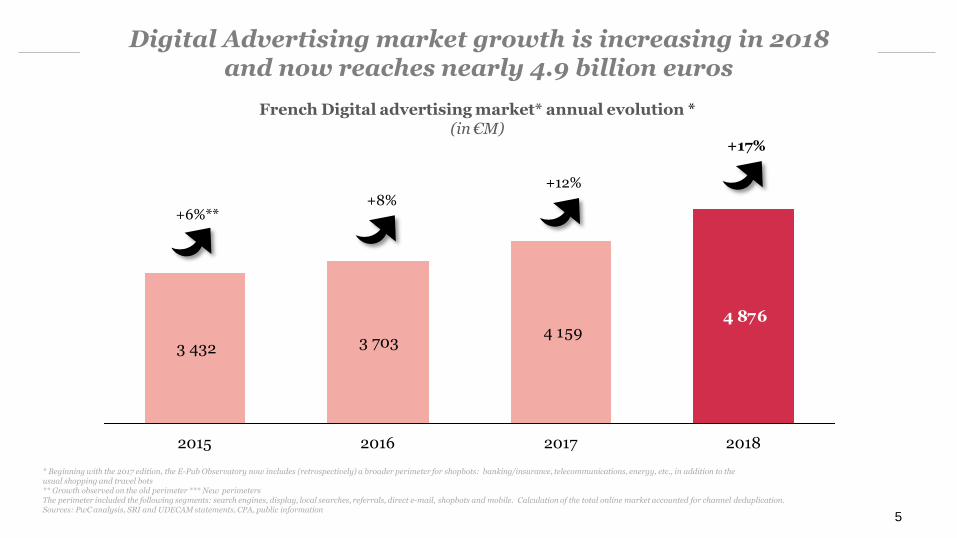
3 432 3 703 4 159
4 876
20172015 2016 2018
+6%**+8%
+12%
5
French Digital advertising market* annual evolution *(in€M)
Digital Advertising market growth is increasing in 2018 and now reaches nearly 4.9 billion euros
+17%
* Beginning with the 2017 edition, the E-Pub Observatory now includes (retrospectively) a broader perimeter for shopbots: banking/insurance, telecommunications, energy, etc., in addition to the usual shopping and travel bots** Growth observed on the old perimeter *** New perimetersThe perimeter included the following segments: search engines, display, local searches, referrals, direct e-mail, shopbots and mobile. Calculation of the total online market accounted for channel deduplication.Sources: PwC analysis, SRI and UDECAM statements, CPA, public information
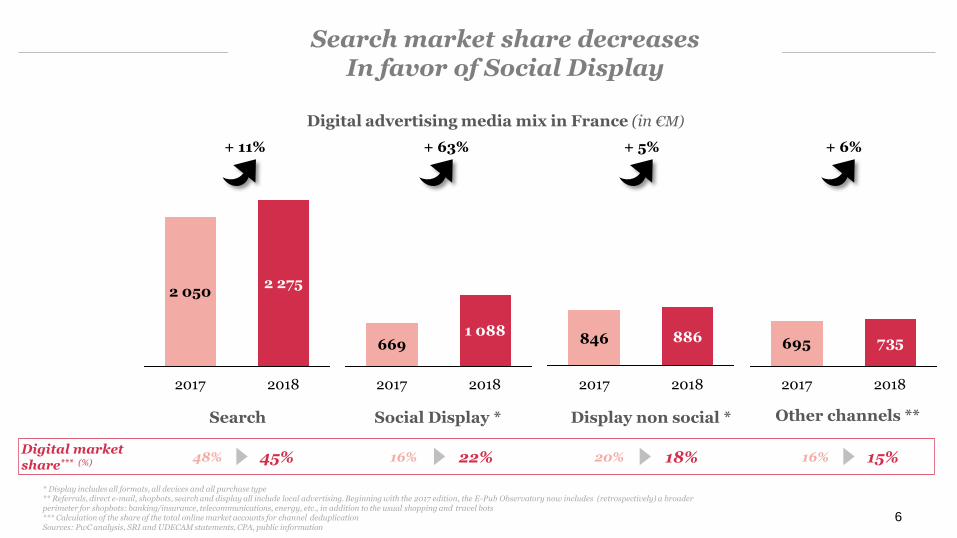
Digital advertising media mix in France (in €M)
Search Social Display * Other channels **
Digital marketshare*** (%) 45% 22% 15%
6
Search market share decreases In favor of Social Display
+ 11% + 63% + 6%
48% 16% 16%
2018
2 275
2017
2 050
2018
1 088
2017
669 735695
2017 20182017 2018
846 886
Display non social *
18%20%
* Display includes all formats, all devices and all purchase type** Referrals, direct e-mail, shopbots, search and display all include local advertising. Beginning with the 2017 edition, the E-Pub Observatory now includes (retrospectively) a broader perimeter for shopbots: banking/insurance, telecommunications, energy, etc., in addition to the usual shopping and travel bots*** Calculation of the share of the total online market accounts for channel deduplicationSources: PwC analysis, SRI and UDECAM statements, CPA, public information
+ 5%
« historical media »
7
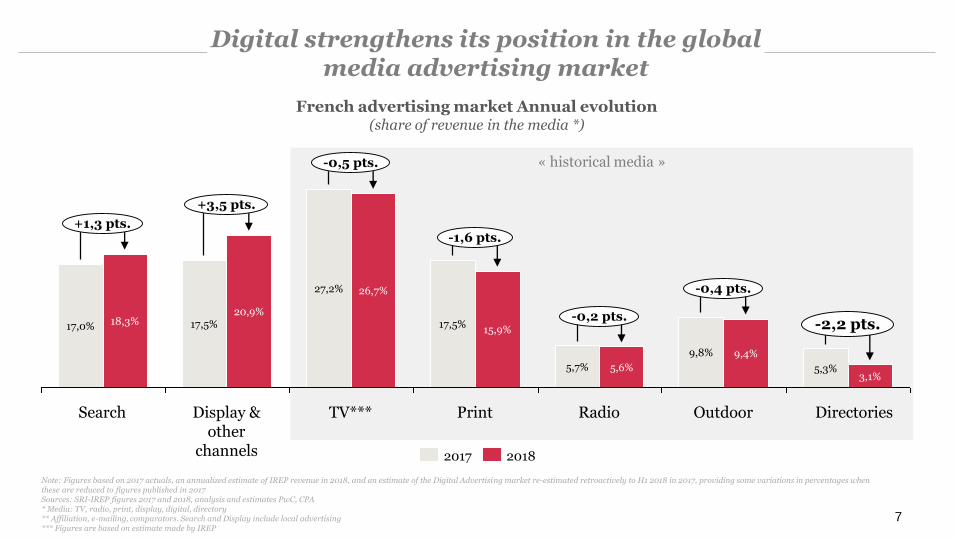
Digital strengthens its position in the global media advertising market
French advertising market Annual evolution(share of revenue in the media *)
Note: Figures based on 2017 actuals, an annualized estimate of IREP revenue in 2018, and an estimate of the Digital Advertising market re-estimated retroactively to H1 2018 in 2017, providing some variations in percentages when these are reduced to figures published in 2017Sources: SRI-IREP figures 2017 and 2018, analysis and estimates PwC, CPA* Media: TV, radio, print, display, digital, directory** Affiliation, e-mailing, comparators. Search and Display include local advertising*** Figures are based on estimate made by IREP
26,7%
+1,3 pts.
-0,5 pts.
TV***
+3,5 pts.
17,5%
27,2%
20,9%
Display & other
channels
5,3%5,7%
9,4%
3,1%5,6%
-0,2 pts.-2,2 pts.
-0,4 pts.
9,8%
-1,6 pts.
17,0% 18,3% 17,5%15,9%
Search Print Radio Outdoor Directories
20182017
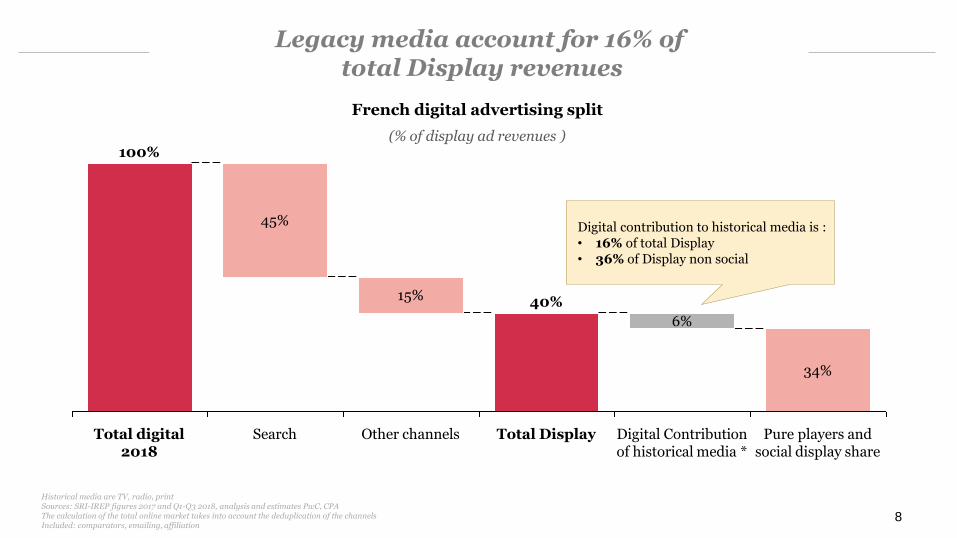
40%
34%
Search Digital Contribution of historical media *
Total Display
6%
Pure players and social display share
Other channels
15%
100%
Total digital 2018
45%
8
Legacy media account for 16% oftotal Display revenues
French digital advertising split
(% of display ad revenues )
Historical media are TV, radio, printSources: SRI-IREP figures 2017 and Q1-Q3 2018, analysis and estimates PwC, CPAThe calculation of the total online market takes into account the deduplication of the channelsIncluded: comparators, emailing, affiliation
Digital contribution to historical media is :• 16% of total Display • 36% of Display non social
9
2
SEARCH GROWTH DRIVEN BY MOBILE,
OTHER CHANNELS KEEP ON INCREASING
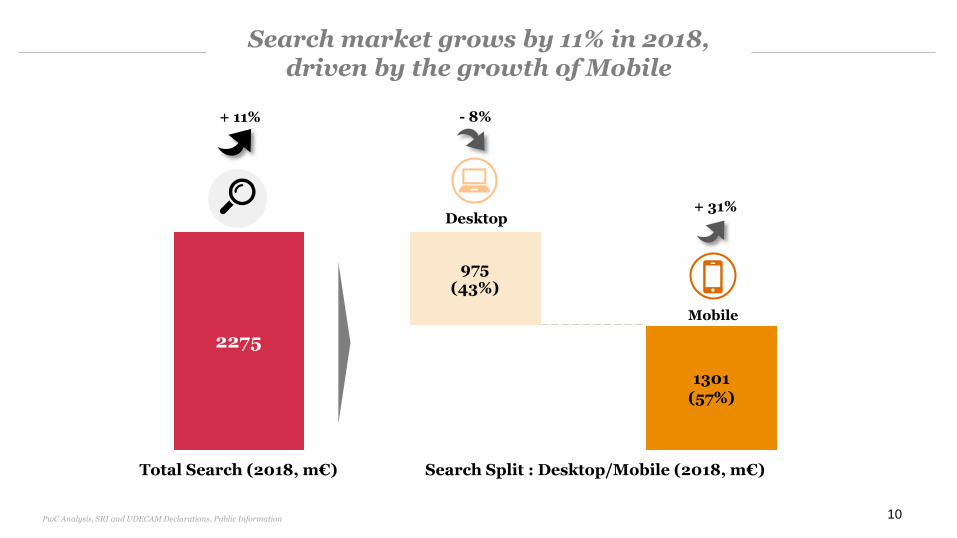
2275
1301(57%)
975(43%)
Total Search (2018, m€)
10
Desktop
Mobile
Search market grows by 11% in 2018, driven by the growth of Mobile
+ 11%
+ 31%
- 8%
Search Split : Desktop/Mobile (2018, m€)
PwC Analysis, SRI and UDECAM Declarations, Public Information
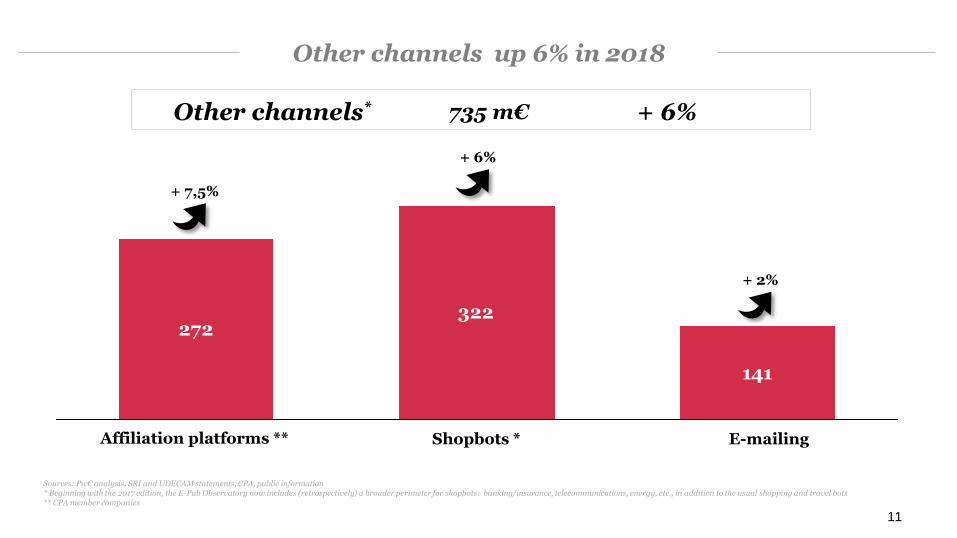
272322
141
Shopbots * E-mailingAffiliation platforms **
11
735 m€ + 6%Other channels*
Other channels up 6% in 2018
Sources: PwC analysis, SRI and UDECAM statements, CPA, public information* Beginning with the 2017 edition, the E-Pub Observatory now includes (retrospectively) a broader perimeter for shopbots: banking/insurance, telecommunications, energy, etc., in addition to the usual shopping and travel bots** CPA member companies
+ 7,5%
+ 6%
+ 2%
12
3
DISPLAY GROWTH STILL DRIVEN BY
SOCIAL NETWORKS
Non socialNative Ads *
13
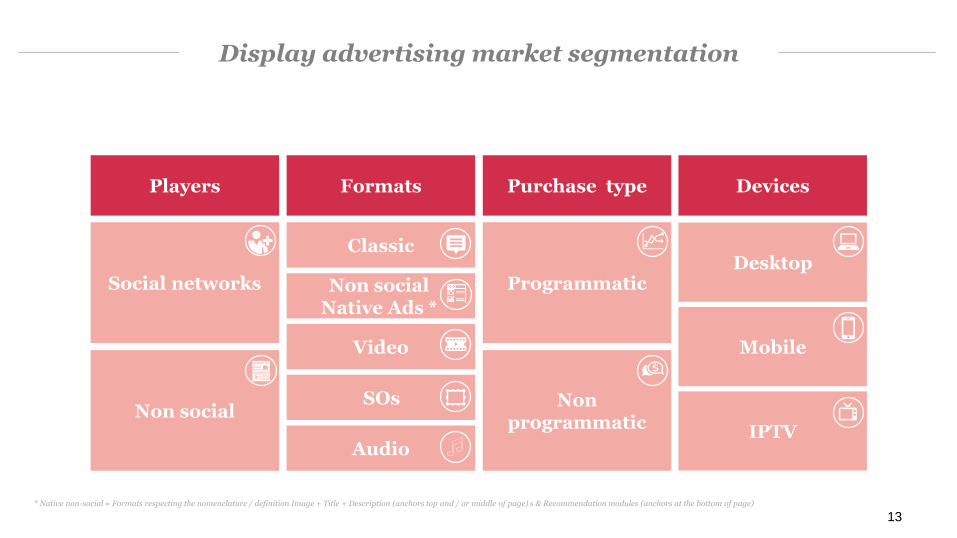
Display advertising market segmentation
Players Formats Purchase type Devices
Social networks
Non social
Video
SOs
Classic
Programmatic
Non programmatic
Desktop
Mobile
IPTV
NEWSLETTER
Audio
* Native non-social = Formats respecting the nomenclature / definition Image + Title + Description (anchors top and / or middle of page) s & Recommendation modules (anchors at the bottom of page)
13
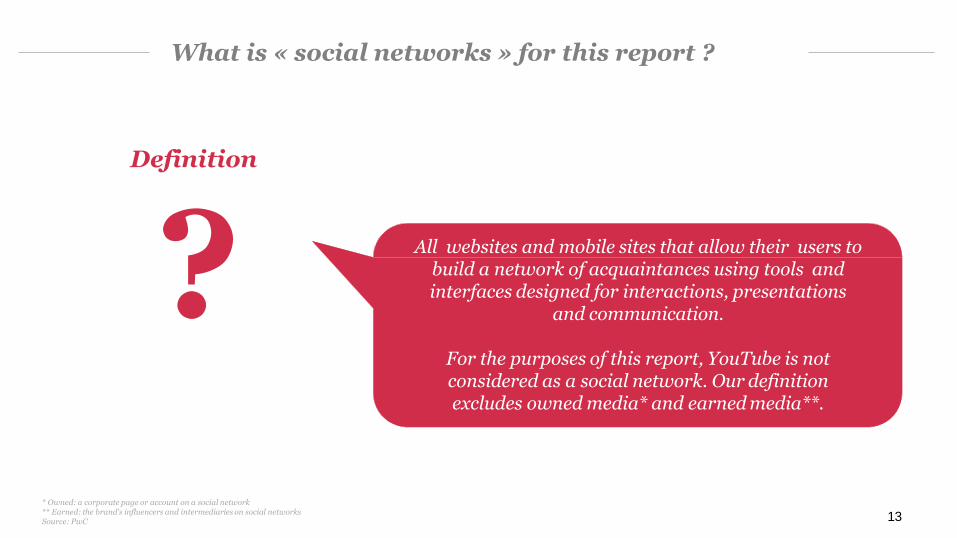
What is « social networks » for this report ?
Definition
All websites and mobile sites that allow their users to build a network of acquaintances using tools and interfaces designed for interactions, presentations
and communication.
For the purposes of this report, YouTube is not considered as a social network. Our definition excludes owned media* and earned media**.
?
* Owned: a corporate page or account on a social network** Earned: the brand's influencers and intermediaries on social networksSource: PwC
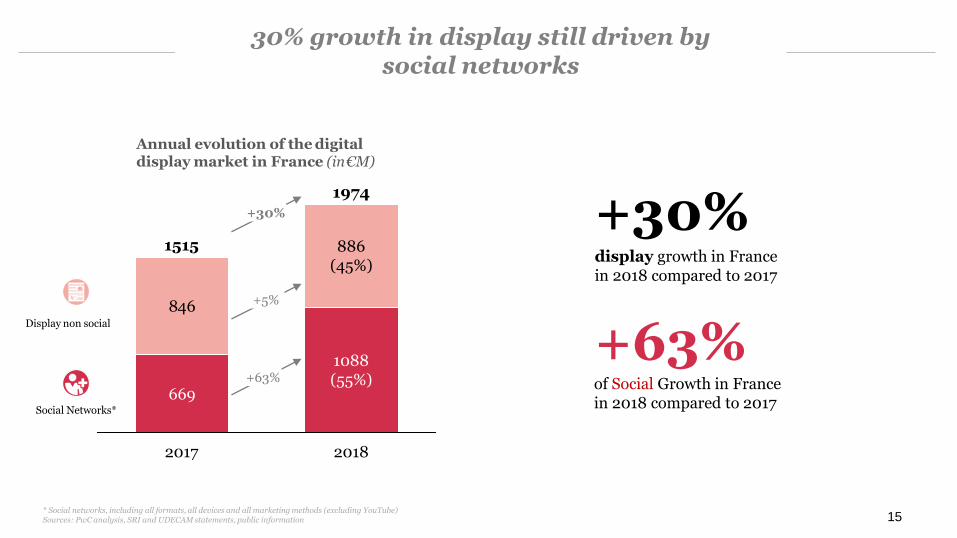
669
846
2018
886(45%)
1088(55%)
1974
1515
2017
15
30% growth in display still driven by social networks
* Social networks, including all formats, all devices and all marketing methods (excluding YouTube)Sources: PwC analysis, SRI and UDECAM statements, public information
Annual evolution of the digitaldisplay market in France (in€M)
+30%display growth in Francein 2018 compared to 2017
Display non social
Social Networks*
NEWSLETTER
+63%of Social Growth in Francein 2018 compared to 2017
+5%
+63%
+30%
16
3A
VIDEO CONTINUES
TO ENHANCE DISPLAY
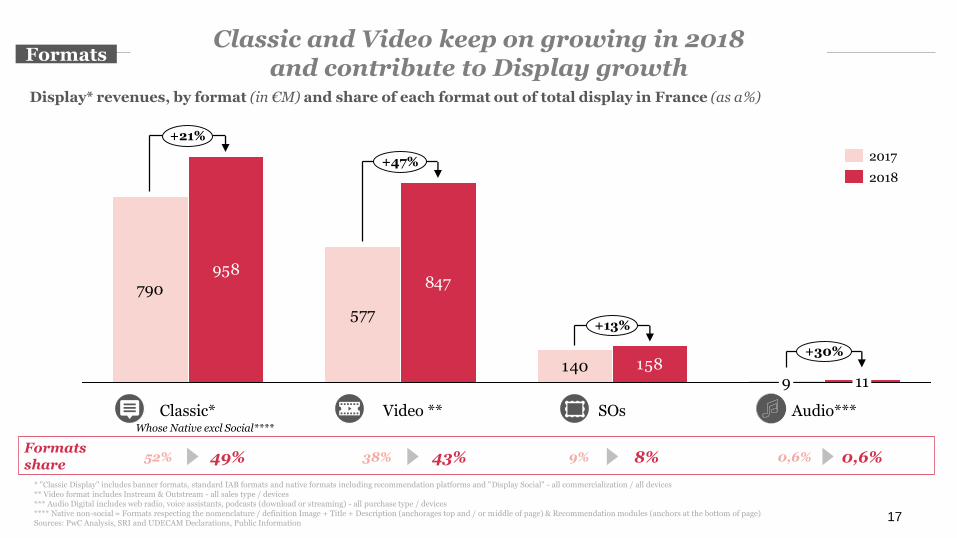
Display* revenues, by format (in €M) and share of each format out of total display in France (as a%)
17
Classic and Video keep on growing in 2018 and contribute to Display growth
* "Classic Display" includes banner formats, standard IAB formats and native formats including recommendation platforms and "Display Social" - all commercialization / all devices** Video format includes Instream & Outstream - all sales type / devices*** Audio Digital includes web radio, voice assistants, podcasts (download or streaming) - all purchase type / devices**** Native non-social = Formats respecting the nomenclature / definition Image + Title + Description (anchorages top and / or middle of page) & Recommendation modules (anchors at the bottom of page)Sources: PwC Analysis, SRI and UDECAM Declarations, Public Information
Formats share
49% 43%52% 38%
Formats
8%9% 0,6%0,6%
790
577
140
958847
158119
+21%
Video **Classic*
+13%
SOs Audio***
+30%
+47%2018
2017
Whose Native excl Social****
235
342
387
460
2018
577
2017
847
18
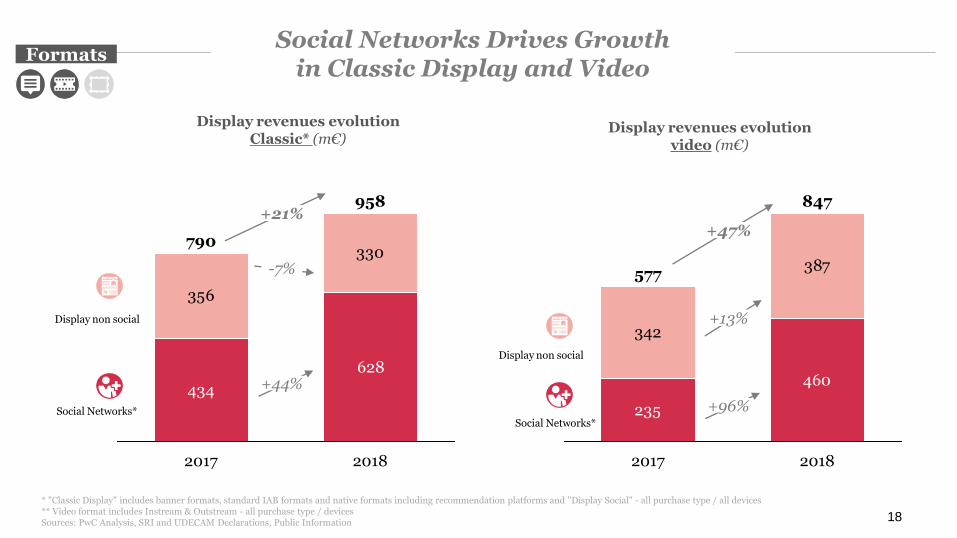
Social Networks Drives Growth in Classic Display and Video
* "Classic Display" includes banner formats, standard IAB formats and native formats including recommendation platforms and "Display Social" - all purchase type / all devices** Video format includes Instream & Outstream - all purchase type / devicesSources: PwC Analysis, SRI and UDECAM Declarations, Public Information
+96%
Display revenues evolutionvideo (m€)
Formats
+47%
+13%
434
628
356
330
2018
958
790
2017
Display revenues evolutionClassic* (m€)
+44%
+21%
-7%NEWSLETTER
NEWSLETTERDisplay non social
Social Networks*Social Networks*
Display non social
140158
342
302
68(8%)
2018
387(44%)
11
262(30%)
2017
886
54
846
9
19
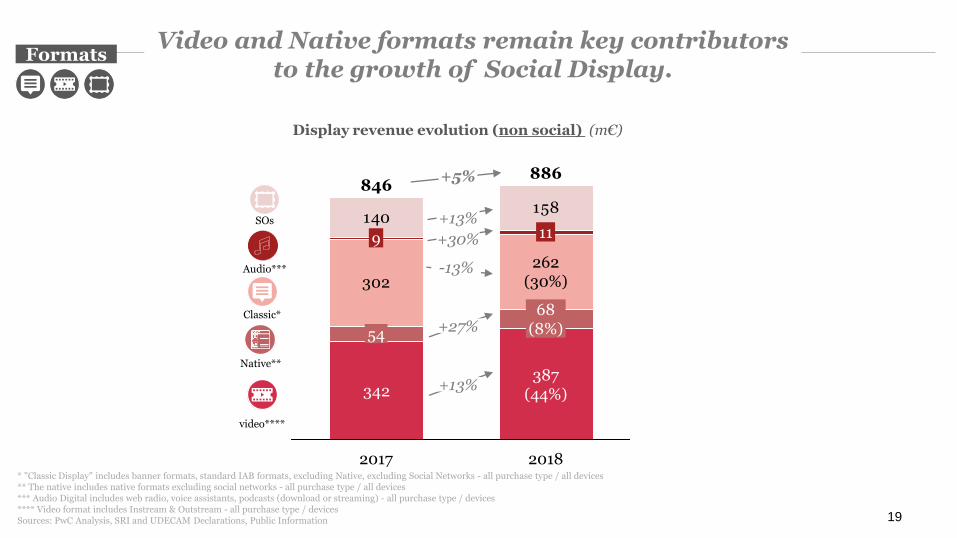
Video and Native formats remain key contributors to the growth of Social Display.
* "Classic Display" includes banner formats, standard IAB formats, excluding Native, excluding Social Networks - all purchase type / all devices** The native includes native formats excluding social networks - all purchase type / all devices*** Audio Digital includes web radio, voice assistants, podcasts (download or streaming) - all purchase type / devices**** Video format includes Instream & Outstream - all purchase type / devicesSources: PwC Analysis, SRI and UDECAM Declarations, Public Information
Display revenue evolution (non social) (m€)
Formats
Classic*
video****
+5%
-13%
+13%
Audio***
+27%
Native**
+13%
+30%
SOs
235
447(87%)
51669
(13%)
20182017
29358
293
283
331(39%)577
2017 2018
847
516(61%)
20
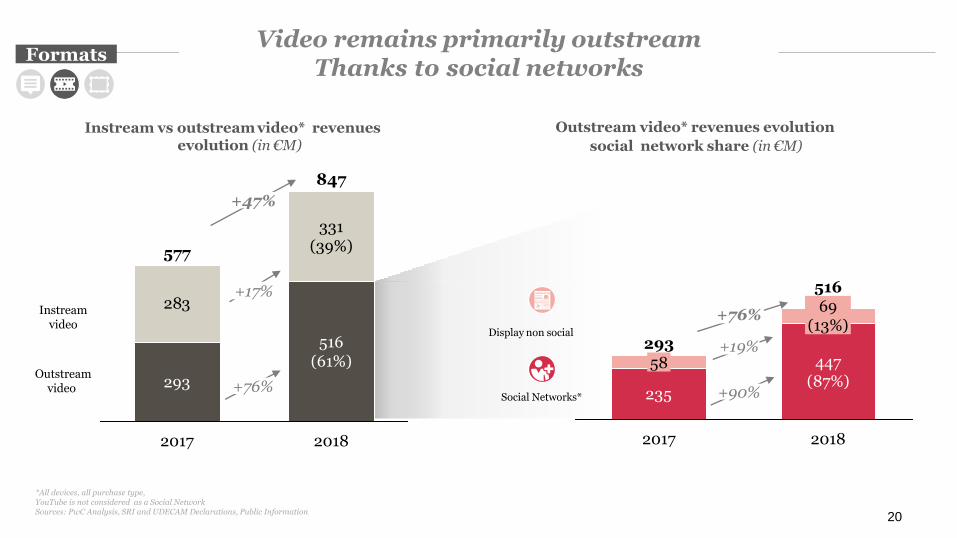
Video remains primarily outstreamThanks to social networks
*All devices, all purchase type,YouTube is not considered as a Social NetworkSources: PwC Analysis, SRI and UDECAM Declarations, Public Information
Instreamvideo
Instream vs outstream video* revenues evolution (in €M)
+76%
+17%
Outstream video* revenues evolution
social network share (in €M)
+90%
+19%
Outstreamvideo
+47%
+76%
Formats
NEWSLETTER
Display non social
Social Networks*
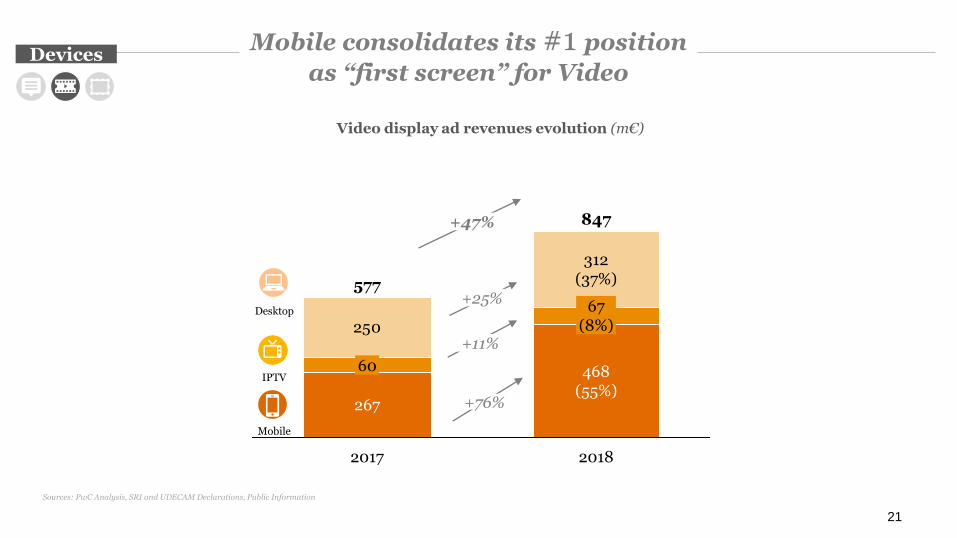
267
250
2018
847
468(55%)
312(37%)
60
67(8%)
577
2017
21
+76%
Desktop
Mobile
+11%
IPTV
Video display ad revenues evolution (m€)
Mobile consolidates its #1 position
as “first screen” for VideoDevices
Sources: PwC Analysis, SRI and UDECAM Declarations, Public Information
+25%
+47%
22
3B
PROGRAMMATIC KEEPS ON GROWING
… AGAIN AND AGAIN
23
What is « Programmatic » for this report ?
Definition
? Inventory sold by automatically connecting buyers and sellers. It includes all automated sales models: guaranteed or not, fixed price or RTB, private marketplaces or open auctions, self-serve
platforms or trading desks.
Social network sales are also considered programmatic sales.
Sources : PwC
24
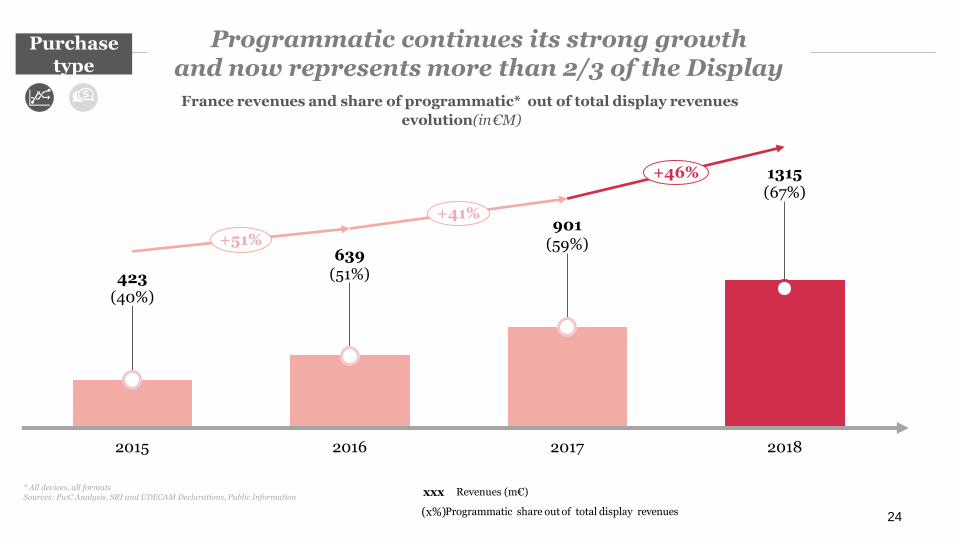
Programmatic continues its strong growth and now represents more than 2/3 of the Display
France revenues and share of programmatic* out of total display revenues
evolution(in€M)
* All devices, all formatsSources: PwC Analysis, SRI and UDECAM Declarations, Public Information
Purchasetype
423(40%)
+41%
+51%
2018
1315(67%)
2015 2017
901(59%)
2016
639(51%)
+46%
(x%)Programmatic share out of total display revenues
xxx Revenues (m€)
25
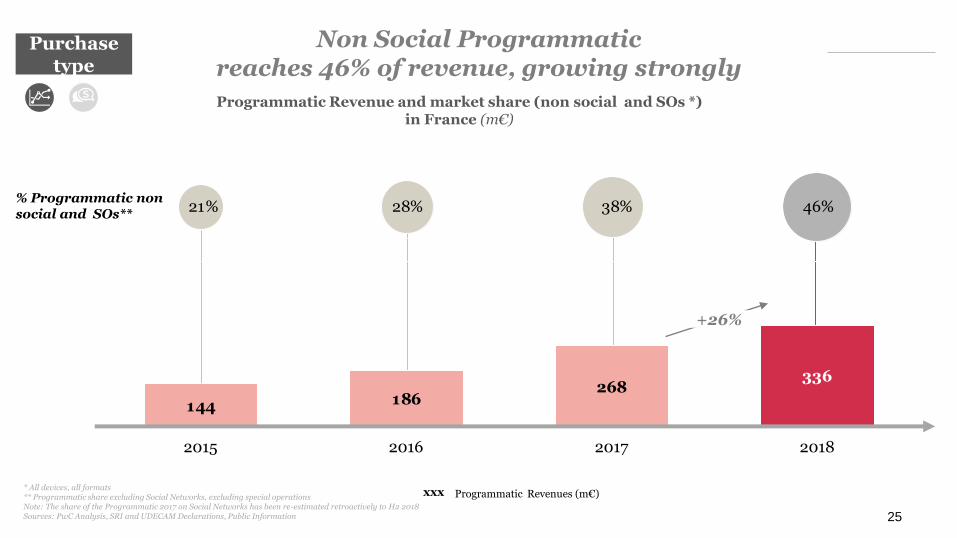
Non Social Programmaticreaches 46% of revenue, growing strongly
Programmatic Revenue and market share (non social and SOs *)in France (m€)
* All devices, all formats** Programmatic share excluding Social Networks, excluding special operationsNote: The share of the Programmatic 2017 on Social Networks has been re-estimated retroactively to H2 2018Sources: PwC Analysis, SRI and UDECAM Declarations, Public Information
xxx Programmatic Revenues (m€)
144 186268
336
2015 20182016 2017
46%38%28%21%% Programmatic non social and SOs**
+26%
Purchasetype
268
438
729
392(54%)
706
336(46%)
20182017
26
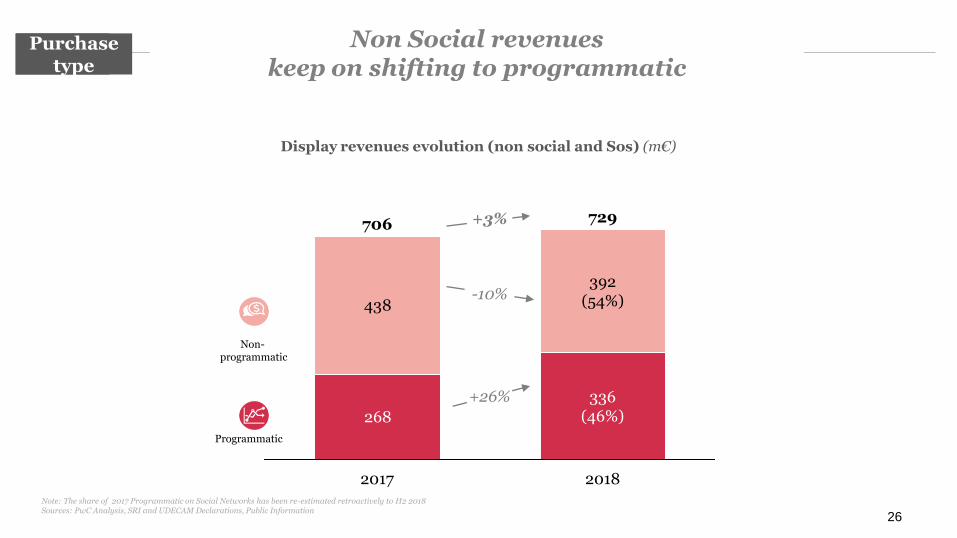
Non Social revenueskeep on shifting to programmatic
Note: The share of 2017 Programmatic on Social Networks has been re-estimated retroactively to H2 2018Sources: PwC Analysis, SRI and UDECAM Declarations, Public Information
Display revenues evolution (non social and Sos) (m€)
+26%
-10%
+3%
Non-programmatic
Programmatic
Mode d’achatPurchase
type
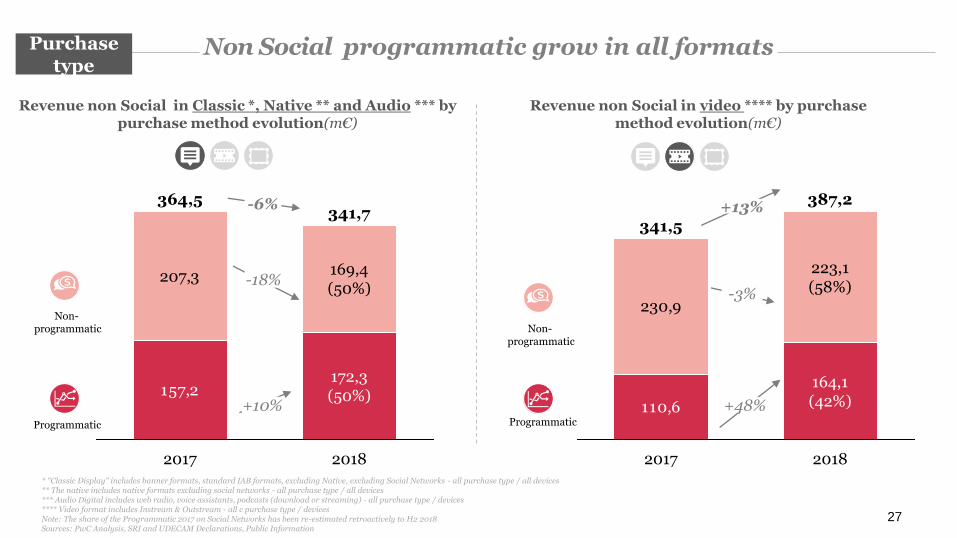
110,6
230,9
164,1(42%)
2017
341,5
387,2
2018
223,1(58%)
157,2
207,3
2018
172,3(50%)
364,5
2017
169,4(50%)
341,7
27
Non Social programmatic grow in all formats
* "Classic Display" includes banner formats, standard IAB formats, excluding Native, excluding Social Networks - all purchase type / all devices** The native includes native formats excluding social networks - all purchase type / all devices*** Audio Digital includes web radio, voice assistants, podcasts (download or streaming) - all purchase type / devices**** Video format includes Instream & Outstream - all c purchase type / devicesNote: The share of the Programmatic 2017 on Social Networks has been re-estimated retroactively to H2 2018Sources: PwC Analysis, SRI and UDECAM Declarations, Public Information
-3%
+48%
Revenue non Social in Classic *, Native ** and Audio *** by purchase method evolution(m€)
+10%
-18%
Revenue non Social in video **** by purchase method evolution(m€)
-6% +13%
Purchasetype
Non-programmatic Non-
programmatic
Programmatic Programmatic
28
4
MOBILE REVENUES FINALLY ALIGNS
WITH CONSUMERS USES
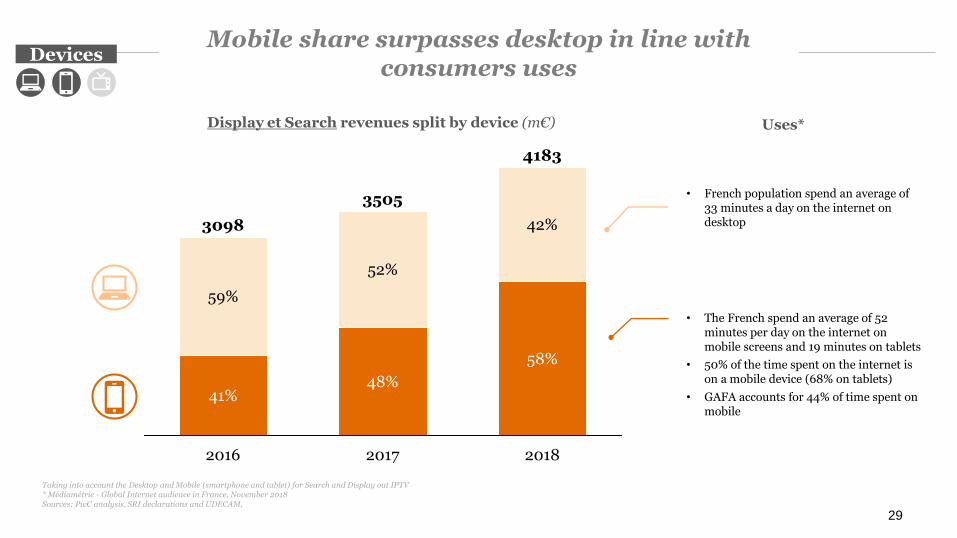
Display et Search revenues split by device (m€)
Taking into account the Desktop and Mobile (smartphone and tablet) for Search and Display out IPTV* Médiamétrie - Global Internet audience in France, November 2018Sources: PwC analysis, SRI declarations and UDECAM,
29
Mobile share surpasses desktop in line with consumers uses
• The French spend an average of 52 minutes per day on the internet on mobile screens and 19 minutes on tablets
• 50% of the time spent on the internet is on a mobile device (68% on tablets)
• GAFA accounts for 44% of time spent on mobile
• French population spend an average of 33 minutes a day on the internet on desktop
Uses*
Devices
59%
41%
3098
4183
42%
58%
2016 2017 2018
52%
48%
3505
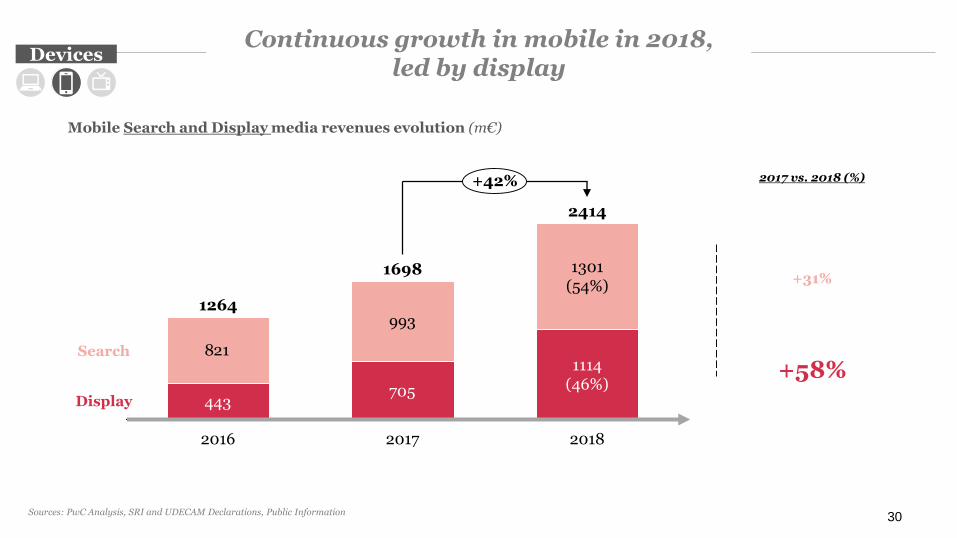
443705
821
993
+42%
1698
1264
2414
1114(46%)
1301(54%)
20182016 2017
Mobile Search and Display media revenues evolution (m€)
30
2017 vs. 2018 (%)
+58%
+31%
Continuous growth in mobile in 2018, led by display
Devices
Display
Search
Sources: PwC Analysis, SRI and UDECAM Declarations, Public Information
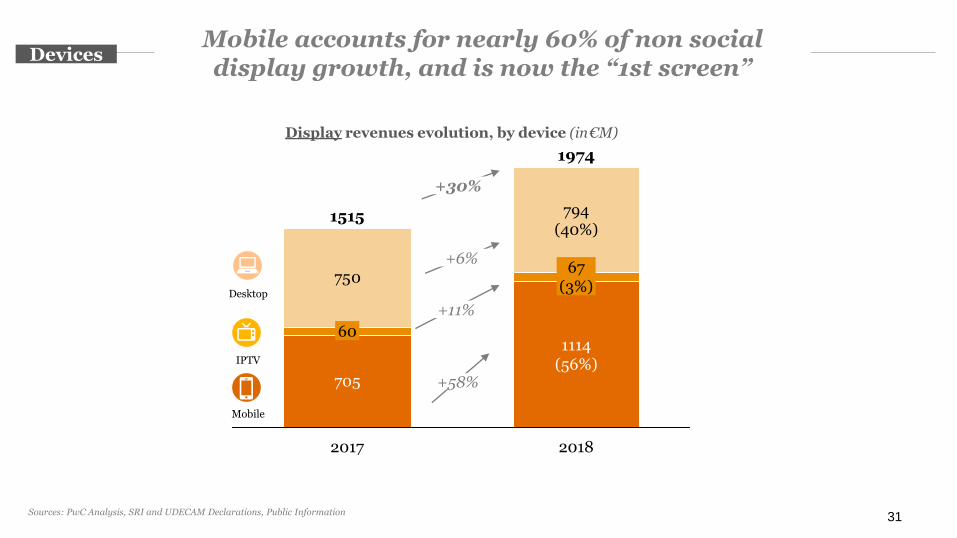
705
750
2017 2018
1515
1974
794(40%)
67(3%)
1114(56%)
60
31
Mobile accounts for nearly 60% of non social display growth, and is now the “1st screen”
+58%
+6%
Desktop
Mobile
+11%
IPTV
+30%
Devices
Display revenues evolution, by device (in€M)
Sources: PwC Analysis, SRI and UDECAM Declarations, Public Information
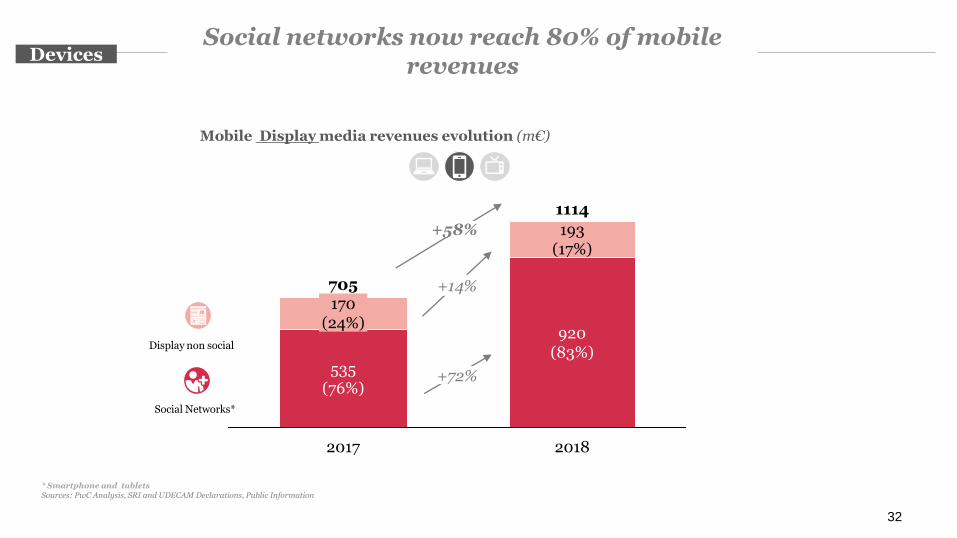
1114
193(17%)
2018
920(83%)
535(76%)
170(24%)
2017
705
32
Social networks now reach 80% of mobilerevenues
* Smartphone and tabletsSources: PwC Analysis, SRI and UDECAM Declarations, Public Information
+14%
+72%
Mobile Display media revenues evolution (m€)
NEWSLETTER
+58%
Devices
Display non social
Social Networks*
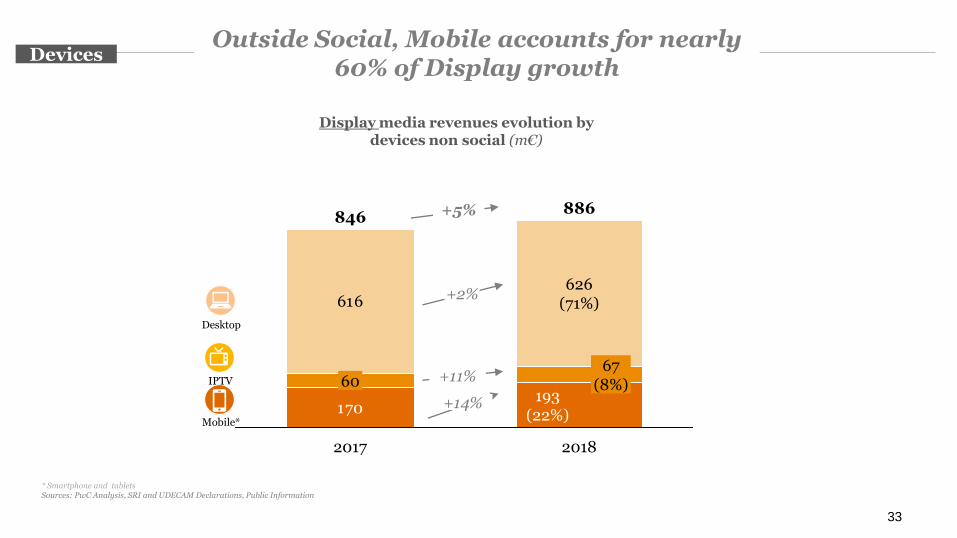
170
616
846
626(71%)
2017 2018
193(22%)
886
67(8%)60
33
Outside Social, Mobile accounts for nearly 60% of Display growth
Display media revenues evolution by devices non social (m€)
+14%
+2%
Desktop
Mobile*
+5%
Devices
+11%IPTV
* Smartphone and tabletsSources: PwC Analysis, SRI and UDECAM Declarations, Public Information
34
5
KEY FACTS
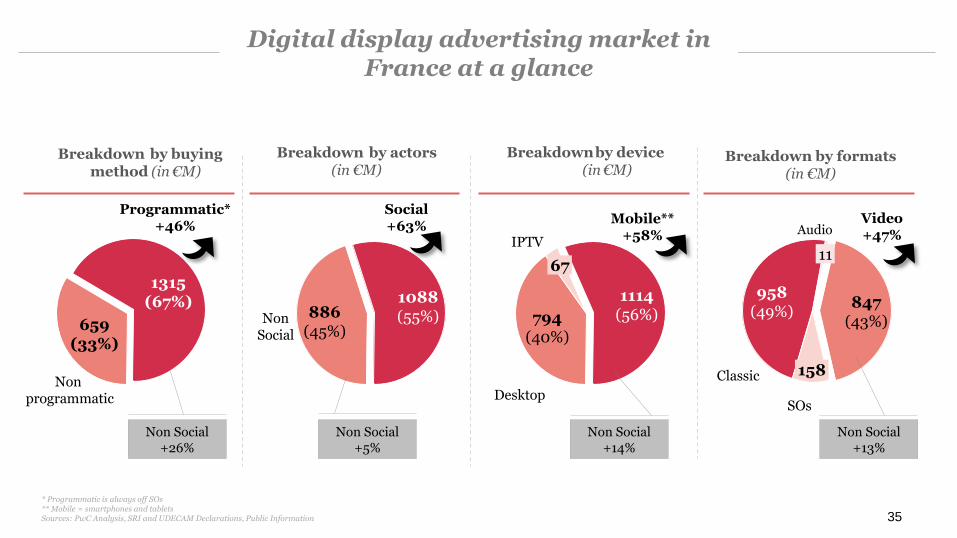
1114(56%)
67
794(40%)
886(45%)
1088(55%)
847(43%)
958(49%)
11
158
1315(67%)
659(33%)
Breakdown by formats (in €M)
Breakdown by actors(in €M)
35
Digital display advertising market inFrance at a glance
Programmatic* +46%
Video+47%
Mobile**+58%
Social+63%
* Programmatic is always off SOs** Mobile = smartphones and tabletsSources: PwC Analysis, SRI and UDECAM Declarations, Public Information
Desktop
IPTV
SOs
Non programmatic
Classic
Audio
NonSocial
Non Social+26%
Non Social+5%
Non Social+14%
Non Social+13%
Breakdownby device (in€M)
Breakdown by buying method (in€M)
36
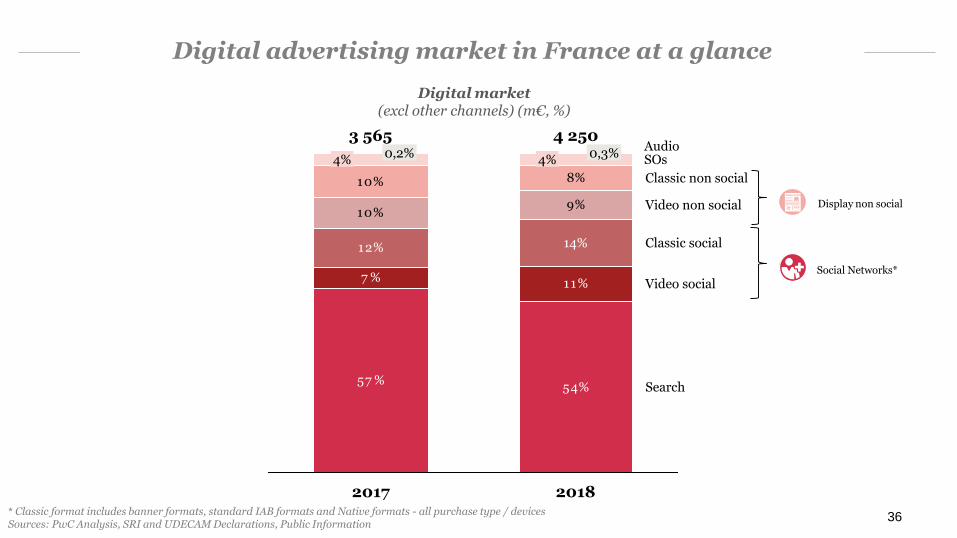
Digital advertising market in France at a glance
* Classic format includes banner formats, standard IAB formats and Native formats - all purchase type / devicesSources: PwC Analysis, SRI and UDECAM Declarations, Public Information
57 %54%
7 % 11%
12%
10%9%
10% 8%
Video social
Search
2018
Classic social
2017
4%0,2%
4%0,3%
3 565
14%
Classic non social
4 250
Video non social
Digital market(excl other channels) (m€, %)
NEWSLETTER
SOsAudio
Display non social
Social Networks*
37
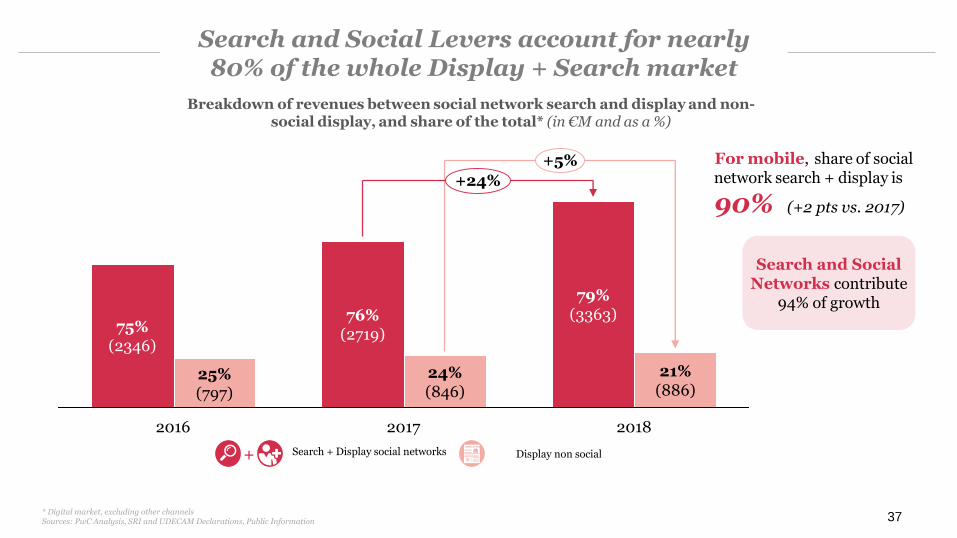
Search and Social Levers account for nearly 80% of the whole Display + Search market
Breakdown of revenues between social network search and display and non-social display, and share of the total* (in €M and as a %)
* Digital market, excluding other channelsSources: PwC Analysis, SRI and UDECAM Declarations, Public Information
Search + Display social networks Display non social +NEWSLETTER
For mobile, share of social network search + display is
90% (+2 pts vs. 2017)
21%(886)
79%(3363)
2018
25%(797)
20172016
75%(2346)
24%(846)
76%(2719)
+5%
+24%
Search and Social Networks contribute
94% of growth
38
#10YEARSCHALLENGE
###
1. GDPR Implementation had structuring impacts for the market: #DBMgate, CMP implementation by publishers, integration of IAB Transparency & Consent Framework of #GDPR
2. Social, video and mobile growth are now permanently established. For non-social actors, native and audio formats offer promising revenues, especially in programmatic growth. #Growth
3. Programmatic continues to grow, on all types of actors, and naturally follows the US & UK trends (+ 80% of display) #Programmatic
4. Quality Data is the key issue. Demand for data is always stronger and at the same time, the expectations in terms of targeting guarantees and impact on targets are growing. The challenge will be to give esay access to campaign performance reporting: more transparency, for more confidence. #Data
5. Will the advertisers' requirements for higher quality and the market initiatives that meet them succeed in shifting trends and rebalancing #FairShare ?
39
2018 : a transition year for digital advertisingin France
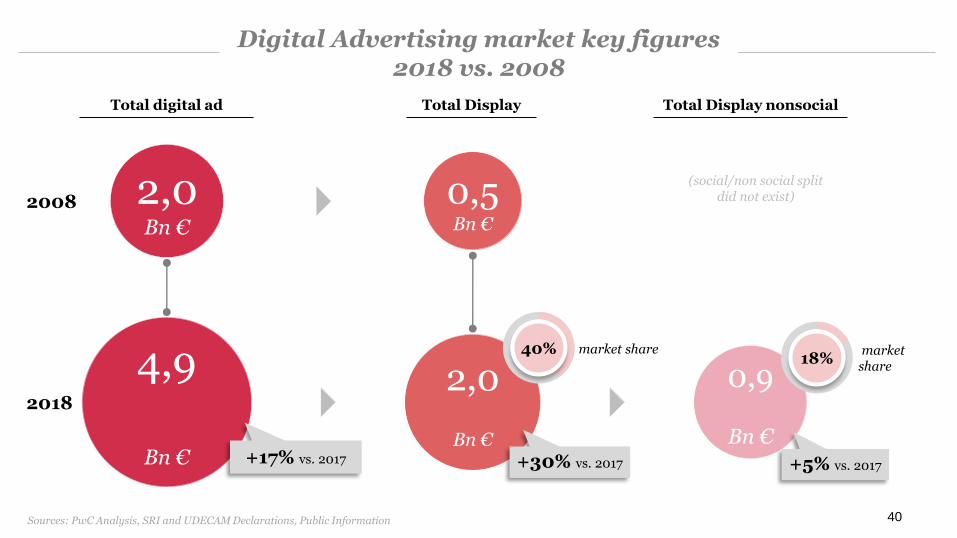
Total Display Total Display nonsocial
40
Digital Advertising market key figures2018 vs. 2008
Total digital ad
market share
2008
2018
2,0Bn €
4,9
Bn €
2,0
Bn €+17% vs. 2017
0,5Bn €
40%
0,9
Bn €
18%marketshare
(social/non social split did not exist)
+30% vs. 2017 +5% vs. 2017
Sources: PwC Analysis, SRI and UDECAM Declarations, Public Information
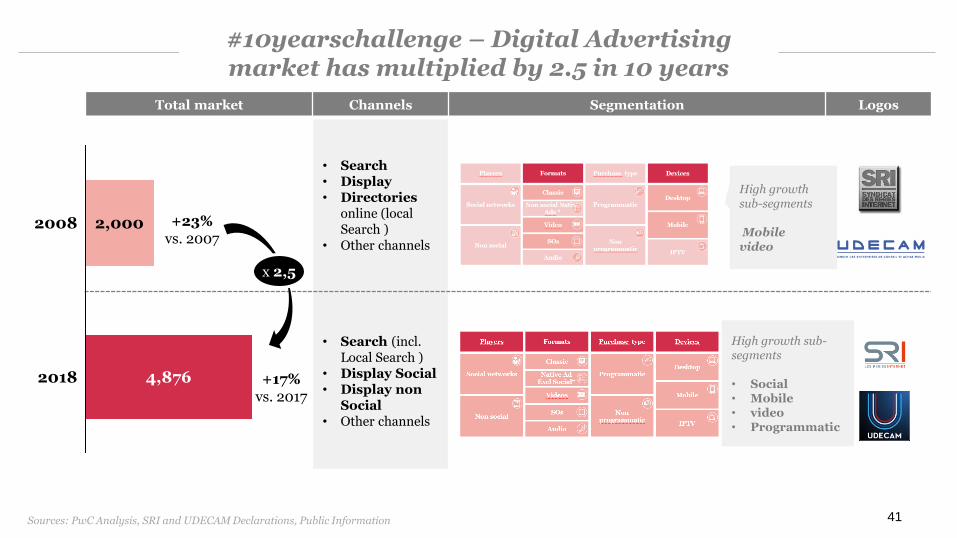
Total market Channels Segmentation Logos
• Search• Display• Directories
online (local Search )
• Other channels
• Search (incl. Local Search )
• Display Social• Display non
Social• Other channels
4,8762018
2008 2,000 +23% vs. 2007
41
#10yearschallenge – Digital Advertising market has multiplied by 2.5 in 10 years
+17% vs. 2017
x 2,5
High growthsub-segments
Mobilevideo
High growth sub-segments
• Social• Mobile• video• Programmatic
Sources: PwC Analysis, SRI and UDECAM Declarations, Public Information
42
DIGITAL AD-TRUST LABEL
UPDATE
43
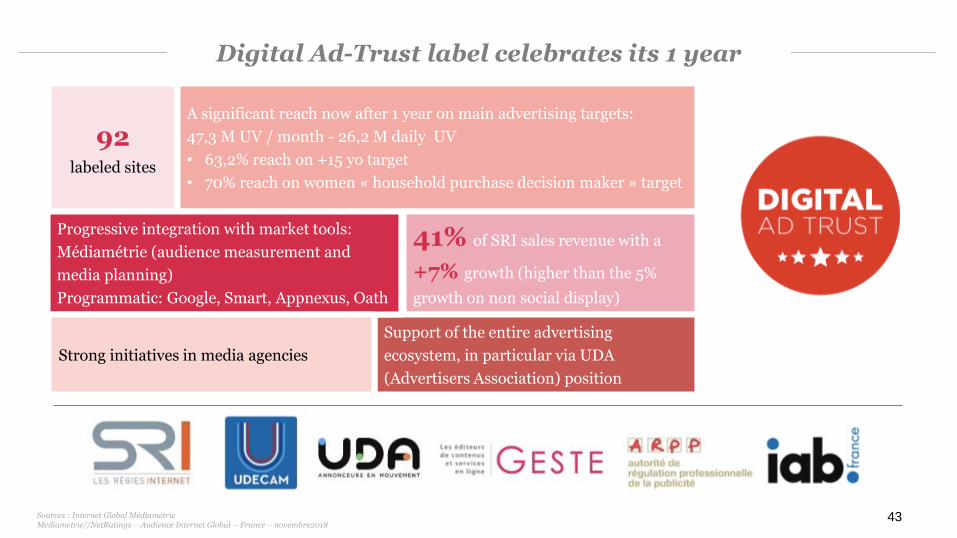
Digital Ad-Trust label celebrates its 1 year
Sources : Internet Global Médiamétrie Mediametrie//NetRatings – Audience Internet Global – France – novembre2018
92labeled sites
A significant reach now after 1 year on main advertising targets:
47,3 M UV / month - 26,2 M daily UV
• 63,2% reach on +15 yo target
• 70% reach on women « household purchase decision maker » target
41% of SRI sales revenue with a
+7% growth (higher than the 5%
growth on non social display)
Support of the entire advertising
ecosystem, in particular via UDA
(Advertisers Association) position
Progressive integration with market tools:
Médiamétrie (audience measurement and
media planning)
Programmatic: Google, Smart, Appnexus, Oath
Strong initiatives in media agencies
Contacts
Matthieu AubussonPartner, [email protected]
Sébastien Leroyer Directo, Experience Center [email protected]
Françoise ChambreExecutive [email protected]
Hélène ChartierManaging [email protected]
Myriam WaquetCommunication & [email protected]
44