Embed Size (px)
Citation preview
Member FINRA | SIPC
Aviation Investment BankingQ1 2018 Update

1
Aviation Investment Banking
Includes projects by our professionals at prior firms.
James S. [email protected]
Representative Assignments:
¡ Sale: Gulfstream International Airlines
¡ Sale: Tradewinds Power Corp
Scott E. [email protected] 305-438-7702
Representative Assignments:
¡ Valuation: Flightstar Aircraft Services¡ Valuation: Global Engine
Maintenance¡ Solvency: Amerijet International¡ Valuation: Avborne Heavy
Maintenance
Joseph “Joey” SmithDirectorAviation [email protected] 305-438-7706
Representative Assignments:
¡ Capital Raise: Avenger Flight Group¡ Capital Raise: Diversified Aero
Services¡ Capital Raise: Alaris Aerospace
Systems
OUR TEAM
Ranjini ChandirakanthanManaging Director
Marcus WaiVice President
Chris MansuetoVice President
Phillip CasselDirector
Laura SalpeterVice President
Ira LeidermanManaging Director
Julian AstroveAnalyst

2
Aviation Investment Banking
I
II
III
AEROSPACE & DEFENSE REVIEW
M&A & PRIVATE PLACEMENT TRANSACTIONS
PUBLIC MARKETS OVERVIEW

3
Aviation Investment BankingAEROSPACE & DEFENSE – 2017 & 1Q 2018 REVIEW
A Rear View Look at 2017¡ 2017 was a record year with global aerospace and defense deal
value exceeding $70 billion.
¡ Competition throughout the aviation ecosystem has put pressure onprofit margins, resulting in great demand for strategic growthopportunities, industry consolidation, supply chain synergies, andpartnering opportunities.
¡ The volume of activity and the premium valuations confirm that theseller’s market continues. These features combined with thehistorical low cost of capital have produced some of the largestacquisitions in industry history.
¡ There were 454 total deals transacted (flat), with the average dealsize at $411 million, ~19% higher than the preceding year.
¡ A few “megadeal” transactions accounted for the majority of thetotal deal value, highlighted by United Technologies’ $30 billionacquisition of Rockwell Collins representing an EV/Revenue multipleof 5.0x and an EV/EBITDA multiple of ~22x. Other notabletransactions included:
¡ Northrop Grumman’s $9.4 billion acquisition of Orbital ATK¡ Safran’s $8 billion acquisition of Zodiac Aerospace¡ Thales’ $5 billion acquisition of Gemalto
¡ The year ended with a sonic boom, as Airbus SE agreed to acquire amajority stake in Bombardier’s (Canada) C Series program, whichprompted Boeing to accelerate conversations with Embraer SA(Brazil) for their E-Jet Family. These pairings, with their smallerregional rivals, provides a generational opportunity to add to their$100 billion global commercial plane duopoly, while positioningthemselves for the upcoming strategic threat from China and India.
2018 and the Runway Ahead¡ Tax reform will provide increased liquidity which, combined with
continued strong growth in aviation, and a return to growth indefense, should result in another strong year of M&A in 2018.
¡ The commercial aviation sector remains strong in terms of new-jetorders and growing airline utilization of equipment, which shouldlead to more used-parts sales, affording numerous opportunities toconsolidate.
¡ As OEM production increases for the aircraft delivery, managing theparts supply chain becomes a more vital component for suppliersfocused on the efficient real-time delivery of products, whilemaintaining incremental margin growth for on-time aircraftdelivery.
¡ The defense and government sector seems primed for continuedgrowth and opportunities. The growing geopolitical tension, and thecall for increased defense budgets, has created tremendouseuphoria within the core military contractor sector, including:missile defense, space, AI, robotics, and cybersecurity.
¡ Aircraft and Parts, including the MRO category, maintains thelargest share of the middle-market deal value, as OEM and after-market part suppliers seek to protect profit margins, and corecapabilities, from increasing competition and consolidation.
¡ 2018 is off to a quick start with its first “megadeal”, i.e. GeneralDynamics’ $9.7 billion acquisition of CSRA Inc. representing anEV/Revenue multiple of ~2.0x and an EV/EBITDA multiple of ~12x.CSRA is now part of General Dynamics’ massive InformationTechnology solutions group.

4
Aviation Investment Banking
I
II
III
AEROSPACE & DEFENSE REVIEW
M&A & PRIVATE PLACEMENT TRANSACTIONS
PUBLIC MARKETS OVERVIEW

5
Aviation Investment BankingM&A REVIEW
Selected Transactions Review($ in millions)
Transaction Metrics Valuation BenchmarksDate Enterprise Target TTM Implied EV / Stock Price Premiums
Annc. Closed Target Acquirer Value Revenue EBITDA % Revenue EBITDA 1-Day 1-Month
2018 1st Quarter M&A Transactions19-Jan-17 2-Mar-18 Zodiac Aerospace Safran SA 9,579.2$ 5,773.4$ 4.7% 1.52x 24.69x 7.3% 11.4%27-Oct-17 22-Jan-18 Asian Compressor Technology Serv. MB Aerospace Newton Abbot Limited 60.0 na na na na na na21-Dec-17 1-Feb-18 Themis Computer, Inc. Mercury Systems, Inc. 180.0 na na na na na na3-Jan-18 na Magnetic MRO AS Guangzhou Hangxin Aviation Tech. Co. 52.7 na na na na na na12-Jan-18 na GKN plc Melrose Industries PLC 12,336.9 13,430.1 9.8% 0.91x 9.29x 38.5% 54.4%31-Jan-18 2-Apr-18 ECS Federal, Inc. ASGN Incorporated 775.0 13,071.6 9.8% na na na na1-Feb-18 1-Feb-18 FMH Aerospace Corp. AMETEK, Inc. 235.0 50.0 na 4.70x na na na8-Feb-18 na Aitech Defense Systems, Inc. First Israel Mezzanine Investors Ltd. 30.0 na na na na na na12-Feb-18 2-Apr-18 CSRA Inc. General Dynamics Corporation 9,871.1 5,064.0 16.6% 1.95x 11.73x 33.8% 28.6%23-Feb-18 na SGT, Inc. KBRwyle Technology Solutions, LLC 355.0 5,064.0 16.6% na na na na27-Feb-18 na Beaver Aerospace & Defense, Inc. Héroux-Devtek Inc. 23.5 30.0 na 0.78x na na na11-Mar-18 na IMI Systems Ltd. Elbit Systems Ltd. 536.2 na na na na na na19-Mar-18 na Extant Components Group TransDigm Group Incorporated 525.0 na na na na na na22-Mar-18 11-Apr-18 Universal Avionics Systems Corp Elbit Systems Ltd. 120.0 na na na na na na29-Mar-18 na Strategic Engineering Div. Tata Power Tata Advanced Systems Limited 335.2 81.8 na 4.19x na na na
Mean 2,334.3$ 5,320.6$ 11.5% 2.34x 15.24x 26.5% 31.5%Median 335.2$ 5,064.0$ 9.8% 1.73x 11.73x 33.8% 28.6%
Sources of information: S&P Capital IQ.

6
Aviation Investment BankingPRIVATE PLACEMENT REVIEWSelected Transactions Review
($ in millions)
Round RoundDate Target Investors Raise Type Number
2018 1st Quarter Private Placements
9-Jan-18 Autonomous Control Systems Laboratory Ltd.iGlobe Partners; Mizuho Capital Co. Ltd.; SPARX Group Co., Ltd; The University of Tokyo Edge Capital Co., Ltd.; iGlobe Partners Platinum Fund; Mirai Creation Fund; Mizuho Seicho Shien Fund 2; DroneFund
18.7$ Venture 2
9-Jan-18 SkySpecs, LLC Venture Investors, LLC; Capital Midwest Fund; Huron River Venture Partners; Statkraft Ventures GmbH; UL Ventures 8.8 Series B 7
16-Jan-18 Beijing OneSpace Technology Co., Ltd.Shenzhen Zhengxuan Investment Co., Ltd.; Shenzhen Qianhai Wutong Buyout Investment Fund Management Co., Ltd.; Tongkong Investment Group; China Merchants Capital Investment Co., Ltd.; Shenzhen Qianhai Hongtai Equity Investment Fund Management Co., Ltd
31.0 Series A 1
17-Jan-18 Elistair SAS Starquest Capital SAS 2.4 Venture 1
18-Jan-18 Iris Automation Inc. ASGN Incorporated 8.0 Series A 3
22-Jan-18 Airobotics Ltd. CRV; BlueRun Ventures; Microsoft Ventures; OurCrowd Ltd. 42.5 Series C 2
24-Jan-18 China North Communication Technology Co.,LtdData Collective; Signia Venture Partners; New Ground Ventures, LP; Manifest Growth Fund I, L.P.; Boeing HorizonX; Manifest Investment Partners, LLC.; Mubadala Investment Company
12.9 Venture 1
1-Feb-18 Joby Aviation, LLCEDB Investments Pte. Ltd.; Intel Capital; Allen & Company Inc., Investment Arm; Capricorn Investment Group LLC; AME Cloud Ventures; Eight Partners; JetBlue Technology Ventures; Toyota AI Ventures,LLC
100.0 Series B 2
7-Feb-18 Commsat Technology Development Co Ltd Lightspeed Venture Partners 16.0 Series A 1
21-Feb-18 Temp-Avia Anpp Pao Tactical Missiles Corporation JSC 3.5 Growth 1
27-Feb-18 Citadel Defense Company Inc. Lightspeed Venture Partners 12.0 Series A 3
1-Mar-18 Astranis Space Technologies Corp. Y Combinator Management LLC; Andreessen Horowitz LLC; Indicator Fund; Fifty Years; Refactor Capital, LLC 13.5 Series A 2
13-Mar-18 Spaceflight Industries, Inc. Mitsui & Co. Global Investment Ltd.; Telespazio Spa; Thales Alenia Space France SAS; The Space Alliance 150.7 Series C 2
15-Mar-18 Fortem Technologies, Inc.Data Collective; Signia Venture Partners; New Ground Ventures, LP; Manifest Growth Fund I, L.P.; Boeing HorizonX; Manifest Investment Partners, LLC.; Mubadala Investment Company
15.0 Series A 2
20-Mar-18 Blackmore Sensors and Analytics Inc. Millennium Technology Value Partners; BMW i Ventures; Next Frontier Capital; Toyota AI Ventures,LLC 18.0 Series B 2
27-Mar-18 AeroEdge Co., Ltd Toyota Tsusho Corporation 20.8 Venture 1
27-Mar-18 Soltworks Co., Ltd. T.S. Investment Corporation; IBK T.S. Exit PEF 7.5 PIPE 3
27-Mar-18 Relativity Space, Inc. Y Combinator Management LLC; Social Capital; Mark Cuban Companies; Playground Global, LLC 35.0 Series B 3
28-Mar-18 CybAero AB European High Growth Opportunities Securitization Fund; Blue Ocean Advisors Inc. 6.3 PIPE 4
29-Mar-18 World View Enterprises, Inc. Accel Partners; Canaan Partners; Norwest Venture Partners 26.5 Series C 4
Mean 27.5$ Median 15.5$
Sources of information: S&P Capital IQ.

7
Aviation Investment Banking
I
II
III
AEROSPACE & DEFENSE REVIEW
M&A & PRIVATE PLACEMENT TRANSACTIONS
PUBLIC MARKETS OVERVIEW

8
Aviation Investment BankingSELECTED MARKET INDICES
March 31, 2017 to March 29, 2018
Relative Performance
S&P 500 11.5%NASDAQ Composite Index 19.4%S&P Aerospace & Defense Select Industry Index 30.0%Russell 2000 Aerospace Industry 29.2%Nasdaq US Benchmark Aerospace Total Return Index 49.2%
Sources of information: S&P Capital IQ.
60
80
100
120
140
160
180
Mar-17 Apr-17 May-17 Jun-17 Jul-17 Aug-17 Sep-17 Oct-17 Nov-17 Dec-17 Jan-18 Feb-18
9
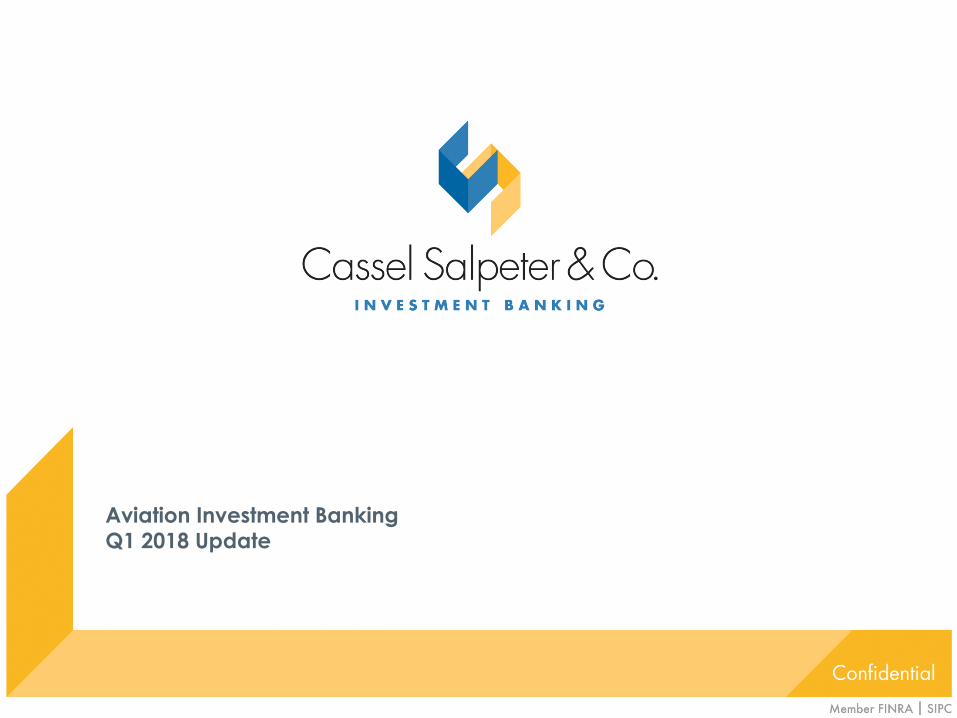
Aviation Investment BankingSELECTED PUBLIC COMPANY TRADING DATA
Selected Companies Review($ in thousands, except per security)
Market Statistics Metrics Valuation Benchmarks
Closing Price % of 52-week Enterprise Revenue EBITDA EBITDA EBITDA EV / Revenue EV / EBITDA
Company Ticker 30-Mar-18 High-Low Value LTM LTM LTM Margin 2019 E Growth LTM 2018 E LTM 2018 E
Aerostructures & Component ManufacturersAir Industries Group AIRI 1.54$ 41.3% - 133.9% 68.6$ 67.2$ (6.0)$ -8.9% 25.0% 1.02x 0.91x na 10.7x
Allegheny Technologies Incorporated ATI 23.68$ 78.3% - 162.9% 4,478.6 3,525.1 355.5 10.1% 22.9% 1.27x 1.17x 12.6x 9.4x
Arconic Inc. ARNC 23.04$ 73.9% - 105.9% 15,886.9 12,960.0 1,781.0 13.7% 9.4% 1.23x 1.17x 8.9x 7.8x
Astronics Corporation ATRO 37.30$ 75.4% - 155.7% 1,325.5 624.5 73.7 11.8% 13.7% 2.12x 1.70x 18.0x 12.2x
CPI Aerostructures, Inc. CVU 9.75$ 97.0% - 175.7% 117.0 81.3 10.8 13.3% 21.5% 1.44x 1.25x 10.8x 9.6x
Hexcel Corporation HXL 64.59$ 92.9% - 131.3% 6,591.8 1,973.3 455.1 23.1% 11.8% 3.34x 3.07x 14.5x 12.8x
Honeywell International Inc. HON 144.51$ 87.5% - 118.1% 116,194.5 40,534.0 8,266.0 20.4% 5.0% 2.87x 2.75x 14.1x 12.5x
Ducommun Incorporated DCO 30.38$ 85.4% - 121.2% 559.3 558.2 47.0 8.4% 13.6% 1.00x 0.95x 11.9x 9.3x
Esterline Technologies Corporation ESL 73.15$ 71.2% - 108.9% 2,634.7 2,023.9 285.2 14.1% 4.2% 1.30x 1.28x 9.2x 8.3x
FACC AG WBAG:FACC 27.47$ 113.1% - 426.4% 1,491.4 905.8 114.4 12.6% 12.0% 1.65x 1.49x 13.0x 12.1x
GKN plc LSE:GKN 6.50$ 140.3% - 219.6% 12,456.5 13,071.6 1,178.6 9.0% 9.8% 0.95x 0.88x 10.6x 8.6x
Héroux-Devtek Inc. TSX:HRX 11.62$ 74.0% - 100.8% 469.1 314.5 41.6 13.2% 13.4% 1.49x 1.22x 11.3x 7.5x
Innovative Solutions and Support, Inc. ISSC 3.53$ 77.8% - 135.8% 34.9 16.5 (2.7) -16.3% na 2.11x na na na
JAMCO Corporation TSE:7408 21.11$ 0.7% - 1.0% 796.4 703.4 55.4 7.9% 7.5% 1.13x 1.07x 14.4x 12.3x
Kaman Corporation KAMN 62.12$ 97.2% - 136.5% 2,107.6 1,805.9 160.7 8.9% 12.5% 1.17x 1.11x 13.1x 12.1x
Latécoère S.A. ENXTPA:LAT 6.13$ 102.2% - 173.1% 624.1 755.2 31.3 4.1% 18.3% 0.83x 0.77x 19.9x 8.9x
Lisi S.A. ENXTPA:FII 40.29$ 84.7% - 129.8% 2,510.5 2,005.3 314.0 15.7% 9.3% 1.25x 1.18x 8.0x 7.4x
Magellan Aerospace Corporation TSX:MAL 15.15$ 69.2% - 86.9% 918.1 772.6 122.9 15.9% 5.5% 1.19x 1.18x 7.5x 6.8x
Meggitt PLC MGGT 6.06$ 114.4% - 144.1% 6,050.8 2,740.2 716.1 26.1% 11.7% 2.21x 2.21x 8.4x 9.6x
Moog Inc. MOG.A 82.41$ 87.7% - 127.1% 3,538.8 2,535.4 323.5 12.8% 7.3% 1.40x 1.34x 10.9x 10.1x
RBC Bearings Incorporated ROLL 124.20$ 88.7% - 136.5% 3,108.4 655.3 160.2 24.5% 11.9% 4.74x 4.43x 19.4x 17.6x
Rockwell Collins, Inc. COL 134.85$ 96.6% - 140.3% 29,069.2 7,640.0 1,638.0 21.4% 6.4% 3.80x 3.31x 17.7x 13.9x
Senior plc LSE:SNR 4.22$ 135.9% - 208.9% 1,980.8 1,383.3 162.6 11.8% 12.0% 1.43x 1.37x 12.2x 10.4x
SIFCO Industries, Inc. SIF 5.52$ 63.1% - 110.4% 61.4 114.2 2.8 2.5% na 0.54x na 21.6x na
Spirit AeroSystems Holdings, Inc. SPR 83.70$ 79.6% - 161.4% 10,322.8 6,983.0 786.7 11.3% 5.4% 1.48x 1.43x 13.1x 8.9x
Triumph Group, Inc. TGI 25.20$ 72.4% - 128.2% 2,562.0 3,222.0 349.5 10.8% 41.5% 0.80x 0.82x 7.3x 8.9x
TransDigm Group Incorporated TDG 306.94$ 95.5% - 141.2% 26,924.2 3,538.2 1,663.2 47.0% 7.0% 7.61x 7.15x 16.2x 14.5x
Woodward, Inc. WWD 71.66$ 80.2% - 109.9% 5,095.7 2,125.9 345.9 16.3% 10.4% 2.40x 2.26x 14.7x 12.4x
Mean 84.9% - 144.0% 9,213.6$ 4,058.4$ 694.0$ 12.9% 12.7% 1.92x 1.83x 13.1x 10.6xMedian 85.0% - 134.8% 2,536.2$ 1,889.6$ 223.9$ 12.7% 11.7% 1.41x 1.27x 12.8x 9.8x
Market value equals price per share times number of diluted shares outstanding. Enterprise value equals market value plus debt, preferred stock, and non controlling interests, less cash.
Sources of information: S&P Capital IQ.
10
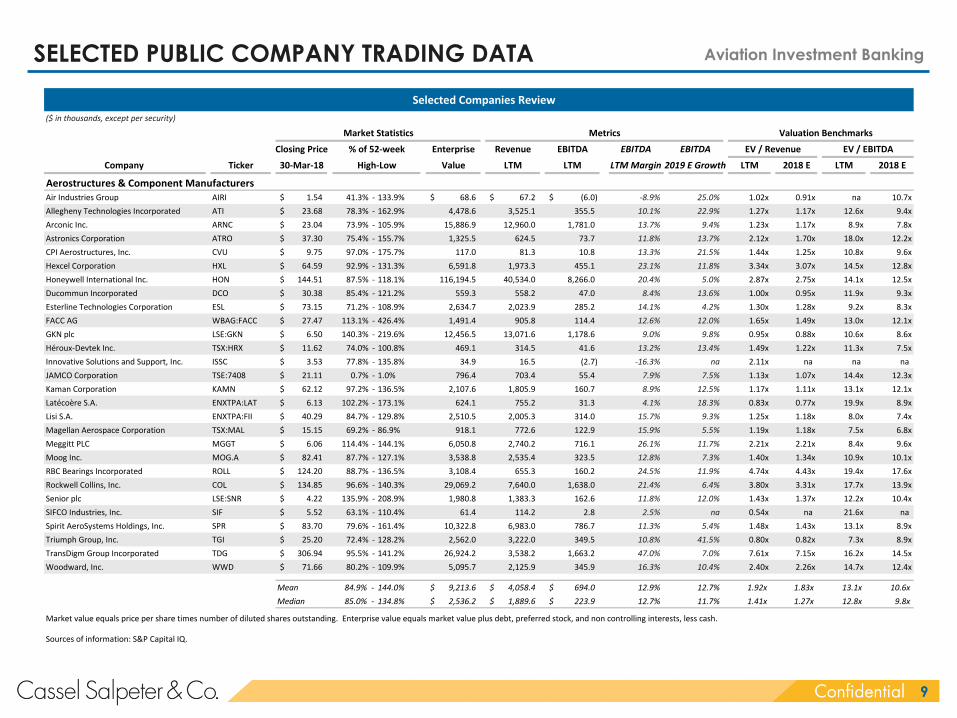
Aviation Investment BankingSELECTED PUBLIC COMPANY TRADING DATA
Selected Companies Review
($ in thousands, except per security)
Market Statistics Metrics Valuation Benchmarks
Closing Price % of 52-week Enterprise Revenue EBITDA EBITDA EBITDA EV / Revenue EV / EBITDA
Company Ticker 30-Mar-18 High-Low Value LTM LTM LTM Margin 2019 E Growth LTM 2018 E LTM 2018 E
MRO, Parts & Supply Chain
AAR Corp. AIR 44.11$ 96.7% - 135.4% 1,687.4$ 1,902.1$ 143.3$ 7.5% na 0.89x 0.85x 11.8x 9.9xCPI Aerostructures, Inc. CVU 9.75$ 97.0% - 175.7% 117.0 81.3 10.8 13.3% 21.5% 1.44x 1.25x 10.8x 9.6xHEICO Corporation HEI 86.81$ 95.0% - 161.2% 9,213.4 1,585.8 387.6 24.4% 8.8% 5.81x 5.24x 23.8x 20.7xHong Kong Aircraft (HAECO) SEHK:44 5.81$ 10.4% - 12.7% 1,511.2 1,861.7 156.9 8.4% na 0.81x na 9.6x naKLX Inc. KLXI 71.06$ 97.1% - 164.1% 4,534.9 1,740.8 282.4 16.2% 11.5% 2.61x 2.26x 16.1x 11.6xWesco Aircraft Holdings, Inc. WAIR 10.25$ 81.8% - 169.4% 1,863.2 1,453.1 129.5 8.9% 15.1% 1.28x 1.25x 14.4x 11.4xMTU Aero Engines AG XTRA:MTX 168.54$ 107.5% - 146.9% 9,955.7 6,047.4 827.1 13.7% 6.8% 1.65x 1.67x 12.0x 10.6xSingapore Technologies (ST Aerospace) SGX:S63 2.74$ 71.0% - 86.7% 8,854.1 4,953.0 567.1 11.4% 6.7% 1.79x 1.66x 15.6x 13.6xTAT Technologies Ltd. TATT 8.70$ 69.6% - 106.1% 58.9 106.5 9.2 8.7% na 0.55x na 6.4x naVSE Corporation VSEC 51.72$ 86.3% - 133.0% 754.8 760.1 80.2 10.6% na 0.99x na 9.4x na
Mean 81.2% - 129.1% 3,855.1$ 2,049.2$ 259.4$ 12.3% 11.7% 1.78x 2.03x 13.0x 12.5xMedian 90.7% - 141.2% 1,775.3$ 1,663.3$ 150.1$ 11.0% 10.1% 1.36x 1.66x 11.9x 11.4x
Aviation Services
AerCap Holdings N.V. AER 50.72$ 91.1% - 119.8% 34,532.5$ 4,987.8$ 2,405.7$ 48.2% 6.0% 6.92x 7.03x 14.4x 9.0xAircastle Limited AYR 19.86$ 78.5% - 104.7% 5,658.2 793.7 na na 9.4% 7.13x 7.32x na 7.8xAir Lease Corporation AL 42.62$ 84.1% - 123.8% 13,988.4 1,516.4 na na 22.7% 9.22x 8.22x na 9.0xAir T, Inc. AIRT 25.30$ 72.6% - 175.7% 78.4 184.7 6.8 3.7% na 0.42x na 11.6x naAir Transport Services Group, Inc. ATSG 23.32$ 84.3% - 148.1% 1,910.9 1,068.2 250.1 23.4% 10.5% 1.79x 1.80x 7.6x 6.2xArotech Corporation ARTX 3.05$ 70.1% - 113.0% 90.2 98.7 6.5 6.6% 49.5% 0.91x 0.88x 13.8x 11.3xAtlas Air Worldwide Holdings, Inc. AAWW 60.45$ 88.0% - 133.0% 3,470.1 2,156.5 438.1 20.3% 10.8% 1.61x 1.40x 7.9x 6.8xBBA Aviation plc LSE:BBA 4.50$ 121.4% - 155.1% 5,840.9 2,370.6 442.2 18.7% 4.1% 2.46x 2.38x 13.2x 12.4xCAE Inc. TSX:CAE 18.60$ 77.3% - 95.0% 5,604.7 2,220.0 403.2 18.2% 5.0% 2.52x 2.44x 13.9x 10.6xGogo Inc. GOGO 8.63$ 58.5% - 102.1% 1,344.1 699.1 81.2 11.6% 66.9% 1.92x 1.51x 16.5x 16.0x
Mean 82.6% - 127.0% 7,251.8$ 1,609.6$ 504.2$ 18.8% 20.5% 3.49x 3.66x 12.4x 9.9xMedian 81.3% - 121.8% 4,537.4$ 1,292.3$ 326.6$ 18.4% 10.5% 2.19x 2.38x 13.5x 9.0x
Market value equals price per share times number of diluted shares outstanding. Enterprise value equals market value plus debt, preferred stock, and non controlling interests, less cash.
Sources of information: S&P Capital IQ.
11
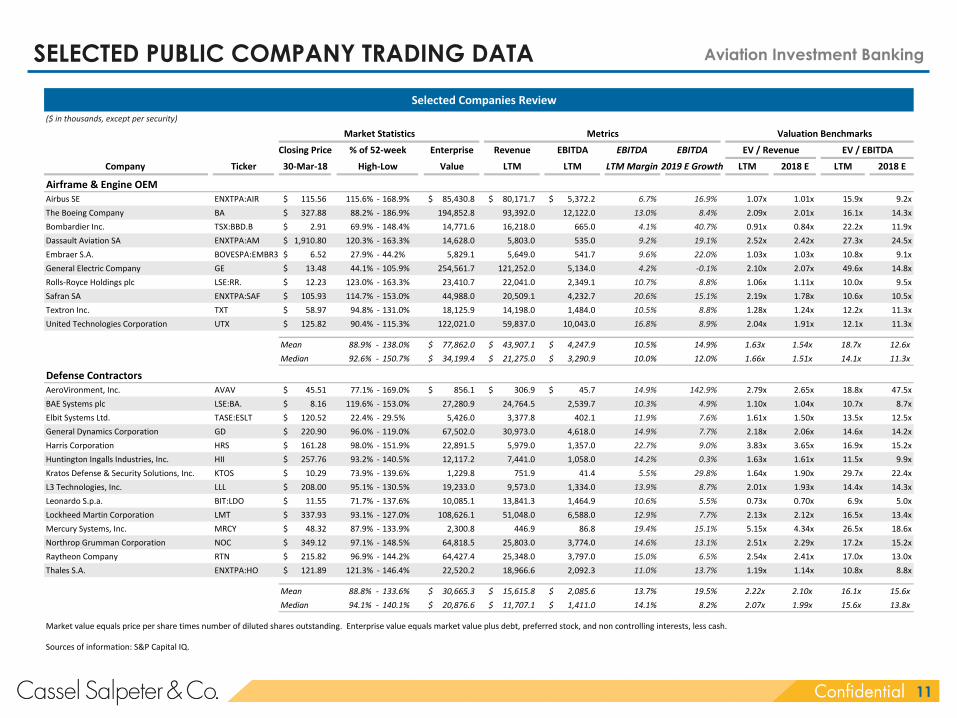
Aviation Investment BankingSELECTED PUBLIC COMPANY TRADING DATA
Selected Companies Review($ in thousands, except per security)
Market Statistics Metrics Valuation BenchmarksClosing Price % of 52-week Enterprise Revenue EBITDA EBITDA EBITDA EV / Revenue EV / EBITDA
Company Ticker 30-Mar-18 High-Low Value LTM LTM LTM Margin 2019 E Growth LTM 2018 E LTM 2018 E
Airframe & Engine OEMAirbus SE ENXTPA:AIR 115.56$ 115.6% - 168.9% 85,430.8$ 80,171.7$ 5,372.2$ 6.7% 16.9% 1.07x 1.01x 15.9x 9.2x
The Boeing Company BA 327.88$ 88.2% - 186.9% 194,852.8 93,392.0 12,122.0 13.0% 8.4% 2.09x 2.01x 16.1x 14.3x
Bombardier Inc. TSX:BBD.B 2.91$ 69.9% - 148.4% 14,771.6 16,218.0 665.0 4.1% 40.7% 0.91x 0.84x 22.2x 11.9x
Dassault Aviation SA ENXTPA:AM 1,910.80$ 120.3% - 163.3% 14,628.0 5,803.0 535.0 9.2% 19.1% 2.52x 2.42x 27.3x 24.5x
Embraer S.A. BOVESPA:EMBR3 6.52$ 27.9% - 44.2% 5,829.1 5,649.0 541.7 9.6% 22.0% 1.03x 1.03x 10.8x 9.1x
General Electric Company GE 13.48$ 44.1% - 105.9% 254,561.7 121,252.0 5,134.0 4.2% -0.1% 2.10x 2.07x 49.6x 14.8x
Rolls-Royce Holdings plc LSE:RR. 12.23$ 123.0% - 163.3% 23,410.7 22,041.0 2,349.1 10.7% 8.8% 1.06x 1.11x 10.0x 9.5x
Safran SA ENXTPA:SAF 105.93$ 114.7% - 153.0% 44,988.0 20,509.1 4,232.7 20.6% 15.1% 2.19x 1.78x 10.6x 10.5x
Textron Inc. TXT 58.97$ 94.8% - 131.0% 18,125.9 14,198.0 1,484.0 10.5% 8.8% 1.28x 1.24x 12.2x 11.3x
United Technologies Corporation UTX 125.82$ 90.4% - 115.3% 122,021.0 59,837.0 10,043.0 16.8% 8.9% 2.04x 1.91x 12.1x 11.3x
Mean 88.9% - 138.0% 77,862.0$ 43,907.1$ 4,247.9$ 10.5% 14.9% 1.63x 1.54x 18.7x 12.6xMedian 92.6% - 150.7% 34,199.4$ 21,275.0$ 3,290.9$ 10.0% 12.0% 1.66x 1.51x 14.1x 11.3x
Defense ContractorsAeroVironment, Inc. AVAV 45.51$ 77.1% - 169.0% 856.1$ 306.9$ 45.7$ 14.9% 142.9% 2.79x 2.65x 18.8x 47.5x
BAE Systems plc LSE:BA. 8.16$ 119.6% - 153.0% 27,280.9 24,764.5 2,539.7 10.3% 4.9% 1.10x 1.04x 10.7x 8.7x
Elbit Systems Ltd. TASE:ESLT 120.52$ 22.4% - 29.5% 5,426.0 3,377.8 402.1 11.9% 7.6% 1.61x 1.50x 13.5x 12.5x
General Dynamics Corporation GD 220.90$ 96.0% - 119.0% 67,502.0 30,973.0 4,618.0 14.9% 7.7% 2.18x 2.06x 14.6x 14.2x
Harris Corporation HRS 161.28$ 98.0% - 151.9% 22,891.5 5,979.0 1,357.0 22.7% 9.0% 3.83x 3.65x 16.9x 15.2x
Huntington Ingalls Industries, Inc. HII 257.76$ 93.2% - 140.5% 12,117.2 7,441.0 1,058.0 14.2% 0.3% 1.63x 1.61x 11.5x 9.9x
Kratos Defense & Security Solutions, Inc. KTOS 10.29$ 73.9% - 139.6% 1,229.8 751.9 41.4 5.5% 29.8% 1.64x 1.90x 29.7x 22.4x
L3 Technologies, Inc. LLL 208.00$ 95.1% - 130.5% 19,233.0 9,573.0 1,334.0 13.9% 8.7% 2.01x 1.93x 14.4x 14.3x
Leonardo S.p.a. BIT:LDO 11.55$ 71.7% - 137.6% 10,085.1 13,841.3 1,464.9 10.6% 5.5% 0.73x 0.70x 6.9x 5.0x
Lockheed Martin Corporation LMT 337.93$ 93.1% - 127.0% 108,626.1 51,048.0 6,588.0 12.9% 7.7% 2.13x 2.12x 16.5x 13.4x
Mercury Systems, Inc. MRCY 48.32$ 87.9% - 133.9% 2,300.8 446.9 86.8 19.4% 15.1% 5.15x 4.34x 26.5x 18.6x
Northrop Grumman Corporation NOC 349.12$ 97.1% - 148.5% 64,818.5 25,803.0 3,774.0 14.6% 13.1% 2.51x 2.29x 17.2x 15.2x
Raytheon Company RTN 215.82$ 96.9% - 144.2% 64,427.4 25,348.0 3,797.0 15.0% 6.5% 2.54x 2.41x 17.0x 13.0x
Thales S.A. ENXTPA:HO 121.89$ 121.3% - 146.4% 22,520.2 18,966.6 2,092.3 11.0% 13.7% 1.19x 1.14x 10.8x 8.8x
Mean 88.8% - 133.6% 30,665.3$ 15,615.8$ 2,085.6$ 13.7% 19.5% 2.22x 2.10x 16.1x 15.6xMedian 94.1% - 140.1% 20,876.6$ 11,707.1$ 1,411.0$ 14.1% 8.2% 2.07x 1.99x 15.6x 13.8x
Market value equals price per share times number of diluted shares outstanding. Enterprise value equals market value plus debt, preferred stock, and non controlling interests, less cash.
Sources of information: S&P Capital IQ.

12
Aviation Investment BankingCONTACT INFORMATION
James S. Cassel Scott E. Salpeter Joseph “Joey” Smith
Chairman President Director, Aviation Services
[email protected] [email protected] [email protected]
305-438-7701 305-438-7702 305-438-7706
801 Brickell Ave.
Suite 1900
Miami, Florida 33131
Telephone 305-438-7700
Fax 305-438-7710
www.casselsalpeter.com


![조선F 15년 1월2주 0117-최종(한유건)18173632]conjapan.pdf · HI조선/해양Flash -15년01월2주 2015. 01. 18 [281호] 최광식(02-2122-9197) gs.choie@hi-ib.com 신조선가](https://img.pdfslide.us/doc/110x75/6028e29714acf362dc2b3f2a/f-15e-12-0117-oeoeoee-18173632-hiflash.jpg)