Embed Size (px)
Citation preview
2018 New Year’s Tax Changes Page 1
Jeff Bowes Research Director December 2017
About the Canadian Taxpayers Federation
The Canadian Taxpayers Federation (CTF) is a federally incorporated, not-for-profit citizen’s group dedicated to lower taxes, less waste and
accountable government. The CTF was founded in Saskatchewan in 1990 when the Association of Saskatchewan Taxpayers and the Resolution
One Association of Alberta joined forces to create a national taxpayers organization. Today, the CTF has 130,000 supporters nation-wide.
The CTF maintains a federal office in Ottawa and regional offices in British Columbia, Alberta, Prairie (SK and MB), Ontario, Quebec and Atlantic.
Regional offices conduct research and advocacy activities specific to their provinces in addition to acting as regional organizers of Canada-wide
initiatives.
CTF offices field hundreds of media interviews each month, hold press conferences and issue regular news releases, commentaries, online
postings and publications to advocate on behalf of CTF supporters. CTF representatives speak at functions, make presentations to government,
meet with politicians, and organize petition drives, events and campaigns to mobilize citizens to affect public policy change. Each week CTF
offices send out Let’s Talk Taxes commentaries to more than 800 media outlets and personalities across Canada.
Any Canadian taxpayer committed to the CTF’s mission is welcome to join at no cost and receive issue and Action Updates. Financial supporters
can additionally receive the CTF’s flagship publication The Taxpayer magazine published four times a year.
The CTF is independent of any institutional or partisan affiliations. All CTF staff, board and representatives are prohibited from holding a
membership in any political party. In 2015-16 the CTF raised $4.7-million on the strength of 29,102 donations. Donations to the CTF are not
deductible as a charitable contribution.
2018 New Year’s Tax Changes Page 2
Jeff Bowes Research Director December 2017
Contents
Summary ..................................................................................................................................................................................................... 3
Other Tax Changes ...................................................................................................................................................................................... 5
Employment Insurance ............................................................................................................................................................................... 7
Quebec EI and Parental Insurance Plan ...................................................................................................................................................... 9
Canada Pension Plan ................................................................................................................................................................................. 11
Quebec Pension Plan ................................................................................................................................................................................ 12
CPP and EI Combined ................................................................................................................................................................................ 13
Household Tax Examples and Inflation Adjustments ............................................................................................................................... 14
Bracket Creep ............................................................................................................................................................................................ 16
Child Benefit Changes ............................................................................................................................................................................... 18
Quebec’s 2017 Income Tax Changes ........................................................................................................................................................ 19
Tax Totals .................................................................................................................................................................................................. 20
Average Tax Rates ..................................................................................................................................................................................... 22
Households with no Children .................................................................................................................................................................... 23
Single Earner ......................................................................................................................................................................................... 23
Dual Earners Equal ................................................................................................................................................................................ 31
Dual Earners 75/25 ............................................................................................................................................................................... 40
Households with Children ......................................................................................................................................................................... 47
Single Earner with Kids .......................................................................................................................................................................... 47
Dual Earners Equal with Kids ................................................................................................................................................................ 55
Dual Earners 75/25 with Kids ................................................................................................................................................................ 62
2018 New Year’s Tax Changes Page 3
Jeff Bowes Research Director December 2017
Summary
The 2018 New Year’s Tax Changes report looks at the tax changes occurring on January 1, 2018, and focuses on income-based taxes,
including income taxes, Employment Insurance premiums, Canada Pension Plan premiums and health taxes. It compares the
inflation-adjusted taxes to inflation-adjusted incomes on a year to year basis.
Comparing tax burdens in this way show the true tax changes from year to year, and reveal a phenomenon known as bracket creep,
which occurs when governments fail to index tax brackets to inflation, resulting in a hidden tax increase. Indexing tax brackets
ensures that if your salary keeps up with inflation you aren’t bumped into a higher tax bracket.
Saskatchewan, Prince Edward Island and Nova Scotia are not indexing their tax brackets at all for 2018. Ontario will not be indexing
its top two tax brackets, nor its health tax. New Brunswick indexes its tax brackets to federal inflation rather the provincial inflation;
since inflation in New Brunswick was higher than the national average that means tax increases in the form of bracket creep. In
Newfoundland and Labrador, regular income taxes are indexed but the Temporary Deficit Reduction Levy is not (the levy is
effectively an additional tax on income over $50,000; had it been indexed to inflation it would be on income over $51,500 in 2018.)
This year, there are only minor changes to federal taxes. Employment Insurance premiums are increasing from 1.63% to 1.66%. For
those making over the maximum insurable earnings, that means a tax increase of $9 for employees and $13 for employers. The
Canada Pension Plan premium rate remains the same in 2018, but will start increasing in 2019.
The Canada Child Benefit (CCB) will be inflation-indexed starting in July 2018. Without indexing, the benefit of CCB would decrease in
value to taxpayers each year, in a sort of benefit bracket creep. Since there was no indexation in 2017 and the indexation starts half
way through the year, the benefit’s value decreases slightly in 2018 by an average of $61 for children under 6 years old, and $72 for
children aged 6 to 17.
Child benefits are generally outside of the scope of this report but the CCB changes are significant enough that they were included.
Another benefit change that was included is Quebec’s new $100 supplement per school-aged child meant to offset back-to-school
costs. It will be given tax-free to all families for each child from age 4 to 16.
There have been other major tax changes in Quebec, the most significant being the reduction of the lowest tax bracket rate from
16% to 15%. However, that tax change was implemented for the 2017 tax year, so does not affect the report’s calculations.
2018 New Year’s Tax Changes Page 4
Jeff Bowes Research Director December 2017
British Columbia’s health tax, the Medical Services Plan (MSP) is being reduced by 50% starting January 1st and B.C will also see an
income tax rate increase on income over $150,000, from 14.7% to 16.8%.
Nova Scotia introduced a means-tested increase in its basic and spousal amounts. The full benefit is available to those making under $25,000
and is phased out above $75,000.
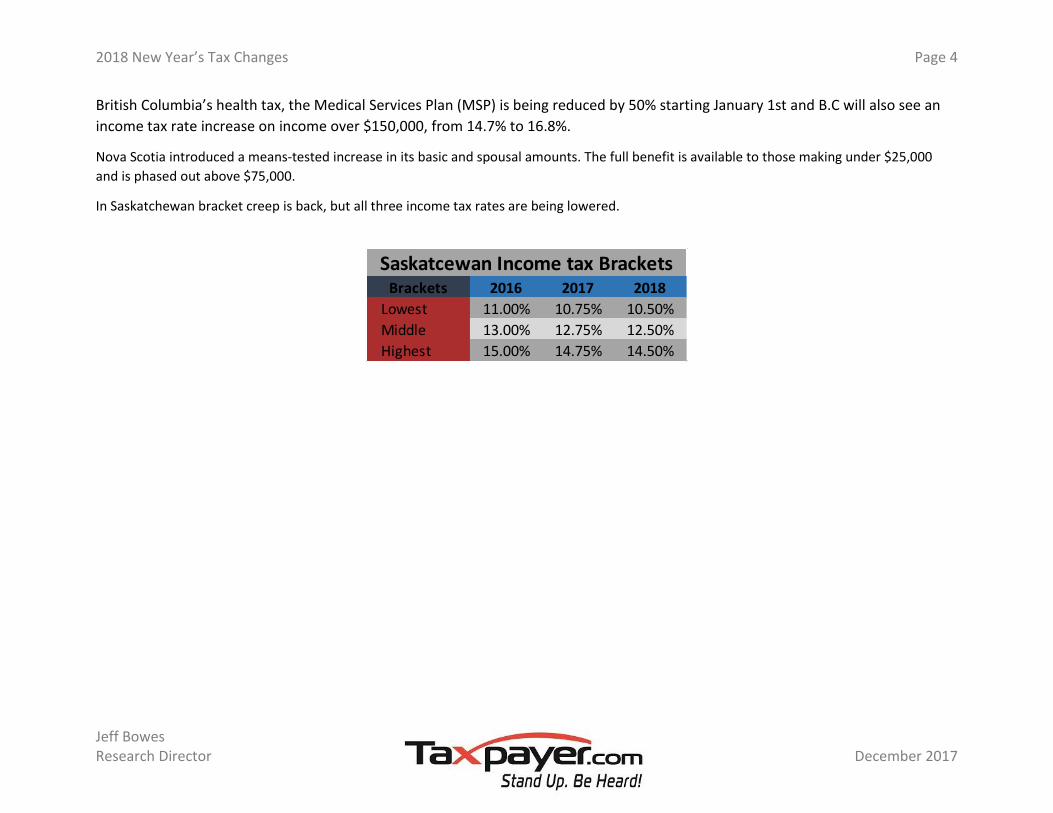
In Saskatchewan bracket creep is back, but all three income tax rates are being lowered.
Brackets 2016 2017 2018
Lowest 11.00% 10.75% 10.50%
Middle 13.00% 12.75% 12.50%
Highest 15.00% 14.75% 14.50%
Saskatcewan Income tax Brackets
2018 New Year’s Tax Changes Page 5
Jeff Bowes Research Director December 2017
Other Tax Changes
This report’s calculations don’t account for all tax changes and in 2018 there are significant changes that don’t fit in its narrow scope. The two
most significant areas not covered in the calculations are carbon taxes and business taxes.
Carbon Tax
The federal government says it will implement a federal carbon tax in any province that does not have carbon pricing — that meets their
standard — by the end of 2018. If provinces don’t have a qualifying system in place, the federal government says it will impose a $10/tonne
carbon tax in that province. However, in some provinces the governments are imposing even higher carbon taxes.
• British Columbia: April 1st, 2018 the carbon tax rate will increase to $35/tonne from $30/tonne.
• Alberta: January 1st, 2018 the carbon tax will increase to $30/tonne from $20/tonne.
• Saskatchewan: No plans for a carbon tax.
• Manitoba: Plans to introduce a $25/tonne tax sometime in 2018.
• Ontario: Has a cap-and-trade system and on January 1st, 2018 it joins the Quebec-California carbon market.
• Quebec: Has a cap-and-trade system.
• New Brunswick: Plans to shift 2.33 cents per litre of the provincial gas tax to be a carbon tax in 2018. With the funds directed to
programs to reduce carbon dioxide emissions.
• Nova Scotia: Plans to implement a cap-and-trade system on large emitters in 2018.
• Price Edward island: Plan expected in early 2018.
• Newfoundland and Labrador: Plan expected in the spring of 2018.
Business Tax Changes
The federal government proposed a series of changes to taxes on Canadian Controlled Private Corporations (CCPC). After consultations the
government chose not to pursue changes concerning converting income into capital gains, but it is planning to implement changes related to
income sprinkling and passive investments.
Starting January 1st, 2018 there will be new rules on income sprinkling. These new rules are meant to determine if the compensation paid to
family members is reasonable based on their contributions to the business. If its determined to be unreasonable, then they will be taxed at the
highest marginal tax rate.
The government also plans to move forward with changes to the taxation of passive investment. They announced that up to $50,000 in
investments each year won’t be subject to the new rules, and that the rules will not affect existing investments. Details of how passive income
over the $50,000 per year threshold will be taxed are expected in the 2018 federal budget.
2018 New Year’s Tax Changes Page 6
Jeff Bowes Research Director December 2017
On January 1st, 2018 the federal small business tax rate will be lowered to 10% from 10.5%, and further reduced to 9% on January 1st, 2019.
• British Columbia: Corporate tax rate is increasing from 11% to 12% on January 1st, 2018.
• Saskatchewan: Corporate tax rate will be raised to 12% from 11.5% on January 1st, 2018. The threshold at which small businesses pay the
lower small business tax rate is increasing from $500,000 to $600,000.
• Ontario: Small business tax lowered to 3.5% from 4.5% on January 1st, 2018.
• New Brunswick: The small business tax rate will be lowered to 2.5% effective April 1, 2018.
2018 New Year’s Tax Changes Page 7
Jeff Bowes Research Director December 2017
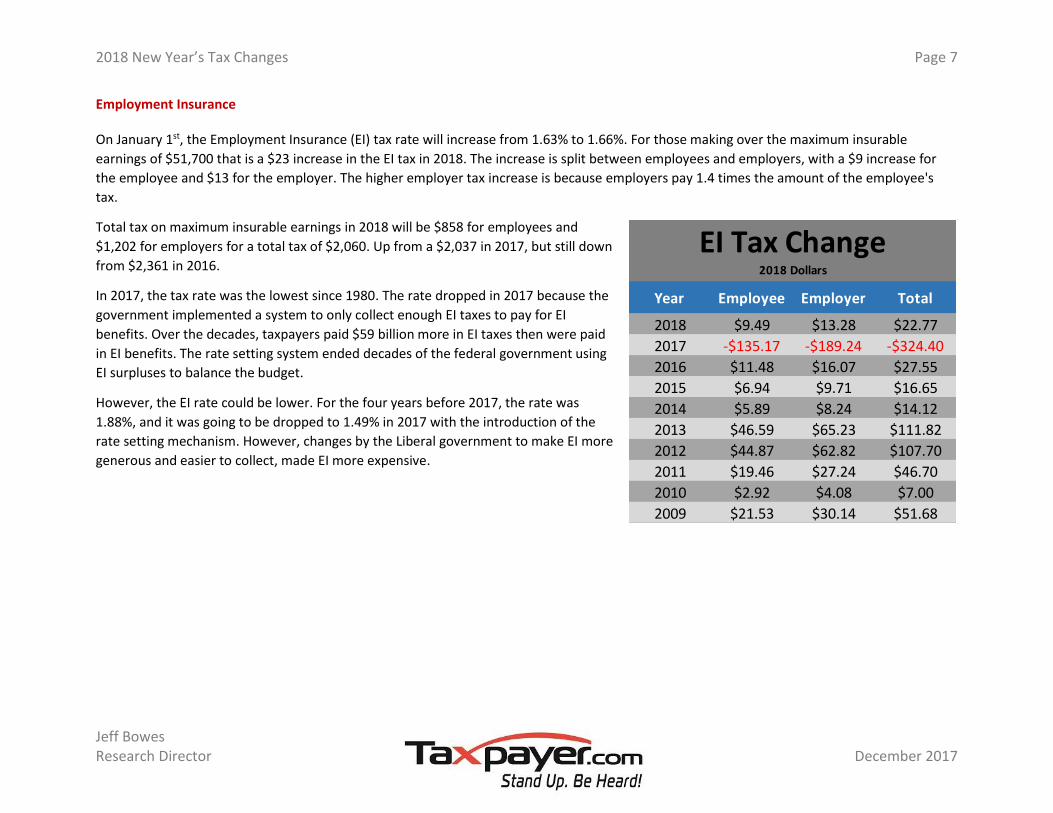
Employment Insurance
On January 1st, the Employment Insurance (EI) tax rate will increase from 1.63% to 1.66%. For those making over the maximum insurable
earnings of $51,700 that is a $23 increase in the EI tax in 2018. The increase is split between employees and employers, with a $9 increase for
the employee and $13 for the employer. The higher employer tax increase is because employers pay 1.4 times the amount of the employee's
tax.
Total tax on maximum insurable earnings in 2018 will be $858 for employees and
$1,202 for employers for a total tax of $2,060. Up from a $2,037 in 2017, but still down
from $2,361 in 2016.
In 2017, the tax rate was the lowest since 1980. The rate dropped in 2017 because the
government implemented a system to only collect enough EI taxes to pay for EI
benefits. Over the decades, taxpayers paid $59 billion more in EI taxes then were paid
in EI benefits. The rate setting system ended decades of the federal government using
EI surpluses to balance the budget.
However, the EI rate could be lower. For the four years before 2017, the rate was
1.88%, and it was going to be dropped to 1.49% in 2017 with the introduction of the
rate setting mechanism. However, changes by the Liberal government to make EI more
generous and easier to collect, made EI more expensive.
Year Employee Employer Total
2018 $9.49 $13.28 $22.77
2017 -$135.17 -$189.24 -$324.40
2016 $11.48 $16.07 $27.55
2015 $6.94 $9.71 $16.65
2014 $5.89 $8.24 $14.12
2013 $46.59 $65.23 $111.82
2012 $44.87 $62.82 $107.70
2011 $19.46 $27.24 $46.70
2010 $2.92 $4.08 $7.00
2009 $21.53 $30.14 $51.68
EI Tax Change2018 Dollars
2018 New Year’s Tax Changes Page 8
Jeff Bowes Research Director December 2017
YearEmployee
Tax Rate
Employer
Tax Rate
Insurable
Earnings
Employee
Tax
Employer
Tax
Combined
Tax
Combined
Tax Change
Percent Tax
Change
2018 1.66% 2.32% $51,700 $858 $1,202 $2,060 $23 1.1%
2017 1.63% 2.28% $52,070 $849 $1,188 $2,037 -$324 -15.9%
2016 1.88% 2.63% $52,335 $984 $1,377 $2,361 $28 1.2%
2015 1.88% 2.63% $51,725 $972 $1,361 $2,334 $17 0.7%
2014 1.88% 2.63% $51,355 $965 $1,352 $2,317 $14 0.6%
2013 1.88% 2.63% $51,042 $960 $1,343 $2,303 $112 4.9%
2012 1.83% 2.56% $49,891 $913 $1,278 $2,191 $108 4.9%
2011 1.78% 2.49% $48,771 $868 $1,215 $2,084 $47 2.2%
2010 1.73% 2.42% $49,056 $849 $1,188 $2,037 $7 0.3%
2009 1.73% 2.42% $48,888 $846 $1,184 $2,030 $52 2.5%
Employment InsuranceTax on Insurable Earnings in 2018 Dollars
2018 New Year’s Tax Changes Page 9
Jeff Bowes Research Director December 2017
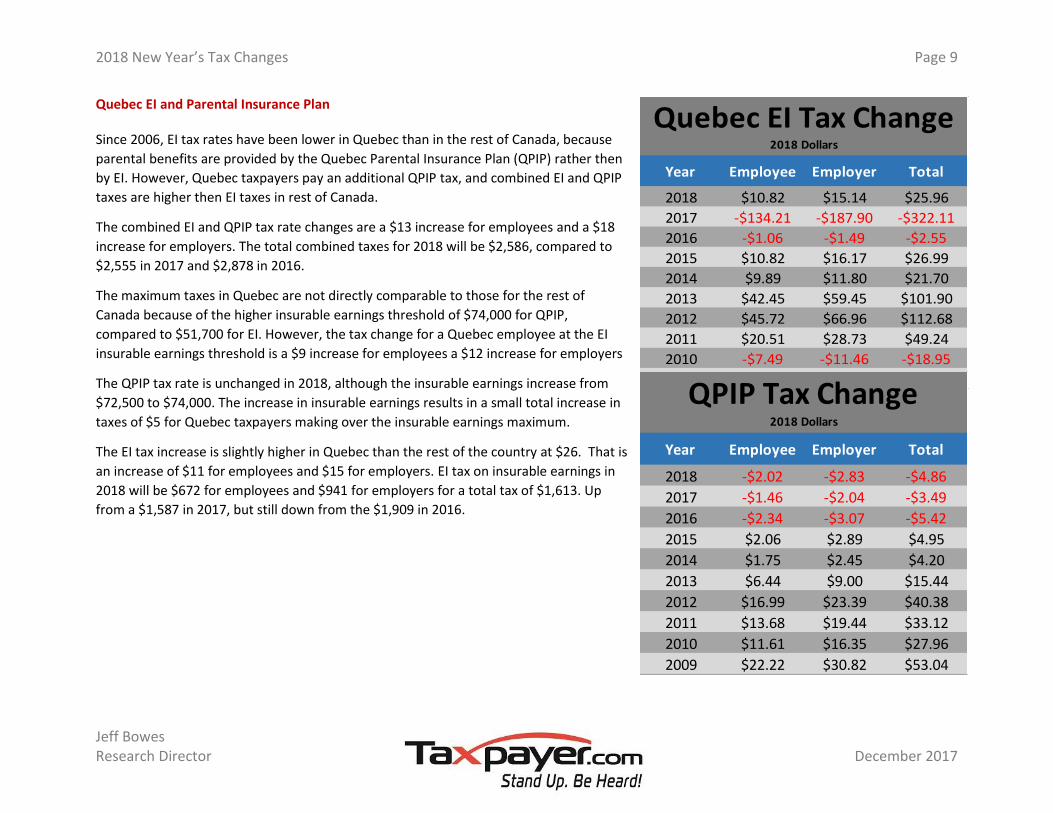
Quebec EI and Parental Insurance Plan
Since 2006, EI tax rates have been lower in Quebec than in the rest of Canada, because
parental benefits are provided by the Quebec Parental Insurance Plan (QPIP) rather then
by EI. However, Quebec taxpayers pay an additional QPIP tax, and combined EI and QPIP
taxes are higher then EI taxes in rest of Canada.
The combined EI and QPIP tax rate changes are a $13 increase for employees and a $18
increase for employers. The total combined taxes for 2018 will be $2,586, compared to
$2,555 in 2017 and $2,878 in 2016.
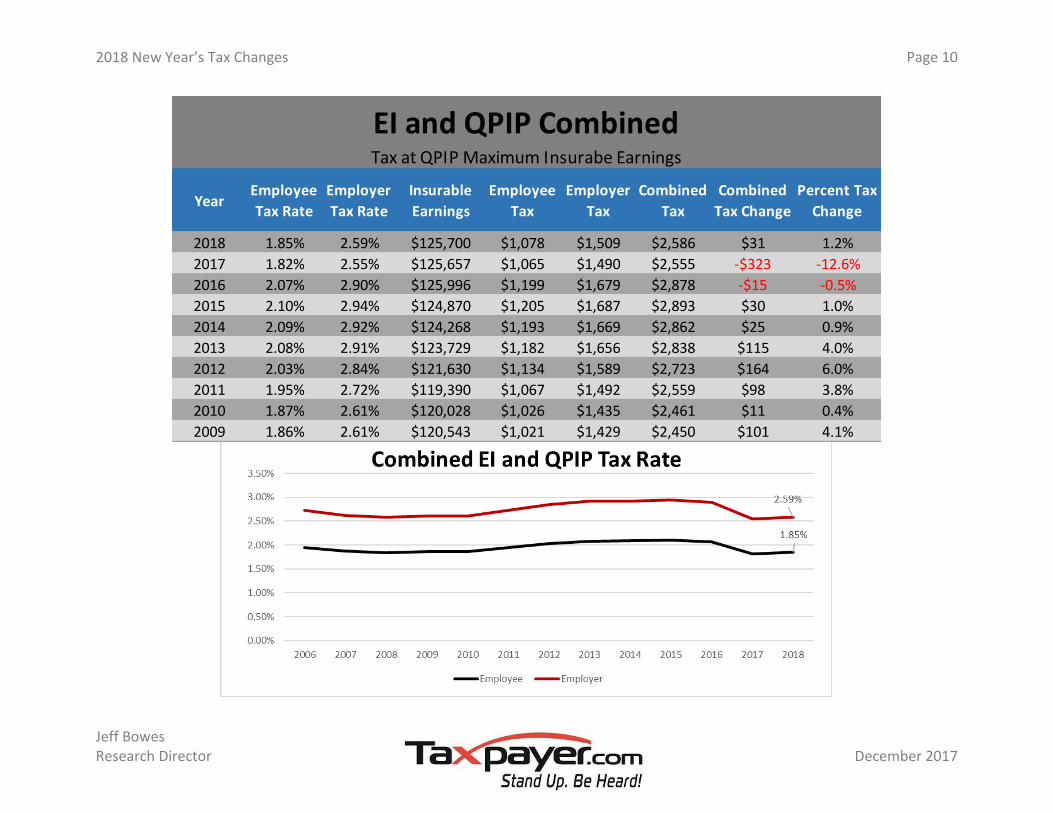
The maximum taxes in Quebec are not directly comparable to those for the rest of
Canada because of the higher insurable earnings threshold of $74,000 for QPIP,
compared to $51,700 for EI. However, the tax change for a Quebec employee at the EI
insurable earnings threshold is a $9 increase for employees a $12 increase for employers
The QPIP tax rate is unchanged in 2018, although the insurable earnings increase from
$72,500 to $74,000. The increase in insurable earnings results in a small total increase in
taxes of $5 for Quebec taxpayers making over the insurable earnings maximum.
The EI tax increase is slightly higher in Quebec than the rest of the country at $26. That is
an increase of $11 for employees and $15 for employers. EI tax on insurable earnings in
2018 will be $672 for employees and $941 for employers for a total tax of $1,613. Up
from a $1,587 in 2017, but still down from the $1,909 in 2016.
Year Employee Employer Total
2018 $10.82 $15.14 $25.96
2017 -$134.21 -$187.90 -$322.11
2016 -$1.06 -$1.49 -$2.55
2015 $10.82 $16.17 $26.99
2014 $9.89 $11.80 $21.70
2013 $42.45 $59.45 $101.90
2012 $45.72 $66.96 $112.68
2011 $20.51 $28.73 $49.24
2010 -$7.49 -$11.46 -$18.95
2009 $12.41 $14.49 $26.90
Quebec EI Tax Change2018 Dollars
Year Employee Employer Total
2018 -$2.02 -$2.83 -$4.86
2017 -$1.46 -$2.04 -$3.49
2016 -$2.34 -$3.07 -$5.42
2015 $2.06 $2.89 $4.95
2014 $1.75 $2.45 $4.20
2013 $6.44 $9.00 $15.44
2012 $16.99 $23.39 $40.38
2011 $13.68 $19.44 $33.12
2010 $11.61 $16.35 $27.96
2009 $22.22 $30.82 $53.04
QPIP Tax Change2018 Dollars
2018 New Year’s Tax Changes Page 10
Jeff Bowes Research Director December 2017
YearEmployee
Tax Rate
Employer
Tax Rate
Insurable
Earnings
Employee
Tax
Employer
Tax
Combined
Tax
Combined
Tax Change
Percent Tax
Change
2018 1.85% 2.59% $125,700 $1,078 $1,509 $2,586 $31 1.2%
2017 1.82% 2.55% $125,657 $1,065 $1,490 $2,555 -$323 -12.6%
2016 2.07% 2.90% $125,996 $1,199 $1,679 $2,878 -$15 -0.5%
2015 2.10% 2.94% $124,870 $1,205 $1,687 $2,893 $30 1.0%
2014 2.09% 2.92% $124,268 $1,193 $1,669 $2,862 $25 0.9%
2013 2.08% 2.91% $123,729 $1,182 $1,656 $2,838 $115 4.0%
2012 2.03% 2.84% $121,630 $1,134 $1,589 $2,723 $164 6.0%
2011 1.95% 2.72% $119,390 $1,067 $1,492 $2,559 $98 3.8%
2010 1.87% 2.61% $120,028 $1,026 $1,435 $2,461 $11 0.4%
2009 1.86% 2.61% $120,543 $1,021 $1,429 $2,450 $101 4.1%
EI and QPIP CombinedTax at QPIP Maximum Insurabe Earnings
2018 New Year’s Tax Changes Page 11
Jeff Bowes Research Director December 2017
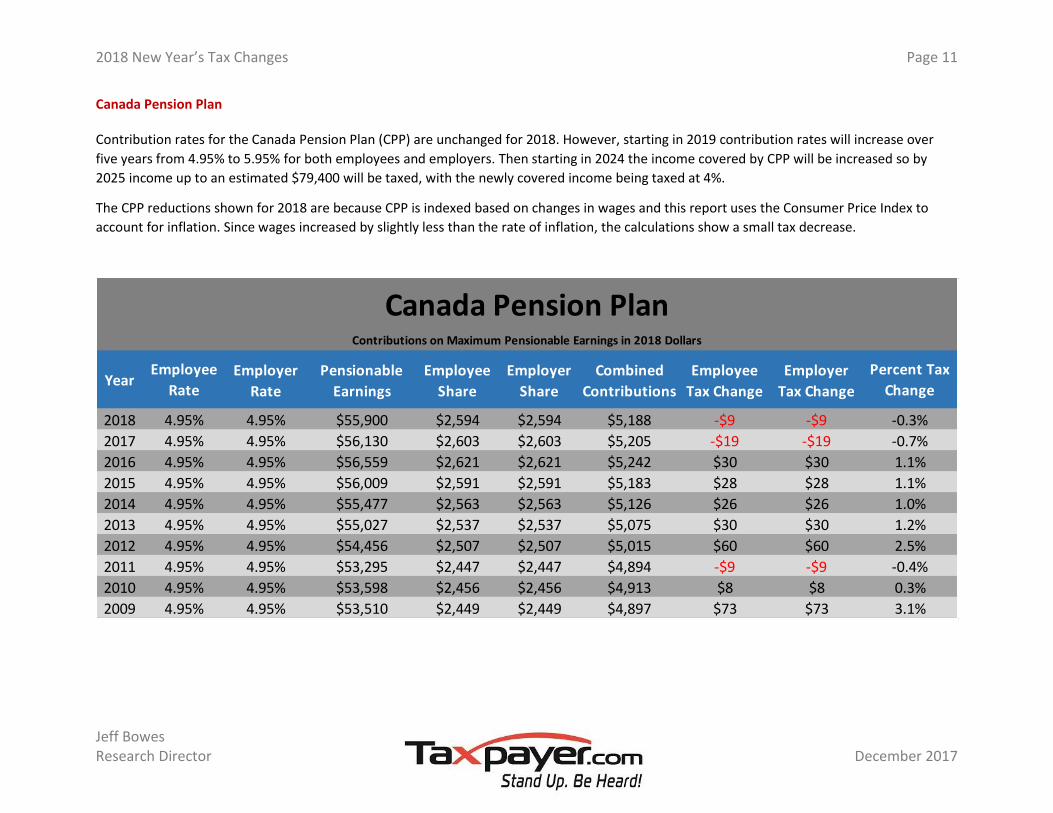
Canada Pension Plan
Contribution rates for the Canada Pension Plan (CPP) are unchanged for 2018. However, starting in 2019 contribution rates will increase over
five years from 4.95% to 5.95% for both employees and employers. Then starting in 2024 the income covered by CPP will be increased so by
2025 income up to an estimated $79,400 will be taxed, with the newly covered income being taxed at 4%.
The CPP reductions shown for 2018 are because CPP is indexed based on changes in wages and this report uses the Consumer Price Index to
account for inflation. Since wages increased by slightly less than the rate of inflation, the calculations show a small tax decrease.
Employer
Rate
Pensionable
Earnings
Employee
Share
Employer
Share
Combined
Contributions
Employee
Tax Change
Employer
Tax Change
2018 4.95% 4.95% $55,900 $2,594 $2,594 $5,188 -$9 -$9 -0.3%
2017 4.95% 4.95% $56,130 $2,603 $2,603 $5,205 -$19 -$19 -0.7%
2016 4.95% 4.95% $56,559 $2,621 $2,621 $5,242 $30 $30 1.1%
2015 4.95% 4.95% $56,009 $2,591 $2,591 $5,183 $28 $28 1.1%
2014 4.95% 4.95% $55,477 $2,563 $2,563 $5,126 $26 $26 1.0%
2013 4.95% 4.95% $55,027 $2,537 $2,537 $5,075 $30 $30 1.2%
2012 4.95% 4.95% $54,456 $2,507 $2,507 $5,015 $60 $60 2.5%
2011 4.95% 4.95% $53,295 $2,447 $2,447 $4,894 -$9 -$9 -0.4%
2010 4.95% 4.95% $53,598 $2,456 $2,456 $4,913 $8 $8 0.3%
2009 4.95% 4.95% $53,510 $2,449 $2,449 $4,897 $73 $73 3.1%
Canada Pension Plan
YearEmployee
Rate
Contributions on Maximum Pensionable Earnings in 2018 Dollars
Percent Tax
Change
2018 New Year’s Tax Changes Page 12
Jeff Bowes Research Director December 2017
Quebec Pension Plan
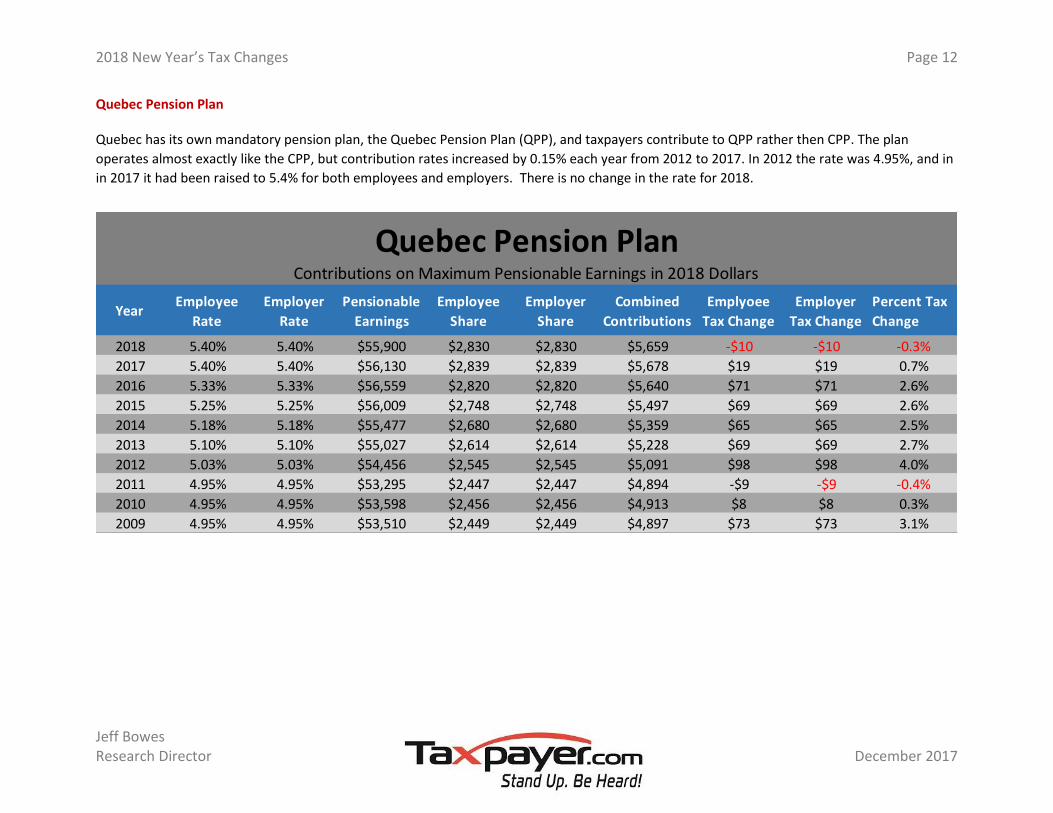
Quebec has its own mandatory pension plan, the Quebec Pension Plan (QPP), and taxpayers contribute to QPP rather then CPP. The plan
operates almost exactly like the CPP, but contribution rates increased by 0.15% each year from 2012 to 2017. In 2012 the rate was 4.95%, and in
in 2017 it had been raised to 5.4% for both employees and employers. There is no change in the rate for 2018.
Employee
Rate
Employer
Rate
Pensionable
Earnings
Employee
Share
Employer
Share
Combined
Contributions
Emplyoee
Tax Change
Employer
Tax Change
Percent Tax
Change
2018 5.40% 5.40% $55,900 $2,830 $2,830 $5,659 -$10 -$10 -0.3%
2017 5.40% 5.40% $56,130 $2,839 $2,839 $5,678 $19 $19 0.7%
2016 5.33% 5.33% $56,559 $2,820 $2,820 $5,640 $71 $71 2.6%
2015 5.25% 5.25% $56,009 $2,748 $2,748 $5,497 $69 $69 2.6%
2014 5.18% 5.18% $55,477 $2,680 $2,680 $5,359 $65 $65 2.5%
2013 5.10% 5.10% $55,027 $2,614 $2,614 $5,228 $69 $69 2.7%
2012 5.03% 5.03% $54,456 $2,545 $2,545 $5,091 $98 $98 4.0%
2011 4.95% 4.95% $53,295 $2,447 $2,447 $4,894 -$9 -$9 -0.4%
2010 4.95% 4.95% $53,598 $2,456 $2,456 $4,913 $8 $8 0.3%
2009 4.95% 4.95% $53,510 $2,449 $2,449 $4,897 $73 $73 3.1%
Quebec Pension PlanContributions on Maximum Pensionable Earnings in 2018 Dollars
Year
2018 New Year’s Tax Changes Page 13
Jeff Bowes Research Director December 2017
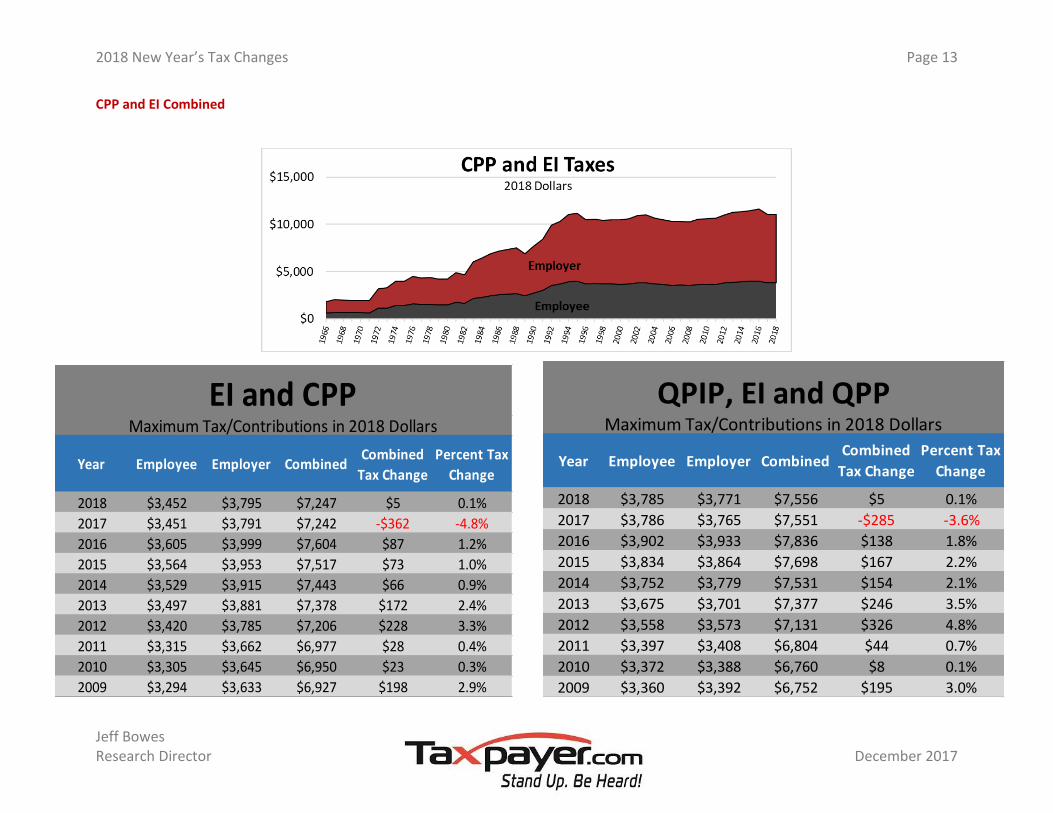
CPP and EI Combined
Year Employee Employer CombinedCombined
Tax Change
Percent Tax
Change
2018 $3,452 $3,795 $7,247 $5 0.1%
2017 $3,451 $3,791 $7,242 -$362 -4.8%
2016 $3,605 $3,999 $7,604 $87 1.2%
2015 $3,564 $3,953 $7,517 $73 1.0%
2014 $3,529 $3,915 $7,443 $66 0.9%
2013 $3,497 $3,881 $7,378 $172 2.4%
2012 $3,420 $3,785 $7,206 $228 3.3%
2011 $3,315 $3,662 $6,977 $28 0.4%
2010 $3,305 $3,645 $6,950 $23 0.3%
2009 $3,294 $3,633 $6,927 $198 2.9%
EI and CPPMaximum Tax/Contributions in 2018 Dollars
2018 $3,785 $3,771 $7,556 $5 0.1%
2017 $3,786 $3,765 $7,551 -$285 -3.6%
2016 $3,902 $3,933 $7,836 $138 1.8%
2015 $3,834 $3,864 $7,698 $167 2.2%
2014 $3,752 $3,779 $7,531 $154 2.1%
2013 $3,675 $3,701 $7,377 $246 3.5%
2012 $3,558 $3,573 $7,131 $326 4.8%
2011 $3,397 $3,408 $6,804 $44 0.7%
2010 $3,372 $3,388 $6,760 $8 0.1%
2009 $3,360 $3,392 $6,752 $195 3.0%
QPIP, EI and QPPMaximum Tax/Contributions in 2018 Dollars
YearPercent Tax
ChangeEmployee Employer Combined
Combined
Tax Change
2018 New Year’s Tax Changes Page 14
Jeff Bowes Research Director December 2017
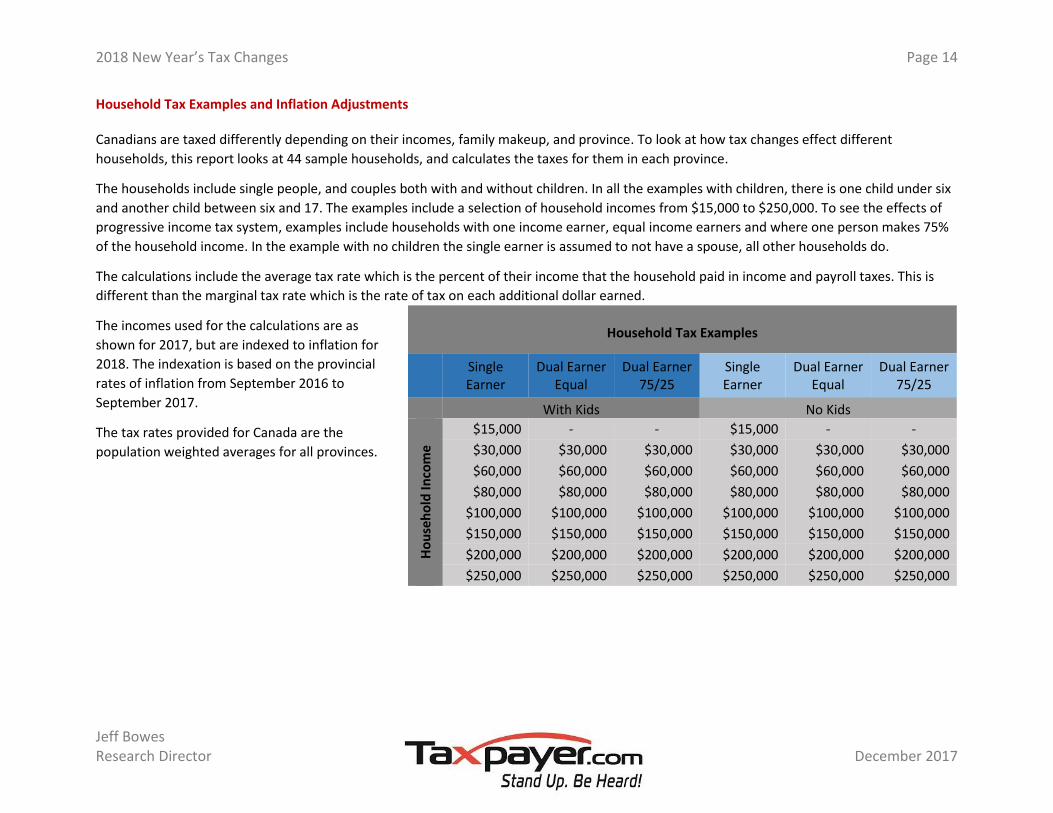
Household Tax Examples and Inflation Adjustments
Canadians are taxed differently depending on their incomes, family makeup, and province. To look at how tax changes effect different
households, this report looks at 44 sample households, and calculates the taxes for them in each province.
The households include single people, and couples both with and without children. In all the examples with children, there is one child under six
and another child between six and 17. The examples include a selection of household incomes from $15,000 to $250,000. To see the effects of
progressive income tax system, examples include households with one income earner, equal income earners and where one person makes 75%
of the household income. In the example with no children the single earner is assumed to not have a spouse, all other households do.
The calculations include the average tax rate which is the percent of their income that the household paid in income and payroll taxes. This is
different than the marginal tax rate which is the rate of tax on each additional dollar earned.
The incomes used for the calculations are as
shown for 2017, but are indexed to inflation for
2018. The indexation is based on the provincial
rates of inflation from September 2016 to
September 2017.
The tax rates provided for Canada are the
population weighted averages for all provinces.
Household Tax Examples
Single Earner
Dual Earner Equal
Dual Earner 75/25
Single Earner
Dual Earner Equal
Dual Earner 75/25
With Kids No Kids H
ou
seh
old
Inco
me
$15,000 - - $15,000 - -
$30,000 $30,000 $30,000 $30,000 $30,000 $30,000
$60,000 $60,000 $60,000 $60,000 $60,000 $60,000
$80,000 $80,000 $80,000 $80,000 $80,000 $80,000
$100,000 $100,000 $100,000 $100,000 $100,000 $100,000
$150,000 $150,000 $150,000 $150,000 $150,000 $150,000
$200,000 $200,000 $200,000 $200,000 $200,000 $200,000
$250,000 $250,000 $250,000 $250,000 $250,000 $250,000
2018 New Year’s Tax Changes Page 15
Jeff Bowes Research Director December 2017
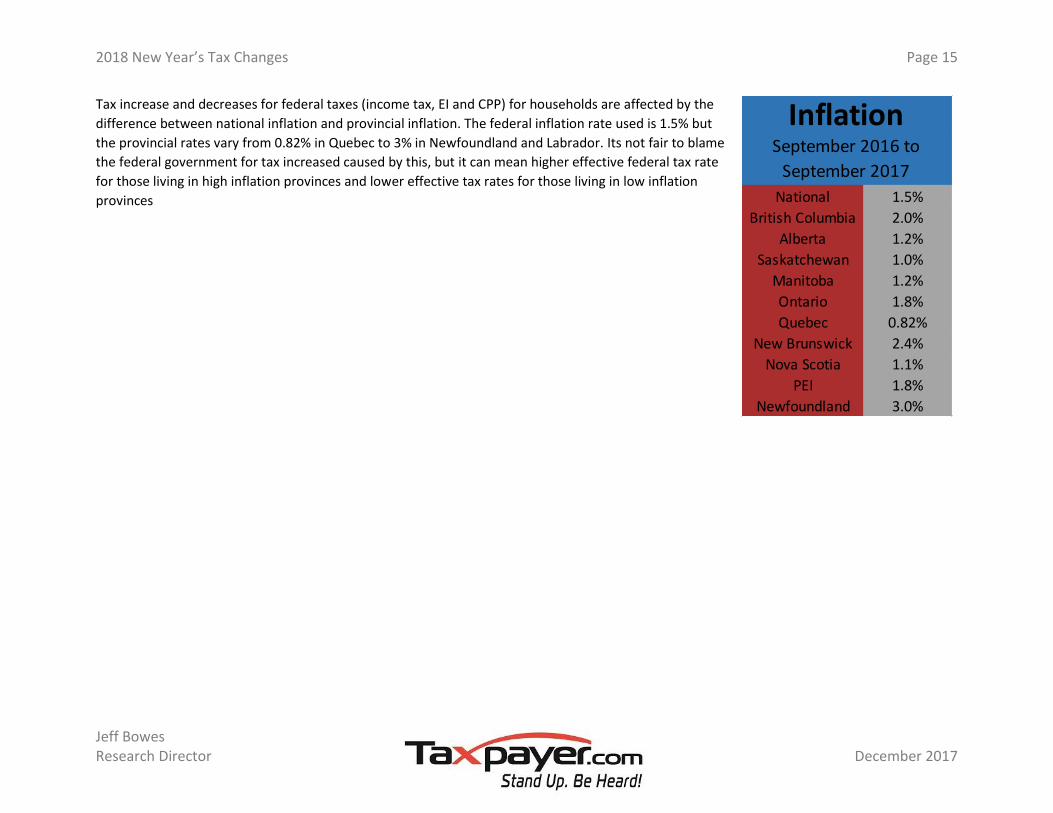
Tax increase and decreases for federal taxes (income tax, EI and CPP) for households are affected by the
difference between national inflation and provincial inflation. The federal inflation rate used is 1.5% but
the provincial rates vary from 0.82% in Quebec to 3% in Newfoundland and Labrador. Its not fair to blame
the federal government for tax increased caused by this, but it can mean higher effective federal tax rate
for those living in high inflation provinces and lower effective tax rates for those living in low inflation
provinces
National 1.5%
British Columbia 2.0%
Alberta 1.2%
Saskatchewan 1.0%
Manitoba 1.2%
Ontario 1.8%
Quebec 0.82%
New Brunswick 2.4%
Nova Scotia 1.1%
PEI 1.8%
Newfoundland 3.0%
September 2016 to
September 2017
Inflation
2018 New Year’s Tax Changes Page 16
Jeff Bowes Research Director December 2017
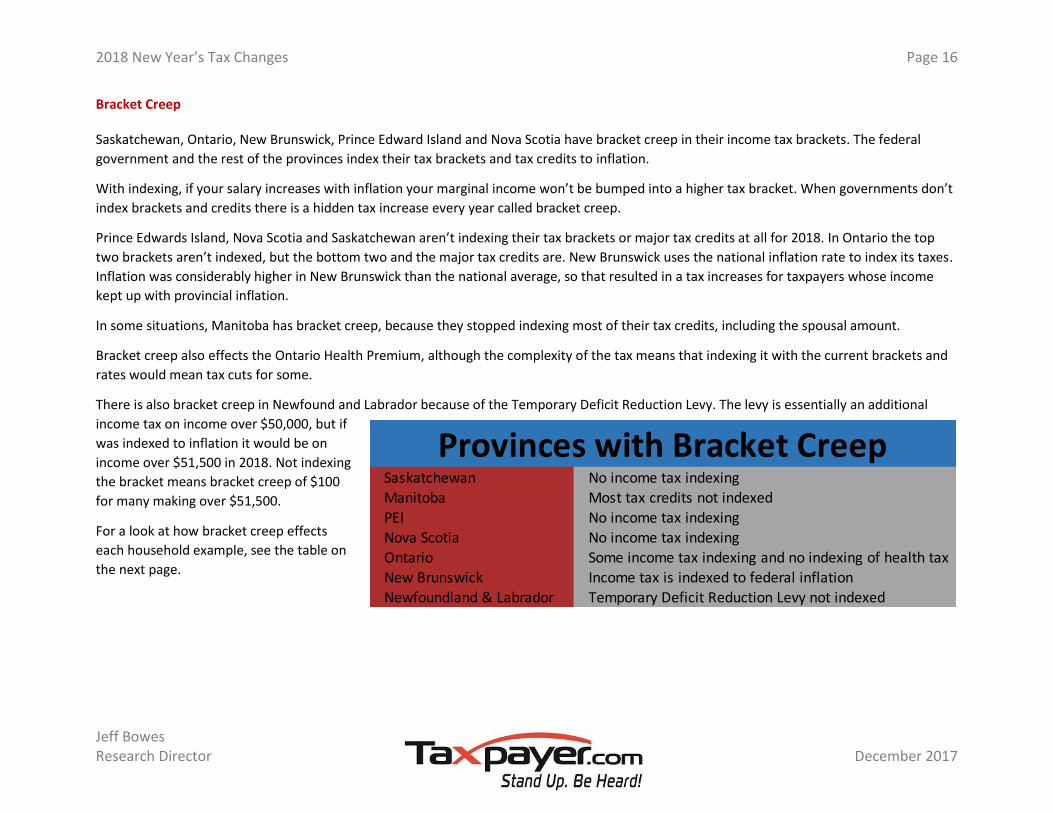
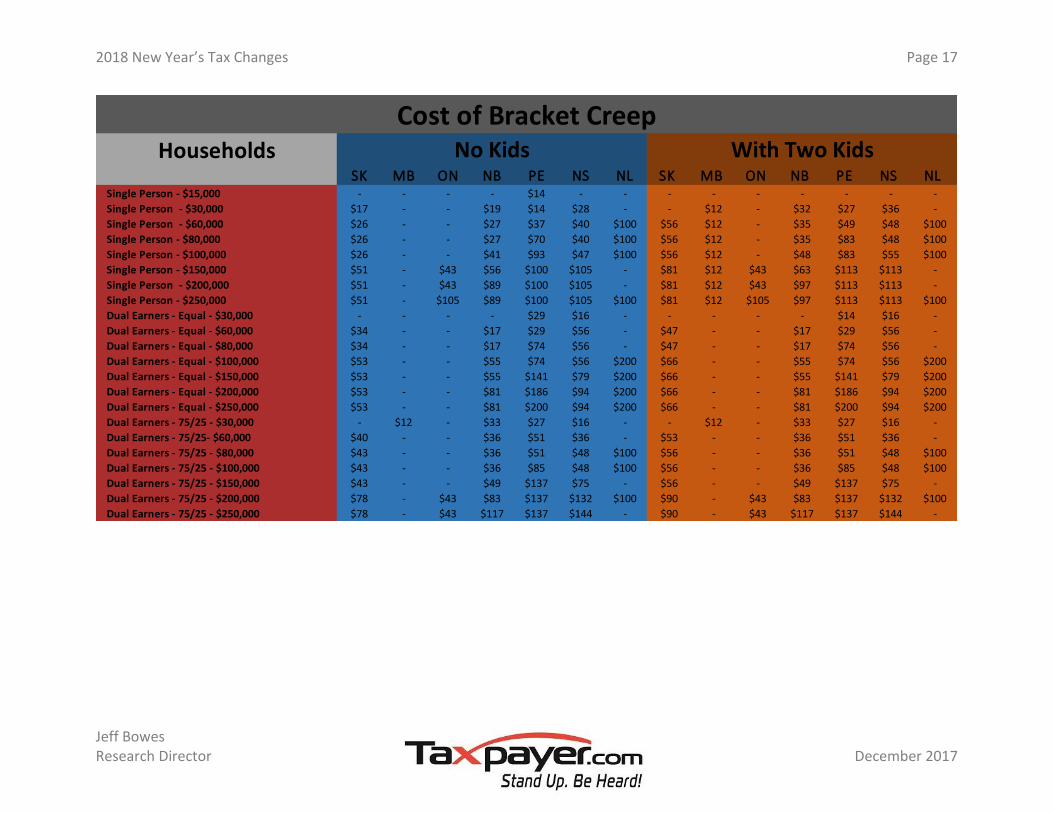
Bracket Creep
Saskatchewan, Ontario, New Brunswick, Prince Edward Island and Nova Scotia have bracket creep in their income tax brackets. The federal
government and the rest of the provinces index their tax brackets and tax credits to inflation.
With indexing, if your salary increases with inflation your marginal income won’t be bumped into a higher tax bracket. When governments don’t
index brackets and credits there is a hidden tax increase every year called bracket creep.
Prince Edwards Island, Nova Scotia and Saskatchewan aren’t indexing their tax brackets or major tax credits at all for 2018. In Ontario the top
two brackets aren’t indexed, but the bottom two and the major tax credits are. New Brunswick uses the national inflation rate to index its taxes.
Inflation was considerably higher in New Brunswick than the national average, so that resulted in a tax increases for taxpayers whose income
kept up with provincial inflation.
In some situations, Manitoba has bracket creep, because they stopped indexing most of their tax credits, including the spousal amount.
Bracket creep also effects the Ontario Health Premium, although the complexity of the tax means that indexing it with the current brackets and
rates would mean tax cuts for some.
There is also bracket creep in Newfound and Labrador because of the Temporary Deficit Reduction Levy. The levy is essentially an additional
income tax on income over $50,000, but if
was indexed to inflation it would be on
income over $51,500 in 2018. Not indexing
the bracket means bracket creep of $100
for many making over $51,500.
For a look at how bracket creep effects
each household example, see the table on
the next page.
Saskatchewan No income tax indexingManitoba Most tax credits not indexed
PEI No income tax indexingNova Scotia No income tax indexingOntario Some income tax indexing and no indexing of health tax New Brunswick Income tax is indexed to federal inflationNewfoundland & Labrador Temporary Deficit Reduction Levy not indexed
Provinces with Bracket Creep
2018 New Year’s Tax Changes Page 17
Jeff Bowes Research Director December 2017
Households SK MB ON NB PE NS NL SK MB ON NB PE NS NL
Single Person - $15,000 - - - - $14 - - - - - - - - -
Single Person - $30,000 $17 - - $19 $14 $28 - - $12 - $32 $27 $36 -
Single Person - $60,000 $26 - - $27 $37 $40 $100 $56 $12 - $35 $49 $48 $100
Single Person - $80,000 $26 - - $27 $70 $40 $100 $56 $12 - $35 $83 $48 $100
Single Person - $100,000 $26 - - $41 $93 $47 $100 $56 $12 - $48 $83 $55 $100
Single Person - $150,000 $51 - $43 $56 $100 $105 - $81 $12 $43 $63 $113 $113 -
Single Person - $200,000 $51 - $43 $89 $100 $105 - $81 $12 $43 $97 $113 $113 -
Single Person - $250,000 $51 - $105 $89 $100 $105 $100 $81 $12 $105 $97 $113 $113 $100
Dual Earners - Equal - $30,000 - - - - $29 $16 - - - - - $14 $16 -
Dual Earners - Equal - $60,000 $34 - - $17 $29 $56 - $47 - - $17 $29 $56 -
Dual Earners - Equal - $80,000 $34 - - $17 $74 $56 - $47 - - $17 $74 $56 -
Dual Earners - Equal - $100,000 $53 - - $55 $74 $56 $200 $66 - - $55 $74 $56 $200
Dual Earners - Equal - $150,000 $53 - - $55 $141 $79 $200 $66 - - $55 $141 $79 $200
Dual Earners - Equal - $200,000 $53 - - $81 $186 $94 $200 $66 - - $81 $186 $94 $200
Dual Earners - Equal - $250,000 $53 - - $81 $200 $94 $200 $66 - - $81 $200 $94 $200
Dual Earners - 75/25 - $30,000 - $12 - $33 $27 $16 - - $12 - $33 $27 $16 -
Dual Earners - 75/25- $60,000 $40 - - $36 $51 $36 - $53 - - $36 $51 $36 -
Dual Earners - 75/25 - $80,000 $43 - - $36 $51 $48 $100 $56 - - $36 $51 $48 $100
Dual Earners - 75/25 - $100,000 $43 - - $36 $85 $48 $100 $56 - - $36 $85 $48 $100
Dual Earners - 75/25 - $150,000 $43 - - $49 $137 $75 - $56 - - $49 $137 $75 -
Dual Earners - 75/25 - $200,000 $78 - $43 $83 $137 $132 $100 $90 - $43 $83 $137 $132 $100
Dual Earners - 75/25 - $250,000 $78 - $43 $117 $137 $144 - $90 - $43 $117 $137 $144 -
No Kids With Two Kids
Cost of Bracket Creep
2018 New Year’s Tax Changes Page 18
Jeff Bowes Research Director December 2017
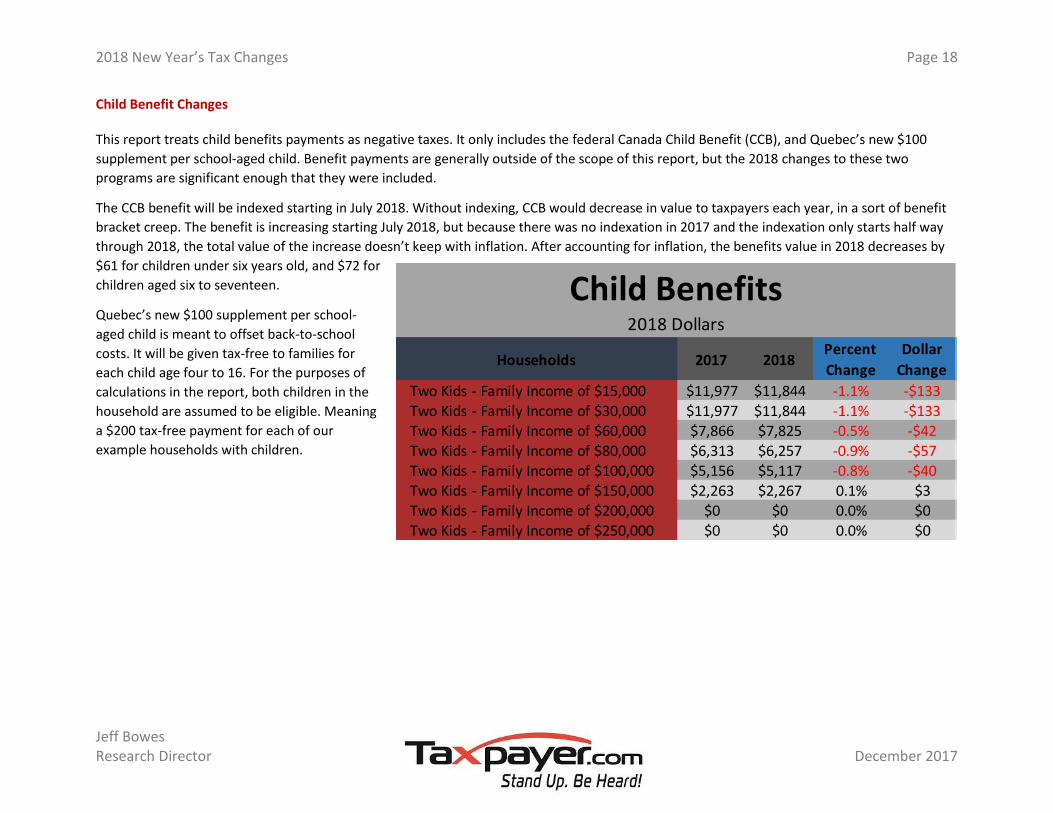
Child Benefit Changes
This report treats child benefits payments as negative taxes. It only includes the federal Canada Child Benefit (CCB), and Quebec’s new $100
supplement per school-aged child. Benefit payments are generally outside of the scope of this report, but the 2018 changes to these two
programs are significant enough that they were included.
The CCB benefit will be indexed starting in July 2018. Without indexing, CCB would decrease in value to taxpayers each year, in a sort of benefit
bracket creep. The benefit is increasing starting July 2018, but because there was no indexation in 2017 and the indexation only starts half way
through 2018, the total value of the increase doesn’t keep with inflation. After accounting for inflation, the benefits value in 2018 decreases by
$61 for children under six years old, and $72 for
children aged six to seventeen.
Quebec’s new $100 supplement per school-
aged child is meant to offset back-to-school
costs. It will be given tax-free to families for
each child age four to 16. For the purposes of
calculations in the report, both children in the
household are assumed to be eligible. Meaning
a $200 tax-free payment for each of our
example households with children.
Households 2017 2018Percent
Change
Dollar
Change
Two Kids - Family Income of $15,000 $11,977 $11,844 -1.1% -$133
Two Kids - Family Income of $30,000 $11,977 $11,844 -1.1% -$133Two Kids - Family Income of $60,000 $7,866 $7,825 -0.5% -$42Two Kids - Family Income of $80,000 $6,313 $6,257 -0.9% -$57Two Kids - Family Income of $100,000 $5,156 $5,117 -0.8% -$40Two Kids - Family Income of $150,000 $2,263 $2,267 0.1% $3Two Kids - Family Income of $200,000 $0 $0 0.0% $0Two Kids - Family Income of $250,000 $0 $0 0.0% $0
Child Benefits2018 Dollars
2018 New Year’s Tax Changes Page 19
Jeff Bowes Research Director December 2017
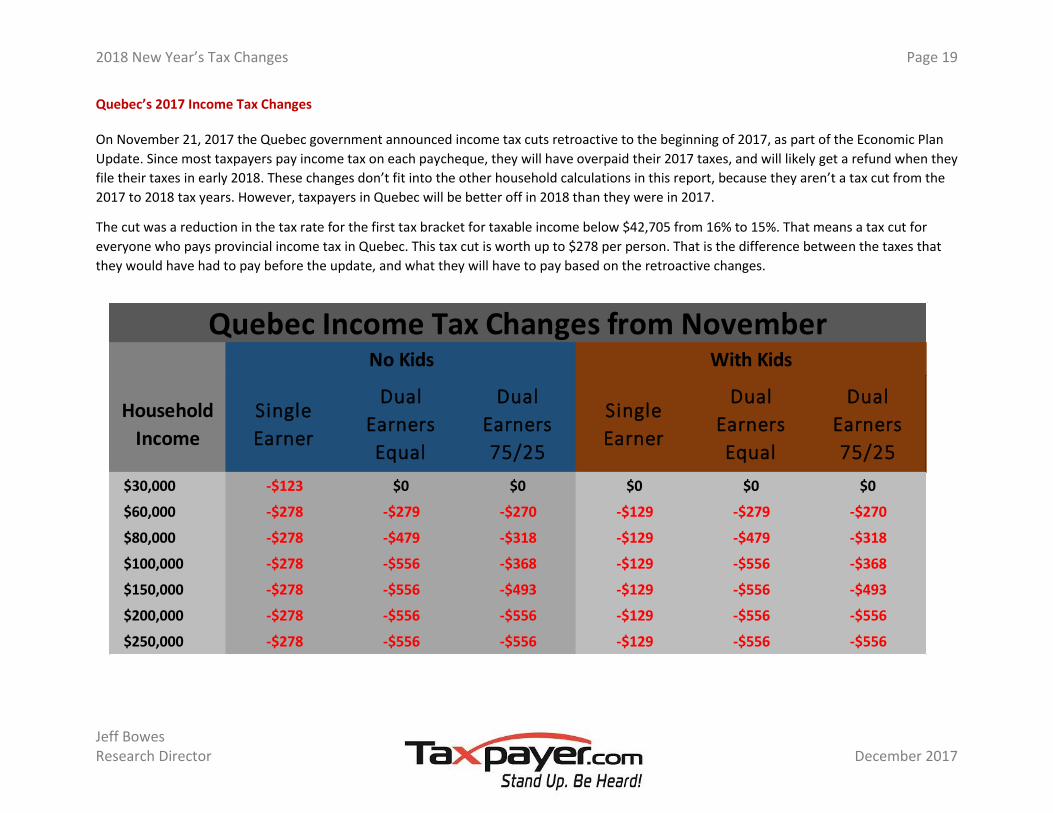
Quebec’s 2017 Income Tax Changes
On November 21, 2017 the Quebec government announced income tax cuts retroactive to the beginning of 2017, as part of the Economic Plan
Update. Since most taxpayers pay income tax on each paycheque, they will have overpaid their 2017 taxes, and will likely get a refund when they
file their taxes in early 2018. These changes don’t fit into the other household calculations in this report, because they aren’t a tax cut from the
2017 to 2018 tax years. However, taxpayers in Quebec will be better off in 2018 than they were in 2017.
The cut was a reduction in the tax rate for the first tax bracket for taxable income below $42,705 from 16% to 15%. That means a tax cut for
everyone who pays provincial income tax in Quebec. This tax cut is worth up to $278 per person. That is the difference between the taxes that
they would have had to pay before the update, and what they will have to pay based on the retroactive changes.
Household
Income
Single
Earner
Dual
Earners
Equal
Dual
Earners
75/25
Single
Earner
Dual
Earners
Equal
Dual
Earners
75/25
$30,000 -$123 $0 $0 $0 $0 $0
$60,000 -$278 -$279 -$270 -$129 -$279 -$270
$80,000 -$278 -$479 -$318 -$129 -$479 -$318
$100,000 -$278 -$556 -$368 -$129 -$556 -$368
$150,000 -$278 -$556 -$493 -$129 -$556 -$493
$200,000 -$278 -$556 -$556 -$129 -$556 -$556
$250,000 -$278 -$556 -$556 -$129 -$556 -$556
Quebec Income Tax Changes from NovemberNo Kids With Kids
2018 New Year’s Tax Changes Page 20
Jeff Bowes Research Director December 2017
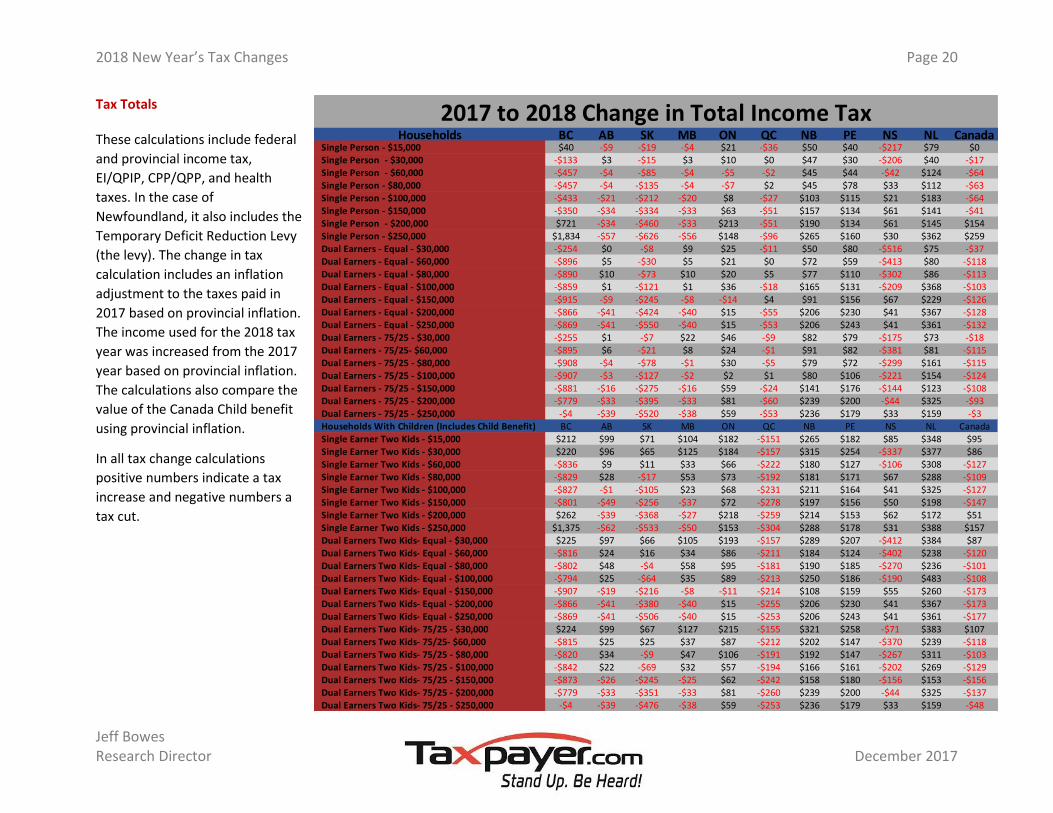
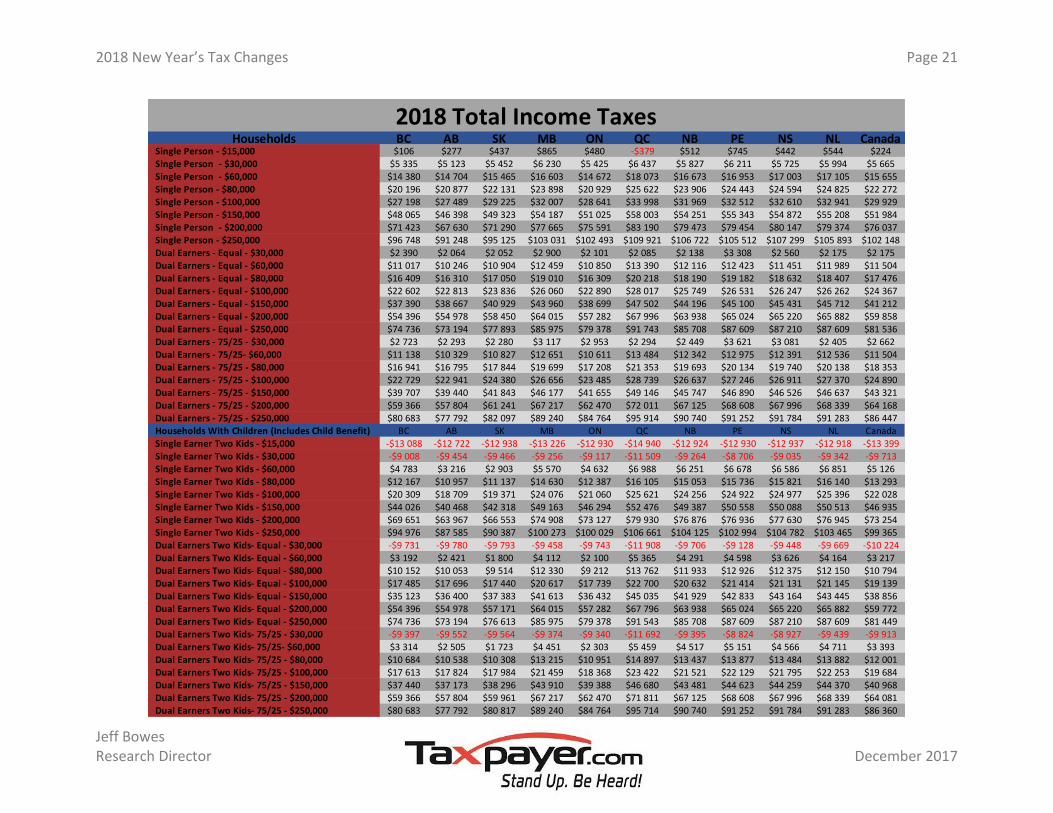
Tax Totals
These calculations include federal
and provincial income tax,
EI/QPIP, CPP/QPP, and health
taxes. In the case of
Newfoundland, it also includes the
Temporary Deficit Reduction Levy
(the levy). The change in tax
calculation includes an inflation
adjustment to the taxes paid in
2017 based on provincial inflation.
The income used for the 2018 tax
year was increased from the 2017
year based on provincial inflation.
The calculations also compare the
value of the Canada Child benefit
using provincial inflation.
In all tax change calculations
positive numbers indicate a tax
increase and negative numbers a
tax cut.
Households BC AB SK MB ON QC NB PE NS NL CanadaSingle Person - $15,000 $40 -$9 -$19 -$4 $21 -$36 $50 $40 -$217 $79 $0Single Person - $30,000 -$133 $3 -$15 $3 $10 $0 $47 $30 -$206 $40 -$17Single Person - $60,000 -$457 -$4 -$85 -$4 -$5 -$2 $45 $44 -$42 $124 -$64Single Person - $80,000 -$457 -$4 -$135 -$4 -$7 $2 $45 $78 $33 $112 -$63Single Person - $100,000 -$433 -$21 -$212 -$20 $8 -$27 $103 $115 $21 $183 -$64Single Person - $150,000 -$350 -$34 -$334 -$33 $63 -$51 $157 $134 $61 $141 -$41Single Person - $200,000 $721 -$34 -$460 -$33 $213 -$51 $190 $134 $61 $145 $154Single Person - $250,000 $1,834 -$57 -$626 -$56 $148 -$96 $265 $160 $30 $362 $259Dual Earners - Equal - $30,000 -$254 $0 -$8 $9 $25 -$11 $50 $80 -$516 $75 -$37Dual Earners - Equal - $60,000 -$896 $5 -$30 $5 $21 $0 $72 $59 -$413 $80 -$118Dual Earners - Equal - $80,000 -$890 $10 -$73 $10 $20 $5 $77 $110 -$302 $86 -$113Dual Earners - Equal - $100,000 -$859 $1 -$121 $1 $36 -$18 $165 $131 -$209 $368 -$103Dual Earners - Equal - $150,000 -$915 -$9 -$245 -$8 -$14 $4 $91 $156 $67 $229 -$126Dual Earners - Equal - $200,000 -$866 -$41 -$424 -$40 $15 -$55 $206 $230 $41 $367 -$128Dual Earners - Equal - $250,000 -$869 -$41 -$550 -$40 $15 -$53 $206 $243 $41 $361 -$132Dual Earners - 75/25 - $30,000 -$255 $1 -$7 $22 $46 -$9 $82 $79 -$175 $73 -$18Dual Earners - 75/25- $60,000 -$895 $6 -$21 $8 $24 -$1 $91 $82 -$381 $81 -$115Dual Earners - 75/25 - $80,000 -$908 -$4 -$78 -$1 $30 -$5 $79 $72 -$299 $161 -$115Dual Earners - 75/25 - $100,000 -$907 -$3 -$127 -$2 $2 $1 $80 $106 -$221 $154 -$124Dual Earners - 75/25 - $150,000 -$881 -$16 -$275 -$16 $59 -$24 $141 $176 -$144 $123 -$108Dual Earners - 75/25 - $200,000 -$779 -$33 -$395 -$33 $81 -$60 $239 $200 -$44 $325 -$93Dual Earners - 75/25 - $250,000 -$4 -$39 -$520 -$38 $59 -$53 $236 $179 $33 $159 -$3Households With Children (Includes Child Benefit) BC AB SK MB ON QC NB PE NS NL CanadaSingle Earner Two Kids - $15,000 $212 $99 $71 $104 $182 -$151 $265 $182 $85 $348 $95Single Earner Two Kids - $30,000 $220 $96 $65 $125 $184 -$157 $315 $254 -$337 $377 $86Single Earner Two Kids - $60,000 -$836 $9 $11 $33 $66 -$222 $180 $127 -$106 $308 -$127Single Earner Two Kids - $80,000 -$829 $28 -$17 $53 $73 -$192 $181 $171 $67 $288 -$109Single Earner Two Kids - $100,000 -$827 -$1 -$105 $23 $68 -$231 $211 $164 $41 $325 -$127Single Earner Two Kids - $150,000 -$801 -$49 -$256 -$37 $72 -$278 $197 $156 $50 $198 -$147Single Earner Two Kids - $200,000 $262 -$39 -$368 -$27 $218 -$259 $214 $153 $62 $172 $51Single Earner Two Kids - $250,000 $1,375 -$62 -$533 -$50 $153 -$304 $288 $178 $31 $388 $157Dual Earners Two Kids- Equal - $30,000 $225 $97 $66 $105 $193 -$157 $289 $207 -$412 $384 $87Dual Earners Two Kids- Equal - $60,000 -$816 $24 $16 $34 $86 -$211 $184 $124 -$402 $238 -$120Dual Earners Two Kids- Equal - $80,000 -$802 $48 -$4 $58 $95 -$181 $190 $185 -$270 $236 -$101Dual Earners Two Kids- Equal - $100,000 -$794 $25 -$64 $35 $89 -$213 $250 $186 -$190 $483 -$108Dual Earners Two Kids- Equal - $150,000 -$907 -$19 -$216 -$8 -$11 -$214 $108 $159 $55 $260 -$173Dual Earners Two Kids- Equal - $200,000 -$866 -$41 -$380 -$40 $15 -$255 $206 $230 $41 $367 -$173Dual Earners Two Kids- Equal - $250,000 -$869 -$41 -$506 -$40 $15 -$253 $206 $243 $41 $361 -$177Dual Earners Two Kids- 75/25 - $30,000 $224 $99 $67 $127 $215 -$155 $321 $258 -$71 $383 $107Dual Earners Two Kids- 75/25- $60,000 -$815 $25 $25 $37 $87 -$212 $202 $147 -$370 $239 -$118Dual Earners Two Kids- 75/25 - $80,000 -$820 $34 -$9 $47 $106 -$191 $192 $147 -$267 $311 -$103Dual Earners Two Kids- 75/25 - $100,000 -$842 $22 -$69 $32 $57 -$194 $166 $161 -$202 $269 -$129Dual Earners Two Kids- 75/25 - $150,000 -$873 -$26 -$245 -$25 $62 -$242 $158 $180 -$156 $153 -$156Dual Earners Two Kids- 75/25 - $200,000 -$779 -$33 -$351 -$33 $81 -$260 $239 $200 -$44 $325 -$137Dual Earners Two Kids- 75/25 - $250,000 -$4 -$39 -$476 -$38 $59 -$253 $236 $179 $33 $159 -$48
2017 to 2018 Change in Total Income Tax
2018 New Year’s Tax Changes Page 21
Jeff Bowes Research Director December 2017
Households BC AB SK MB ON QC NB PE NS NL CanadaSingle Person - $15,000 $106 $277 $437 $865 $480 -$379 $512 $745 $442 $544 $224Single Person - $30,000 $5 335 $5 123 $5 452 $6 230 $5 425 $6 437 $5 827 $6 211 $5 725 $5 994 $5 665Single Person - $60,000 $14 380 $14 704 $15 465 $16 603 $14 672 $18 073 $16 673 $16 953 $17 003 $17 105 $15 655Single Person - $80,000 $20 196 $20 877 $22 131 $23 898 $20 929 $25 622 $23 906 $24 443 $24 594 $24 825 $22 272Single Person - $100,000 $27 198 $27 489 $29 225 $32 007 $28 641 $33 998 $31 969 $32 512 $32 610 $32 941 $29 929Single Person - $150,000 $48 065 $46 398 $49 323 $54 187 $51 025 $58 003 $54 251 $55 343 $54 872 $55 208 $51 984Single Person - $200,000 $71 423 $67 630 $71 290 $77 665 $75 591 $83 190 $79 473 $79 454 $80 147 $79 374 $76 037Single Person - $250,000 $96 748 $91 248 $95 125 $103 031 $102 493 $109 921 $106 722 $105 512 $107 299 $105 893 $102 148Dual Earners - Equal - $30,000 $2 390 $2 064 $2 052 $2 900 $2 101 $2 085 $2 138 $3 308 $2 560 $2 175 $2 175Dual Earners - Equal - $60,000 $11 017 $10 246 $10 904 $12 459 $10 850 $13 390 $12 116 $12 423 $11 451 $11 989 $11 504Dual Earners - Equal - $80,000 $16 409 $16 310 $17 050 $19 010 $16 309 $20 218 $18 190 $19 182 $18 632 $18 407 $17 476Dual Earners - Equal - $100,000 $22 602 $22 813 $23 836 $26 060 $22 890 $28 017 $25 749 $26 531 $26 247 $26 262 $24 367Dual Earners - Equal - $150,000 $37 390 $38 667 $40 929 $43 960 $38 699 $47 502 $44 196 $45 100 $45 431 $45 712 $41 212Dual Earners - Equal - $200,000 $54 396 $54 978 $58 450 $64 015 $57 282 $67 996 $63 938 $65 024 $65 220 $65 882 $59 858Dual Earners - Equal - $250,000 $74 736 $73 194 $77 893 $85 975 $79 378 $91 743 $85 708 $87 609 $87 210 $87 609 $81 536Dual Earners - 75/25 - $30,000 $2 723 $2 293 $2 280 $3 117 $2 953 $2 294 $2 449 $3 621 $3 081 $2 405 $2 662Dual Earners - 75/25- $60,000 $11 138 $10 329 $10 827 $12 651 $10 611 $13 484 $12 342 $12 975 $12 391 $12 536 $11 504Dual Earners - 75/25 - $80,000 $16 941 $16 795 $17 844 $19 699 $17 208 $21 353 $19 693 $20 134 $19 740 $20 138 $18 353Dual Earners - 75/25 - $100,000 $22 729 $22 941 $24 380 $26 656 $23 485 $28 739 $26 637 $27 246 $26 911 $27 370 $24 890Dual Earners - 75/25 - $150,000 $39 707 $39 440 $41 843 $46 177 $41 655 $49 146 $45 747 $46 890 $46 526 $46 637 $43 321Dual Earners - 75/25 - $200,000 $59 366 $57 804 $61 241 $67 217 $62 470 $72 011 $67 125 $68 608 $67 996 $68 339 $64 168Dual Earners - 75/25 - $250,000 $80 683 $77 792 $82 097 $89 240 $84 764 $95 914 $90 740 $91 252 $91 784 $91 283 $86 447Households With Children (Includes Child Benefit) BC AB SK MB ON QC NB PE NS NL CanadaSingle Earner Two Kids - $15,000 -$13 088 -$12 722 -$12 938 -$13 226 -$12 930 -$14 940 -$12 924 -$12 930 -$12 937 -$12 918 -$13 399Single Earner Two Kids - $30,000 -$9 008 -$9 454 -$9 466 -$9 256 -$9 117 -$11 509 -$9 264 -$8 706 -$9 035 -$9 342 -$9 713Single Earner Two Kids - $60,000 $4 783 $3 216 $2 903 $5 570 $4 632 $6 988 $6 251 $6 678 $6 586 $6 851 $5 126Single Earner Two Kids - $80,000 $12 167 $10 957 $11 137 $14 630 $12 387 $16 105 $15 053 $15 736 $15 821 $16 140 $13 293Single Earner Two Kids - $100,000 $20 309 $18 709 $19 371 $24 076 $21 060 $25 621 $24 256 $24 922 $24 977 $25 396 $22 028Single Earner Two Kids - $150,000 $44 026 $40 468 $42 318 $49 163 $46 294 $52 476 $49 387 $50 558 $50 088 $50 513 $46 935Single Earner Two Kids - $200,000 $69 651 $63 967 $66 553 $74 908 $73 127 $79 930 $76 876 $76 936 $77 630 $76 945 $73 254Single Earner Two Kids - $250,000 $94 976 $87 585 $90 387 $100 273 $100 029 $106 661 $104 125 $102 994 $104 782 $103 465 $99 365Dual Earners Two Kids- Equal - $30,000 -$9 731 -$9 780 -$9 793 -$9 458 -$9 743 -$11 908 -$9 706 -$9 128 -$9 448 -$9 669 -$10 224Dual Earners Two Kids- Equal - $60,000 $3 192 $2 421 $1 800 $4 112 $2 100 $5 365 $4 291 $4 598 $3 626 $4 164 $3 217Dual Earners Two Kids- Equal - $80,000 $10 152 $10 053 $9 514 $12 330 $9 212 $13 762 $11 933 $12 926 $12 375 $12 150 $10 794Dual Earners Two Kids- Equal - $100,000 $17 485 $17 696 $17 440 $20 617 $17 739 $22 700 $20 632 $21 414 $21 131 $21 145 $19 139Dual Earners Two Kids- Equal - $150,000 $35 123 $36 400 $37 383 $41 613 $36 432 $45 035 $41 929 $42 833 $43 164 $43 445 $38 856Dual Earners Two Kids- Equal - $200,000 $54 396 $54 978 $57 171 $64 015 $57 282 $67 796 $63 938 $65 024 $65 220 $65 882 $59 772Dual Earners Two Kids- Equal - $250,000 $74 736 $73 194 $76 613 $85 975 $79 378 $91 543 $85 708 $87 609 $87 210 $87 609 $81 449Dual Earners Two Kids- 75/25 - $30,000 -$9 397 -$9 552 -$9 564 -$9 374 -$9 340 -$11 692 -$9 395 -$8 824 -$8 927 -$9 439 -$9 913Dual Earners Two Kids- 75/25- $60,000 $3 314 $2 505 $1 723 $4 451 $2 303 $5 459 $4 517 $5 151 $4 566 $4 711 $3 393Dual Earners Two Kids- 75/25 - $80,000 $10 684 $10 538 $10 308 $13 215 $10 951 $14 897 $13 437 $13 877 $13 484 $13 882 $12 001Dual Earners Two Kids- 75/25 - $100,000 $17 613 $17 824 $17 984 $21 459 $18 368 $23 422 $21 521 $22 129 $21 795 $22 253 $19 684Dual Earners Two Kids- 75/25 - $150,000 $37 440 $37 173 $38 296 $43 910 $39 388 $46 680 $43 481 $44 623 $44 259 $44 370 $40 968Dual Earners Two Kids- 75/25 - $200,000 $59 366 $57 804 $59 961 $67 217 $62 470 $71 811 $67 125 $68 608 $67 996 $68 339 $64 081Dual Earners Two Kids- 75/25 - $250,000 $80 683 $77 792 $80 817 $89 240 $84 764 $95 714 $90 740 $91 252 $91 784 $91 283 $86 360
2018 Total Income Taxes
2018 New Year’s Tax Changes Page 22
Jeff Bowes Research Director December 2017
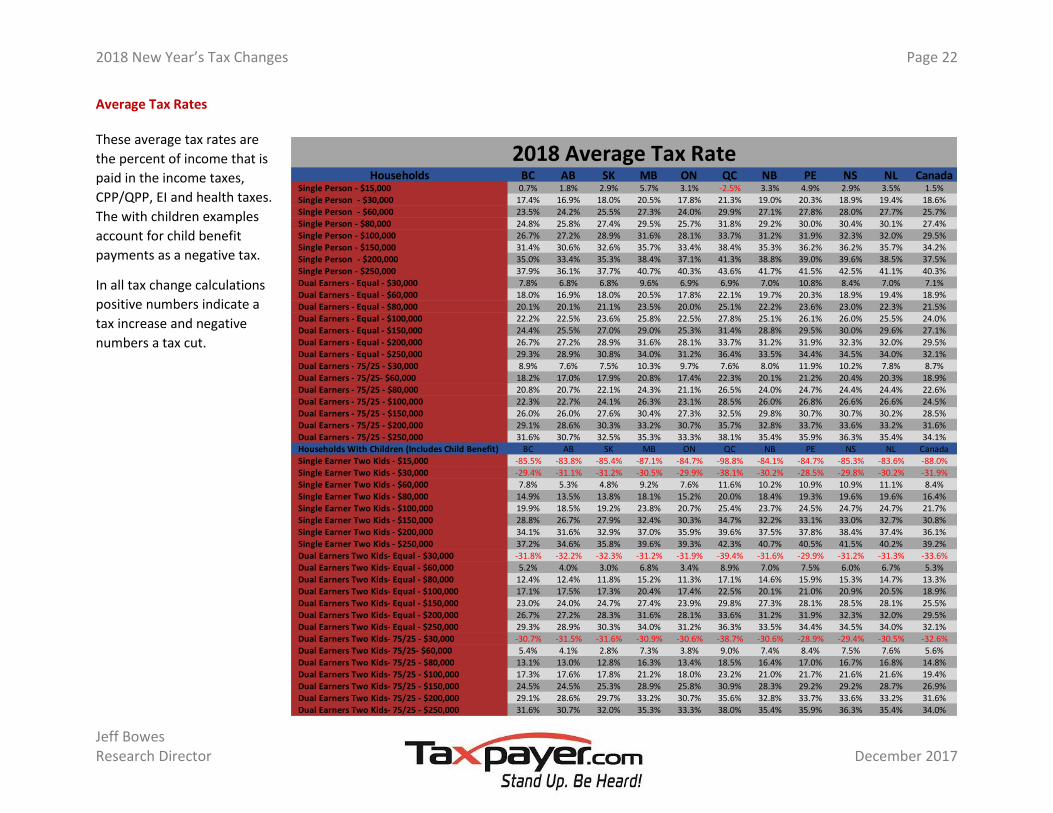
Average Tax Rates
These average tax rates are
the percent of income that is
paid in the income taxes,
CPP/QPP, EI and health taxes.
The with children examples
account for child benefit
payments as a negative tax.
In all tax change calculations
positive numbers indicate a
tax increase and negative
numbers a tax cut.
Households BC AB SK MB ON QC NB PE NS NL CanadaSingle Person - $15,000 0.7% 1.8% 2.9% 5.7% 3.1% -2.5% 3.3% 4.9% 2.9% 3.5% 1.5%Single Person - $30,000 17.4% 16.9% 18.0% 20.5% 17.8% 21.3% 19.0% 20.3% 18.9% 19.4% 18.6%Single Person - $60,000 23.5% 24.2% 25.5% 27.3% 24.0% 29.9% 27.1% 27.8% 28.0% 27.7% 25.7%Single Person - $80,000 24.8% 25.8% 27.4% 29.5% 25.7% 31.8% 29.2% 30.0% 30.4% 30.1% 27.4%Single Person - $100,000 26.7% 27.2% 28.9% 31.6% 28.1% 33.7% 31.2% 31.9% 32.3% 32.0% 29.5%Single Person - $150,000 31.4% 30.6% 32.6% 35.7% 33.4% 38.4% 35.3% 36.2% 36.2% 35.7% 34.2%Single Person - $200,000 35.0% 33.4% 35.3% 38.4% 37.1% 41.3% 38.8% 39.0% 39.6% 38.5% 37.5%Single Person - $250,000 37.9% 36.1% 37.7% 40.7% 40.3% 43.6% 41.7% 41.5% 42.5% 41.1% 40.3%Dual Earners - Equal - $30,000 7.8% 6.8% 6.8% 9.6% 6.9% 6.9% 7.0% 10.8% 8.4% 7.0% 7.1%Dual Earners - Equal - $60,000 18.0% 16.9% 18.0% 20.5% 17.8% 22.1% 19.7% 20.3% 18.9% 19.4% 18.9%Dual Earners - Equal - $80,000 20.1% 20.1% 21.1% 23.5% 20.0% 25.1% 22.2% 23.6% 23.0% 22.3% 21.5%Dual Earners - Equal - $100,000 22.2% 22.5% 23.6% 25.8% 22.5% 27.8% 25.1% 26.1% 26.0% 25.5% 24.0%Dual Earners - Equal - $150,000 24.4% 25.5% 27.0% 29.0% 25.3% 31.4% 28.8% 29.5% 30.0% 29.6% 27.1%Dual Earners - Equal - $200,000 26.7% 27.2% 28.9% 31.6% 28.1% 33.7% 31.2% 31.9% 32.3% 32.0% 29.5%Dual Earners - Equal - $250,000 29.3% 28.9% 30.8% 34.0% 31.2% 36.4% 33.5% 34.4% 34.5% 34.0% 32.1%Dual Earners - 75/25 - $30,000 8.9% 7.6% 7.5% 10.3% 9.7% 7.6% 8.0% 11.9% 10.2% 7.8% 8.7%Dual Earners - 75/25- $60,000 18.2% 17.0% 17.9% 20.8% 17.4% 22.3% 20.1% 21.2% 20.4% 20.3% 18.9%Dual Earners - 75/25 - $80,000 20.8% 20.7% 22.1% 24.3% 21.1% 26.5% 24.0% 24.7% 24.4% 24.4% 22.6%Dual Earners - 75/25 - $100,000 22.3% 22.7% 24.1% 26.3% 23.1% 28.5% 26.0% 26.8% 26.6% 26.6% 24.5%Dual Earners - 75/25 - $150,000 26.0% 26.0% 27.6% 30.4% 27.3% 32.5% 29.8% 30.7% 30.7% 30.2% 28.5%Dual Earners - 75/25 - $200,000 29.1% 28.6% 30.3% 33.2% 30.7% 35.7% 32.8% 33.7% 33.6% 33.2% 31.6%Dual Earners - 75/25 - $250,000 31.6% 30.7% 32.5% 35.3% 33.3% 38.1% 35.4% 35.9% 36.3% 35.4% 34.1%Households With Children (Includes Child Benefit) BC AB SK MB ON QC NB PE NS NL CanadaSingle Earner Two Kids - $15,000 -85.5% -83.8% -85.4% -87.1% -84.7% -98.8% -84.1% -84.7% -85.3% -83.6% -88.0%Single Earner Two Kids - $30,000 -29.4% -31.1% -31.2% -30.5% -29.9% -38.1% -30.2% -28.5% -29.8% -30.2% -31.9%Single Earner Two Kids - $60,000 7.8% 5.3% 4.8% 9.2% 7.6% 11.6% 10.2% 10.9% 10.9% 11.1% 8.4%Single Earner Two Kids - $80,000 14.9% 13.5% 13.8% 18.1% 15.2% 20.0% 18.4% 19.3% 19.6% 19.6% 16.4%Single Earner Two Kids - $100,000 19.9% 18.5% 19.2% 23.8% 20.7% 25.4% 23.7% 24.5% 24.7% 24.7% 21.7%Single Earner Two Kids - $150,000 28.8% 26.7% 27.9% 32.4% 30.3% 34.7% 32.2% 33.1% 33.0% 32.7% 30.8%Single Earner Two Kids - $200,000 34.1% 31.6% 32.9% 37.0% 35.9% 39.6% 37.5% 37.8% 38.4% 37.4% 36.1%Single Earner Two Kids - $250,000 37.2% 34.6% 35.8% 39.6% 39.3% 42.3% 40.7% 40.5% 41.5% 40.2% 39.2%Dual Earners Two Kids- Equal - $30,000 -31.8% -32.2% -32.3% -31.2% -31.9% -39.4% -31.6% -29.9% -31.2% -31.3% -33.6%Dual Earners Two Kids- Equal - $60,000 5.2% 4.0% 3.0% 6.8% 3.4% 8.9% 7.0% 7.5% 6.0% 6.7% 5.3%Dual Earners Two Kids- Equal - $80,000 12.4% 12.4% 11.8% 15.2% 11.3% 17.1% 14.6% 15.9% 15.3% 14.7% 13.3%Dual Earners Two Kids- Equal - $100,000 17.1% 17.5% 17.3% 20.4% 17.4% 22.5% 20.1% 21.0% 20.9% 20.5% 18.9%Dual Earners Two Kids- Equal - $150,000 23.0% 24.0% 24.7% 27.4% 23.9% 29.8% 27.3% 28.1% 28.5% 28.1% 25.5%Dual Earners Two Kids- Equal - $200,000 26.7% 27.2% 28.3% 31.6% 28.1% 33.6% 31.2% 31.9% 32.3% 32.0% 29.5%Dual Earners Two Kids- Equal - $250,000 29.3% 28.9% 30.3% 34.0% 31.2% 36.3% 33.5% 34.4% 34.5% 34.0% 32.1%Dual Earners Two Kids- 75/25 - $30,000 -30.7% -31.5% -31.6% -30.9% -30.6% -38.7% -30.6% -28.9% -29.4% -30.5% -32.6%Dual Earners Two Kids- 75/25- $60,000 5.4% 4.1% 2.8% 7.3% 3.8% 9.0% 7.4% 8.4% 7.5% 7.6% 5.6%Dual Earners Two Kids- 75/25 - $80,000 13.1% 13.0% 12.8% 16.3% 13.4% 18.5% 16.4% 17.0% 16.7% 16.8% 14.8%Dual Earners Two Kids- 75/25 - $100,000 17.3% 17.6% 17.8% 21.2% 18.0% 23.2% 21.0% 21.7% 21.6% 21.6% 19.4%Dual Earners Two Kids- 75/25 - $150,000 24.5% 24.5% 25.3% 28.9% 25.8% 30.9% 28.3% 29.2% 29.2% 28.7% 26.9%Dual Earners Two Kids- 75/25 - $200,000 29.1% 28.6% 29.7% 33.2% 30.7% 35.6% 32.8% 33.7% 33.6% 33.2% 31.6%Dual Earners Two Kids- 75/25 - $250,000 31.6% 30.7% 32.0% 35.3% 33.3% 38.0% 35.4% 35.9% 36.3% 35.4% 34.0%
2018 Average Tax Rate
2018 New Year’s Tax Changes Page 23
Jeff Bowes Research Director December 2017
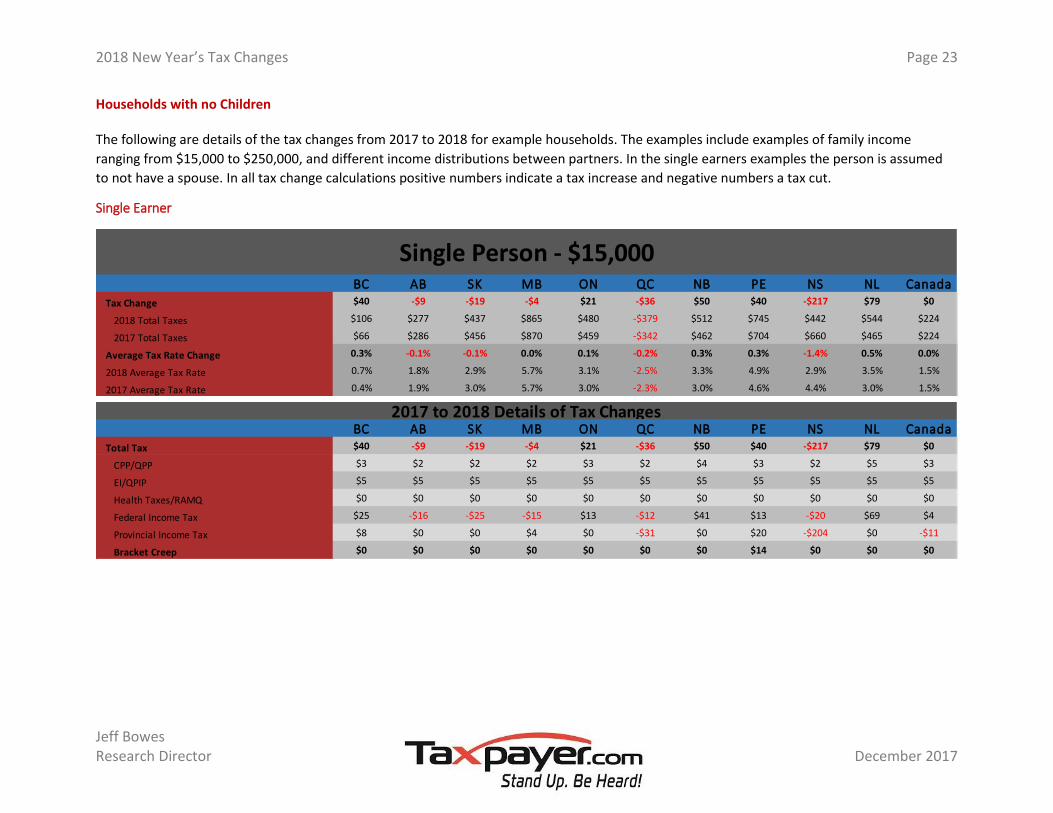
Households with no Children
The following are details of the tax changes from 2017 to 2018 for example households. The examples include examples of family income
ranging from $15,000 to $250,000, and different income distributions between partners. In the single earners examples the person is assumed
to not have a spouse. In all tax change calculations positive numbers indicate a tax increase and negative numbers a tax cut.
Single Earner
BC AB SK MB ON QC NB PE NS NL Canada
Tax Change $40 -$9 -$19 -$4 $21 -$36 $50 $40 -$217 $79 $0
2018 Total Taxes $106 $277 $437 $865 $480 -$379 $512 $745 $442 $544 $224
2017 Total Taxes $66 $286 $456 $870 $459 -$342 $462 $704 $660 $465 $224
Average Tax Rate Change 0.3% -0.1% -0.1% 0.0% 0.1% -0.2% 0.3% 0.3% -1.4% 0.5% 0.0%
2018 Average Tax Rate 0.7% 1.8% 2.9% 5.7% 3.1% -2.5% 3.3% 4.9% 2.9% 3.5% 1.5%
2017 Average Tax Rate 0.4% 1.9% 3.0% 5.7% 3.0% -2.3% 3.0% 4.6% 4.4% 3.0% 1.5%
BC AB SK MB ON QC NB PE NS NL Canada
Total Tax $40 -$9 -$19 -$4 $21 -$36 $50 $40 -$217 $79 $0
CPP/QPP $3 $2 $2 $2 $3 $2 $4 $3 $2 $5 $3
EI/QPIP $5 $5 $5 $5 $5 $5 $5 $5 $5 $5 $5
Health Taxes/RAMQ $0 $0 $0 $0 $0 $0 $0 $0 $0 $0 $0
Federal Income Tax $25 -$16 -$25 -$15 $13 -$12 $41 $13 -$20 $69 $4
Provincial Income Tax $8 $0 $0 $4 $0 -$31 $0 $20 -$204 $0 -$11
Bracket Creep $0 $0 $0 $0 $0 $0 $0 $14 $0 $0 $0
Single Person - $15,000
2017 to 2018 Details of Tax Changes

2018 New Year’s Tax Changes Page 24
Jeff Bowes Research Director December 2017
BC AB SK MB ON QC NB PE NS NL Canada
Tax Change -$133 $3 -$15 $3 $10 $0 $47 $30 -$206 $40 -$17
2018 Total Taxes $5,335 $5,123 $5,452 $6,230 $5,425 $6,437 $5,827 $6,211 $5,725 $5,994 $5,665
2017 Total Taxes $5,467 $5,120 $5,467 $6,227 $5,415 $6,437 $5,780 $6,182 $5,932 $5,954 $5,682
Average Tax Rate Change -0.4% 0.0% 0.0% 0.0% 0.0% 0.0% 0.2% 0.1% -0.7% 0.1% -0.1%
2018 Average Tax Rate 17.4% 16.9% 18.0% 20.5% 17.8% 21.3% 19.0% 20.3% 18.9% 19.4% 18.6%
2017 Average Tax Rate 17.9% 16.9% 18.0% 20.5% 17.7% 21.3% 18.8% 20.2% 19.6% 19.3% 18.7%
BC AB SK MB ON QC NB PE NS NL Canada
Total Tax -$133 $3 -$15 $3 $10 $0 $47 $30 -$206 $40 -$17
CPP/QPP $3 $2 $2 $2 $3 $2 $4 $3 $2 $5 $3
EI/QPIP $9 $9 $9 $9 $9 $9 $9 $9 $9 $9 $9
Health Taxes/RAMQ -$152 $0 $0 $0 -$5 $1 $0 $0 $0 $0 -$22
Federal Income Tax $8 -$7 -$11 -$7 $4 -$12 $15 $4 -$9 $27 -$1
Provincial Income Tax -$1 -$1 -$15 -$1 -$1 $0 $18 $13 -$208 -$1 -$6
Bracket Creep $0 $0 $17 $0 -$5 $0 $19 $14 $28 $0 $0
Single Person - $30,000
2017 to 2018 Details of Tax Changes

2018 New Year’s Tax Changes Page 25
Jeff Bowes Research Director December 2017
BC AB SK MB ON QC NB PE NS NL Canada
Tax Change -$457 -$4 -$85 -$4 -$5 -$2 $45 $44 -$42 $124 -$64
2018 Total Taxes $14,380 $14,704 $15,465 $16,603 $14,672 $18,073 $16,673 $16,953 $17,003 $17,105 $15,655
2017 Total Taxes $14,838 $14,708 $15,550 $16,607 $14,676 $18,075 $16,627 $16,909 $17,045 $16,981 $15,719
Average Tax Rate Change -0.7% 0.0% -0.1% 0.0% 0.0% 0.0% 0.1% 0.1% -0.1% 0.2% -0.1%
2018 Average Tax Rate 23.5% 24.2% 25.5% 27.3% 24.0% 29.9% 27.1% 27.8% 28.0% 27.7% 25.7%
2017 Average Tax Rate 24.2% 24.2% 25.7% 27.4% 24.0% 29.9% 27.1% 27.7% 28.1% 27.5% 25.8%
BC AB SK MB ON QC NB PE NS NL Canada
Total Tax -$457 -$4 -$85 -$4 -$5 -$2 $45 $44 -$42 $124 -$64
CPP/QPP -$22 -$1 $4 -$1 -$16 $9 -$32 -$16 $1 -$47 -$8
EI/QPIP $5 $12 $14 $12 $7 $15 $2 $7 $13 -$3 $10
Health Taxes/RAMQ -$468 $0 $0 $0 -$11 $1 $0 $0 $0 $0 -$65
Federal Income Tax $26 -$14 -$24 -$14 $16 -$28 $45 $16 -$19 $75 $2
Provincial Income Tax $1 -$1 -$78 -$1 $0 -$1 $30 $38 -$37 $99 -$1
Bracket Creep $0 $0 $26 $0 -$10 $0 $27 $37 $40 $100 $0
Single Person - $60,000
2017 to 2018 Details of Tax Changes

2018 New Year’s Tax Changes Page 26
Jeff Bowes Research Director December 2017
BC AB SK MB ON QC NB PE NS NL Canada
Tax Change -$457 -$4 -$135 -$4 -$7 $2 $45 $78 $33 $112 -$63
2018 Total Taxes $20,196 $20,877 $22,131 $23,898 $20,929 $25,622 $23,906 $24,443 $24,594 $24,825 $22,272
2017 Total Taxes $20,653 $20,881 $22,266 $23,902 $20,937 $25,620 $23,861 $24,366 $24,561 $24,714 $22,336
Average Tax Rate Change -0.6% 0.0% -0.2% 0.0% 0.0% 0.0% 0.1% 0.1% 0.0% 0.1% -0.1%
2018 Average Tax Rate 24.8% 25.8% 27.4% 29.5% 25.7% 31.8% 29.2% 30.0% 30.4% 30.1% 27.4%
2017 Average Tax Rate 25.3% 25.8% 27.6% 29.5% 25.7% 31.8% 29.1% 29.9% 30.4% 30.0% 27.5%
BC AB SK MB ON QC NB PE NS NL Canada
Total Tax -$457 -$4 -$135 -$4 -$7 $2 $45 $78 $33 $112 -$63
CPP/QPP -$22 -$1 $4 -$1 -$16 $9 -$32 -$16 $1 -$47 -$8
EI/QPIP $5 $12 $14 $12 $7 $20 $2 $7 $13 -$3 $11
Health Taxes/RAMQ -$468 $0 $0 $0 -$14 $1 $0 $0 $0 $0 -$66
Federal Income Tax $26 -$14 -$24 -$14 $16 -$28 $45 $16 -$19 $75 $2
Provincial Income Tax $2 -$1 -$129 -$1 $0 -$1 $30 $72 $38 $87 -$1
Bracket Creep $0 $0 $26 $0 -$13 $0 $27 $70 $40 $100 -$1
Single Person - $80,000
2017 to 2018 Details of Tax Changes

2018 New Year’s Tax Changes Page 27
Jeff Bowes Research Director December 2017
BC AB SK MB ON QC NB PE NS NL Canada
Tax Change -$433 -$21 -$212 -$20 $8 -$27 $103 $115 $21 $183 -$64
2018 Total Taxes $27,198 $27,489 $29,225 $32,007 $28,641 $33,998 $31,969 $32,512 $32,610 $32,941 $29,929
2017 Total Taxes $27,631 $27,509 $29,437 $32,028 $28,633 $34,025 $31,866 $32,397 $32,589 $32,758 $29,993
Average Tax Rate Change -0.4% 0.0% -0.2% 0.0% 0.0% 0.0% 0.1% 0.1% 0.0% 0.2% -0.1%
2018 Average Tax Rate 26.7% 27.2% 28.9% 31.6% 28.1% 33.7% 31.2% 31.9% 32.3% 32.0% 29.5%
2017 Average Tax Rate 27.1% 27.2% 29.1% 31.6% 28.1% 33.7% 31.1% 31.8% 32.2% 31.8% 29.6%
BC AB SK MB ON QC NB PE NS NL Canada
Total Tax -$433 -$21 -$212 -$20 $8 -$27 $103 $115 $21 $183 -$64
CPP/QPP -$22 -$1 $4 -$1 -$16 $9 -$32 -$16 $1 -$47 -$8
EI/QPIP $5 $12 $14 $12 $7 $20 $2 $7 $13 -$3 $11
Health Taxes/RAMQ -$468 $0 $0 $0 -$14 $1 $0 $0 $0 $0 -$66
Federal Income Tax $50 -$30 -$50 -$30 $30 -$58 $90 $30 -$40 $150 $2
Provincial Income Tax $1 -$1 -$179 -$1 $1 -$1 $43 $95 $47 $84 -$2
Bracket Creep $0 $0 $26 $0 -$13 $0 $41 $93 $47 $100 $0
Single Person - $100,000
2017 to 2018 Details of Tax Changes

2018 New Year’s Tax Changes Page 28
Jeff Bowes Research Director December 2017
BC AB SK MB ON QC NB PE NS NL Canada
Tax Change -$350 -$34 -$334 -$33 $63 -$51 $157 $134 $61 $141 -$41
2018 Total Taxes $48,065 $46,398 $49,323 $54,187 $51,025 $58,003 $54,251 $55,343 $54,872 $55,208 $51,984
2017 Total Taxes $48,415 $46,431 $49,657 $54,220 $50,962 $58,054 $54,094 $55,209 $54,811 $55,067 $52,026
Average Tax Rate Change -0.2% 0.0% -0.2% 0.0% 0.0% 0.0% 0.1% 0.1% 0.0% 0.1% 0.0%
2018 Average Tax Rate 31.4% 30.6% 32.6% 35.7% 33.4% 38.4% 35.3% 36.2% 36.2% 35.7% 34.2%
2017 Average Tax Rate 31.6% 30.6% 32.8% 35.7% 33.4% 38.4% 35.2% 36.2% 36.1% 35.6% 34.2%
BC AB SK MB ON QC NB PE NS NL Canada
Total Tax -$350 -$34 -$334 -$33 $63 -$51 $157 $134 $61 $141 -$41
CPP/QPP -$22 -$1 $4 -$1 -$16 $9 -$32 -$16 $1 -$47 -$8
EI/QPIP $5 $12 $14 $12 $7 $20 $2 $7 $13 -$3 $11
Health Taxes/RAMQ -$468 $0 $0 $0 -$14 $1 $0 $0 $0 $0 -$66
Federal Income Tax $71 -$44 -$72 -$44 $42 -$82 $128 $42 -$58 $214 $2
Provincial Income Tax $64 -$1 -$280 -$1 $44 $0 $59 $101 $104 -$22 $20
Bracket Creep $0 $0 $51 $0 $30 $0 $56 $100 $105 $0 $17
Single Person - $150,000
2017 to 2018 Details of Tax Changes

2018 New Year’s Tax Changes Page 29
Jeff Bowes Research Director December 2017
BC AB SK MB ON QC NB PE NS NL Canada
Tax Change $721 -$34 -$460 -$33 $213 -$51 $190 $134 $61 $145 $154
2018 Total Taxes $71,423 $67,630 $71,290 $77,665 $75,591 $83,190 $79,473 $79,454 $80,147 $79,374 $76,037
2017 Total Taxes $70,702 $67,664 $71,751 $77,699 $75,378 $83,241 $79,283 $79,320 $80,086 $79,228 $75,883
Average Tax Rate Change 0.4% 0.0% -0.2% 0.0% 0.1% 0.0% 0.1% 0.1% 0.0% 0.1% 0.1%
2018 Average Tax Rate 35.0% 33.4% 35.3% 38.4% 37.1% 41.3% 38.8% 39.0% 39.6% 38.5% 37.5%
2017 Average Tax Rate 34.7% 33.4% 35.5% 38.4% 37.0% 41.3% 38.7% 39.0% 39.6% 38.5% 37.4%
BC AB SK MB ON QC NB PE NS NL Canada
Total Tax $721 -$34 -$460 -$33 $213 -$51 $190 $134 $61 $145 $154
CPP/QPP -$22 -$1 $4 -$1 -$16 $9 -$32 -$16 $1 -$47 -$8
EI/QPIP $5 $12 $14 $12 $7 $20 $2 $7 $13 -$3 $11
Health Taxes/RAMQ -$468 $0 $0 $0 $137 $1 $0 $0 $0 $0 -$8
Federal Income Tax $71 -$44 -$72 -$44 $42 -$82 $128 $42 -$58 $220 $2
Provincial Income Tax $1,135 -$2 -$406 -$1 $44 $0 $93 $101 $104 -$25 $158
Bracket Creep $0 $0 $51 $0 $180 $0 $89 $100 $105 $0 $76
Single Person - $200,000
2017 to 2018 Details of Tax Changes

2018 New Year’s Tax Changes Page 30
Jeff Bowes Research Director December 2017
BC AB SK MB ON QC NB PE NS NL Canada
Tax Change $1,834 -$57 -$626 -$56 $148 -$96 $265 $160 $30 $362 $259
2018 Total Taxes $96,748 $91,248 $95,125 $103,031 $102,493 $109,921 $106,722 $105,512 $107,299 $105,893 $102,148
2017 Total Taxes $94,914 $91,305 $95,751 $103,087 $102,345 $110,017 $106,457 $105,353 $107,269 $105,532 $101,889
Average Tax Rate Change 0.7% 0.0% -0.2% 0.0% 0.1% 0.0% 0.1% 0.1% 0.0% 0.1% 0.1%
2018 Average Tax Rate 37.9% 36.1% 37.7% 40.7% 40.3% 43.6% 41.7% 41.5% 42.5% 41.1% 40.3%
2017 Average Tax Rate 37.2% 36.1% 37.9% 40.7% 40.2% 43.6% 41.6% 41.4% 42.4% 41.0% 40.2%
BC AB SK MB ON QC NB PE NS NL Canada
Total Tax $1,834 -$57 -$626 -$56 $148 -$96 $265 $160 $30 $362 $259
CPP/QPP -$22 -$1 $4 -$1 -$16 $9 -$32 -$16 $1 -$47 -$8
EI/QPIP $5 $12 $14 $12 $7 $20 $2 $7 $13 -$3 $11
Health Taxes/RAMQ -$468 $0 $0 $0 -$16 $1 $0 $0 $0 $0 -$67
Federal Income Tax $113 -$67 -$111 -$67 $68 -$127 $202 $68 -$89 $336 $5
Provincial Income Tax $2,206 -$2 -$532 -$1 $106 $0 $93 $101 $104 $75 $319
Bracket Creep $0 $0 $51 $0 $89 $0 $89 $100 $105 $100 $43
Single Person - $250,000
2017 to 2018 Details of Tax Changes
2018 New Year’s Tax Changes Page 31
Jeff Bowes Research Director December 2017
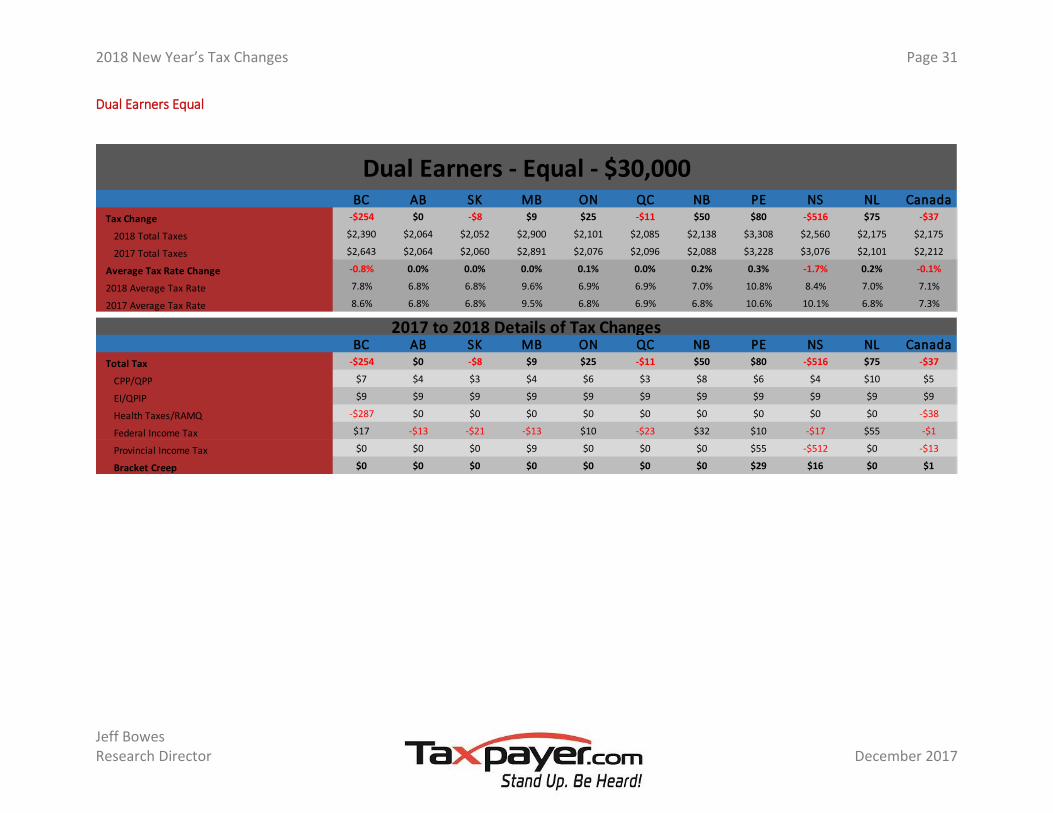
Dual Earners Equal
BC AB SK MB ON QC NB PE NS NL Canada
Tax Change -$254 $0 -$8 $9 $25 -$11 $50 $80 -$516 $75 -$37
2018 Total Taxes $2,390 $2,064 $2,052 $2,900 $2,101 $2,085 $2,138 $3,308 $2,560 $2,175 $2,175
2017 Total Taxes $2,643 $2,064 $2,060 $2,891 $2,076 $2,096 $2,088 $3,228 $3,076 $2,101 $2,212
Average Tax Rate Change -0.8% 0.0% 0.0% 0.0% 0.1% 0.0% 0.2% 0.3% -1.7% 0.2% -0.1%
2018 Average Tax Rate 7.8% 6.8% 6.8% 9.6% 6.9% 6.9% 7.0% 10.8% 8.4% 7.0% 7.1%
2017 Average Tax Rate 8.6% 6.8% 6.8% 9.5% 6.8% 6.9% 6.8% 10.6% 10.1% 6.8% 7.3%
BC AB SK MB ON QC NB PE NS NL Canada
Total Tax -$254 $0 -$8 $9 $25 -$11 $50 $80 -$516 $75 -$37
CPP/QPP $7 $4 $3 $4 $6 $3 $8 $6 $4 $10 $5
EI/QPIP $9 $9 $9 $9 $9 $9 $9 $9 $9 $9 $9
Health Taxes/RAMQ -$287 $0 $0 $0 $0 $0 $0 $0 $0 $0 -$38
Federal Income Tax $17 -$13 -$21 -$13 $10 -$23 $32 $10 -$17 $55 -$1
Provincial Income Tax $0 $0 $0 $9 $0 $0 $0 $55 -$512 $0 -$13
Bracket Creep $0 $0 $0 $0 $0 $0 $0 $29 $16 $0 $1
Dual Earners - Equal - $30,000
2017 to 2018 Details of Tax Changes

2018 New Year’s Tax Changes Page 32
Jeff Bowes Research Director December 2017
BC AB SK MB ON QC NB PE NS NL Canada
Tax Change -$896 $5 -$30 $5 $21 $0 $72 $59 -$413 $80 -$118
2018 Total Taxes $11,017 $10,246 $10,904 $12,459 $10,850 $13,390 $12,116 $12,423 $11,451 $11,989 $11,504
2017 Total Taxes $11,914 $10,241 $10,935 $12,454 $10,830 $13,390 $12,043 $12,364 $11,864 $11,909 $11,622
Average Tax Rate Change -1.5% 0.0% 0.0% 0.0% 0.0% 0.0% 0.1% 0.1% -0.7% 0.1% -0.2%
2018 Average Tax Rate 18.0% 16.9% 18.0% 20.5% 17.8% 22.1% 19.7% 20.3% 18.9% 19.4% 18.9%
2017 Average Tax Rate 19.5% 16.9% 18.0% 20.5% 17.7% 22.1% 19.6% 20.2% 19.6% 19.3% 19.1%
BC AB SK MB ON QC NB PE NS NL Canada
Total Tax -$896 $5 -$30 $5 $21 $0 $72 $59 -$413 $80 -$118
CPP/QPP $7 $4 $3 $4 $6 $3 $8 $6 $4 $10 $5
EI/QPIP $18 $18 $18 $18 $18 $18 $18 $18 $18 $19 $18
Health Taxes/RAMQ -$936 $0 $0 $0 -$11 $3 $0 $0 $0 $0 -$126
Federal Income Tax $16 -$15 -$22 -$15 $8 -$24 $31 $8 -$18 $54 -$2
Provincial Income Tax -$2 -$2 -$30 -$2 -$1 $0 $15 $26 -$417 -$2 -$13
Bracket Creep $0 $0 $34 $0 -$11 $0 $17 $29 $56 $0 -$1
Dual Earners - Equal - $60,000
2017 to 2018 Details of Tax Changes

2018 New Year’s Tax Changes Page 33
Jeff Bowes Research Director December 2017
BC AB SK MB ON QC NB PE NS NL Canada
Tax Change -$890 $10 -$73 $10 $20 $5 $77 $110 -$302 $86 -$113
2018 Total Taxes $16,409 $16,310 $17,050 $19,010 $16,309 $20,218 $18,190 $19,182 $18,632 $18,407 $17,476
2017 Total Taxes $17,299 $16,299 $17,123 $19,000 $16,288 $20,213 $18,113 $19,072 $18,933 $18,321 $17,589
Average Tax Rate Change -1.1% 0.0% -0.1% 0.0% 0.0% 0.0% 0.1% 0.1% -0.4% 0.1% -0.1%
2018 Average Tax Rate 20.1% 20.1% 21.1% 23.5% 20.0% 25.1% 22.2% 23.6% 23.0% 22.3% 21.5%
2017 Average Tax Rate 21.2% 20.1% 21.2% 23.5% 20.0% 25.1% 22.1% 23.4% 23.4% 22.2% 21.7%
BC AB SK MB ON QC NB PE NS NL Canada
Total Tax -$890 $10 -$73 $10 $20 $5 $77 $110 -$302 $86 -$113
CPP/QPP $7 $4 $3 $4 $6 $3 $8 $6 $4 $10 $5
EI/QPIP $24 $24 $24 $24 $24 $24 $25 $24 $24 $25 $24
Health Taxes/RAMQ -$936 $0 $0 $0 -$16 $3 $0 $0 $0 $0 -$128
Federal Income Tax $15 -$15 -$23 -$15 $7 -$25 $30 $7 -$19 $53 -$3
Provincial Income Tax $0 -$3 -$78 -$3 -$2 $0 $14 $72 -$311 -$2 -$11
Bracket Creep $0 $0 $34 $0 -$16 $0 $17 $74 $56 $0 -$3
Dual Earners - Equal - $80,000
2017 to 2018 Details of Tax Changes

2018 New Year’s Tax Changes Page 34
Jeff Bowes Research Director December 2017
BC AB SK MB ON QC NB PE NS NL Canada
Tax Change -$859 $1 -$121 $1 $36 -$18 $165 $131 -$209 $368 -$103
2018 Total Taxes $22,602 $22,813 $23,836 $26,060 $22,890 $28,017 $25,749 $26,531 $26,247 $26,262 $24,367
2017 Total Taxes $23,460 $22,812 $23,958 $26,059 $22,854 $28,035 $25,584 $26,400 $26,457 $25,894 $24,470
Average Tax Rate Change -0.8% 0.0% -0.1% 0.0% 0.0% 0.0% 0.2% 0.1% -0.2% 0.4% -0.1%
2018 Average Tax Rate 22.2% 22.5% 23.6% 25.8% 22.5% 27.8% 25.1% 26.1% 26.0% 25.5% 24.0%
2017 Average Tax Rate 23.0% 22.5% 23.7% 25.7% 22.5% 27.8% 25.0% 25.9% 26.2% 25.1% 24.1%
BC AB SK MB ON QC NB PE NS NL Canada
Total Tax -$859 $1 -$121 $1 $36 -$18 $165 $131 -$209 $368 -$103
CPP/QPP $7 $4 $3 $4 $6 $3 $8 $6 $4 $10 $5
EI/QPIP $31 $30 $30 $30 $31 $30 $31 $31 $30 $31 $30
Health Taxes/RAMQ -$936 $0 $0 $0 -$22 $3 $0 $0 $0 $0 -$130
Federal Income Tax $40 -$30 -$48 -$30 $23 -$53 $76 $23 -$39 $129 -$2
Provincial Income Tax -$1 -$4 -$107 -$3 -$2 -$1 $50 $71 -$204 $197 -$6
Bracket Creep $0 $0 $53 $0 -$21 $0 $55 $74 $56 $200 -$1
Dual Earners - Equal - $100,000
2017 to 2018 Details of Tax Changes

2018 New Year’s Tax Changes Page 35
Jeff Bowes Research Director December 2017
BC AB SK MB ON QC NB PE NS NL Canada
Tax Change -$890 $10 -$73 $10 $20 $5 $77 $110 -$302 $86 -$113
2018 Total Taxes $16,409 $16,310 $17,050 $19,010 $16,309 $20,218 $18,190 $19,182 $18,632 $18,407 $17,476
2017 Total Taxes $17,299 $16,299 $17,123 $19,000 $16,288 $20,213 $18,113 $19,072 $18,933 $18,321 $17,589
Average Tax Rate Change -1.1% 0.0% -0.1% 0.0% 0.0% 0.0% 0.1% 0.1% -0.4% 0.1% -0.1%
2018 Average Tax Rate 20.1% 20.1% 21.1% 23.5% 20.0% 25.1% 22.2% 23.6% 23.0% 22.3% 21.5%
2017 Average Tax Rate 21.2% 20.1% 21.2% 23.5% 20.0% 25.1% 22.1% 23.4% 23.4% 22.2% 21.7%
BC AB SK MB ON QC NB PE NS NL Canada
Total Tax -$890 $10 -$73 $10 $20 $5 $77 $110 -$302 $86 -$113
CPP/QPP $7 $4 $3 $4 $6 $3 $8 $6 $4 $10 $5
EI/QPIP $24 $24 $24 $24 $24 $24 $25 $24 $24 $25 $24
Health Taxes/RAMQ -$936 $0 $0 $0 -$16 $3 $0 $0 $0 $0 -$128
Federal Income Tax $15 -$15 -$23 -$15 $7 -$25 $30 $7 -$19 $53 -$3
Provincial Income Tax $0 -$3 -$78 -$3 -$2 $0 $14 $72 -$311 -$2 -$11
Bracket Creep $0 $0 $34 $0 -$16 $0 $17 $74 $56 $0 -$3
Dual Earners - Equal - $80,000
2017 to 2018 Details of Tax Changes

2018 New Year’s Tax Changes Page 36
Jeff Bowes Research Director December 2017
BC AB SK MB ON QC NB PE NS NL Canada
Tax Change -$859 $1 -$121 $1 $36 -$18 $165 $131 -$209 $368 -$103
2018 Total Taxes $22,602 $22,813 $23,836 $26,060 $22,890 $28,017 $25,749 $26,531 $26,247 $26,262 $24,367
2017 Total Taxes $23,460 $22,812 $23,958 $26,059 $22,854 $28,035 $25,584 $26,400 $26,457 $25,894 $24,470
Average Tax Rate Change -0.8% 0.0% -0.1% 0.0% 0.0% 0.0% 0.2% 0.1% -0.2% 0.4% -0.1%
2018 Average Tax Rate 22.2% 22.5% 23.6% 25.8% 22.5% 27.8% 25.1% 26.1% 26.0% 25.5% 24.0%
2017 Average Tax Rate 23.0% 22.5% 23.7% 25.7% 22.5% 27.8% 25.0% 25.9% 26.2% 25.1% 24.1%
BC AB SK MB ON QC NB PE NS NL Canada
Total Tax -$859 $1 -$121 $1 $36 -$18 $165 $131 -$209 $368 -$103
CPP/QPP $7 $4 $3 $4 $6 $3 $8 $6 $4 $10 $5
EI/QPIP $31 $30 $30 $30 $31 $30 $31 $31 $30 $31 $30
Health Taxes/RAMQ -$936 $0 $0 $0 -$22 $3 $0 $0 $0 $0 -$130
Federal Income Tax $40 -$30 -$48 -$30 $23 -$53 $76 $23 -$39 $129 -$2
Provincial Income Tax -$1 -$4 -$107 -$3 -$2 -$1 $50 $71 -$204 $197 -$6
Bracket Creep $0 $0 $53 $0 -$21 $0 $55 $74 $56 $200 -$1
Dual Earners - Equal - $100,000
2017 to 2018 Details of Tax Changes

2018 New Year’s Tax Changes Page 37
Jeff Bowes Research Director December 2017
BC AB SK MB ON QC NB PE NS NL Canada
Tax Change -$915 -$9 -$245 -$8 -$14 $4 $91 $156 $67 $229 -$126
2018 Total Taxes $37,390 $38,667 $40,929 $43,960 $38,699 $47,502 $44,196 $45,100 $45,431 $45,712 $41,212
2017 Total Taxes $38,305 $38,676 $41,174 $43,968 $38,713 $47,497 $44,105 $44,944 $45,364 $45,482 $41,338
Average Tax Rate Change -0.6% 0.0% -0.2% 0.0% 0.0% 0.0% 0.1% 0.1% 0.0% 0.1% -0.1%
2018 Average Tax Rate 24.4% 25.5% 27.0% 29.0% 25.3% 31.4% 28.8% 29.5% 30.0% 29.6% 27.1%
2017 Average Tax Rate 25.0% 25.5% 27.2% 29.0% 25.4% 31.4% 28.7% 29.4% 29.9% 29.4% 27.2%
BC AB SK MB ON QC NB PE NS NL Canada
Total Tax -$915 -$9 -$245 -$8 -$14 $4 $91 $156 $67 $229 -$126
CPP/QPP -$43 -$2 $8 -$2 -$33 $19 -$64 -$33 $3 -$94 -$17
EI/QPIP $11 $24 $27 $24 $14 $40 $4 $14 $26 -$6 $21
Health Taxes/RAMQ -$936 $0 $0 $0 -$27 $3 $0 $0 $0 $0 -$133
Federal Income Tax $51 -$28 -$48 -$28 $31 -$57 $91 $31 -$38 $150 $3
Provincial Income Tax $3 -$2 -$232 -$2 $0 -$1 $60 $143 $76 $180 -$1
Bracket Creep $0 $0 $53 $0 -$26 $0 $55 $141 $79 $200 -$2
Dual Earners - Equal - $150,000
2017 to 2018 Details of Tax Changes

2018 New Year’s Tax Changes Page 38
Jeff Bowes Research Director December 2017
BC AB SK MB ON QC NB PE NS NL Canada
Tax Change -$866 -$41 -$424 -$40 $15 -$55 $206 $230 $41 $367 -$128
2018 Total Taxes $54,396 $54,978 $58,450 $64,015 $57,282 $67,996 $63,938 $65,024 $65,220 $65,882 $59,858
2017 Total Taxes $55,262 $55,019 $58,874 $64,055 $57,267 $68,051 $63,732 $64,795 $65,179 $65,515 $59,986
Average Tax Rate Change -0.4% 0.0% -0.2% 0.0% 0.0% 0.0% 0.1% 0.1% 0.0% 0.2% -0.1%
2018 Average Tax Rate 26.7% 27.2% 28.9% 31.6% 28.1% 33.7% 31.2% 31.9% 32.3% 32.0% 29.5%
2017 Average Tax Rate 27.1% 27.2% 29.1% 31.6% 28.1% 33.7% 31.1% 31.8% 32.2% 31.8% 29.6%
BC AB SK MB ON QC NB PE NS NL Canada
Total Tax -$866 -$41 -$424 -$40 $15 -$55 $206 $230 $41 $367 -$128
CPP/QPP -$43 -$2 $8 -$2 -$33 $19 -$64 -$33 $3 -$94 -$17
EI/QPIP $11 $24 $27 $24 $14 $40 $4 $14 $26 -$6 $21
Health Taxes/RAMQ -$936 $0 $0 $0 -$27 $3 $0 $0 $0 $0 -$133
Federal Income Tax $99 -$61 -$101 -$61 $59 -$116 $180 $59 -$81 $300 $3
Provincial Income Tax $3 -$2 -$358 -$2 $2 -$1 $86 $189 $93 $168 -$3
Bracket Creep $0 $0 $53 $0 -$26 $0 $81 $186 $94 $200 $0
Dual Earners - Equal - $200,000
2017 to 2018 Details of Tax Changes

2018 New Year’s Tax Changes Page 39
Jeff Bowes Research Director December 2017
BC AB SK MB ON QC NB PE NS NL Canada
Tax Change -$869 -$41 -$550 -$40 $15 -$53 $206 $243 $41 $361 -$132
2018 Total Taxes $74,736 $73,194 $77,893 $85,975 $79,378 $91,743 $85,708 $87,609 $87,210 $87,609 $81,536
2017 Total Taxes $75,605 $73,235 $78,443 $86,016 $79,362 $91,796 $85,502 $87,365 $87,168 $87,248 $81,668
Average Tax Rate Change -0.3% 0.0% -0.2% 0.0% 0.0% 0.0% 0.1% 0.1% 0.0% 0.1% -0.1%
2018 Average Tax Rate 29.3% 28.9% 30.8% 34.0% 31.2% 36.4% 33.5% 34.4% 34.5% 34.0% 32.1%
2017 Average Tax Rate 29.6% 28.9% 31.1% 34.0% 31.2% 36.4% 33.4% 34.3% 34.5% 33.9% 32.2%
BC AB SK MB ON QC NB PE NS NL Canada
Total Tax -$869 -$41 -$550 -$40 $15 -$53 $206 $243 $41 $361 -$132
CPP/QPP -$43 -$2 $8 -$2 -$33 $19 -$64 -$33 $3 -$94 -$17
EI/QPIP $11 $24 $27 $24 $14 $40 $4 $14 $26 -$6 $21
Health Taxes/RAMQ -$936 $0 $0 $0 -$27 $3 $0 $0 $0 $0 -$133
Federal Income Tax $99 -$61 -$101 -$61 $59 -$116 $180 $59 -$81 $300 $3
Provincial Income Tax $0 -$2 -$485 -$2 $2 $1 $86 $203 $93 $162 -$7
Bracket Creep $0 $0 $53 $0 -$26 $0 $81 $200 $94 $200 $0
Dual Earners - Equal - $250,000
2017 to 2018 Details of Tax Changes

2018 New Year’s Tax Changes Page 40
Jeff Bowes Research Director December 2017
Dual Earners 75/25
BC AB SK MB ON QC NB PE NS NL Canada
Tax Change -$255 $1 -$7 $22 $46 -$9 $82 $79 -$175 $73 -$18
2018 Total Taxes $2,723 $2,293 $2,280 $3,117 $2,953 $2,294 $2,449 $3,621 $3,081 $2,405 $2,662
2017 Total Taxes $2,977 $2,291 $2,287 $3,095 $2,907 $2,303 $2,367 $3,542 $3,256 $2,332 $2,680
Average Tax Rate Change -0.8% 0.0% 0.0% 0.1% 0.2% 0.0% 0.3% 0.3% -0.6% 0.2% -0.1%
2018 Average Tax Rate 8.9% 7.6% 7.5% 10.3% 9.7% 7.6% 8.0% 11.9% 10.2% 7.8% 8.7%
2017 Average Tax Rate 9.7% 7.5% 7.5% 10.2% 9.5% 7.6% 7.7% 11.6% 10.7% 7.5% 8.8%
BC AB SK MB ON QC NB PE NS NL Canada
Total Tax -$255 $1 -$7 $22 $46 -$9 $82 $79 -$175 $73 -$18
CPP/QPP $7 $4 $3 $4 $6 $3 $8 $6 $4 $10 $5
EI/QPIP $9 $9 $9 $9 $9 $9 $9 $9 $9 $9 $9
Health Taxes/RAMQ -$287 $0 $0 $0 $22 $0 $0 $0 $0 $0 -$29
Federal Income Tax $17 -$12 -$19 -$12 $10 -$21 $32 $10 -$16 $53 $0
Provincial Income Tax -$1 $0 $0 $21 -$1 $0 $33 $54 -$173 $0 -$3
Bracket Creep $0 $0 $0 $12 $22 $0 $33 $27 $16 $0 $10
Dual Earners - 75/25 - $30,000
2017 to 2018 Details of Tax Changes

2018 New Year’s Tax Changes Page 41
Jeff Bowes Research Director December 2017
BC AB SK MB ON QC NB PE NS NL Canada
Tax Change -$895 $6 -$21 $8 $24 -$1 $91 $82 -$381 $81 -$115
2018 Total Taxes $11,138 $10,329 $10,827 $12,651 $10,611 $13,484 $12,342 $12,975 $12,391 $12,536 $11,504
2017 Total Taxes $12,034 $10,323 $10,848 $12,642 $10,587 $13,485 $12,251 $12,893 $12,772 $12,455 $11,618
Average Tax Rate Change -1.5% 0.0% 0.0% 0.0% 0.0% 0.0% 0.1% 0.1% -0.6% 0.1% -0.2%
2018 Average Tax Rate 18.2% 17.0% 17.9% 20.8% 17.4% 22.3% 20.1% 21.2% 20.4% 20.3% 18.9%
2017 Average Tax Rate 19.7% 17.0% 17.9% 20.8% 17.3% 22.3% 19.9% 21.1% 21.1% 20.2% 19.1%
BC AB SK MB ON QC NB PE NS NL Canada
Total Tax -$895 $6 -$21 $8 $24 -$1 $91 $82 -$381 $81 -$115
CPP/QPP $7 $4 $3 $4 $6 $3 $8 $6 $4 $10 $5
EI/QPIP $18 $18 $18 $18 $18 $18 $18 $18 $18 $19 $18
Health Taxes/RAMQ -$936 $0 $0 $0 -$8 $3 $0 $0 $0 $0 -$125
Federal Income Tax $16 -$15 -$22 -$15 $8 -$24 $31 $8 -$18 $54 -$2
Provincial Income Tax $0 -$2 -$21 $0 -$1 -$1 $33 $49 -$385 -$2 -$11
Bracket Creep $0 $0 $40 $0 -$8 $0 $36 $51 $36 $0 $0
Dual Earners - 75/25- $60,000
2017 to 2018 Details of Tax Changes

2018 New Year’s Tax Changes Page 42
Jeff Bowes Research Director December 2017
BC AB SK MB ON QC NB PE NS NL Canada
Tax Change -$908 -$4 -$78 -$1 $30 -$5 $79 $72 -$299 $161 -$115
2018 Total Taxes $16,941 $16,795 $17,844 $19,699 $17,208 $21,353 $19,693 $20,134 $19,740 $20,138 $18,353
2017 Total Taxes $17,849 $16,799 $17,923 $19,700 $17,177 $21,358 $19,614 $20,062 $20,039 $19,977 $18,468
Average Tax Rate Change -1.1% 0.0% -0.1% 0.0% 0.0% 0.0% 0.1% 0.1% -0.4% 0.2% -0.1%
2018 Average Tax Rate 20.8% 20.7% 22.1% 24.3% 21.1% 26.5% 24.0% 24.7% 24.4% 24.4% 22.6%
2017 Average Tax Rate 21.9% 20.7% 22.2% 24.3% 21.1% 26.5% 23.9% 24.6% 24.8% 24.2% 22.8%
BC AB SK MB ON QC NB PE NS NL Canada
Total Tax -$908 -$4 -$78 -$1 $30 -$5 $79 $72 -$299 $161 -$115
CPP/QPP -$18 $1 $6 $1 -$13 $11 -$28 -$13 $3 -$42 -$6
EI/QPIP $11 $18 $20 $18 $13 $21 $8 $13 $19 $3 $16
Health Taxes/RAMQ -$936 $0 $0 $0 $11 $3 $0 $0 $0 $0 -$118
Federal Income Tax $34 -$21 -$35 -$21 $20 -$39 $61 $20 -$28 $102 $1
Provincial Income Tax $1 -$2 -$69 $1 $0 -$1 $38 $52 -$294 $98 -$8
Bracket Creep $0 $0 $43 $0 $11 $0 $36 $51 $48 $100 $9
Dual Earners - 75/25 - $80,000
2017 to 2018 Details of Tax Changes

2018 New Year’s Tax Changes Page 43
Jeff Bowes Research Director December 2017
BC AB SK MB ON QC NB PE NS NL Canada
Tax Change -$907 -$3 -$127 -$2 $2 $1 $80 $106 -$221 $154 -$124
2018 Total Taxes $22,729 $22,941 $24,380 $26,656 $23,485 $28,739 $26,637 $27,246 $26,911 $27,370 $24,890
2017 Total Taxes $23,636 $22,943 $24,507 $26,658 $23,483 $28,738 $26,557 $27,140 $27,132 $27,216 $25,014
Average Tax Rate Change -0.9% 0.0% -0.1% 0.0% 0.0% 0.0% 0.1% 0.1% -0.2% 0.1% -0.1%
2018 Average Tax Rate 22.3% 22.7% 24.1% 26.3% 23.1% 28.5% 26.0% 26.8% 26.6% 26.6% 24.5%
2017 Average Tax Rate 23.2% 22.7% 24.3% 26.3% 23.1% 28.5% 25.9% 26.7% 26.8% 26.4% 24.7%
BC AB SK MB ON QC NB PE NS NL Canada
Total Tax -$907 -$3 -$127 -$2 $2 $1 $80 $106 -$221 $154 -$124
CPP/QPP -$18 $1 $6 $1 -$13 $11 -$28 -$13 $3 -$42 -$6
EI/QPIP $13 $20 $21 $20 $15 $28 $10 $15 $20 $5 $18
Health Taxes/RAMQ -$936 $0 $0 $0 -$19 $3 $0 $0 $0 $0 -$129
Federal Income Tax $34 -$21 -$35 -$21 $20 -$40 $61 $20 -$28 $102 $1
Provincial Income Tax $1 -$2 -$119 -$2 $0 -$1 $37 $85 -$217 $89 -$7
Bracket Creep $0 $0 $43 $0 -$18 $0 $36 $85 $48 $100 -$2
Dual Earners - 75/25 - $100,000
2017 to 2018 Details of Tax Changes

2018 New Year’s Tax Changes Page 44
Jeff Bowes Research Director December 2017
BC AB SK MB ON QC NB PE NS NL Canada
Tax Change -$881 -$16 -$275 -$16 $59 -$24 $141 $176 -$144 $123 -$108
2018 Total Taxes $39,707 $39,440 $41,843 $46,177 $41,655 $49,146 $45,747 $46,890 $46,526 $46,637 $43,321
2017 Total Taxes $40,587 $39,456 $42,117 $46,192 $41,596 $49,171 $45,606 $46,714 $46,670 $46,514 $43,429
Average Tax Rate Change -0.6% 0.0% -0.2% 0.0% 0.0% 0.0% 0.1% 0.1% -0.1% 0.1% -0.1%
2018 Average Tax Rate 26.0% 26.0% 27.6% 30.4% 27.3% 32.5% 29.8% 30.7% 30.7% 30.2% 28.5%
2017 Average Tax Rate 26.5% 26.0% 27.8% 30.4% 27.2% 32.5% 29.7% 30.6% 30.8% 30.1% 28.5%
BC AB SK MB ON QC NB PE NS NL Canada
Total Tax -$881 -$16 -$275 -$16 $59 -$24 $141 $176 -$144 $123 -$108
CPP/QPP -$18 $1 $6 $1 -$13 $11 -$28 -$13 $3 -$42 -$6
EI/QPIP $17 $23 $25 $23 $18 $32 $13 $18 $24 $9 $22
Health Taxes/RAMQ -$936 $0 $0 $0 $20 $3 $0 $0 $0 $0 -$114
Federal Income Tax $57 -$38 -$62 -$38 $33 -$70 $105 $33 -$50 $176 $0
Provincial Income Tax -$1 -$3 -$244 -$2 $0 $1 $50 $137 -$122 -$20 -$10
Bracket Creep $0 $0 $43 $0 $21 $0 $49 $137 $75 $0 $13
Dual Earners - 75/25 - $150,000
2017 to 2018 Details of Tax Changes
2018 New Year’s Tax Changes Page 45
Jeff Bowes Research Director December 2017
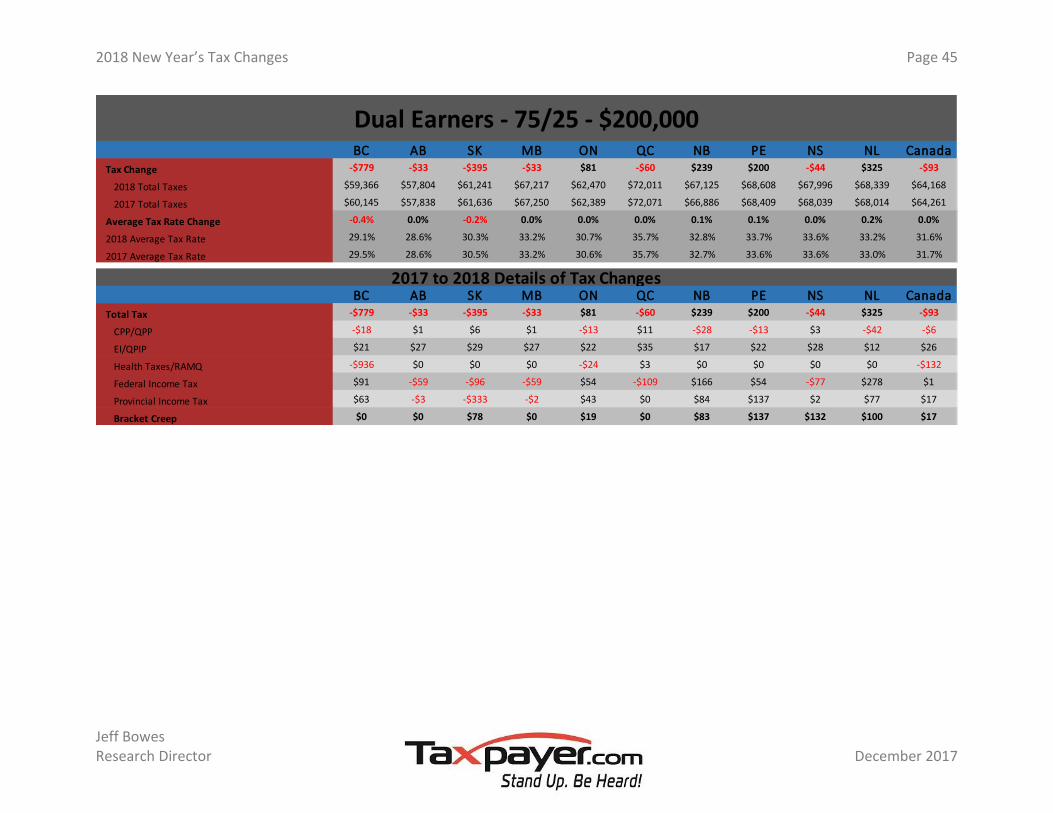
BC AB SK MB ON QC NB PE NS NL Canada
Tax Change -$779 -$33 -$395 -$33 $81 -$60 $239 $200 -$44 $325 -$93
2018 Total Taxes $59,366 $57,804 $61,241 $67,217 $62,470 $72,011 $67,125 $68,608 $67,996 $68,339 $64,168
2017 Total Taxes $60,145 $57,838 $61,636 $67,250 $62,389 $72,071 $66,886 $68,409 $68,039 $68,014 $64,261
Average Tax Rate Change -0.4% 0.0% -0.2% 0.0% 0.0% 0.0% 0.1% 0.1% 0.0% 0.2% 0.0%
2018 Average Tax Rate 29.1% 28.6% 30.3% 33.2% 30.7% 35.7% 32.8% 33.7% 33.6% 33.2% 31.6%
2017 Average Tax Rate 29.5% 28.6% 30.5% 33.2% 30.6% 35.7% 32.7% 33.6% 33.6% 33.0% 31.7%
BC AB SK MB ON QC NB PE NS NL Canada
Total Tax -$779 -$33 -$395 -$33 $81 -$60 $239 $200 -$44 $325 -$93
CPP/QPP -$18 $1 $6 $1 -$13 $11 -$28 -$13 $3 -$42 -$6
EI/QPIP $21 $27 $29 $27 $22 $35 $17 $22 $28 $12 $26
Health Taxes/RAMQ -$936 $0 $0 $0 -$24 $3 $0 $0 $0 $0 -$132
Federal Income Tax $91 -$59 -$96 -$59 $54 -$109 $166 $54 -$77 $278 $1
Provincial Income Tax $63 -$3 -$333 -$2 $43 $0 $84 $137 $2 $77 $17
Bracket Creep $0 $0 $78 $0 $19 $0 $83 $137 $132 $100 $17
Dual Earners - 75/25 - $200,000
2017 to 2018 Details of Tax Changes

2018 New Year’s Tax Changes Page 46
Jeff Bowes Research Director December 2017
BC AB SK MB ON QC NB PE NS NL Canada
Tax Change -$4 -$39 -$520 -$38 $59 -$53 $236 $179 $33 $159 -$3
2018 Total Taxes $80,683 $77,792 $82,097 $89,240 $84,764 $95,914 $90,740 $91,252 $91,784 $91,283 $86,447
2017 Total Taxes $80,687 $77,830 $82,617 $89,278 $84,705 $95,967 $90,504 $91,074 $91,752 $91,124 $86,450
Average Tax Rate Change 0.0% 0.0% -0.2% 0.0% 0.0% 0.0% 0.1% 0.1% 0.0% 0.1% 0.0%
2018 Average Tax Rate 31.6% 30.7% 32.5% 35.3% 33.3% 38.1% 35.4% 35.9% 36.3% 35.4% 34.1%
2017 Average Tax Rate 31.6% 30.8% 32.7% 35.3% 33.3% 38.1% 35.4% 35.8% 36.3% 35.4% 34.1%
BC AB SK MB ON QC NB PE NS NL Canada
Total Tax -$4 -$39 -$520 -$38 $59 -$53 $236 $179 $33 $159 -$3
CPP/QPP -$43 -$2 $8 -$2 -$33 $19 -$64 -$33 $3 -$94 -$17
EI/QPIP $11 $24 $27 $24 $14 $35 $4 $14 $26 -$6 $20
Health Taxes/RAMQ -$936 $0 $0 $0 -$24 $3 $0 $0 $0 $0 -$132
Federal Income Tax $96 -$58 -$96 -$58 $58 -$110 $173 $58 -$77 $289 $4
Provincial Income Tax $869 -$3 -$459 -$2 $44 $0 $122 $140 $81 -$29 $121
Bracket Creep $0 $0 $78 $0 $19 $0 $117 $137 $144 $0 $17
Dual Earners - 75/25 - $250,000
2017 to 2018 Details of Tax Changes
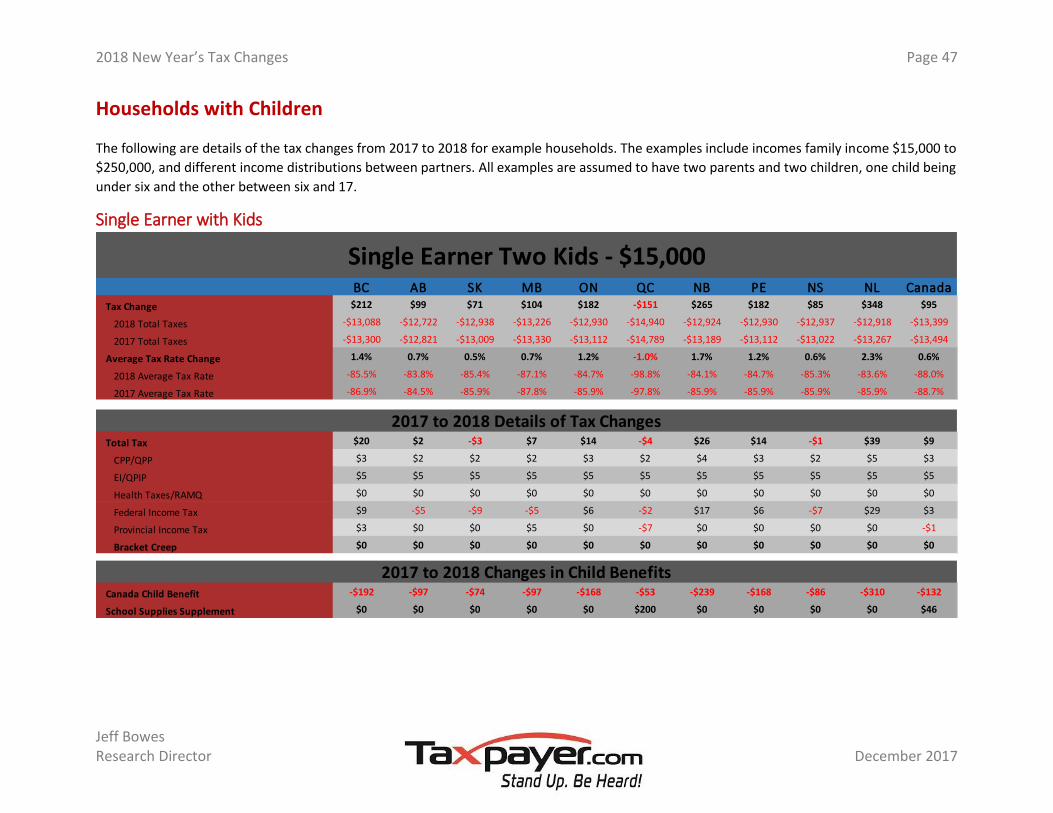
2018 New Year’s Tax Changes Page 47
Jeff Bowes Research Director December 2017
Households with Children
The following are details of the tax changes from 2017 to 2018 for example households. The examples include incomes family income $15,000 to
$250,000, and different income distributions between partners. All examples are assumed to have two parents and two children, one child being
under six and the other between six and 17.
Single Earner with Kids
BC AB SK MB ON QC NB PE NS NL Canada
Tax Change $212 $99 $71 $104 $182 -$151 $265 $182 $85 $348 $95
2018 Total Taxes -$13,088 -$12,722 -$12,938 -$13,226 -$12,930 -$14,940 -$12,924 -$12,930 -$12,937 -$12,918 -$13,399
2017 Total Taxes -$13,300 -$12,821 -$13,009 -$13,330 -$13,112 -$14,789 -$13,189 -$13,112 -$13,022 -$13,267 -$13,494
Average Tax Rate Change 1.4% 0.7% 0.5% 0.7% 1.2% -1.0% 1.7% 1.2% 0.6% 2.3% 0.6%
2018 Average Tax Rate -85.5% -83.8% -85.4% -87.1% -84.7% -98.8% -84.1% -84.7% -85.3% -83.6% -88.0%
2017 Average Tax Rate -86.9% -84.5% -85.9% -87.8% -85.9% -97.8% -85.9% -85.9% -85.9% -85.9% -88.7%
Total Tax $20 $2 -$3 $7 $14 -$4 $26 $14 -$1 $39 $9
CPP/QPP $3 $2 $2 $2 $3 $2 $4 $3 $2 $5 $3
EI/QPIP $5 $5 $5 $5 $5 $5 $5 $5 $5 $5 $5
Health Taxes/RAMQ $0 $0 $0 $0 $0 $0 $0 $0 $0 $0 $0
Federal Income Tax $9 -$5 -$9 -$5 $6 -$2 $17 $6 -$7 $29 $3
Provincial Income Tax $3 $0 $0 $5 $0 -$7 $0 $0 $0 $0 -$1
Bracket Creep $0 $0 $0 $0 $0 $0 $0 $0 $0 $0 $0
Canada Child Benefit -$192 -$97 -$74 -$97 -$168 -$53 -$239 -$168 -$86 -$310 -$132
School Supplies Supplement $0 $0 $0 $0 $0 $200 $0 $0 $0 $0 $46
2017 to 2018 Details of Tax Changes
2017 to 2018 Changes in Child Benefits
Single Earner Two Kids - $15,000

2018 New Year’s Tax Changes Page 48
Jeff Bowes Research Director December 2017
BC AB SK MB ON QC NB PE NS NL Canada
Tax Change $220 $96 $65 $125 $184 -$157 $315 $254 -$337 $377 $86
2018 Total Taxes -$9,008 -$9,454 -$9,466 -$9,256 -$9,117 -$11,509 -$9,264 -$8,706 -$9,035 -$9,342 -$9,713
2017 Total Taxes -$9,228 -$9,550 -$9,531 -$9,381 -$9,301 -$11,351 -$9,580 -$8,960 -$8,698 -$9,720 -$9,799
Average Tax Rate Change 0.7% 0.3% 0.2% 0.4% 0.6% -0.5% 1.0% 0.8% -1.1% 1.2% 0.3%
2018 Average Tax Rate -29.4% -31.1% -31.2% -30.5% -29.9% -38.1% -30.2% -28.5% -29.8% -30.2% -31.9%
2017 Average Tax Rate -30.2% -31.5% -31.5% -30.9% -30.5% -37.5% -31.2% -29.3% -28.7% -31.5% -32.2%
Total Tax $29 -$1 -$9 $27 $16 -$10 $77 $86 -$422 $68 $0
CPP/QPP $3 $2 $2 $2 $3 $2 $4 $3 $2 $5 $3
EI/QPIP $9 $9 $9 $9 $9 $9 $9 $9 $9 $9 $9
Health Taxes/RAMQ $0 $0 $0 $0 -$5 $0 $0 $0 $0 $0 -$2
Federal Income Tax $17 -$12 -$20 -$12 $9 -$22 $31 $9 -$16 $53 -$1
Provincial Income Tax -$1 $0 $0 $28 $0 $1 $32 $64 -$417 $0 -$9
Bracket Creep $0 $0 $0 $12 -$5 $0 $32 $27 $36 $0 $0
Canada Child Benefit -$192 -$97 -$74 -$97 -$168 -$53 -$239 -$168 -$86 -$310 -$132
School Supplies Supplement $0 $0 $0 $0 $0 $200 $0 $0 $0 $0 $46
2017 to 2018 Details of Tax Changes
2017 to 2018 Changes in Child Benefits
Single Earner Two Kids - $30,000

2018 New Year’s Tax Changes Page 49
Jeff Bowes Research Director December 2017
BC AB SK MB ON QC NB PE NS NL Canada
Tax Change -$836 $9 $11 $33 $66 -$222 $180 $127 -$106 $308 -$127
2018 Total Taxes $4,783 $3,216 $2,903 $5,570 $4,632 $6,988 $6,251 $6,678 $6,586 $6,851 $5,126
2017 Total Taxes $5,619 $3,207 $2,892 $5,537 $4,566 $7,209 $6,071 $6,551 $6,692 $6,543 $5,252
Average Tax Rate Change -1.4% 0.0% 0.0% 0.1% 0.1% -0.4% 0.3% 0.2% -0.2% 0.5% -0.2%
2018 Average Tax Rate 7.8% 5.3% 4.8% 9.2% 7.6% 11.6% 10.2% 10.9% 10.9% 11.1% 8.4%
2017 Average Tax Rate 9.2% 5.3% 4.8% 9.1% 7.5% 11.9% 9.9% 10.7% 11.0% 10.6% 8.6%
Total Tax -$917 -$10 $8 $15 $1 -$11 $68 $62 -$117 $150 -$122
CPP/QPP -$22 -$1 $4 -$1 -$16 $9 -$32 -$16 $1 -$47 -$8
EI/QPIP $5 $12 $14 $12 $7 $15 $2 $7 $13 -$3 $10
Health Taxes/RAMQ -$936 $0 $0 $0 -$11 $3 $0 $0 $0 $0 -$126
Federal Income Tax $34 -$19 -$33 -$19 $21 -$38 $61 $21 -$26 $101 $2
Provincial Income Tax $1 -$1 $23 $23 $0 -$1 $37 $51 -$105 $99 $1
Bracket Creep $0 $0 $56 $12 -$10 $0 $35 $49 $48 $100 $2
Canada Child Benefit -$80 -$18 -$3 -$18 -$65 $11 -$111 -$65 -$11 -$158 -$41
School Supplies Supplement $0 $0 $0 $0 $0 $200 $0 $0 $0 $0 $46
2017 to 2018 Details of Tax Changes
2017 to 2018 Changes in Child Benefits
Single Earner Two Kids - $60,000
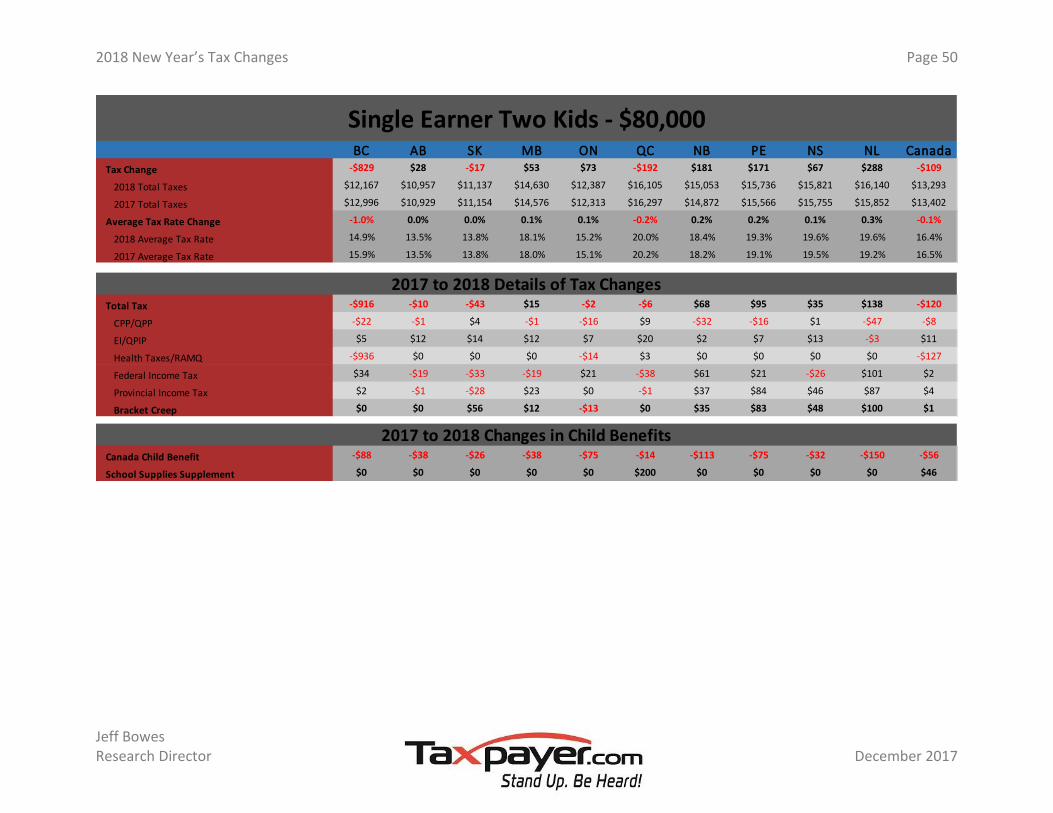
2018 New Year’s Tax Changes Page 50
Jeff Bowes Research Director December 2017
BC AB SK MB ON QC NB PE NS NL Canada
Tax Change -$829 $28 -$17 $53 $73 -$192 $181 $171 $67 $288 -$109
2018 Total Taxes $12,167 $10,957 $11,137 $14,630 $12,387 $16,105 $15,053 $15,736 $15,821 $16,140 $13,293
2017 Total Taxes $12,996 $10,929 $11,154 $14,576 $12,313 $16,297 $14,872 $15,566 $15,755 $15,852 $13,402
Average Tax Rate Change -1.0% 0.0% 0.0% 0.1% 0.1% -0.2% 0.2% 0.2% 0.1% 0.3% -0.1%
2018 Average Tax Rate 14.9% 13.5% 13.8% 18.1% 15.2% 20.0% 18.4% 19.3% 19.6% 19.6% 16.4%
2017 Average Tax Rate 15.9% 13.5% 13.8% 18.0% 15.1% 20.2% 18.2% 19.1% 19.5% 19.2% 16.5%
Total Tax -$916 -$10 -$43 $15 -$2 -$6 $68 $95 $35 $138 -$120
CPP/QPP -$22 -$1 $4 -$1 -$16 $9 -$32 -$16 $1 -$47 -$8
EI/QPIP $5 $12 $14 $12 $7 $20 $2 $7 $13 -$3 $11
Health Taxes/RAMQ -$936 $0 $0 $0 -$14 $3 $0 $0 $0 $0 -$127
Federal Income Tax $34 -$19 -$33 -$19 $21 -$38 $61 $21 -$26 $101 $2
Provincial Income Tax $2 -$1 -$28 $23 $0 -$1 $37 $84 $46 $87 $4
Bracket Creep $0 $0 $56 $12 -$13 $0 $35 $83 $48 $100 $1
Canada Child Benefit -$88 -$38 -$26 -$38 -$75 -$14 -$113 -$75 -$32 -$150 -$56
School Supplies Supplement $0 $0 $0 $0 $0 $200 $0 $0 $0 $0 $46
2017 to 2018 Details of Tax Changes
2017 to 2018 Changes in Child Benefits
Single Earner Two Kids - $80,000

2018 New Year’s Tax Changes Page 51
Jeff Bowes Research Director December 2017
BC AB SK MB ON QC NB PE NS NL Canada
Tax Change -$827 -$1 -$105 $23 $68 -$231 $211 $164 $41 $325 -$127
2018 Total Taxes $20,309 $18,709 $19,371 $24,076 $21,060 $25,621 $24,256 $24,922 $24,977 $25,396 $22,028
2017 Total Taxes $21,136 $18,711 $19,476 $24,053 $20,993 $25,852 $24,044 $24,758 $24,935 $25,070 $22,155
Average Tax Rate Change -0.8% 0.0% -0.1% 0.0% 0.1% -0.2% 0.2% 0.2% 0.0% 0.3% -0.1%
2018 Average Tax Rate 19.9% 18.5% 19.2% 23.8% 20.7% 25.4% 23.7% 24.5% 24.7% 24.7% 21.7%
2017 Average Tax Rate 20.7% 18.5% 19.3% 23.8% 20.6% 25.6% 23.5% 24.3% 24.7% 24.3% 21.8%
Total Tax -$892 -$26 -$119 -$1 $13 -$36 $126 $110 $22 $210 -$120
CPP/QPP -$22 -$1 $4 -$1 -$16 $9 -$32 -$16 $1 -$47 -$8
EI/QPIP $5 $12 $14 $12 $7 $20 $2 $7 $13 -$3 $11
Health Taxes/RAMQ -$936 $0 $0 $0 -$14 $3 $0 $0 $0 $0 -$127
Federal Income Tax $59 -$35 -$59 -$35 $35 -$68 $106 $35 -$47 $176 $2
Provincial Income Tax $1 -$1 -$78 $24 $1 -$1 $50 $84 $55 $84 $3
Bracket Creep $0 $0 $56 $12 -$13 $0 $48 $83 $55 $100 $1
Canada Child Benefit -$65 -$24 -$14 -$24 -$55 -$5 -$85 -$55 -$19 -$116 -$39
School Supplies Supplement $0 $0 $0 $0 $0 $200 $0 $0 $0 $0 $46
2017 to 2018 Details of Tax Changes
2017 to 2018 Changes in Child Benefits
Single Earner Two Kids - $100,000

2018 New Year’s Tax Changes Page 52
Jeff Bowes Research Director December 2017
BC AB SK MB ON QC NB PE NS NL Canada
Tax Change -$801 -$49 -$256 -$37 $72 -$278 $197 $156 $50 $198 -$147
2018 Total Taxes $44,026 $40,468 $42,318 $49,163 $46,294 $52,476 $49,387 $50,558 $50,088 $50,513 $46,935
2017 Total Taxes $44,827 $40,517 $42,574 $49,199 $46,222 $52,753 $49,191 $50,401 $50,038 $50,315 $47,082
Average Tax Rate Change -0.5% 0.0% -0.2% 0.0% 0.0% -0.2% 0.1% 0.1% 0.0% 0.1% -0.1%
2018 Average Tax Rate 28.8% 26.7% 27.9% 32.4% 30.3% 34.7% 32.2% 33.1% 33.0% 32.7% 30.8%
2017 Average Tax Rate 29.3% 26.7% 28.1% 32.4% 30.3% 34.9% 32.0% 33.0% 33.0% 32.6% 30.9%
Total Tax -$809 -$39 -$242 -$27 $68 -$59 $180 $153 $62 $168 -$98
CPP/QPP -$22 -$1 $4 -$1 -$16 $9 -$32 -$16 $1 -$47 -$8
EI/QPIP $5 $12 $14 $12 $7 $20 $2 $7 $13 -$3 $11
Health Taxes/RAMQ -$936 $0 $0 $0 -$14 $3 $0 $0 $0 $0 -$127
Federal Income Tax $80 -$49 -$81 -$49 $47 -$92 $144 $47 -$65 $240 $3
Provincial Income Tax $64 -$1 -$179 $11 $44 $0 $66 $115 $113 -$22 $24
Bracket Creep $0 $0 $81 $12 $30 $0 $63 $113 $113 $0 $19
Canada Child Benefit -$8 $10 $14 $10 -$4 $18 -$17 -$4 $12 -$30 $3
School Supplies Supplement $0 $0 $0 $0 $0 $200 $0 $0 $0 $0 $46
2017 to 2018 Details of Tax Changes
2017 to 2018 Changes in Child Benefits
Single Earner Two Kids - $150,000

2018 New Year’s Tax Changes Page 53
Jeff Bowes Research Director December 2017
BC AB SK MB ON QC NB PE NS NL Canada
Tax Change $262 -$39 -$368 -$27 $218 -$259 $214 $153 $62 $172 $51
2018 Total Taxes $69,651 $63,967 $66,553 $74,908 $73,127 $79,930 $76,876 $76,936 $77,630 $76,945 $73,254
2017 Total Taxes $69,389 $64,006 $66,920 $74,934 $72,909 $80,189 $76,663 $76,783 $77,568 $76,774 $73,203
Average Tax Rate Change 0.1% 0.0% -0.2% 0.0% 0.1% -0.1% 0.1% 0.1% 0.0% 0.1% 0.0%
2018 Average Tax Rate 34.1% 31.6% 32.9% 37.0% 35.9% 39.6% 37.5% 37.8% 38.4% 37.4% 36.1%
2017 Average Tax Rate 34.0% 31.6% 33.1% 37.0% 35.8% 39.8% 37.4% 37.7% 38.4% 37.3% 36.1%
Total Tax $262 -$39 -$368 -$27 $218 -$59 $214 $153 $62 $172 $97
CPP/QPP -$22 -$1 $4 -$1 -$16 $9 -$32 -$16 $1 -$47 -$8
EI/QPIP $5 $12 $14 $12 $7 $20 $2 $7 $13 -$3 $11
Health Taxes/RAMQ -$936 $0 $0 $0 $137 $3 $0 $0 $0 $0 -$70
Federal Income Tax $80 -$49 -$81 -$49 $47 -$92 $144 $47 -$65 $247 $3
Provincial Income Tax $1,135 -$2 -$305 $11 $44 $0 $100 $115 $113 -$25 $162
Bracket Creep $0 $0 $81 $12 $180 $0 $97 $113 $113 $0 $78
Canada Child Benefit $0 $0 $0 $0 $0 $0 $0 $0 $0 $0 $0
School Supplies Supplement $0 $0 $0 $0 $0 $200 $0 $0 $0 $0 $46
2017 to 2018 Details of Tax Changes
2017 to 2018 Changes in Child Benefits
Single Earner Two Kids - $200,000

2018 New Year’s Tax Changes Page 54
Jeff Bowes Research Director December 2017
BC AB SK MB ON QC NB PE NS NL Canada
Tax Change $1,375 -$62 -$533 -$50 $153 -$304 $288 $178 $31 $388 $157
2018 Total Taxes $94,976 $87,585 $90,387 $100,273 $100,029 $106,661 $104,125 $102,994 $104,782 $103,465 $99,365
2017 Total Taxes $93,601 $87,647 $90,920 $100,323 $99,876 $106,965 $103,837 $102,815 $104,751 $103,077 $99,209
Average Tax Rate Change 0.5% 0.0% -0.2% 0.0% 0.1% -0.1% 0.1% 0.1% 0.0% 0.2% 0.1%
2018 Average Tax Rate 37.2% 34.6% 35.8% 39.6% 39.3% 42.3% 40.7% 40.5% 41.5% 40.2% 39.2%
2017 Average Tax Rate 36.7% 34.6% 36.0% 39.7% 39.2% 42.4% 40.6% 40.4% 41.4% 40.0% 39.1%
Total Tax $1,375 -$62 -$533 -$50 $153 -$104 $288 $178 $31 $388 $203
CPP/QPP -$22 -$1 $4 -$1 -$16 $9 -$32 -$16 $1 -$47 -$8
EI/QPIP $5 $12 $14 $12 $7 $20 $2 $7 $13 -$3 $11
Health Taxes/RAMQ -$936 $0 $0 $0 -$16 $3 $0 $0 $0 $0 -$128
Federal Income Tax $121 -$72 -$120 -$72 $73 -$137 $218 $73 -$96 $363 $5
Provincial Income Tax $2,206 -$2 -$431 $11 $106 $0 $100 $115 $113 $75 $323
Bracket Creep $0 $0 $81 $12 $89 $0 $97 $113 $113 $100 $44
Canada Child Benefit $0 $0 $0 $0 $0 $0 $0 $0 $0 $0 $0
School Supplies Supplement $0 $0 $0 $0 $0 $200 $0 $0 $0 $0 $46
2017 to 2018 Details of Tax Changes
2017 to 2018 Changes in Child Benefits
Single Earner Two Kids - $250,000
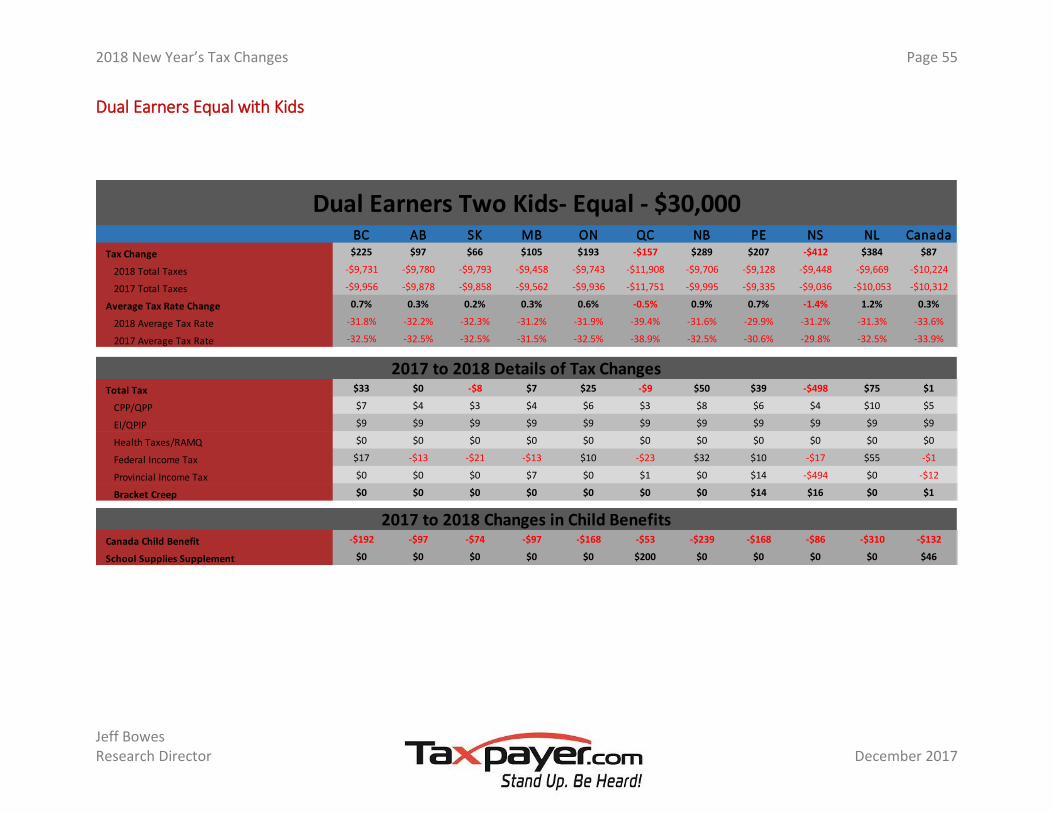
2018 New Year’s Tax Changes Page 55
Jeff Bowes Research Director December 2017
Dual Earners Equal with Kids
BC AB SK MB ON QC NB PE NS NL Canada
Tax Change $225 $97 $66 $105 $193 -$157 $289 $207 -$412 $384 $87
2018 Total Taxes -$9,731 -$9,780 -$9,793 -$9,458 -$9,743 -$11,908 -$9,706 -$9,128 -$9,448 -$9,669 -$10,224
2017 Total Taxes -$9,956 -$9,878 -$9,858 -$9,562 -$9,936 -$11,751 -$9,995 -$9,335 -$9,036 -$10,053 -$10,312
Average Tax Rate Change 0.7% 0.3% 0.2% 0.3% 0.6% -0.5% 0.9% 0.7% -1.4% 1.2% 0.3%
2018 Average Tax Rate -31.8% -32.2% -32.3% -31.2% -31.9% -39.4% -31.6% -29.9% -31.2% -31.3% -33.6%
2017 Average Tax Rate -32.5% -32.5% -32.5% -31.5% -32.5% -38.9% -32.5% -30.6% -29.8% -32.5% -33.9%
Total Tax $33 $0 -$8 $7 $25 -$9 $50 $39 -$498 $75 $1
CPP/QPP $7 $4 $3 $4 $6 $3 $8 $6 $4 $10 $5
EI/QPIP $9 $9 $9 $9 $9 $9 $9 $9 $9 $9 $9
Health Taxes/RAMQ $0 $0 $0 $0 $0 $0 $0 $0 $0 $0 $0
Federal Income Tax $17 -$13 -$21 -$13 $10 -$23 $32 $10 -$17 $55 -$1
Provincial Income Tax $0 $0 $0 $7 $0 $1 $0 $14 -$494 $0 -$12
Bracket Creep $0 $0 $0 $0 $0 $0 $0 $14 $16 $0 $1
Canada Child Benefit -$192 -$97 -$74 -$97 -$168 -$53 -$239 -$168 -$86 -$310 -$132
School Supplies Supplement $0 $0 $0 $0 $0 $200 $0 $0 $0 $0 $46
2017 to 2018 Details of Tax Changes
2017 to 2018 Changes in Child Benefits
Dual Earners Two Kids- Equal - $30,000

2018 New Year’s Tax Changes Page 56
Jeff Bowes Research Director December 2017
BC AB SK MB ON QC NB PE NS NL Canada
Tax Change -$816 $24 $16 $34 $86 -$211 $184 $124 -$402 $238 -$120
2018 Total Taxes $3,192 $2,421 $1,800 $4,112 $2,100 $5,365 $4,291 $4,598 $3,626 $4,164 $3,217
2017 Total Taxes $4,009 $2,398 $1,784 $4,078 $2,013 $5,576 $4,107 $4,474 $4,028 $3,926 $3,338
Average Tax Rate Change -1.3% 0.0% 0.0% 0.1% 0.1% -0.3% 0.3% 0.2% -0.7% 0.4% -0.2%
2018 Average Tax Rate 5.2% 4.0% 3.0% 6.8% 3.4% 8.9% 7.0% 7.5% 6.0% 6.7% 5.3%
2017 Average Tax Rate 6.5% 3.9% 2.9% 6.7% 3.3% 9.2% 6.7% 7.3% 6.6% 6.4% 5.5%
Total Tax -$896 $5 $13 $15 $21 $0 $72 $59 -$413 $80 -$116
CPP/QPP $7 $4 $3 $4 $6 $3 $8 $6 $4 $10 $5
EI/QPIP $18 $18 $18 $18 $18 $18 $18 $18 $18 $19 $18
Health Taxes/RAMQ -$936 $0 $0 $0 -$11 $3 $0 $0 $0 $0 -$126
Federal Income Tax $16 -$15 -$22 -$15 $8 -$24 $31 $8 -$18 $54 -$2
Provincial Income Tax -$2 -$2 $14 $7 -$1 $0 $15 $26 -$417 -$2 -$11
Bracket Creep $0 $0 $47 $0 -$11 $0 $17 $29 $56 $0 -$1
Canada Child Benefit -$80 -$18 -$3 -$18 -$65 $11 -$111 -$65 -$11 -$158 -$41
School Supplies Supplement $0 $0 $0 $0 $0 $200 $0 $0 $0 $0 $46
2017 to 2018 Details of Tax Changes
2017 to 2018 Changes in Child Benefits
Dual Earners Two Kids- Equal - $60,000

2018 New Year’s Tax Changes Page 57
Jeff Bowes Research Director December 2017
BC AB SK MB ON QC NB PE NS NL Canada
Tax Change -$802 $48 -$4 $58 $95 -$181 $190 $185 -$270 $236 -$101
2018 Total Taxes $10,152 $10,053 $9,514 $12,330 $9,212 $13,762 $11,933 $12,926 $12,375 $12,150 $10,794
2017 Total Taxes $10,955 $10,005 $9,517 $12,272 $9,118 $13,942 $11,744 $12,740 $12,645 $11,914 $10,896
Average Tax Rate Change -1.0% 0.1% 0.0% 0.1% 0.1% -0.2% 0.2% 0.2% -0.3% 0.3% -0.1%
2018 Average Tax Rate 12.4% 12.4% 11.8% 15.2% 11.3% 17.1% 14.6% 15.9% 15.3% 14.7% 13.3%
2017 Average Tax Rate 13.4% 12.4% 11.8% 15.2% 11.2% 17.3% 14.3% 15.6% 15.6% 14.5% 13.4%
Total Tax -$890 $10 -$29 $20 $19 $5 $77 $110 -$302 $86 -$112
CPP/QPP $7 $4 $3 $4 $6 $3 $8 $6 $4 $10 $5
EI/QPIP $24 $24 $24 $24 $24 $24 $25 $24 $24 $25 $24
Health Taxes/RAMQ -$936 $0 $0 $0 -$16 $3 $0 $0 $0 $0 -$128
Federal Income Tax $15 -$15 -$23 -$15 $7 -$25 $30 $7 -$19 $53 -$3
Provincial Income Tax $0 -$3 -$34 $7 -$3 $0 $14 $72 -$311 -$2 -$10
Bracket Creep $0 $0 $47 $0 -$16 $0 $17 $74 $56 $0 -$3
Canada Child Benefit -$88 -$38 -$26 -$38 -$75 -$14 -$113 -$75 -$32 -$150 -$56
School Supplies Supplement $0 $0 $0 $0 $0 $200 $0 $0 $0 $0 $46
2017 to 2018 Details of Tax Changes
2017 to 2018 Changes in Child Benefits
Dual Earners Two Kids- Equal - $80,000

2018 New Year’s Tax Changes Page 58
Jeff Bowes Research Director December 2017
BC AB SK MB ON QC NB PE NS NL Canada
Tax Change -$794 $25 -$64 $35 $89 -$213 $250 $186 -$190 $483 -$108
2018 Total Taxes $17,485 $17,696 $17,440 $20,617 $17,739 $22,700 $20,632 $21,414 $21,131 $21,145 $19,139
2017 Total Taxes $18,279 $17,671 $17,504 $20,582 $17,650 $22,913 $20,382 $21,229 $21,321 $20,662 $19,247
Average Tax Rate Change -0.8% 0.0% -0.1% 0.0% 0.1% -0.2% 0.2% 0.2% -0.2% 0.5% -0.1%
2018 Average Tax Rate 17.1% 17.5% 17.3% 20.4% 17.4% 22.5% 20.1% 21.0% 20.9% 20.5% 18.9%
2017 Average Tax Rate 17.9% 17.5% 17.3% 20.3% 17.3% 22.7% 19.9% 20.9% 21.1% 20.1% 19.0%
Total Tax -$859 $1 -$78 $11 $34 -$18 $165 $131 -$209 $368 -$102
CPP/QPP $7 $4 $3 $4 $6 $3 $8 $6 $4 $10 $5
EI/QPIP $31 $30 $30 $30 $31 $30 $31 $31 $30 $31 $30
Health Taxes/RAMQ -$936 $0 $0 $0 -$22 $3 $0 $0 $0 $0 -$130
Federal Income Tax $40 -$30 -$48 -$30 $23 -$53 $76 $23 -$39 $129 -$2
Provincial Income Tax -$1 -$4 -$64 $6 -$4 -$1 $50 $71 -$204 $197 -$5
Bracket Creep $0 $0 $66 $0 -$21 $0 $55 $74 $56 $200 $0
Canada Child Benefit -$65 -$24 -$14 -$24 -$55 -$5 -$85 -$55 -$19 -$116 -$39
School Supplies Supplement $0 $0 $0 $0 $0 $200 $0 $0 $0 $0 $46
2017 to 2018 Details of Tax Changes
2017 to 2018 Changes in Child Benefits
Dual Earners Two Kids- Equal - $100,000

2018 New Year’s Tax Changes Page 59
Jeff Bowes Research Director December 2017
BC AB SK MB ON QC NB PE NS NL Canada
Tax Change -$907 -$19 -$216 -$8 -$11 -$214 $108 $159 $55 $260 -$173
2018 Total Taxes $35,123 $36,400 $37,383 $41,613 $36,432 $45,035 $41,929 $42,833 $43,164 $43,445 $38,856
2017 Total Taxes $36,030 $36,419 $37,599 $41,621 $36,443 $45,249 $41,821 $42,674 $43,110 $43,186 $39,030
Average Tax Rate Change -0.6% 0.0% -0.1% 0.0% 0.0% -0.1% 0.1% 0.1% 0.0% 0.2% -0.1%
2018 Average Tax Rate 23.0% 24.0% 24.7% 27.4% 23.9% 29.8% 27.3% 28.1% 28.5% 28.1% 25.5%
2017 Average Tax Rate 23.5% 24.0% 24.8% 27.4% 23.9% 29.9% 27.2% 27.9% 28.4% 28.0% 25.6%
Total Tax -$915 -$9 -$201 $2 -$14 $4 $91 $156 $67 $229 -$124
CPP/QPP -$43 -$2 $8 -$2 -$33 $19 -$64 -$33 $3 -$94 -$17
EI/QPIP $11 $24 $27 $24 $14 $40 $4 $14 $26 -$6 $21
Health Taxes/RAMQ -$936 $0 $0 $0 -$27 $3 $0 $0 $0 $0 -$133
Federal Income Tax $51 -$28 -$48 -$28 $31 -$57 $91 $31 -$38 $150 $3
Provincial Income Tax $3 -$2 -$189 $8 $0 -$1 $60 $143 $76 $180 $1
Bracket Creep $0 $0 $66 $0 -$26 $0 $55 $141 $79 $200 -$1
Canada Child Benefit -$8 $10 $14 $10 -$4 $18 -$17 -$4 $12 -$30 $3
School Supplies Supplement $0 $0 $0 $0 $0 $200 $0 $0 $0 $0 $46
2017 to 2018 Details of Tax Changes
2017 to 2018 Changes in Child Benefits
Dual Earners Two Kids- Equal - $150,000
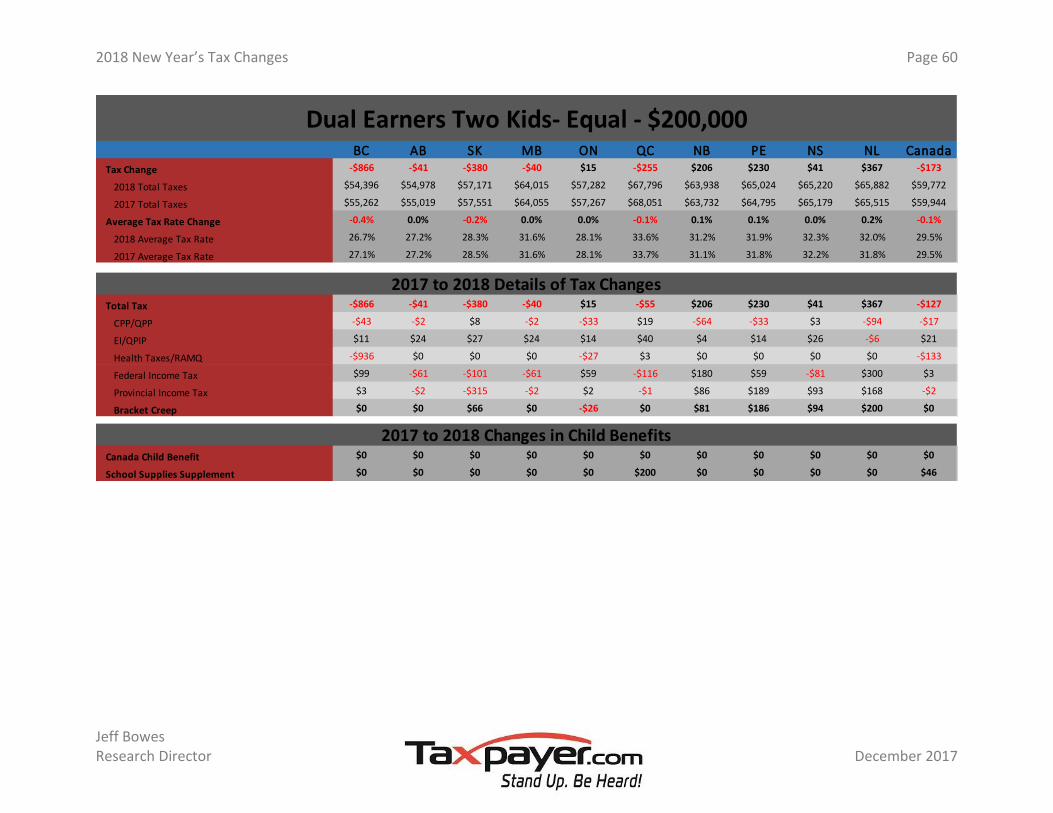
2018 New Year’s Tax Changes Page 60
Jeff Bowes Research Director December 2017
BC AB SK MB ON QC NB PE NS NL Canada
Tax Change -$866 -$41 -$380 -$40 $15 -$255 $206 $230 $41 $367 -$173
2018 Total Taxes $54,396 $54,978 $57,171 $64,015 $57,282 $67,796 $63,938 $65,024 $65,220 $65,882 $59,772
2017 Total Taxes $55,262 $55,019 $57,551 $64,055 $57,267 $68,051 $63,732 $64,795 $65,179 $65,515 $59,944
Average Tax Rate Change -0.4% 0.0% -0.2% 0.0% 0.0% -0.1% 0.1% 0.1% 0.0% 0.2% -0.1%
2018 Average Tax Rate 26.7% 27.2% 28.3% 31.6% 28.1% 33.6% 31.2% 31.9% 32.3% 32.0% 29.5%
2017 Average Tax Rate 27.1% 27.2% 28.5% 31.6% 28.1% 33.7% 31.1% 31.8% 32.2% 31.8% 29.5%
Total Tax -$866 -$41 -$380 -$40 $15 -$55 $206 $230 $41 $367 -$127
CPP/QPP -$43 -$2 $8 -$2 -$33 $19 -$64 -$33 $3 -$94 -$17
EI/QPIP $11 $24 $27 $24 $14 $40 $4 $14 $26 -$6 $21
Health Taxes/RAMQ -$936 $0 $0 $0 -$27 $3 $0 $0 $0 $0 -$133
Federal Income Tax $99 -$61 -$101 -$61 $59 -$116 $180 $59 -$81 $300 $3
Provincial Income Tax $3 -$2 -$315 -$2 $2 -$1 $86 $189 $93 $168 -$2
Bracket Creep $0 $0 $66 $0 -$26 $0 $81 $186 $94 $200 $0
Canada Child Benefit $0 $0 $0 $0 $0 $0 $0 $0 $0 $0 $0
School Supplies Supplement $0 $0 $0 $0 $0 $200 $0 $0 $0 $0 $46
2017 to 2018 Details of Tax Changes
2017 to 2018 Changes in Child Benefits
Dual Earners Two Kids- Equal - $200,000

2018 New Year’s Tax Changes Page 61
Jeff Bowes Research Director December 2017
BC AB SK MB ON QC NB PE NS NL Canada
Tax Change -$869 -$41 -$506 -$40 $15 -$253 $206 $243 $41 $361 -$177
2018 Total Taxes $74,736 $73,194 $76,613 $85,975 $79,378 $91,543 $85,708 $87,609 $87,210 $87,609 $81,449
2017 Total Taxes $75,605 $73,235 $77,119 $86,016 $79,362 $91,796 $85,502 $87,365 $87,168 $87,248 $81,626
Average Tax Rate Change -0.3% 0.0% -0.2% 0.0% 0.0% -0.1% 0.1% 0.1% 0.0% 0.1% -0.1%
2018 Average Tax Rate 29.3% 28.9% 30.3% 34.0% 31.2% 36.3% 33.5% 34.4% 34.5% 34.0% 32.1%
2017 Average Tax Rate 29.6% 28.9% 30.5% 34.0% 31.2% 36.4% 33.4% 34.3% 34.5% 33.9% 32.2%
Total Tax -$869 -$41 -$506 -$40 $15 -$53 $206 $243 $41 $361 -$131
CPP/QPP -$43 -$2 $8 -$2 -$33 $19 -$64 -$33 $3 -$94 -$17
EI/QPIP $11 $24 $27 $24 $14 $40 $4 $14 $26 -$6 $21
Health Taxes/RAMQ -$936 $0 $0 $0 -$27 $3 $0 $0 $0 $0 -$133
Federal Income Tax $99 -$61 -$101 -$61 $59 -$116 $180 $59 -$81 $300 $3
Provincial Income Tax $0 -$2 -$441 -$2 $2 $1 $86 $203 $93 $162 -$6
Bracket Creep $0 $0 $66 $0 -$26 $0 $81 $200 $94 $200 $0
Canada Child Benefit $0 $0 $0 $0 $0 $0 $0 $0 $0 $0 $0
School Supplies Supplement $0 $0 $0 $0 $0 $200 $0 $0 $0 $0 $46
2017 to 2018 Details of Tax Changes
2017 to 2018 Changes in Child Benefits
Dual Earners Two Kids- Equal - $250,000
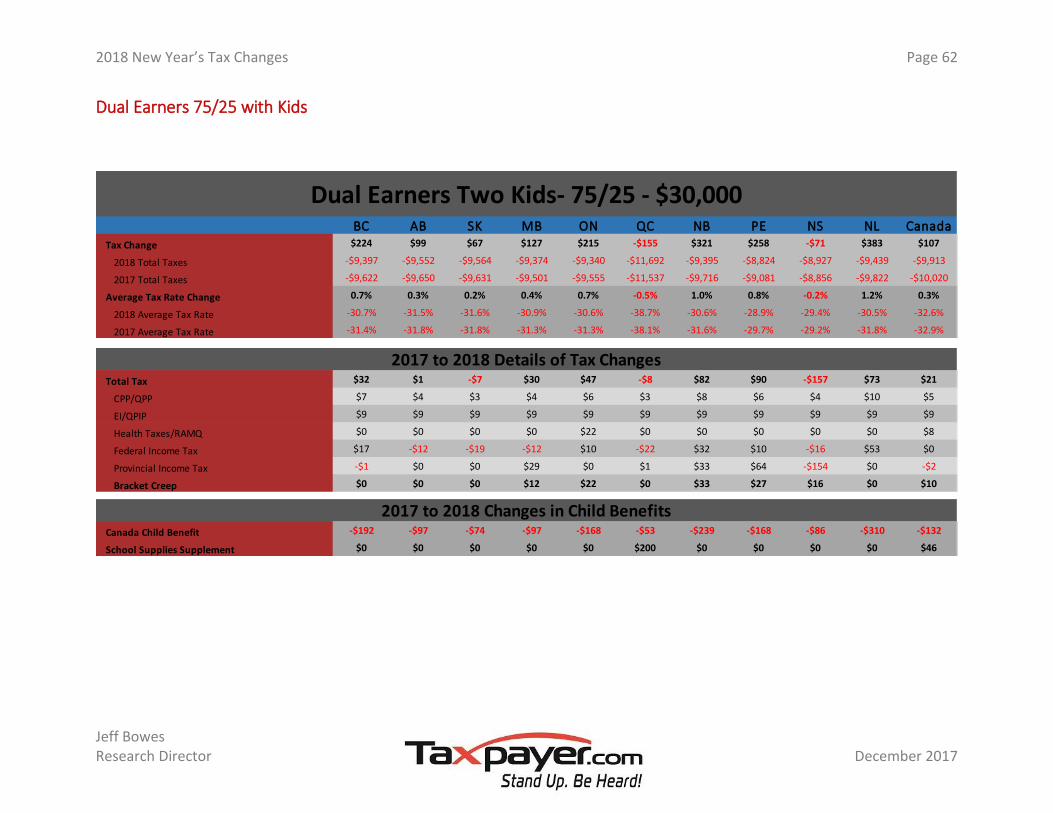
2018 New Year’s Tax Changes Page 62
Jeff Bowes Research Director December 2017
Dual Earners 75/25 with Kids
BC AB SK MB ON QC NB PE NS NL Canada
Tax Change $224 $99 $67 $127 $215 -$155 $321 $258 -$71 $383 $107
2018 Total Taxes -$9,397 -$9,552 -$9,564 -$9,374 -$9,340 -$11,692 -$9,395 -$8,824 -$8,927 -$9,439 -$9,913
2017 Total Taxes -$9,622 -$9,650 -$9,631 -$9,501 -$9,555 -$11,537 -$9,716 -$9,081 -$8,856 -$9,822 -$10,020
Average Tax Rate Change 0.7% 0.3% 0.2% 0.4% 0.7% -0.5% 1.0% 0.8% -0.2% 1.2% 0.3%
2018 Average Tax Rate -30.7% -31.5% -31.6% -30.9% -30.6% -38.7% -30.6% -28.9% -29.4% -30.5% -32.6%
2017 Average Tax Rate -31.4% -31.8% -31.8% -31.3% -31.3% -38.1% -31.6% -29.7% -29.2% -31.8% -32.9%
Total Tax $32 $1 -$7 $30 $47 -$8 $82 $90 -$157 $73 $21
CPP/QPP $7 $4 $3 $4 $6 $3 $8 $6 $4 $10 $5
EI/QPIP $9 $9 $9 $9 $9 $9 $9 $9 $9 $9 $9
Health Taxes/RAMQ $0 $0 $0 $0 $22 $0 $0 $0 $0 $0 $8
Federal Income Tax $17 -$12 -$19 -$12 $10 -$22 $32 $10 -$16 $53 $0
Provincial Income Tax -$1 $0 $0 $29 $0 $1 $33 $64 -$154 $0 -$2
Bracket Creep $0 $0 $0 $12 $22 $0 $33 $27 $16 $0 $10
Canada Child Benefit -$192 -$97 -$74 -$97 -$168 -$53 -$239 -$168 -$86 -$310 -$132
School Supplies Supplement $0 $0 $0 $0 $0 $200 $0 $0 $0 $0 $46
2017 to 2018 Details of Tax Changes
2017 to 2018 Changes in Child Benefits
Dual Earners Two Kids- 75/25 - $30,000

2018 New Year’s Tax Changes Page 63
Jeff Bowes Research Director December 2017
BC AB SK MB ON QC NB PE NS NL Canada
Tax Change -$815 $25 $25 $37 $87 -$212 $202 $147 -$370 $239 -$118
2018 Total Taxes $3,314 $2,505 $1,723 $4,451 $2,303 $5,459 $4,517 $5,151 $4,566 $4,711 $3,393
2017 Total Taxes $4,129 $2,480 $1,698 $4,415 $2,216 $5,671 $4,315 $5,004 $4,937 $4,473 $3,511
Average Tax Rate Change -1.3% 0.0% 0.0% 0.1% 0.1% -0.4% 0.3% 0.2% -0.6% 0.4% -0.2%
2018 Average Tax Rate 5.4% 4.1% 2.8% 7.3% 3.8% 9.0% 7.4% 8.4% 7.5% 7.6% 5.6%
2017 Average Tax Rate 6.7% 4.1% 2.8% 7.3% 3.6% 9.4% 7.0% 8.2% 8.1% 7.2% 5.8%
Total Tax -$895 $6 $23 $18 $22 -$1 $91 $82 -$381 $81 -$114
CPP/QPP $7 $4 $3 $4 $6 $3 $8 $6 $4 $10 $5
EI/QPIP $18 $18 $18 $18 $18 $18 $18 $18 $18 $19 $18
Health Taxes/RAMQ -$936 $0 $0 $0 -$8 $3 $0 $0 $0 $0 -$125
Federal Income Tax $16 -$15 -$22 -$15 $8 -$24 $31 $8 -$18 $54 -$2
Provincial Income Tax $0 -$2 $23 $10 -$3 -$1 $33 $49 -$385 -$2 -$9
Bracket Creep $0 $0 $53 $0 -$8 $0 $36 $51 $36 $0 $1
Canada Child Benefit -$80 -$18 -$3 -$18 -$65 $11 -$111 -$65 -$11 -$158 -$41
School Supplies Supplement $0 $0 $0 $0 $0 $200 $0 $0 $0 $0 $46
2017 to 2018 Details of Tax Changes
2017 to 2018 Changes in Child Benefits
Dual Earners Two Kids- 75/25- $60,000

2018 New Year’s Tax Changes Page 64
Jeff Bowes Research Director December 2017
BC AB SK MB ON QC NB PE NS NL Canada
Tax Change -$820 $34 -$9 $47 $106 -$191 $192 $147 -$267 $311 -$103
2018 Total Taxes $10,684 $10,538 $10,308 $13,215 $10,951 $14,897 $13,437 $13,877 $13,484 $13,882 $12,001
2017 Total Taxes $11,504 $10,504 $10,317 $13,168 $10,845 $15,087 $13,245 $13,730 $13,751 $13,570 $12,104
Average Tax Rate Change -1.0% 0.0% 0.0% 0.1% 0.1% -0.2% 0.2% 0.2% -0.3% 0.4% -0.1%
2018 Average Tax Rate 13.1% 13.0% 12.8% 16.3% 13.4% 18.5% 16.4% 17.0% 16.7% 16.8% 14.8%
2017 Average Tax Rate 14.1% 13.0% 12.8% 16.3% 13.3% 18.7% 16.2% 16.9% 17.0% 16.5% 14.9%
Total Tax -$908 -$4 -$35 $9 $30 -$5 $79 $72 -$299 $161 -$113
CPP/QPP -$18 $1 $6 $1 -$13 $11 -$28 -$13 $3 -$42 -$6
EI/QPIP $11 $18 $20 $18 $13 $21 $8 $13 $19 $3 $16
Health Taxes/RAMQ -$936 $0 $0 $0 $11 $3 $0 $0 $0 $0 -$118
Federal Income Tax $34 -$21 -$35 -$21 $20 -$39 $61 $20 -$28 $102 $1
Provincial Income Tax $1 -$2 -$26 $11 $0 -$1 $38 $52 -$294 $98 -$6
Bracket Creep $0 $0 $56 $0 $11 $0 $36 $51 $48 $100 $10
Canada Child Benefit -$88 -$38 -$26 -$38 -$75 -$14 -$113 -$75 -$32 -$150 -$56
School Supplies Supplement $0 $0 $0 $0 $0 $200 $0 $0 $0 $0 $46
2017 to 2018 Details of Tax Changes
2017 to 2018 Changes in Child Benefits
Dual Earners Two Kids- 75/25 - $80,000
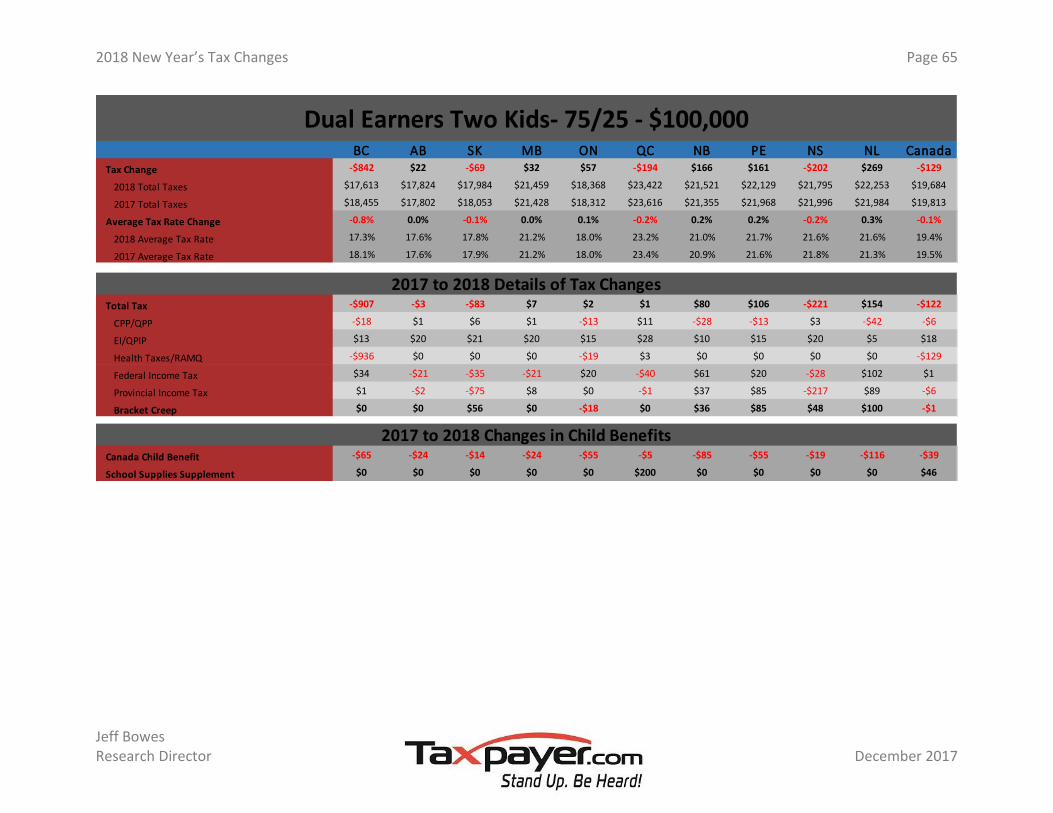
2018 New Year’s Tax Changes Page 65
Jeff Bowes Research Director December 2017
BC AB SK MB ON QC NB PE NS NL Canada
Tax Change -$842 $22 -$69 $32 $57 -$194 $166 $161 -$202 $269 -$129
2018 Total Taxes $17,613 $17,824 $17,984 $21,459 $18,368 $23,422 $21,521 $22,129 $21,795 $22,253 $19,684
2017 Total Taxes $18,455 $17,802 $18,053 $21,428 $18,312 $23,616 $21,355 $21,968 $21,996 $21,984 $19,813
Average Tax Rate Change -0.8% 0.0% -0.1% 0.0% 0.1% -0.2% 0.2% 0.2% -0.2% 0.3% -0.1%
2018 Average Tax Rate 17.3% 17.6% 17.8% 21.2% 18.0% 23.2% 21.0% 21.7% 21.6% 21.6% 19.4%
2017 Average Tax Rate 18.1% 17.6% 17.9% 21.2% 18.0% 23.4% 20.9% 21.6% 21.8% 21.3% 19.5%
Total Tax -$907 -$3 -$83 $7 $2 $1 $80 $106 -$221 $154 -$122
CPP/QPP -$18 $1 $6 $1 -$13 $11 -$28 -$13 $3 -$42 -$6
EI/QPIP $13 $20 $21 $20 $15 $28 $10 $15 $20 $5 $18
Health Taxes/RAMQ -$936 $0 $0 $0 -$19 $3 $0 $0 $0 $0 -$129
Federal Income Tax $34 -$21 -$35 -$21 $20 -$40 $61 $20 -$28 $102 $1
Provincial Income Tax $1 -$2 -$75 $8 $0 -$1 $37 $85 -$217 $89 -$6
Bracket Creep $0 $0 $56 $0 -$18 $0 $36 $85 $48 $100 -$1
Canada Child Benefit -$65 -$24 -$14 -$24 -$55 -$5 -$85 -$55 -$19 -$116 -$39
School Supplies Supplement $0 $0 $0 $0 $0 $200 $0 $0 $0 $0 $46
2017 to 2018 Details of Tax Changes
2017 to 2018 Changes in Child Benefits
Dual Earners Two Kids- 75/25 - $100,000

2018 New Year’s Tax Changes Page 66
Jeff Bowes Research Director December 2017
BC AB SK MB ON QC NB PE NS NL Canada
Tax Change -$873 -$26 -$245 -$25 $62 -$242 $158 $180 -$156 $153 -$156
2018 Total Taxes $37,440 $37,173 $38,296 $43,910 $39,388 $46,680 $43,481 $44,623 $44,259 $44,370 $40,968
2017 Total Taxes $38,313 $37,199 $38,541 $43,935 $39,326 $46,922 $43,323 $44,444 $44,415 $44,217 $41,123
Average Tax Rate Change -0.6% 0.0% -0.2% 0.0% 0.0% -0.2% 0.1% 0.1% -0.1% 0.1% -0.1%
2018 Average Tax Rate 24.5% 24.5% 25.3% 28.9% 25.8% 30.9% 28.3% 29.2% 29.2% 28.7% 26.9%
2017 Average Tax Rate 25.0% 24.5% 25.4% 28.9% 25.8% 31.0% 28.2% 29.1% 29.3% 28.6% 27.0%
Total Tax -$881 -$16 -$231 -$16 $59 -$24 $141 $176 -$144 $123 -$106
CPP/QPP -$18 $1 $6 $1 -$13 $11 -$28 -$13 $3 -$42 -$6
EI/QPIP $17 $23 $25 $23 $18 $32 $13 $18 $24 $9 $22
Health Taxes/RAMQ -$936 $0 $0 $0 $20 $3 $0 $0 $0 $0 -$114
Federal Income Tax $57 -$38 -$62 -$38 $33 -$70 $105 $33 -$50 $176 $0
Provincial Income Tax -$1 -$3 -$200 -$2 $0 $1 $50 $137 -$122 -$20 -$8
Bracket Creep $0 $0 $56 $0 $21 $0 $49 $137 $75 $0 $13
Canada Child Benefit -$8 $10 $14 $10 -$4 $18 -$17 -$4 $12 -$30 $3
School Supplies Supplement $0 $0 $0 $0 $0 $200 $0 $0 $0 $0 $46
2017 to 2018 Details of Tax Changes
2017 to 2018 Changes in Child Benefits
Dual Earners Two Kids- 75/25 - $150,000

2018 New Year’s Tax Changes Page 67
Jeff Bowes Research Director December 2017
BC AB SK MB ON QC NB PE NS NL Canada
Tax Change -$779 -$33 -$351 -$33 $81 -$260 $239 $200 -$44 $325 -$137
2018 Total Taxes $59,366 $57,804 $59,961 $67,217 $62,470 $71,811 $67,125 $68,608 $67,996 $68,339 $64,081
2017 Total Taxes $60,145 $57,838 $60,313 $67,250 $62,389 $72,071 $66,886 $68,409 $68,039 $68,014 $64,219
Average Tax Rate Change -0.4% 0.0% -0.2% 0.0% 0.0% -0.1% 0.1% 0.1% 0.0% 0.2% -0.1%
2018 Average Tax Rate 29.1% 28.6% 29.7% 33.2% 30.7% 35.6% 32.8% 33.7% 33.6% 33.2% 31.6%
2017 Average Tax Rate 29.5% 28.6% 29.9% 33.2% 30.6% 35.7% 32.7% 33.6% 33.6% 33.0% 31.6%
Total Tax -$779 -$33 -$351 -$33 $81 -$60 $239 $200 -$44 $325 -$92
CPP/QPP -$18 $1 $6 $1 -$13 $11 -$28 -$13 $3 -$42 -$6
EI/QPIP $21 $27 $29 $27 $22 $35 $17 $22 $28 $12 $26
Health Taxes/RAMQ -$936 $0 $0 $0 -$24 $3 $0 $0 $0 $0 -$132
Federal Income Tax $91 -$59 -$96 -$59 $54 -$109 $166 $54 -$77 $278 $1
Provincial Income Tax $63 -$3 -$290 -$2 $43 $0 $84 $137 $2 $77 $19
Bracket Creep $0 $0 $90 $0 $19 $0 $83 $137 $132 $100 $18
Canada Child Benefit $0 $0 $0 $0 $0 $0 $0 $0 $0 $0 $0
School Supplies Supplement $0 $0 $0 $0 $0 $200 $0 $0 $0 $0 $46
2017 to 2018 Details of Tax Changes
2017 to 2018 Changes in Child Benefits
Dual Earners Two Kids- 75/25 - $200,000

2018 New Year’s Tax Changes Page 68
Jeff Bowes Research Director December 2017
BC AB SK MB ON QC NB PE NS NL Canada
Tax Change -$4 -$39 -$476 -$38 $59 -$253 $236 $179 $33 $159 -$48
2018 Total Taxes $80,683 $77,792 $80,817 $89,240 $84,764 $95,714 $90,740 $91,252 $91,784 $91,283 $86,360
2017 Total Taxes $80,687 $77,830 $81,293 $89,278 $84,705 $95,967 $90,504 $91,074 $91,752 $91,124 $86,408
Average Tax Rate Change 0.0% 0.0% -0.2% 0.0% 0.0% -0.1% 0.1% 0.1% 0.0% 0.1% 0.0%
2018 Average Tax Rate 31.6% 30.7% 32.0% 35.3% 33.3% 38.0% 35.4% 35.9% 36.3% 35.4% 34.0%
2017 Average Tax Rate 31.6% 30.8% 32.2% 35.3% 33.3% 38.1% 35.4% 35.8% 36.3% 35.4% 34.1%
Total Tax -$4 -$39 -$476 -$38 $59 -$53 $236 $179 $33 $159 -$2
CPP/QPP -$43 -$2 $8 -$2 -$33 $19 -$64 -$33 $3 -$94 -$17
EI/QPIP $11 $24 $27 $24 $14 $35 $4 $14 $26 -$6 $20
Health Taxes/RAMQ -$936 $0 $0 $0 -$24 $3 $0 $0 $0 $0 -$132
Federal Income Tax $96 -$58 -$96 -$58 $58 -$110 $173 $58 -$77 $289 $4
Provincial Income Tax $869 -$3 -$415 -$2 $44 $0 $122 $140 $81 -$29 $122
Bracket Creep $0 $0 $90 $0 $19 $0 $117 $137 $144 $0 $17
Canada Child Benefit $0 $0 $0 $0 $0 $0 $0 $0 $0 $0 $0
School Supplies Supplement $0 $0 $0 $0 $0 $200 $0 $0 $0 $0 $46
2017 to 2018 Details of Tax Changes
2017 to 2018 Changes in Child Benefits
Dual Earners Two Kids- 75/25 - $250,000