Embed Size (px)
Citation preview
2018SEMI-ANNUAL REPORTMay 31 , 2018
Brookfield Investment Management
Center Coast Brookfield MLP & Energy Infrastructure Fund
IN PROFILE
Brookfield Investment Management (the “Firm”) is an SEC-registeredinvestment adviser and represents the Public Securities platform ofBrookfield Asset Management. The Firm provides global listed real assetsstrategies including real estate equities, infrastructure equities, real assetdebt and diversified real assets. With approximately $20 billion of assetsunder management as of June 30, 2018, the Firm manages separateaccounts, registered funds and opportunistic strategies for institutional andindividual clients, including financial institutions, public and private pensionplans, insurance companies, endowments and foundations, sovereignwealth funds and high net worth investors. The Firm is a wholly ownedsubsidiary of Brookfield Asset Management, a leading global alternativeasset manager with more than $285 billion of assets under management asof March 31, 2018. For more information, go to www.brookfield.com.
Center Coast Brookfield MLP & Energy Infrastructure Fund is managed byBrookfield Investment Management. The Fund uses its website as a channelof distribution of material company information. Financial and other materialinformation regarding the Fund is routinely posted on and accessible atwww.brookfield.com.
Letter to Shareholders . . . . . . . . . . . . . . . . . . . . . . . . . . . . . . . . . . . . . . . . . . . . . . . . . . . . . . . . . . . . . . . . . . . . . . . . . . . . . . 1
Portfolio Characteristics . . . . . . . . . . . . . . . . . . . . . . . . . . . . . . . . . . . . . . . . . . . . . . . . . . . . . . . . . . . . . . . . . . . . . . . . . . . . . 3
Schedule of Investments. . . . . . . . . . . . . . . . . . . . . . . . . . . . . . . . . . . . . . . . . . . . . . . . . . . . . . . . . . . . . . . . . . . . . . . . . . . . . 4
Statement of Assets and Liabilities. . . . . . . . . . . . . . . . . . . . . . . . . . . . . . . . . . . . . . . . . . . . . . . . . . . . . . . . . . . . . . . . . . . . 6
Statement of Operations. . . . . . . . . . . . . . . . . . . . . . . . . . . . . . . . . . . . . . . . . . . . . . . . . . . . . . . . . . . . . . . . . . . . . . . . . . . . . 7
Statements of Changes in Net Assets . . . . . . . . . . . . . . . . . . . . . . . . . . . . . . . . . . . . . . . . . . . . . . . . . . . . . . . . . . . . . . . . . 8
Statement of Cash Flows . . . . . . . . . . . . . . . . . . . . . . . . . . . . . . . . . . . . . . . . . . . . . . . . . . . . . . . . . . . . . . . . . . . . . . . . . . . . 9
Financial Highlights . . . . . . . . . . . . . . . . . . . . . . . . . . . . . . . . . . . . . . . . . . . . . . . . . . . . . . . . . . . . . . . . . . . . . . . . . . . . . . . . .10
Notes to Financial Statements . . . . . . . . . . . . . . . . . . . . . . . . . . . . . . . . . . . . . . . . . . . . . . . . . . . . . . . . . . . . . . . . . . . . . . . .11
Compliance Certification. . . . . . . . . . . . . . . . . . . . . . . . . . . . . . . . . . . . . . . . . . . . . . . . . . . . . . . . . . . . . . . . . . . . . . . . . . . . .25
Proxy Results . . . . . . . . . . . . . . . . . . . . . . . . . . . . . . . . . . . . . . . . . . . . . . . . . . . . . . . . . . . . . . . . . . . . . . . . . . . . . . . . . . . . . .26
Board Considerations Relating to the Investment Advisory Agreement . . . . . . . . . . . . . . . . . . . . . . . . . . . . . . . . . . . . .27
Dividend Reinvestment Plan. . . . . . . . . . . . . . . . . . . . . . . . . . . . . . . . . . . . . . . . . . . . . . . . . . . . . . . . . . . . . . . . . . . . . . . . . .30
Joint Notice of Privacy Policy . . . . . . . . . . . . . . . . . . . . . . . . . . . . . . . . . . . . . . . . . . . . . . . . . . . . . . . . . . . . . . . . . . . . . . . . .31
This report is for shareholder information. This is not a prospectus intended for use in the purchase or sale of Fund shares.
NOT FDIC INSURED MAY LOSE VALUE NOT BANK GUARANTEED
TABLE OF CONTENTS

[THIS PAGE IS INTENTIONALLY LEFT BLANK]
Dear Shareholders,
We are pleased to provide the Semi-Annual Report for Center Coast Brookfield MLP & Energy Infrastructure Fund(the “Fund”) for the six-month period ended May 31, 2018.
The energy infrastructure sector continued on its recovery path during the six-month period ended May 31, 2018,with generally positive investment returns and continued improvement in fundamentals. However, the missingingredient in this recovery continues to be the lack of fund flows into the sector, which we believe will simply takemore time. The Alerian MLP Index had a positive return of 5.71% during the six-month period. While this positivereturn was welcomed by investors, the volatility of the sector was noteworthy with a strong start (December andJanuary), a very weak middle (February and March) followed by a resumption of the recovery in April and May.With this backdrop, the Fund’s net asset value return underperformed the Alerian MLP Index, posting a positivereturn of 3.63% during the six-month period. . We attribute our underperformance to the Fund’s exposure tosecurities that were adversely impacted by the surprise announcement in March from the Federal EnergyRegulatory Commission (“FERC”), discussed in more detail below.
The FERC announcement on March 15th, 2018 to disallow an MLP to recover an income tax allowance in its costof service rates contributed to the heightened volatility during the quarter and also impacted a select number ofsecurities in the Fund. These types of policy/tax changes are difficult to predict, but we believe the impact islargely (if not entirely) already priced-into security prices, and also, many companies in our Fund are not expectedto experience a material negative impact. However, this change in tax policy is directionally negative for the sectorand is likely also impacting investor sentiment, which is an important missing component of this recovery.
After the date of this report, the FERC made another surprise announcement on July 18, 2018 with a modifiedproposal that clarified the original March ruling. The modified proposal, in our view, substantially mitigates thepotential rate reductions through the removal of Accumulated Deferred Income Taxes (ADIT) from the rate baseand by allowing consolidated MLPs to include a federal income tax allowance in certain instances. At a minimum,the additional clarity provided by the modified proposal should ameliorate the uncertainty surrounding thosenames most impacted by the recent FERC actions.
We continue to be encouraged by the strong fundamentals across the energy infrastructure sector, whichcontinued to improve during the first quarter earnings season. Production across all hydrocarbons continue topush past record levels and drive meaningful volume growth across the midstream sector. The strongfundamentals are being driven by several factors, including: significant production efficiency gains which makeNorth American production competitive in a global market; continued strong demand for the commodities driven bysynchronized global economic expansion; a shortage of critical pipeline capacity in certain regions of the country,stronger financial health among customers – specifically upstream exploration and production companies thatfaced increased bankruptcy risk in 2016 and are now once again able to invest in future growth, pay dividends andbuyback stock; and lastly a more healthy commodity price backdrop which is spurring investment. We anticipatethat these factors will remain in place for the short-to-medium term. However, we are watching intently for anysigns of change which could alter the current strong fundamental backdrop.
We have also witnessed the continued trend towards corporate simplification during the period. Thesesimplifications are likely to be a positive for the sector over the long term as companies are better positioned tofund growth internally (rather than relying on external equity issuance), balance sheets are stronger, and simplestructures are replacing complexity.
We believe the combination of strong and further improving fundamentals, depressed valuations, good currentincome, and healthier balance sheets represent an attractive investment opportunity. We believe investorsentiment, and thus fund flows, will eventually catch-up with the fundamentals.
LETTER TO SHAREHOLDERS
2018 Semi-Annual Report 1
In addition to performance information, this report provides the Fund’s unaudited financial statements.
We welcome your questions and comments, and encourage you to contact our Investor Relations team at (855)777-8001 or visit us at www.brookfield.com for more information. Thank you for your support.
Sincerely,
Brian F. Hurley
PresidentCenter Coast Brookfield MLP & Energy InfrastructureFund
Craig Noble, CFA
CEO, Chief Investment Officer and Portfolio ManagerBrookfield Investment Management Inc.
LETTER TO SHAREHOLDERS (continued)
2 Brookfield Investment Management Inc.
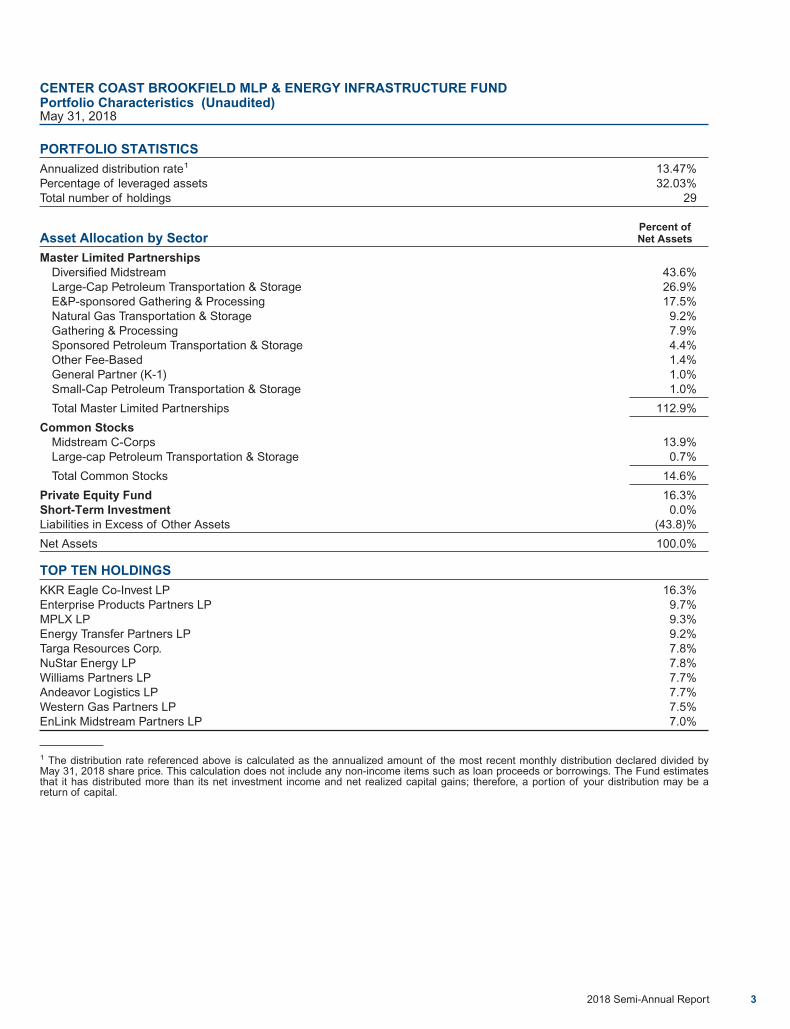
PORTFOLIO STATISTICS
Annualized distribution rate1 13.47%Percentage of leveraged assets 32.03%Total number of holdings 29
Asset Allocation by SectorPercent ofNet Assets
Master Limited PartnershipsDiversified Midstream 43.6%Large-Cap Petroleum Transportation & Storage 26.9%E&P-sponsored Gathering & Processing 17.5%Natural Gas Transportation & Storage 9.2%Gathering & Processing 7.9%Sponsored Petroleum Transportation & Storage 4.4%Other Fee-Based 1.4%General Partner (K-1) 1.0%Small-Cap Petroleum Transportation & Storage 1.0%
Total Master Limited Partnerships 112.9%
Common StocksMidstream C-Corps 13.9%Large-cap Petroleum Transportation & Storage 0.7%
Total Common Stocks 14.6%
Private Equity Fund 16.3%Short-Term Investment 0.0%Liabilities in Excess of Other Assets (43.8)%
Net Assets 100.0%
TOP TEN HOLDINGS
KKR Eagle Co-Invest LP 16.3%Enterprise Products Partners LP 9.7%MPLX LP 9.3%Energy Transfer Partners LP 9.2%Targa Resources Corp. 7.8%NuStar Energy LP 7.8%Williams Partners LP 7.7%Andeavor Logistics LP 7.7%Western Gas Partners LP 7.5%EnLink Midstream Partners LP 7.0%
1 The distribution rate referenced above is calculated as the annualized amount of the most recent monthly distribution declared divided byMay 31, 2018 share price. This calculation does not include any non-income items such as loan proceeds or borrowings. The Fund estimatesthat it has distributed more than its net investment income and net realized capital gains; therefore, a portion of your distribution may be areturn of capital.
CENTER COAST BROOKFIELD MLP & ENERGY INFRASTRUCTURE FUNDPortfolio Characteristics (Unaudited)May 31, 2018
2018 Semi-Annual Report 3
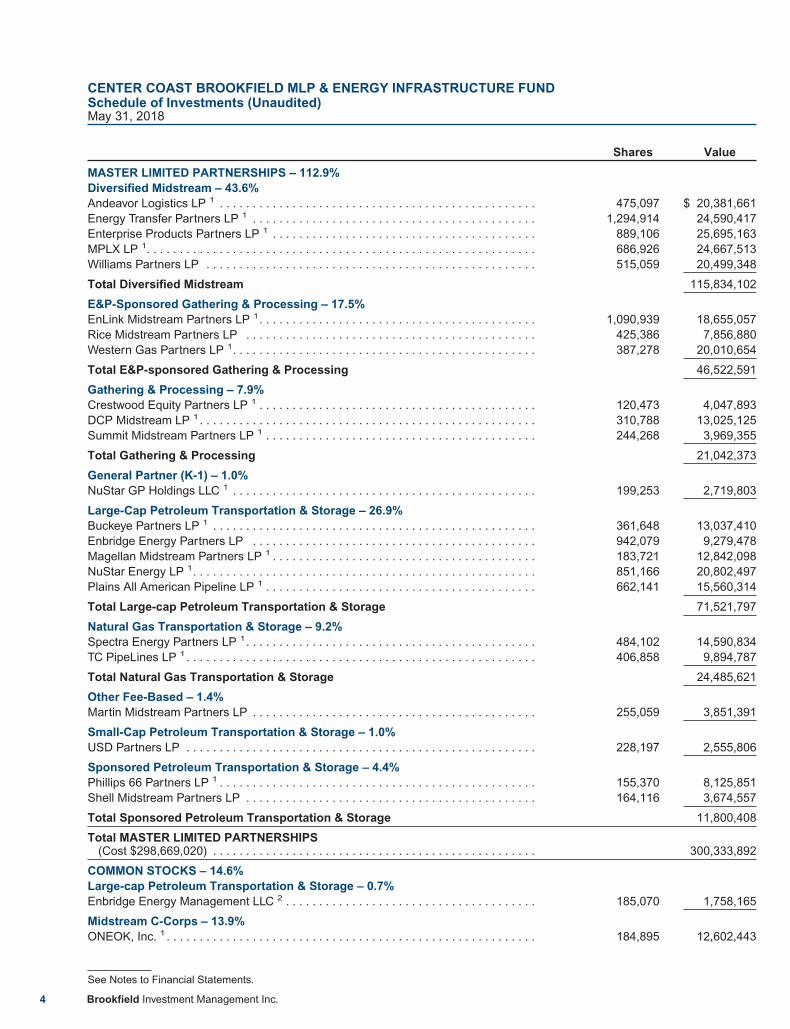
Shares Value
MASTER LIMITED PARTNERSHIPS – 112.9%Diversified Midstream – 43.6%Andeavor Logistics LP 1 . . . . . . . . . . . . . . . . . . . . . . . . . . . . . . . . . . . . . . . . . . . . . . . . 475,097 $ 20,381,661Energy Transfer Partners LP 1 . . . . . . . . . . . . . . . . . . . . . . . . . . . . . . . . . . . . . . . . . . . 1,294,914 24,590,417Enterprise Products Partners LP 1 . . . . . . . . . . . . . . . . . . . . . . . . . . . . . . . . . . . . . . . . 889,106 25,695,163MPLX LP 1. . . . . . . . . . . . . . . . . . . . . . . . . . . . . . . . . . . . . . . . . . . . . . . . . . . . . . . . . . . 686,926 24,667,513Williams Partners LP . . . . . . . . . . . . . . . . . . . . . . . . . . . . . . . . . . . . . . . . . . . . . . . . . . 515,059 20,499,348
Total Diversified Midstream 115,834,102
E&P-Sponsored Gathering & Processing – 17.5%EnLink Midstream Partners LP 1. . . . . . . . . . . . . . . . . . . . . . . . . . . . . . . . . . . . . . . . . . 1,090,939 18,655,057Rice Midstream Partners LP . . . . . . . . . . . . . . . . . . . . . . . . . . . . . . . . . . . . . . . . . . . . 425,386 7,856,880Western Gas Partners LP 1. . . . . . . . . . . . . . . . . . . . . . . . . . . . . . . . . . . . . . . . . . . . . . 387,278 20,010,654
Total E&P-sponsored Gathering & Processing 46,522,591
Gathering & Processing – 7.9%Crestwood Equity Partners LP 1 . . . . . . . . . . . . . . . . . . . . . . . . . . . . . . . . . . . . . . . . . . 120,473 4,047,893DCP Midstream LP 1. . . . . . . . . . . . . . . . . . . . . . . . . . . . . . . . . . . . . . . . . . . . . . . . . . . 310,788 13,025,125Summit Midstream Partners LP 1 . . . . . . . . . . . . . . . . . . . . . . . . . . . . . . . . . . . . . . . . . 244,268 3,969,355
Total Gathering & Processing 21,042,373
General Partner (K-1) – 1.0%NuStar GP Holdings LLC 1 . . . . . . . . . . . . . . . . . . . . . . . . . . . . . . . . . . . . . . . . . . . . . . 199,253 2,719,803
Large-Cap Petroleum Transportation & Storage – 26.9%Buckeye Partners LP 1 . . . . . . . . . . . . . . . . . . . . . . . . . . . . . . . . . . . . . . . . . . . . . . . . . 361,648 13,037,410Enbridge Energy Partners LP . . . . . . . . . . . . . . . . . . . . . . . . . . . . . . . . . . . . . . . . . . . 942,079 9,279,478Magellan Midstream Partners LP 1 . . . . . . . . . . . . . . . . . . . . . . . . . . . . . . . . . . . . . . . . 183,721 12,842,098NuStar Energy LP 1. . . . . . . . . . . . . . . . . . . . . . . . . . . . . . . . . . . . . . . . . . . . . . . . . . . . 851,166 20,802,497Plains All American Pipeline LP 1 . . . . . . . . . . . . . . . . . . . . . . . . . . . . . . . . . . . . . . . . . 662,141 15,560,314
Total Large-cap Petroleum Transportation & Storage 71,521,797
Natural Gas Transportation & Storage – 9.2%Spectra Energy Partners LP 1. . . . . . . . . . . . . . . . . . . . . . . . . . . . . . . . . . . . . . . . . . . . 484,102 14,590,834TC PipeLines LP 1 . . . . . . . . . . . . . . . . . . . . . . . . . . . . . . . . . . . . . . . . . . . . . . . . . . . . . 406,858 9,894,787
Total Natural Gas Transportation & Storage 24,485,621
Other Fee-Based – 1.4%Martin Midstream Partners LP . . . . . . . . . . . . . . . . . . . . . . . . . . . . . . . . . . . . . . . . . . . 255,059 3,851,391
Small-Cap Petroleum Transportation & Storage – 1.0%USD Partners LP . . . . . . . . . . . . . . . . . . . . . . . . . . . . . . . . . . . . . . . . . . . . . . . . . . . . . 228,197 2,555,806
Sponsored Petroleum Transportation & Storage – 4.4%Phillips 66 Partners LP 1 . . . . . . . . . . . . . . . . . . . . . . . . . . . . . . . . . . . . . . . . . . . . . . . . 155,370 8,125,851Shell Midstream Partners LP . . . . . . . . . . . . . . . . . . . . . . . . . . . . . . . . . . . . . . . . . . . . 164,116 3,674,557
Total Sponsored Petroleum Transportation & Storage 11,800,408
Total MASTER LIMITED PARTNERSHIPS(Cost $298,669,020) . . . . . . . . . . . . . . . . . . . . . . . . . . . . . . . . . . . . . . . . . . . . . . . . . 300,333,892
COMMON STOCKS – 14.6%Large-cap Petroleum Transportation & Storage – 0.7%Enbridge Energy Management LLC 2 . . . . . . . . . . . . . . . . . . . . . . . . . . . . . . . . . . . . . . 185,070 1,758,165
Midstream C-Corps – 13.9%ONEOK, Inc. 1 . . . . . . . . . . . . . . . . . . . . . . . . . . . . . . . . . . . . . . . . . . . . . . . . . . . . . . . . 184,895 12,602,443
CENTER COAST BROOKFIELD MLP & ENERGY INFRASTRUCTURE FUNDSchedule of Investments (Unaudited)May 31, 2018
See Notes to Financial Statements.
4 Brookfield Investment Management Inc.
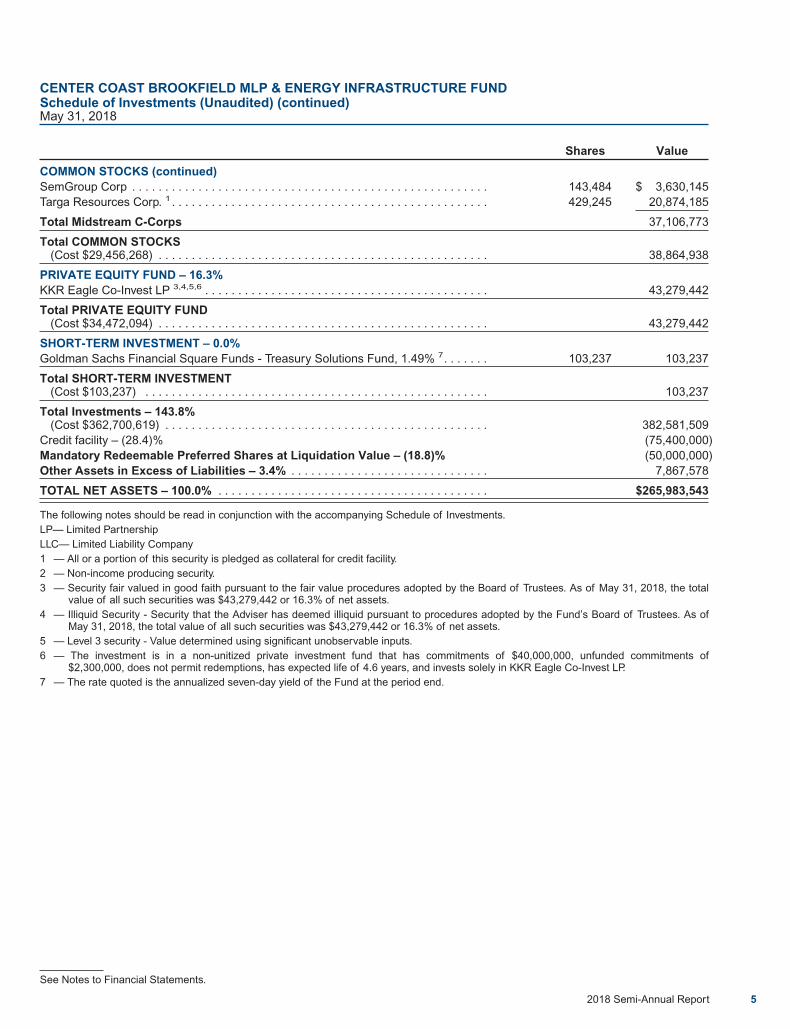
Shares Value
COMMON STOCKS (continued)SemGroup Corp . . . . . . . . . . . . . . . . . . . . . . . . . . . . . . . . . . . . . . . . . . . . . . . . . . . . . . 143,484 $ 3,630,145Targa Resources Corp. 1 . . . . . . . . . . . . . . . . . . . . . . . . . . . . . . . . . . . . . . . . . . . . . . . . 429,245 20,874,185
Total Midstream C-Corps 37,106,773
Total COMMON STOCKS(Cost $29,456,268) . . . . . . . . . . . . . . . . . . . . . . . . . . . . . . . . . . . . . . . . . . . . . . . . . . 38,864,938
PRIVATE EQUITY FUND – 16.3%KKR Eagle Co-Invest LP 3,4,5,6 . . . . . . . . . . . . . . . . . . . . . . . . . . . . . . . . . . . . . . . . . . . 43,279,442
Total PRIVATE EQUITY FUND(Cost $34,472,094) . . . . . . . . . . . . . . . . . . . . . . . . . . . . . . . . . . . . . . . . . . . . . . . . . . 43,279,442
SHORT-TERM INVESTMENT – 0.0%Goldman Sachs Financial Square Funds - Treasury Solutions Fund, 1.49% 7. . . . . . . 103,237 103,237
Total SHORT-TERM INVESTMENT(Cost $103,237) . . . . . . . . . . . . . . . . . . . . . . . . . . . . . . . . . . . . . . . . . . . . . . . . . . . . 103,237
Total Investments – 143.8%(Cost $362,700,619) . . . . . . . . . . . . . . . . . . . . . . . . . . . . . . . . . . . . . . . . . . . . . . . . . 382,581,509
Credit facility – (28.4)% (75,400,000)Mandatory Redeemable Preferred Shares at Liquidation Value – (18.8)% (50,000,000)Other Assets in Excess of Liabilities – 3.4% . . . . . . . . . . . . . . . . . . . . . . . . . . . . . . 7,867,578
TOTAL NET ASSETS – 100.0% . . . . . . . . . . . . . . . . . . . . . . . . . . . . . . . . . . . . . . . . . $265,983,543
The following notes should be read in conjunction with the accompanying Schedule of Investments.LP— Limited PartnershipLLC— Limited Liability Company1 — All or a portion of this security is pledged as collateral for credit facility.2 — Non-income producing security.3 — Security fair valued in good faith pursuant to the fair value procedures adopted by the Board of Trustees. As of May 31, 2018, the total
value of all such securities was $43,279,442 or 16.3% of net assets.4 — Illiquid Security - Security that the Adviser has deemed illiquid pursuant to procedures adopted by the Fund’s Board of Trustees. As of
May 31, 2018, the total value of all such securities was $43,279,442 or 16.3% of net assets.5 — Level 3 security - Value determined using significant unobservable inputs.6 — The investment is in a non-unitized private investment fund that has commitments of $40,000,000, unfunded commitments of
$2,300,000, does not permit redemptions, has expected life of 4.6 years, and invests solely in KKR Eagle Co-Invest LP.7 — The rate quoted is the annualized seven-day yield of the Fund at the period end.
CENTER COAST BROOKFIELD MLP & ENERGY INFRASTRUCTURE FUNDSchedule of Investments (Unaudited) (continued)May 31, 2018
See Notes to Financial Statements.
2018 Semi-Annual Report 5
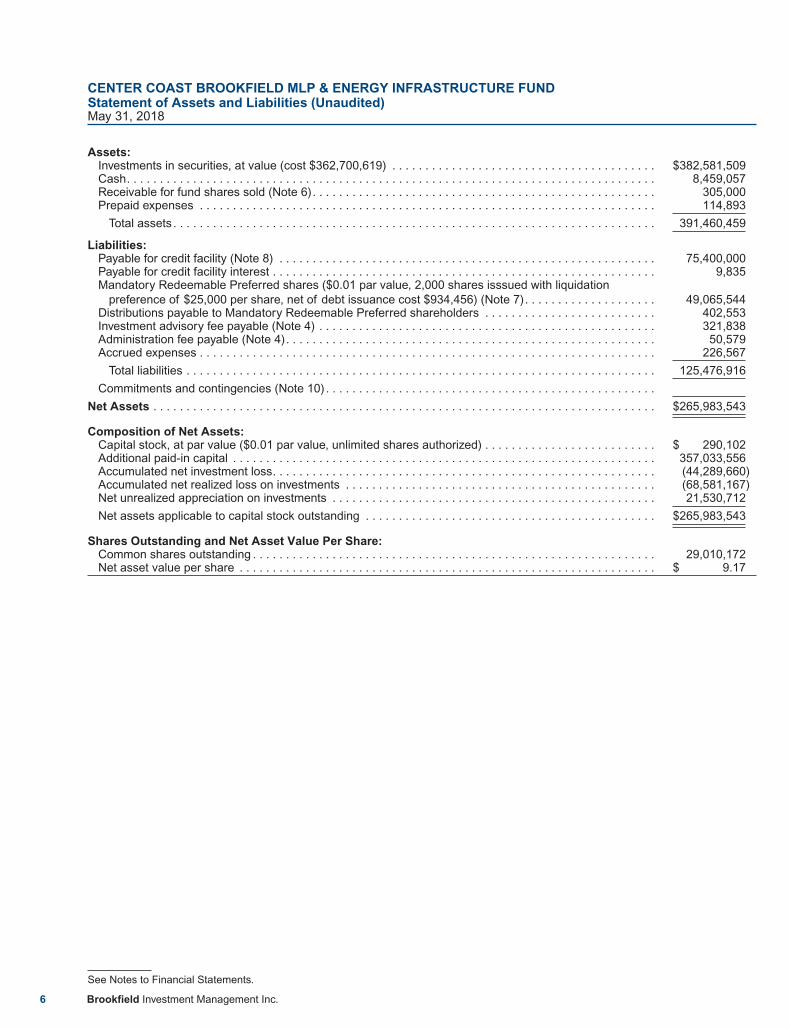
Assets:Investments in securities, at value (cost $362,700,619) . . . . . . . . . . . . . . . . . . . . . . . . . . . . . . . . . . . . . . . . $382,581,509Cash. . . . . . . . . . . . . . . . . . . . . . . . . . . . . . . . . . . . . . . . . . . . . . . . . . . . . . . . . . . . . . . . . . . . . . . . . . . . . . . . 8,459,057Receivable for fund shares sold (Note 6). . . . . . . . . . . . . . . . . . . . . . . . . . . . . . . . . . . . . . . . . . . . . . . . . . . . 305,000Prepaid expenses . . . . . . . . . . . . . . . . . . . . . . . . . . . . . . . . . . . . . . . . . . . . . . . . . . . . . . . . . . . . . . . . . . . . . 114,893
Total assets . . . . . . . . . . . . . . . . . . . . . . . . . . . . . . . . . . . . . . . . . . . . . . . . . . . . . . . . . . . . . . . . . . . . . . . . . 391,460,459
Liabilities:Payable for credit facility (Note 8) . . . . . . . . . . . . . . . . . . . . . . . . . . . . . . . . . . . . . . . . . . . . . . . . . . . . . . . . . 75,400,000Payable for credit facility interest . . . . . . . . . . . . . . . . . . . . . . . . . . . . . . . . . . . . . . . . . . . . . . . . . . . . . . . . . . 9,835Mandatory Redeemable Preferred shares ($0.01 par value, 2,000 shares isssued with liquidation
preference of $25,000 per share, net of debt issuance cost $934,456) (Note 7). . . . . . . . . . . . . . . . . . . . 49,065,544Distributions payable to Mandatory Redeemable Preferred shareholders . . . . . . . . . . . . . . . . . . . . . . . . . . 402,553Investment advisory fee payable (Note 4) . . . . . . . . . . . . . . . . . . . . . . . . . . . . . . . . . . . . . . . . . . . . . . . . . . . 321,838Administration fee payable (Note 4). . . . . . . . . . . . . . . . . . . . . . . . . . . . . . . . . . . . . . . . . . . . . . . . . . . . . . . . 50,579Accrued expenses . . . . . . . . . . . . . . . . . . . . . . . . . . . . . . . . . . . . . . . . . . . . . . . . . . . . . . . . . . . . . . . . . . . . . 226,567
Total liabilities . . . . . . . . . . . . . . . . . . . . . . . . . . . . . . . . . . . . . . . . . . . . . . . . . . . . . . . . . . . . . . . . . . . . . . . 125,476,916
Commitments and contingencies (Note 10) . . . . . . . . . . . . . . . . . . . . . . . . . . . . . . . . . . . . . . . . . . . . . . . . . .
Net Assets . . . . . . . . . . . . . . . . . . . . . . . . . . . . . . . . . . . . . . . . . . . . . . . . . . . . . . . . . . . . . . . . . . . . . . . . . . . . $265,983,543
Composition of Net Assets:Capital stock, at par value ($0.01 par value, unlimited shares authorized) . . . . . . . . . . . . . . . . . . . . . . . . . . $ 290,102Additional paid-in capital . . . . . . . . . . . . . . . . . . . . . . . . . . . . . . . . . . . . . . . . . . . . . . . . . . . . . . . . . . . . . . . . 357,033,556Accumulated net investment loss. . . . . . . . . . . . . . . . . . . . . . . . . . . . . . . . . . . . . . . . . . . . . . . . . . . . . . . . . . (44,289,660)Accumulated net realized loss on investments . . . . . . . . . . . . . . . . . . . . . . . . . . . . . . . . . . . . . . . . . . . . . . . (68,581,167)Net unrealized appreciation on investments . . . . . . . . . . . . . . . . . . . . . . . . . . . . . . . . . . . . . . . . . . . . . . . . . 21,530,712
Net assets applicable to capital stock outstanding . . . . . . . . . . . . . . . . . . . . . . . . . . . . . . . . . . . . . . . . . . . . $265,983,543
Shares Outstanding and Net Asset Value Per Share:Common shares outstanding . . . . . . . . . . . . . . . . . . . . . . . . . . . . . . . . . . . . . . . . . . . . . . . . . . . . . . . . . . . . . 29,010,172Net asset value per share . . . . . . . . . . . . . . . . . . . . . . . . . . . . . . . . . . . . . . . . . . . . . . . . . . . . . . . . . . . . . . . $ 9.17
CENTER COAST BROOKFIELD MLP & ENERGY INFRASTRUCTURE FUNDStatement of Assets and Liabilities (Unaudited)May 31, 2018
See Notes to Financial Statements.
6 Brookfield Investment Management Inc.
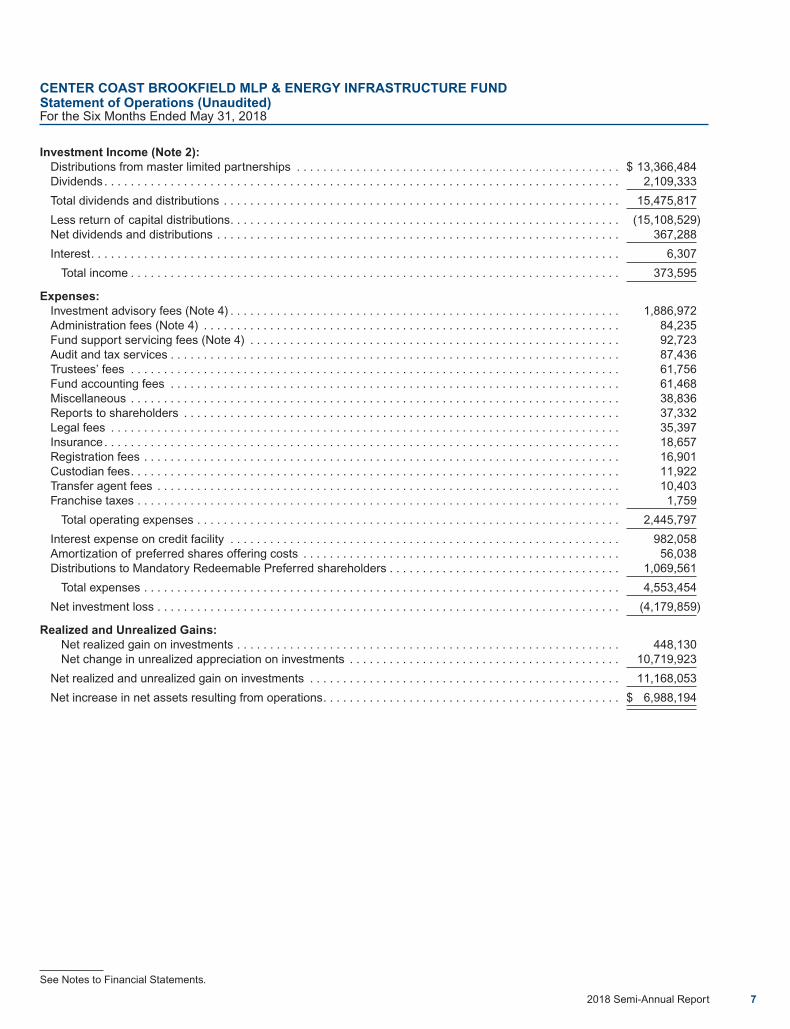
Investment Income (Note 2):Distributions from master limited partnerships . . . . . . . . . . . . . . . . . . . . . . . . . . . . . . . . . . . . . . . . . . . . . . . . . $ 13,366,484Dividends . . . . . . . . . . . . . . . . . . . . . . . . . . . . . . . . . . . . . . . . . . . . . . . . . . . . . . . . . . . . . . . . . . . . . . . . . . . . . . 2,109,333
Total dividends and distributions . . . . . . . . . . . . . . . . . . . . . . . . . . . . . . . . . . . . . . . . . . . . . . . . . . . . . . . . . . . . 15,475,817
Less return of capital distributions. . . . . . . . . . . . . . . . . . . . . . . . . . . . . . . . . . . . . . . . . . . . . . . . . . . . . . . . . . . (15,108,529)Net dividends and distributions . . . . . . . . . . . . . . . . . . . . . . . . . . . . . . . . . . . . . . . . . . . . . . . . . . . . . . . . . . . . . 367,288
Interest. . . . . . . . . . . . . . . . . . . . . . . . . . . . . . . . . . . . . . . . . . . . . . . . . . . . . . . . . . . . . . . . . . . . . . . . . . . . . . . . 6,307
Total income . . . . . . . . . . . . . . . . . . . . . . . . . . . . . . . . . . . . . . . . . . . . . . . . . . . . . . . . . . . . . . . . . . . . . . . . . . 373,595
Expenses:Investment advisory fees (Note 4) . . . . . . . . . . . . . . . . . . . . . . . . . . . . . . . . . . . . . . . . . . . . . . . . . . . . . . . . . . . 1,886,972Administration fees (Note 4) . . . . . . . . . . . . . . . . . . . . . . . . . . . . . . . . . . . . . . . . . . . . . . . . . . . . . . . . . . . . . . . 84,235Fund support servicing fees (Note 4) . . . . . . . . . . . . . . . . . . . . . . . . . . . . . . . . . . . . . . . . . . . . . . . . . . . . . . . . 92,723Audit and tax services . . . . . . . . . . . . . . . . . . . . . . . . . . . . . . . . . . . . . . . . . . . . . . . . . . . . . . . . . . . . . . . . . . . . 87,436Trustees’ fees . . . . . . . . . . . . . . . . . . . . . . . . . . . . . . . . . . . . . . . . . . . . . . . . . . . . . . . . . . . . . . . . . . . . . . . . . . 61,756Fund accounting fees . . . . . . . . . . . . . . . . . . . . . . . . . . . . . . . . . . . . . . . . . . . . . . . . . . . . . . . . . . . . . . . . . . . . 61,468Miscellaneous . . . . . . . . . . . . . . . . . . . . . . . . . . . . . . . . . . . . . . . . . . . . . . . . . . . . . . . . . . . . . . . . . . . . . . . . . . 38,836Reports to shareholders . . . . . . . . . . . . . . . . . . . . . . . . . . . . . . . . . . . . . . . . . . . . . . . . . . . . . . . . . . . . . . . . . . 37,332Legal fees . . . . . . . . . . . . . . . . . . . . . . . . . . . . . . . . . . . . . . . . . . . . . . . . . . . . . . . . . . . . . . . . . . . . . . . . . . . . . 35,397Insurance. . . . . . . . . . . . . . . . . . . . . . . . . . . . . . . . . . . . . . . . . . . . . . . . . . . . . . . . . . . . . . . . . . . . . . . . . . . . . . 18,657Registration fees . . . . . . . . . . . . . . . . . . . . . . . . . . . . . . . . . . . . . . . . . . . . . . . . . . . . . . . . . . . . . . . . . . . . . . . . 16,901Custodian fees. . . . . . . . . . . . . . . . . . . . . . . . . . . . . . . . . . . . . . . . . . . . . . . . . . . . . . . . . . . . . . . . . . . . . . . . . . 11,922Transfer agent fees . . . . . . . . . . . . . . . . . . . . . . . . . . . . . . . . . . . . . . . . . . . . . . . . . . . . . . . . . . . . . . . . . . . . . . 10,403Franchise taxes . . . . . . . . . . . . . . . . . . . . . . . . . . . . . . . . . . . . . . . . . . . . . . . . . . . . . . . . . . . . . . . . . . . . . . . . . 1,759
Total operating expenses . . . . . . . . . . . . . . . . . . . . . . . . . . . . . . . . . . . . . . . . . . . . . . . . . . . . . . . . . . . . . . . . 2,445,797
Interest expense on credit facility . . . . . . . . . . . . . . . . . . . . . . . . . . . . . . . . . . . . . . . . . . . . . . . . . . . . . . . . . . . 982,058Amortization of preferred shares offering costs . . . . . . . . . . . . . . . . . . . . . . . . . . . . . . . . . . . . . . . . . . . . . . . . 56,038Distributions to Mandatory Redeemable Preferred shareholders . . . . . . . . . . . . . . . . . . . . . . . . . . . . . . . . . . . 1,069,561
Total expenses . . . . . . . . . . . . . . . . . . . . . . . . . . . . . . . . . . . . . . . . . . . . . . . . . . . . . . . . . . . . . . . . . . . . . . . . 4,553,454
Net investment loss . . . . . . . . . . . . . . . . . . . . . . . . . . . . . . . . . . . . . . . . . . . . . . . . . . . . . . . . . . . . . . . . . . . . . . (4,179,859)
Realized and Unrealized Gains:Net realized gain on investments . . . . . . . . . . . . . . . . . . . . . . . . . . . . . . . . . . . . . . . . . . . . . . . . . . . . . . . . . . 448,130Net change in unrealized appreciation on investments . . . . . . . . . . . . . . . . . . . . . . . . . . . . . . . . . . . . . . . . . 10,719,923
Net realized and unrealized gain on investments . . . . . . . . . . . . . . . . . . . . . . . . . . . . . . . . . . . . . . . . . . . . . . . 11,168,053
Net increase in net assets resulting from operations. . . . . . . . . . . . . . . . . . . . . . . . . . . . . . . . . . . . . . . . . . . . . $ 6,988,194
CENTER COAST BROOKFIELD MLP & ENERGY INFRASTRUCTURE FUNDStatement of Operations (Unaudited)For the Six Months Ended May 31, 2018
See Notes to Financial Statements.
2018 Semi-Annual Report 7
For the SixMonths EndedMay 31, 2018(Unaudited)
For the FiscalYear Ended
November 30,2017
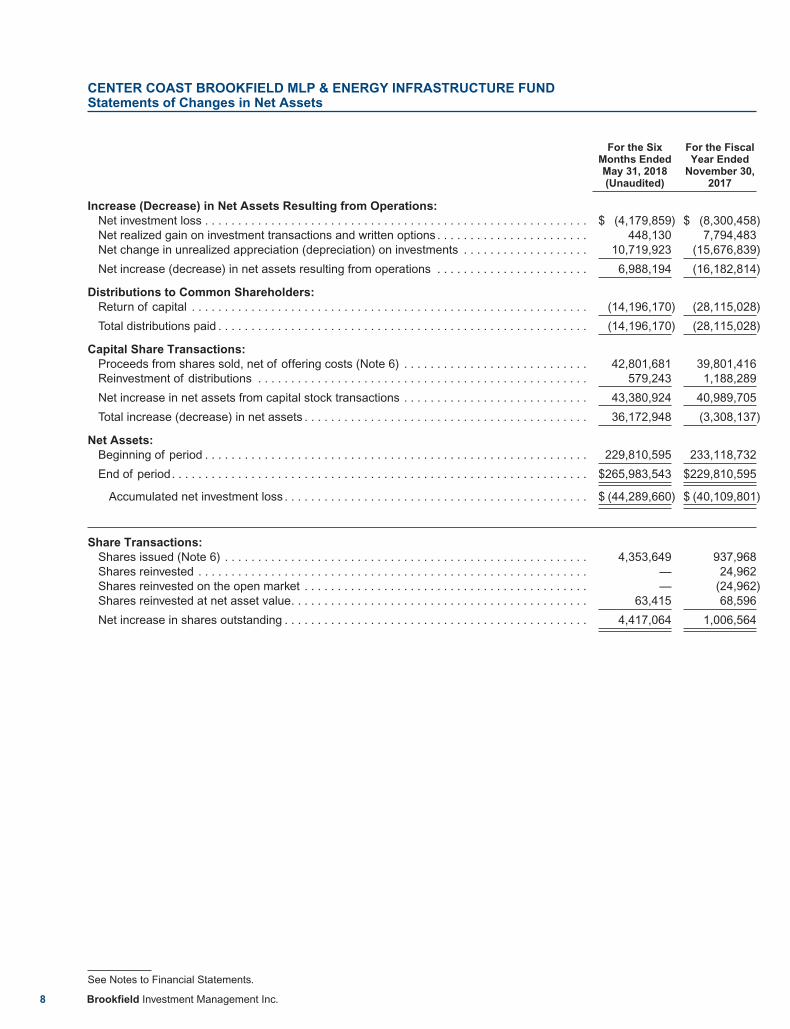
Increase (Decrease) in Net Assets Resulting from Operations:Net investment loss . . . . . . . . . . . . . . . . . . . . . . . . . . . . . . . . . . . . . . . . . . . . . . . . . . . . . . . . . . $ (4,179,859) $ (8,300,458)Net realized gain on investment transactions and written options . . . . . . . . . . . . . . . . . . . . . . . 448,130 7,794,483Net change in unrealized appreciation (depreciation) on investments . . . . . . . . . . . . . . . . . . . 10,719,923 (15,676,839)
Net increase (decrease) in net assets resulting from operations . . . . . . . . . . . . . . . . . . . . . . . 6,988,194 (16,182,814)
Distributions to Common Shareholders:Return of capital . . . . . . . . . . . . . . . . . . . . . . . . . . . . . . . . . . . . . . . . . . . . . . . . . . . . . . . . . . . . (14,196,170) (28,115,028)
Total distributions paid . . . . . . . . . . . . . . . . . . . . . . . . . . . . . . . . . . . . . . . . . . . . . . . . . . . . . . . . (14,196,170) (28,115,028)
Capital Share Transactions:Proceeds from shares sold, net of offering costs (Note 6) . . . . . . . . . . . . . . . . . . . . . . . . . . . . 42,801,681 39,801,416Reinvestment of distributions . . . . . . . . . . . . . . . . . . . . . . . . . . . . . . . . . . . . . . . . . . . . . . . . . . 579,243 1,188,289
Net increase in net assets from capital stock transactions . . . . . . . . . . . . . . . . . . . . . . . . . . . . 43,380,924 40,989,705
Total increase (decrease) in net assets . . . . . . . . . . . . . . . . . . . . . . . . . . . . . . . . . . . . . . . . . . . 36,172,948 (3,308,137)
Net Assets:Beginning of period . . . . . . . . . . . . . . . . . . . . . . . . . . . . . . . . . . . . . . . . . . . . . . . . . . . . . . . . . . 229,810,595 233,118,732
End of period. . . . . . . . . . . . . . . . . . . . . . . . . . . . . . . . . . . . . . . . . . . . . . . . . . . . . . . . . . . . . . . $265,983,543 $229,810,595
Accumulated net investment loss . . . . . . . . . . . . . . . . . . . . . . . . . . . . . . . . . . . . . . . . . . . . . . $ (44,289,660) $ (40,109,801)
Share Transactions:Shares issued (Note 6) . . . . . . . . . . . . . . . . . . . . . . . . . . . . . . . . . . . . . . . . . . . . . . . . . . . . . . . 4,353,649 937,968Shares reinvested . . . . . . . . . . . . . . . . . . . . . . . . . . . . . . . . . . . . . . . . . . . . . . . . . . . . . . . . . . . — 24,962Shares reinvested on the open market . . . . . . . . . . . . . . . . . . . . . . . . . . . . . . . . . . . . . . . . . . . — (24,962)Shares reinvested at net asset value. . . . . . . . . . . . . . . . . . . . . . . . . . . . . . . . . . . . . . . . . . . . . 63,415 68,596
Net increase in shares outstanding . . . . . . . . . . . . . . . . . . . . . . . . . . . . . . . . . . . . . . . . . . . . . . 4,417,064 1,006,564
CENTER COAST BROOKFIELD MLP & ENERGY INFRASTRUCTURE FUNDStatements of Changes in Net Assets
See Notes to Financial Statements.
8 Brookfield Investment Management Inc.
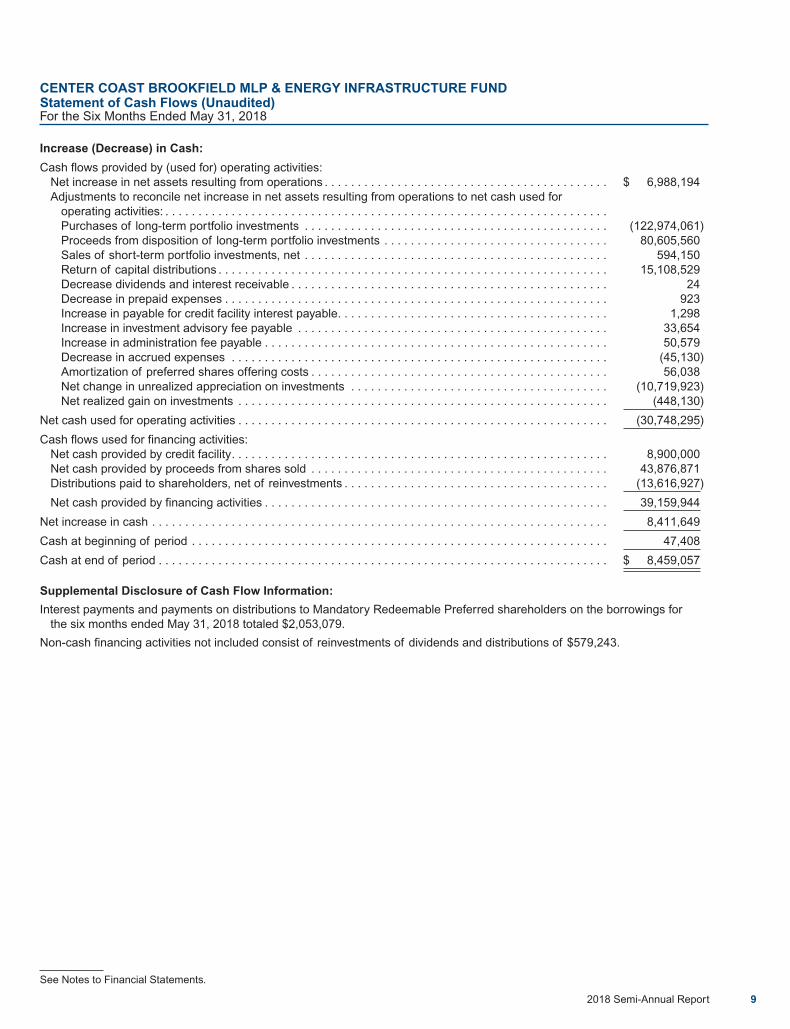
Increase (Decrease) in Cash:
Cash flows provided by (used for) operating activities:Net increase in net assets resulting from operations . . . . . . . . . . . . . . . . . . . . . . . . . . . . . . . . . . . . . . . . . . . $ 6,988,194Adjustments to reconcile net increase in net assets resulting from operations to net cash used for
operating activities: . . . . . . . . . . . . . . . . . . . . . . . . . . . . . . . . . . . . . . . . . . . . . . . . . . . . . . . . . . . . . . . . . . .Purchases of long-term portfolio investments . . . . . . . . . . . . . . . . . . . . . . . . . . . . . . . . . . . . . . . . . . . . . . (122,974,061)Proceeds from disposition of long-term portfolio investments . . . . . . . . . . . . . . . . . . . . . . . . . . . . . . . . . . 80,605,560Sales of short-term portfolio investments, net . . . . . . . . . . . . . . . . . . . . . . . . . . . . . . . . . . . . . . . . . . . . . . 594,150Return of capital distributions . . . . . . . . . . . . . . . . . . . . . . . . . . . . . . . . . . . . . . . . . . . . . . . . . . . . . . . . . . . 15,108,529Decrease dividends and interest receivable . . . . . . . . . . . . . . . . . . . . . . . . . . . . . . . . . . . . . . . . . . . . . . . . 24Decrease in prepaid expenses . . . . . . . . . . . . . . . . . . . . . . . . . . . . . . . . . . . . . . . . . . . . . . . . . . . . . . . . . . 923Increase in payable for credit facility interest payable. . . . . . . . . . . . . . . . . . . . . . . . . . . . . . . . . . . . . . . . . 1,298Increase in investment advisory fee payable . . . . . . . . . . . . . . . . . . . . . . . . . . . . . . . . . . . . . . . . . . . . . . . 33,654Increase in administration fee payable . . . . . . . . . . . . . . . . . . . . . . . . . . . . . . . . . . . . . . . . . . . . . . . . . . . . 50,579Decrease in accrued expenses . . . . . . . . . . . . . . . . . . . . . . . . . . . . . . . . . . . . . . . . . . . . . . . . . . . . . . . . . (45,130)Amortization of preferred shares offering costs . . . . . . . . . . . . . . . . . . . . . . . . . . . . . . . . . . . . . . . . . . . . . 56,038Net change in unrealized appreciation on investments . . . . . . . . . . . . . . . . . . . . . . . . . . . . . . . . . . . . . . . (10,719,923)Net realized gain on investments . . . . . . . . . . . . . . . . . . . . . . . . . . . . . . . . . . . . . . . . . . . . . . . . . . . . . . . . (448,130)
Net cash used for operating activities . . . . . . . . . . . . . . . . . . . . . . . . . . . . . . . . . . . . . . . . . . . . . . . . . . . . . . . . (30,748,295)
Cash flows used for financing activities:Net cash provided by credit facility. . . . . . . . . . . . . . . . . . . . . . . . . . . . . . . . . . . . . . . . . . . . . . . . . . . . . . . . . 8,900,000Net cash provided by proceeds from shares sold . . . . . . . . . . . . . . . . . . . . . . . . . . . . . . . . . . . . . . . . . . . . . 43,876,871Distributions paid to shareholders, net of reinvestments . . . . . . . . . . . . . . . . . . . . . . . . . . . . . . . . . . . . . . . . (13,616,927)
Net cash provided by financing activities . . . . . . . . . . . . . . . . . . . . . . . . . . . . . . . . . . . . . . . . . . . . . . . . . . . . 39,159,944
Net increase in cash . . . . . . . . . . . . . . . . . . . . . . . . . . . . . . . . . . . . . . . . . . . . . . . . . . . . . . . . . . . . . . . . . . . . . 8,411,649
Cash at beginning of period . . . . . . . . . . . . . . . . . . . . . . . . . . . . . . . . . . . . . . . . . . . . . . . . . . . . . . . . . . . . . . . 47,408
Cash at end of period . . . . . . . . . . . . . . . . . . . . . . . . . . . . . . . . . . . . . . . . . . . . . . . . . . . . . . . . . . . . . . . . . . . . $ 8,459,057
Supplemental Disclosure of Cash Flow Information:
Interest payments and payments on distributions to Mandatory Redeemable Preferred shareholders on the borrowings forthe six months ended May 31, 2018 totaled $2,053,079.
Non-cash financing activities not included consist of reinvestments of dividends and distributions of $579,243.
CENTER COAST BROOKFIELD MLP & ENERGY INFRASTRUCTURE FUNDStatement of Cash Flows (Unaudited)For the Six Months Ended May 31, 2018
See Notes to Financial Statements.
2018 Semi-Annual Report 9
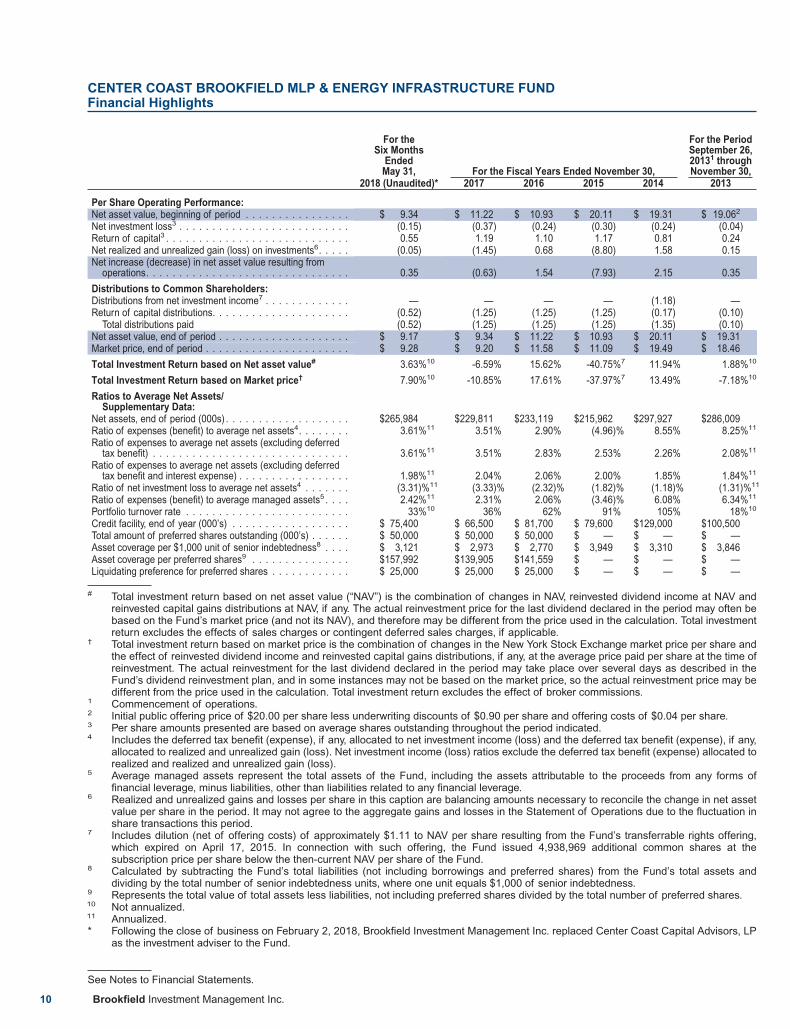
For theSix Months
EndedMay 31, For the Fiscal Years Ended November 30,
For the PeriodSeptember 26,20131 throughNovember 30,
2018 (Unaudited)* 2017 2016 2015 2014 2013
Per Share Operating Performance:Net asset value, beginning of period . . . . . . . . . . . . . . . . $ 9.34 $ 11.22 $ 10.93 $ 20.11 $ 19.31 $ 19.062
Net investment loss3 . . . . . . . . . . . . . . . . . . . . . . . . . . (0.15) (0.37) (0.24) (0.30) (0.24) (0.04)Return of capital3 . . . . . . . . . . . . . . . . . . . . . . . . . . . . 0.55 1.19 1.10 1.17 0.81 0.24Net realized and unrealized gain (loss) on investments6. . . . . (0.05) (1.45) 0.68 (8.80) 1.58 0.15Net increase (decrease) in net asset value resulting from
operations. . . . . . . . . . . . . . . . . . . . . . . . . . . . . . . 0.35 (0.63) 1.54 (7.93) 2.15 0.35
Distributions to Common Shareholders:Distributions from net investment income7 . . . . . . . . . . . . . — — — — (1.18) —Return of capital distributions. . . . . . . . . . . . . . . . . . . . . (0.52) (1.25) (1.25) (1.25) (0.17) (0.10)
Total distributions paid (0.52) (1.25) (1.25) (1.25) (1.35) (0.10)Net asset value, end of period . . . . . . . . . . . . . . . . . . . . $ 9.17 $ 9.34 $ 11.22 $ 10.93 $ 20.11 $ 19.31Market price, end of period . . . . . . . . . . . . . . . . . . . . . . $ 9.28 $ 9.20 $ 11.58 $ 11.09 $ 19.49 $ 18.46
Total Investment Return based on Net asset value# 3.63%10 -6.59% 15.62% -40.75%7 11.94% 1.88%10
Total Investment Return based on Market price† 7.90%10 -10.85% 17.61% -37.97%7 13.49% -7.18%10
Ratios to Average Net Assets/Supplementary Data:
Net assets, end of period (000s) . . . . . . . . . . . . . . . . . . . $265,984 $229,811 $233,119 $215,962 $297,927 $286,009Ratio of expenses (benefit) to average net assets4. . . . . . . . 3.61%11 3.51% 2.90% (4.96)% 8.55% 8.25%11
Ratio of expenses to average net assets (excluding deferredtax benefit) . . . . . . . . . . . . . . . . . . . . . . . . . . . . . . 3.61%11 3.51% 2.83% 2.53% 2.26% 2.08%11
Ratio of expenses to average net assets (excluding deferredtax benefit and interest expense) . . . . . . . . . . . . . . . . . 1.98%11 2.04% 2.06% 2.00% 1.85% 1.84%11
Ratio of net investment loss to average net assets4 . . . . . . . (3.31)%11 (3.33)% (2.32)% (1.82)% (1.18)% (1.31)%11
Ratio of expenses (benefit) to average managed assets5 . . . . 2.42%11 2.31% 2.06% (3.46)% 6.08% 6.34%11
Portfolio turnover rate . . . . . . . . . . . . . . . . . . . . . . . . . 33%10 36% 62% 91% 105% 18%10
Credit facility, end of year (000’s) . . . . . . . . . . . . . . . . . . $ 75,400 $ 66,500 $ 81,700 $ 79,600 $129,000 $100,500Total amount of preferred shares outstanding (000’s) . . . . . . $ 50,000 $ 50,000 $ 50,000 $ — $ — $ —Asset coverage per $1,000 unit of senior indebtedness8 . . . . $ 3,121 $ 2,973 $ 2,770 $ 3,949 $ 3,310 $ 3,846Asset coverage per preferred shares9 . . . . . . . . . . . . . . . $157,992 $139,905 $141,559 $ — $ — $ —Liquidating preference for preferred shares . . . . . . . . . . . . $ 25,000 $ 25,000 $ 25,000 $ — $ — $ —
# Total investment return based on net asset value (“NAV”) is the combination of changes in NAV, reinvested dividend income at NAV andreinvested capital gains distributions at NAV, if any. The actual reinvestment price for the last dividend declared in the period may often bebased on the Fund’s market price (and not its NAV), and therefore may be different from the price used in the calculation. Total investmentreturn excludes the effects of sales charges or contingent deferred sales charges, if applicable.
† Total investment return based on market price is the combination of changes in the New York Stock Exchange market price per share andthe effect of reinvested dividend income and reinvested capital gains distributions, if any, at the average price paid per share at the time ofreinvestment. The actual reinvestment for the last dividend declared in the period may take place over several days as described in theFund’s dividend reinvestment plan, and in some instances may not be based on the market price, so the actual reinvestment price may bedifferent from the price used in the calculation. Total investment return excludes the effect of broker commissions.
1 Commencement of operations.2 Initial public offering price of $20.00 per share less underwriting discounts of $0.90 per share and offering costs of $0.04 per share.3 Per share amounts presented are based on average shares outstanding throughout the period indicated.4 Includes the deferred tax benefit (expense), if any, allocated to net investment income (loss) and the deferred tax benefit (expense), if any,
allocated to realized and unrealized gain (loss). Net investment income (loss) ratios exclude the deferred tax benefit (expense) allocated torealized and realized and unrealized gain (loss).
5 Average managed assets represent the total assets of the Fund, including the assets attributable to the proceeds from any forms offinancial leverage, minus liabilities, other than liabilities related to any financial leverage.
6 Realized and unrealized gains and losses per share in this caption are balancing amounts necessary to reconcile the change in net assetvalue per share in the period. It may not agree to the aggregate gains and losses in the Statement of Operations due to the fluctuation inshare transactions this period.
7 Includes dilution (net of offering costs) of approximately $1.11 to NAV per share resulting from the Fund’s transferrable rights offering,which expired on April 17, 2015. In connection with such offering, the Fund issued 4,938,969 additional common shares at thesubscription price per share below the then-current NAV per share of the Fund.
8 Calculated by subtracting the Fund’s total liabilities (not including borrowings and preferred shares) from the Fund’s total assets anddividing by the total number of senior indebtedness units, where one unit equals $1,000 of senior indebtedness.
9 Represents the total value of total assets less liabilities, not including preferred shares divided by the total number of preferred shares.10 Not annualized.11 Annualized.* Following the close of business on February 2, 2018, Brookfield Investment Management Inc. replaced Center Coast Capital Advisors, LP
as the investment adviser to the Fund.
CENTER COAST BROOKFIELD MLP & ENERGY INFRASTRUCTURE FUNDFinancial Highlights
See Notes to Financial Statements.
10 Brookfield Investment Management Inc.
1. Organization
Center Coast Brookfield MLP & Energy Infrastructure Fund (the ‘‘Fund’’) is a non-diversified, closed-endmanagement investment company, registered under the Investment Company Act of 1940, as amended (the “1940Act”). The Fund was organized as a statutory trust on May 3, 2013, pursuant to a Certificate of Trust, and isgoverned by the laws of the state of Delaware. The Fund commenced operations on September 26, 2013.
Brookfield Investment Management Inc. (“BIM” or “Adviser”), a wholly-owned subsidiary of Brookfield AssetManagement Inc., is registered as an investment adviser under the Investment Advisers Act of 1940, as amended,and serves as investment adviser to the Fund. On February 2, 2018, Center Coast Capital Advisors, LP, the Fund’sformer investment adviser, was acquired by BIM and Center Coast MLP & Infrastructure Fund was renamed“Center Coast Brookfield MLP & Energy Infrastructure Fund.”
The investment objective of the Fund is to provide a high level of total return with an emphasis on distributions toshareholders. The Fund seeks to achieve its investment objective by investing primarily in a portfolio of masterlimited partnerships (“MLPs”) and energy infrastructure companies. No assurance can be given that the Fund’sinvestment objective will be achieved.
2. Significant Accounting Policies
The preparation of financial statements in conformity with accounting principles generally accepted in theUnited States of America (“GAAP”) requires management to make estimates and assumptions that affect thereported amounts of assets and liabilities and disclosure of contingent assets and liabilities at the date of thefinancial statements and the reported amounts of increases and decreases in net assets from operations duringthe reporting period. Actual results could differ from those estimates. The Fund is an investment company withinthe scope of Financial Accounting Standards Board (“FASB”) Accounting Standards Update (“ASU”) 2013-08 andfollows accounting and reporting guidance under FASB Accounting Standards Codification (“ASC”) Topic 946Financial Services-Investment Companies.
Valuation of Investments: The Fund’s Board of Trustees (the “Board”) has adopted procedures for the valuation ofthe Fund’s securities. The Adviser oversees the day to day responsibilities for valuation determinations underthese procedures. The Board regularly reviews the application of these procedures to the securities in the Fund’sportfolio. The Adviser’s Valuation Committee is comprised of senior members of the Adviser’s management team.There can be no assurance that the Fund could purchase or sell a portfolio security at the price used to calculatethe Fund’s net asset value (“NAV”).
Debt securities, including U.S. government securities, listed corporate bonds, other fixed income and asset-backedsecurities, and unlisted securities and private placement securities, are generally valued at the bid prices furnishedby an independent pricing service or, if not valued by an independent pricing service, using bid prices obtainedfrom active and reliable market makers in any such security or a broker-dealer. The broker-dealers or pricingservices use multiple valuation techniques to determine fair value. In instances where sufficient market activityexists, the broker-dealers or pricing services may utilize a market-based approach through which quotes frommarket makers are used to determine fair value. In instances where sufficient market activity may not exist or islimited, the broker-dealers or pricing services may also utilize proprietary valuation models which may considermarket transactions in comparable securities and the various relationships between securities in determining fairvalue and/or market characteristics such as benchmark yield curves, option-adjusted spreads, credit spreads,estimated default rates, coupon-rates, anticipated timing of principal repayments, underlying collateral, and otherunique security features in order to estimate the relevant cash flows, which are then discounted to calculate thefair values. Short-term debt securities with remaining maturities of sixty days or less are valued at amortized costof discount or premium to maturity, unless such valuation, in the judgment of the Adviser’s Valuation Committee,does not represent fair value.
CENTER COAST BROOKFIELD MLP & ENERGY INFRASTRUCTURE FUNDNotes to Financial Statements (Unaudited)May 31, 2018
2018 Semi-Annual Report 11
Investments in equity securities listed or traded on any securities exchange or traded in the over-the-countermarket are valued at the last trade price as of the close of business on the valuation date. Prices of foreignequities that are principally traded on certain foreign markets will generally be adjusted daily pursuant to a fairvalue pricing service approved by the Board in order to reflect an adjustment for the factors occurring after theclose of certain foreign markets but before the NYSE close. When fair value pricing is employed, the value of theportfolio securities used to calculate the Fund’s net asset values may differ from quoted or official closing prices.Investments in open-end registered investment companies, if any, are valued at the NAV as reported by thoseinvestment companies.
Securities for which market prices are not readily available or which cannot be valued using the sources describedabove will be valued using an internal proprietary fair value methodology. For any security warranting such fairvalue measurement, a memorandum, including the specific methodology and supporting information, will beprovided to the Valuation Committee by a portfolio manager or analyst looking to fair value a particular securityutilizing the internal proprietary fair value methodology. A portfolio manager or analyst shall use their best efforts tomaximize the use of relevant observable inputs and minimize the use of unobservable inputs within their valuationtechnique. The Valuation Committee shall review the memorandum and supporting information provided by aportfolio manager or analyst and consider all relevant factors as it deems appropriate before approving the fairvalue recommendation.
The Fund may use the fair value of a security to calculate its NAV when, for example, (1) a portfolio security is nottraded in a public market or the principal market in which the security trades is closed, (2) trading in a portfoliosecurity is suspended and not resumed prior to the normal market close, (3) a portfolio security is not traded insignificant volume for a substantial period, or (4) the Adviser determines that the quotation or price for a portfoliosecurity provided by a broker-dealer or an independent pricing service is inaccurate.
The fair value of securities may be difficult to determine and thus judgment plays a greater role in the valuationprocess. The fair valuation methodology may include or consider the following guidelines, as appropriate: (1)evaluation of all relevant factors, including, but not limited to, pricing history, current market level, supply anddemand of the respective security; (2) comparison to the values and current pricing of securities that havecomparable characteristics; (3) knowledge of historical market information with respect to the security; (4) otherfactors relevant to the security which would include, but not be limited to, duration, yield, fundamental analyticaldata, the Treasury yield curve, and credit quality.
The values assigned to fair valued investments are based on available information and do not necessarilyrepresent amounts that might ultimately be realized, since such amounts depend on future developments inherentin investments. Changes in the fair valuation of portfolio securities may be less frequent and of greater magnitudethan changes in the price of portfolio securities valued at their last sale price, by an independent pricing service, orbased on market quotations. Imprecision in estimating fair value can also impact the amount of unrealizedappreciation or depreciation recorded for a particular portfolio security and differences in the assumptions usedcould result in a different determination of fair value, and those differences could be material.
The Fund has established methods of fair value measurements in accordance with GAAP. Fair value denotes theprice that the Fund would receive upon selling an investment in a timely transaction to an independent buyer in theprincipal or most advantageous market of the investment. A three-tier hierarchy has been established to maximizethe use of observable market data and minimize the use of unobservable inputs and to establish classification offair value measurements for disclosure purposes. Inputs refer broadly to the assumptions that market participantswould use in pricing the asset or liability, including assumptions about risk, for example, the risk inherent in aparticular valuation technique used to measure fair value including such a pricing model and/or the risk inherent inthe inputs to the valuation technique. Inputs may be observable or unobservable. Observable inputs are inputsthat reflect the assumptions market participants would use in pricing the asset or liability developed based onmarket data obtained from sources independent of the reporting entity. Unobservable inputs are inputs that reflectthe reporting entity’s own assumptions about the assumptions market participants would use in pricing the asset
CENTER COAST BROOKFIELD MLP & ENERGY INFRASTRUCTURE FUNDNotes to Financial Statements (Unaudited) (continued)May 31, 2018
12 Brookfield Investment Management Inc.
or liability developed based on the best information available in the circumstances. The three-tier hierarchy ofinputs is summarized in the three broad levels listed below.
Level 1 - quoted prices in active markets for identical assets or liabilities
Level 2 - quoted prices in markets that are not active or other significant observable inputs (including, but notlimited to: quoted prices for similar assets or liabilities, quoted prices based on recently executedtransactions, interest rates, credit risk, etc.)
Level 3 - significant unobservable inputs (including the Fund’s own assumptions in determining the fair valueof assets or liabilities)
The Adviser’s valuation policy, as previously stated, establishes parameters for the sources and types of valuationanalysis, as well as, the methodologies and inputs the Valuation Committee uses in determining fair value. If theValuation Committee determines that additional techniques, sources or inputs are appropriate or necessary in agiven situation, such additional work will be undertaken.
Significant increases or decreases in any of the unobservable inputs in isolation may result in a lower or higher fairvalue measurement.
To assess the continuing appropriateness of security valuations, the Adviser (or its third party service provider,who is subject to oversight by the Adviser), regularly compares its prior day prices, prices on comparable securitiesand sale prices to the current day prices and challenges those prices that exceed certain tolerance levels with thethird party pricing service or broker source. For those securities valued by fair valuations, the Adviser’s ValuationCommittee reviews and affirms the reasonableness of the valuations based on such methodologies and fairvaluation determinations on a regular basis after considering all relevant information that is reasonably available.
The inputs or methodology used for valuing investments are not necessarily an indication of the risk associatedwith investing in those securities.
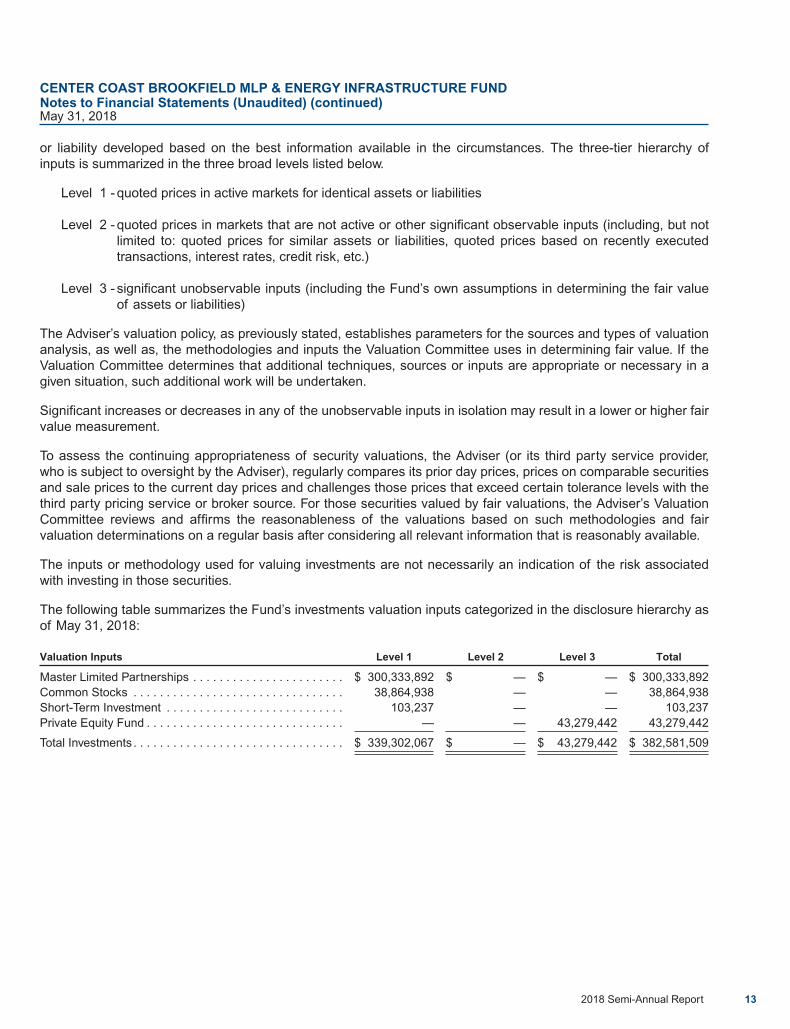
The following table summarizes the Fund’s investments valuation inputs categorized in the disclosure hierarchy asof May 31, 2018:
Valuation Inputs Level 1 Level 2 Level 3 Total
Master Limited Partnerships . . . . . . . . . . . . . . . . . . . . . . . $ 300,333,892 $ — $ — $ 300,333,892Common Stocks . . . . . . . . . . . . . . . . . . . . . . . . . . . . . . . . 38,864,938 — — 38,864,938Short-Term Investment . . . . . . . . . . . . . . . . . . . . . . . . . . . 103,237 — — 103,237Private Equity Fund . . . . . . . . . . . . . . . . . . . . . . . . . . . . . . — — 43,279,442 43,279,442
Total Investments . . . . . . . . . . . . . . . . . . . . . . . . . . . . . . . . $ 339,302,067 $ — $ 43,279,442 $ 382,581,509
CENTER COAST BROOKFIELD MLP & ENERGY INFRASTRUCTURE FUNDNotes to Financial Statements (Unaudited) (continued)May 31, 2018
2018 Semi-Annual Report 13
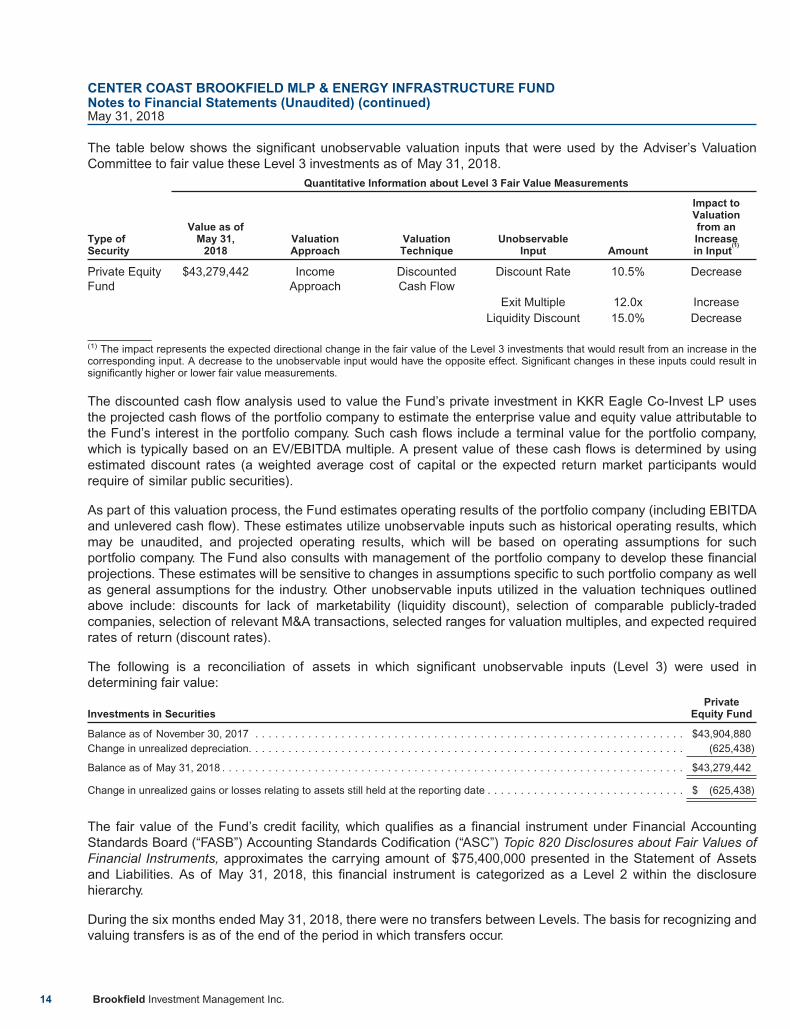
The table below shows the significant unobservable valuation inputs that were used by the Adviser’s ValuationCommittee to fair value these Level 3 investments as of May 31, 2018.
Quantitative Information about Level 3 Fair Value Measurements
Type ofSecurity
Value as ofMay 31,
2018ValuationApproach
ValuationTechnique
UnobservableInput Amount
Impact toValuationfrom anIncreasein Input
(1)
Private EquityFund
$43,279,442 IncomeApproach
DiscountedCash Flow
Discount Rate 10.5% Decrease
Exit Multiple 12.0x IncreaseLiquidity Discount 15.0% Decrease
(1) The impact represents the expected directional change in the fair value of the Level 3 investments that would result from an increase in thecorresponding input. A decrease to the unobservable input would have the opposite effect. Significant changes in these inputs could result insignificantly higher or lower fair value measurements.
The discounted cash flow analysis used to value the Fund’s private investment in KKR Eagle Co-Invest LP usesthe projected cash flows of the portfolio company to estimate the enterprise value and equity value attributable tothe Fund’s interest in the portfolio company. Such cash flows include a terminal value for the portfolio company,which is typically based on an EV/EBITDA multiple. A present value of these cash flows is determined by usingestimated discount rates (a weighted average cost of capital or the expected return market participants wouldrequire of similar public securities).
As part of this valuation process, the Fund estimates operating results of the portfolio company (including EBITDAand unlevered cash flow). These estimates utilize unobservable inputs such as historical operating results, whichmay be unaudited, and projected operating results, which will be based on operating assumptions for suchportfolio company. The Fund also consults with management of the portfolio company to develop these financialprojections. These estimates will be sensitive to changes in assumptions specific to such portfolio company as wellas general assumptions for the industry. Other unobservable inputs utilized in the valuation techniques outlinedabove include: discounts for lack of marketability (liquidity discount), selection of comparable publicly-tradedcompanies, selection of relevant M&A transactions, selected ranges for valuation multiples, and expected requiredrates of return (discount rates).
The following is a reconciliation of assets in which significant unobservable inputs (Level 3) were used indetermining fair value:
Investments in SecuritiesPrivate
Equity Fund
Balance as of November 30, 2017 . . . . . . . . . . . . . . . . . . . . . . . . . . . . . . . . . . . . . . . . . . . . . . . . . . . . . . . . . . . . . . . . . $43,904,880Change in unrealized depreciation. . . . . . . . . . . . . . . . . . . . . . . . . . . . . . . . . . . . . . . . . . . . . . . . . . . . . . . . . . . . . . . . . . (625,438)
Balance as of May 31, 2018 . . . . . . . . . . . . . . . . . . . . . . . . . . . . . . . . . . . . . . . . . . . . . . . . . . . . . . . . . . . . . . . . . . . . . . $43,279,442
Change in unrealized gains or losses relating to assets still held at the reporting date . . . . . . . . . . . . . . . . . . . . . . . . . . . . . . $ (625,438)
The fair value of the Fund’s credit facility, which qualifies as a financial instrument under Financial AccountingStandards Board (“FASB”) Accounting Standards Codification (“ASC”) Topic 820 Disclosures about Fair Values ofFinancial Instruments, approximates the carrying amount of $75,400,000 presented in the Statement of Assetsand Liabilities. As of May 31, 2018, this financial instrument is categorized as a Level 2 within the disclosurehierarchy.
During the six months ended May 31, 2018, there were no transfers between Levels. The basis for recognizing andvaluing transfers is as of the end of the period in which transfers occur.
CENTER COAST BROOKFIELD MLP & ENERGY INFRASTRUCTURE FUNDNotes to Financial Statements (Unaudited) (continued)May 31, 2018
14 Brookfield Investment Management Inc.
Master Limited Partnerships: A master limited partnership (“MLP”) is an entity receiving partnership taxationtreatment under the U.S. Internal Revenue Code of 1986 (the “Code”), the partnership interests or “units” of whichare traded on securities exchanges like shares of corporate stock. Holders of MLP units generally have limitedcontrol and voting rights on matters affecting the partnership.
The Fund invests in MLPs, which generally are treated as partnerships for federal income tax purposes. If an MLPdoes not meet current legal requirements to maintain partnership status, or if it is unable to do so because of taxlaw changes, it would be taxed as a corporation or other form of taxable entity and there could be a materialdecrease in the value of its securities. Additionally, if tax law changes to eliminate or reduce tax deductions suchas depletion, depreciation and amortization expense deductions that MLPs have been able to use to offset asignificant portion of their taxable income, it could significantly reduce the value of the MLPs held by the Fund andcould cause a greater portion of the income and gain allocated to the Fund to be subject to U.S. federal, state andlocal corporate income taxes, which would reduce the amount the Fund can distribute to shareholders and couldincrease the percentage of Fund distributions treated as dividends instead of tax-deferred return of capital.
Depreciation or other cost recovery deductions passed through to the Fund from investments in MLPs in a givenyear generally will reduce the Fund’s taxable income (and earnings and profits), but those deductions may berecaptured in the Fund’s taxable income (and earnings and profits) in subsequent years when the MLPs disposeof their assets or when the Fund disposes of its interests in the MLPs. When deductions are recaptured,distributions to the Fund’s shareholders may be taxable.
Investment Transactions and Investment Income: Securities transactions are recorded on the trade date. Realizedgains and losses from securities transactions are calculated on the identified cost basis. Interest income isrecorded on the accrual basis. Discounts and premiums on securities are accreted and amortized, respectively, ona daily basis, using the effective yield to maturity method adjusted based on management’s assessment of thecollectability of such interest. Dividend income is recorded on the ex-dividend date.
Return of Capital Estimates: A distribution received from the Fund’s investments in MLPs generally are comprisedof income and return of capital. The Fund records investment income and return of capital based on estimatesmade at the time such distributions are received. Such estimates are based on historical information availablefrom each MLP and other industry sources. These estimates may subsequently be revised based on informationreceived from MLPs after their tax reporting periods are concluded. For the six months ended May 31, 2018, theFund estimated that 100% of the MLP distributions received would be treated as return of capital.
Partnership Accounting Policy: The Fund records its distributions as income (loss) and capital gains/(losses)based on the pro-rata share of income/(loss) and gains/(losses) of the underlying partnership. Distributionsreceived in excess of income and gains is treated as an adjustment of cost basis. These amounts are included inthe Fund’s Statement of Operations.
Expenses: Expenses directly attributable to the Fund are charged directly to the Fund, while expenses which areattributable to the Fund and other investment companies advised by the Adviser are allocated among therespective investment companies, including the Fund, based upon relative average net assets, evenly or acombination of average net assets and evenly.
Distributions to Common Shareholders: The Fund’s dividend distribution policy is intended to provide monthlydistributions to its common shareholders at a rate that over time is similar to the distribution rate the Fund receivesfrom the MLPs in which it invests, without offset for the expenses of the Fund. The Fund is not required to makesuch distributions and therefore the amount, if any, and/or the frequency of payment is subject to change. Theamount of the Fund’s distributions is based on, among other considerations, distributions the Fund actuallyreceives from portfolio investments, including returns of capital, and estimated future cash flows. Because theFund’s distribution policy takes into consideration estimated future cash flows from its underlying holdings, and topermit the Fund to maintain a stable distribution rate, the Fund’s distributions may exceed, or be below the amountthe Fund actually receives from its portfolio investments. Additionally, since the Fund’s distribution rate is not
CENTER COAST BROOKFIELD MLP & ENERGY INFRASTRUCTURE FUNDNotes to Financial Statements (Unaudited) (continued)May 31, 2018
2018 Semi-Annual Report 15
derived from the Fund’s investment income or loss, the Fund’s distributions may not represent yield or investmentreturn on the Fund’s portfolio. To the extent that the distributions paid exceed the distributions the Fund hasreceived, the distributions will reduce the Fund’s net assets. Consequently, the Fund may maintain cash reserves,borrow or may be required to sell certain investments at times when it would not otherwise be desirable to do so inorder to pay the expenses of the Fund. The Fund is not required to make such distributions and, as a result, theFund could in the future decide not to make such distributions or not to make distributions at a rate that over time issimilar to the distribution rate that it receives from the MLPs in which it invests. Furthermore, unlike the MLPs inwhich it invests, the Fund is not a pass through entity. Consequently, the tax characterization of the distributionspaid by the Fund, as dividend income or return of capital, may differ greatly from those of the underlying MLPs.
Distributions, if any, are declared and distributed monthly. The estimated characterization of the distributions paidwill be either a dividend (ordinary income) or distribution (return of capital). This estimate is based on the Fund’soperating results during the period. It is anticipated that a portion of its distributions will be comprised of return ofcapital as a result of the tax character of cash distributions made by the Fund’s investments. The actualcharacterization of the distributions made during the period will not be determined until after the end of the fiscalyear. The Fund will inform shareholders of the final tax character of the distributions on IRS Form DIV in February2019. For the six months ended May 31, 2018, the Fund’s distributions were expected to be comprised of 100%return of capital.
The portion of the Fund’s distributions that may be classified as return of capital is uncertain and can be materiallyimpacted by events that are not subject to the control of the Fund’s Adviser (e.g., mergers, acquisitions,reorganizations and other capital transactions occurring at the individual MLP level, changes in the taxcharacterization of distributions received from the MLP investments held by the Fund, changes in tax laws, etc.).The return of capital portion may also be impacted by the Fund’s strategy, which may recognize gains on itsholdings. Because of these factors, the portion of the Fund’s distributions that are classified as return of capitalmay vary materially from year to year. Accordingly, there is no guarantee that future distributions will maintain thesame classification for tax purposes as past distributions.
The distributions are determined in accordance with federal income tax regulations and are recorded on theex-dividend date. The character may differ from GAAP. These “book/tax” differences are either consideredtemporary or permanent in nature. To the extent these differences are permanent in nature, such amounts arereclassified within the composition of net assets based on their federal tax-basis treatment; temporary differencesdo not require reclassification.
Energy Industry Concentration Risk: A substantial portion of the MLPs in which the Fund invests are engagedprimarily in the energy industry. As a result, the Fund will be concentrated in the energy industry, and will thereforebe susceptible to adverse economic, environmental or regulatory occurrences effecting the energy industry.
New Accounting Pronouncements: In November 2016, the FASB issued ASU 2016-18, Restricted Cash which willrequire entities to include the total of cash, cash equivalents, restricted cash and restricted cash equivalents in thebeginning and ending cash balances in the Statement of Cash Flows. The guidance will be applied retrospectivelyand is effective for fiscal years beginning after December 15, 2017, and interim periods within those years.Management is currently evaluating the implications of ASU 2016-18, if any.
3. Federal Income Tax Information
The Fund does not intend to qualify as a regulated investment company pursuant to Subchapter M of the InternalRevenue Code, therefore it is taxed as a corporation. As a corporation, the Fund is obligated to pay federal, stateand local income tax on taxable income. On December 22, 2017 (Date of Enactment), President Trump signed taxreform legislation, which includes a broad range of tax reform provisions. The federal income tax rate forcorporations changed to 21% for taxable years beginning after December 31, 2017, which may have a materialimpact on future financial statements. The change in federal income tax rate is recorded on the Date ofEnactment. As a result of the tax legislation enacted on December 22, 2017, the Fund adjusted its estimates of its
CENTER COAST BROOKFIELD MLP & ENERGY INFRASTRUCTURE FUNDNotes to Financial Statements (Unaudited) (continued)May 31, 2018
16 Brookfield Investment Management Inc.
net deferred tax asset balance to reflect the reduction in the corporate rate from 35% to 21%. The Fund’s netdeferred tax asset balance was reduced, and continued to be completely offset by a full valuation allowance. TheFund may be subject to a 20% alternative minimum tax on its federal alternative minimum taxable income to theextent that its alternative minimum tax exceeds its regular federal income tax. The Fund is currently using anestimated tax rate of 2.41% for state and local tax.
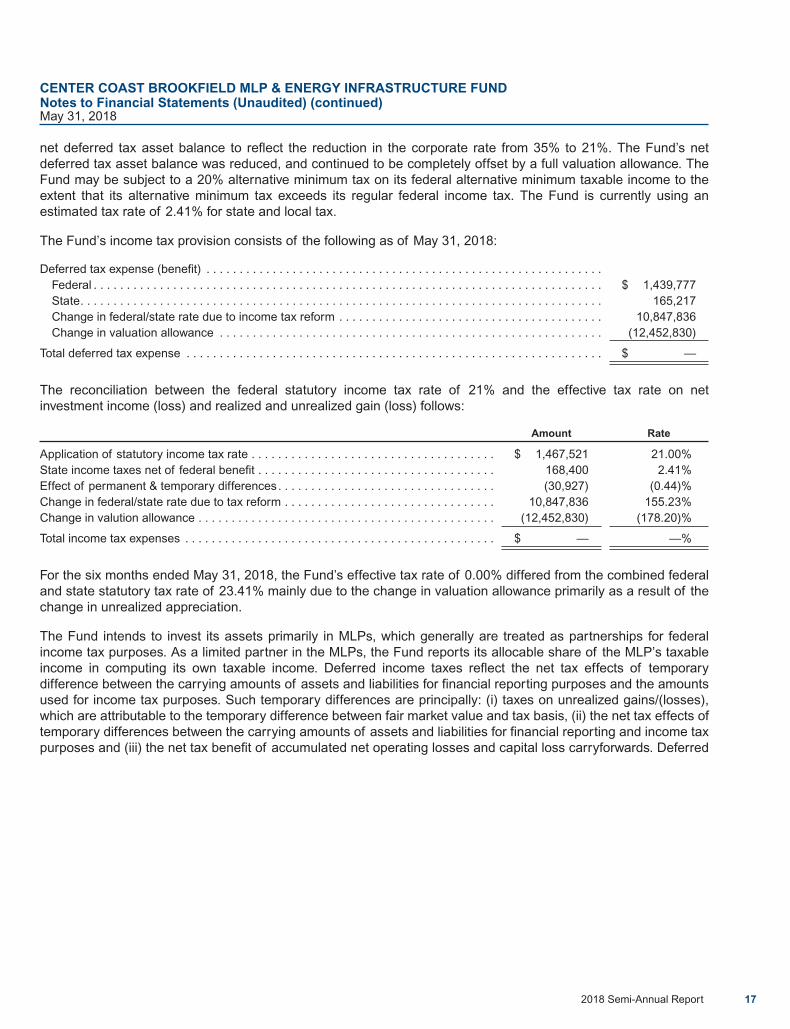
The Fund’s income tax provision consists of the following as of May 31, 2018:
Deferred tax expense (benefit) . . . . . . . . . . . . . . . . . . . . . . . . . . . . . . . . . . . . . . . . . . . . . . . . . . . . . . . . . . . .Federal . . . . . . . . . . . . . . . . . . . . . . . . . . . . . . . . . . . . . . . . . . . . . . . . . . . . . . . . . . . . . . . . . . . . . . . . . . . . . $ 1,439,777State. . . . . . . . . . . . . . . . . . . . . . . . . . . . . . . . . . . . . . . . . . . . . . . . . . . . . . . . . . . . . . . . . . . . . . . . . . . . . . . 165,217Change in federal/state rate due to income tax reform . . . . . . . . . . . . . . . . . . . . . . . . . . . . . . . . . . . . . . . . 10,847,836Change in valuation allowance . . . . . . . . . . . . . . . . . . . . . . . . . . . . . . . . . . . . . . . . . . . . . . . . . . . . . . . . . . (12,452,830)
Total deferred tax expense . . . . . . . . . . . . . . . . . . . . . . . . . . . . . . . . . . . . . . . . . . . . . . . . . . . . . . . . . . . . . . . $ —
The reconciliation between the federal statutory income tax rate of 21% and the effective tax rate on netinvestment income (loss) and realized and unrealized gain (loss) follows:
Amount Rate
Application of statutory income tax rate . . . . . . . . . . . . . . . . . . . . . . . . . . . . . . . . . . . . . $ 1,467,521 21.00%State income taxes net of federal benefit . . . . . . . . . . . . . . . . . . . . . . . . . . . . . . . . . . . . 168,400 2.41%Effect of permanent & temporary differences. . . . . . . . . . . . . . . . . . . . . . . . . . . . . . . . . (30,927) (0.44)%Change in federal/state rate due to tax reform . . . . . . . . . . . . . . . . . . . . . . . . . . . . . . . . 10,847,836 155.23%Change in valution allowance . . . . . . . . . . . . . . . . . . . . . . . . . . . . . . . . . . . . . . . . . . . . . (12,452,830) (178.20)%
Total income tax expenses . . . . . . . . . . . . . . . . . . . . . . . . . . . . . . . . . . . . . . . . . . . . . . . $ — —%
For the six months ended May 31, 2018, the Fund’s effective tax rate of 0.00% differed from the combined federaland state statutory tax rate of 23.41% mainly due to the change in valuation allowance primarily as a result of thechange in unrealized appreciation.
The Fund intends to invest its assets primarily in MLPs, which generally are treated as partnerships for federalincome tax purposes. As a limited partner in the MLPs, the Fund reports its allocable share of the MLP’s taxableincome in computing its own taxable income. Deferred income taxes reflect the net tax effects of temporarydifference between the carrying amounts of assets and liabilities for financial reporting purposes and the amountsused for income tax purposes. Such temporary differences are principally: (i) taxes on unrealized gains/(losses),which are attributable to the temporary difference between fair market value and tax basis, (ii) the net tax effects oftemporary differences between the carrying amounts of assets and liabilities for financial reporting and income taxpurposes and (iii) the net tax benefit of accumulated net operating losses and capital loss carryforwards. Deferred
CENTER COAST BROOKFIELD MLP & ENERGY INFRASTRUCTURE FUNDNotes to Financial Statements (Unaudited) (continued)May 31, 2018
2018 Semi-Annual Report 17
tax assets and liabilities are measured using effective tax rates expected to apply to taxable income in the yearssuch temporary differences are realized or otherwise settled.
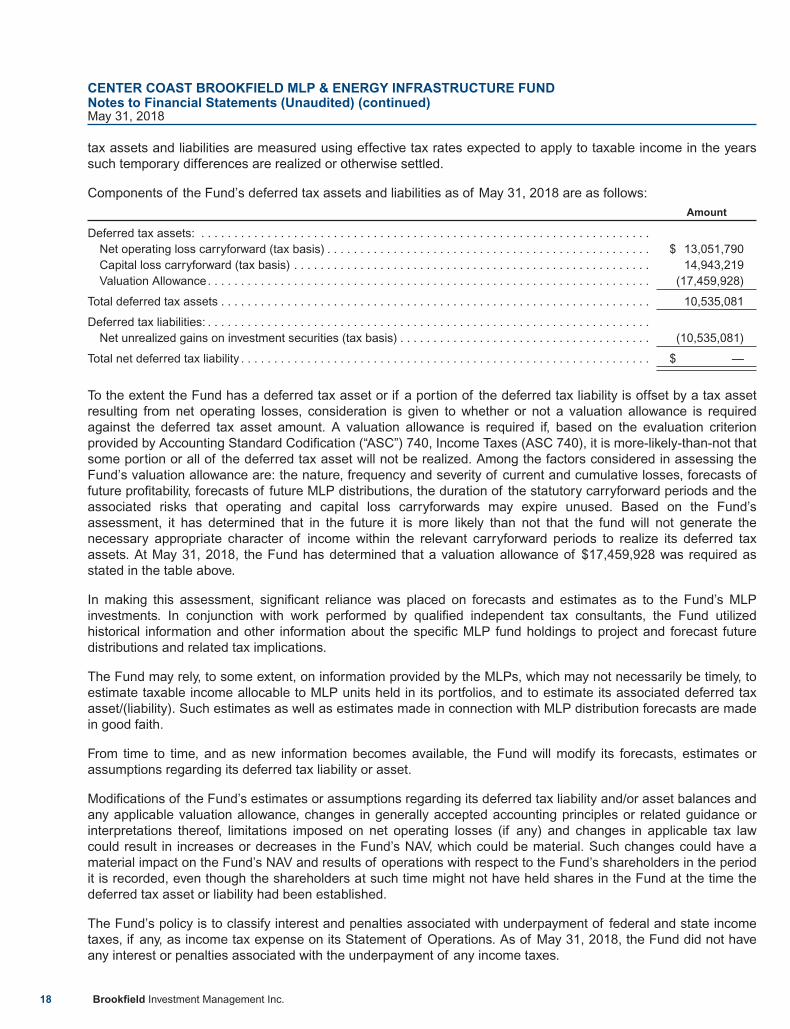
Components of the Fund’s deferred tax assets and liabilities as of May 31, 2018 are as follows:Amount
Deferred tax assets: . . . . . . . . . . . . . . . . . . . . . . . . . . . . . . . . . . . . . . . . . . . . . . . . . . . . . . . . . . . . . . . . . . . .Net operating loss carryforward (tax basis) . . . . . . . . . . . . . . . . . . . . . . . . . . . . . . . . . . . . . . . . . . . . . . . . . $ 13,051,790Capital loss carryforward (tax basis) . . . . . . . . . . . . . . . . . . . . . . . . . . . . . . . . . . . . . . . . . . . . . . . . . . . . . . 14,943,219Valuation Allowance. . . . . . . . . . . . . . . . . . . . . . . . . . . . . . . . . . . . . . . . . . . . . . . . . . . . . . . . . . . . . . . . . . . (17,459,928)
Total deferred tax assets . . . . . . . . . . . . . . . . . . . . . . . . . . . . . . . . . . . . . . . . . . . . . . . . . . . . . . . . . . . . . . . . . 10,535,081
Deferred tax liabilities: . . . . . . . . . . . . . . . . . . . . . . . . . . . . . . . . . . . . . . . . . . . . . . . . . . . . . . . . . . . . . . . . . . .Net unrealized gains on investment securities (tax basis) . . . . . . . . . . . . . . . . . . . . . . . . . . . . . . . . . . . . . . (10,535,081)
Total net deferred tax liability . . . . . . . . . . . . . . . . . . . . . . . . . . . . . . . . . . . . . . . . . . . . . . . . . . . . . . . . . . . . . . $ —
To the extent the Fund has a deferred tax asset or if a portion of the deferred tax liability is offset by a tax assetresulting from net operating losses, consideration is given to whether or not a valuation allowance is requiredagainst the deferred tax asset amount. A valuation allowance is required if, based on the evaluation criterionprovided by Accounting Standard Codification (“ASC”) 740, Income Taxes (ASC 740), it is more-likely-than-not thatsome portion or all of the deferred tax asset will not be realized. Among the factors considered in assessing theFund’s valuation allowance are: the nature, frequency and severity of current and cumulative losses, forecasts offuture profitability, forecasts of future MLP distributions, the duration of the statutory carryforward periods and theassociated risks that operating and capital loss carryforwards may expire unused. Based on the Fund’sassessment, it has determined that in the future it is more likely than not that the fund will not generate thenecessary appropriate character of income within the relevant carryforward periods to realize its deferred taxassets. At May 31, 2018, the Fund has determined that a valuation allowance of $17,459,928 was required asstated in the table above.
In making this assessment, significant reliance was placed on forecasts and estimates as to the Fund’s MLPinvestments. In conjunction with work performed by qualified independent tax consultants, the Fund utilizedhistorical information and other information about the specific MLP fund holdings to project and forecast futuredistributions and related tax implications.
The Fund may rely, to some extent, on information provided by the MLPs, which may not necessarily be timely, toestimate taxable income allocable to MLP units held in its portfolios, and to estimate its associated deferred taxasset/(liability). Such estimates as well as estimates made in connection with MLP distribution forecasts are madein good faith.
From time to time, and as new information becomes available, the Fund will modify its forecasts, estimates orassumptions regarding its deferred tax liability or asset.
Modifications of the Fund’s estimates or assumptions regarding its deferred tax liability and/or asset balances andany applicable valuation allowance, changes in generally accepted accounting principles or related guidance orinterpretations thereof, limitations imposed on net operating losses (if any) and changes in applicable tax lawcould result in increases or decreases in the Fund’s NAV, which could be material. Such changes could have amaterial impact on the Fund’s NAV and results of operations with respect to the Fund’s shareholders in the periodit is recorded, even though the shareholders at such time might not have held shares in the Fund at the time thedeferred tax asset or liability had been established.
The Fund’s policy is to classify interest and penalties associated with underpayment of federal and state incometaxes, if any, as income tax expense on its Statement of Operations. As of May 31, 2018, the Fund did not haveany interest or penalties associated with the underpayment of any income taxes.
CENTER COAST BROOKFIELD MLP & ENERGY INFRASTRUCTURE FUNDNotes to Financial Statements (Unaudited) (continued)May 31, 2018
18 Brookfield Investment Management Inc.
The Fund files income tax returns in the U.S. federal jurisdiction and various states. The Fund has reviewed allmajor jurisdictions and concluded that there is no significant impact on the Fund’s net assets and no tax liabilityresulting from unrecognized tax benefits relating to uncertain tax positions expected to be taken on its tax returns.Furthermore, management of the Fund is not aware of any tax positions for which it is reasonably possible thatthe total amounts of unrecognized tax benefits will significantly change in the next 12 months.
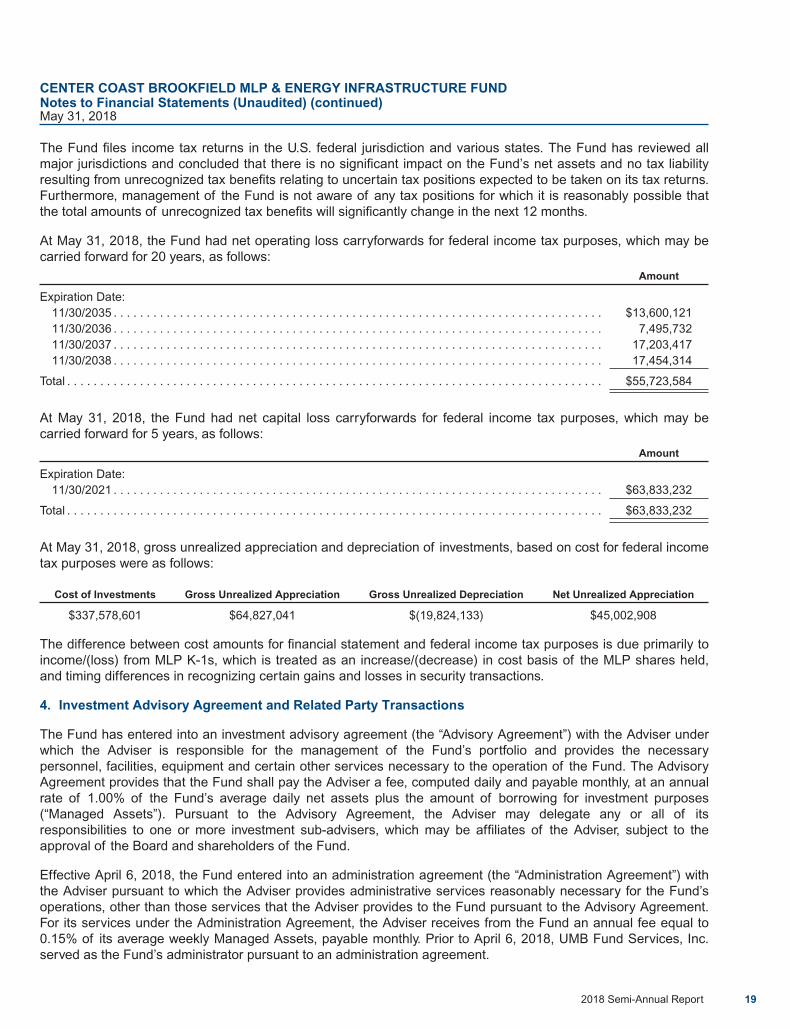
At May 31, 2018, the Fund had net operating loss carryforwards for federal income tax purposes, which may becarried forward for 20 years, as follows:
Amount
Expiration Date:11/30/2035 . . . . . . . . . . . . . . . . . . . . . . . . . . . . . . . . . . . . . . . . . . . . . . . . . . . . . . . . . . . . . . . . . . . . . . . . . . $13,600,12111/30/2036 . . . . . . . . . . . . . . . . . . . . . . . . . . . . . . . . . . . . . . . . . . . . . . . . . . . . . . . . . . . . . . . . . . . . . . . . . . 7,495,73211/30/2037 . . . . . . . . . . . . . . . . . . . . . . . . . . . . . . . . . . . . . . . . . . . . . . . . . . . . . . . . . . . . . . . . . . . . . . . . . . 17,203,41711/30/2038 . . . . . . . . . . . . . . . . . . . . . . . . . . . . . . . . . . . . . . . . . . . . . . . . . . . . . . . . . . . . . . . . . . . . . . . . . . 17,454,314
Total . . . . . . . . . . . . . . . . . . . . . . . . . . . . . . . . . . . . . . . . . . . . . . . . . . . . . . . . . . . . . . . . . . . . . . . . . . . . . . . . . $55,723,584
At May 31, 2018, the Fund had net capital loss carryforwards for federal income tax purposes, which may becarried forward for 5 years, as follows:
Amount
Expiration Date:11/30/2021 . . . . . . . . . . . . . . . . . . . . . . . . . . . . . . . . . . . . . . . . . . . . . . . . . . . . . . . . . . . . . . . . . . . . . . . . . . $63,833,232
Total . . . . . . . . . . . . . . . . . . . . . . . . . . . . . . . . . . . . . . . . . . . . . . . . . . . . . . . . . . . . . . . . . . . . . . . . . . . . . . . . . $63,833,232
At May 31, 2018, gross unrealized appreciation and depreciation of investments, based on cost for federal incometax purposes were as follows:
Cost of Investments Gross Unrealized Appreciation Gross Unrealized Depreciation Net Unrealized Appreciation
$337,578,601 $64,827,041 $(19,824,133) $45,002,908
The difference between cost amounts for financial statement and federal income tax purposes is due primarily toincome/(loss) from MLP K-1s, which is treated as an increase/(decrease) in cost basis of the MLP shares held,and timing differences in recognizing certain gains and losses in security transactions.
4. Investment Advisory Agreement and Related Party Transactions
The Fund has entered into an investment advisory agreement (the “Advisory Agreement”) with the Adviser underwhich the Adviser is responsible for the management of the Fund’s portfolio and provides the necessarypersonnel, facilities, equipment and certain other services necessary to the operation of the Fund. The AdvisoryAgreement provides that the Fund shall pay the Adviser a fee, computed daily and payable monthly, at an annualrate of 1.00% of the Fund’s average daily net assets plus the amount of borrowing for investment purposes(“Managed Assets”). Pursuant to the Advisory Agreement, the Adviser may delegate any or all of itsresponsibilities to one or more investment sub-advisers, which may be affiliates of the Adviser, subject to theapproval of the Board and shareholders of the Fund.
Effective April 6, 2018, the Fund entered into an administration agreement (the “Administration Agreement”) withthe Adviser pursuant to which the Adviser provides administrative services reasonably necessary for the Fund’soperations, other than those services that the Adviser provides to the Fund pursuant to the Advisory Agreement.For its services under the Administration Agreement, the Adviser receives from the Fund an annual fee equal to0.15% of its average weekly Managed Assets, payable monthly. Prior to April 6, 2018, UMB Fund Services, Inc.served as the Fund’s administrator pursuant to an administration agreement.
CENTER COAST BROOKFIELD MLP & ENERGY INFRASTRUCTURE FUNDNotes to Financial Statements (Unaudited) (continued)May 31, 2018
2018 Semi-Annual Report 19
Effective April 6, 2018, the Adviser entered into a sub-administration agreement (the “Sub-AdministrationAgreement”) with U.S. Bancorp Fund Services, LLC, (“USBFS”) pursuant to which USBFS acts as thesub-administrator to the Fund. USBFS provides certain services to the Fund including, among otherresponsibilities, coordinating the negotiation of contracts and fees with, and the monitoring of performance andbilling of, the Fund’s independent contractors and agents; preparation for signature by an officer of the Fund of alldocuments required to be filed for compliance by the Fund with applicable laws and regulations, excluding those ofthe securities laws of various states; arranging for the computation of performance data, including NAV per shareand yield; responding to shareholder inquiries; and arranging for the maintenance of books and records of theFund, and providing, at its own expense, office facilities, equipment and personnel necessary to carry out itsduties. In this capacity, USBFS does not have any responsibility or authority for the management of the Fund, thedetermination of investment policy, or for any matter pertaining to the distribution of Fund shares. In addition,pursuant to a fund accounting servicing agreement (the “Fund Accounting Servicing Agreement”), USBFS alsoacts as the fund accountant for the Fund. USBFS provides certain accounting services to the Fund including,among other responsibilities, portfolio accounting services; expense accrual and payment services; fund valuationand financial reporting services; tax accounting services; and compliance control services.
Pursuant to the Sub-Administration Agreement and Fund Accounting Servicing Agreement, as compensation forits services, USBFS receives from the Adviser, as administrator to the Fund, an annual fee based upon theaverage net assets for the Brookfield fund complex of: 0.04% on the first $2 billion, 0.035% on the next $2 billion,0.03% on the next $2.5 billion and 0.02% on the remaining assets, with a minimum annual fee for the Brookfieldfund complex of $534,000.
From inception of the Fund until the close of business on February 2, 2018, HRC Portfolio Solutions providedinvestor relations support services in connection with the on-going operation of the Fund pursuant to a fundsupport services agreement (the “Fund Support Services Agreement”). Following the close of business onFebruary 2, 2018, Brookfield acquired certain assets of HRC Fund Associates, LLC and HRC PortfolioSolutions, LLC (the �HRC Asset Acquisition�). Upon the closing of the HRC Asset Acquisition, the Adviser beganproviding such support services pursuant to a new Fund Support Services Agreement (the “New Fund SupportServices Agreement”). Such services included providing assistance with communicating with and responding toinquiries from professional financial intermediaries, communicating with the NYSE specialist for the CommonShares and with the closed-end fund analyst community regarding the Fund, assisting with the formatting,development and maintenance of the Fund’s website, assisting with administrative and accounting issues withrespect to the Fund and assisting in investor communications for the Fund. Pursuant to the New Fund SupportServices Agreement, the Fund paid a monthly fee at an annual rate of 0.10% of the Fund’s average daily netassets for each month during which the Fund’s average daily net assets are $500 million or less and 0.15% of theFund’s average daily net assets for each month during which the Fund’s average daily net assets are more than$500 million. The Fund Support Services Agreement was terminated upon the closing of the HRC AssetAcquisition on February 2, 2018. The New Fund Support Services Agreement terminated effective April 6, 2018.For the six months ended May 31, 2018, fund support servicing fees incurred are disclosed on the Statement ofOperations.
Certain officers and/or trustees of the Fund are officers and/or employees of the Adviser.
5. Purchases and Sales of Investments
For the six months ended May 31, 2018, purchases and sales of investments, excluding short-term securities, U.S.Government securities, were $122,974,060 and $80,605,560, respectively.
The Fund did not have any purchases or sales of U.S. Government securities for the six months ended May 31,2018.
CENTER COAST BROOKFIELD MLP & ENERGY INFRASTRUCTURE FUNDNotes to Financial Statements (Unaudited) (continued)May 31, 2018
20 Brookfield Investment Management Inc.
6. Capital Stock
The Fund is authorized to issue unlimited common shares of beneficial interest, par value of $0.01 per share(“Common Shares”). At May 31, 2018, the shares outstanding were 29,010,172. Of the 29,010,172 sharesoutstanding at May 31, 2018 for the Fund, the Adviser owned 12,376 shares. The Fund’s Board is authorized toclassify and reclassify any unissued shares into other classes or series of shares and authorize the issuance ofshares without obtaining shareholder approval. The Board, without any action by the shareholders, may amend thecharter from time to time to increase or decrease the aggregate number of shares or the number of shares of anyclass or series that the Fund has authority to issue.
The Common Shares have no preemptive, conversion, exchange or redemption rights. The Common Shares haveequal voting, dividend, distribution and liquidation rights, are fully paid and non-assessable. Shareholders areentitled to one vote per share and all voting rights for the election of directors are non-cumulative.
The Common Shares are listed on the New York Stock Exchange under the symbol “CEN.” The Fund has enteredinto a distribution agreement, dated May 27, 2016, which was amended and restated as of August 18, 2017 andMay 8, 2018, with Foreside Fund Services, LLC (the “Distributor”), pursuant to which the Fund may offer and sellup to 15,173,943 Common Shares, from time to time, through the Distributor, as agent for the Fund, in transactionsthat are deemed to be “at the market” as defined in Rule 415 under the Securities Act of 1933, as amended. Theminimum price at which such Common Shares may be sold may not be less than the current Net Asset Value perCommon Share plus any commissions to be paid to the distributor. For the six months ended May 31, 2018, theFund issued 4,353,649 shares under this “at the market” program at an average price of $9.9275 per share.
On May 17, 2018, the Board approved a share repurchase plan. Under the current share repurchase plan, theFund may purchase in the open market up to 10% of its outstanding common shares as of March 31, 2018. Thecurrent share repurchase plan will remain in effect until December 5, 2018. The amount and timing of therepurchases will be at the discretion of the Fund’s management, subject to market conditions and investmentconsiderations. There is no assurance that the Fund will purchase shares at any particular discount level or in anyparticular amounts. The Board authorized the share repurchase program as a result of its review of the optionsavailable to enhance shareholder value and reduce any potential discount between the market price of the Fund’sshares and the net asset value per share. As of May 31, 2018, the Fund did not repurchase any shares under theshare repurchase plan.
7. Preferred Shares
On September 22, 2016, the Fund completed a private placement of 2,000 shares of Series A MandatoryRedeemable Preferred Shares (“MRP Shares”). Each MRP Share has a liquidation preference of $25,000,resulting in an aggregate liquidation preference of $50,000,000 for all MRP Shares. The MRP Shares will payquarterly cash distributions at a rate of 4.29% per annum. The MRP Shares have a redemption date ofSeptember 26, 2026.
The Fund incurred costs in connection with the issuance of the MRP Shares. These costs were recorded as adeferred charge and are being amortized over the life of the MRP Shares. Amortization of these costs aredisclosed on the Statement of Operations, and the unamortized balance is included within MandatoryRedeemable Preferred shares on the Statement of Assets and Liabilities.
The average aggregate liquidation preference outstanding and the average annualized distribution rate of theMRP Shares during the six months ended May 31, 2018 were $25,000 and 4.29%, respectively.
The Fund is subject to certain restrictions relating to the MRP Shares, such as maintaining certain asset coverageand leverage ratio requirements. Failure to comply with these restrictions could cause increases in the distributionrate paid, preclude the Fund from declaring any distributions to common shareholders or purchasing commonshares, and/or could trigger the mandatory redemption of MRP Shares at liquidation preference.
CENTER COAST BROOKFIELD MLP & ENERGY INFRASTRUCTURE FUNDNotes to Financial Statements (Unaudited) (continued)May 31, 2018
2018 Semi-Annual Report 21
The liquidation preference of MRP Shares, which are considered debt of the Fund for financial reportingpurposes, is recorded as a liability under the caption Mandatory Redeemable Preferred Shares on the Statementof Assets and Liabilities. Unpaid distributions on MRP Shares are disclosed on the Statement of Assets andLiabilities. Distributions paid on MRP Shares are disclosed on the Statement of Operations.
8. Borrowings
Credit facility: The Fund has entered into a revolving credit agreement (the “Credit Agreement”) with BNP ParibasPrime Brokerage, Inc. (“BNPP”) pursuant to which the Fund may borrow up to a maximum commitment amount of(1) $75,000,000 under a 179-day facility plus (2) additional amounts on a demand basis subject to the amount ofthe Fund’s pledged collateral and the limits imposed by the 1940 Act. The Fund pays interest in the amount of0.95% plus the 1-month London Interbank Offered Rate on the amount outstanding and 0.70% on the line of creditthat is unused. Under the Credit Agreement, the Fund is required to pledge portfolio securities as collateral in anamount up to two times the loan balance outstanding (or more depending on the terms of the Credit Agreement)and has granted a security interest in the securities pledged to, and in favor of, BNPP as security for the loanbalance outstanding. If the Fund fails to meet certain requirements or maintain other financial covenants requiredunder the Credit Agreement, the Fund may be required to repay immediately, in part or in full, the loan balanceoutstanding under the Credit Agreement, necessitating the sale of portfolio securities at potentially inopportunetimes.
The Fund had outstanding borrowings of $75,400,000 as of May 31, 2018. The Fund borrowed an average dailybalance of approximately $73,656,593 at a weighted average borrowing cost of 2.63%.
9. Other Risks
Liquidity Risk: The Fund may make investments that are illiquid or that may become less liquid in response tomarket developments or adverse investor perceptions. Illiquid investments may be more difficult to value. Liquidityrisk may also refer to the risk that the Fund will not be able to pay redemption proceeds within the allowable timeperiod because of unusual market conditions, an unusually high volume of redemption requests, or other reasons.To meet redemption requests, the Fund may be forced to sell investments at an unfavorable time and/or underunfavorable conditions.
Market and Credit Risks: In the normal course of business, the Fund trades financial instruments and enters intofinancial transactions where risk of potential loss exists due to changes in the market (market risk). Additionally,the Fund may also be exposed to credit risk in the event that an issuer fails to perform or that an institution or entitywith which the Fund has unsettled or open transactions defaults.
Master Limited Partnership Risk: Investments in securities of MLPs involve risks that differ from investments incommon stock, including risks related to limited control and limited rights to vote on matters affecting the MLP,risks related to potential conflicts of interest between the MLP and the MLP’s general partner, cash flow risks,dilution risks, limited liquidity and risks related to the general partner’s right to require unit-holders to sell theircommon units at an undesirable time or price.
Non-Diversification Risk: The Fund is non-diversified, meaning that it is permitted to invest a larger percentage ofits assets in fewer issuers than diversified mutual funds. Thus, the Fund may be more susceptible to adversedevelopments affecting any single issuer held in its portfolio, and may be more susceptible to greater lossesbecause of these developments.
Private Investment Risk: The Fund may invest in unregistered or restricted securities, including private investmentin public equities (“PIPE”). Unregistered or restricted securities may not be readily marketable and are often moredifficult to value. Further, the Advisor may not have timely or accurate information about the business, financialcondition and results of operations which may adversely affect the Advisor’s ability to value those investments.PIPE investors may purchase securities directly from a publicly traded company in a private placement transaction,
CENTER COAST BROOKFIELD MLP & ENERGY INFRASTRUCTURE FUNDNotes to Financial Statements (Unaudited) (continued)May 31, 2018
22 Brookfield Investment Management Inc.
typically at a discount to the market price of the company’s common stock. In a PIPE transaction, the Fund maybear the price risk from the time of pricing until the time of closing. In addition, the Fund may have to commit topurchase a specified number of shares at a fixed price, with the closing conditioned upon, among other things, theSEC’s preparedness to declare effective a resale registration statement covering the resale, from time to time, ofthe shares sold in the private financing. Because the sale of the securities is not registered under the 1933 Act, thesecurities are “restricted” and cannot be immediately resold by the investors into the public markets. Accordingly,PIPE securities may be deemed illiquid.
Portfolio Concentration Risk: The Fund concentrates its investments in the energy sector, and will therefore besusceptible to adverse economic, environmental, business, regulatory or other occurrences affecting that sector.The energy sector has historically experienced substantial price volatility. MLPs and other companies operating inthe energy sector are subject to specific risks, including, among others, fluctuations in commodity prices; reducedconsumer demand for commodities such as oil, natural gas or petroleum products; reduced availability of naturalgas or other commodities for transporting, processing, storing or delivering; slowdowns in new construction;extreme weather or other natural disasters; and threats of attack by terrorists on energy assets. Additionally,changes in the regulatory environment for energy companies may adversely impact their profitability. Over time,depletion of natural gas reserves and other energy reserves may also affect the profitability of energy companies.
Leverage Risk: The Fund’s use of leverage creates the possibility of higher volatility for the Fund’s per share NAV,market price, distributions and returns. When the Fund uses leverage, the Fund will experience a greater increasein its net asset value if the securities acquired through the use of leverage increase in value, but it will alsoexperience a correspondingly larger decline in its net asset value if the bonds acquired through leverage decline invalue, which will make the Fund’s net asset value more volatile, and its total return performance more variable overtime. There is no assurance that a Fund’s leveraging strategy will be successful.
Tax Risks: Tax risks associated with investments in the Fund include but are not limited to the following:
Fund Structure Risk: The Fund will be taxable as a regular corporation, or “C” corporation, for U.S. federal incometax purposes. This means the Fund generally will be subject to U.S. federal income tax on its taxable income at therates applicable to corporations (currently a maximum rate of 21%), and will also be subject to state and localincome taxes.
MLP Tax Risk: MLPs are generally treated as partnerships for U.S. federal income tax purposes. Partnerships donot pay U.S. federal income tax at the partnership level. Rather, each partner is allocated a share of thepartnership’s income, gains, losses, deductions and expenses. A change in current tax law or a change in theunderlying business mix of a given MLP could result in an MLP being treated as a corporation for U.S. federalincome tax purposes, which would result in the MLP being required to pay U.S. federal income tax (as well as stateand local income taxes) on its taxable income. This would have the effect of reducing the amount of cash availablefor distribution by the MLP and could result in a reduction in the value of the Fund’s investment in the MLP andlower income to the Fund. To the extent a distribution received by the Fund from an MLP is treated as a return ofcapital, the Fund’s adjusted tax basis in the interests of the MLP will be reduced, which may increase the Fund’stax liability upon the sale of the interests in the MLP or upon subsequent distributions in respect of such interests.
Tax Estimation/NAV Risk: In calculating the Fund’s net asset value (“NAV”), the Fund will, among other things,include its current taxes and deferred tax liability and/or asset balances and related valuation balances, if any. TheFund may accrue a deferred income tax liability balance, at the currently effective statutory U.S. federal income taxrate (currently 21%) plus an estimated state and local income tax rate, for its future tax liability associated with thecapital appreciation of its investments and the distributions received by the Fund on interests of MLPs consideredto be return of capital and for any net operating gains. Any deferred tax liability balance will reduce the Fund’sNAV. The Fund may also record a deferred tax asset balance, which reflects an estimate of the Fund’s future taxbenefit associated with net operating losses and/or unrealized losses. Any deferred tax asset balance will increasethe Fund’s NAV to the extent it exceeds any valuation allowance. The Fund will rely to some extent on informationprovided by MLPs, which may not be provided to the Fund on a timely basis, to estimate current taxes and
CENTER COAST BROOKFIELD MLP & ENERGY INFRASTRUCTURE FUNDNotes to Financial Statements (Unaudited) (continued)May 31, 2018
2018 Semi-Annual Report 23
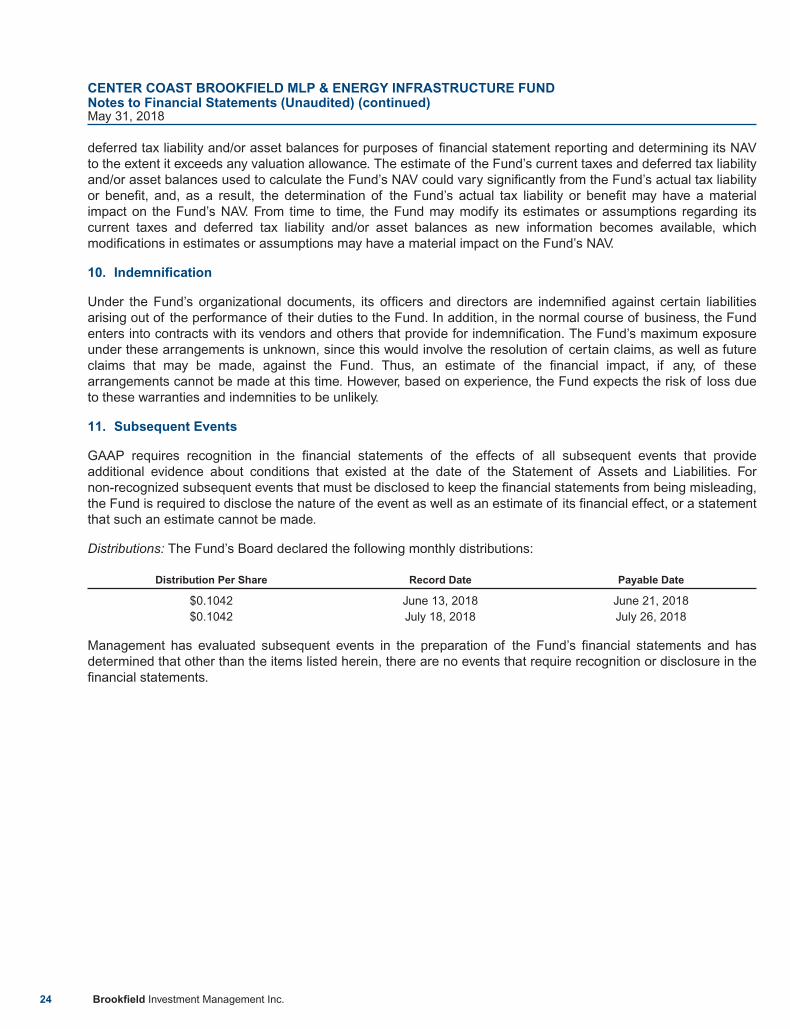
deferred tax liability and/or asset balances for purposes of financial statement reporting and determining its NAVto the extent it exceeds any valuation allowance. The estimate of the Fund’s current taxes and deferred tax liabilityand/or asset balances used to calculate the Fund’s NAV could vary significantly from the Fund’s actual tax liabilityor benefit, and, as a result, the determination of the Fund’s actual tax liability or benefit may have a materialimpact on the Fund’s NAV. From time to time, the Fund may modify its estimates or assumptions regarding itscurrent taxes and deferred tax liability and/or asset balances as new information becomes available, whichmodifications in estimates or assumptions may have a material impact on the Fund’s NAV.
10. Indemnification
Under the Fund’s organizational documents, its officers and directors are indemnified against certain liabilitiesarising out of the performance of their duties to the Fund. In addition, in the normal course of business, the Fundenters into contracts with its vendors and others that provide for indemnification. The Fund’s maximum exposureunder these arrangements is unknown, since this would involve the resolution of certain claims, as well as futureclaims that may be made, against the Fund. Thus, an estimate of the financial impact, if any, of thesearrangements cannot be made at this time. However, based on experience, the Fund expects the risk of loss dueto these warranties and indemnities to be unlikely.
11. Subsequent Events
GAAP requires recognition in the financial statements of the effects of all subsequent events that provideadditional evidence about conditions that existed at the date of the Statement of Assets and Liabilities. Fornon-recognized subsequent events that must be disclosed to keep the financial statements from being misleading,the Fund is required to disclose the nature of the event as well as an estimate of its financial effect, or a statementthat such an estimate cannot be made.
Distributions: The Fund’s Board declared the following monthly distributions:
Distribution Per Share Record Date Payable Date
$0.1042 June 13, 2018 June 21, 2018$0.1042 July 18, 2018 July 26, 2018
Management has evaluated subsequent events in the preparation of the Fund’s financial statements and hasdetermined that other than the items listed herein, there are no events that require recognition or disclosure in thefinancial statements.
CENTER COAST BROOKFIELD MLP & ENERGY INFRASTRUCTURE FUNDNotes to Financial Statements (Unaudited) (continued)May 31, 2018
24 Brookfield Investment Management Inc.

On May 21, 2018, the Fund submitted a CEO annual certification to the New York Stock Exchange (“NYSE”) onwhich the Fund’s principal executive officer certified that he was not aware, as of that date, of any violation by theFund of the NYSE’s Corporate Governance listing standards. In addition, as required by Section 302 of theSarbanes-Oxley Act of 2002 and related SEC rules, the Fund’s principal executive and principal financial officershave made quarterly certifications, included in filings with the SEC on Forms N-CSR and N-Q relating to, amongother things, the Fund’s disclosure controls and procedures and internal control over financial reporting, asapplicable.
CENTER COAST BROOKFIELD MLP & ENERGY INFRASTRUCTURE FUNDCompliance Certification (Unaudited)May 31, 2018
2018 Semi-Annual Report 25
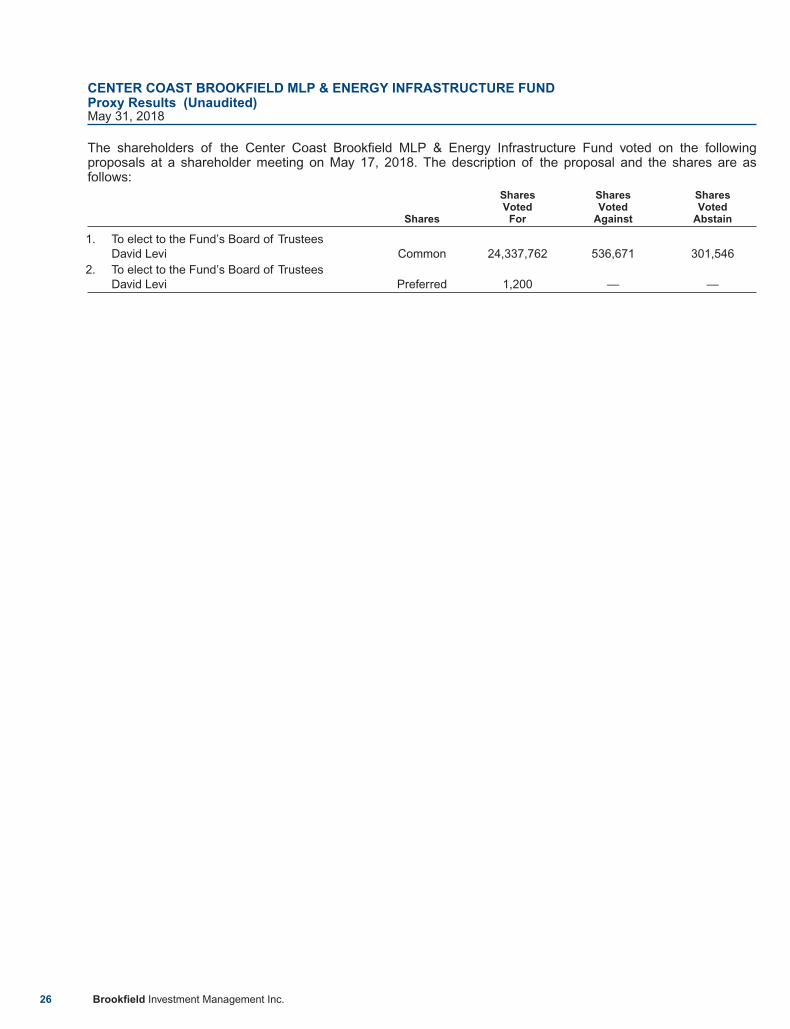
The shareholders of the Center Coast Brookfield MLP & Energy Infrastructure Fund voted on the followingproposals at a shareholder meeting on May 17, 2018. The description of the proposal and the shares are asfollows:
Shares
SharesVoted
For
SharesVoted
Against
SharesVoted
Abstain
1. To elect to the Fund’s Board of TrusteesDavid Levi Common 24,337,762 536,671 301,546
2. To elect to the Fund’s Board of TrusteesDavid Levi Preferred 1,200 — —
CENTER COAST BROOKFIELD MLP & ENERGY INFRASTRUCTURE FUNDProxy Results (Unaudited)May 31, 2018
26 Brookfield Investment Management Inc.
As background, on October 9, 2017, Center Coast Capital Holdings, LLC, the parent company of Center CoastCapital Advisors, LP (“CCC”), the former investment adviser to the Fund, entered into a definitive agreement to beacquired by Brookfield’s Public Securities Group. Upon the consummation of this transaction, the investmentadvisory agreement between CCC and the Fund terminated. Prior to the transaction closing, the former Board ofTrustees of the Fund approved a new investment advisory agreement with Brookfield InvestmentManagement Inc. and nominated for election five trustee nominees to serve on the Fund’s newly constituted Boardof Trustees. On January 23, 2018, the Fund conducted a special meeting of shareholders at which shareholdersof the Fund approved the new investment advisory agreement and elected the five trustee nominees to serve onthe Fund’s Board of Trustees. The transaction was completed following the close of business on February 2,2018. The following is a description of the former Board of Trustees’ considerations in connection with theapproval of the new investment advisory agreement with Brookfield Investment Management Inc.
At a special meeting, held on July 24, 2017, the former board of trustees (the “Board”) of the Fund, including all ofthe Trustees who are not “interested persons” (as defined in Section 2(a)(19) of the Investment Company Act of1940, as amended) (the “Independent Trustees”) voting separately thereof, unanimously approved (subject toapproval by the Fund’s shareholders) a new investment advisory agreement (the “Agreement”) between the Fundand Brookfield Investment Management Inc. (the “Adviser,” or the “Public Securities Group”). At the specialmeeting, the Board noted that Center Coast Capital Holdings, LLC (“Center Coast”), the parent company of CenterCoast Capital Advisors, LP (“CCC”), the Fund’s investment adviser, recently announced its intention to be acquiredby Brookfield’s Public Securities Group, a wholly-owned subsidiary of Brookfield Asset Management Inc. (the“Transaction”). The Board then noted that the closing of the Transaction will be deemed to cause an “assignment”and automatic termination of the investment advisory agreement between CCC and the Fund (the “FormerAdvisory Agreement”). As a result, the Board was asked to consider the approval of the Agreement to providecontinuity of advisory services for the Fund after the closing of the Transaction. The Board noted that they hadmost recently approved the continuation of the Former Advisory Agreement on May 25, 2017. The Board furthernoted that in advance of the July 24, 2017 in-person meeting, Mr. Dan Tutcher, in his capacity as Chair of theBoard and principal of CCC, had regularly met and communicated with the Independent Trustees of the Board tokeep them informed regarding the Transaction and to answer questions that they had. At the July 24, 2017meeting, the Board met with representatives of CCC and the Adviser. The Board also met in person onOctober 26, 2017 with representatives of CCC who apprised the Board of further developments with respect to theTransaction that occurred between the Board’s July 24, 2017 meeting and the signing of a purchase agreementpursuant to which the Transaction would be consummated (the “Purchase Agreement”). At the October 26, 2017meeting, the Board ratified and affirmed their prior approvals.
In connection with the Board’s review, the Adviser provided, and the Board obtained, information regardingBrookfield Asset Management Inc. (“Brookfield”), the Adviser, including with respect to Brookfield’s business lines,competitive advantages, global scale and investment flexibility, and the Adviser’s complementary fit withinBrookfield, investment principals, experience of its leadership team, range of investment strategies and vehicles,performance track record, distribution support, marketing platform and strategic vision. In addition, the Adviserprovided, and the Board obtained, information regarding the Adviser’s compliance programs, disaster recoveryprocedures, cybersecurity measures and operational risk evaluations. The Board also received and reviewed acopy of the Agreement.
Representatives of CCC and the Adviser discussed how the Center Coast team would operate within the PublicSecurities Group, the depth and breadth of resources that would support the Center Coast team and their beliefthat being part of Brookfield would be additive to the Center Coast team. The representatives of CCC and theAdviser discussed the Adviser’s experience managing assets in the MLP and infrastructure sectors and confirmedthat the current portfolio managers would continue to manage the Fund according to the same objectives andpolicies as before, and that significant changes to the Fund’s investment operations were not anticipated.Representatives of CCC and the Adviser discussed the future plans with respect to service providers to the Fund.
Below is an overview of the primary factors the Board considered in connection with the review of the Agreement.In reaching this conclusion for the Fund, no single factor was determinative in the Board’s conclusion, but ratherthe Board considered a variety of factors.
CONSIDERATION OF NATURE, EXTENT AND QUALITY OF THE SERVICES. The Board, including theIndependent Trustees, considered that in connection with its most recent approval of the continuation of theFormer Advisory Agreement it had received and considered information regarding the nature, extent and quality of
CENTER COAST BROOKFIELD MLP & ENERGY INFRASTRUCTURE FUNDBoard Considerations Relating to the Investment Advisory Agreement (Unaudited)May 31, 2018
2018 Semi-Annual Report 27
services to be provided to the Fund in light of the investment objective, policies and strategies of the Fund. TheBoard noted that in connection with such review it had reviewed and considered CCC’s investment advisorypersonnel, its history as an asset manager, performance of other accounts managed by CCC, the amount of itscurrent assets under management, the research and decision-making processes utilized by CCC, including themethods adopted to seek to achieve compliance with the investment objectives, polices and restrictions of theFund, the background and experience of CCC’s management in connection with the Fund, including thequalifications, backgrounds and responsibilities of the management team primarily responsible for the day-to-dayportfolio management of the Fund and the extent of the resources devoted to research and analysis of the Fund’sactual and potential investments. The Board considered that the manner in which the Center Coast team wouldoperate within Brookfield, and the fact that the current portfolio managers would continue to manage the Fund.The Board considered the manner in which the reputation and size of Brookfield may benefit the Center Coastteam and the Fund. The Board noted the experience and resources of Brookfield and the Adviser and that withinthe Public Securities Group, the Center Coast team may benefit from enhanced general support and oversightfrom certain functional groups such as legal, finance, internal audit, compliance, and risk management. Based ontheir review, the Board concluded that the nature, extent and quality of services provided to the Fund wereexpected to continue at the same or improved levels following the Transaction.
CONSIDERATION OF ADVISORY FEES AND THE COST OF THE SERVICES. The Board, including theIndependent Trustees, considered that in connection with its most recent approval of the continuation of theFormer Advisory Agreement it had received and considered information regarding the Fund’s contractual annualadvisory fee and anticipated overall expenses with (a) a peer group of competitor closed-end funds identified byCCC and (b) other products managed by CCC and that given the small universe of managers fitting within thecriteria for the peer group, CCC had not believed that it would be beneficial to engage the services of anindependent third party to prepare the peer group analysis and that the Independent Trustees had concurred withthis approach. Based on such information, the Board had determined that the proposed contractual annualadvisory fee of 1.00% of the Fund’s managed assets was equal to the median contractual advisory fee rate offunds within the peer group and that the fee structure was competitive with fee structures applicable to othersimilar products managed by CCC. The Board considered that the contractual annual advisory fee would remainunchanged under the Agreement. The Board noted that while certain terms of the Agreement differed from theFormer Advisory Agreement, in order to conform the terms of the Agreement to the Adviser’s advisoryagreements with other closed-end funds it managed, the Adviser had represented that the Agreement and FormerAdvisory Agreement were substantially similar and no material changes were proposed. The Board concluded thatthe investment advisory fees to be received by the Adviser were comparable to the fees charged to otherinvestment vehicles within the Fund’s peer group and to other clients of CCC in broadly comparable investmentproducts.
CONSIDERATION OF INVESTMENT PERFORMANCE. The Board, including the Independent Trustees,considered that in connection with its most recent approval of the continuation of the Former Advisory Agreementit had received and considered information regarding the Fund’s performance and comparisons of thatperformance to similar MLP closed-end funds along with the Alerian MLP index. The Board noted that the currentportfolio managers would continue to manage the Fund according to the same objectives and policies as before,and that significant changes to the Fund’s investment operations are not anticipated. The Board concluded that theinvestment performance of the Fund supported approving the Agreement.
OTHER CONSIDERATIONS. The Board, including the Independent Trustees, considered that in connection withits most recent approval of the continuation of the Former Advisory Agreement it had considered the anticipatedprofits, if any, to be realized by CCC in connection with the operation of the Fund and concluded that the profit, ifany, anticipated to be realized by CCC in connection with the operation of the Fund was not unreasonable. TheBoard noted that it was too early to predict how the Transaction may affect future profitability, but noted thatcontractual fee rates under the Agreement are the same as those assessed under the Former AdvisoryAgreement.
The Board, including the Independent Trustees, considered that in connection with its most recent approval of thecontinuation of the Former Advisory Agreement it had considered whether economies of scale in the provision ofservices to the Fund will be passed along to the shareholders under the proposed agreements and concludedthere were currently no or de minimis material economies of scale or other incidental benefits accruing to CCC inconnection with its relationship with the Fund. The Board further noted that representatives of the Adviser hadindicated that such economies of scale could not be predicted in advance of the closing of the Transaction.
CENTER COAST BROOKFIELD MLP & ENERGY INFRASTRUCTURE FUNDBoard Considerations Relating to the Investment Advisory Agreement (Unaudited) (continued)May 31, 2018
28 Brookfield Investment Management Inc.
The Board, including the Independent Trustees, considered other benefits to the Adviser, Brookfield and theiraffiliates expected to be derived from their relationships with the Fund as a result of the Transaction. The Boardconsidered that pursuant to the Transaction, the Adviser would enter into a replacement agreement for the fundsupport services agreement between the Fund and HRC Portfolio Solutions, LLC, and would provide fund supportservices in exchange for a fee payable by the Fund.
In addition to the factors above, the Board, including the Independent Trustees, also considered the following:
• Center Coast would rely on the provisions of Section 15(f) of the 1940 Act. In this regard, the Adviser hadagreed to conduct its business so as to assure that for a period of not less than two (2) years after theclosing, neither the Adviser nor any of its affiliates will impose or seek to impose on the Fund an “unfairburden” as a result of the Transaction, or any express or implied terms, conditions or understandingsapplicable thereto.
• The Fund would not incur any costs in seeking the necessary shareholder approvals for the Agreement.
• The reputation, financial strength and resources of Brookfield.
• The long-term investment philosophy of the Adviser and anticipated plans to grow the Center Coast team’sbusiness to the benefit of the Fund.
• The proposed Transaction, and the resulting continuity in the provision of fund support services to theFund, including the expected continuity in personnel providing such services, and that the overall scope andlevel of services that are currently provided to the Fund will not change and the Fund’s cost for theseservices will not change.
As a result of its review and consideration of the Agreement in connection with the Transaction, at a meeting onJuly 24, 2017, the Board, including the Independent Trustees voting separately, voted unanimously to approve theAgreement and to recommend the Agreement to Fund shareholders for their approval. Following the signing of thePurchase Agreement, at an in-person meeting held on October 26, 2017, the Board unanimously reaffirmed itsapproval of the Agreement and its recommendation of the Agreement to Fund shareholders for their approval.
CENTER COAST BROOKFIELD MLP & ENERGY INFRASTRUCTURE FUNDBoard Considerations Relating to the Investment Advisory Agreement (Unaudited) (continued)May 31, 2018
2018 Semi-Annual Report 29

A Dividend Reinvestment Plan (the “Plan”) is available to shareholders of the Fund pursuant to which they mayelect to have all distributions of dividends and capital gains automatically reinvested by American Stock Transfer &Trust Company (the “Plan Agent”) in additional Fund shares. Shareholders who do not participate in the Plan willreceive all distributions in cash paid by check mailed directly to the shareholder of record (or if the shares are heldin street or other nominee name, then to the nominee) by the Fund’s Custodian, as Dividend Disbursing Agent.
The Plan Agent serves as agent for the shareholders in administering the Plan. After the Fund declares a dividendor determines to make a capital gain distribution, payable in cash, if (1) the market price is lower than the net assetvalue, the participants in the Plan will receive the equivalent in Fund shares valued at the market price determinedas of the time of purchase (generally, the payment date of the dividend or distribution); or if (2) the market price ofthe shares on the payment date of the dividend or distribution is equal to or exceeds their net asset value,participants will be issued Fund shares at the higher of net asset value or 95% of the market price. This discountreflects savings in underwriting and other costs that the Fund otherwise will be required to incur to raise additionalcapital. If the net asset value exceeds the market price of the Fund shares on the payment date or the Funddeclares a dividend or other distribution payable only in cash (i.e., if the Board of Trustees precludes reinvestmentin Fund shares for that purpose), the Plan Agent will, as agent for the participants, receive the cash payment anduse it to buy Fund shares in the open market, on the New York Stock Exchange or elsewhere, for the participants’accounts. If, before the Plan Agent has completed its purchases, the market price exceeds the net asset value ofthe Fund’s shares, the average per share purchase price paid by the Plan Agent may exceed the net asset value ofthe Fund’s shares, resulting in the acquisition of fewer shares than if the dividend or distribution had been paid inshares issued by the Fund. The Fund will not issue shares under the Plan below net asset value.
Participants in the Plan may withdraw from the Plan upon written notice to the Plan Agent. When a participantwithdraws from the Plan or upon termination of the Plan by the Fund, certificates for whole shares credited to hisor her account under the Plan will be issued and a cash payment will be made for any fraction of a share creditedto such account.
There is no charge to participants for reinvesting dividends or capital gain distributions, except for certainbrokerage commissions, as described below. The Plan Agent’s fees for handling the reinvestment of dividends anddistributions are paid by the Fund. There are no brokerage commissions charged with respect to shares issueddirectly by the Fund. However, each participant will pay a pro rata share of brokerage commissions incurred withrespect to the Plan Agent’s open market purchases in connection with the reinvestment of dividends anddistributions.
The automatic reinvestment of dividends and distributions will not relieve participants of any federal income taxthat may be payable on such dividends or distributions.
A brochure describing the Plan is available from the Plan Agent, by calling 1-800-937-5449.
If you wish to participate in the Plan and your shares are held in your name, you may simply complete and mail theenrollment form in the brochure. If your shares are held in the name of your brokerage firm, bank or othernominee, you should ask them whether or how you can participate in the Plan. Shareholders whose shares areheld in the name of a brokerage firm, bank or other nominee and are participating in the Plan may not be able tocontinue participating in the Plan if they transfer their shares to a different brokerage firm, bank or other nominee,since such shareholders may participate only if permitted by the brokerage firm, bank or other nominee to whichtheir shares are transferred.
CENTER COAST BROOKFIELD MLP & ENERGY INFRASTRUCTURE FUNDDividend Reinvestment Plan (Unaudited)
30 Brookfield Investment Management Inc.

Brookfield Investment Management Inc. (“BIM”), on its own behalf and on behalf of the funds managed by BIMand its affiliates, recognizes and appreciates the importance of respecting the privacy of our clients andshareholders. Our relationships are based on integrity and trust and we maintain high standards to safeguard yournon-public personal information (“Personal Information”) at all times. This privacy policy (“Policy”) describes thetypes of Personal Information we collect about you, the steps we take to safeguard that information and thecircumstances in which it may be disclosed.
If you hold shares of a Fund through a financial intermediary, such as a broker, investment adviser, bank or trustcompany, the privacy policy of your financial intermediary will also govern how your Personal Information will beshared with other parties.
WHAT INFORMATION DO WE COLLECT?
We collect the following Personal Information about you:
• Information we receive from you in applications or other forms, correspondence or conversations, includingbut not limited to name, address, phone number, social security number, assets, income and date of birth.
• Information about transactions with us, our affiliates, or others, including but not limited to account number,balance and payment history, parties to transactions, cost basis information, and other financial information.
• Information we may receive from our due diligence, such as your creditworthiness and your credit history.
WHAT IS OUR PRIVACY POLICY?
We may share your Personal Information with our affiliates in order to provide products or services to you or tosupport our business needs. We will not disclose your Personal Information to nonaffiliated third parties unless 1)we have received proper consent from you; 2) we are legally permitted to do so; or 3) we reasonably believe, ingood faith, that we are legally required to do so. For example, we may disclose your Personal Information with thefollowing in order to assist us with various aspects of conducting our business, to comply with laws or industryregulations, and/or to effect any transaction on your behalf;
• Unaffiliated service providers (e.g. transfer agents, securities broker-dealers, administrators, investmentadvisors or other firms that assist us in maintaining and supporting financial products and services providedto you);
• Government agencies, other regulatory bodies and law enforcement officials (e.g. for reporting suspicioustransactions);
• Other organizations, with your consent or as directed by you; and
• Other organizations, as permitted or required by law (e.g. for fraud protection)
When we share your Personal Information, the information is made available for limited purposes and undercontrolled circumstances designed to protect your privacy. We require third parties to comply with our standards forsecurity and confidentiality.
HOW DO WE PROTECT CLIENT INFORMATION?
We restrict access to your Personal Information to those persons who require such information to assist us withproviding products or services to you. It is our practice to maintain and monitor physical, electronic, and proceduralsafeguards that comply with federal standards to guard client nonpublic personal information. We regularly trainour employees on privacy and information security and on their obligations to protect client information.
CONTACT INFORMATION
For questions concerning our Privacy Policy, please contact our client services representative at 1-855-777-8001.
CENTER COAST BROOKFIELD MLP & ENERGY INFRASTRUCTURE FUNDJoint Notice of Privacy Policy (Unaudited)
2018 Semi-Annual Report 31

[THIS PAGE IS INTENTIONALLY LEFT BLANK]

[THIS PAGE IS INTENTIONALLY LEFT BLANK]

[THIS PAGE IS INTENTIONALLY LEFT BLANK]

Investment Adviser and AdministratorBrookfield Investment Management Inc.Brookfield Place250 Vesey Street, 15th FloorNew York, New York 10281-1023www.brookfieldim.com
Please direct your inquiries to:Investor RelationsPhone: 1-855-777-8001E-mail: [email protected]
Transfer AgentStockholder inquiries relating to distributions, addresschanges and stockholder account information shouldbe directed to the Fund’s transfer agent:
American Stock Transfer & Trust Company6201 15th AvenueBrooklyn, New York 112191-800-937-5449
Fund Accounting AgentU.S. Bancorp Fund Services, LLC615 East Michigan StreetMilwaukee, Wisconsin 53202
Sub-AdministratorU.S. Bancorp Fund Services, LLC615 East Michigan StreetMilwaukee, Wisconsin 53202
Independent Registered Public Accounting FirmDeloitte & Touche LLP111 South Wacker DriveChicago, Illinois 60606
Legal CounselPaul Hastings LLP200 Park AvenueNew York, New York 10166
CustodianU.S. Bank National Association1555 Northriver Center Drive, Suite 302Milwaukee, Wisconsin 53212
DistributorForeside Fund Services, LLCThree Canal Plaza, Suite 100Portland, Maine 04101
Trustees of the FundEdward A. Kuczmarski ChairmanLouis P. Salvatore Audit Committee ChairmanHeather S. Goldman TrusteeStuart A. McFarland TrusteeDavid Levi Trustee (Interested)
Officers of the FundBrian F. Hurley PresidentAngela W. Ghantous TreasurerCasey Tushaus Assistant TreasurerMohamed Rasul Assistant TreasurerThomas D. Peeney SecretaryAdam R. Sachs Chief Compliance Officer
The Fund files its complete schedule of portfolio holdings with the SEC for the first and third quarters of each fiscal year on Form N-Q. TheFund’s Form N-Q are available on the SEC’s website at www.sec.gov. In addition, the Fund’s Form N-Q may be reviewed and copied at theSEC’s Public Reference Room in Washington, D.C. Information on the operation of the Public Reference Room may be obtained by calling1-800-SEC-0330.
You may obtain a description of the Fund’s proxy voting policies and procedures, information regarding how the Fund voted proxies relating toportfolio securities during the most recent 12-month period ended June 30, without charge, upon request by calling 1-855-777-8001, or go tothe SEC’s website at www.sec.gov.
CORPORATE INFORMATION

Brookfield Investment Management Inc.Brookfield Place 250 Vesey Street, 15th Floor New York, New York 10281-10231-855-777-8001www.brookfield.com