Embed Size (px)
Citation preview
Value Innovation for the Next Stage
Daifuku Report2018
Financial Section
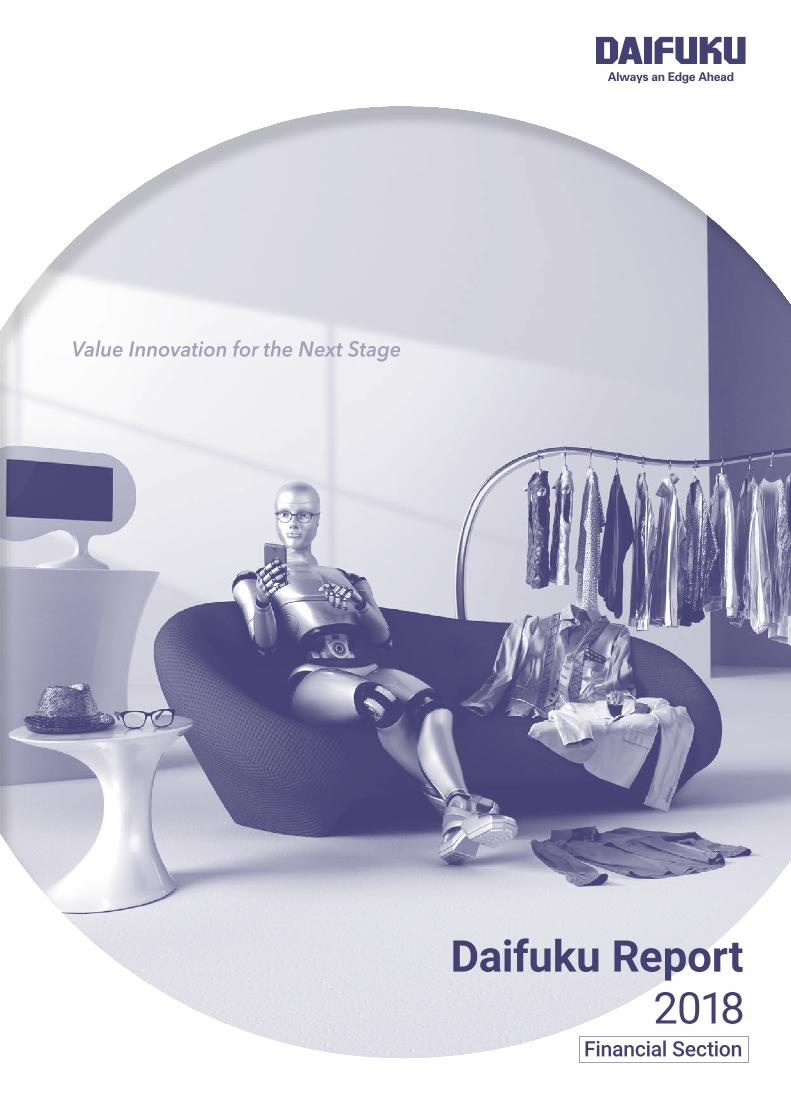
(Million yen) 2008 2009 2010 2011 2012 2013 2014 2015 2016 2017 2018
For the Year
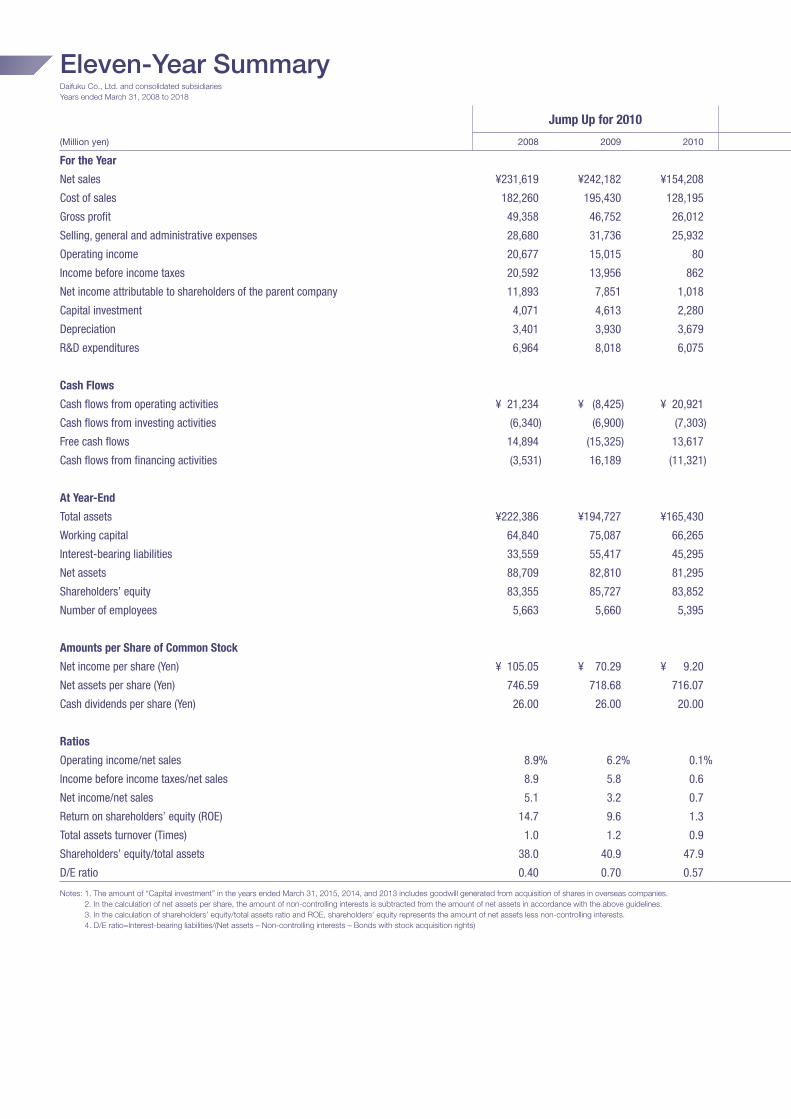
Net sales ¥231,619 ¥242,182 ¥154,208 ¥159,263 ¥198,052 ¥202,337 ¥241,811 ¥267,284 ¥ 336,184 ¥ 320,825 ¥ 404,925
Cost of sales 182,260 195,430 128,195 131,639 165,505 165,340 194,974 215,641 272,832 256,417 321,836
Gross profit 49,358 46,752 26,012 27,623 32,546 36,996 46,836 51,642 63,351 64,407 83,089
Selling, general and administrative expenses 28,680 31,736 25,932 25,897 28,328 28,986 34,279 36,759 42,472 41,308 43,164
Operating income 20,677 15,015 80 1,726 4,217 8,010 12,556 14,883 20,878 23,099 39,924
Income before income taxes 20,592 13,956 862 703 3,129 7,316 12,137 15,211 20,650 23,942 41,059
Net income attributable to shareholders of the parent company 11,893 7,851 1,018 269 1,223 4,439 7,740 9,810 13,652 16,746 29,008
Capital investment 4,071 4,613 2,280 3,221 2,393 7,687 10,446 7,532 4,210 5,905 6,348
Depreciation 3,401 3,930 3,679 3,577 3,612 3,332 3,821 4,157 4,587 4,202 4,419
R&D expenditures 6,964 8,018 6,075 6,370 6,484 6,855 7,490 6,945 7,009 7,489 8,123
Cash Flows
Cash flows from operating activities ¥ 21,234 ¥ (8,425) ¥ 20,921 ¥ 11,417 ¥ (5,187) ¥ 15,666 ¥ 20,447 ¥ 6,295 ¥ 7,206 ¥ 26,683 ¥ 11,497
Cash flows from investing activities (6,340) (6,900) (7,303) (3,616) (4,039) (13,649) (7,372) (5,846) (2,099) (5,393) (5,600)
Free cash flows 14,894 (15,325) 13,617 7,801 (9,227) 2,016 13,074 448 5,107 21,289 5,897
Cash flows from financing activities (3,531) 16,189 (11,321) (6,056) 7,709 88 1,045 (509) (8,702) (4,404) 13,444
At Year-End
Total assets ¥222,386 ¥194,727 ¥165,430 ¥163,388 ¥185,049 ¥206,875 ¥249,531 ¥271,011 ¥ 296,055 ¥ 303,540 ¥ 373,712
Working capital 64,840 75,087 66,265 65,908 61,943 45,832 87,070 91,187 99,293 96,401 142,267
Interest-bearing liabilities 33,559 55,417 45,295 40,912 51,010 53,385 58,144 60,547 40,904 39,770 37,967
Net assets 88,709 82,810 81,295 77,714 76,618 85,685 99,690 111,521 130,116 142,340 191,474
Shareholders’ equity 83,355 85,727 83,852 82,454 82,013 84,486 90,652 98,469 123,669 136,694 181,454
Number of employees 5,663 5,660 5,395 5,209 5,617 6,678 7,349 7,746 7,835 8,689 9,193
Amounts per Share of Common Stock
Net income per share (Yen) ¥ 105.05 ¥ 70.29 ¥ 9.20 ¥ 2.43 ¥ 11.05 ¥ 40.12 ¥ 69.96 ¥ 88.59 ¥ 118.72 ¥ 137.58 ¥ 235.62
Net assets per share (Yen) 746.59 718.68 716.07 683.39 674.72 754.98 875.14 972.75 1,044.40 1,142.14 1,493.69
Cash dividends per share (Yen) 26.00 26.00 20.00 15.00 15.00 15.00 18.00 22.00 30.00 42.00 70.00
Ratios
Operating income/net sales 8.9% 6.2% 0.1% 1.1% 2.1% 4.0% 5.2% 5.6% 6.2% 7.2% 9.9%
Income before income taxes/net sales 8.9 5.8 0.6 0.4 1.6 3.6 5.0 5.7 6.1 7.5 10.1
Net income/net sales 5.1 3.2 0.7 0.2 0.6 2.2 3.2 3.7 4.1 5.2 7.2
Return on shareholders’ equity (ROE) 14.7 9.6 1.3 0.3 1.6 5.6 8.6 9.6 11.6 12.6 17.7
Total assets turnover (Times) 1.0 1.2 0.9 1.0 1.1 1.0 1.0 1.0 1.1 1.1 1.1
Shareholders’ equity/total assets 38.0 40.9 47.9 46.3 40.3 40.4 38.8 39.8 42.9 45.8 50.3
D/E ratio 0.40 0.70 0.57 0.54 0.68 0.64 0.60 0.56 0.32 0.29 0.20
Notes: 1. The amount of “Capital investment” in the years ended March 31, 2015, 2014, and 2013 includes goodwill generated from acquisition of shares in overseas companies. 2. In the calculation of net assets per share, the amount of non-controlling interests is subtracted from the amount of net assets in accordance with the above guidelines. 3. In the calculation of shareholders’ equity/total assets ratio and ROE, shareholders’ equity represents the amount of net assets less non-controlling interests. 4. D/E ratio=Interest-bearing liabilities/(Net assets – Non-controlling interests – Bonds with stock acquisition rights)
Eleven-Year SummaryDaifuku Co., Ltd. and consolidated subsidiaries Years ended March 31, 2008 to 2018
Jump Up for 2010
ContentsOperating and Financial Review 2Consolidated Balance Sheets 6Consolidated Statements of Income and Comprehensive Income 8Consolidated Statements of Changes in Net Assets 9Consolidated Statements of Cash Flows 10Notes to the Consolidated Financial Statements 11Independent Auditor’s Report 40
(Million yen) 2008 2009 2010 2011 2012 2013 2014 2015 2016 2017 2018
For the Year
Net sales ¥231,619 ¥242,182 ¥154,208 ¥159,263 ¥198,052 ¥202,337 ¥241,811 ¥267,284 ¥ 336,184 ¥ 320,825 ¥ 404,925
Cost of sales 182,260 195,430 128,195 131,639 165,505 165,340 194,974 215,641 272,832 256,417 321,836
Gross profit 49,358 46,752 26,012 27,623 32,546 36,996 46,836 51,642 63,351 64,407 83,089
Selling, general and administrative expenses 28,680 31,736 25,932 25,897 28,328 28,986 34,279 36,759 42,472 41,308 43,164
Operating income 20,677 15,015 80 1,726 4,217 8,010 12,556 14,883 20,878 23,099 39,924
Income before income taxes 20,592 13,956 862 703 3,129 7,316 12,137 15,211 20,650 23,942 41,059
Net income attributable to shareholders of the parent company 11,893 7,851 1,018 269 1,223 4,439 7,740 9,810 13,652 16,746 29,008
Capital investment 4,071 4,613 2,280 3,221 2,393 7,687 10,446 7,532 4,210 5,905 6,348
Depreciation 3,401 3,930 3,679 3,577 3,612 3,332 3,821 4,157 4,587 4,202 4,419
R&D expenditures 6,964 8,018 6,075 6,370 6,484 6,855 7,490 6,945 7,009 7,489 8,123
Cash Flows
Cash flows from operating activities ¥ 21,234 ¥ (8,425) ¥ 20,921 ¥ 11,417 ¥ (5,187) ¥ 15,666 ¥ 20,447 ¥ 6,295 ¥ 7,206 ¥ 26,683 ¥ 11,497
Cash flows from investing activities (6,340) (6,900) (7,303) (3,616) (4,039) (13,649) (7,372) (5,846) (2,099) (5,393) (5,600)
Free cash flows 14,894 (15,325) 13,617 7,801 (9,227) 2,016 13,074 448 5,107 21,289 5,897
Cash flows from financing activities (3,531) 16,189 (11,321) (6,056) 7,709 88 1,045 (509) (8,702) (4,404) 13,444
At Year-End
Total assets ¥222,386 ¥194,727 ¥165,430 ¥163,388 ¥185,049 ¥206,875 ¥249,531 ¥271,011 ¥ 296,055 ¥ 303,540 ¥ 373,712
Working capital 64,840 75,087 66,265 65,908 61,943 45,832 87,070 91,187 99,293 96,401 142,267
Interest-bearing liabilities 33,559 55,417 45,295 40,912 51,010 53,385 58,144 60,547 40,904 39,770 37,967
Net assets 88,709 82,810 81,295 77,714 76,618 85,685 99,690 111,521 130,116 142,340 191,474
Shareholders’ equity 83,355 85,727 83,852 82,454 82,013 84,486 90,652 98,469 123,669 136,694 181,454
Number of employees 5,663 5,660 5,395 5,209 5,617 6,678 7,349 7,746 7,835 8,689 9,193
Amounts per Share of Common Stock
Net income per share (Yen) ¥ 105.05 ¥ 70.29 ¥ 9.20 ¥ 2.43 ¥ 11.05 ¥ 40.12 ¥ 69.96 ¥ 88.59 ¥ 118.72 ¥ 137.58 ¥ 235.62
Net assets per share (Yen) 746.59 718.68 716.07 683.39 674.72 754.98 875.14 972.75 1,044.40 1,142.14 1,493.69
Cash dividends per share (Yen) 26.00 26.00 20.00 15.00 15.00 15.00 18.00 22.00 30.00 42.00 70.00
Ratios
Operating income/net sales 8.9% 6.2% 0.1% 1.1% 2.1% 4.0% 5.2% 5.6% 6.2% 7.2% 9.9%
Income before income taxes/net sales 8.9 5.8 0.6 0.4 1.6 3.6 5.0 5.7 6.1 7.5 10.1
Net income/net sales 5.1 3.2 0.7 0.2 0.6 2.2 3.2 3.7 4.1 5.2 7.2
Return on shareholders’ equity (ROE) 14.7 9.6 1.3 0.3 1.6 5.6 8.6 9.6 11.6 12.6 17.7
Total assets turnover (Times) 1.0 1.2 0.9 1.0 1.1 1.0 1.0 1.0 1.1 1.1 1.1
Shareholders’ equity/total assets 38.0 40.9 47.9 46.3 40.3 40.4 38.8 39.8 42.9 45.8 50.3
D/E ratio 0.40 0.70 0.57 0.54 0.68 0.64 0.60 0.56 0.32 0.29 0.20
Notes: 1. The amount of “Capital investment” in the years ended March 31, 2015, 2014, and 2013 includes goodwill generated from acquisition of shares in overseas companies. 2. In the calculation of net assets per share, the amount of non-controlling interests is subtracted from the amount of net assets in accordance with the above guidelines. 3. In the calculation of shareholders’ equity/total assets ratio and ROE, shareholders’ equity represents the amount of net assets less non-controlling interests. 4. D/E ratio=Interest-bearing liabilities/(Net assets – Non-controlling interests – Bonds with stock acquisition rights)
Material Handling and Beyond Value Innovation 2017 Value Innovation 2020
1DAIFUKU REPORT 2018
Operating and Financial Review
Business OverviewIn fiscal 2017, the first year of its medium-term business
plan Value Innovation 2020, the Daifuku Group (“the
Group”) reported new record highs for orders received, net
sales and income. Orders were particularly strong, driven
by robust capital investment in the semiconductor and flat-
panel display (FPD) sectors in East Asia, as well as large
and active investments in e-commerce distribution centers,
together with favorable orders for systems for automobile
factories and airports. Daifuku’s ability to provide the
optimal solutions to customers across a wide range of
industries ensures its position as an unrivaled materials
handling system provider and integrator. Its extensive
product lineup, ability to provide proposals that respond to
customer needs, global reach, ability to fulfill on major
projects and strong after-sales services are decisive factors
in winning orders.
Sales were positive, underpinned by the high level of
orders. With increased production capacity due to
continued capital investment and increased supply capacity
to meet rapidly increasing demand in cooperation among
Group companies worldwide, the Group was able to
achieve growth in sales.
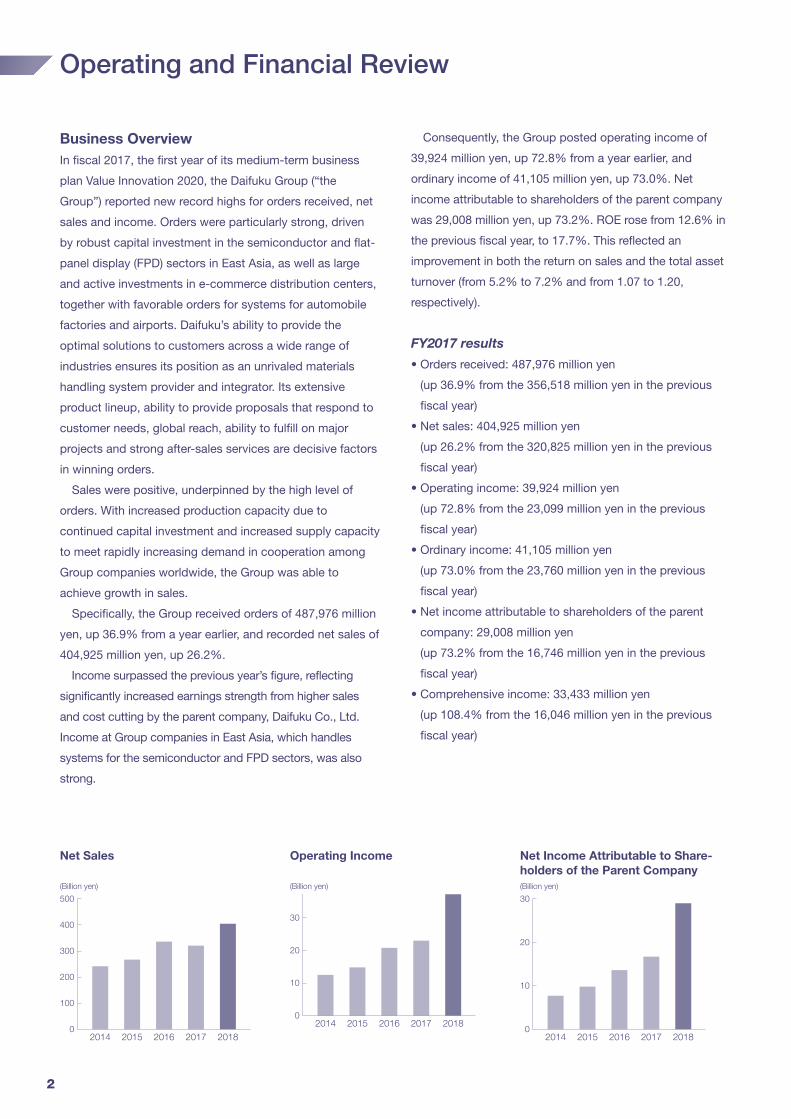
Specifically, the Group received orders of 487,976 million
yen, up 36.9% from a year earlier, and recorded net sales of
404,925 million yen, up 26.2%.
Income surpassed the previous year’s figure, reflecting
significantly increased earnings strength from higher sales
and cost cutting by the parent company, Daifuku Co., Ltd.
Income at Group companies in East Asia, which handles
systems for the semiconductor and FPD sectors, was also
strong.
Consequently, the Group posted operating income of
39,924 million yen, up 72.8% from a year earlier, and
ordinary income of 41,105 million yen, up 73.0%. Net
income attributable to shareholders of the parent company
was 29,008 million yen, up 73.2%. ROE rose from 12.6% in
the previous fiscal year, to 17.7%. This reflected an
improvement in both the return on sales and the total asset
turnover (from 5.2% to 7.2% and from 1.07 to 1.20,
respectively).
FY2017 results
• Orders received: 487,976 million yen
(up 36.9% from the 356,518 million yen in the previous
fiscal year)
• Net sales: 404,925 million yen
(up 26.2% from the 320,825 million yen in the previous
fiscal year)
• Operating income: 39,924 million yen
(up 72.8% from the 23,099 million yen in the previous
fiscal year)
• Ordinary income: 41,105 million yen
(up 73.0% from the 23,760 million yen in the previous
fiscal year)
• Net income attributable to shareholders of the parent
company: 29,008 million yen
(up 73.2% from the 16,746 million yen in the previous
fiscal year)
• Comprehensive income: 33,433 million yen
(up 108.4% from the 16,046 million yen in the previous
fiscal year)
Net Sales
(Billion yen)
2014 2015 2016 2017 2018
500
300
400
200
100
0
Operating Income
(Billion yen)
2014 2015 2016 2017 2018
40
20
30
10
0
Net Income Attributable to Shareholders of the Parent Company(Billion yen)
2014 2015 2016 2017 2018
30
20
10
0
2

Operating Results by Segment1. Daifuku Co., Ltd.
Orders were favorable, mainly due to the significant increase
in exports in systems for semiconductor and FPD factories in
East Asia and North America, the increased number of large
projects for distributors in Japan, and the Company’s highly
recognized proposals. In automobile production line systems,
orders remained firm, mainly for production re-building and
development, services, and small upgrade projects in Japan.
Sales increased steadily by expanding production capacity
in response to the strong increase in orders, including short
lead-time projects for semiconductor and FPD factories,
along with the Company maximizing comprehensive
strengths with partner companies, in procurement,
manufacturing, and installations. Income rose significantly,
mainly attributable to the increased sales and reduced costs.
As a result, the Company recorded orders of 215,934
million yen, up 26.2% from the previous fiscal year, sales of
186,983 million yen, up 28.2%, and segment income of
25,205 million yen, up 89.3%.
2. Contec Co., Ltd. and its subsidiaries
Industrial computers
In the Japanese market, sales of industrial computers
remained strong, mainly for the semiconductor
production equipment sector. In the medical device
sector in the United States, however, sales declined on
cautious trends emerging in new capital investment.
Measuring and control boards
Sales of measuring and control boards for production
facilities and wireless LANs for distributors’ store facilities
were steady, along with the increased capital investment
by companies.
Solution products
While sales of automobile-related systems rose, sales of
photovoltaic measurement systems declined, associated
with a fall in purchase prices of renewable energy.
As a result, Contec posted orders of 16,466 million yen,
up 5.4% from the previous fiscal year, sales of 15,716
million yen, up 1.7%, and segment income of 910 million
yen, up 26.1%.
3. Daifuku North America Holding Company
and its subsidiaries and affiliates
Orders were favorable in systems for semiconductor
manufacturers and airports. Orders from semiconductor
manufacturers were significantly higher than initially
expected. Compared with airports in Europe, baggage
handling systems used at airports in North America are
noticeably aging. Accordingly, investment in facility
upgrades is expected to continue for some time. In systems
for manufacturers and distributors, results reflected capital
investment concentrating on the e-commerce and
transportation sectors and decreased investment from
customers in other sectors. Meanwhile, the operation &
maintenance service business for distribution centers was
growing. Orders for automobile production line systems
remained firm.
Sales grew favorably, underpinned by strong orders.
Income fell, reflecting deteriorated profitability in certain
large projects for distributors.
As a result, Daifuku North America achieved orders of
110,441 million yen, up 24.3% from the previous fiscal year,
sales of 99,775 million yen, up 26.2%, and segment income
of 2,884 million yen, down 18.4%.
Net Assets and ROE
(Billion yen) (%)
2014 2015 2016 2017 2018
20
15
10
5
0
200
150
100
50
0
L L Net assets (left scale) ROE
Total Assets and ROA
(Billion yen) (%)
2014 2015 2016 2017 2018
9.0
6.0
3.0
0
400
300
200
100
0
L L Total assets (left scale) ROA
InterestBearing Liabilities
(Billion yen)
2014 2015 2016 2017 2018
90
30
60
0
3DAIFUKU REPORT 2018
Free Cash Flows(Billion yen)
2014 2015 2016 2017 2018
24
12
18
6
0
Capital Investment(Billion yen)
2014 2015 2016 2017 2018
12
6
9
3
0
Depreciation(Billion yen)
2014 2015 2016 2017 2018
5
3
4
2
1
0
4. Daifuku Plusmore Co., Ltd.
Daifuku Plusmore mainly provides sales and services for
car wash machines in Japan. Sales concluded almost as
initially planned, remaining firm thanks to solid sales of
machines for car service stations on the back of subsidies
from the government and steady demand from the
automotive aftermarket sectors, such as dealers.
Highly lauded by drivers, sales of the Sliding Bubble, a
space-saving foam car wash system for drive-through car
wash machines for car service stations, were strong.
Daifuku Plusmore also launched the Camion Custom, a
truck and bus wash machine that will assist in reducing the
workload of truck and bus drivers.
As a result, Daifuku Plusmore reported orders of 11,074
million yen, down 2.2% from the previous fiscal year, sales
of 10,778 million yen, down 6.0%, and segment income of
99 million yen, down 12.2%.
5. Other
The Group has a total of 53 consolidated subsidiaries and
affiliates worldwide. The Other segment includes all other
Group companies, excluding the aforementioned Contec
and its subsidiaries, Daifuku North America and its
subsidiaries and affiliates, and Daifuku Plusmore. Outside
Japan, major subsidiaries include Daifuku (China) Co., Ltd.
in China; Taiwan Daifuku Co., Ltd. in Taiwan; Daifuku Korea
Co., Ltd. and Clean Factomation, Inc. in South Korea; and
Daifuku (Thailand) Ltd. in Thailand, which primarily
manufacture and sell material handling systems and
equipment. Each of these companies plays a global role in
optimizing the local production and procurement framework
of the Group, while also increasing its exports.
In China, inquiries have been brisk from distributors,
including the e-commerce sector, and Daifuku (China)
Manufacturing Co., Ltd. received an order for its largest- ever
project. In automobile-related sectors, the company
received an order from a lithium-ion battery factory for the
first time, reflecting the policy of shifting to eco-friendly
electric vehicles, in addition to strong capital investment in
production lines by Japanese automakers and the
manufacturers of parts including seats. In systems for FPD
factories, while demand for OLEDs was rising, flat-panels for
TVs were growing in size, and Daifuku (Suzhou) Cleanroom
Automation Co., Ltd. continued to receive strong orders,
including large projects. Under China’s national policy of
promoting domestic production, orders for systems for
semiconductor factories also began to increase.
In Taiwan, orders for and sales of systems for
semiconductor and FPD factories remained firm.
In South Korea, orders for systems for semiconductor
factories were strong, reflecting active demand in the
semiconductor sector. The government’s policy of
improving the employment rate and halving the number of
non-regular employees is expected to accelerate the
equipment automation of companies. Along with increased
demand for tunnel-type car wash machines due to the
prohibition of car washing at home, Hallim Machinery Co.,
Ltd., which manufactures and sells car wash machines,
expanded supply capacity by relocating to a new factory.
In ASEAN countries and India, capital investment in systems
for manufacturers, including the food, miscellaneous daily
goods, and pharmaceutical sectors, is rising. In particular,
demand from the frozen-food sector is growing rapidly.
Group companies operating in each region have been
striving to meet these needs. Daifuku Thailand has been
proceeding with the local production of automated warehouses
and other equipment, and has won a large order from a mass
retailer. In India, Daifuku India Private Limited is now working
with sectors other than automobiles, installing its conveyor
system at a construction manufacturer’s assembly shop.
4
New Zealand-based BCS Group Limited is enhancing its
global airport technology business by collaborating with
other Group companies.
As a result, the segment recorded orders of 134,059
million yen, up 92.7% from the previous fiscal year, sales of
95,755 million yen, up 39.2%, and segment income of
4,737 million yen, up 107.1%.
Financial PositionAssets, liabilities, and net assets
Total assets at the end of fiscal 2017 stood at 373,712
million yen, an increase of 70,171 million yen from the end
of the previous fiscal year. The result principally reflected an
increase of 39,095 million yen in notes and accounts
receivable and unbilled receivables and an increase of
20,358 million yen in cash on hand and in banks.
Total liabilities at the end of fiscal 2017 were 182,237
million yen, an increase of 21,038 million yen year on year.
Primary factors included increases of 6,139 million yen in
notes and accounts payable and construction contracts
payable and 9,121 million yen in income taxes payable.
Net assets at the end of fiscal 2017 were 191,474 million
yen, an increase of 49,133 million yen from the end of the
previous fiscal year. This was mainly attributable to
increases of 16,849 million yen in common stock and
22,305 million yen in retained earnings.
Cash flows
Cash and cash equivalents at the end of fiscal 2017
increased 20,361 million yen from the end of the previous
fiscal year, to 85,152 million yen, compared with 64,790
million yen in the same period of the previous fiscal year.
Cash flows from operating activities
Cash provided by operating activities totaled 11,497 million
yen, compared with cash provided of 26,683 million yen in
the same period of the previous fiscal year. This primarily
reflected income before income taxes of 41,059 million yen
and an increase in notes and accounts payable of 9,464
million yen, offsetting an increase in notes and accounts
receivable of 37,923 million yen and an increase in
inventories of 4,155 million yen.
Cash flows from investing activities
Cash used in investing activities was 5,600 million yen,
compared with cash used of 5,393 million yen in the same
period of the previous fiscal year. Major factors included
6,417 million yen for payments for the purchase of property,
plant and equipment, outweighing proceeds of 740 million
yen from sales of property, plant and equipment.
Cash flows from financing activities
Cash provided by financing activities was 13,444 million yen,
compared with cash used of 4,404 million yen in the same
period of the previous fiscal year, mainly attributable to
proceeds of 16,697 million yen from issuance of common
shares, offsetting payment of cash dividends of 6,695 million
yen.
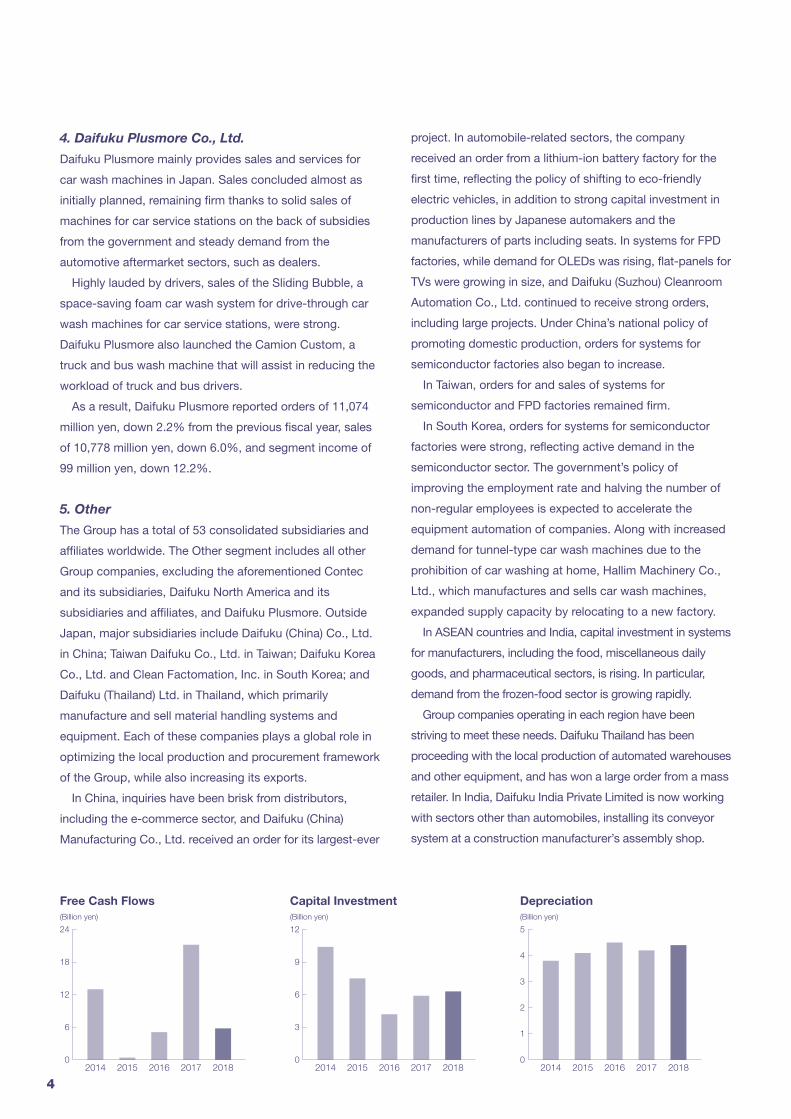
Capital InvestmentDuring fiscal 2017, the Group’s capital investment was
6,348 million yen, which included mainly in Daifuku Co.,
Ltd. for maintenance and renewal work on various factory
equipment at its Shiga Works.
Dividend PolicyDaifuku regards the return of profits to shareholders as its
most important management task and adopts a
performance-based policy for cash dividends based on
consolidated net income. Under its four-year medium-term
business plan Value Innova tion 2020, Daifuku aims to
achieve a dividend payout ratio of 30% and increase its
corporate value through investments for growth. Taking the
results of fiscal 2017 and the above policy into account,
Daifuku paid an interim dividend of 25 yen per share, and a
year-end dividend of 45 yen, thus bringing the annual
dividend to 70 yen per share for fiscal 2017.
With respect to dividends for fiscal 2018, taking into
consideration the earnings forecast for fiscal 2018 and the
above policy, Daifuku plans to pay an annual dividend of 75
yen per share (an interim dividend of 25 yen per share and a
year-end dividend of 50 yen).
R&D Expenditure(Billion yen)
2014 2015 2016 2017 2018
9
6
3
0
5DAIFUKU REPORT 2018

Consolidated Balance SheetsDaifuku Co., Ltd. and consolidated subsidiaries March 31, 2018 and 2017
(Million yen)
March 31
ASSETS 2018 2017
Current assets:Cash on hand and in banks (Notes 8 and 26) ¥ 85,160 ¥ 64,802
Notes and accounts receivable and unbilled receivables (Note 8) 163,101 124,005
Merchandise and finished goods 5,084 4,910
Costs incurred on uncompleted construction contracts and other (Note 7) 10,657 8,860
Raw materials and supplies 11,296 9,086
Deferred tax assets (Notes 5 and 25) 4,988 3,429
Other current assets 10,915 7,489
Less: allowance for doubtful accounts (128) (116)
Total current assets 291,076 222,468
Non-current assets:Property, plant and equipment (Notes 6 and 12):
Buildings and structures, net 15,091 13,344
Machinery and vehicles, net 4,411 4,040
Tools and fixtures, net 1,768 1,455
Land 11,800 12,041
Other, net 2,179 2,704
Total property, plant and equipment 35,252 33,586
Intangible assets: Software 3,208 3,244
Goodwill 8,794 9,882
Other 2,035 2,304
Total intangible assets 14,037 15,430
Investments and other assets:Investments in securities (Notes 8, 9, and 10) 23,976 21,260
Long-term loans 140 147
Assets for retirement benefits (Note 13) 3,967 2,628
Deferred tax assets (Notes 5 and 25) 2,077 4,865
Other 3,319 3,285
Less: allowance for doubtful accounts (136) (132)
Total investments and other assets 33,345 32,054
Total non-current assets 82,635 81,071
Total assets ¥373,712 ¥303,540
The accompanying notes are an integral part of these statements.
6

(Million yen)
March 31
LIABILITIES 2018 2017
Current liabilities: Notes and accounts payable and construction contracts payable (Note 8) ¥ 46,450 ¥ 40,311
Electronically recorded obligations - operating (Note 8) 22,826 18,806
Short-term borrowings and current portion of long-term borrowings (Notes 8 and 11) 17,267 21,647
Current portion of bonds 2,700 —
Income taxes payable 10,360 1,239
Advances received on uncompleted construction contracts and other 28,298 26,313
Provision for losses on construction contracts (Notes 7 and 19) 562 863
Other current liabilities (Note 11) 20,342 16,885
Total current liabilities 148,809 126,067
Non-current liabilities: Bonds (Notes 8 and 11) — 2,700
Long-term borrowings (Notes 8 and 11) 18,000 15,422
Deferred tax liabilities (Notes 5 and 25) 1,210 619
Liabilities for retirement benefits (Note 13) 11,656 13,486
Negative goodwill — 59
Other non-current liabilities (Note 11) 2,562 2,843
Total non-current liabilities 33,428 35,132
Total liabilities 182,237 161,199
Contingent liabilities (Note 15)
NET ASSETSShareholders’ equity (Notes 5 and 17): Common stock:
Authorized—250,000,000 shares
Issued—126,610,077 shares 31,865 15,016
Capital surplus 20,717 15,915
Retained earnings 129,654 107,349
Less: treasury stock, at cost—March 31, 2018—828,727 shares (782) (1,586)
March 31, 2017—1,827,904 shares
Total shareholders’ equity 181,454 136,694
Accumulated other comprehensive income: Net unrealized gain (loss) on securities 5,358 4,290
Deferred gain (loss) on hedges 34 (5)
Foreign currency translation adjustments 6,360 5,102
Accumulated adjustments on retirement benefits (Note 13) (5,328) (6,989)
Total accumulated other comprehensive income 6,424 2,398
Non-controlling interests Non-controlling interests 3,595 3,247
Total net assets 191,474 142,340
Total liabilities and net assets ¥373,712 ¥303,540
The accompanying notes are an integral part of these statements.
7DAIFUKU REPORT 2018
Consolidated Statements of Income and Comprehensive IncomeDaifuku Co., Ltd. and consolidated subsidiaries For the years ended March 31, 2018 and 2017
(Million yen)March 31
2018 2017
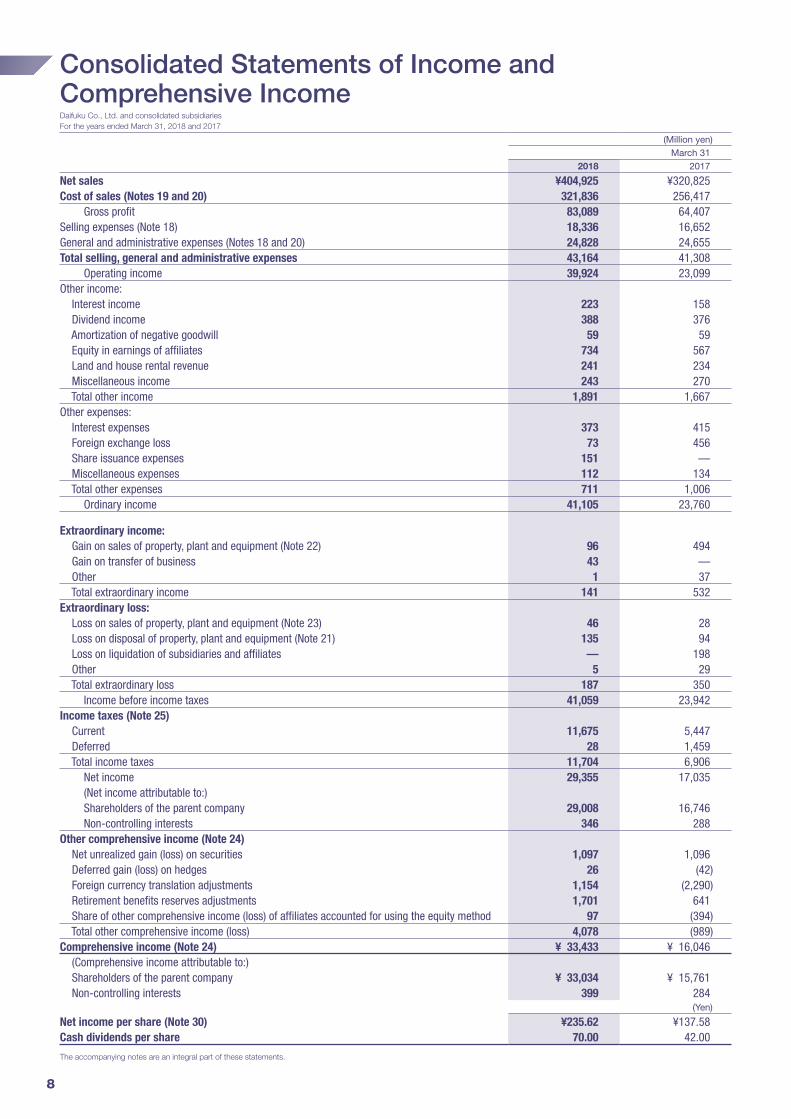
Net sales ¥404,925 ¥320,825Cost of sales (Notes 19 and 20) 321,836 256,417 Gross profit 83,089 64,407Selling expenses (Note 18) 18,336 16,652General and administrative expenses (Notes 18 and 20) 24,828 24,655Total selling, general and administrative expenses 43,164 41,308 Operating income 39,924 23,099Other income: Interest income 223 158 Dividend income 388 376 Amortization of negative goodwill 59 59 Equity in earnings of affiliates 734 567 Land and house rental revenue 241 234 Miscellaneous income 243 270 Total other income 1,891 1,667Other expenses: Interest expenses 373 415 Foreign exchange loss 73 456 Share issuance expenses 151 — Miscellaneous expenses 112 134 Total other expenses 711 1,006 Ordinary income 41,105 23,760
Extraordinary income: Gain on sales of property, plant and equipment (Note 22) 96 494 Gain on transfer of business 43 — Other 1 37 Total extraordinary income 141 532Extraordinary loss: Loss on sales of property, plant and equipment (Note 23) 46 28 Loss on disposal of property, plant and equipment (Note 21) 135 94 Loss on liquidation of subsidiaries and affiliates — 198 Other 5 29 Total extraordinary loss 187 350 Income before income taxes 41,059 23,942Income taxes (Note 25) Current 11,675 5,447 Deferred 28 1,459 Total income taxes 11,704 6,906 Net income 29,355 17,035 (Net income attributable to:) Shareholders of the parent company 29,008 16,746 Non-controlling interests 346 288Other comprehensive income (Note 24) Net unrealized gain (loss) on securities 1,097 1,096 Deferred gain (loss) on hedges 26 (42) Foreign currency translation adjustments 1,154 (2,290) Retirement benefits reserves adjustments 1,701 641 Share of other comprehensive income (loss) of affiliates accounted for using the equity method 97 (394) Total other comprehensive income (loss) 4,078 (989)Comprehensive income (Note 24) ¥ 33,433 ¥ 16,046 (Comprehensive income attributable to:) Shareholders of the parent company ¥ 33,034 ¥ 15,761 Non-controlling interests 399 284
(Yen)
Net income per share (Note 30) ¥235.62 ¥137.58Cash dividends per share 70.00 42.00
The accompanying notes are an integral part of these statements.
8

Consolidated Statements of Changes in Net AssetsDaifuku Co., Ltd. and consolidated subsidiaries For the years ended March 31, 2018 and 2017
Shareholders’ equity
Number ofshares of
common stockCommon
stockCapital surplus
Retained earnings
Treasury stock,
at cost
Total shareholders’
equity
(Thousands) (Million yen)
Balance at March 31, 2016 123,610 ¥15,016 ¥15,794 ¥ 94,501 ¥(1,642) ¥123,669
Cash dividends — — — (3,898) — (3,898)
Issuance of new shares — — — — — —
Net income attributable to shareholders of the parent company — — — 16,746 — 16,746
Purchase of treasury stock — — — — (185) (185)
Disposal of treasury stock — — 107 — 242 350
Change in treasury shares of parent arising from transactions with non-controlling shareholders — — 12 — — 12
Net changes of items other than shareholders’ equity — — — — — —
Balance at March 31, 2017 123,610 ¥15,016 ¥15,915 ¥107,349 ¥(1,586) ¥136,694
Cash dividends — — — (6,702) — (6,702)
Issuance of new shares 3,000 16,849 — — — 16,849
Net income attributable to shareholders of the parent company — — — 29,008 — 29,008
Purchase of treasury stock — — — — (15) (15)
Disposal of treasury stock — — 4,802 — 819 5,621
Change in treasury shares of parent arising from transactions with non-controlling shareholders — — (0) — — (0)
Net changes of items other than shareholders’ equity — — — — — —
Balance at March 31, 2018 126,610 ¥31,865 ¥20,717 ¥129,654 ¥ (782) ¥181,454
Accumulated other comprehensive income
Net unrealized
gain (loss) on securities
Deferred gain (loss) on hedges
Foreign currency
translation adjustments
Accumulated adjustments
on retirement benefits
Total accumulated
other comprehensive
income
Non-controlling
interestsTotal net
assets
(Million yen)
Balance at March 31, 2016 ¥3,206 ¥22 ¥7,730 ¥(7,576) ¥3,383 ¥3,063 ¥130,116
Cash dividends — — — — — — (3,898)
Issuance of new shares — — — — — — —
Net income attributable to shareholders of the parent company — — — — — — 16,746
Purchase of treasury stock — — — — — — (185)
Disposal of treasury stock — — — — — — 350
Change in treasury shares of parent arising from transactions with non-controlling shareholders — — — — — — 12
Net changes of items other than shareholders’ equity 1,083 (28) (2,628) 587 (985) 184 (801)
Balance at March 31, 2017 ¥4,290 ¥ (5) ¥5,102 ¥(6,989) ¥2,398 ¥3,247 ¥142,340
Cash dividends — — — — — — (6,702)
Issuance of new shares — — — — — — 16,849
Net income attributable to shareholders of the parent company — — — — — — 29,008
Purchase of treasury stock — — — — — — (15)
Disposal of treasury stock — — — — — — 5,621
Change in treasury shares of parent arising from transactions with non-controlling shareholders — — — — — — (0)
Net changes of items other than shareholders’ equity 1,067 39 1,258 1,660 4,025 347 4,373
Balance at March 31, 2018 ¥5,358 ¥34 ¥6,360 ¥(5,328) ¥6,424 ¥3,595 ¥191,474
The accompanying notes are an integral part of these statements.
9DAIFUKU REPORT 2018
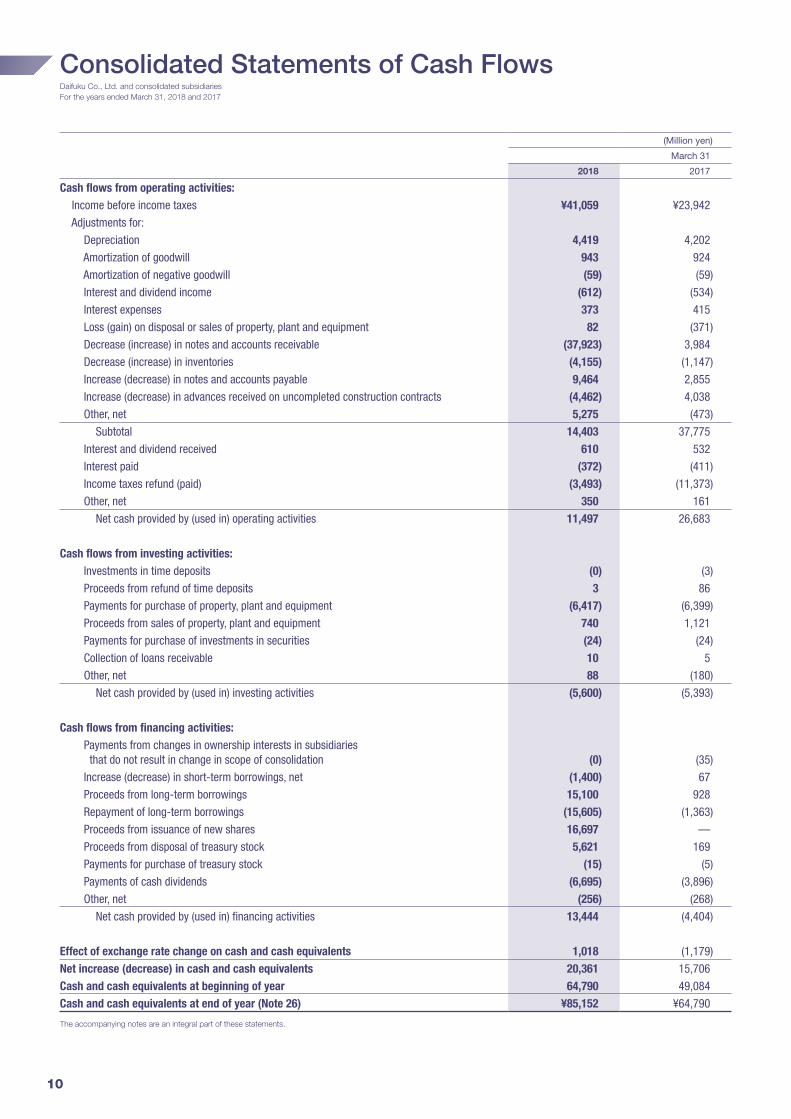
Consolidated Statements of Cash FlowsDaifuku Co., Ltd. and consolidated subsidiaries For the years ended March 31, 2018 and 2017
(Million yen)
March 31
2018 2017
Cash flows from operating activities: Income before income taxes ¥41,059 ¥23,942
Adjustments for:
Depreciation 4,419 4,202
Amortization of goodwill 943 924
Amortization of negative goodwill (59) (59)
Interest and dividend income (612) (534)
Interest expenses 373 415
Loss (gain) on disposal or sales of property, plant and equipment 82 (371)
Decrease (increase) in notes and accounts receivable (37,923) 3,984
Decrease (increase) in inventories (4,155) (1,147)
Increase (decrease) in notes and accounts payable 9,464 2,855
Increase (decrease) in advances received on uncompleted construction contracts (4,462) 4,038
Other, net 5,275 (473)
Subtotal 14,403 37,775
Interest and dividend received 610 532
Interest paid (372) (411)
Income taxes refund (paid) (3,493) (11,373)
Other, net 350 161
Net cash provided by (used in) operating activities 11,497 26,683
Cash flows from investing activities: Investments in time deposits (0) (3)
Proceeds from refund of time deposits 3 86
Payments for purchase of property, plant and equipment (6,417) (6,399)
Proceeds from sales of property, plant and equipment 740 1,121
Payments for purchase of investments in securities (24) (24)
Collection of loans receivable 10 5
Other, net 88 (180)
Net cash provided by (used in) investing activities (5,600) (5,393)
Cash flows from financing activities: Payments from changes in ownership interests in subsidiaries
that do not result in change in scope of consolidation (0) (35)
Increase (decrease) in short-term borrowings, net (1,400) 67
Proceeds from long-term borrowings 15,100 928
Repayment of long-term borrowings (15,605) (1,363)
Proceeds from issuance of new shares 16,697 —
Proceeds from disposal of treasury stock 5,621 169
Payments for purchase of treasury stock (15) (5)
Payments of cash dividends (6,695) (3,896)
Other, net (256) (268)
Net cash provided by (used in) financing activities 13,444 (4,404)
Effect of exchange rate change on cash and cash equivalents 1,018 (1,179)
Net increase (decrease) in cash and cash equivalents 20,361 15,706
Cash and cash equivalents at beginning of year 64,790 49,084
Cash and cash equivalents at end of year (Note 26) ¥85,152 ¥64,790
The accompanying notes are an integral part of these statements.
10

Notes to the Consolidated Financial StatementsDaifuku Co., Ltd. and consolidated subsidiaries For the years ended March 31, 2018 and 2017
1. Basis of presenting consolidated financial statements
The accompanying consolidated financial statements have been
prepared based on the accounts maintained by Daifuku Co., Ltd.
(hereinafter “the Company”) and its consolidated subsidiaries.
The Company and its domestic subsidiaries have maintained their
accounts and records in accordance with the provisions set forth in
Japan’s Companies Act and in conformity with generally accepted
accounting principles prevailing in Japan, which are different in
certain respects as to application and disclosure requirements of
International Financial Reporting Standards, and are compiled from
the consolidated financial statements prepared by the Company as
required by the Financial Instruments and Exchange Act of Japan.
The accounts of its overseas consolidated subsidiaries are based
on their accounting records, which are maintained in conformity with
generally accepted accounting principles and practices prevailing in
the respective countries in which the subsidiaries have been
incorporated. Necessary adjustments to the accounts of the
overseas consolidated subsidiaries have been reflected in the
accompanying consolidated financial statements, in all material
respects, to present them in conformity with International Financial
Reporting Standards or accounting principles generally accepted in
the United States of America.
The presentation of the accompanying consolidated financial
statements is made in conformity with the “Regulations Concerning
Terminology, Forms and Preparation Methods of Consolidated
Financial Statements” (ordinance promulgated by the Japanese
Cabinet Office) and meets the requirements for disclosure of
financial information of the Company on a consolidated basis.
Amounts less than ¥1 million have been rounded down. As a
result, the totals shown in the consolidated financial statements and
notes thereto do not necessarily agree with the sum of the individual
account balances.
2. Summary of significant accounting policies
(1) Principles of consolidationThe consolidated financial statements consist of the accounts of the
parent company and 53 subsidiaries as of March 31, 2018.
The following two subsidiaries are newly included in the scope of
consolidation for the fiscal year ended March 31, 2018:
• Daifuku Europe GmbH, which was established by the Company
• Daifuku Self Services Technologies AS, which was established by
BCS Group Limited
The following four subsidiaries were excluded from the scope of
consolidation for the year ended March 31, 2018:
• Hiniaratakan Corporation, which was absorbed by the Company
• Contec Software Development Co., Ltd., which was absorbed by
Contec Co., Ltd.
• Pacific Coast Structures Inc., which was liquidated by Daifuku
North America Holding Company
• Daifuku Renace Co., Ltd., which was disposed by the Company
The domestic consolidated subsidiaries and Daifuku India Private
Limited, an overseas consolidated subsidiary, adopt the same
fiscal year as the Company. Forty-seven (47) overseas
consolidated subsidiaries adopt the fiscal year ending
December 31. For the consolidation of these overseas
subsidiaries, the Company makes appropriate adjustments
for any material transactions subsequent to December 31.
The Company has two affiliates, including Knapp AG, as of March
31, 2018, which are accounted for using the equity method. For
equity-method affiliates that have a different fiscal year from the
Company’s, the financial statements for the fiscal year of these
companies are used. The number of equity-method affiliates is the
same as the year ended March 31, 2017.
The Company has one affiliate, IKS Co., Ltd., which is not
accounted for using the equity method but using the cost method
since total assets, net sales, net income or loss (the amount
corresponding to equity interests), and retained earnings (the
amount corresponding to equity interests), etc. of the affiliates are
not deemed to have a significant impact on the Company’s
consolidated financial statements as a whole. The number of non-
equity-method affiliates is the same as the year ended March 31,
2017.
All significant intercompany transactions, account balances, and
unrealized profit among the consolidated group have been
eliminated.
(2) Translation of foreign currenciesAccounts receivable and payable denominated in foreign currencies
are translated into Japanese yen at year-end exchange rates. Resulting
gains and losses are charged or credited to income for the period.
The balance sheet accounts of the overseas consolidated
subsidiaries and affiliates are translated into Japanese yen at year-
end exchange rates, except for shareholders’ equity, which is
translated at the historical exchange rates. Revenue and expense
accounts of the overseas consolidated subsidiaries and affiliates are
translated into Japanese yen at the average rate for the year.
The translation differences in Japanese yen arising from the use of
different rates are recorded as “Foreign currency translation
adjustments” and “Non-controlling interests” in the consolidated
balance sheets.
(3) Cash and cash equivalentsCash and cash equivalents consist of cash on hand, deposits that
can be withdrawn at any time, and short-term investments with a
maturity of three months or less from the date of acquisition, which
are readily convertible to cash and bear only an insignificant risk of
price fluctuation.
(4) InventoriesInventories are stated at the lower of cost or market. The costs of
components relating to material handling systems and “Raw
materials and supplies” are determined using the moving-average
method, while the specific identification method is used for other
inventories.
(5) Financial instruments(a) Derivatives
All derivatives are stated at fair value.
11DAIFUKU REPORT 2018
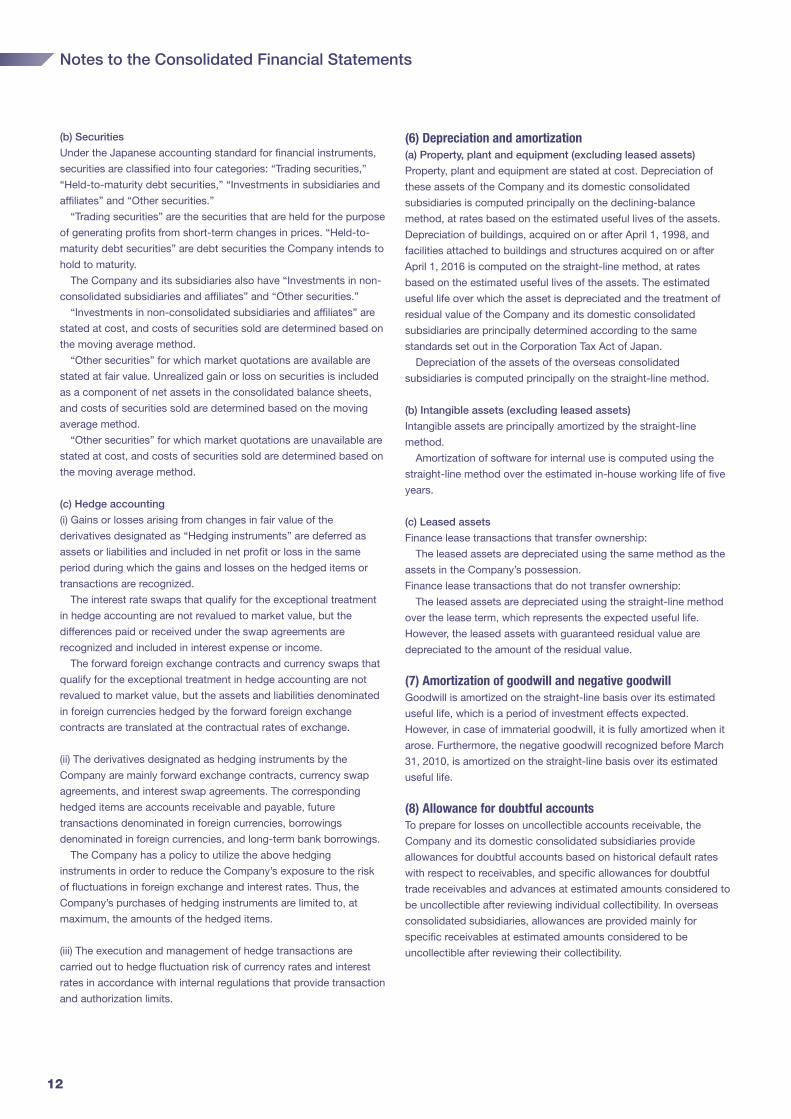
(b) Securities
Under the Japanese accounting standard for financial instruments,
securities are classified into four categories: “Trading securities,”
“Held-to-maturity debt securities,” “Investments in subsidiaries and
affiliates” and “Other securities.”
“Trading securities” are the securities that are held for the purpose
of generating profits from short-term changes in prices. “Held-to-
maturity debt securities” are debt securities the Company intends to
hold to maturity.
The Company and its subsidiaries also have “Investments in non-
consolidated subsidiaries and affiliates” and “Other securities.”
“Investments in non-consolidated subsidiaries and affiliates” are
stated at cost, and costs of securities sold are determined based on
the moving average method.
“Other securities” for which market quotations are available are
stated at fair value. Unrealized gain or loss on securities is included
as a component of net assets in the consolidated balance sheets,
and costs of securities sold are determined based on the moving
average method.
“Other securities” for which market quotations are unavailable are
stated at cost, and costs of securities sold are determined based on
the moving average method.
(c) Hedge accounting
(i) Gains or losses arising from changes in fair value of the
derivatives designated as “Hedging instruments” are deferred as
assets or liabilities and included in net profit or loss in the same
period during which the gains and losses on the hedged items or
transactions are recognized.
The interest rate swaps that qualify for the exceptional treatment
in hedge accounting are not revalued to market value, but the
differences paid or received under the swap agreements are
recognized and included in interest expense or income.
The forward foreign exchange contracts and currency swaps that
qualify for the exceptional treatment in hedge accounting are not
revalued to market value, but the assets and liabilities denominated
in foreign currencies hedged by the forward foreign exchange
contracts are translated at the contractual rates of exchange.
(ii) The derivatives designated as hedging instruments by the
Company are mainly forward exchange contracts, currency swap
agreements, and interest swap agreements. The corresponding
hedged items are accounts receivable and payable, future
transactions denominated in foreign currencies, borrowings
denominated in foreign currencies, and long-term bank borrowings.
The Company has a policy to utilize the above hedging
instruments in order to reduce the Company’s exposure to the risk
of fluctuations in foreign exchange and interest rates. Thus, the
Company’s purchases of hedging instruments are limited to, at
maximum, the amounts of the hedged items.
(iii) The execution and management of hedge transactions are
carried out to hedge fluctuation risk of currency rates and interest
rates in accordance with internal regulations that provide transaction
and authorization limits.
(6) Depreciation and amortization(a) Property, plant and equipment (excluding leased assets)
Property, plant and equipment are stated at cost. Depreciation of
these assets of the Company and its domestic consolidated
subsidiaries is computed principally on the declining-balance
method, at rates based on the estimated useful lives of the assets.
Depreciation of buildings, acquired on or after April 1, 1998, and
facilities attached to buildings and structures acquired on or after
April 1, 2016 is computed on the straight-line method, at rates
based on the estimated useful lives of the assets. The estimated
useful life over which the asset is depreciated and the treatment of
residual value of the Company and its domestic consolidated
subsidiaries are principally determined according to the same
standards set out in the Corporation Tax Act of Japan.
Depreciation of the assets of the overseas consolidated
subsidiaries is computed principally on the straight-line method.
(b) Intangible assets (excluding leased assets)
Intangible assets are principally amortized by the straight-line
method.
Amortization of software for internal use is computed using the
straight-line method over the estimated in-house working life of five
years.
(c) Leased assets
Finance lease transactions that transfer ownership:
The leased assets are depreciated using the same method as the
assets in the Company’s possession.
Finance lease transactions that do not transfer ownership:
The leased assets are depreciated using the straight-line method
over the lease term, which represents the expected useful life.
However, the leased assets with guaranteed residual value are
depreciated to the amount of the residual value.
(7) Amortization of goodwill and negative goodwillGoodwill is amortized on the straight-line basis over its estimated
useful life, which is a period of investment effects expected.
However, in case of immaterial goodwill, it is fully amortized when it
arose. Furthermore, the negative goodwill recognized before March
31, 2010, is amortized on the straight-line basis over its estimated
useful life.
(8) Allowance for doubtful accountsTo prepare for losses on uncollectible accounts receivable, the
Company and its domestic consolidated subsidiaries provide
allowances for doubtful accounts based on historical default rates
with respect to receivables, and specific allowances for doubtful
trade receivables and advances at estimated amounts considered to
be uncollectible after reviewing individual collectibility. In overseas
consolidated subsidiaries, allowances are provided mainly for
specific receivables at estimated amounts considered to be
uncollectible after reviewing their collectibility.
Notes to the Consolidated Financial Statements
12
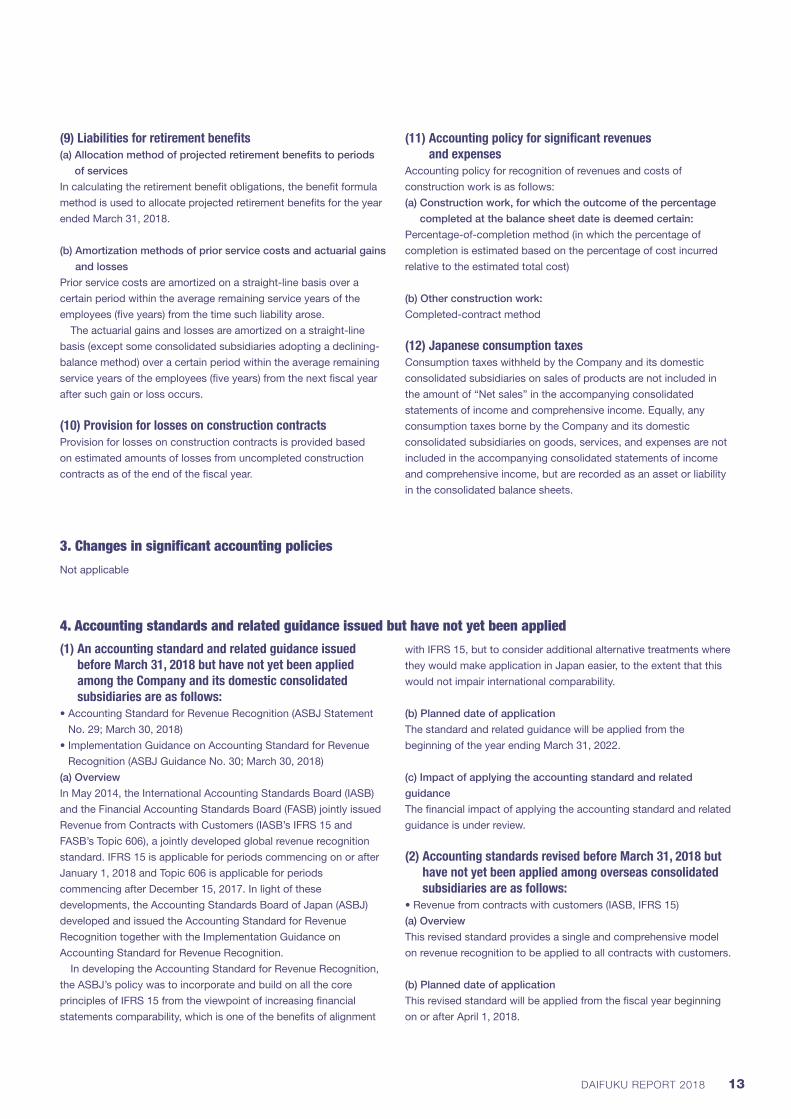
(9) Liabilities for retirement benefits(a) Allocation method of projected retirement benefits to periods
of services
In calculating the retirement benefit obligations, the benefit formula
method is used to allocate projected retirement benefits for the year
ended March 31, 2018.
(b) Amortization methods of prior service costs and actuarial gains
and losses
Prior service costs are amortized on a straight-line basis over a
certain period within the average remaining service years of the
employees (five years) from the time such liability arose.
The actuarial gains and losses are amortized on a straight-line
basis (except some consolidated subsidiaries adopting a declining-
balance method) over a certain period within the average remaining
service years of the employees (five years) from the next fiscal year
after such gain or loss occurs.
(10) Provision for losses on construction contractsProvision for losses on construction contracts is provided based
on estimated amounts of losses from uncompleted construction
contracts as of the end of the fiscal year.
(11) Accounting policy for significant revenues and expenses
Accounting policy for recognition of revenues and costs of
construction work is as follows:
(a) Construction work, for which the outcome of the percentage
completed at the balance sheet date is deemed certain:
Percentage-of-completion method (in which the percentage of
completion is estimated based on the percentage of cost incurred
relative to the estimated total cost)
(b) Other construction work:
Completed-contract method
(12) Japanese consumption taxesConsumption taxes withheld by the Company and its domestic
consolidated subsidiaries on sales of products are not included in
the amount of “Net sales” in the accompanying consolidated
statements of income and comprehensive income. Equally, any
consumption taxes borne by the Company and its domestic
consolidated subsidiaries on goods, services, and expenses are not
included in the accompanying consolidated statements of income
and comprehensive income, but are recorded as an asset or liability
in the consolidated balance sheets.
3. Changes in significant accounting policies
Not applicable
4. Accounting standards and related guidance issued but have not yet been applied
(1) An accounting standard and related guidance issued before March 31, 2018 but have not yet been applied among the Company and its domestic consolidated subsidiaries are as follows:
• Accounting Standard for Revenue Recognition (ASBJ Statement
No. 29; March 30, 2018)
• Implementation Guidance on Accounting Standard for Revenue
Recognition (ASBJ Guidance No. 30; March 30, 2018)
(a) Overview
In May 2014, the International Accounting Standards Board (IASB)
and the Financial Accounting Standards Board (FASB) jointly issued
Revenue from Contracts with Customers (IASB’s IFRS 15 and
FASB’s Topic 606), a jointly developed global revenue recognition
standard. IFRS 15 is applicable for periods commencing on or after
January 1, 2018 and Topic 606 is applicable for periods
commencing after December 15, 2017. In light of these
developments, the Accounting Standards Board of Japan (ASBJ)
developed and issued the Accounting Standard for Revenue
Recognition together with the Implementation Guidance on
Accounting Standard for Revenue Recognition.
In developing the Accounting Standard for Revenue Recognition,
the ASBJ’s policy was to incorporate and build on all the core
principles of IFRS 15 from the viewpoint of increasing financial
statements comparability, which is one of the benefits of alignment
with IFRS 15, but to consider additional alternative treatments where
they would make application in Japan easier, to the extent that this
would not impair international comparability.
(b) Planned date of application
The standard and related guidance will be applied from the
beginning of the year ending March 31, 2022.
(c) Impact of applying the accounting standard and related
guidance
The financial impact of applying the accounting standard and related
guidance is under review.
(2) Accounting standards revised before March 31, 2018 but have not yet been applied among overseas consolidated subsidiaries are as follows:
• Revenue from contracts with customers (IASB, IFRS 15)
(a) Overview
This revised standard provides a single and comprehensive model
on revenue recognition to be applied to all contracts with customers.
(b) Planned date of application
This revised standard will be applied from the fiscal year beginning
on or after April 1, 2018.
13DAIFUKU REPORT 2018

(c) Impact of applying the revised accounting standard
The financial impact of applying the revised accounting standard is
under review.
• Revenue from contracts with customers (FASB, ASU 2014-09 and
other)
(a) Overview
This revised standard provides a single and comprehensive model
on revenue recognition to be applied to all contracts with customers.
(b) Planned date of application
This revised standard will be applied from the fiscal year beginning
on or after April 1, 2019.
(c) Impact of applying the revised accounting standard
The financial impact of applying the revised accounting standard is
under review.
5. Additional information
Board Benefit Trust (BBT)The Company has introduced the BBT system for its directors and
corporate officers (hereinafter “Directors, etc.”).
The system further clarifies the linkage of the remuneration for
Directors, etc. with the Company’s business performance as well as
its stock value, which enables Directors, etc. to share not only the
benefit of increase in stock value but also the risk of decrease in
stock value with shareholders. It is expected to motivate Directors,
etc. to contribute to improving the Company’s business performance
in the medium and long terms and boosting corporate value.
1) Outline of the transaction
The system is a stock compensation plan linked directly to the
Company’s business performance, under which the Company’s
shares are acquired through the trust using the funds that the
Company contributes (hereinafter “the Trust”) and remuneration is
provided to the Directors, etc. through the Trust, in accordance with
the stock compensation regulation for officers stipulated by the
Company. The remuneration is the Company’s shares (equivalent to
points accrued based on titles and target achievement) and the
monetary payment (equivalent to the amount obtained by converting
the Company’s shares at a market price as of the retirement date).
The Company’s shares to be acquired by the Trust this time are
treasury shares held by the Company that are allotted through
private placement. As a general rule, the shares are provided to the
Directors, etc. upon retirement.
The Company follows the Practical Solution on Transactions of
Delivering the Company’s Own Stock to Employees, etc. through
Trusts (ASBJ PITF No. 30, March 26, 2015) with respect to
accounting for the trust agreement.
2) The Company’s shares still held by the Trust
The Company records the shares of the Company, which are held by
the Trust, as treasury stock in net assets, at its carrying amounts
(excluding incidental expenses) in the Trust. The carrying amount
and the number of the treasury stock were ¥175 million and 87
thousand shares, respectively, as of March 31, 2018.
6. Accumulated depreciation of property, plant and equipmentAccumulated depreciation of property, plant and equipment was ¥53,149 million and ¥52,300 million as of March 31, 2018 and 2017,
respectively.
7. Inventories related to construction contracts with probable loss and provision for losses on construction contracts
Inventories related to construction contracts with probable loss and
provision for losses on construction contracts are both presented
without being offset.
The amount of inventories related to construction contracts with
probable loss, for which provision for losses on construction
contracts is provided, totaled ¥33 million and ¥43 million as of
March 31, 2018 and 2017, respectively.
Notes to the Consolidated Financial Statements
14
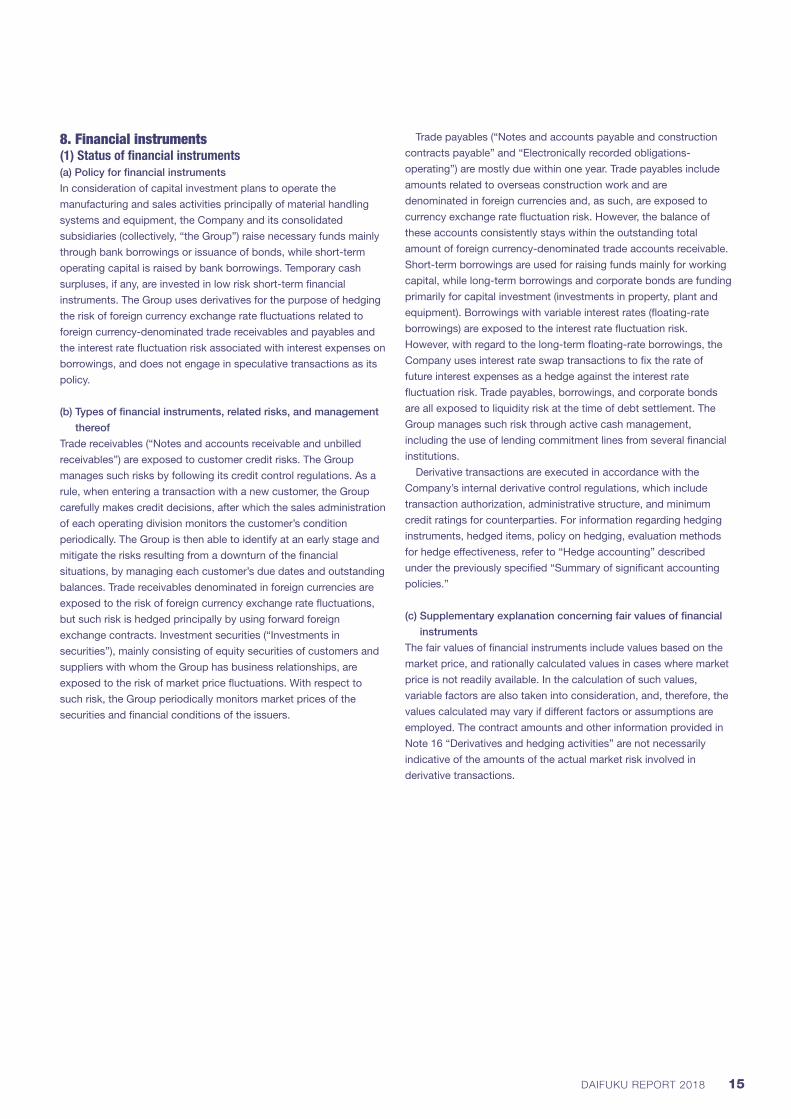
8. Financial instruments(1) Status of financial instruments(a) Policy for financial instruments
In consideration of capital investment plans to operate the
manufacturing and sales activities principally of material handling
systems and equipment, the Company and its consolidated
subsidiaries (collectively, “the Group”) raise necessary funds mainly
through bank borrowings or issuance of bonds, while short-term
operating capital is raised by bank borrowings. Temporary cash
surpluses, if any, are invested in low risk short-term financial
instruments. The Group uses derivatives for the purpose of hedging
the risk of foreign currency exchange rate fluctuations related to
foreign currency-denominated trade receivables and payables and
the interest rate fluctuation risk associated with interest expenses on
borrowings, and does not engage in speculative transactions as its
policy.
(b) Types of financial instruments, related risks, and management
thereof
Trade receivables (“Notes and accounts receivable and unbilled
receivables”) are exposed to customer credit risks. The Group
manages such risks by following its credit control regulations. As a
rule, when entering a transaction with a new customer, the Group
carefully makes credit decisions, after which the sales administration
of each operating division monitors the customer’s condition
periodically. The Group is then able to identify at an early stage and
mitigate the risks resulting from a downturn of the financial
situations, by managing each customer’s due dates and outstanding
balances. Trade receivables denominated in foreign currencies are
exposed to the risk of foreign currency exchange rate fluctuations,
but such risk is hedged principally by using forward foreign
exchange contracts. Investment securities (“Investments in
securities”), mainly consisting of equity securities of customers and
suppliers with whom the Group has business relationships, are
exposed to the risk of market price fluctuations. With respect to
such risk, the Group periodically monitors market prices of the
securities and financial conditions of the issuers.
Trade payables (“Notes and accounts payable and construction
contracts payable” and “Electronically recorded obligations-
operating”) are mostly due within one year. Trade payables include
amounts related to overseas construction work and are
denominated in foreign currencies and, as such, are exposed to
currency exchange rate fluctuation risk. However, the balance of
these accounts consistently stays within the outstanding total
amount of foreign currency-denominated trade accounts receivable.
Short-term borrowings are used for raising funds mainly for working
capital, while long-term borrowings and corporate bonds are funding
primarily for capital investment (investments in property, plant and
equipment). Borrowings with variable interest rates (floating-rate
borrowings) are exposed to the interest rate fluctuation risk.
However, with regard to the long-term floating-rate borrowings, the
Company uses interest rate swap transactions to fix the rate of
future interest expenses as a hedge against the interest rate
fluctuation risk. Trade payables, borrowings, and corporate bonds
are all exposed to liquidity risk at the time of debt settlement. The
Group manages such risk through active cash management,
including the use of lending commitment lines from several financial
institutions.
Derivative transactions are executed in accordance with the
Company’s internal derivative control regulations, which include
transaction authorization, administrative structure, and minimum
credit ratings for counterparties. For information regarding hedging
instruments, hedged items, policy on hedging, evaluation methods
for hedge effectiveness, refer to “Hedge accounting” described
under the previously specified “Summary of significant accounting
policies.”
(c) Supplementary explanation concerning fair values of financial
instruments
The fair values of financial instruments include values based on the
market price, and rationally calculated values in cases where market
price is not readily available. In the calculation of such values,
variable factors are also taken into consideration, and, therefore, the
values calculated may vary if different factors or assumptions are
employed. The contract amounts and other information provided in
Note 16 “Derivatives and hedging activities” are not necessarily
indicative of the amounts of the actual market risk involved in
derivative transactions.
15DAIFUKU REPORT 2018
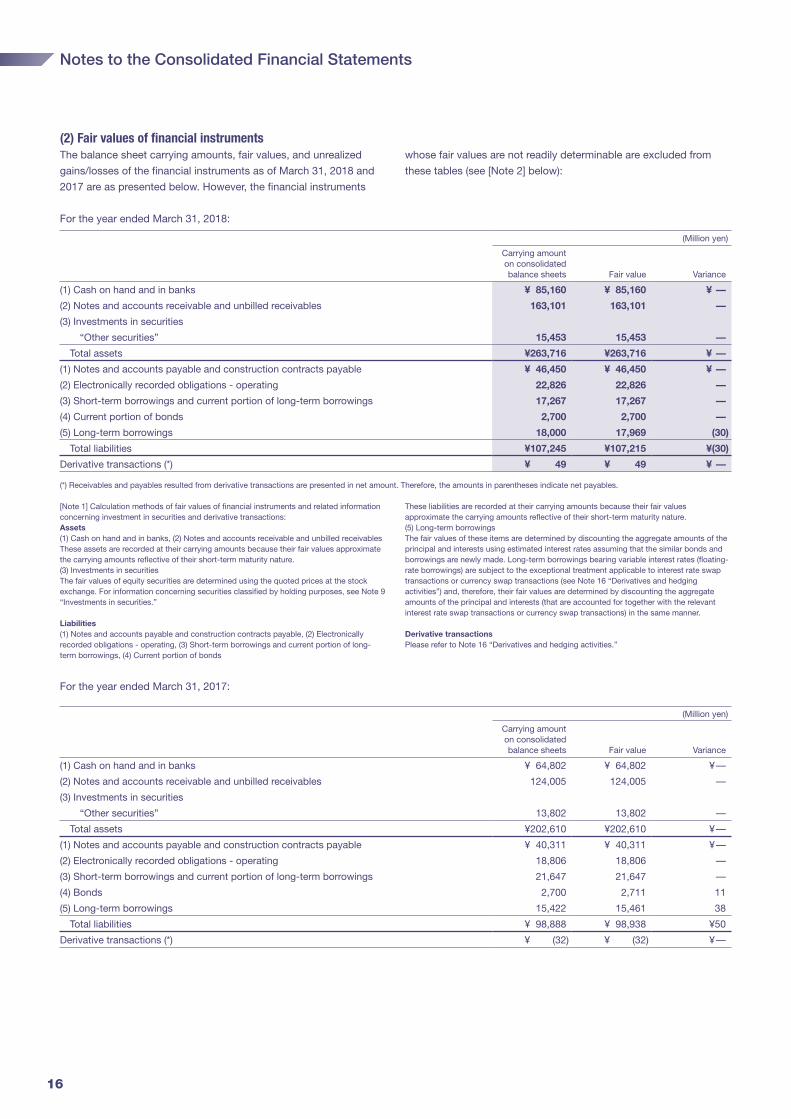
(2) Fair values of financial instrumentsThe balance sheet carrying amounts, fair values, and unrealized
gains/losses of the financial instruments as of March 31, 2018 and
2017 are as presented below. However, the financial instruments
whose fair values are not readily determinable are excluded from
these tables (see [Note 2] below):
For the year ended March 31, 2018:
(Million yen)
Carrying amount on consolidated balance sheets Fair value Variance
(1) Cash on hand and in banks ¥ 85,160 ¥ 85,160 ¥ —
(2) Notes and accounts receivable and unbilled receivables 163,101 163,101 —
(3) Investments in securities
“Other securities” 15,453 15,453 —
Total assets ¥263,716 ¥263,716 ¥ —
(1) Notes and accounts payable and construction contracts payable ¥ 46,450 ¥ 46,450 ¥ —
(2) Electronically recorded obligations - operating 22,826 22,826 —
(3) Short-term borrowings and current portion of long-term borrowings 17,267 17,267 —
(4) Current portion of bonds 2,700 2,700 —
(5) Long-term borrowings 18,000 17,969 (30)
Total liabilities ¥107,245 ¥107,215 ¥(30)
Derivative transactions (*) ¥ 49 ¥ 49 ¥ —
(*) Receivables and payables resulted from derivative transactions are presented in net amount. Therefore, the amounts in parentheses indicate net payables.
[Note 1] Calculation methods of fair values of financial instruments and related information concerning investment in securities and derivative transactions:Assets(1) Cash on hand and in banks, (2) Notes and accounts receivable and unbilled receivablesThese assets are recorded at their carrying amounts because their fair values approximate the carrying amounts reflective of their short-term maturity nature.(3) Investments in securitiesThe fair values of equity securities are determined using the quoted prices at the stock exchange. For information concerning securities classified by holding purposes, see Note 9 “Investments in securities.”
Liabilities(1) Notes and accounts payable and construction contracts payable, (2) Electronically recorded obligations - operating, (3) Short-term borrowings and current portion of long-term borrowings, (4) Current portion of bonds
These liabilities are recorded at their carrying amounts because their fair values approximate the carrying amounts reflective of their short-term maturity nature.(5) Long-term borrowingsThe fair values of these items are determined by discounting the aggregate amounts of the principal and interests using estimated interest rates assuming that the similar bonds and borrowings are newly made. Long-term borrowings bearing variable interest rates (floating- rate borrowings) are subject to the exceptional treatment applicable to interest rate swap transactions or currency swap transactions (see Note 16 “Derivatives and hedging activities”) and, therefore, their fair values are determined by discounting the aggregate amounts of the principal and interests (that are accounted for together with the relevant interest rate swap transactions or currency swap transactions) in the same manner.
Derivative transactionsPlease refer to Note 16 “Derivatives and hedging activities.”
For the year ended March 31, 2017:
(Million yen)
Carrying amount on consolidated balance sheets Fair value Variance
(1) Cash on hand and in banks ¥ 64,802 ¥ 64,802 ¥—
(2) Notes and accounts receivable and unbilled receivables 124,005 124,005 —
(3) Investments in securities
“Other securities” 13,802 13,802 —
Total assets ¥202,610 ¥202,610 ¥—
(1) Notes and accounts payable and construction contracts payable ¥ 40,311 ¥ 40,311 ¥—
(2) Electronically recorded obligations - operating 18,806 18,806 —
(3) Short-term borrowings and current portion of long-term borrowings 21,647 21,647 —
(4) Bonds 2,700 2,711 11
(5) Long-term borrowings 15,422 15,461 38
Total liabilities ¥ 98,888 ¥ 98,938 ¥50
Derivative transactions (*) ¥ (32) ¥ (32) ¥—
Notes to the Consolidated Financial Statements
16
(*) Receivables and payables resulted from derivative transactions are presented in net amount. Therefore, the amounts in parentheses indicate net payables.
[Note 1] Calculation methods of fair values of financial instruments and related information concerning investment in securities and derivative transactions:Assets(1) Cash on hand and in banks, (2) Notes and accounts receivable and unbilled receivablesThese assets are recorded at their carrying amounts because their fair values approximate the carrying amounts reflective of their short-term maturity nature.(3) Investments in securitiesThe fair values of equity securities are determined using the quoted prices at the stock exchange. For information concerning securities classified by holding purposes, see Note 9 “Investments in securities.”
Liabilities(1) Notes and accounts payable and construction contracts payable, (2) Electronically recorded obligations - operating, (3) Short-term borrowings and current portion of long-term borrowingsThese liabilities are recorded at their carrying amounts because their fair values approximate the carrying amounts reflective of their short-term maturity nature.(4) Bonds, (5) Long-term borrowingsThe fair values of these items are determined by discounting the aggregate amounts of the principal and interests using estimated interest rates assuming that the similar bonds and borrowings are newly made. Long-term borrowings bearing variable interest rates (floating- rate borrowings) are subject to the exceptional treatment applicable to interest rate swap transactions or currency swap transactions (see Note 16 “Derivatives and hedging activities”) and, therefore, their fair values are determined by discounting the aggregate amounts of the principal and interests (that are accounted for together with the relevant interest rate swap transactions or currency swap transactions) in the same manner.
Derivative transactionsPlease refer to Note 16 “Derivatives and hedging activities.”
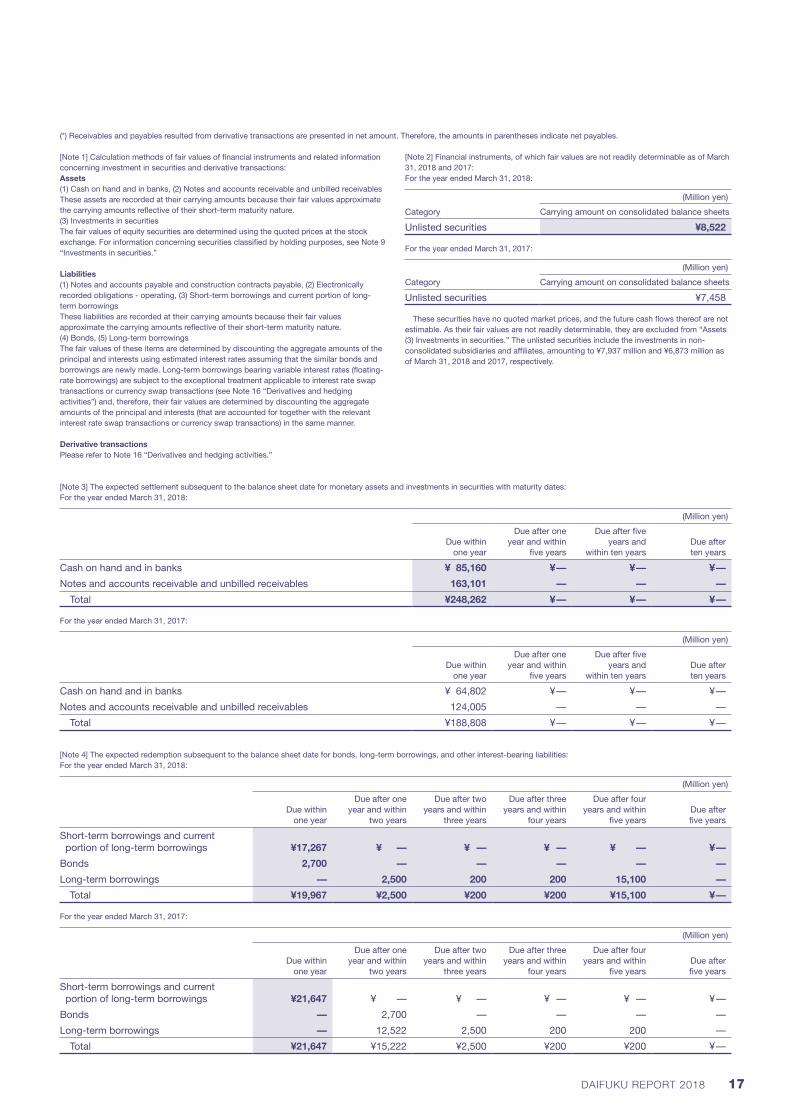
[Note 2] Financial instruments, of which fair values are not readily determinable as of March 31, 2018 and 2017:For the year ended March 31, 2018:
(Million yen)
Category Carrying amount on consolidated balance sheets
Unlisted securities ¥8,522
For the year ended March 31, 2017:
(Million yen)
Category Carrying amount on consolidated balance sheets
Unlisted securities ¥7,458
These securities have no quoted market prices, and the future cash flows thereof are not estimable. As their fair values are not readily determinable, they are excluded from “Assets (3) Investments in securities.” The unlisted securities include the investments in non-consolidated subsidiaries and affiliates, amounting to ¥7,937 million and ¥6,873 million as of March 31, 2018 and 2017, respectively.
[Note 3] The expected settlement subsequent to the balance sheet date for monetary assets and investments in securities with maturity dates:For the year ended March 31, 2018:
(Million yen)
Due within one year
Due after one year and within
five years
Due after five years and
within ten yearsDue after ten years
Cash on hand and in banks ¥ 85,160 ¥— ¥— ¥—
Notes and accounts receivable and unbilled receivables 163,101 — — —
Total ¥248,262 ¥— ¥— ¥—
For the year ended March 31, 2017:
(Million yen)
Due within one year
Due after one year and within
five years
Due after five years and
within ten yearsDue after ten years
Cash on hand and in banks ¥ 64,802 ¥— ¥— ¥—
Notes and accounts receivable and unbilled receivables 124,005 — — —
Total ¥188,808 ¥— ¥— ¥—
[Note 4] The expected redemption subsequent to the balance sheet date for bonds, long-term borrowings, and other interest-bearing liabilities:For the year ended March 31, 2018:
(Million yen)
Due within one year
Due after one year and within
two years
Due after two years and within
three years
Due after three years and within
four years
Due after four years and within
five yearsDue after five years
Short-term borrowings and current portion of long-term borrowings ¥17,267 ¥ — ¥ — ¥ — ¥ — ¥—
Bonds 2,700 — — — — —
Long-term borrowings — 2,500 200 200 15,100 —
Total ¥19,967 ¥2,500 ¥200 ¥200 ¥15,100 ¥—
For the year ended March 31, 2017:
(Million yen)
Due within one year
Due after one year and within
two years
Due after two years and within
three years
Due after three years and within
four years
Due after four years and within
five yearsDue after five years
Short-term borrowings and current portion of long-term borrowings ¥21,647 ¥ — ¥ — ¥ — ¥ — ¥—
Bonds — 2,700 — — — —
Long-term borrowings — 12,522 2,500 200 200 —
Total ¥21,647 ¥15,222 ¥2,500 ¥200 ¥200 ¥—
17DAIFUKU REPORT 2018
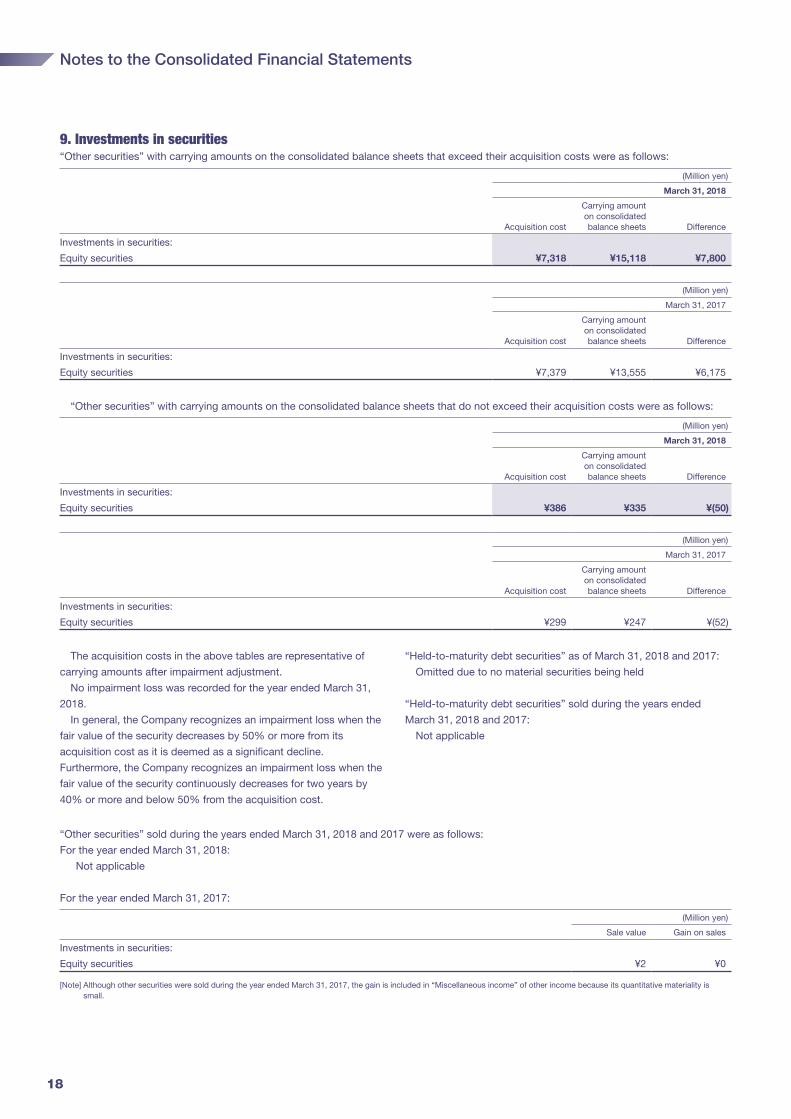
9. Investments in securities“Other securities” with carrying amounts on the consolidated balance sheets that exceed their acquisition costs were as follows:
(Million yen)
March 31, 2018
Acquisition cost
Carrying amount on consolidated balance sheets Difference
Investments in securities:
Equity securities ¥7,318 ¥15,118 ¥7,800
(Million yen)
March 31, 2017
Acquisition cost
Carrying amount on consolidated balance sheets Difference
Investments in securities:
Equity securities ¥7,379 ¥13,555 ¥6,175
“Other securities” with carrying amounts on the consolidated balance sheets that do not exceed their acquisition costs were as follows:
(Million yen)
March 31, 2018
Acquisition cost
Carrying amount on consolidated balance sheets Difference
Investments in securities:
Equity securities ¥386 ¥335 ¥(50)
(Million yen)
March 31, 2017
Acquisition cost
Carrying amount on consolidated balance sheets Difference
Investments in securities:
Equity securities ¥299 ¥247 ¥(52)
The acquisition costs in the above tables are representative of
carrying amounts after impairment adjustment.
No impairment loss was recorded for the year ended March 31,
2018.
In general, the Company recognizes an impairment loss when the
fair value of the security decreases by 50% or more from its
acquisition cost as it is deemed as a significant decline.
Furthermore, the Company recognizes an impairment loss when the
fair value of the security continuously decreases for two years by
40% or more and below 50% from the acquisition cost.
“Held-to-maturity debt securities” as of March 31, 2018 and 2017:
Omitted due to no material securities being held
“Held-to-maturity debt securities” sold during the years ended
March 31, 2018 and 2017:
Not applicable
“Other securities” sold during the years ended March 31, 2018 and 2017 were as follows:
For the year ended March 31, 2018:
Not applicable
For the year ended March 31, 2017:
(Million yen)
Sale value Gain on sales
Investments in securities:
Equity securities ¥2 ¥0
[Note] Although other securities were sold during the year ended March 31, 2017, the gain is included in “Miscellaneous income” of other income because its quantitative materiality is small.
Notes to the Consolidated Financial Statements
18

10. Investments in non-consolidated subsidiaries and affiliatesInvestments in non-consolidated subsidiaries and affiliates that are included in “Investments in securities” were as follows:
(Million yen)
March 31 2018 2017
Investments in securities:
Equity securities ¥7,937 ¥6,873
11. Short-term borrowings, long-term borrowings, bonds, and lease obligationsShort-term borrowings are principally bank borrowings.
The weighted average interest rate applicable to the short-term borrowings outstanding as of March 31, 2018 was 2.1%.
Short-term borrowings outstanding as of March 31, 2018 and 2017 were as follows:
(Million yen)
March 31 2018 2017
Borrowings from banks:
Unsecured ¥4,743 ¥6,042
Long-term borrowings are principally bank borrowings.
The weighted average interest rate applicable to the portion due within one year of long-term borrowings outstanding as of March 31, 2018
was 0.8%. The weighted average interest rate applicable to the long-term borrowings outstanding as of March 31, 2018 was 0.4%.
Long-term borrowings and bonds outstanding as of March 31, 2018 and 2017 were as follows:
(Million yen)
March 31 2018 2017
Borrowings, principally from banks:
Secured and unsecured ¥30,523 ¥31,028
Less: portion due within one year 12,523 15,605
Subtotal 18,000 15,422
Bonds
0.50% yen unsecured bonds, due 2019 700 700
0.73% yen unsecured bonds, due 2019 2,000 2,000
Subtotal 2,700 2,700
Total ¥20,700 ¥18,122
The 0.50% unsecured bonds in the principal amount of ¥700
million, due 2019, issued on March 25, 2014 were issued in Japan at
their face value.
The 0.73% unsecured bonds in the principal amount of ¥2,000
million, due 2019, issued on March 25, 2014 were issued in Japan at
their face value.
Borrowings details
The analysis of long-term borrowings with maturity within five years after March 31, 2018, other than the portion due within one year was as
follows:
(Million yen)
Due after one year and within two years ¥ 2,500
Due after two years and within three years 200
Due after three years and within four years 200
Due after four years and within five years 15,100
Total ¥18,000
19DAIFUKU REPORT 2018
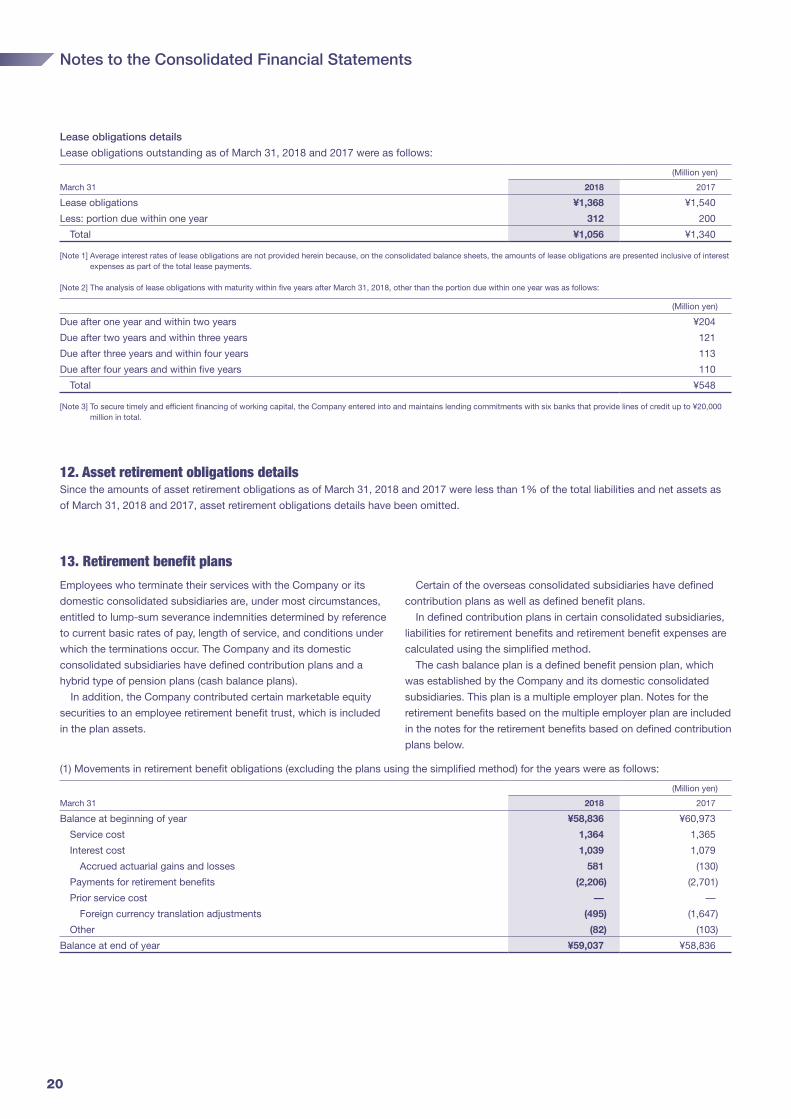
Lease obligations details
Lease obligations outstanding as of March 31, 2018 and 2017 were as follows:
(Million yen)
March 31 2018 2017
Lease obligations ¥1,368 ¥1,540
Less: portion due within one year 312 200
Total ¥1,056 ¥1,340
[Note 1] Average interest rates of lease obligations are not provided herein because, on the consolidated balance sheets, the amounts of lease obligations are presented inclusive of interest expenses as part of the total lease payments.
[Note 2] The analysis of lease obligations with maturity within five years after March 31, 2018, other than the portion due within one year was as follows:
(Million yen)
Due after one year and within two years ¥204
Due after two years and within three years 121
Due after three years and within four years 113
Due after four years and within five years 110
Total ¥548
[Note 3] To secure timely and efficient financing of working capital, the Company entered into and maintains lending commitments with six banks that provide lines of credit up to ¥20,000 million in total.
12. Asset retirement obligations detailsSince the amounts of asset retirement obligations as of March 31, 2018 and 2017 were less than 1% of the total liabilities and net assets as
of March 31, 2018 and 2017, asset retirement obligations details have been omitted.
13. Retirement benefit plans
Employees who terminate their services with the Company or its
domestic consolidated subsidiaries are, under most circumstances,
entitled to lump-sum severance indemnities determined by reference
to current basic rates of pay, length of service, and conditions under
which the terminations occur. The Company and its domestic
consolidated subsidiaries have defined contribution plans and a
hybrid type of pension plans (cash balance plans).
In addition, the Company contributed certain marketable equity
securities to an employee retirement benefit trust, which is included
in the plan assets.
Certain of the overseas consolidated subsidiaries have defined
contribution plans as well as defined benefit plans.
In defined contribution plans in certain consolidated subsidiaries,
liabilities for retirement benefits and retirement benefit expenses are
calculated using the simplified method.
The cash balance plan is a defined benefit pension plan, which
was established by the Company and its domestic consolidated
subsidiaries. This plan is a multiple employer plan. Notes for the
retirement benefits based on the multiple employer plan are included
in the notes for the retirement benefits based on defined contribution
plans below.
(1) Movements in retirement benefit obligations (excluding the plans using the simplified method) for the years were as follows:
(Million yen)
March 31 2018 2017
Balance at beginning of year ¥58,836 ¥60,973
Service cost 1,364 1,365
Interest cost 1,039 1,079
Accrued actuarial gains and losses 581 (130)
Payments for retirement benefits (2,206) (2,701)
Prior service cost — —
Foreign currency translation adjustments (495) (1,647)
Other (82) (103)
Balance at end of year ¥59,037 ¥58,836
Notes to the Consolidated Financial Statements
20
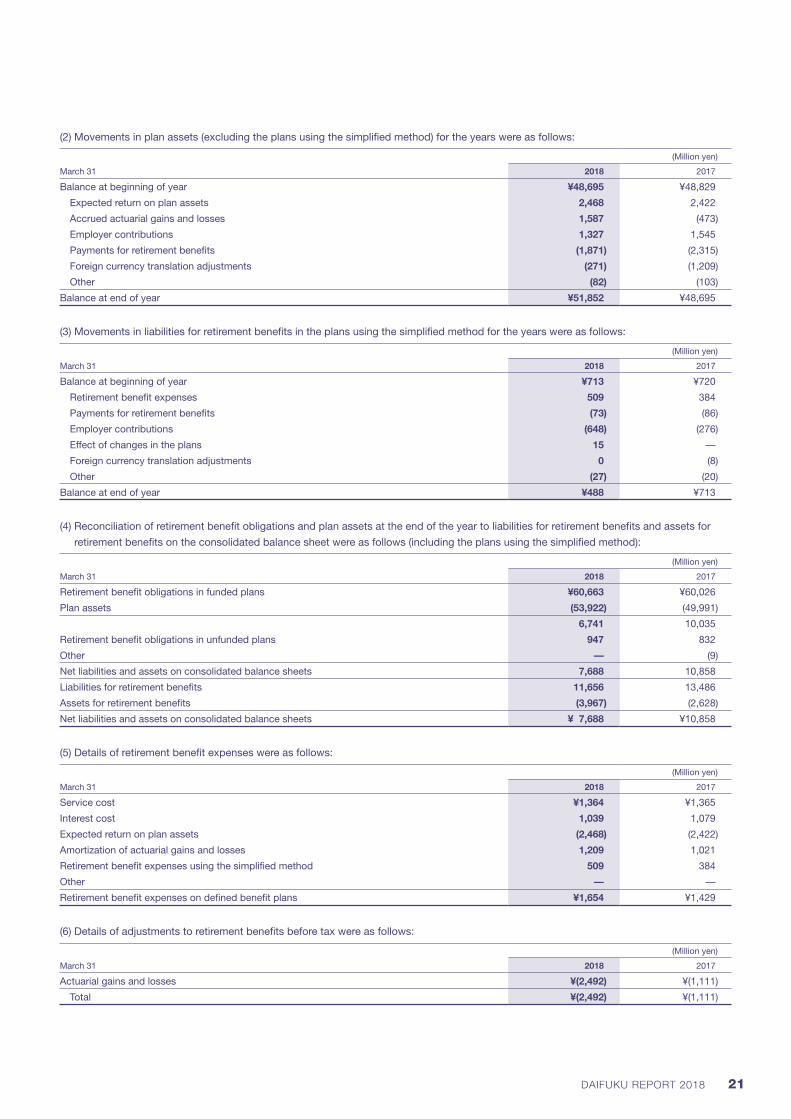
(2) Movements in plan assets (excluding the plans using the simplified method) for the years were as follows:
(Million yen)
March 31 2018 2017
Balance at beginning of year ¥48,695 ¥48,829
Expected return on plan assets 2,468 2,422
Accrued actuarial gains and losses 1,587 (473)
Employer contributions 1,327 1,545
Payments for retirement benefits (1,871) (2,315)
Foreign currency translation adjustments (271) (1,209)
Other (82) (103)
Balance at end of year ¥51,852 ¥48,695
(3) Movements in liabilities for retirement benefits in the plans using the simplified method for the years were as follows:
(Million yen)
March 31 2018 2017
Balance at beginning of year ¥713 ¥720
Retirement benefit expenses 509 384
Payments for retirement benefits (73) (86)
Employer contributions (648) (276)
Effect of changes in the plans 15 —
Foreign currency translation adjustments 0 (8)
Other (27) (20)
Balance at end of year ¥488 ¥713
(4) Reconciliation of retirement benefit obligations and plan assets at the end of the year to liabilities for retirement benefits and assets for
retirement benefits on the consolidated balance sheet were as follows (including the plans using the simplified method):
(Million yen)
March 31 2018 2017
Retirement benefit obligations in funded plans ¥60,663 ¥60,026
Plan assets (53,922) (49,991)
6,741 10,035
Retirement benefit obligations in unfunded plans 947 832
Other — (9)
Net liabilities and assets on consolidated balance sheets 7,688 10,858
Liabilities for retirement benefits 11,656 13,486
Assets for retirement benefits (3,967) (2,628)
Net liabilities and assets on consolidated balance sheets ¥ 7,688 ¥10,858
(5) Details of retirement benefit expenses were as follows:
(Million yen)
March 31 2018 2017
Service cost ¥1,364 ¥1,365
Interest cost 1,039 1,079
Expected return on plan assets (2,468) (2,422)
Amortization of actuarial gains and losses 1,209 1,021
Retirement benefit expenses using the simplified method 509 384
Other — —
Retirement benefit expenses on defined benefit plans ¥1,654 ¥1,429
(6) Details of adjustments to retirement benefits before tax were as follows:
(Million yen)
March 31 2018 2017
Actuarial gains and losses ¥(2,492) ¥(1,111)
Total ¥(2,492) ¥(1,111)
21DAIFUKU REPORT 2018
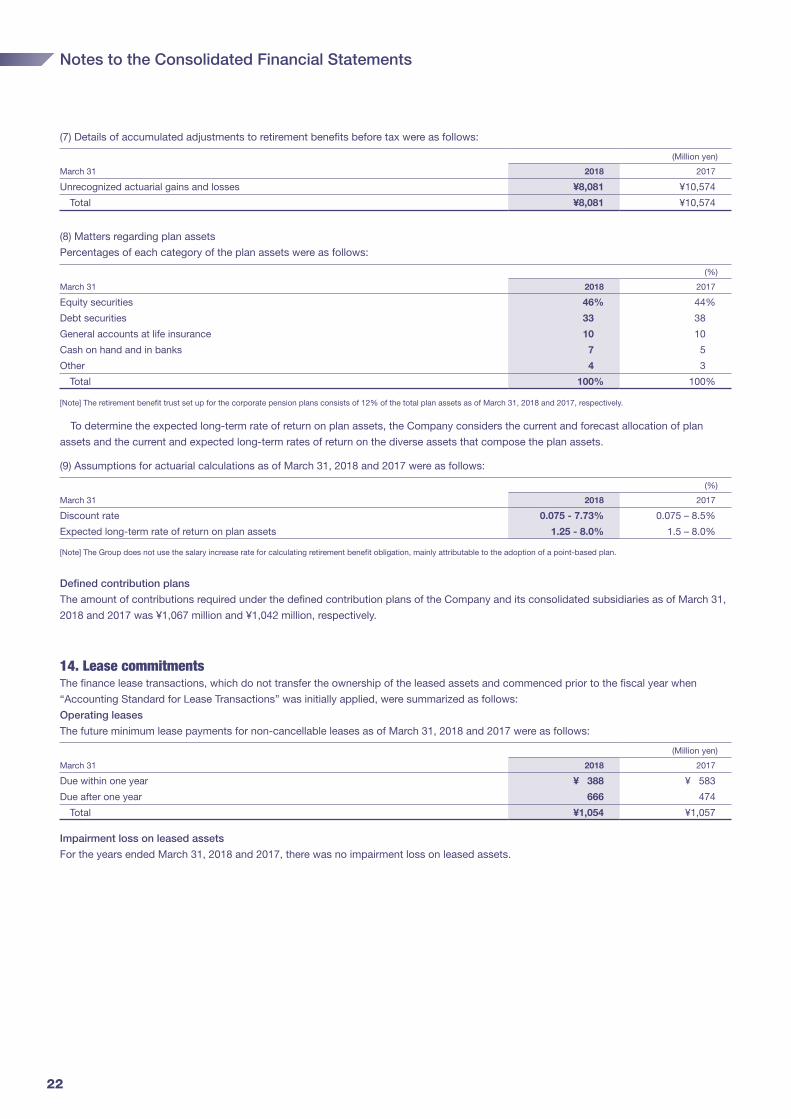
(7) Details of accumulated adjustments to retirement benefits before tax were as follows:
(Million yen)
March 31 2018 2017
Unrecognized actuarial gains and losses ¥8,081 ¥10,574
Total ¥8,081 ¥10,574
(8) Matters regarding plan assets
Percentages of each category of the plan assets were as follows:
(%)
March 31 2018 2017
Equity securities 46% 44%
Debt securities 33 38
General accounts at life insurance 10 10
Cash on hand and in banks 7 5
Other 4 3
Total 100% 100%
[Note] The retirement benefit trust set up for the corporate pension plans consists of 12% of the total plan assets as of March 31, 2018 and 2017, respectively.
To determine the expected long-term rate of return on plan assets, the Company considers the current and forecast allocation of plan
assets and the current and expected long-term rates of return on the diverse assets that compose the plan assets.
(9) Assumptions for actuarial calculations as of March 31, 2018 and 2017 were as follows:
(%)
March 31 2018 2017
Discount rate 0.075 7.73% 0.075 – 8.5%
Expected long-term rate of return on plan assets 1.25 8.0% 1.5 – 8.0%
[Note] The Group does not use the salary increase rate for calculating retirement benefit obligation, mainly attributable to the adoption of a point-based plan.
Defined contribution plans
The amount of contributions required under the defined contribution plans of the Company and its consolidated subsidiaries as of March 31,
2018 and 2017 was ¥1,067 million and ¥1,042 million, respectively.
14. Lease commitmentsThe finance lease transactions, which do not transfer the ownership of the leased assets and commenced prior to the fiscal year when
“Accounting Standard for Lease Transactions” was initially applied, were summarized as follows:
Operating leases
The future minimum lease payments for non-cancellable leases as of March 31, 2018 and 2017 were as follows:
(Million yen)
March 31 2018 2017
Due within one year ¥ 388 ¥ 583
Due after one year 666 474
Total ¥1,054 ¥1,057
Impairment loss on leased assets
For the years ended March 31, 2018 and 2017, there was no impairment loss on leased assets.
Notes to the Consolidated Financial Statements
22
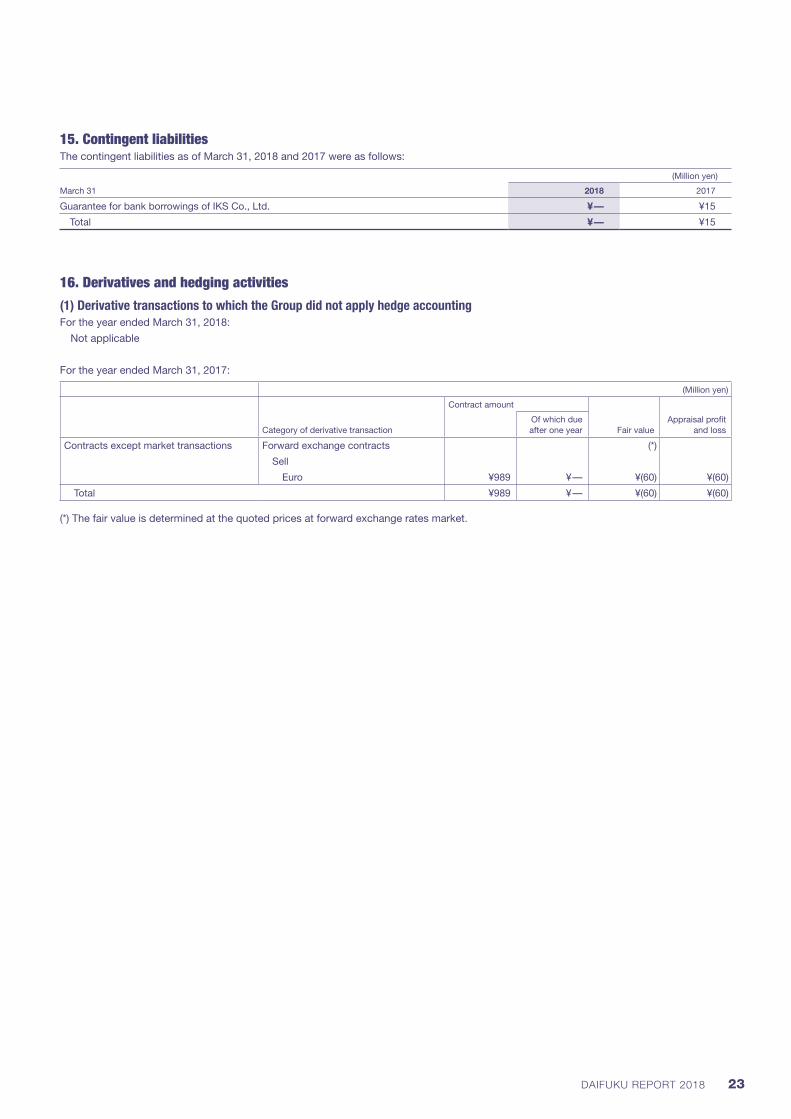
15. Contingent liabilitiesThe contingent liabilities as of March 31, 2018 and 2017 were as follows:
(Million yen)
March 31 2018 2017
Guarantee for bank borrowings of IKS Co., Ltd. ¥— ¥15
Total ¥— ¥15
16. Derivatives and hedging activities
(1) Derivative transactions to which the Group did not apply hedge accountingFor the year ended March 31, 2018:
Not applicable
For the year ended March 31, 2017:
(Million yen)
Category of derivative transaction
Contract amount
Fair valueAppraisal profit
and lossOf which due after one year
Contracts except market transactions Forward exchange contracts (*)
Sell
Euro ¥989 ¥— ¥(60) ¥(60)
Total ¥989 ¥— ¥(60) ¥(60)
(*) The fair value is determined at the quoted prices at forward exchange rates market.
23DAIFUKU REPORT 2018
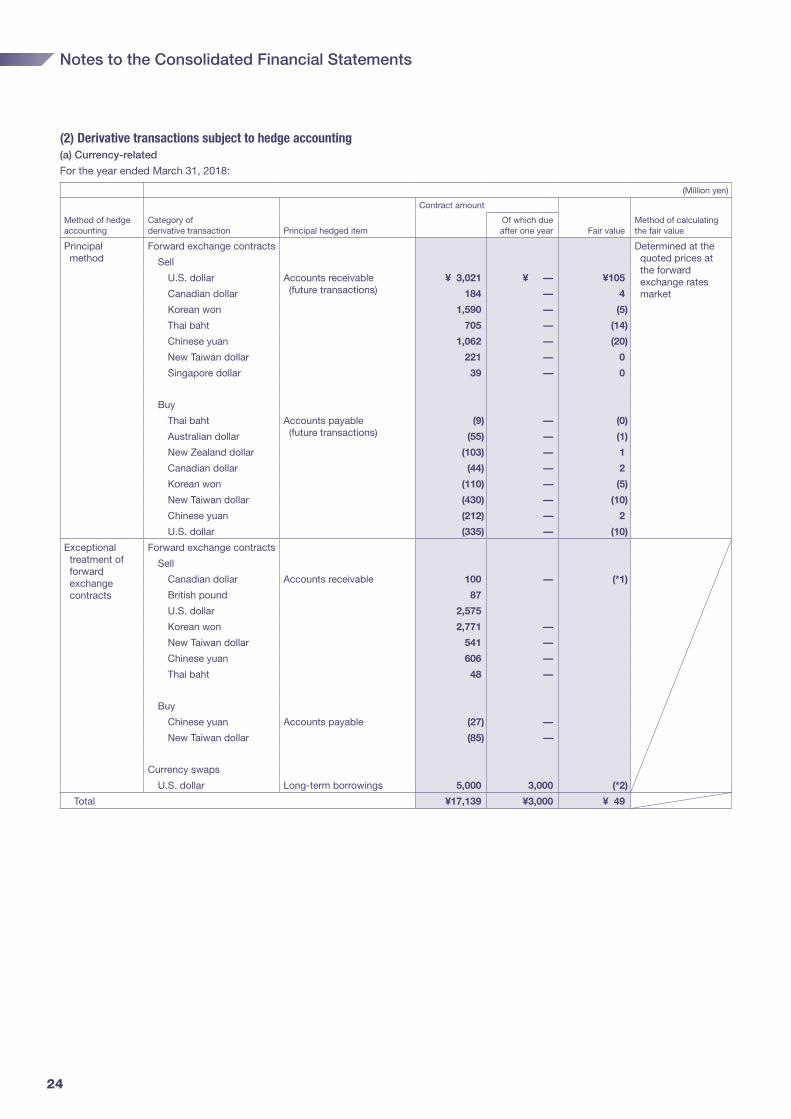
(2) Derivative transactions subject to hedge accounting(a) Currency-related
For the year ended March 31, 2018:
(Million yen)
Method of hedge accounting
Category of derivative transaction Principal hedged item
Contract amount
Fair valueMethod of calculating the fair value
Of which due after one year
Principal method
Forward exchange contracts Determined at the quoted prices at
the forward exchange rates market
Sell
U.S. dollar Accounts receivable (future transactions)
¥ 3,021 ¥ — ¥105
Canadian dollar 184 — 4
Korean won 1,590 — (5)
Thai baht 705 — (14)
Chinese yuan 1,062 — (20)
New Taiwan dollar 221 — 0
Singapore dollar 39 — 0
Buy
Thai baht Accounts payable (future transactions)
(9) — (0)
Australian dollar (55) — (1)
New Zealand dollar (103) — 1
Canadian dollar (44) — 2
Korean won (110) — (5)
New Taiwan dollar (430) — (10)
Chinese yuan (212) — 2
U.S. dollar (335) — (10)
Exceptional treatment of forward exchange contracts
Forward exchange contracts
Sell
Canadian dollar Accounts receivable 100 — (*1)
British pound 87
U.S. dollar 2,575
Korean won 2,771 —
New Taiwan dollar 541 —
Chinese yuan 606 —
Thai baht 48 —
Buy
Chinese yuan Accounts payable (27) —
New Taiwan dollar (85) —
Currency swaps
U.S. dollar Long-term borrowings 5,000 3,000 (*2)
Total ¥17,139 ¥3,000 ¥ 49
Notes to the Consolidated Financial Statements
24
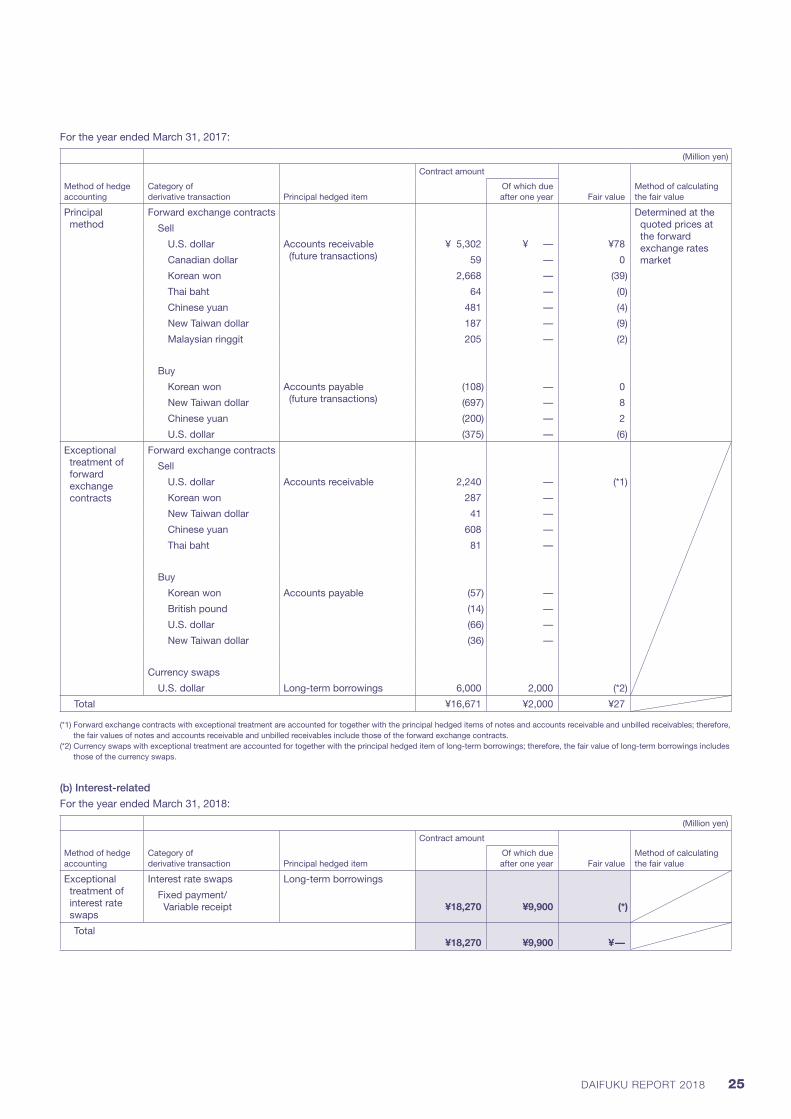
For the year ended March 31, 2017:
(Million yen)
Method of hedge accounting
Category of derivative transaction Principal hedged item
Contract amount
Fair valueMethod of calculating the fair value
Of which due after one year
Principal method
Forward exchange contracts Determined at the quoted prices at
the forward exchange rates market
Sell
U.S. dollar Accounts receivable (future transactions)
¥ 5,302 ¥ — ¥78
Canadian dollar 59 — 0
Korean won 2,668 — (39)
Thai baht 64 — (0)
Chinese yuan 481 — (4)
New Taiwan dollar 187 — (9)
Malaysian ringgit 205 — (2)
Buy
Korean won Accounts payable (future transactions)
(108) — 0
New Taiwan dollar (697) — 8
Chinese yuan (200) — 2
U.S. dollar (375) — (6)
Exceptional treatment of forward exchange contracts
Forward exchange contracts
Sell
U.S. dollar Accounts receivable 2,240 — (*1)
Korean won 287 —
New Taiwan dollar 41 —
Chinese yuan 608 —
Thai baht 81 —
Buy
Korean won Accounts payable (57) —
British pound (14) —
U.S. dollar (66) —
New Taiwan dollar (36) —
Currency swaps
U.S. dollar Long-term borrowings 6,000 2,000 (*2)
Total ¥16,671 ¥2,000 ¥27
(*1) Forward exchange contracts with exceptional treatment are accounted for together with the principal hedged items of notes and accounts receivable and unbilled receivables; therefore, the fair values of notes and accounts receivable and unbilled receivables include those of the forward exchange contracts.
(*2) Currency swaps with exceptional treatment are accounted for together with the principal hedged item of long-term borrowings; therefore, the fair value of long-term borrowings includes those of the currency swaps.
(b) Interest-related
For the year ended March 31, 2018:
(Million yen)
Method of hedge accounting
Category of derivative transaction Principal hedged item
Contract amount
Fair valueMethod of calculating the fair value
Of which due after one year
Exceptional treatment of interest rate swaps
Interest rate swaps Long-term borrowings
Fixed payment/ Variable receipt ¥18,270 ¥9,900 (*)
Total¥18,270 ¥9,900 ¥—
25DAIFUKU REPORT 2018
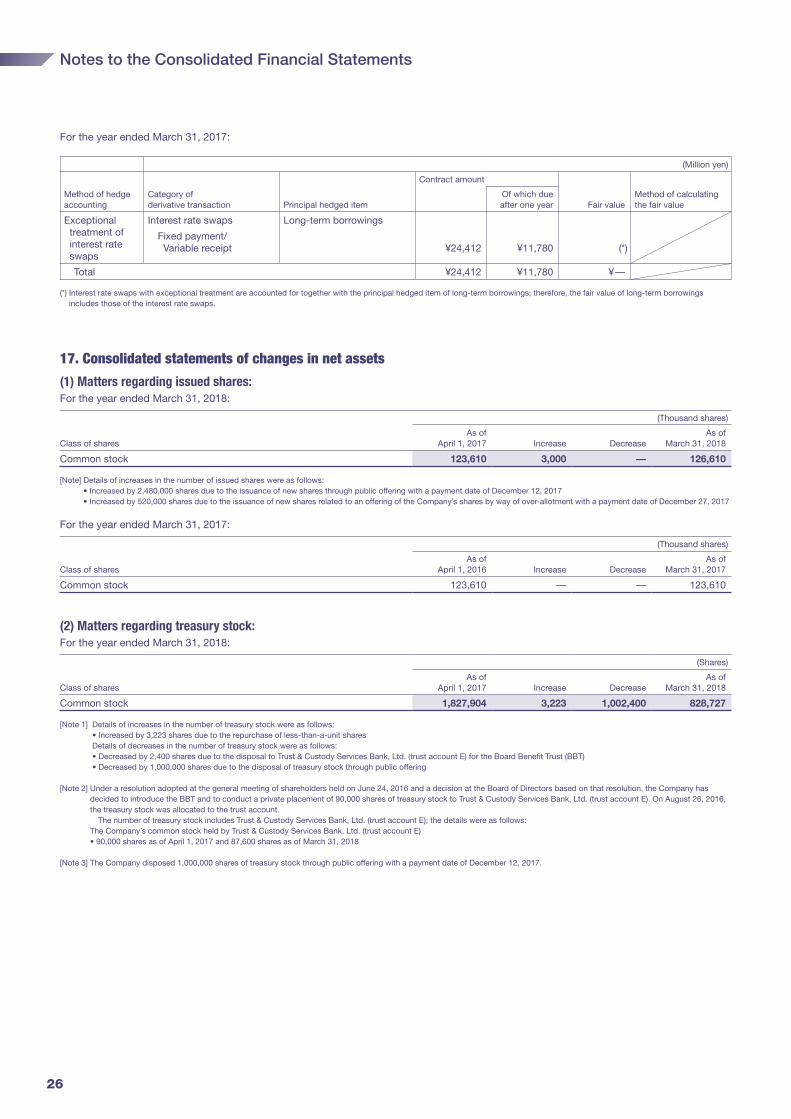
For the year ended March 31, 2017:
(Million yen)
Method of hedge accounting
Category of derivative transaction Principal hedged item
Contract amount
Fair valueMethod of calculating the fair value
Of which due after one year
Exceptional treatment of interest rate swaps
Interest rate swaps Long-term borrowings
Fixed payment/ Variable receipt ¥24,412 ¥11,780 (*)
Total ¥24,412 ¥11,780 ¥—
(*) Interest rate swaps with exceptional treatment are accounted for together with the principal hedged item of long-term borrowings; therefore, the fair value of long-term borrowings includes those of the interest rate swaps.
17. Consolidated statements of changes in net assets
(1) Matters regarding issued shares:For the year ended March 31, 2018:
(Thousand shares)
Class of sharesAs of
April 1, 2017 Increase DecreaseAs of
March 31, 2018
Common stock 123,610 3,000 — 126,610
[Note] Details of increases in the number of issued shares were as follows: • Increased by 2,480,000 shares due to the issuance of new shares through public offering with a payment date of December 12, 2017 • Increased by 520,000 shares due to the issuance of new shares related to an offering of the Company’s shares by way of over-allotment with a payment date of December 27, 2017
For the year ended March 31, 2017:
(Thousand shares)
Class of sharesAs of
April 1, 2016 Increase DecreaseAs of
March 31, 2017
Common stock 123,610 — — 123,610
(2) Matters regarding treasury stock:For the year ended March 31, 2018:
(Shares)
Class of sharesAs of
April 1, 2017 Increase DecreaseAs of
March 31, 2018
Common stock 1,827,904 3,223 1,002,400 828,727
[Note 1] Details of increases in the number of treasury stock were as follows: • Increased by 3,223 shares due to the repurchase of less-than-a-unit shares Details of decreases in the number of treasury stock were as follows: • Decreased by 2,400 shares due to the disposal to Trust & Custody Services Bank, Ltd. (trust account E) for the Board Benefit Trust (BBT) • Decreased by 1,000,000 shares due to the disposal of treasury stock through public offering
[Note 2] Under a resolution adopted at the general meeting of shareholders held on June 24, 2016 and a decision at the Board of Directors based on that resolution, the Company has decided to introduce the BBT and to conduct a private placement of 90,000 shares of treasury stock to Trust & Custody Services Bank, Ltd. (trust account E). On August 26, 2016, the treasury stock was allocated to the trust account. The number of treasury stock includes Trust & Custody Services Bank, Ltd. (trust account E); the details were as follows: The Company’s common stock held by Trust & Custody Services Bank, Ltd. (trust account E) • 90,000 shares as of April 1, 2017 and 87,600 shares as of March 31, 2018
[Note 3] The Company disposed 1,000,000 shares of treasury stock through public offering with a payment date of December 12, 2017.
Notes to the Consolidated Financial Statements
26
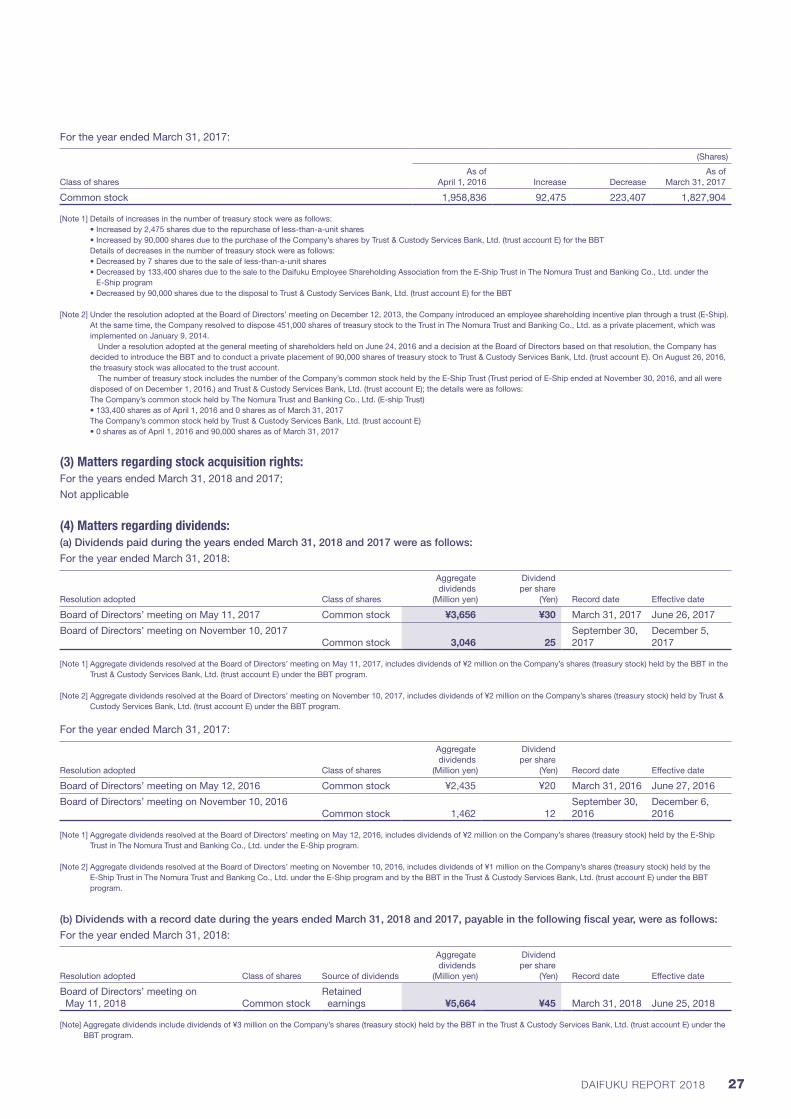
For the year ended March 31, 2017:
(Shares)
Class of sharesAs of
April 1, 2016 Increase DecreaseAs of
March 31, 2017
Common stock 1,958,836 92,475 223,407 1,827,904
[Note 1] Details of increases in the number of treasury stock were as follows: • Increased by 2,475 shares due to the repurchase of less-than-a-unit shares • Increased by 90,000 shares due to the purchase of the Company’s shares by Trust & Custody Services Bank, Ltd. (trust account E) for the BBT Details of decreases in the number of treasury stock were as follows: • Decreased by 7 shares due to the sale of less-than-a-unit shares • Decreased by 133,400 shares due to the sale to the Daifuku Employee Shareholding Association from the E-Ship Trust in The Nomura Trust and Banking Co., Ltd. under the
E-Ship program • Decreased by 90,000 shares due to the disposal to Trust & Custody Services Bank, Ltd. (trust account E) for the BBT
[Note 2] Under the resolution adopted at the Board of Directors’ meeting on December 12, 2013, the Company introduced an employee shareholding incentive plan through a trust (E-Ship). At the same time, the Company resolved to dispose 451,000 shares of treasury stock to the Trust in The Nomura Trust and Banking Co., Ltd. as a private placement, which was implemented on January 9, 2014. Under a resolution adopted at the general meeting of shareholders held on June 24, 2016 and a decision at the Board of Directors based on that resolution, the Company has decided to introduce the BBT and to conduct a private placement of 90,000 shares of treasury stock to Trust & Custody Services Bank, Ltd. (trust account E). On August 26, 2016, the treasury stock was allocated to the trust account. The number of treasury stock includes the number of the Company’s common stock held by the E-Ship Trust (Trust period of E-Ship ended at November 30, 2016, and all were disposed of on December 1, 2016.) and Trust & Custody Services Bank, Ltd. (trust account E); the details were as follows: The Company’s common stock held by The Nomura Trust and Banking Co., Ltd. (E-ship Trust) • 133,400 shares as of April 1, 2016 and 0 shares as of March 31, 2017 The Company’s common stock held by Trust & Custody Services Bank, Ltd. (trust account E) • 0 shares as of April 1, 2016 and 90,000 shares as of March 31, 2017
(3) Matters regarding stock acquisition rights:For the years ended March 31, 2018 and 2017;
Not applicable
(4) Matters regarding dividends:(a) Dividends paid during the years ended March 31, 2018 and 2017 were as follows:
For the year ended March 31, 2018:
Resolution adopted Class of shares
Aggregate dividends
(Million yen)
Dividend per share
(Yen) Record date Effective date
Board of Directors’ meeting on May 11, 2017 Common stock ¥3,656 ¥30 March 31, 2017 June 26, 2017
Board of Directors’ meeting on November 10, 2017Common stock 3,046 25
September 30, 2017
December 5, 2017
[Note 1] Aggregate dividends resolved at the Board of Directors’ meeting on May 11, 2017, includes dividends of ¥2 million on the Company’s shares (treasury stock) held by the BBT in the Trust & Custody Services Bank, Ltd. (trust account E) under the BBT program.
[Note 2] Aggregate dividends resolved at the Board of Directors’ meeting on November 10, 2017, includes dividends of ¥2 million on the Company’s shares (treasury stock) held by Trust & Custody Services Bank, Ltd. (trust account E) under the BBT program.
For the year ended March 31, 2017:
Resolution adopted Class of shares
Aggregate dividends
(Million yen)
Dividend per share
(Yen) Record date Effective date
Board of Directors’ meeting on May 12, 2016 Common stock ¥2,435 ¥20 March 31, 2016 June 27, 2016
Board of Directors’ meeting on November 10, 2016Common stock 1,462 12
September 30, 2016
December 6, 2016
[Note 1] Aggregate dividends resolved at the Board of Directors’ meeting on May 12, 2016, includes dividends of ¥2 million on the Company’s shares (treasury stock) held by the E-Ship Trust in The Nomura Trust and Banking Co., Ltd. under the E-Ship program.
[Note 2] Aggregate dividends resolved at the Board of Directors’ meeting on November 10, 2016, includes dividends of ¥1 million on the Company’s shares (treasury stock) held by the E-Ship Trust in The Nomura Trust and Banking Co., Ltd. under the E-Ship program and by the BBT in the Trust & Custody Services Bank, Ltd. (trust account E) under the BBT program.
(b) Dividends with a record date during the years ended March 31, 2018 and 2017, payable in the following fiscal year, were as follows:
For the year ended March 31, 2018:
Resolution adopted Class of shares Source of dividends
Aggregate dividends
(Million yen)
Dividend per share
(Yen) Record date Effective date
Board of Directors’ meeting on May 11, 2018 Common stock
Retained earnings ¥5,664 ¥45 March 31, 2018 June 25, 2018
[Note] Aggregate dividends include dividends of ¥3 million on the Company’s shares (treasury stock) held by the BBT in the Trust & Custody Services Bank, Ltd. (trust account E) under the BBT program.
27DAIFUKU REPORT 2018

For the year ended March 31, 2017:
Resolution adopted Class of shares Source of dividends
Aggregate dividends
(Million yen)
Dividend per share
(Yen) Record date Effective date
Board of Directors’ meeting on May 11, 2017 Common stock
Retained earnings ¥3,656 ¥30 March 31, 2017 June 26, 2017
[Note] Aggregate dividends include dividends of ¥2 million on the Company’s shares (treasury stock) held by the BBT in the Trust & Custody Services Bank, Ltd. (trust account E) under the BBT program.
18. Major items of selling, general and administrative expensesMajor items of selling, general and administrative expenses for the years ended March 31, 2018 and 2017, were as follows:
Selling expenses
(Million yen)
March 31 2018 2017
Sales commissions ¥1,707 ¥ 915
Advertising 238 236
Outsourcing 823 697
Salaries and bonuses 8,625 8,012
Retirement benefit expenses 339 332
Welfare 1,564 1,494
Travel and transportation 1,553 1,519
Rent 481 481
Depreciation 168 159
General and administrative expenses
(Million yen)
March 31 2018 2017
Outsourcing ¥ 2,567 ¥2,723
Directors’ compensation 1,176 1,013
Salaries and bonuses 10,076 9,440
Retirement benefit expenses 934 796
Welfare 1,792 1,428
Depreciation 1,770 1,837
Research and development 2,626 2,461
19. Provision for losses on construction contracts included in cost of salesFor the years ended March 31, 2018 and 2017 were as follows:
(Million yen)
March 31 2018 2017
Provision for losses on construction contracts included in cost of sales ¥(305) ¥(104)
20. Research and developmentResearch and development expenditures included in general and administrative expenses and manufacturing costs were ¥8,123 million and
¥7,489 million for the years ended March 31, 2018 and 2017, respectively.
Notes to the Consolidated Financial Statements
28
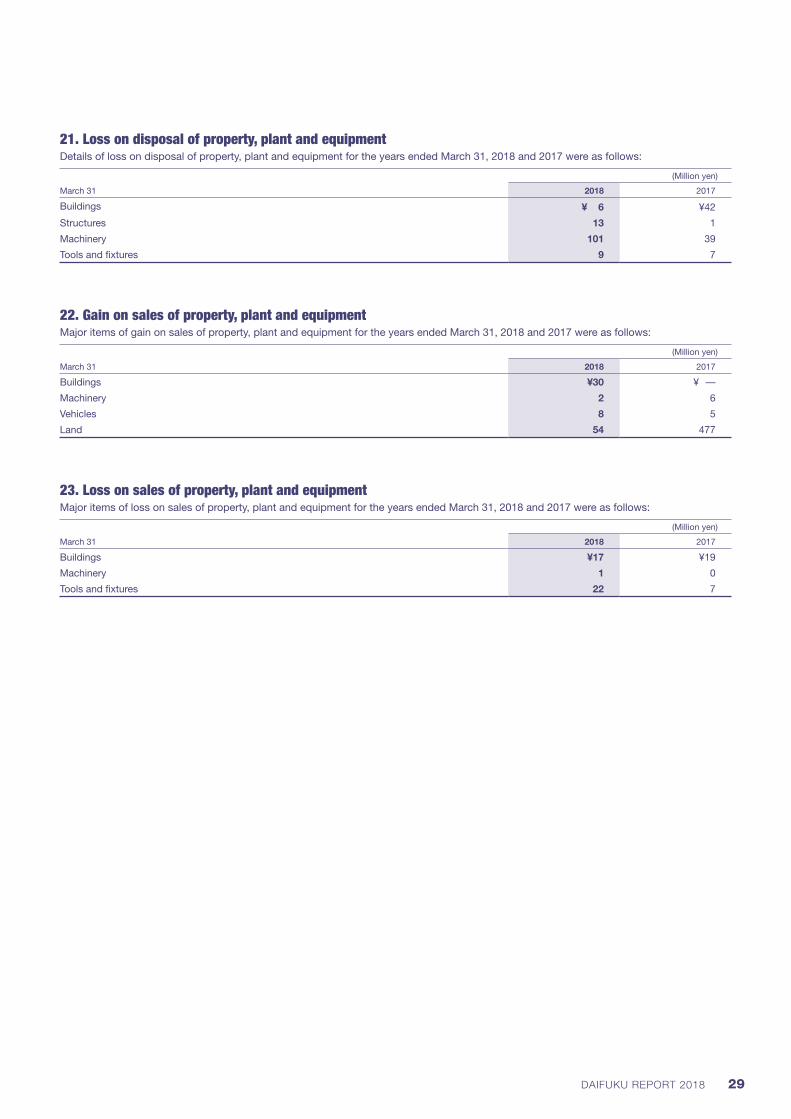
21. Loss on disposal of property, plant and equipmentDetails of loss on disposal of property, plant and equipment for the years ended March 31, 2018 and 2017 were as follows:
(Million yen)
March 31 2018 2017
Buildings ¥ 6 ¥42
Structures 13 1
Machinery 101 39
Tools and fixtures 9 7
22. Gain on sales of property, plant and equipmentMajor items of gain on sales of property, plant and equipment for the years ended March 31, 2018 and 2017 were as follows:
(Million yen)
March 31 2018 2017
Buildings ¥30 ¥ —
Machinery 2 6
Vehicles 8 5
Land 54 477
23. Loss on sales of property, plant and equipmentMajor items of loss on sales of property, plant and equipment for the years ended March 31, 2018 and 2017 were as follows:
(Million yen)
March 31 2018 2017
Buildings ¥17 ¥19
Machinery 1 0
Tools and fixtures 22 7
29DAIFUKU REPORT 2018
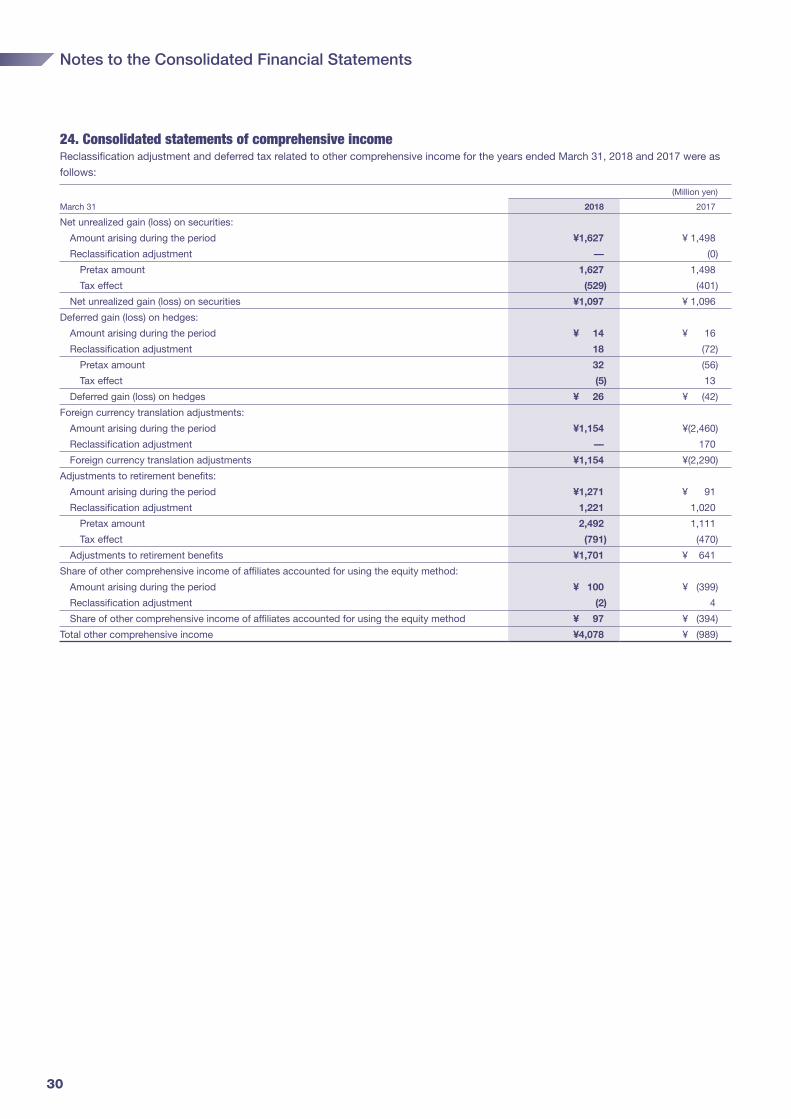
24. Consolidated statements of comprehensive incomeReclassification adjustment and deferred tax related to other comprehensive income for the years ended March 31, 2018 and 2017 were as
follows:
(Million yen)
March 31 2018 2017
Net unrealized gain (loss) on securities:
Amount arising during the period ¥1,627 ¥ 1,498
Reclassification adjustment — (0)
Pretax amount 1,627 1,498
Tax effect (529) (401)
Net unrealized gain (loss) on securities ¥1,097 ¥ 1,096
Deferred gain (loss) on hedges:
Amount arising during the period ¥ 14 ¥ 16
Reclassification adjustment 18 (72)
Pretax amount 32 (56)
Tax effect (5) 13
Deferred gain (loss) on hedges ¥ 26 ¥ (42)
Foreign currency translation adjustments:
Amount arising during the period ¥1,154 ¥(2,460)
Reclassification adjustment — 170
Foreign currency translation adjustments ¥1,154 ¥(2,290)
Adjustments to retirement benefits:
Amount arising during the period ¥1,271 ¥ 91
Reclassification adjustment 1,221 1,020
Pretax amount 2,492 1,111
Tax effect (791) (470)
Adjustments to retirement benefits ¥1,701 ¥ 641
Share of other comprehensive income of affiliates accounted for using the equity method:
Amount arising during the period ¥ 100 ¥ (399)
Reclassification adjustment (2) 4
Share of other comprehensive income of affiliates accounted for using the equity method ¥ 97 ¥ (394)
Total other comprehensive income ¥4,078 ¥ (989)
Notes to the Consolidated Financial Statements
30

25. Income taxes
(1) The significant components of deferred tax assets and liabilities as of March 31, 2018 and 2017 were as follows:(Million yen)
March 31 2018 2017
Deferred tax assets:
Current assets
Research and development ¥ 929 ¥ 590
Accrued expenses 2,312 1,565
Provision for losses on construction contracts 193 187
Unrealized profit on inventories 115 145
Other 1,440 943
Subtotal 4,991 3,432
Less: Valuation allowance — (0)
Offset against deferred tax liabilities (current) (2) (3)
Net deferred tax assets (current) ¥4,988 ¥3,429
Non-current assets
Liabilities for retirement benefits ¥2,941 ¥5,740
Loss carried forward 708 1,514
Unrealized gain on sales of property, plant and equipment 597 597
Loss on valuation of investments in securities 848 970
Excess depreciation 61 232
Other 1,025 469
Subtotal 6,183 9,525
Less: Valuation allowance (1,703) (2,215)
Offset against deferred tax liabilities (non-current) (2,403) (2,444)
Net deferred tax assets (non-current) ¥2,077 ¥4,865
Deferred tax liabilities:
Current liabilities
Other ¥ 22 ¥ 27
Offset against deferred tax assets (current) (2) (3)
Net deferred tax liabilities (current) ¥ 19 ¥ 23
Non-current liabilities
Net unrealized gain on assets of consolidated subsidiaries ¥ 485 ¥ 841
Liabilities for retirement benefits 518 296
Reserve for deferred gains on sales of property, plant and equipment 137 140
Net unrealized gain on securities 2,258 1,729
Other 213 55
Offset against deferred tax assets (non-current) (2,403) (2,444)
Net deferred tax liabilities (non-current) ¥1,210 ¥ 619
(2) Reconciliation of the difference between the statutory income tax rate and the effective income tax rate for the years ended March 31, 2018 and 2017 were as follows:
(%)
March 31 2018 2017
Statutory tax rate 30.8% 30.8%
Permanent difference arising from non-deductible expenses 0.5 0.8
Taxation on per capita basis 0.2 0.4
Increase in valuation allowance 0.2 0.5
Tax rate difference applied to overseas subsidiaries (0.9) 0.2
Amortization of goodwill and negative goodwill 0.6 0.7
Tax effects on retained earnings of overseas subsidiaries (0.8) (0.1)
Tax deduction (3.8) (4.6)
Other 1.7 0.1
Effective tax rate 28.5% 28.8%
31DAIFUKU REPORT 2018
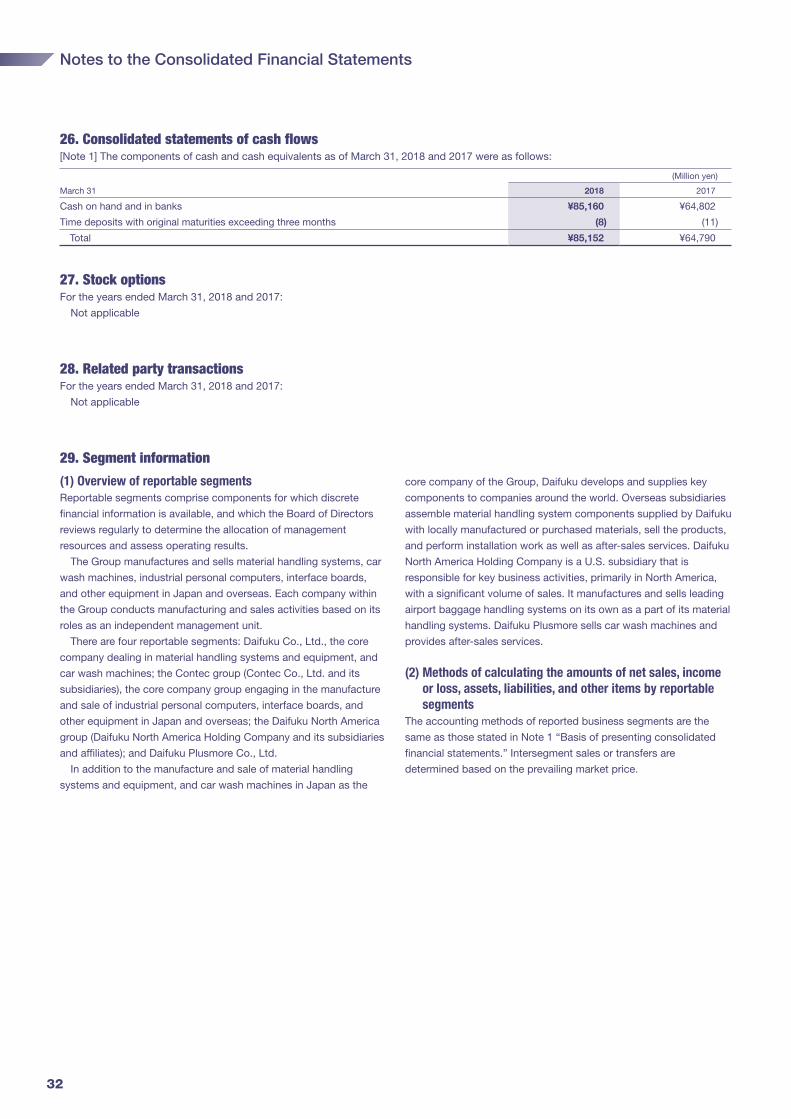
26. Consolidated statements of cash flows[Note 1] The components of cash and cash equivalents as of March 31, 2018 and 2017 were as follows:
(Million yen)
March 31 2018 2017
Cash on hand and in banks ¥85,160 ¥64,802
Time deposits with original maturities exceeding three months (8) (11)
Total ¥85,152 ¥64,790
27. Stock optionsFor the years ended March 31, 2018 and 2017:
Not applicable
28. Related party transactionsFor the years ended March 31, 2018 and 2017:
Not applicable
29. Segment information
(1) Overview of reportable segmentsReportable segments comprise components for which discrete
financial information is available, and which the Board of Directors
reviews regularly to determine the allocation of management
resources and assess operating results.
The Group manufactures and sells material handling systems, car
wash machines, industrial personal computers, interface boards,
and other equipment in Japan and overseas. Each company within
the Group conducts manufacturing and sales activities based on its
roles as an independent management unit.
There are four reportable segments: Daifuku Co., Ltd., the core
company dealing in material handling systems and equipment, and
car wash machines; the Contec group (Contec Co., Ltd. and its
subsidiaries), the core company group engaging in the manufacture
and sale of industrial personal computers, interface boards, and
other equipment in Japan and overseas; the Daifuku North America
group (Daifuku North America Holding Company and its subsidiaries
and affiliates); and Daifuku Plusmore Co., Ltd.
In addition to the manufacture and sale of material handling
systems and equipment, and car wash machines in Japan as the
core company of the Group, Daifuku develops and supplies key
components to companies around the world. Overseas subsidiaries
assemble material handling system components supplied by Daifuku
with locally manufactured or purchased materials, sell the products,
and perform installation work as well as after-sales services. Daifuku
North America Holding Company is a U.S. subsidiary that is
responsible for key business activities, primarily in North America,
with a significant volume of sales. It manufactures and sells leading
airport baggage handling systems on its own as a part of its material
handling systems. Daifuku Plusmore sells car wash machines and
provides after-sales services.
(2) Methods of calculating the amounts of net sales, income or loss, assets, liabilities, and other items by reportable segments
The accounting methods of reported business segments are the
same as those stated in Note 1 “Basis of presenting consolidated
financial statements.” Intersegment sales or transfers are
determined based on the prevailing market price.
Notes to the Consolidated Financial Statements
32
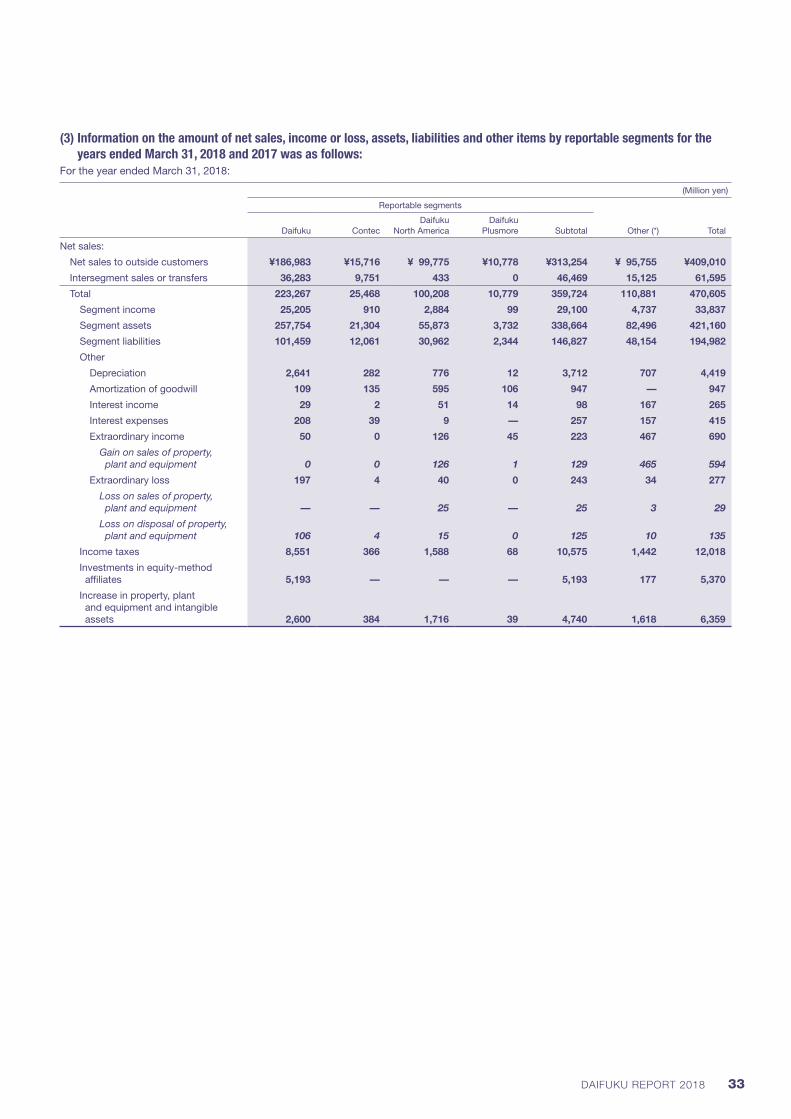
(3) Information on the amount of net sales, income or loss, assets, liabilities and other items by reportable segments for the years ended March 31, 2018 and 2017 was as follows:
For the year ended March 31, 2018:
(Million yen)
Reportable segments
Daifuku ContecDaifuku
North AmericaDaifuku
Plusmore Subtotal Other (*) Total
Net sales:
Net sales to outside customers ¥186,983 ¥15,716 ¥ 99,775 ¥10,778 ¥313,254 ¥ 95,755 ¥409,010
Intersegment sales or transfers 36,283 9,751 433 0 46,469 15,125 61,595
Total 223,267 25,468 100,208 10,779 359,724 110,881 470,605
Segment income 25,205 910 2,884 99 29,100 4,737 33,837
Segment assets 257,754 21,304 55,873 3,732 338,664 82,496 421,160
Segment liabilities 101,459 12,061 30,962 2,344 146,827 48,154 194,982
Other
Depreciation 2,641 282 776 12 3,712 707 4,419
Amortization of goodwill 109 135 595 106 947 — 947
Interest income 29 2 51 14 98 167 265
Interest expenses 208 39 9 — 257 157 415
Extraordinary income 50 0 126 45 223 467 690
Gain on sales of property, plant and equipment 0 0 126 1 129 465 594
Extraordinary loss 197 4 40 0 243 34 277
Loss on sales of property, plant and equipment — — 25 — 25 3 29
Loss on disposal of property, plant and equipment 106 4 15 0 125 10 135
Income taxes 8,551 366 1,588 68 10,575 1,442 12,018
Investments in equity-method affiliates 5,193 — — — 5,193 177 5,370
Increase in property, plant and equipment and intangible assets 2,600 384 1,716 39 4,740 1,618 6,359
33DAIFUKU REPORT 2018
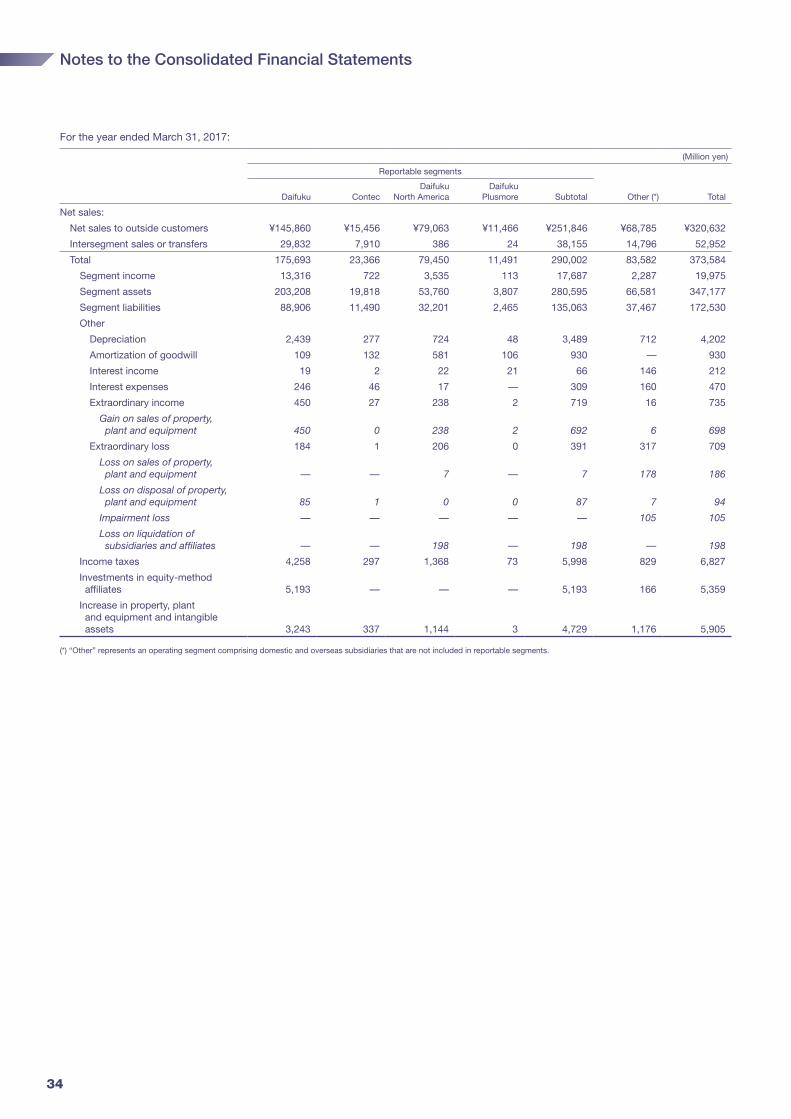
For the year ended March 31, 2017:
(Million yen)
Reportable segments
Daifuku ContecDaifuku
North AmericaDaifuku
Plusmore Subtotal Other (*) Total
Net sales:
Net sales to outside customers ¥145,860 ¥15,456 ¥79,063 ¥11,466 ¥251,846 ¥68,785 ¥320,632
Intersegment sales or transfers 29,832 7,910 386 24 38,155 14,796 52,952
Total 175,693 23,366 79,450 11,491 290,002 83,582 373,584
Segment income 13,316 722 3,535 113 17,687 2,287 19,975
Segment assets 203,208 19,818 53,760 3,807 280,595 66,581 347,177
Segment liabilities 88,906 11,490 32,201 2,465 135,063 37,467 172,530
Other
Depreciation 2,439 277 724 48 3,489 712 4,202
Amortization of goodwill 109 132 581 106 930 — 930
Interest income 19 2 22 21 66 146 212
Interest expenses 246 46 17 — 309 160 470
Extraordinary income 450 27 238 2 719 16 735
Gain on sales of property, plant and equipment 450 0 238 2 692 6 698
Extraordinary loss 184 1 206 0 391 317 709
Loss on sales of property, plant and equipment — — 7 — 7 178 186
Loss on disposal of property, plant and equipment 85 1 0 0 87 7 94
Impairment loss — — — — — 105 105
Loss on liquidation of subsidiaries and affiliates — — 198 — 198 — 198
Income taxes 4,258 297 1,368 73 5,998 829 6,827
Investments in equity-method affiliates 5,193 — — — 5,193 166 5,359
Increase in property, plant and equipment and intangible assets 3,243 337 1,144 3 4,729 1,176 5,905
(*) “Other” represents an operating segment comprising domestic and overseas subsidiaries that are not included in reportable segments.
Notes to the Consolidated Financial Statements
34
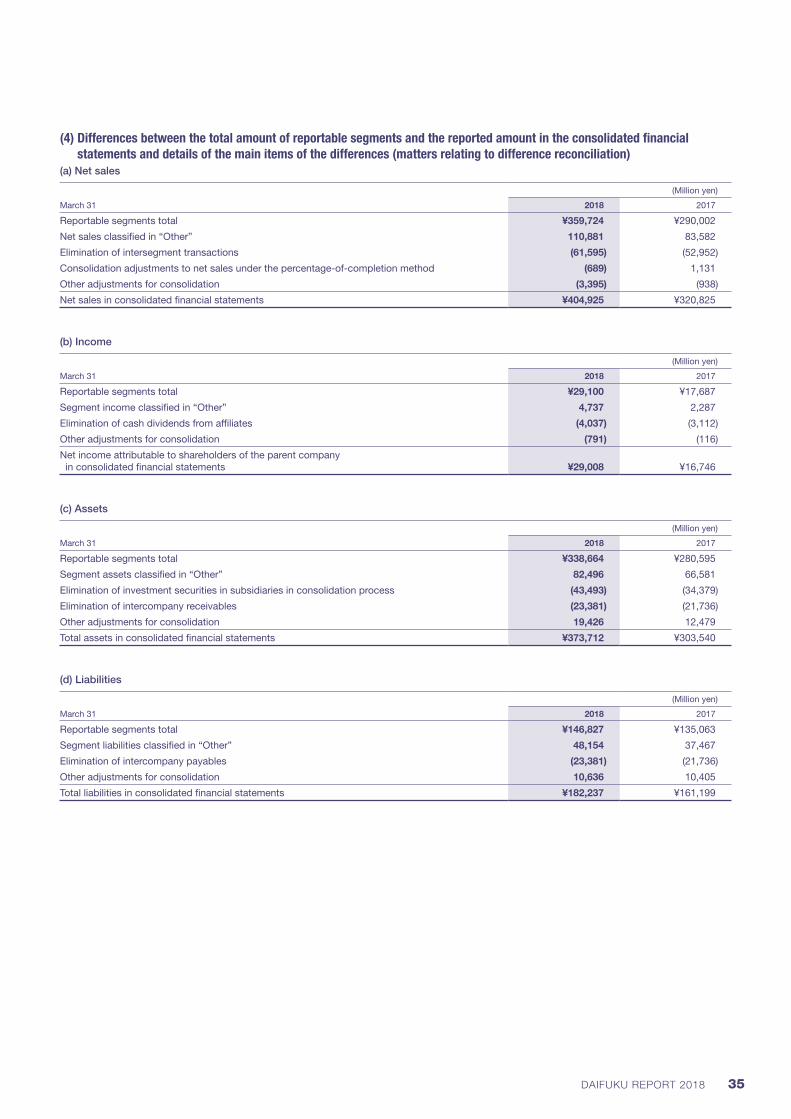
(4) Differences between the total amount of reportable segments and the reported amount in the consolidated financial statements and details of the main items of the differences (matters relating to difference reconciliation)
(a) Net sales
(Million yen)
March 31 2018 2017
Reportable segments total ¥359,724 ¥290,002
Net sales classified in “Other” 110,881 83,582
Elimination of intersegment transactions (61,595) (52,952)
Consolidation adjustments to net sales under the percentage-of-completion method (689) 1,131
Other adjustments for consolidation (3,395) (938)
Net sales in consolidated financial statements ¥404,925 ¥320,825
(b) Income
(Million yen)
March 31 2018 2017
Reportable segments total ¥29,100 ¥17,687
Segment income classified in “Other” 4,737 2,287
Elimination of cash dividends from affiliates (4,037) (3,112)
Other adjustments for consolidation (791) (116)
Net income attributable to shareholders of the parent company in consolidated financial statements ¥29,008 ¥16,746
(c) Assets
(Million yen)
March 31 2018 2017
Reportable segments total ¥338,664 ¥280,595
Segment assets classified in “Other” 82,496 66,581
Elimination of investment securities in subsidiaries in consolidation process (43,493) (34,379)
Elimination of intercompany receivables (23,381) (21,736)
Other adjustments for consolidation 19,426 12,479
Total assets in consolidated financial statements ¥373,712 ¥303,540
(d) Liabilities
(Million yen)
March 31 2018 2017
Reportable segments total ¥146,827 ¥135,063
Segment liabilities classified in “Other” 48,154 37,467
Elimination of intercompany payables (23,381) (21,736)
Other adjustments for consolidation 10,636 10,405
Total liabilities in consolidated financial statements ¥182,237 ¥161,199
35DAIFUKU REPORT 2018
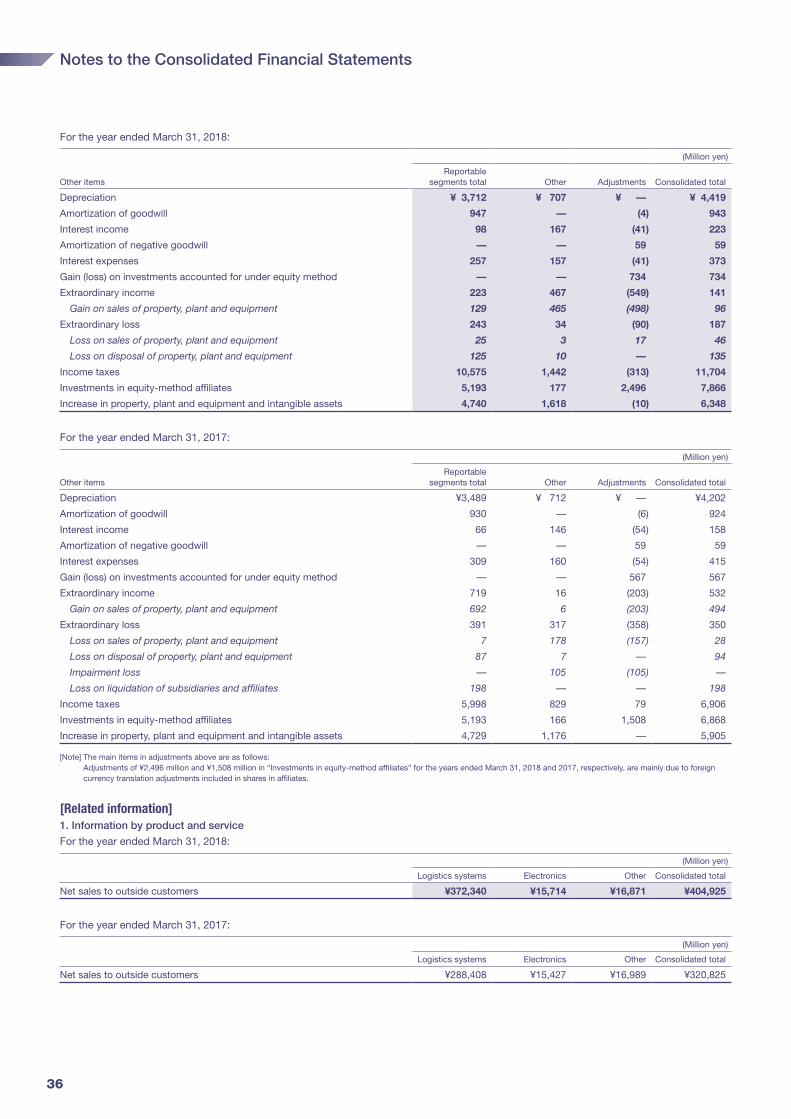
For the year ended March 31, 2018:
(Million yen)
Other itemsReportable
segments total Other Adjustments Consolidated total
Depreciation ¥ 3,712 ¥ 707 ¥ — ¥ 4,419
Amortization of goodwill 947 — (4) 943
Interest income 98 167 (41) 223
Amortization of negative goodwill — — 59 59
Interest expenses 257 157 (41) 373
Gain (loss) on investments accounted for under equity method — — 734 734
Extraordinary income 223 467 (549) 141
Gain on sales of property, plant and equipment 129 465 (498) 96
Extraordinary loss 243 34 (90) 187
Loss on sales of property, plant and equipment 25 3 17 46
Loss on disposal of property, plant and equipment 125 10 — 135
Income taxes 10,575 1,442 (313) 11,704
Investments in equity-method affiliates 5,193 177 2,496 7,866
Increase in property, plant and equipment and intangible assets 4,740 1,618 (10) 6,348
For the year ended March 31, 2017:
(Million yen)
Other itemsReportable
segments total Other Adjustments Consolidated total
Depreciation ¥3,489 ¥ 712 ¥ — ¥4,202
Amortization of goodwill 930 — (6) 924
Interest income 66 146 (54) 158
Amortization of negative goodwill — — 59 59
Interest expenses 309 160 (54) 415
Gain (loss) on investments accounted for under equity method — — 567 567
Extraordinary income 719 16 (203) 532
Gain on sales of property, plant and equipment 692 6 (203) 494
Extraordinary loss 391 317 (358) 350
Loss on sales of property, plant and equipment 7 178 (157) 28
Loss on disposal of property, plant and equipment 87 7 — 94
Impairment loss — 105 (105) —
Loss on liquidation of subsidiaries and affiliates 198 — — 198
Income taxes 5,998 829 79 6,906
Investments in equity-method affiliates 5,193 166 1,508 6,868
Increase in property, plant and equipment and intangible assets 4,729 1,176 — 5,905
[Note] The main items in adjustments above are as follows: Adjustments of ¥2,496 million and ¥1,508 million in “Investments in equity-method affiliates” for the years ended March 31, 2018 and 2017, respectively, are mainly due to foreign currency translation adjustments included in shares in affiliates.
[Related information]1. Information by product and service
For the year ended March 31, 2018:
(Million yen)
Logistics systems Electronics Other Consolidated total
Net sales to outside customers ¥372,340 ¥15,714 ¥16,871 ¥404,925
For the year ended March 31, 2017:
(Million yen)
Logistics systems Electronics Other Consolidated total
Net sales to outside customers ¥288,408 ¥15,427 ¥16,989 ¥320,825
Notes to the Consolidated Financial Statements
36

2. Information by geographic area
(1) Net sales
For the year ended March 31, 2018:
(Million yen)
Japan U.S.A. China S. Korea Other Consolidated total
Net sales to outside customers ¥132,468 ¥88,700 ¥72,560 ¥50,841 ¥60,355 ¥404,925
For the year ended March 31, 2017:
(Million yen)
Japan U.S.A. China S. Korea Other Consolidated total
Net sales to outside customers ¥110,678 ¥71,470 ¥36,863 ¥32,275 ¥69,537 ¥320,825
[Note] Net sales are classified by country or area where customers are located.
(2) Property, plant and equipment
For the year ended March 31, 2018:
(Million yen)
Japan U.S.A. Other Consolidated total
Property, plant and equipment ¥23,773 ¥4,759 ¥6,719 ¥35,252
For the year ended March 31, 2017:
(Million yen)
Japan U.S.A. Other Consolidated total
Property, plant and equipment ¥23,938 ¥3,814 ¥5,833 ¥33,586
3. Information by customer
It is omitted because no single outside customer represents 10% or more of the net sales reported in the consolidated statements of income
and comprehensive income.
[Information about impairment loss of property, plant and equipment and intangible assets by reportable segment]For the year ended March 31, 2018:
Not applicable
For the year ended March 31, 2017:
(Million yen)
Reportable segments
Daifuku ContecDaifuku
North AmericaDaifuku
Plusmore Total OtherElimination
or corporateConsolidated
total
Impairment loss ¥— ¥— ¥— ¥— ¥— ¥105 ¥(105) ¥—
[Information about the amount of amortization and unamortized balance of goodwill and negative goodwill by reportable segment]For the year ended March 31, 2018:
(Million yen)
Reportable segments
Daifuku ContecDaifuku
North AmericaDaifuku
Plusmore Total OtherElimination
or corporateConsolidated
total
Ending balance of goodwill ¥210 ¥1,369 ¥4,203 ¥294 ¥6,078 ¥521 ¥2,194 ¥8,794
Ending balance of negative goodwill ¥ — ¥ — ¥ — ¥ — ¥ — ¥ — ¥ — ¥ —
37DAIFUKU REPORT 2018
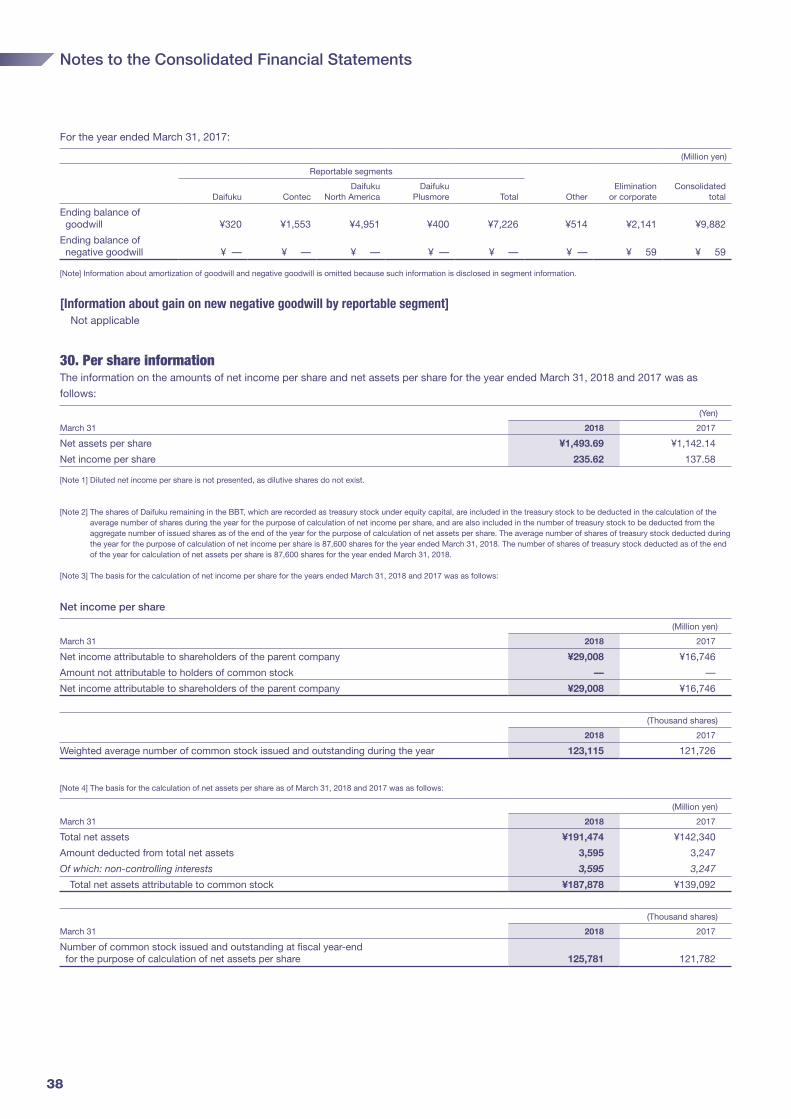
For the year ended March 31, 2017:
(Million yen)
Reportable segments
Daifuku ContecDaifuku
North AmericaDaifuku
Plusmore Total OtherElimination
or corporateConsolidated
total
Ending balance of goodwill ¥320 ¥1,553 ¥4,951 ¥400 ¥7,226 ¥514 ¥2,141 ¥9,882
Ending balance of negative goodwill ¥ — ¥ — ¥ — ¥ — ¥ — ¥ — ¥ 59 ¥ 59
[Note] Information about amortization of goodwill and negative goodwill is omitted because such information is disclosed in segment information.
[Information about gain on new negative goodwill by reportable segment] Not applicable
30. Per share informationThe information on the amounts of net income per share and net assets per share for the year ended March 31, 2018 and 2017 was as
follows:
(Yen)
March 31 2018 2017
Net assets per share ¥1,493.69 ¥1,142.14
Net income per share 235.62 137.58
[Note 1] Diluted net income per share is not presented, as dilutive shares do not exist.
[Note 2] The shares of Daifuku remaining in the BBT, which are recorded as treasury stock under equity capital, are included in the treasury stock to be deducted in the calculation of the average number of shares during the year for the purpose of calculation of net income per share, and are also included in the number of treasury stock to be deducted from the aggregate number of issued shares as of the end of the year for the purpose of calculation of net assets per share. The average number of shares of treasury stock deducted during the year for the purpose of calculation of net income per share is 87,600 shares for the year ended March 31, 2018. The number of shares of treasury stock deducted as of the end of the year for calculation of net assets per share is 87,600 shares for the year ended March 31, 2018.
[Note 3] The basis for the calculation of net income per share for the years ended March 31, 2018 and 2017 was as follows:
Net income per share
(Million yen)
March 31 2018 2017
Net income attributable to shareholders of the parent company ¥29,008 ¥16,746
Amount not attributable to holders of common stock — —
Net income attributable to shareholders of the parent company ¥29,008 ¥16,746
(Thousand shares)
2018 2017
Weighted average number of common stock issued and outstanding during the year 123,115 121,726
[Note 4] The basis for the calculation of net assets per share as of March 31, 2018 and 2017 was as follows:
(Million yen)
March 31 2018 2017
Total net assets ¥191,474 ¥142,340
Amount deducted from total net assets 3,595 3,247
Of which: non-controlling interests 3,595 3,247
Total net assets attributable to common stock ¥187,878 ¥139,092
(Thousand shares)
March 31 2018 2017
Number of common stock issued and outstanding at fiscal year-end for the purpose of calculation of net assets per share 125,781 121,782
Notes to the Consolidated Financial Statements
38
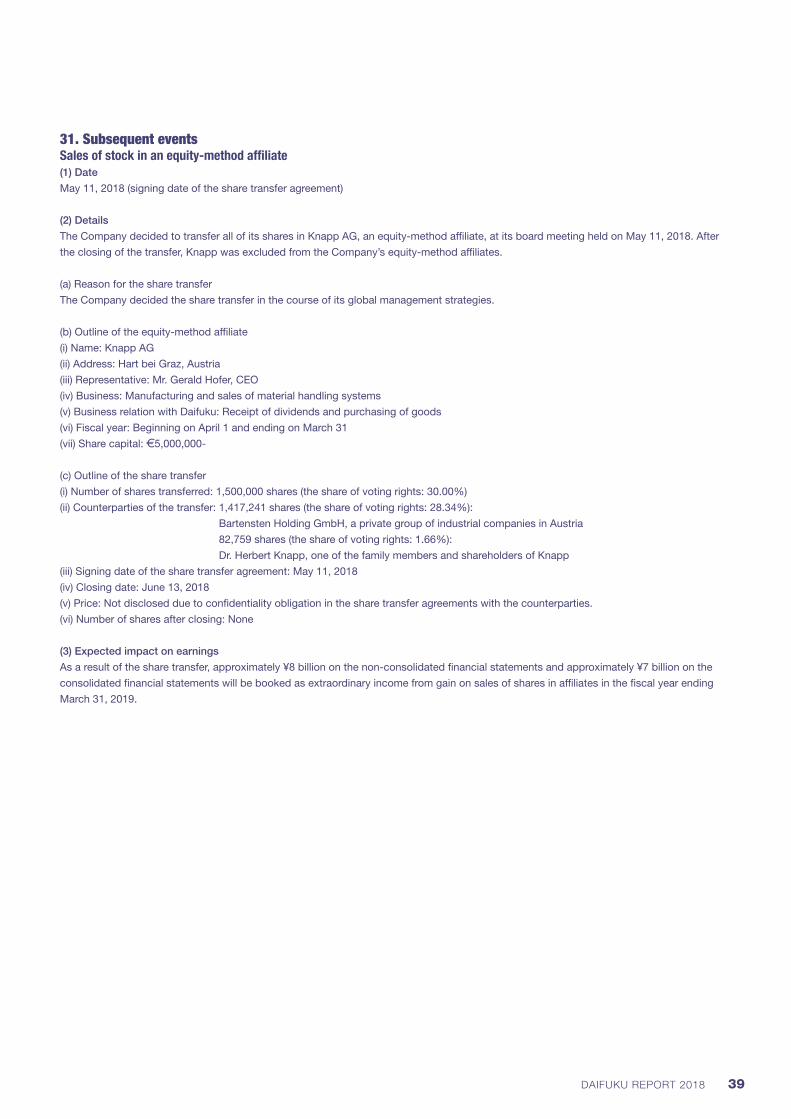
31. Subsequent eventsSales of stock in an equity-method affiliate(1) Date
May 11, 2018 (signing date of the share transfer agreement)
(2) Details
The Company decided to transfer all of its shares in Knapp AG, an equity-method affiliate, at its board meeting held on May 11, 2018. After
the closing of the transfer, Knapp was excluded from the Company’s equity-method affiliates.
(a) Reason for the share transfer
The Company decided the share transfer in the course of its global management strategies.
(b) Outline of the equity-method affiliate
(i) Name: Knapp AG
(ii) Address: Hart bei Graz, Austria
(iii) Representative: Mr. Gerald Hofer, CEO
(iv) Business: Manufacturing and sales of material handling systems
(v) Business relation with Daifuku: Receipt of dividends and purchasing of goods
(vi) Fiscal year: Beginning on April 1 and ending on March 31
(vii) Share capital: 5,000,000-
(c) Outline of the share transfer
(i) Number of shares transferred: 1,500,000 shares (the share of voting rights: 30.00%)
(ii) Counterparties of the transfer: 1,417,241 shares (the share of voting rights: 28.34%):
Bartensten Holding GmbH, a private group of industrial companies in Austria
82,759 shares (the share of voting rights: 1.66%):
Dr. Herbert Knapp, one of the family members and shareholders of Knapp
(iii) Signing date of the share transfer agreement: May 11, 2018
(iv) Closing date: June 13, 2018
(v) Price: Not disclosed due to confidentiality obligation in the share transfer agreements with the counterparties.
(vi) Number of shares after closing: None
(3) Expected impact on earnings
As a result of the share transfer, approximately ¥8 billion on the non-consolidated financial statements and approximately ¥7 billion on the
consolidated financial statements will be booked as extraordinary income from gain on sales of shares in affiliates in the fiscal year ending
March 31, 2019.
39DAIFUKU REPORT 2018

Independent Auditor’s Report
40

1809-08DR
www.daifuku.com


![Electrode Die Size Active Area PAD Size Specification.pdf · 2020-01-27 · Electrode Die Size Active Area PAD Size Common [mm] W x L[ mm ] W x L[ mm ] PSD-1054A Cathode 0.54 x 0.54](https://img.pdfslide.us/doc/110x75/5eaefb254f8cf80a932acf56/electrode-die-size-active-area-pad-specificationpdf-2020-01-27-electrode-die.jpg)


![100[ch] 0.28[ps/ch] 200[ch] 0.54[ps/ch] TDC-calibration](https://img.pdfslide.us/doc/110x75/56649c7d5503460f94931818/100ch-028psch-200ch-054psch-tdc-calibration.jpg)