Embed Size (px)
Citation preview
Disclaimer: The information contained in this document is intended only for use during the presentation and should not be disseminated or distributed to parties outside the presentation. Mermaid Group accepts no liability whatsoeverwith respect to the use of this document or its contents.
www.mermaid-group.com
CORPORATE PRESENTATION
Suntec Singapore International Convention & Exhibition Centre
23 March 2018
AGENDA
• Corporate Introduction
• Financial Review
• Sustainability Report
• Market Review & Business Outlook
2
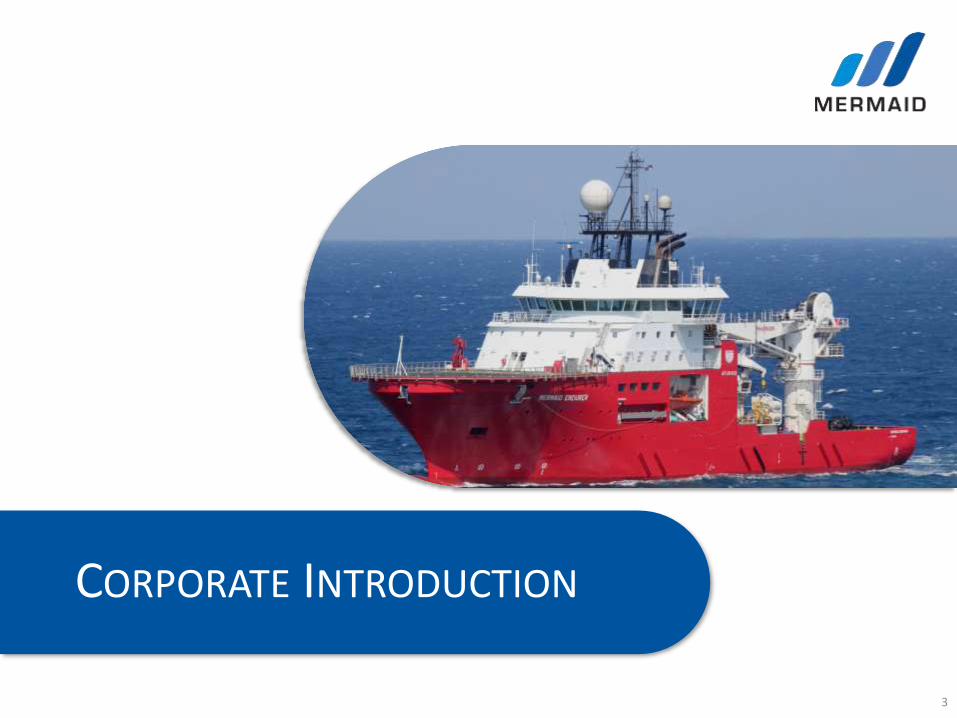
CORPORATE INTRODUCTION
3
MERMAID GROUP
4
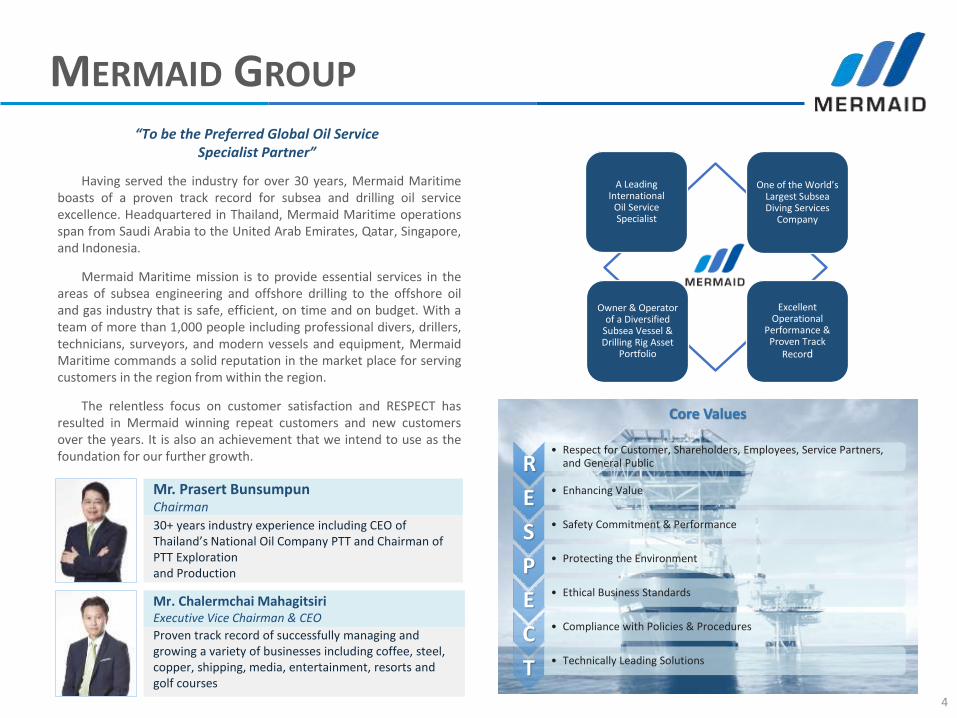
Having served the industry for over 30 years, Mermaid Maritimeboasts of a proven track record for subsea and drilling oil serviceexcellence. Headquartered in Thailand, Mermaid Maritime operationsspan from Saudi Arabia to the United Arab Emirates, Qatar, Singapore,and Indonesia.
Mermaid Maritime mission is to provide essential services in theareas of subsea engineering and offshore drilling to the offshore oiland gas industry that is safe, efficient, on time and on budget. With ateam of more than 1,000 people including professional divers, drillers,technicians, surveyors, and modern vessels and equipment, MermaidMaritime commands a solid reputation in the market place for servingcustomers in the region from within the region.
The relentless focus on customer satisfaction and RESPECT hasresulted in Mermaid winning repeat customers and new customersover the years. It is also an achievement that we intend to use as thefoundation for our further growth.
30+ years industry experience including CEO of Thailand’s National Oil Company PTT and Chairman of PTT Exploration and Production
Mr. Prasert BunsumpunChairman
Proven track record of successfully managing and growing a variety of businesses including coffee, steel, copper, shipping, media, entertainment, resorts and golf courses
Mr. Chalermchai MahagitsiriExecutive Vice Chairman & CEO
A Leading International
Oil Service Specialist
One of the World’s Largest Subsea Diving Services
Company
Owner & Operator of a Diversified
Subsea Vessel & Drilling Rig Asset
Portfolio
Excellent Operational
Performance & Proven Track
Record
“To be the Preferred Global Oil Service Specialist Partner”
Core Values
R• Respect for Customer, Shareholders, Employees, Service Partners,
and General Public
E • Enhancing Value
S • Safety Commitment & Performance
P • Protecting the Environment
E • Ethical Business Standards
C • Compliance with Policies & Procedures
T • Technically Leading Solutions
MEMBER OF THORESEN GROUP
5
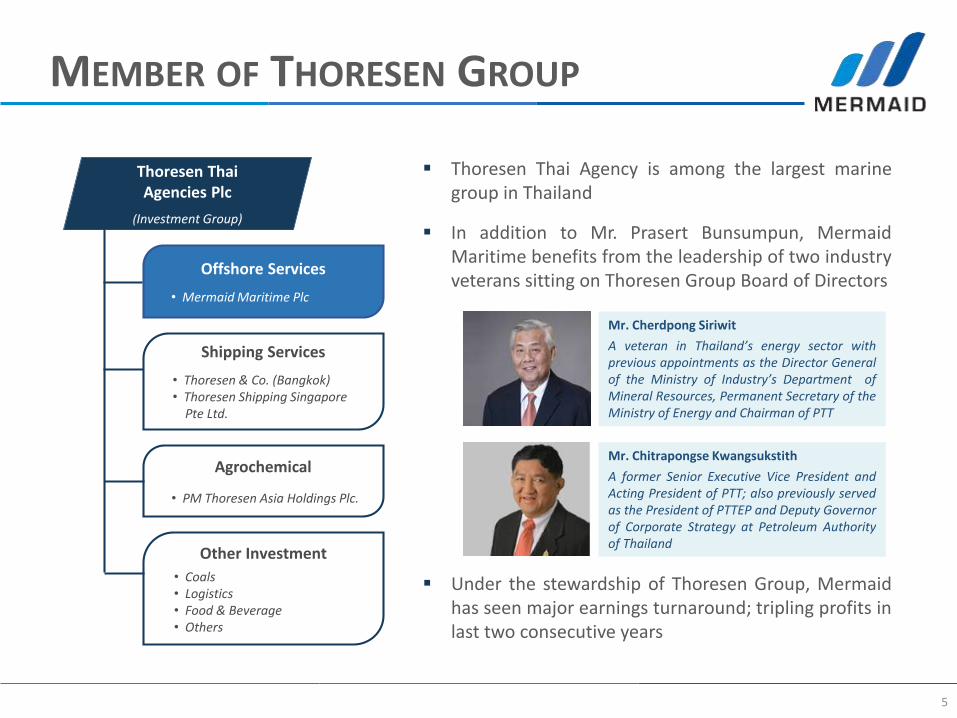
Thoresen Thai Agency is among the largest marine group in Thailand
In addition to Mr. Prasert Bunsumpun, Mermaid Maritime benefits from the leadership of two industry veterans sitting on Thoresen Group Board of Directors
Under the stewardship of Thoresen Group, Mermaid has seen major earnings turnaround; tripling profits in last two consecutive years
Mr. Chitrapongse Kwangsukstith
A former Senior Executive Vice President and Acting President of PTT; also previously served as the President of PTTEP and Deputy Governor of Corporate Strategy at Petroleum Authority of Thailand
Mr. Cherdpong Siriwit
A veteran in Thailand’s energy sector with previous appointments as the Director General of the Ministry of Industry’s Department of Mineral Resources, Permanent Secretary of the Ministry of Energy and Chairman of PTT
Thoresen Thai Agencies Plc
(Investment Group)
Shipping Services
• Thoresen & Co. (Bangkok)• Thoresen Shipping Singapore
Pte Ltd.
Agrochemical
• PM Thoresen Asia Holdings Plc.
Offshore Services
• Mermaid Maritime Plc
Other Investment
• Coals • Logistics• Food & Beverage• Others
.
MERMAID ROADMAP
6
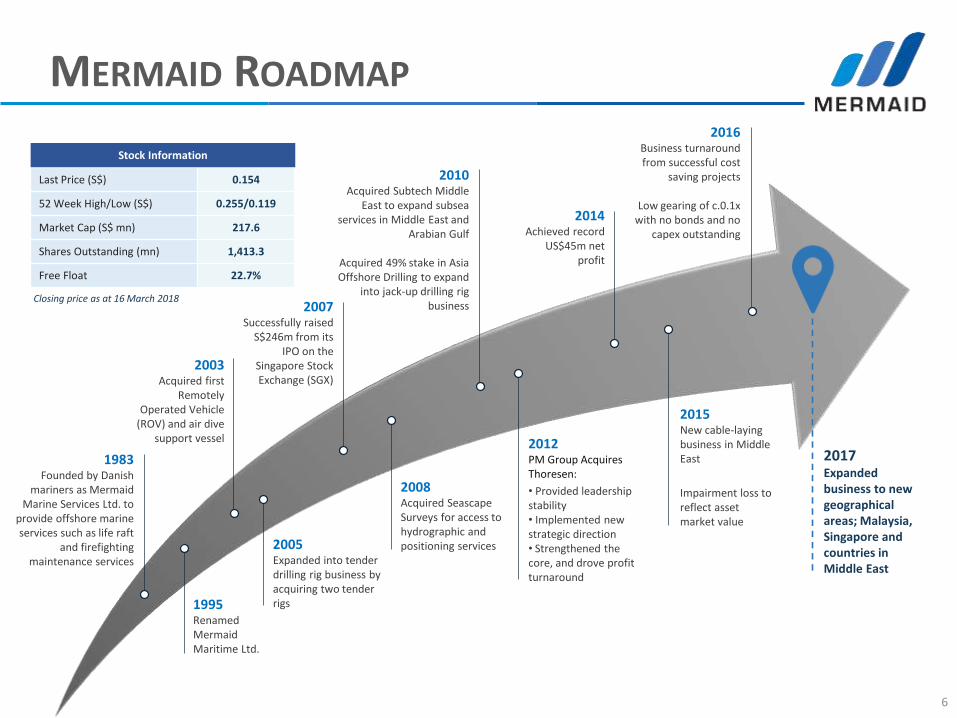
1983 Founded by Danish
mariners as Mermaid Marine Services Ltd. to
provide offshore marine services such as life raft
and firefighting maintenance services
1995Renamed Mermaid Maritime Ltd.
2003Acquired first
Remotely Operated Vehicle
(ROV) and air dive support vessel
2005Expanded into tender drilling rig business by acquiring two tender rigs
2007Successfully raised
S$246m from its IPO on the
Singapore Stock Exchange (SGX)
2008Acquired Seascape Surveys for access to hydrographic and positioning services
2010Acquired Subtech Middle
East to expand subsea services in Middle East and
Arabian Gulf
Acquired 49% stake in Asia Offshore Drilling to expand
into jack-up drilling rig business
2012PM Group Acquires Thoresen:
• Provided leadership stability• Implemented new strategic direction• Strengthened the core, and drove profit turnaround
2014Achieved record
US$45m net profit
2015New cable-laying business in Middle East
Impairment loss to reflect asset market value
2017Expanded business to new geographical areas; Malaysia, Singapore and countries in Middle East
Last Price (S$) 0.154
52 Week High/Low (S$) 0.255/0.119
Market Cap (S$ mn) 217.6
Shares Outstanding (mn) 1,413.3
Free Float 22.7%
Stock Information
Closing price as at 16 March 2018
2016Business turnaround from successful cost
saving projects
Low gearing of c.0.1x with no bonds and no
capex outstanding
GLOBAL SERVICE SPECIALIST
7
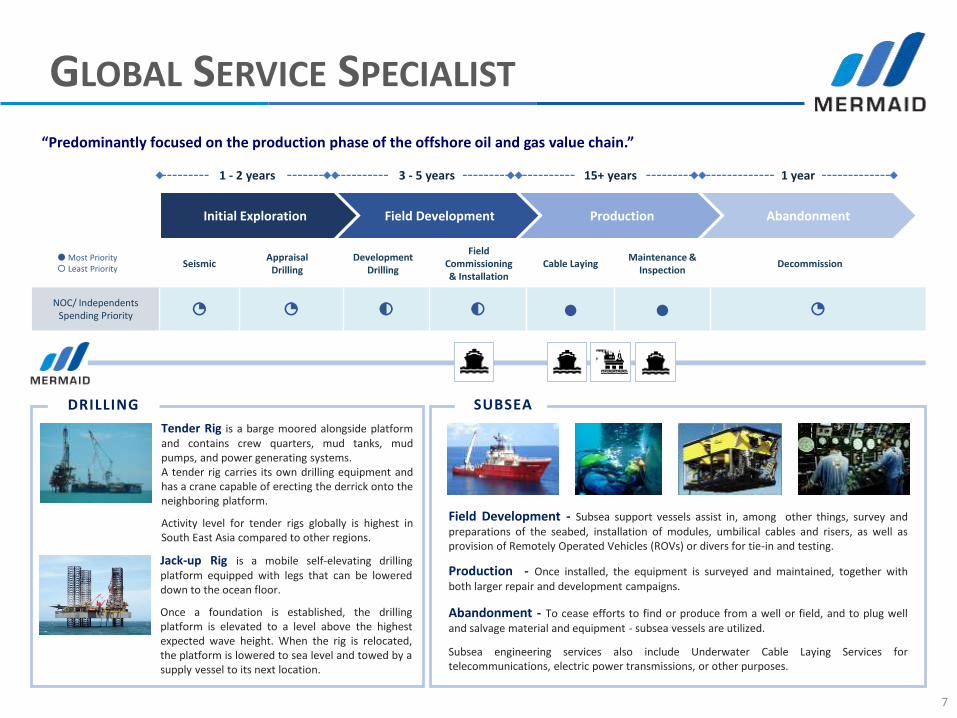
Initial Exploration Field Development Production Abandonment
“Predominantly focused on the production phase of the offshore oil and gas value chain.”
1 - 2 years 3 - 5 years 15+ years 1 year
SeismicAppraisal
DrillingDevelopment
Drilling
FieldCommissioning & Installation
Cable LayingMaintenance &
InspectionDecommission
NOC/ IndependentsSpending Priority ◔ ◔ ◐ ◐ ● ● ◔
Most Priority Least Priority
Tender Rig is a barge moored alongside platform and contains crew quarters, mud tanks, mud pumps, and power generating systems.A tender rig carries its own drilling equipment and has a crane capable of erecting the derrick onto the neighboring platform.
Activity level for tender rigs globally is highest in South East Asia compared to other regions.
Jack-up Rig is a mobile self-elevating drilling platform equipped with legs that can be lowered down to the ocean floor.
Once a foundation is established, the drilling platform is elevated to a level above the highest expected wave height. When the rig is relocated, the platform is lowered to sea level and towed by a supply vessel to its next location.
Field Development - Subsea support vessels assist in, among other things, survey and preparations of the seabed, installation of modules, umbilical cables and risers, as well as provision of Remotely Operated Vehicles (ROVs) or divers for tie-in and testing.
DRILLING SUBSEA
Production - Once installed, the equipment is surveyed and maintained, together with both larger repair and development campaigns.
Abandonment - To cease efforts to find or produce from a well or field, and to plug well and salvage material and equipment - subsea vessels are utilized.
Subsea engineering services also include Underwater Cable Laying Services for telecommunications, electric power transmissions, or other purposes.
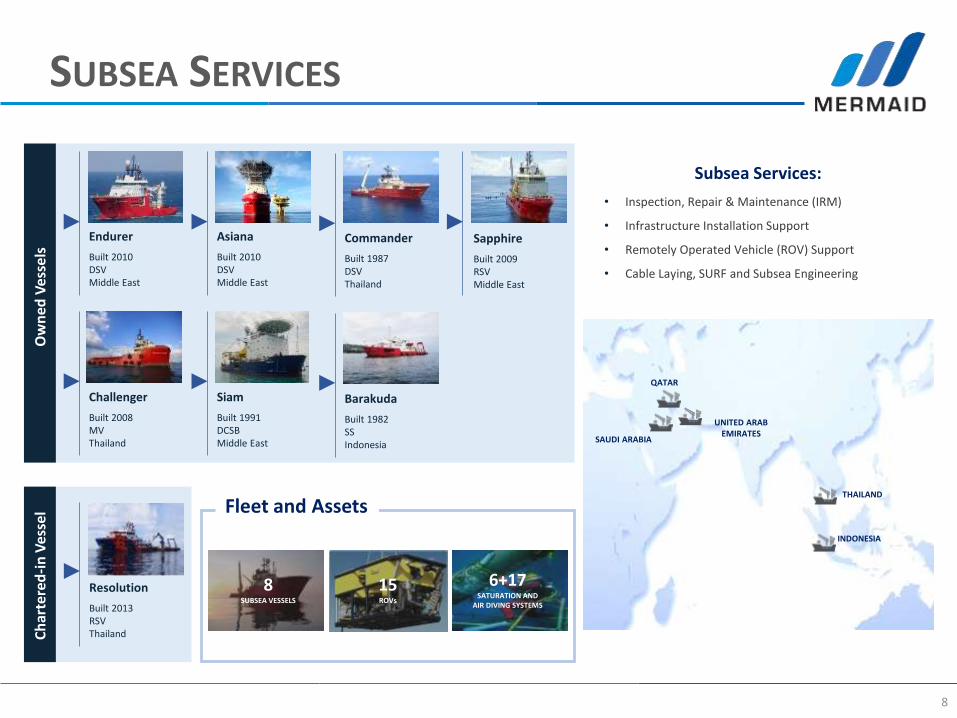
SUBSEA SERVICES
8
Ch
arte
red
-in
Ves
sel
Resolution
Built 2013RSVThailand
15ROVs
8SUBSEA VESSELS
6+17 SATURATION AND
AIR DIVING SYSTEMS
Subsea Services:
• Inspection, Repair & Maintenance (IRM)
• Infrastructure Installation Support
• Remotely Operated Vehicle (ROV) Support
• Cable Laying, SURF and Subsea Engineering
THAILAND
INDONESIA
UNITED ARAB EMIRATES
SAUDI ARABIA
QATAR
Endurer
Built 2010DSVMiddle East
Asiana
Built 2010DSVMiddle East
Commander
Built 1987DSVThailand
Sapphire
Built 2009RSVMiddle East
Challenger
Built 2008MVThailand
Siam
Built 1991DCSBMiddle East
Barakuda
Built 1982SSIndonesia
Ow
ned
Ves
sels
Fleet and Assets
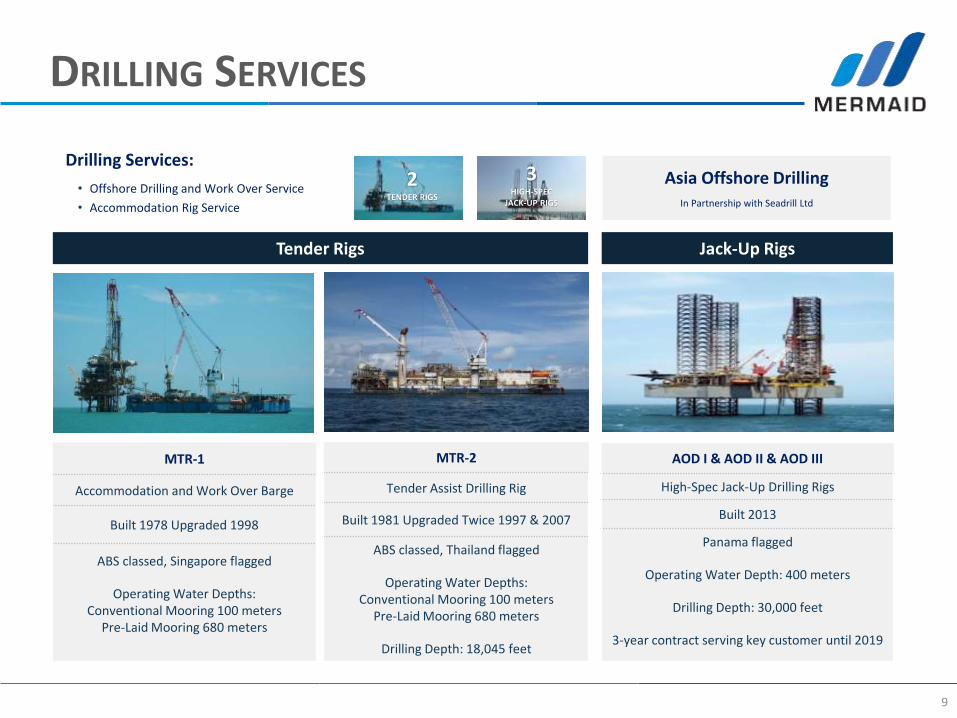
DRILLING SERVICES
9
3HIGH-SPEC
JACK-UP RIGS
2TENDER RIGS
Asia Offshore DrillingIn Partnership with Seadrill Ltd
Drilling Services:
• Offshore Drilling and Work Over Service
• Accommodation Rig Service
MTR-1
Accommodation and Work Over Barge
Built 1978 Upgraded 1998
ABS classed, Singapore flagged
Operating Water Depths:Conventional Mooring 100 meters
Pre-Laid Mooring 680 meters
MTR-2
Tender Assist Drilling Rig
Built 1981 Upgraded Twice 1997 & 2007
ABS classed, Thailand flagged
Operating Water Depths:Conventional Mooring 100 meters
Pre-Laid Mooring 680 meters
Drilling Depth: 18,045 feet
AOD I & AOD II & AOD III
High-Spec Jack-Up Drilling Rigs
Built 2013
Panama flagged
Operating Water Depth: 400 meters
Drilling Depth: 30,000 feet
3-year contract serving key customer until 2019
Tender Rigs Jack-Up Rigs
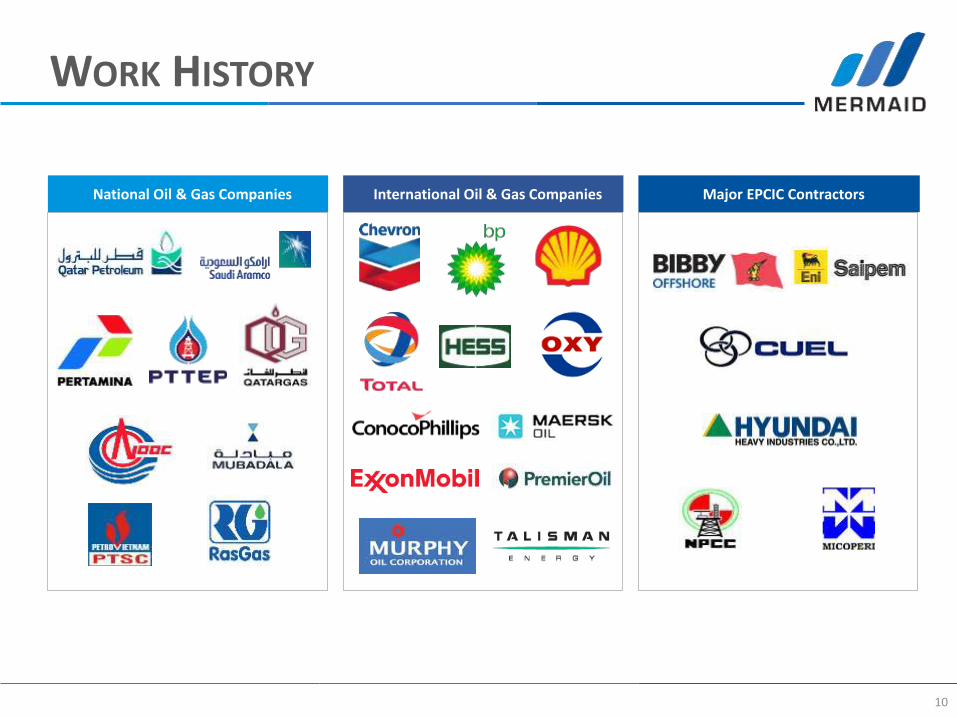
WORK HISTORY
10
National Oil & Gas Companies Major EPCIC ContractorsInternational Oil & Gas Companies
FINANCIAL REVIEW
11
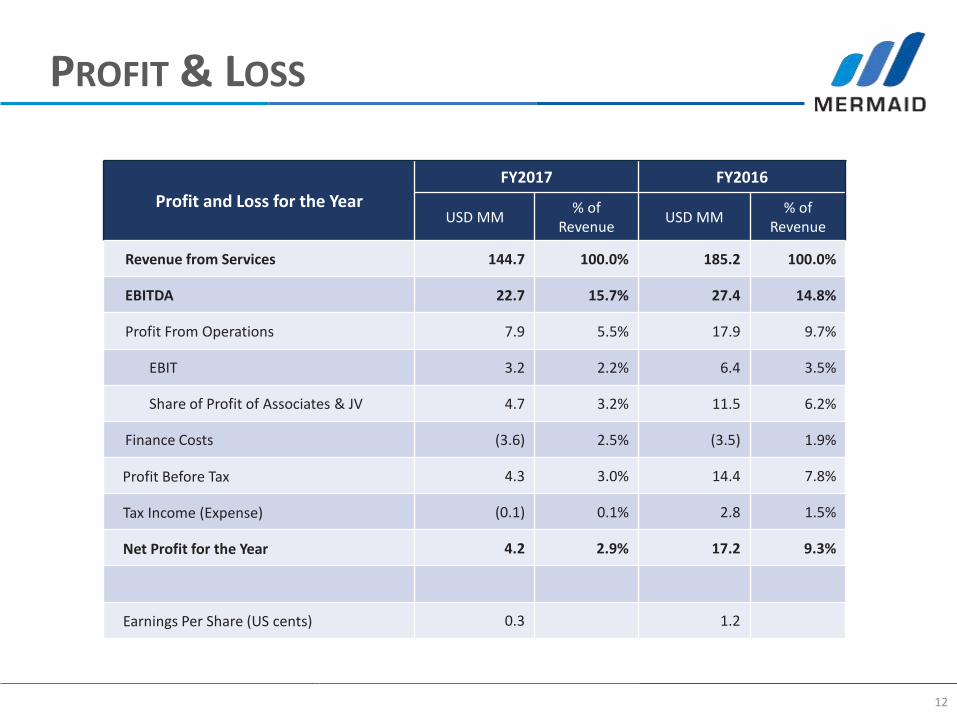
PROFIT & LOSS
12
Profit and Loss for the Year
FY2017 FY2016
USD MM% of
RevenueUSD MM
% of Revenue
Revenue from Services 144.7 100.0% 185.2 100.0%
EBITDA 22.7 15.7% 27.4 14.8%
Profit From Operations 7.9 5.5% 17.9 9.7%
EBIT 3.2 2.2% 6.4 3.5%
Share of Profit of Associates & JV 4.7 3.2% 11.5 6.2%
Finance Costs (3.6) 2.5% (3.5) 1.9%
Profit Before Tax 4.3 3.0% 14.4 7.8%
Tax Income (Expense) (0.1) 0.1% 2.8 1.5%
Net Profit for the Year 4.2 2.9% 17.2 9.3%
Earnings Per Share (US cents) 0.3 1.2
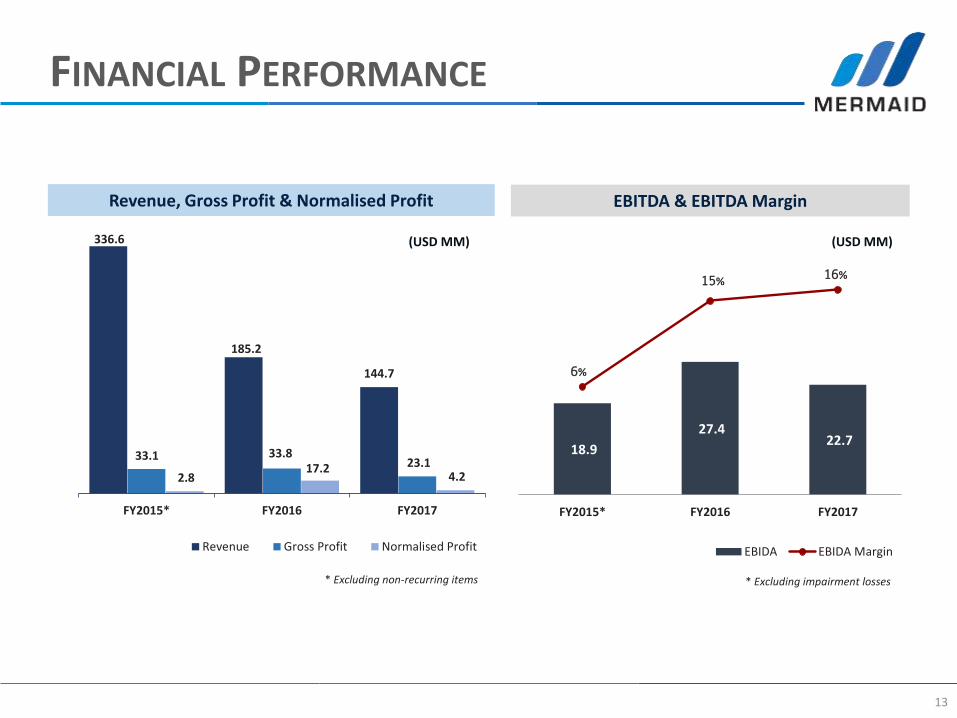
FINANCIAL PERFORMANCE
13
Revenue, Gross Profit & Normalised Profit EBITDA & EBITDA Margin
336.6
185.2
144.7
33.1 33.8 23.1
2.8 17.2
4.2
FY2015* FY2016 FY2017
Revenue Gross Profit Normalised Profit
18.9
27.4 22.7
6%
15%16%
-
5.0
10.0
15.0
20.0
25.0
30.0
35.0
40.0
45.0
50.0
FY2015* FY2016 FY2017
EBIDA EBIDA Margin
* Excluding non-recurring items * Excluding impairment losses
(USD MM)(USD MM)
SUBSEA REVENUE
14
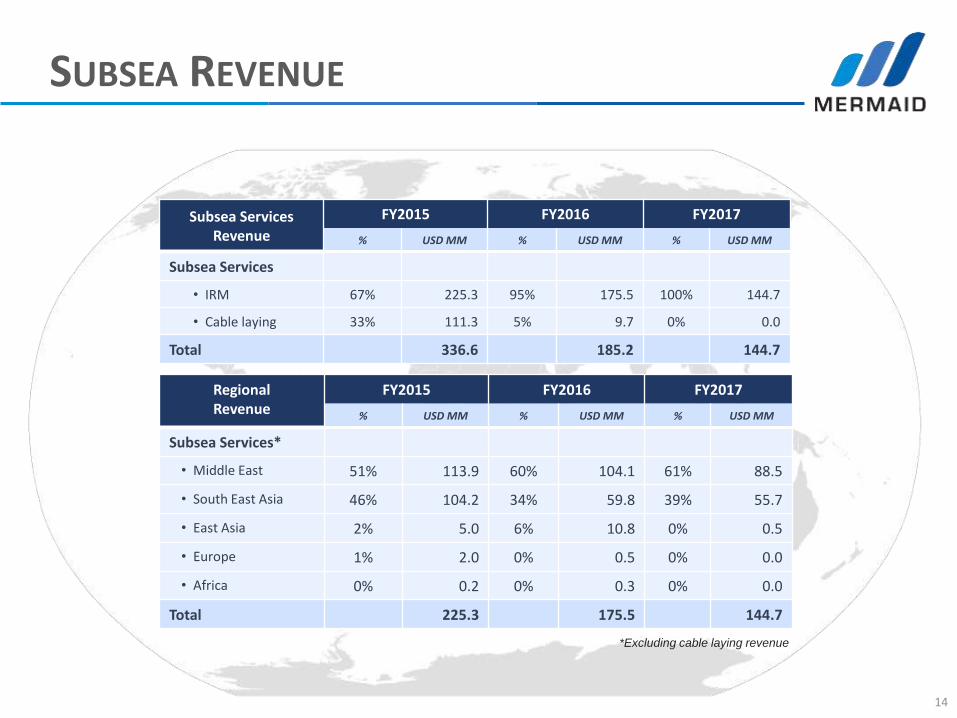
Subsea Services Revenue
FY2015 FY2016 FY2017
% USD MM % USD MM % USD MM
Subsea Services
• IRM 67% 225.3 95% 175.5 100% 144.7
• Cable laying 33% 111.3 5% 9.7 0% 0.0
Total 336.6 185.2 144.7
RegionalRevenue
FY2015 FY2016 FY2017
% USD MM % USD MM % USD MM
Subsea Services*
• Middle East 51% 113.9 60% 104.1 61% 88.5
• South East Asia 46% 104.2 34% 59.8 39% 55.7
• East Asia 2% 5.0 6% 10.8 0% 0.5
• Europe 1% 2.0 0% 0.5 0% 0.0
• Africa 0% 0.2 0% 0.3 0% 0.0
Total 225.3 175.5 144.7
*Excluding cable laying revenue
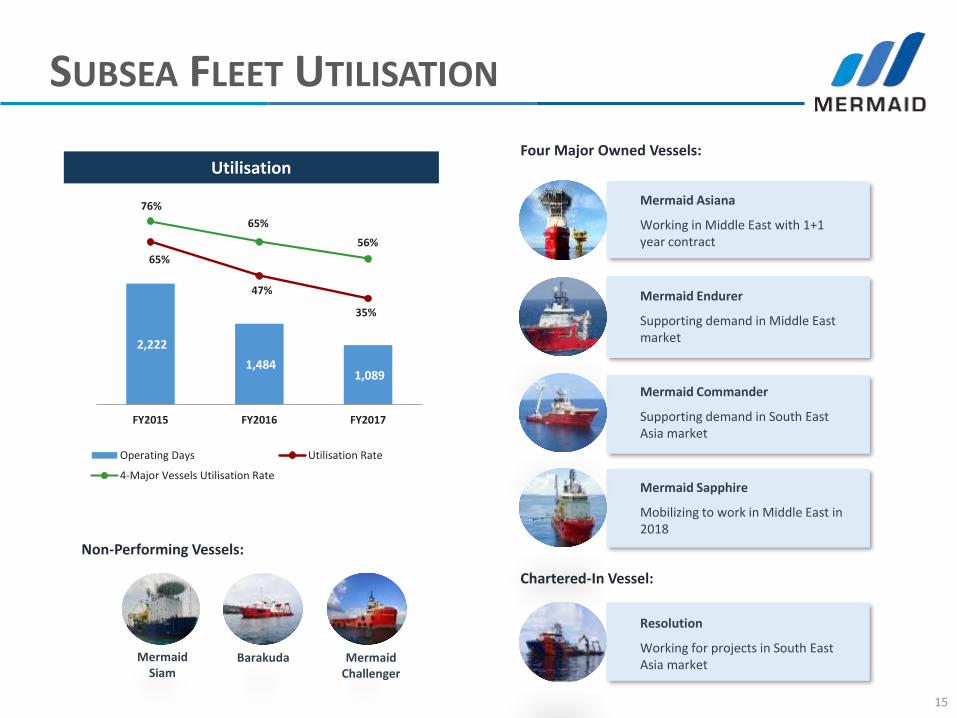
SUBSEA FLEET UTILISATION
15
Mermaid Asiana
Working in Middle East with 1+1 year contract
MermaidSiam
Mermaid Endurer
Supporting demand in Middle East market
Mermaid Commander
Supporting demand in South East Asia market
Mermaid Sapphire
Mobilizing to work in Middle East in 2018
Resolution
Working for projects in South East Asia market
Barakuda Mermaid Challenger
Four Major Owned Vessels:
Chartered-In Vessel:
Non-Performing Vessels:
2,222
1,484 1,089
65%
47%
35%
76%
65%
56%
(300)
200
700
1,200
1,700
2,200
2,700
3,200
3,700
4,200
FY2015 FY2016 FY2017
Operating Days Utilisation Rate
4-Major Vessels Utilisation Rate
Utilisation
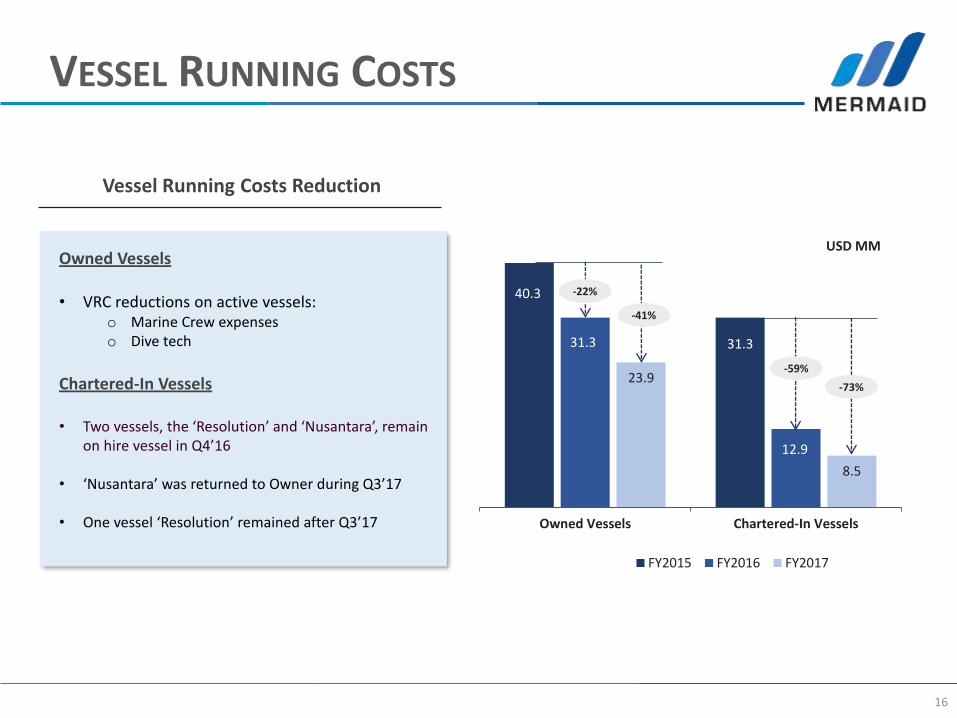
VESSEL RUNNING COSTS
16
Owned Vessels
• VRC reductions on active vessels:o Marine Crew expenseso Dive tech
Chartered-In Vessels
• Two vessels, the ‘Resolution’ and ‘Nusantara’, remain on hire vessel in Q4’16
• ‘Nusantara’ was returned to Owner during Q3’17
• One vessel ‘Resolution’ remained after Q3’17
Vessel Running Costs Reduction
40.3
31.331.3
12.9
23.9
8.5
Owned Vessels Chartered-In Vessels
USD MM
FY2015 FY2016 FY2017
-22%
-41%
-59%
-73%
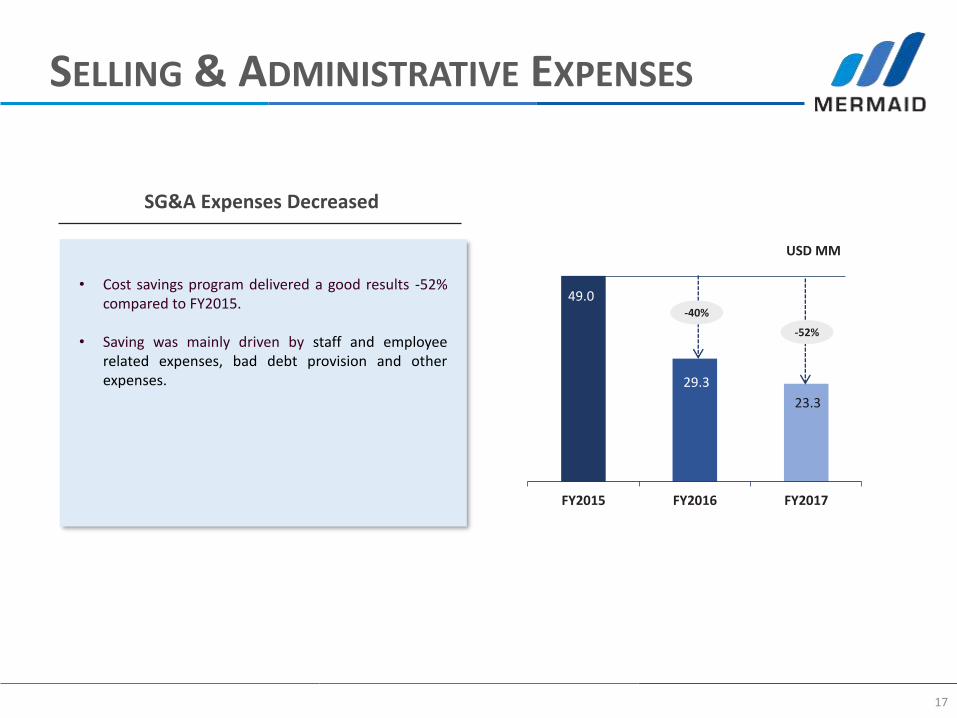
SELLING & ADMINISTRATIVE EXPENSES
17
• Cost savings program delivered a good results -52% compared to FY2015.
• Saving was mainly driven by staff and employee related expenses, bad debt provision and other expenses.
SG&A Expenses Decreased
49.0
29.3
23.3
FY2015 FY2016 FY2017
USD MM
-40%
-52%
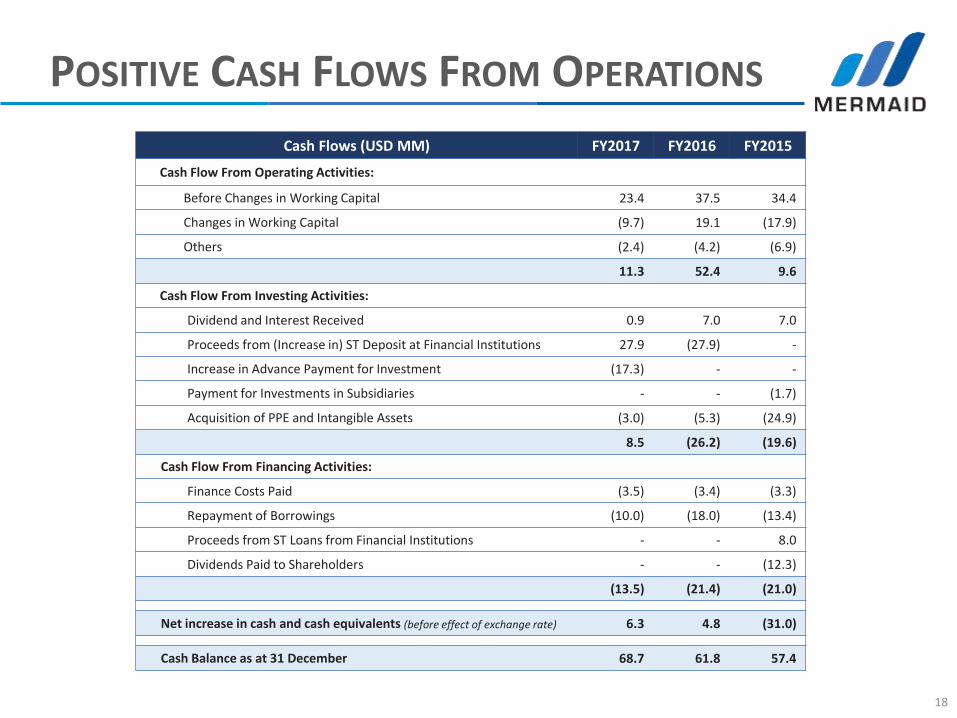
POSITIVE CASH FLOWS FROM OPERATIONS
18
Cash Flows (USD MM) FY2017 FY2016 FY2015
Cash Flow From Operating Activities:
Before Changes in Working Capital 23.4 37.5 34.4
Changes in Working Capital (9.7) 19.1 (17.9)
Others (2.4) (4.2) (6.9)
11.3 52.4 9.6
Cash Flow From Investing Activities:
Dividend and Interest Received 0.9 7.0 7.0
Proceeds from (Increase in) ST Deposit at Financial Institutions 27.9 (27.9) -
Increase in Advance Payment for Investment (17.3) - -
Payment for Investments in Subsidiaries - - (1.7)
Acquisition of PPE and Intangible Assets (3.0) (5.3) (24.9)
8.5 (26.2) (19.6)
Cash Flow From Financing Activities:
Finance Costs Paid (3.5) (3.4) (3.3)
Repayment of Borrowings (10.0) (18.0) (13.4)
Proceeds from ST Loans from Financial Institutions - - 8.0
Dividends Paid to Shareholders - - (12.3)
(13.5) (21.4) (21.0)
Net increase in cash and cash equivalents (before effect of exchange rate) 6.3 4.8 (31.0)
Cash Balance as at 31 December 68.7 61.8 57.4
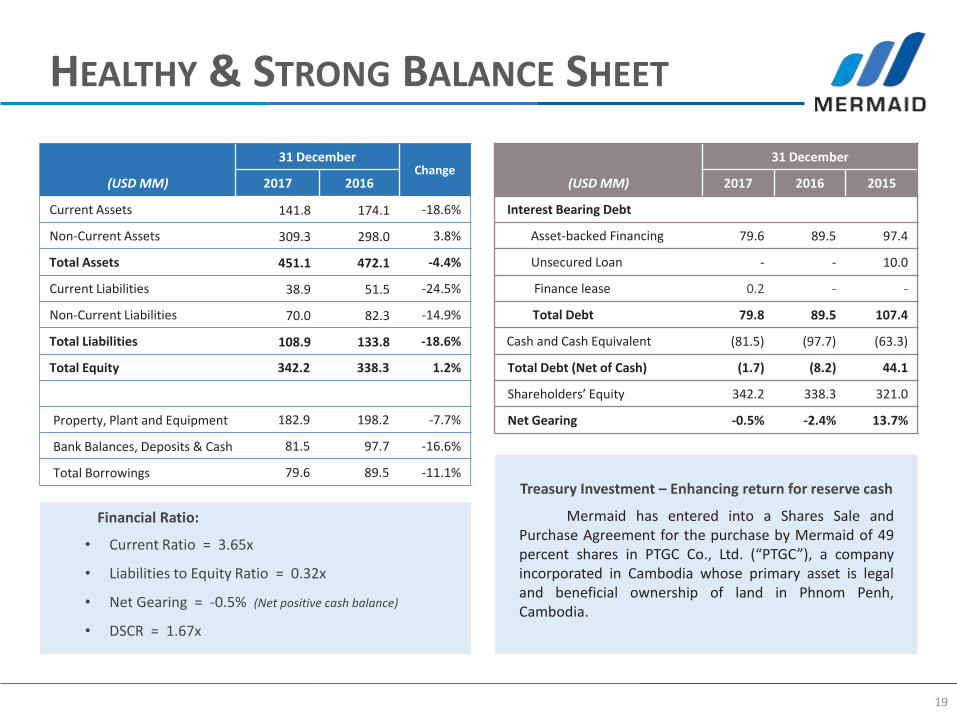
HEALTHY & STRONG BALANCE SHEET
19
(USD MM)
31 DecemberChange
2017 2016
Current Assets 141.8 174.1 -18.6%
Non-Current Assets 309.3 298.0 3.8%
Total Assets 451.1 472.1 -4.4%
Current Liabilities 38.9 51.5 -24.5%
Non-Current Liabilities 70.0 82.3 -14.9%
Total Liabilities 108.9 133.8 -18.6%
Total Equity 342.2 338.3 1.2%
Property, Plant and Equipment 182.9 198.2 -7.7%
Bank Balances, Deposits & Cash 81.5 97.7 -16.6%
Total Borrowings 79.6 89.5 -11.1%
(USD MM)
31 December
2017 2016 2015
Interest Bearing Debt
Asset-backed Financing 79.6 89.5 97.4
Unsecured Loan - - 10.0
Finance lease 0.2 - -
Total Debt 79.8 89.5 107.4
Cash and Cash Equivalent (81.5) (97.7) (63.3)
Total Debt (Net of Cash) (1.7) (8.2) 44.1
Shareholders’ Equity 342.2 338.3 321.0
Net Gearing -0.5% -2.4% 13.7%
Financial Ratio:
• Current Ratio = 3.65x
• Liabilities to Equity Ratio = 0.32x
• Net Gearing = -0.5% (Net positive cash balance)
• DSCR = 1.67x
Treasury Investment – Enhancing return for reserve cash
Mermaid has entered into a Shares Sale andPurchase Agreement for the purchase by Mermaid of 49percent shares in PTGC Co., Ltd. (“PTGC”), a companyincorporated in Cambodia whose primary asset is legaland beneficial ownership of land in Phnom Penh,Cambodia.
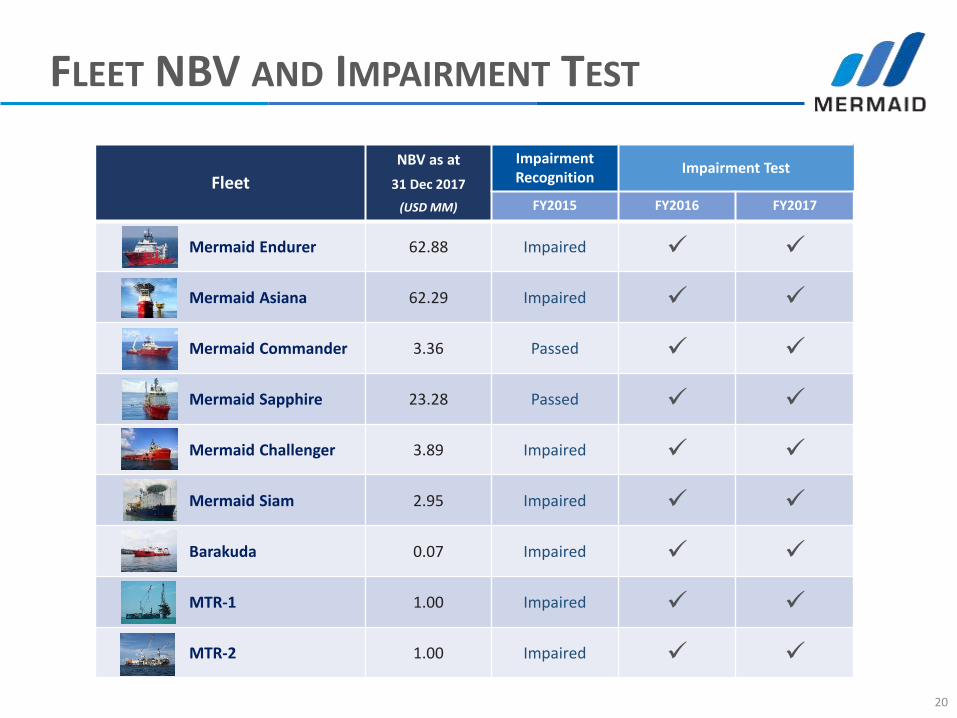
FLEET NBV AND IMPAIRMENT TEST
20
Fleet
NBV as at
31 Dec 2017
(USD MM)
Impairment Recognition
Impairment Test
FY2015 FY2016 FY2017
Mermaid Endurer 62.88 Impaired
Mermaid Asiana 62.29 Impaired
Mermaid Commander 3.36 Passed
Mermaid Sapphire 23.28 Passed
Mermaid Challenger 3.89 Impaired
Mermaid Siam 2.95 Impaired
Barakuda 0.07 Impaired
MTR-1 1.00 Impaired
MTR-2 1.00 Impaired
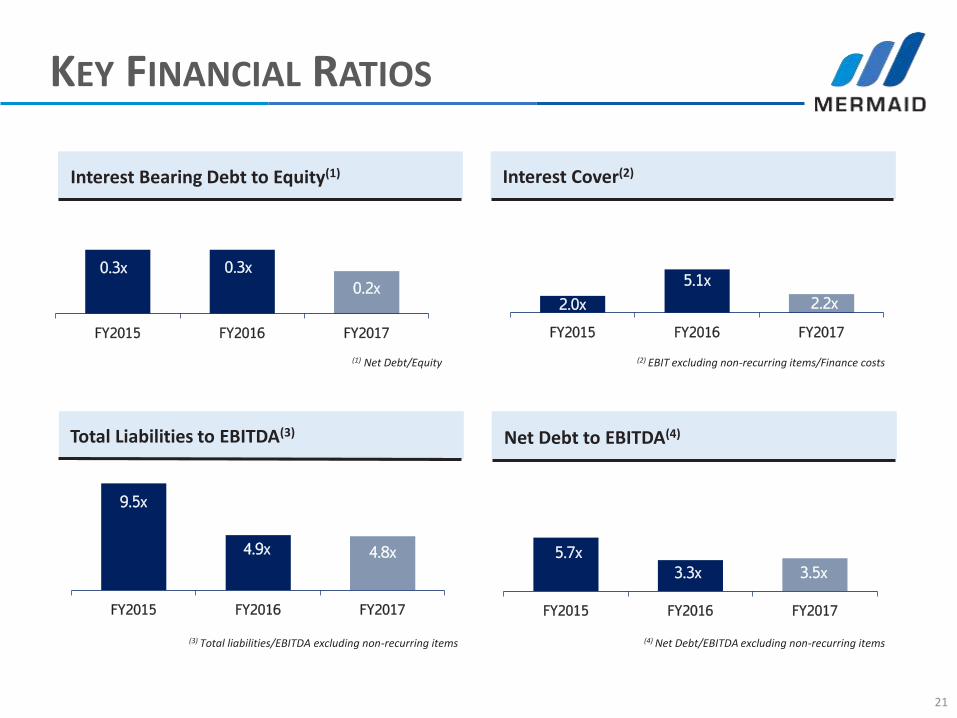
KEY FINANCIAL RATIOS
21
0.3x 0.3x
0.2x
FY2015 FY2016 FY2017
2.0x
5.1x
2.2x
FY2015 FY2016 FY2017
9.5x
4.9x 4.8x
FY2015 FY2016 FY2017
5.7x
3.3x 3.5x
FY2015 FY2016 FY2017
Interest Bearing Debt to Equity(1) Interest Cover(2)
Total Liabilities to EBITDA(3) Net Debt to EBITDA(4)
(4) Net Debt/EBITDA excluding non-recurring items
(2) EBIT excluding non-recurring items/Finance costs(1) Net Debt/Equity
(3) Total liabilities/EBITDA excluding non-recurring items
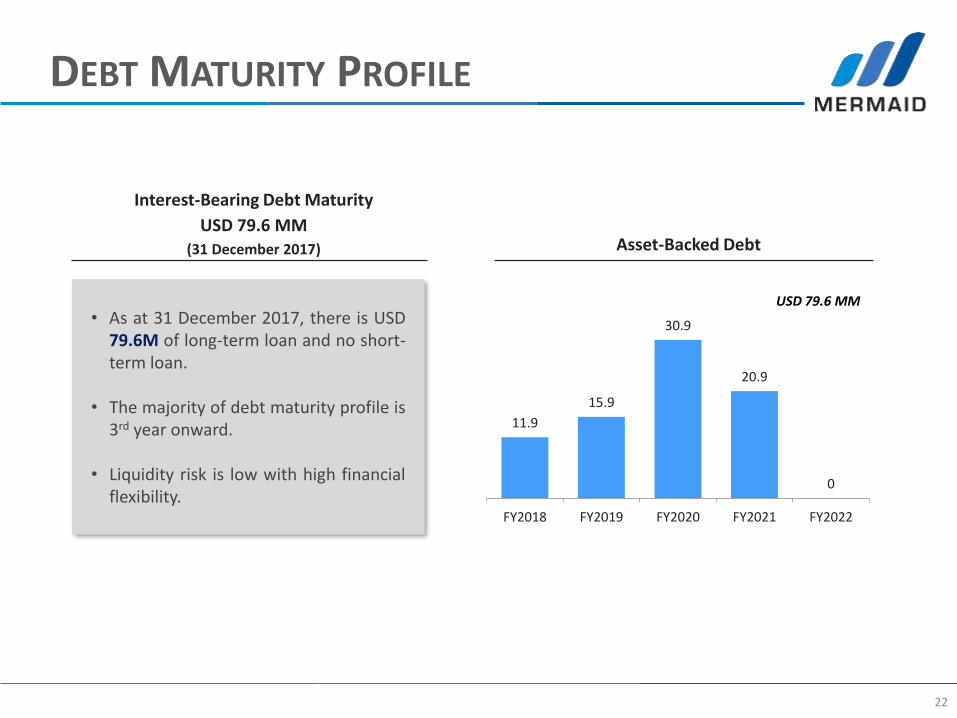
DEBT MATURITY PROFILE
22
11.9
15.9
30.9
20.9
0
FY2018 FY2019 FY2020 FY2021 FY2022
USD 79.6 MM• As at 31 December 2017, there is USD
79.6M of long-term loan and no short-term loan.
• The majority of debt maturity profile is3rd year onward.
• Liquidity risk is low with high financialflexibility.
Interest-Bearing Debt Maturity
USD 79.6 MM(31 December 2017) Asset-Backed Debt
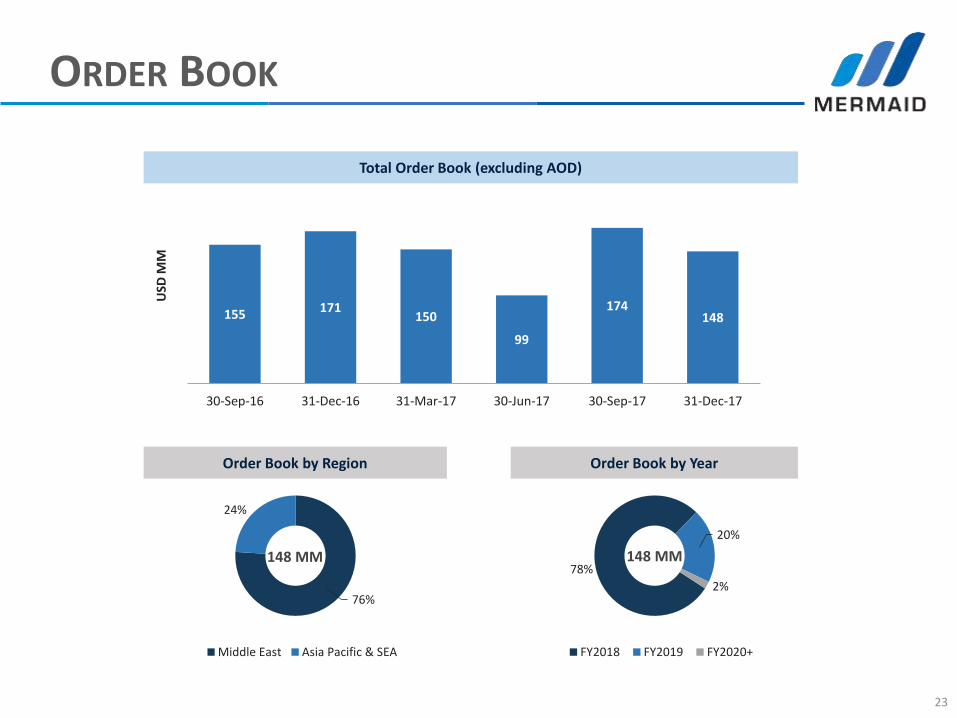
ORDER BOOK
23
155 171150
99
174148
30-Sep-16 31-Dec-16 31-Mar-17 30-Jun-17 30-Sep-17 31-Dec-17
USD
MM
76%
24%
Middle East Asia Pacific & SEA
148 MM
Total Order Book (excluding AOD)
Order Book by Region
78%
20%
2%
FY2018 FY2019 FY2020+
148 MM
Order Book by Year
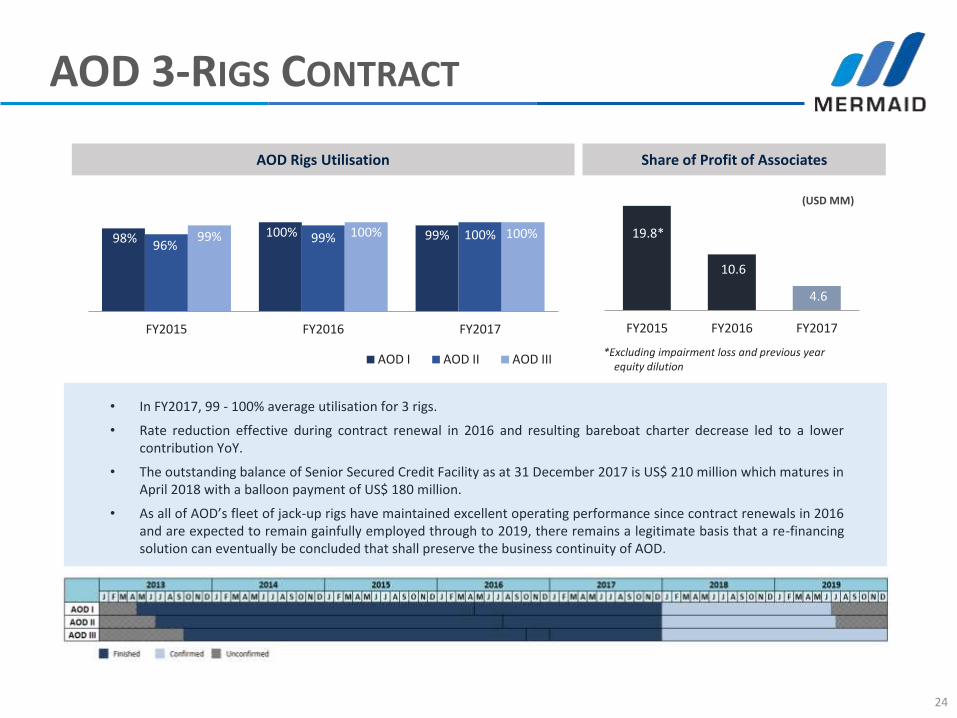
AOD 3-RIGS CONTRACT
24
Share of Profit of Associates
19.8*
10.6
4.6
FY2015 FY2016 FY2017
(USD MM)
AOD Rigs Utilisation
98% 100% 99% 96%
99% 100% 99% 100% 100%
FY2015 FY2016 FY2017
AOD I AOD II AOD III*Excluding impairment loss and previous year
equity dilution
• In FY2017, 99 - 100% average utilisation for 3 rigs.
• Rate reduction effective during contract renewal in 2016 and resulting bareboat charter decrease led to a lower contribution YoY.
• The outstanding balance of Senior Secured Credit Facility as at 31 December 2017 is US$ 210 million which matures in April 2018 with a balloon payment of US$ 180 million.
• As all of AOD’s fleet of jack-up rigs have maintained excellent operating performance since contract renewals in 2016 and are expected to remain gainfully employed through to 2019, there remains a legitimate basis that a re-financing solution can eventually be concluded that shall preserve the business continuity of AOD.
SUSTAINABILITY REPORT
25
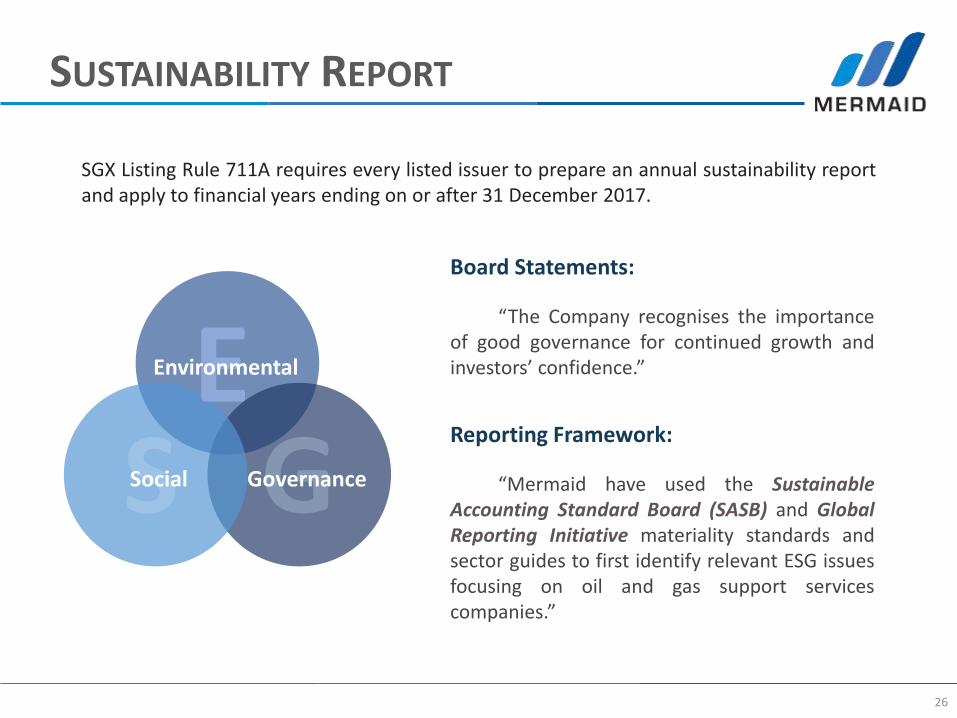
SUSTAINABILITY REPORT
26
Board Statements:
“The Company recognises the importanceof good governance for continued growth andinvestors’ confidence.”
Reporting Framework:
“Mermaid have used the SustainableAccounting Standard Board (SASB) and GlobalReporting Initiative materiality standards andsector guides to first identify relevant ESG issuesfocusing on oil and gas support servicescompanies.”
EEnvironmental
SSocial GGovernance
SGX Listing Rule 711A requires every listed issuer to prepare an annual sustainability reportand apply to financial years ending on or after 31 December 2017.
SUSTAINABILITY REPORT
27
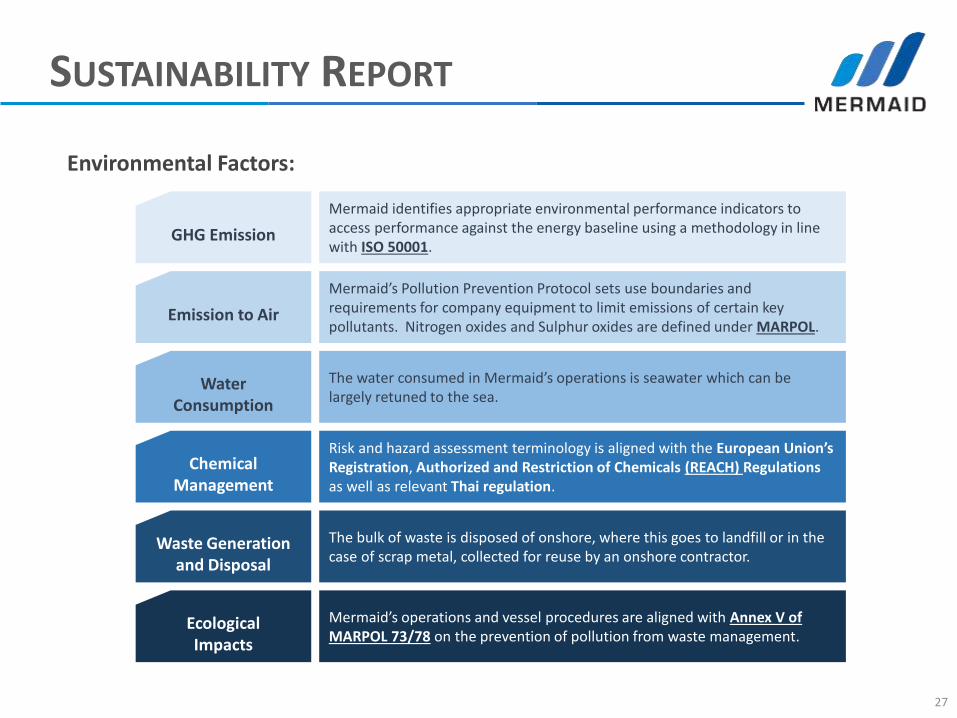
Environmental Factors:
GHG Emission
Mermaid identifies appropriate environmental performance indicators to access performance against the energy baseline using a methodology in line with ISO 50001.
Emission to Air
Mermaid’s Pollution Prevention Protocol sets use boundaries and requirements for company equipment to limit emissions of certain key pollutants. Nitrogen oxides and Sulphur oxides are defined under MARPOL.
Water Consumption
The water consumed in Mermaid’s operations is seawater which can be largely retuned to the sea.
Chemical Management
Risk and hazard assessment terminology is aligned with the European Union’s Registration, Authorized and Restriction of Chemicals (REACH) Regulations as well as relevant Thai regulation.
Waste Generation and Disposal
The bulk of waste is disposed of onshore, where this goes to landfill or in the case of scrap metal, collected for reuse by an onshore contractor.
Ecological Impacts
Mermaid’s operations and vessel procedures are aligned with Annex V of MARPOL 73/78 on the prevention of pollution from waste management.
SUSTAINABILITY REPORT
28
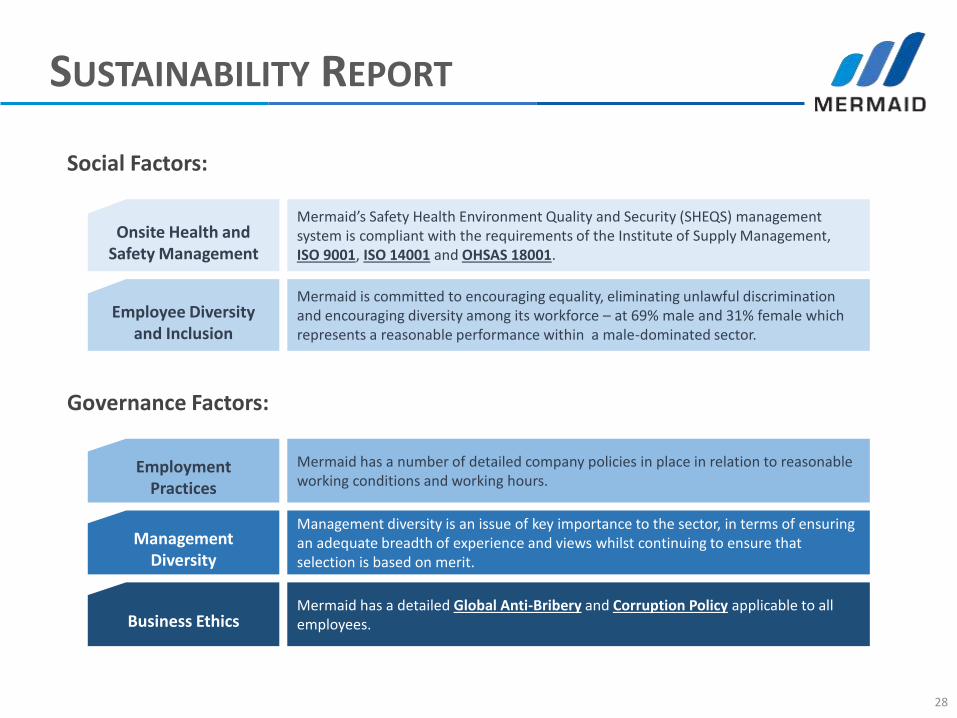
Social Factors:
Onsite Health and Safety Management
Mermaid’s Safety Health Environment Quality and Security (SHEQS) management system is compliant with the requirements of the Institute of Supply Management, ISO 9001, ISO 14001 and OHSAS 18001.
Employee Diversity and Inclusion
Mermaid is committed to encouraging equality, eliminating unlawful discrimination and encouraging diversity among its workforce – at 69% male and 31% female which represents a reasonable performance within a male-dominated sector.
Employment Practices
Mermaid has a number of detailed company policies in place in relation to reasonable working conditions and working hours.
Management Diversity
Management diversity is an issue of key importance to the sector, in terms of ensuring an adequate breadth of experience and views whilst continuing to ensure that selection is based on merit.
Governance Factors:
Business EthicsMermaid has a detailed Global Anti-Bribery and Corruption Policy applicable to all employees.
SUSTAINABILITY REPORT
29
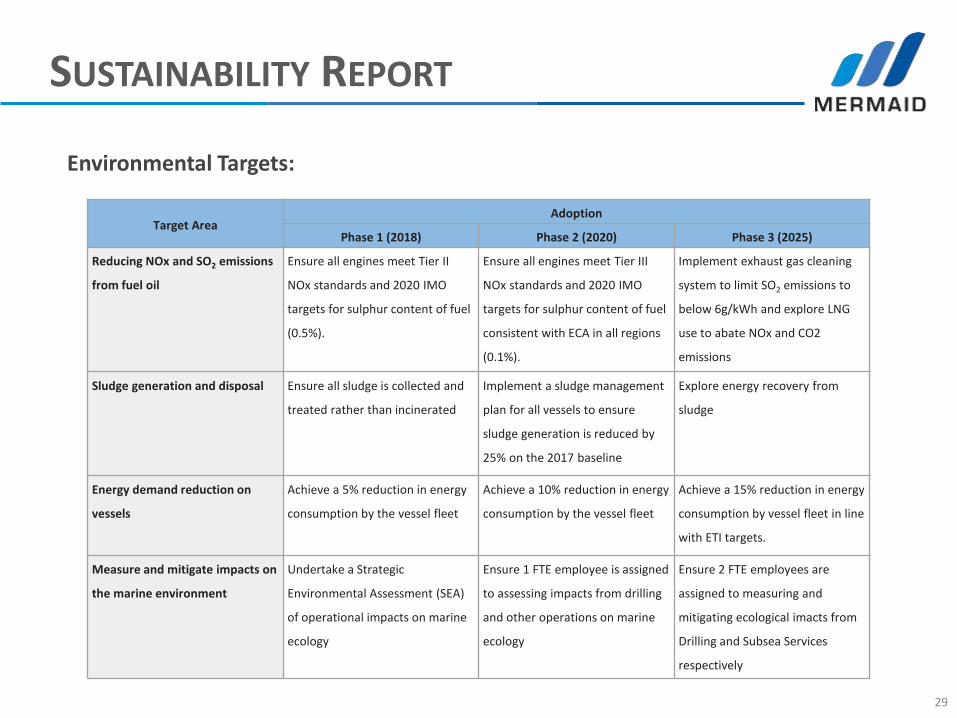
Environmental Targets:
Target Area Adoption
Phase 1 (2018) Phase 2 (2020) Phase 3 (2025)
Reducing NOx and SO2 emissions
from fuel oil
Ensure all engines meet Tier II
NOx standards and 2020 IMO
targets for sulphur content of fuel
(0.5%).
Ensure all engines meet Tier III
NOx standards and 2020 IMO
targets for sulphur content of fuel
consistent with ECA in all regions
(0.1%).
Implement exhaust gas cleaning
system to limit SO2 emissions to
below 6g/kWh and explore LNG
use to abate NOx and CO2
emissions
Sludge generation and disposal Ensure all sludge is collected and
treated rather than incinerated
Implement a sludge management
plan for all vessels to ensure
sludge generation is reduced by
25% on the 2017 baseline
Explore energy recovery from
sludge
Energy demand reduction on
vessels
Achieve a 5% reduction in energy
consumption by the vessel fleet
Achieve a 10% reduction in energy
consumption by the vessel fleet
Achieve a 15% reduction in energy
consumption by vessel fleet in line
with ETI targets.
Measure and mitigate impacts on
the marine environment
Undertake a Strategic
Environmental Assessment (SEA)
of operational impacts on marine
ecology
Ensure 1 FTE employee is assigned
to assessing impacts from drilling
and other operations on marine
ecology
Ensure 2 FTE employees are
assigned to measuring and
mitigating ecological imacts from
Drilling and Subsea Services
respectively
SUSTAINABILITY REPORT
30
Social and Governance Targets:
Target Area Adoption
Phase 1 (2018) Phase 2 (2020) Phase 3 (2025)
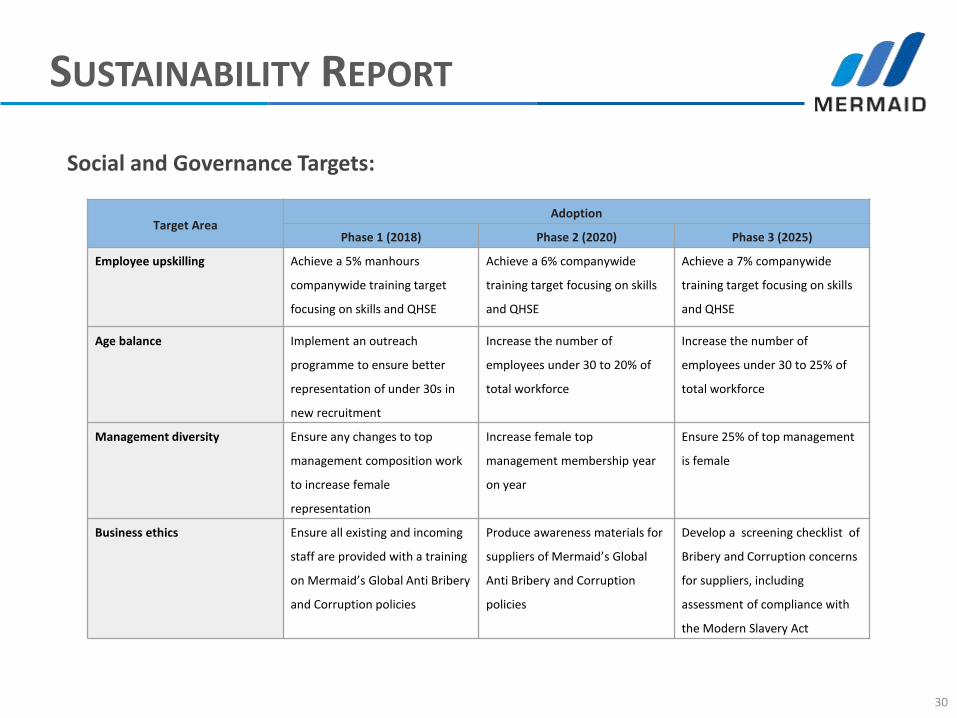
Employee upskilling Achieve a 5% manhours
companywide training target
focusing on skills and QHSE
Achieve a 6% companywide
training target focusing on skills
and QHSE
Achieve a 7% companywide
training target focusing on skills
and QHSE
Age balance Implement an outreach
programme to ensure better
representation of under 30s in
new recruitment
Increase the number of
employees under 30 to 20% of
total workforce
Increase the number of
employees under 30 to 25% of
total workforce
Management diversity Ensure any changes to top
management composition work
to increase female
representation
Increase female top
management membership year
on year
Ensure 25% of top management
is female
Business ethics Ensure all existing and incoming
staff are provided with a training
on Mermaid’s Global Anti Bribery
and Corruption policies
Produce awareness materials for
suppliers of Mermaid’s Global
Anti Bribery and Corruption
policies
Develop a screening checklist of
Bribery and Corruption concerns
for suppliers, including
assessment of compliance with
the Modern Slavery Act
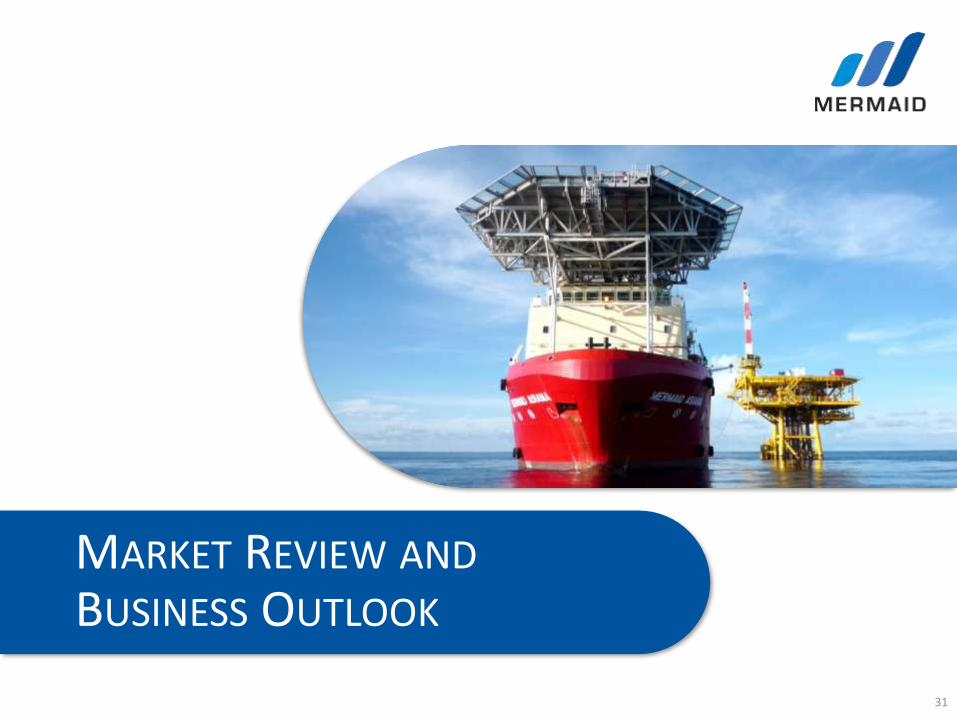
MARKET REVIEW AND
BUSINESS OUTLOOK
31
MARKET REVIEW
32
16%
15%
39%
15%
15%Pipelay
Subsea Vessel (Greenfield)
Subsea Vessel (IRM)
SURF
Well Intervention
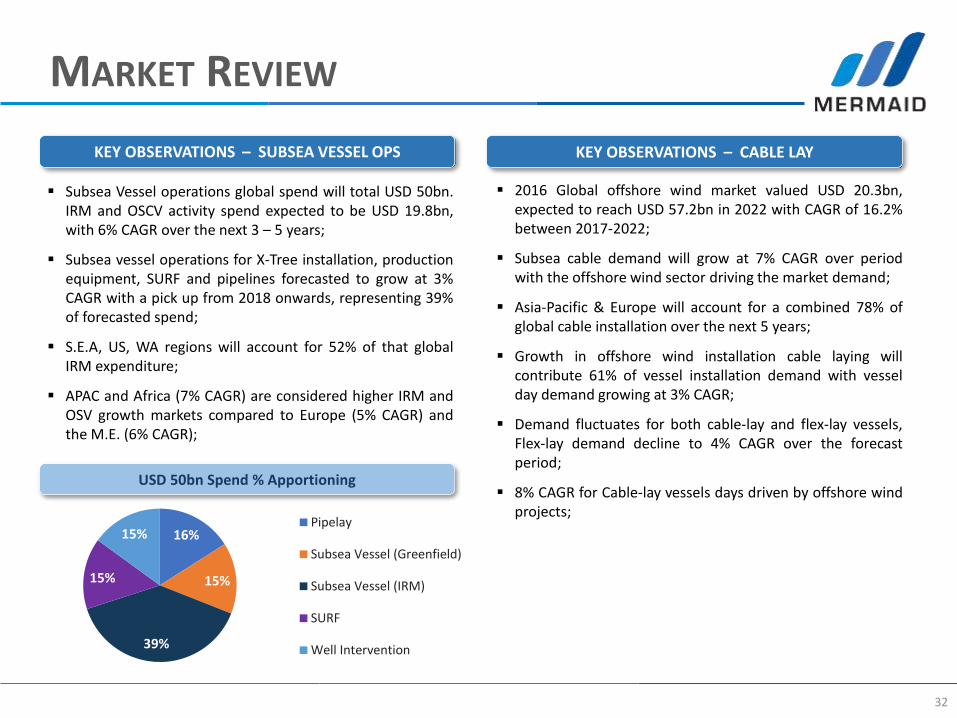
KEY OBSERVATIONS – SUBSEA VESSEL OPS
Subsea Vessel operations global spend will total USD 50bn.IRM and OSCV activity spend expected to be USD 19.8bn,with 6% CAGR over the next 3 – 5 years;
Subsea vessel operations for X-Tree installation, productionequipment, SURF and pipelines forecasted to grow at 3%CAGR with a pick up from 2018 onwards, representing 39%of forecasted spend;
S.E.A, US, WA regions will account for 52% of that globalIRM expenditure;
APAC and Africa (7% CAGR) are considered higher IRM andOSV growth markets compared to Europe (5% CAGR) andthe M.E. (6% CAGR);
2016 Global offshore wind market valued USD 20.3bn,expected to reach USD 57.2bn in 2022 with CAGR of 16.2%between 2017-2022;
Subsea cable demand will grow at 7% CAGR over periodwith the offshore wind sector driving the market demand;
Asia-Pacific & Europe will account for a combined 78% ofglobal cable installation over the next 5 years;
Growth in offshore wind installation cable laying willcontribute 61% of vessel installation demand with vesselday demand growing at 3% CAGR;
Demand fluctuates for both cable-lay and flex-lay vessels,Flex-lay demand decline to 4% CAGR over the forecastperiod;
8% CAGR for Cable-lay vessels days driven by offshore windprojects;
KEY OBSERVATIONS – CABLE LAY
USD 50bn Spend % Apportioning
MARKET REVIEW
33
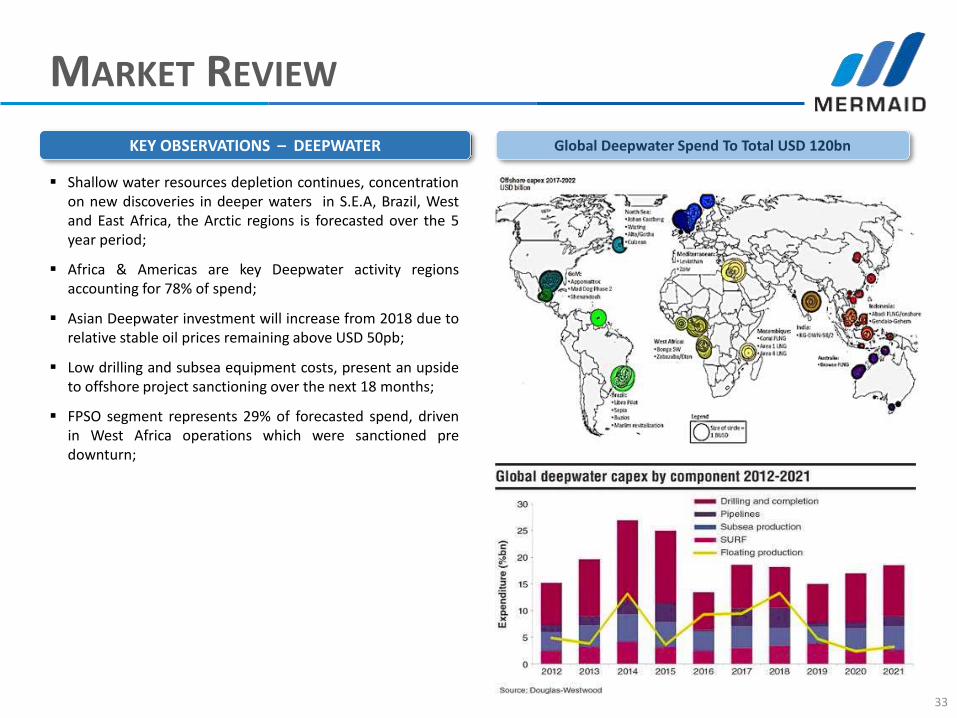
KEY OBSERVATIONS – DEEPWATER
Shallow water resources depletion continues, concentrationon new discoveries in deeper waters in S.E.A, Brazil, Westand East Africa, the Arctic regions is forecasted over the 5year period;
Africa & Americas are key Deepwater activity regionsaccounting for 78% of spend;
Asian Deepwater investment will increase from 2018 due torelative stable oil prices remaining above USD 50pb;
Low drilling and subsea equipment costs, present an upsideto offshore project sanctioning over the next 18 months;
FPSO segment represents 29% of forecasted spend, drivenin West Africa operations which were sanctioned predownturn;
Global Deepwater Spend To Total USD 120bn
BUSINESS OUTLOOK
34
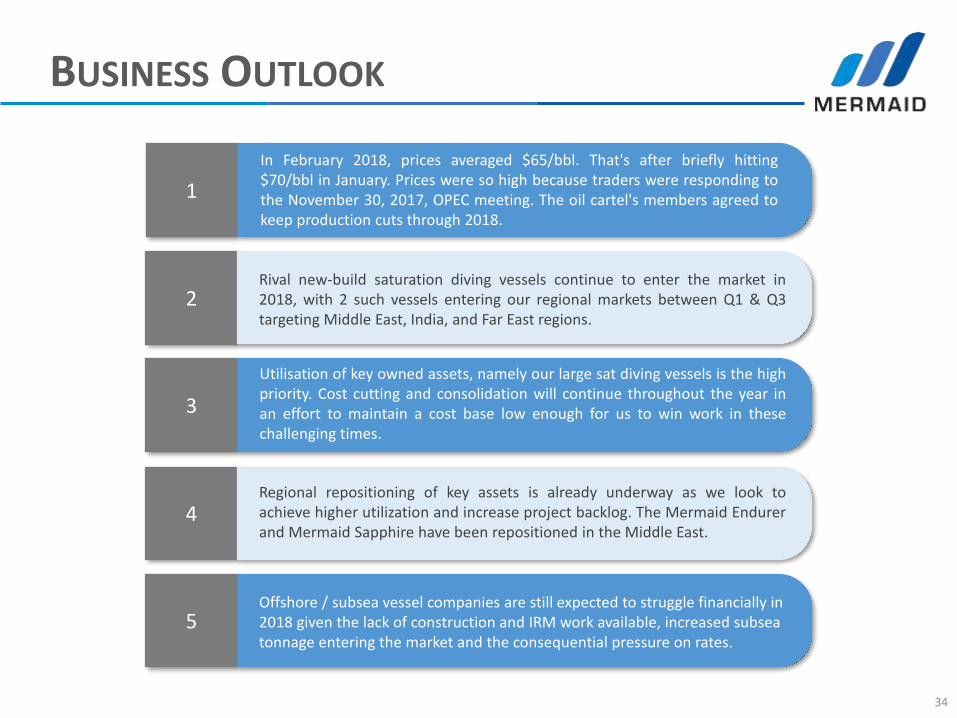
1
In February 2018, prices averaged $65/bbl. That's after briefly hitting$70/bbl in January. Prices were so high because traders were responding tothe November 30, 2017, OPEC meeting. The oil cartel's members agreed tokeep production cuts through 2018.
2Rival new-build saturation diving vessels continue to enter the market in2018, with 2 such vessels entering our regional markets between Q1 & Q3targeting Middle East, India, and Far East regions.
3
Utilisation of key owned assets, namely our large sat diving vessels is the highpriority. Cost cutting and consolidation will continue throughout the year inan effort to maintain a cost base low enough for us to win work in thesechallenging times.
4Regional repositioning of key assets is already underway as we look toachieve higher utilization and increase project backlog. The Mermaid Endurerand Mermaid Sapphire have been repositioned in the Middle East.
5Offshore / subsea vessel companies are still expected to struggle financially in 2018 given the lack of construction and IRM work available, increased subsea tonnage entering the market and the consequential pressure on rates.
BUSINESS OUTLOOK
35
6
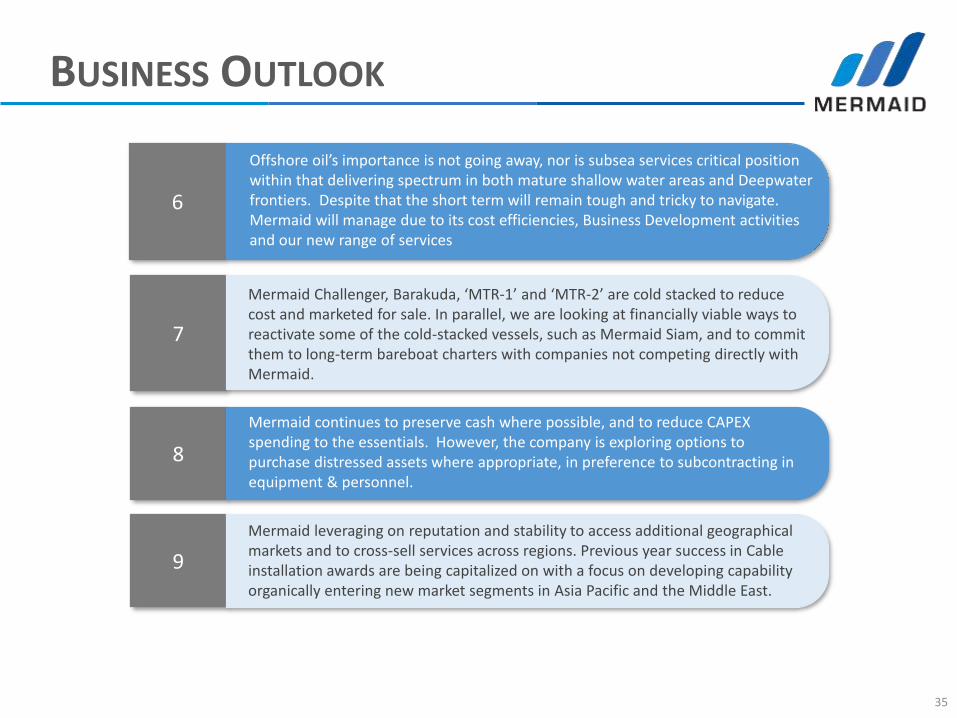
Offshore oil’s importance is not going away, nor is subsea services critical position within that delivering spectrum in both mature shallow water areas and Deepwater frontiers. Despite that the short term will remain tough and tricky to navigate. Mermaid will manage due to its cost efficiencies, Business Development activities and our new range of services
7
Mermaid Challenger, Barakuda, ‘MTR-1’ and ‘MTR-2’ are cold stacked to reduce cost and marketed for sale. In parallel, we are looking at financially viable ways to reactivate some of the cold-stacked vessels, such as Mermaid Siam, and to commit them to long-term bareboat charters with companies not competing directly with Mermaid.
8
Mermaid continues to preserve cash where possible, and to reduce CAPEX spending to the essentials. However, the company is exploring options to purchase distressed assets where appropriate, in preference to subcontracting in equipment & personnel.
9
Mermaid leveraging on reputation and stability to access additional geographical markets and to cross-sell services across regions. Previous year success in Cable installation awards are being capitalized on with a focus on developing capability organically entering new market segments in Asia Pacific and the Middle East.
MERMAID’S POSITIONING
36
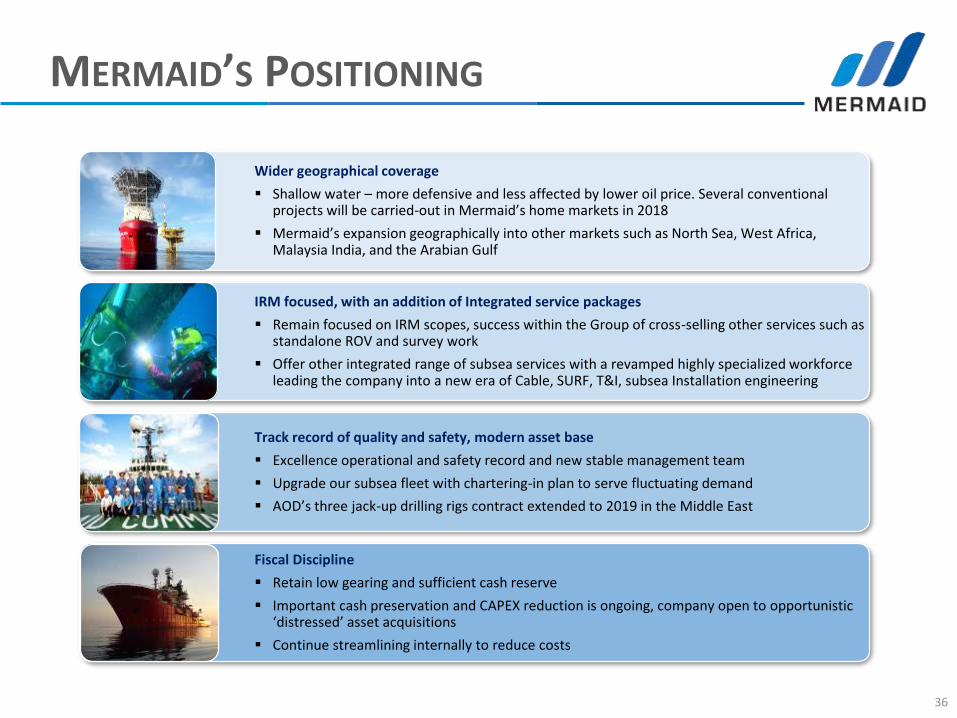
Wider geographical coverage
Shallow water – more defensive and less affected by lower oil price. Several conventional projects will be carried-out in Mermaid’s home markets in 2018
Mermaid’s expansion geographically into other markets such as North Sea, West Africa, Malaysia India, and the Arabian Gulf
IRM focused, with an addition of Integrated service packages
Remain focused on IRM scopes, success within the Group of cross-selling other services such as standalone ROV and survey work
Offer other integrated range of subsea services with a revamped highly specialized workforce leading the company into a new era of Cable, SURF, T&I, subsea Installation engineering
Track record of quality and safety, modern asset base
Excellence operational and safety record and new stable management team
Upgrade our subsea fleet with chartering-in plan to serve fluctuating demand
AOD’s three jack-up drilling rigs contract extended to 2019 in the Middle East
Fiscal Discipline
Retain low gearing and sufficient cash reserve
Important cash preservation and CAPEX reduction is ongoing, company open to opportunistic ‘distressed’ asset acquisitions
Continue streamlining internally to reduce costs
A Company Moving Forward
www.mermaid-group.com