Embed Size (px)
Citation preview

2018 Major League Baseball Florida Spring Training
Economic Impact StudyJoseph St. Germain, Ph.D.
Phillip Downs, Ph.D.Rachael Anglin

Introduction
2
Goals• Determine overall economic impact, jobs
supported, and associated wages for the state of Florida for all non-local attendees* of MLB Florida Spring Training
• Determine overall economic impact, jobs supported, and associated wages of MLB Florida Spring Training team operating, facilities, and concessions expenditures
3
* Live outside the county in which a game is played

Executive Summary
4
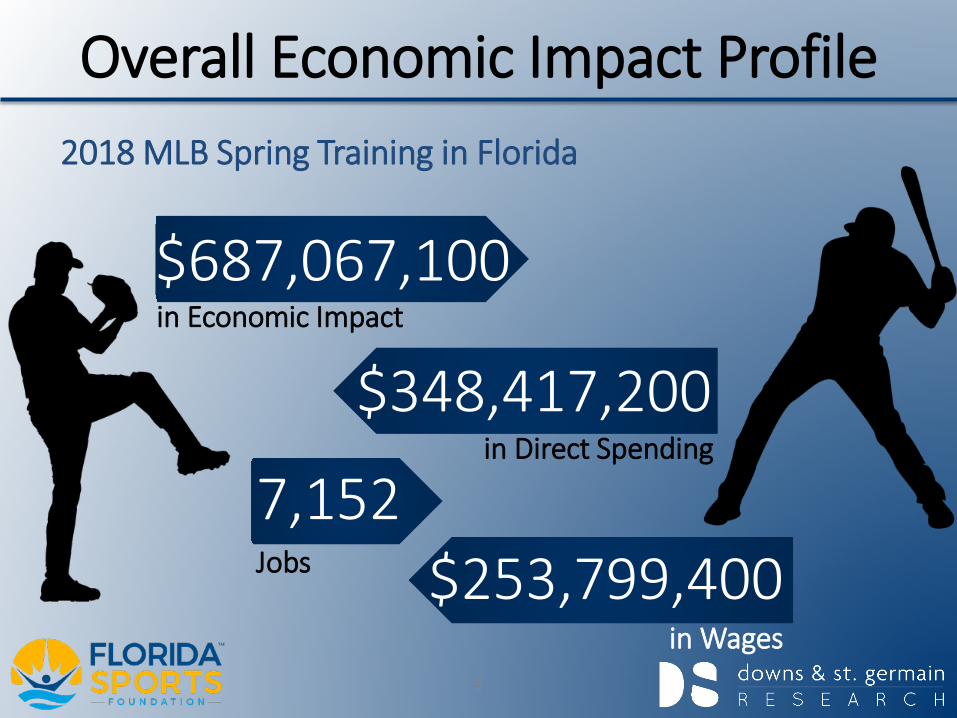
Overall Economic Impact Profile
in Economic Impact
in Wages
$687,067,100
Jobs
7,152$253,799,400
5
in Direct Spending$348,417,200
2018 MLB Spring Training in Florida
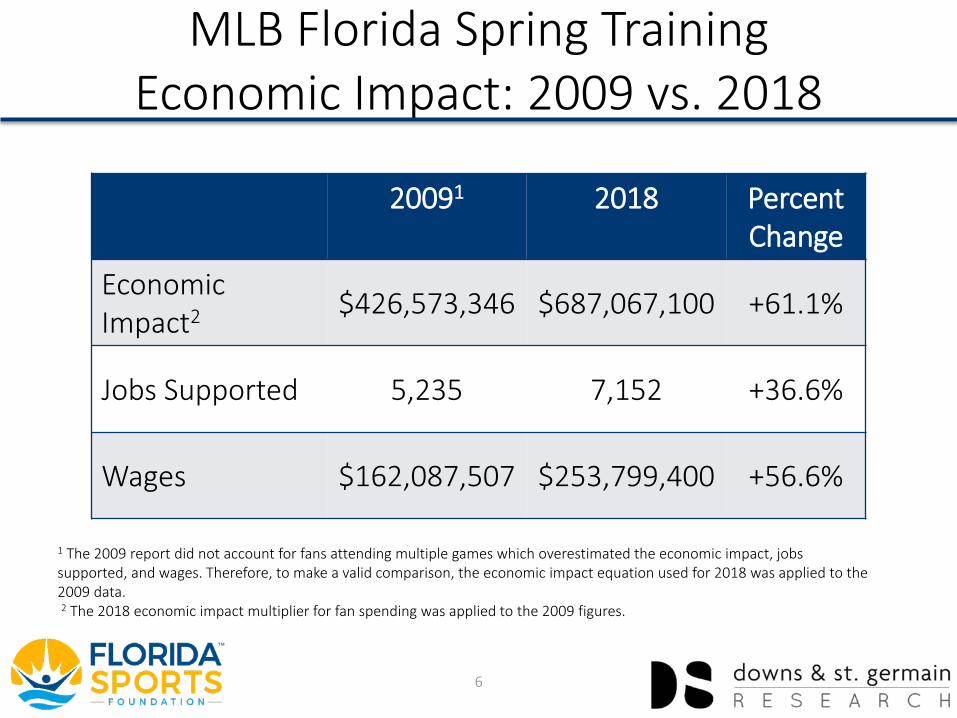
MLB Florida Spring Training Economic Impact: 2009 vs. 2018
20091 2018 Percent Change
Economic Impact2 $426,573,346 $687,067,100 +61.1%
Jobs Supported 5,235 7,152 +36.6%
Wages $162,087,507 $253,799,400 +56.6%
6
1 The 2009 report did not account for fans attending multiple games which overestimated the economic impact, jobs supported, and wages. Therefore, to make a valid comparison, the economic impact equation used for 2018 was applied to the 2009 data.2 The 2018 economic impact multiplier for fan spending was applied to the 2009 figures.

Economic Impact Profile – All Fan Spending
in Economic Impact
in Wages
$583,978,800
Jobs
6,084$214,306,300
7
in Direct Spending$296,436,000
2018 MLB Spring Training in Florida
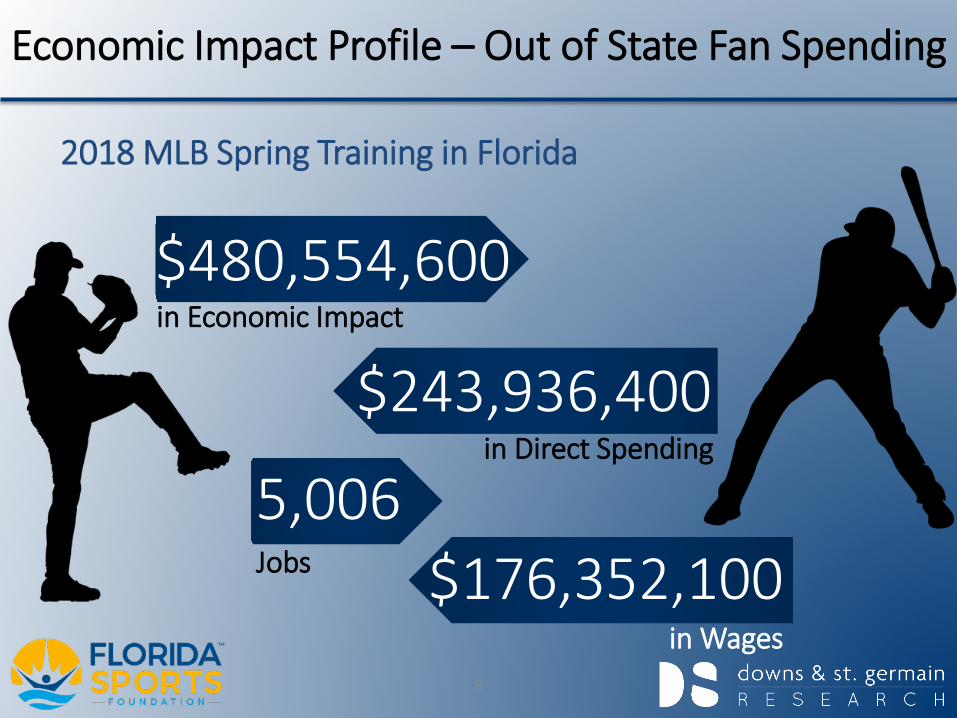
Economic Impact Profile – Out of State Fan Spending
in Economic Impact
in Wages
$480,554,600
Jobs
5,006$176,352,100
8
in Direct Spending$243,936,400
2018 MLB Spring Training in Florida
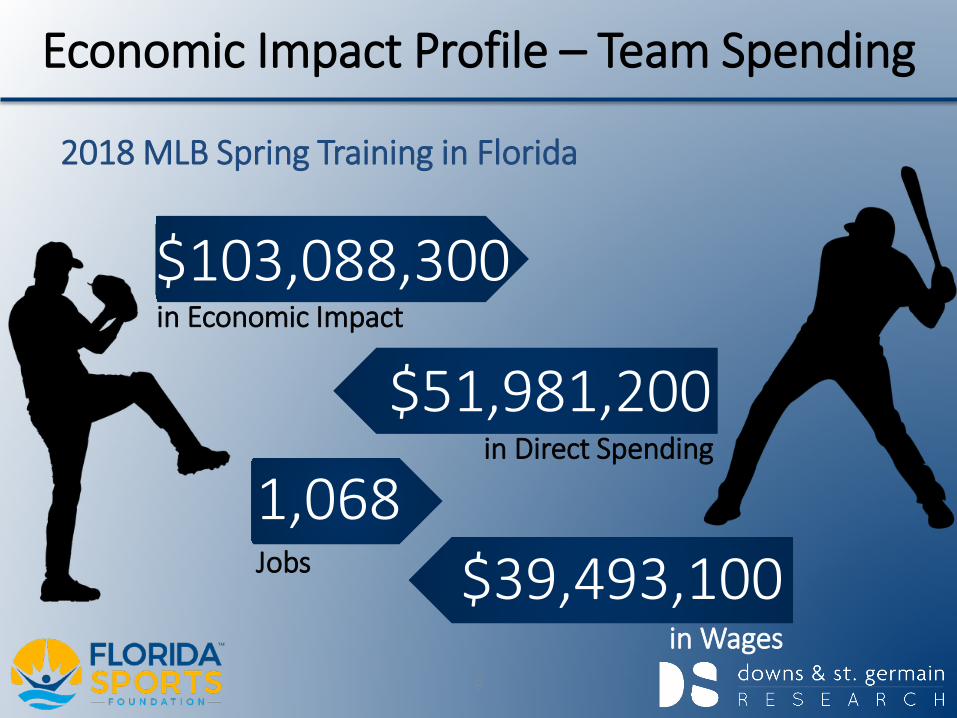
Economic Impact Profile – Team Spending
in Economic Impact
in Wages
$103,088,300
Jobs
1,068$39,493,100
9
in Direct Spending$51,981,200
2018 MLB Spring Training in Florida
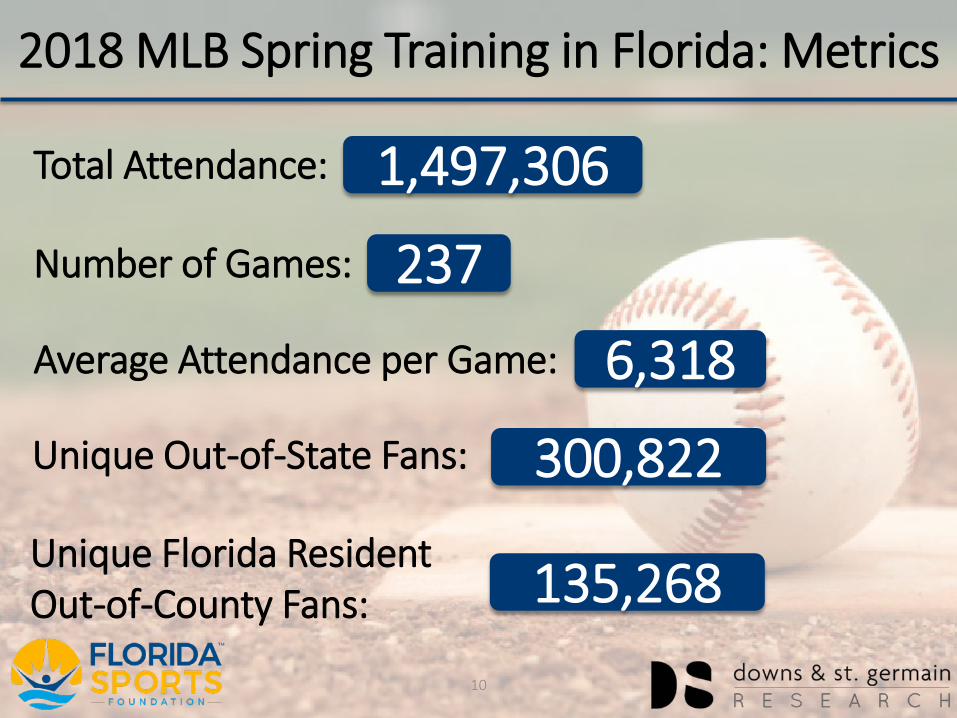
1,497,306
10
237
6,318
300,822
Total Attendance:
Average Attendance per Game:
Unique Out-of-State Fans:
Number of Games:
2018 MLB Spring Training in Florida: Metrics
Unique Florida ResidentOut-of-County Fans: 135,268
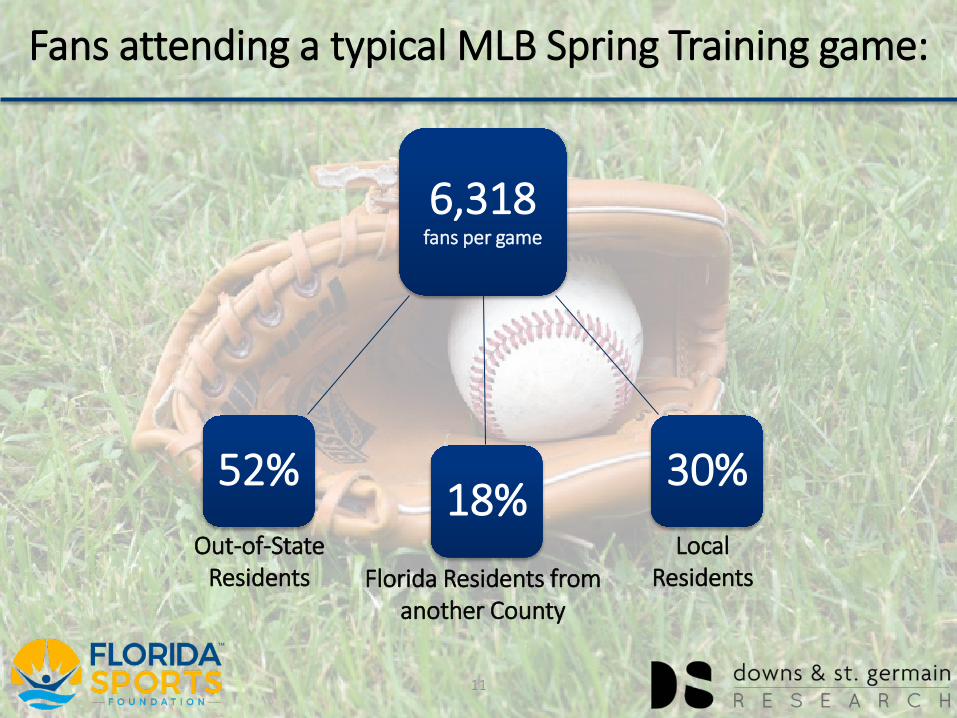
6,318fans per game
18%30%52%
11
Florida Residents from another County
Local Residents
Out-of-State Residents
Fans attending a typical MLB Spring Training game:
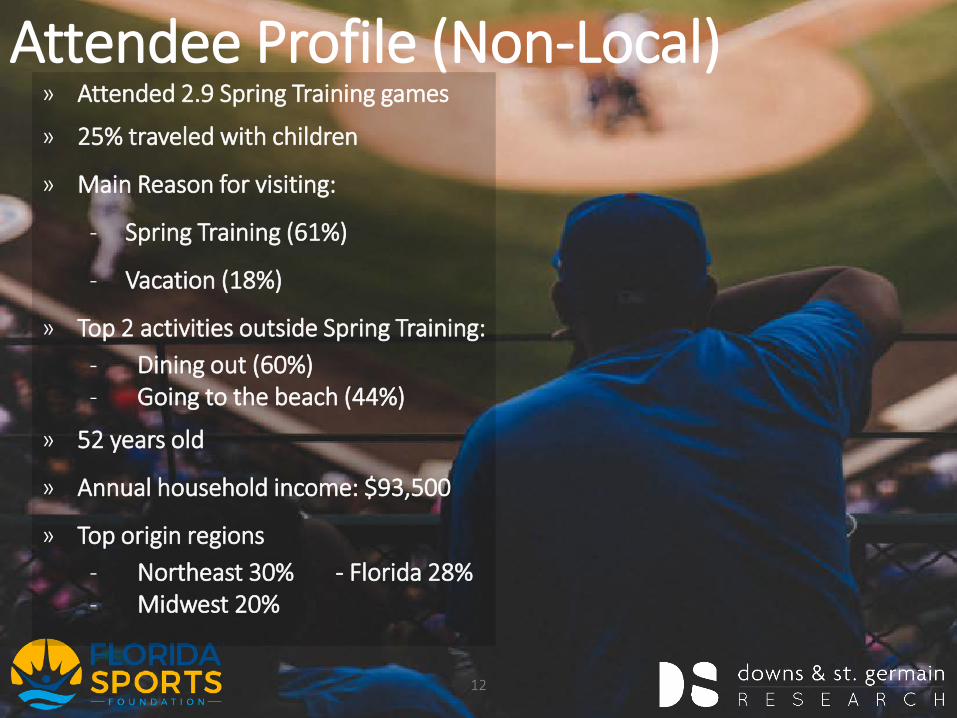
Attendee Profile (Non-Local)» Attended 2.9 Spring Training games
» 25% traveled with children
» Main Reason for visiting:
- Spring Training (61%)
- Vacation (18%)
» Top 2 activities outside Spring Training:- Dining out (60%)- Going to the beach (44%)
» 52 years old
» Annual household income: $93,500
» Top origin regions- Northeast 30% - Florida 28%- Midwest 20%
12
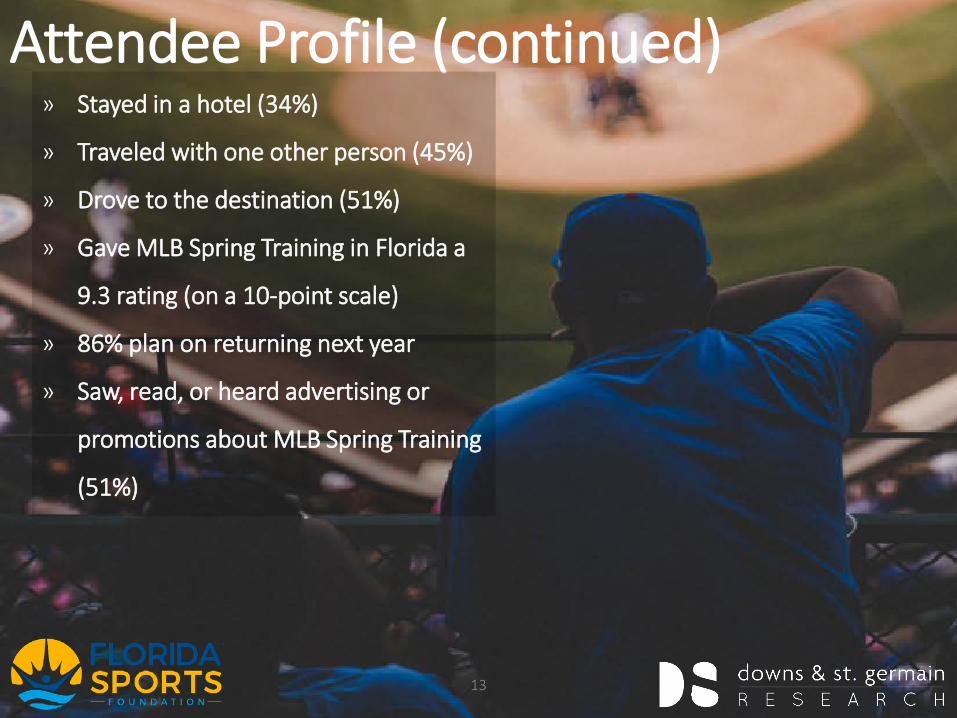
Attendee Profile (continued)» Stayed in a hotel (34%)
» Traveled with one other person (45%)
» Drove to the destination (51%)
» Gave MLB Spring Training in Florida a
9.3 rating (on a 10-point scale)
» 86% plan on returning next year
» Saw, read, or heard advertising or
promotions about MLB Spring Training
(51%)
13
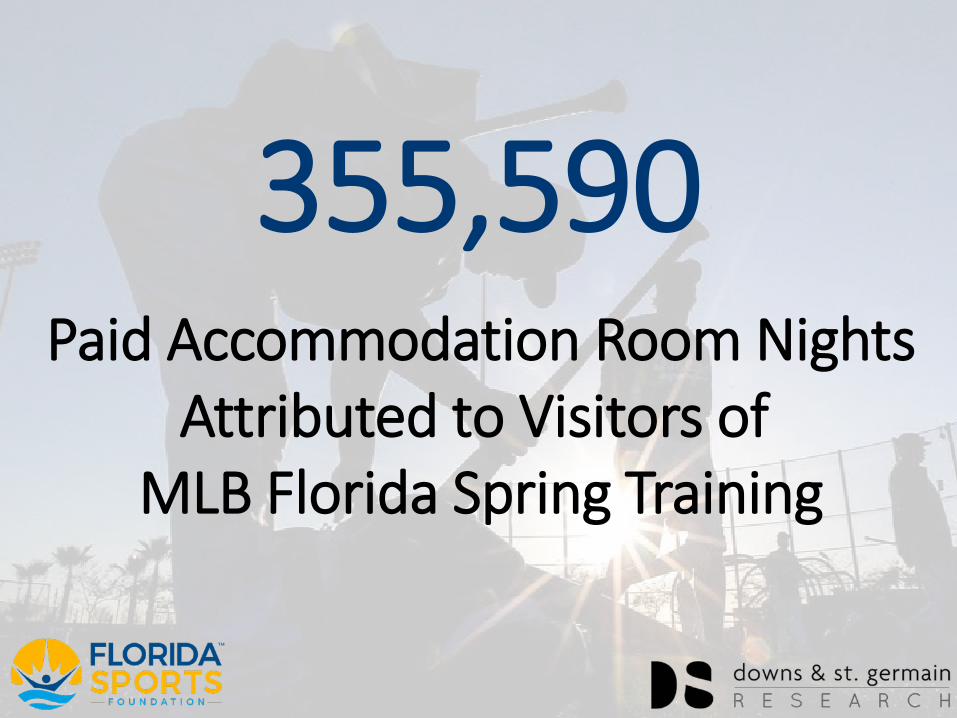
Paid Accommodation Room NightsAttributed to Visitors of
MLB Florida Spring Training
355,590
Detailed Findings
15

Economic Impact – Fan Spending
16
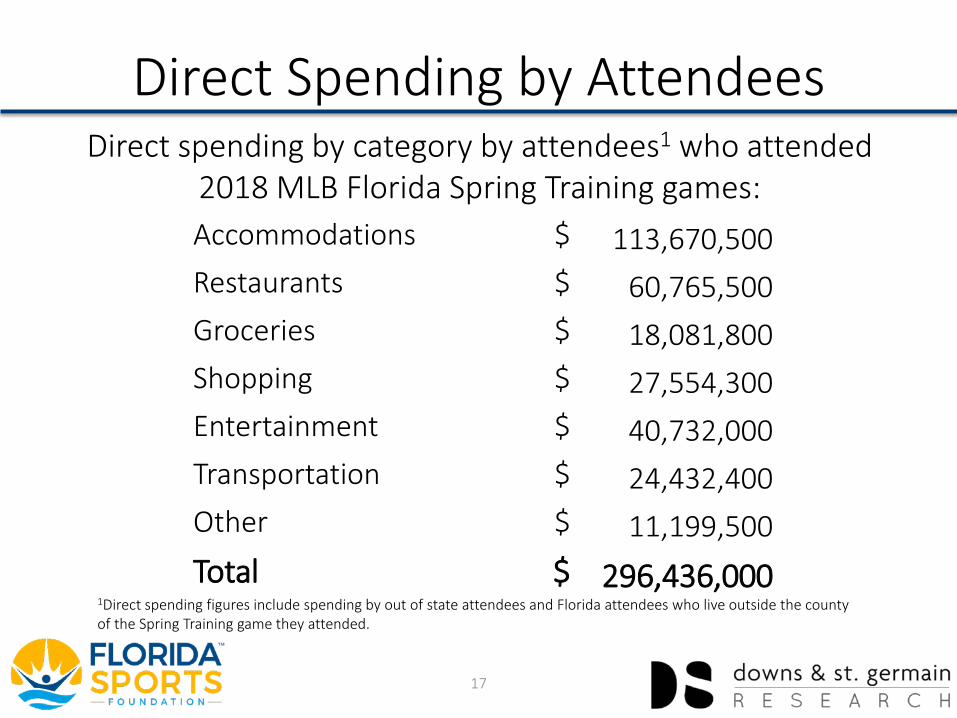
Direct Spending by AttendeesDirect spending by category by attendees1 who attended
2018 MLB Florida Spring Training games:Accommodations $ 113,670,500 Restaurants $ 60,765,500 Groceries $ 18,081,800 Shopping $ 27,554,300 Entertainment $ 40,732,000 Transportation $ 24,432,400 Other $ 11,199,500Total $ 296,436,000
1Direct spending figures include spending by out of state attendees and Florida attendees who live outside the county of the Spring Training game they attended.
17
MLB Florida Spring Training Attendee TypesOne of the goals established by the Florida Sports Foundation for this study was to examine the economic impact of the following 4 types of fans:1. Out of State Attendees: Primary trip purpose Spring Training2. Out of State Attendees: Primary trip purpose other3. Florida Resident, Non-County Attendees: Primary trip purpose Spring Training4. Florida Resident, Non-County Attendees: Primary trip purpose otherSlides 17 through 29 show results for these 4 types of attendees.
18
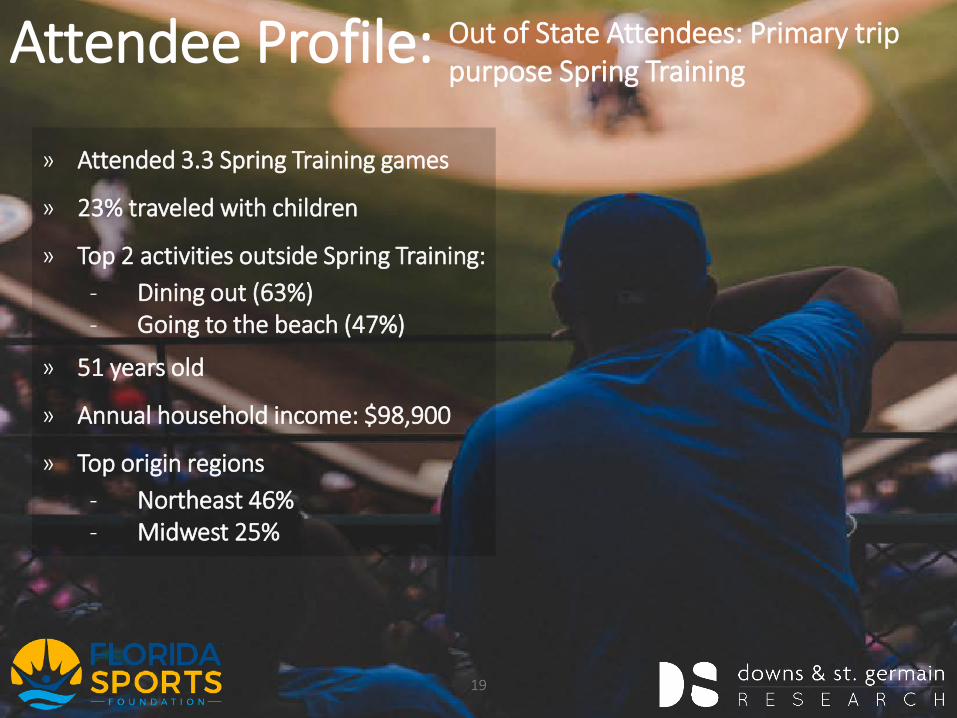
Out of State Attendees: Primary trip purpose Spring TrainingAttendee Profile:
» Attended 3.3 Spring Training games
» 23% traveled with children
» Top 2 activities outside Spring Training:- Dining out (63%)- Going to the beach (47%)
» 51 years old
» Annual household income: $98,900
» Top origin regions- Northeast 46%- Midwest 25%
19
Economic Impact Profile
in Economic Impact
in Wages
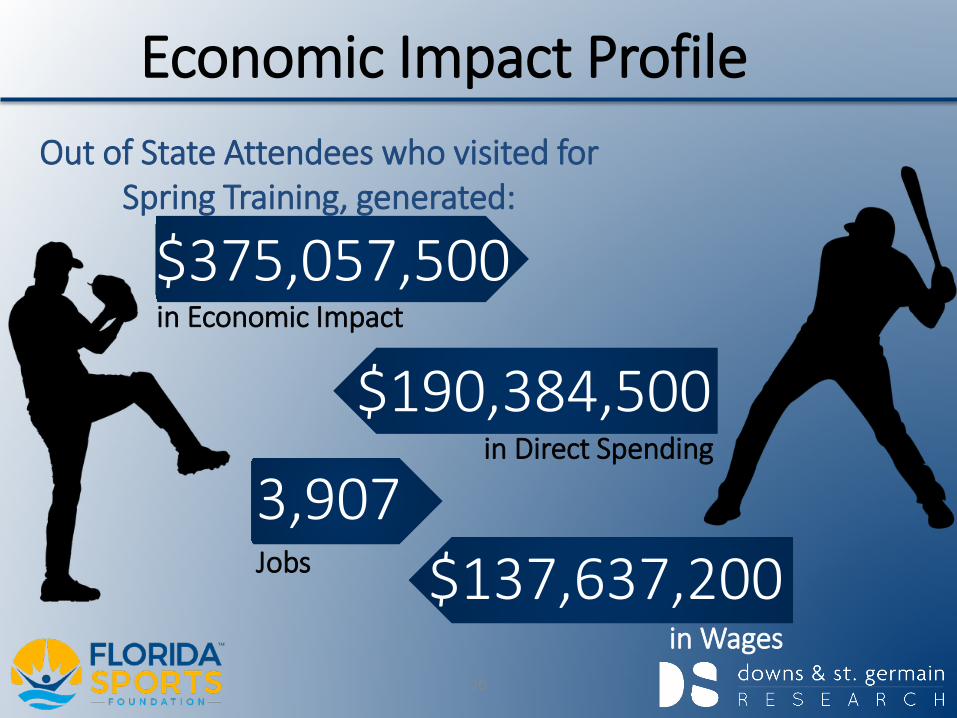
$375,057,500
Jobs
3,907$137,637,200
20
Out of State Attendees who visited for Spring Training, generated:
in Direct Spending$190,384,500
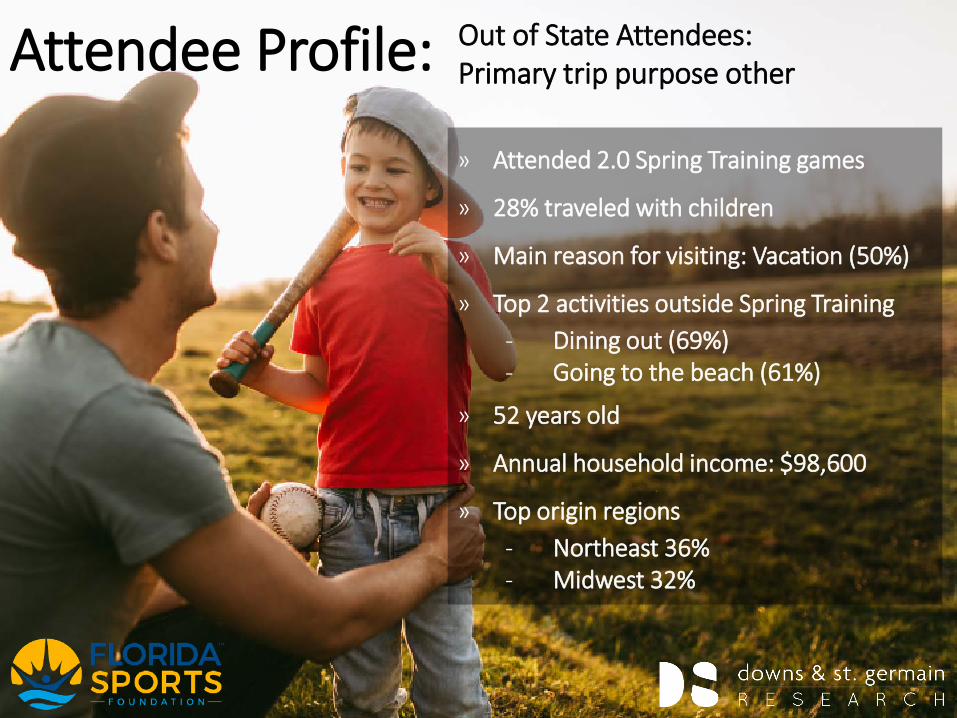
Out of State Attendees: Primary trip purpose otherAttendee Profile:
» Attended 2.0 Spring Training games
» 28% traveled with children
» Main reason for visiting: Vacation (50%)
» Top 2 activities outside Spring Training- Dining out (69%)- Going to the beach (61%)
» 52 years old
» Annual household income: $98,600
» Top origin regions- Northeast 36%- Midwest 32%
21

Economic Impact Profile
in Economic Impact
in Wages
$105,497,100
Jobs
1,099$38,714,900
22
Out of State Attendees who visited for another purpose, generated:
in Direct Spending$53,551,900
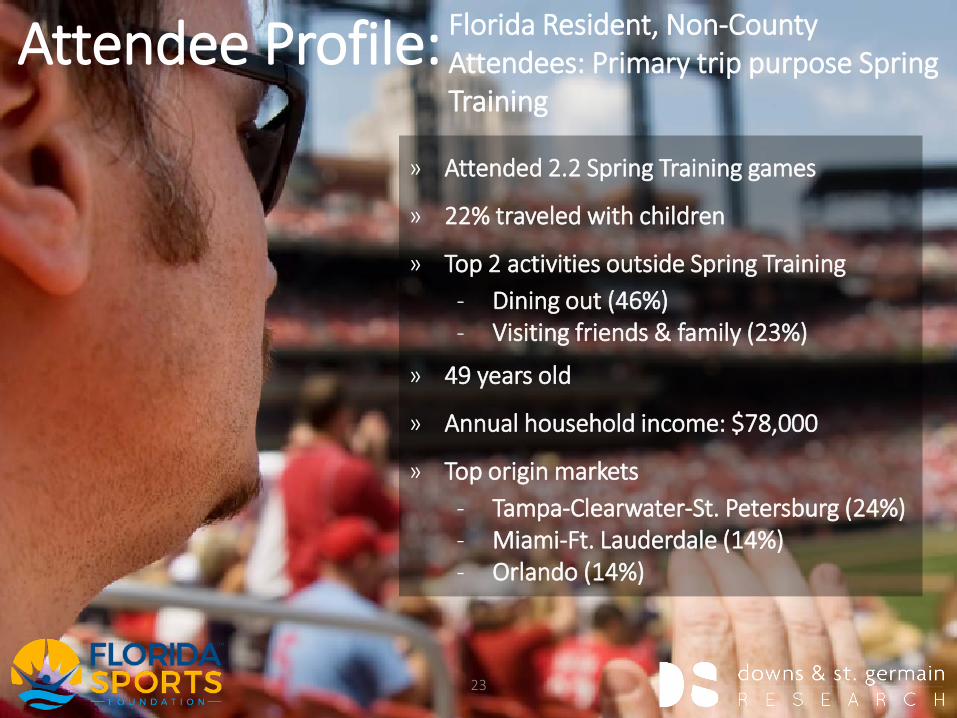
Florida Resident, Non-County Attendees: Primary trip purpose Spring Training
Attendee Profile:
» Attended 2.2 Spring Training games
» 22% traveled with children
» Top 2 activities outside Spring Training- Dining out (46%)- Visiting friends & family (23%)
» 49 years old
» Annual household income: $78,000
» Top origin markets- Tampa-Clearwater-St. Petersburg (24%)- Miami-Ft. Lauderdale (14%)- Orlando (14%)
23

Economic Impact Profile
in Economic Impact
in Wages
$73,579,800
Jobs
767$27,002,000
24
Florida Resident Attendees who visited for Spring Training, generated:
in Direct Spending$37,350,200
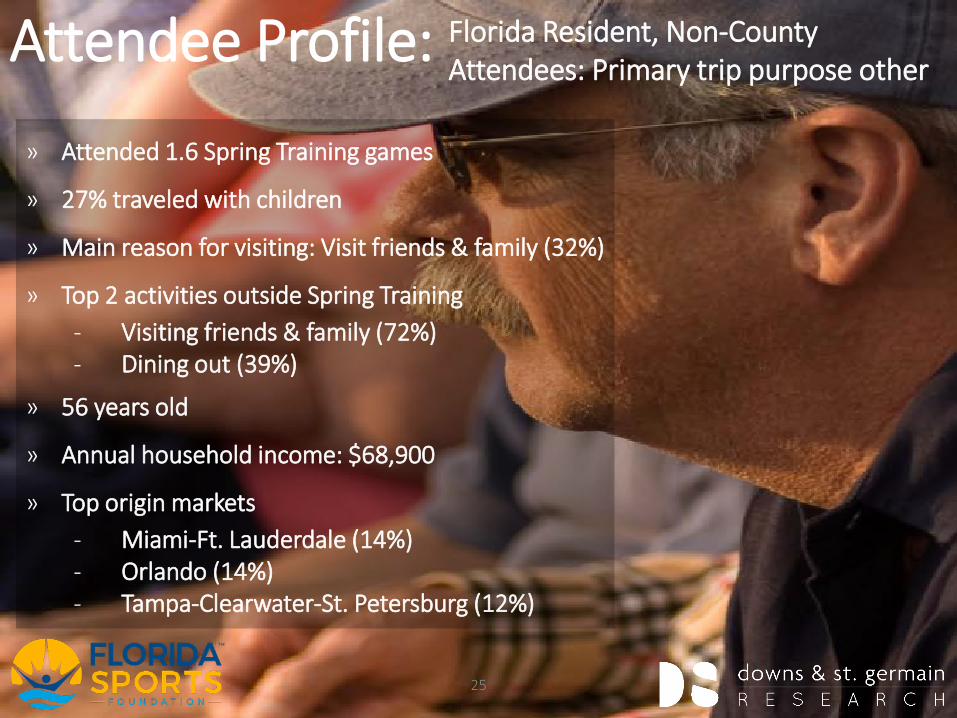
Florida Resident, Non-County Attendees: Primary trip purpose otherAttendee Profile:
» Attended 1.6 Spring Training games
» 27% traveled with children
» Main reason for visiting: Visit friends & family (32%)
» Top 2 activities outside Spring Training- Visiting friends & family (72%)- Dining out (39%)
» 56 years old
» Annual household income: $68,900
» Top origin markets- Miami-Ft. Lauderdale (14%)- Orlando (14%)- Tampa-Clearwater-St. Petersburg (12%)
25
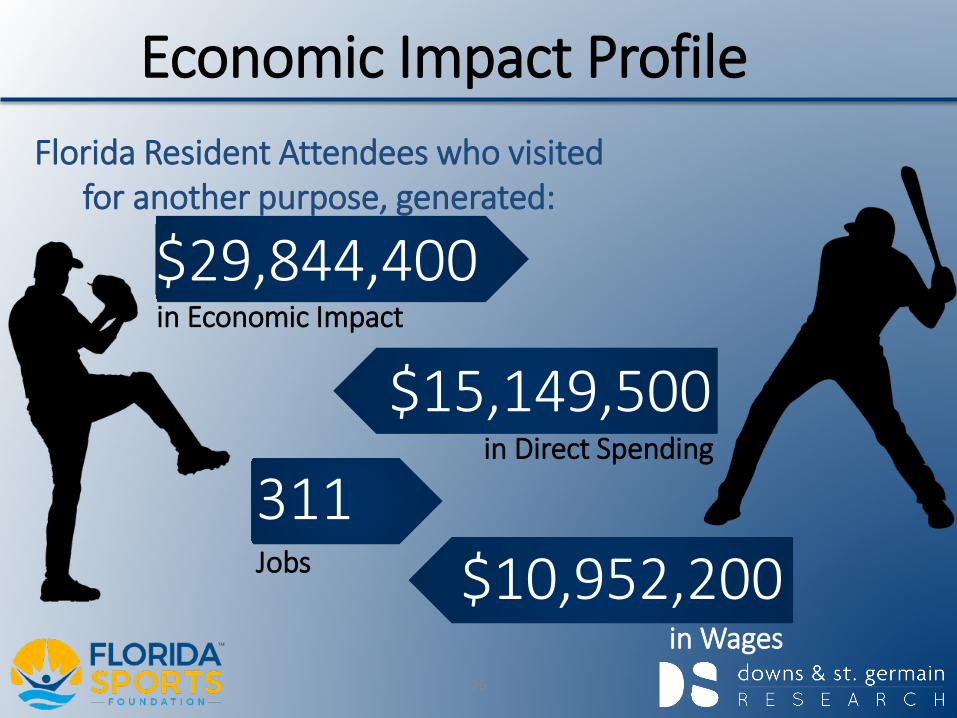
Economic Impact Profile
in Economic Impact
in Wages
$29,844,400
Jobs
311$10,952,200
26
Florida Resident Attendees who visited for another purpose, generated:
in Direct Spending$15,149,500
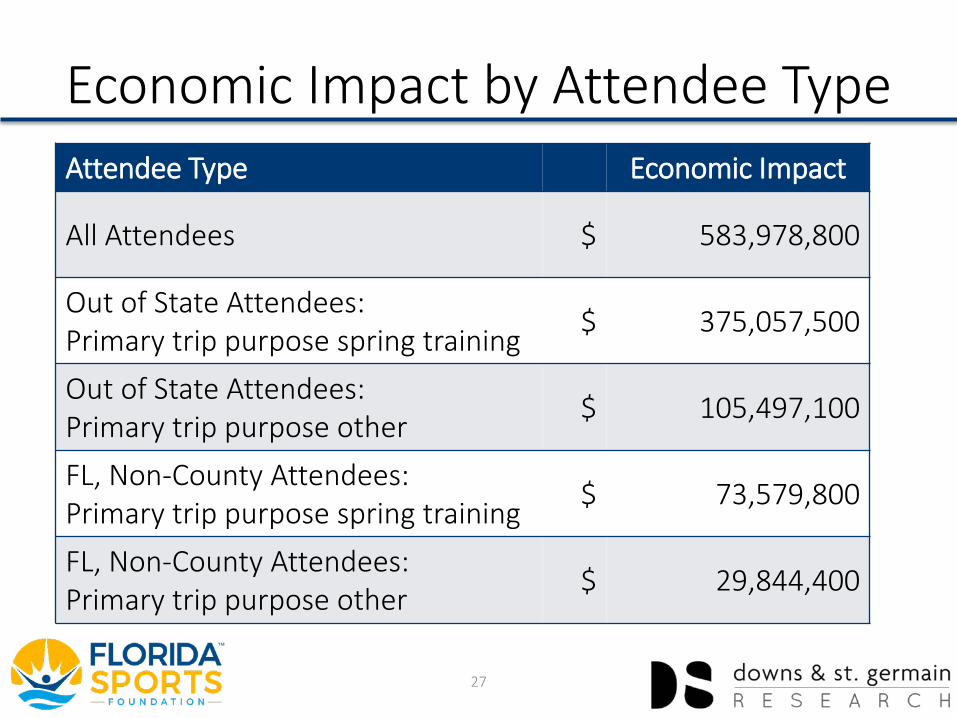
Economic Impact by Attendee TypeAttendee Type Economic Impact
All Attendees $ 583,978,800
Out of State Attendees: Primary trip purpose spring training $ 375,057,500
Out of State Attendees: Primary trip purpose other $ 105,497,100
FL, Non-County Attendees: Primary trip purpose spring training $ 73,579,800
FL, Non-County Attendees: Primary trip purpose other $ 29,844,400
27
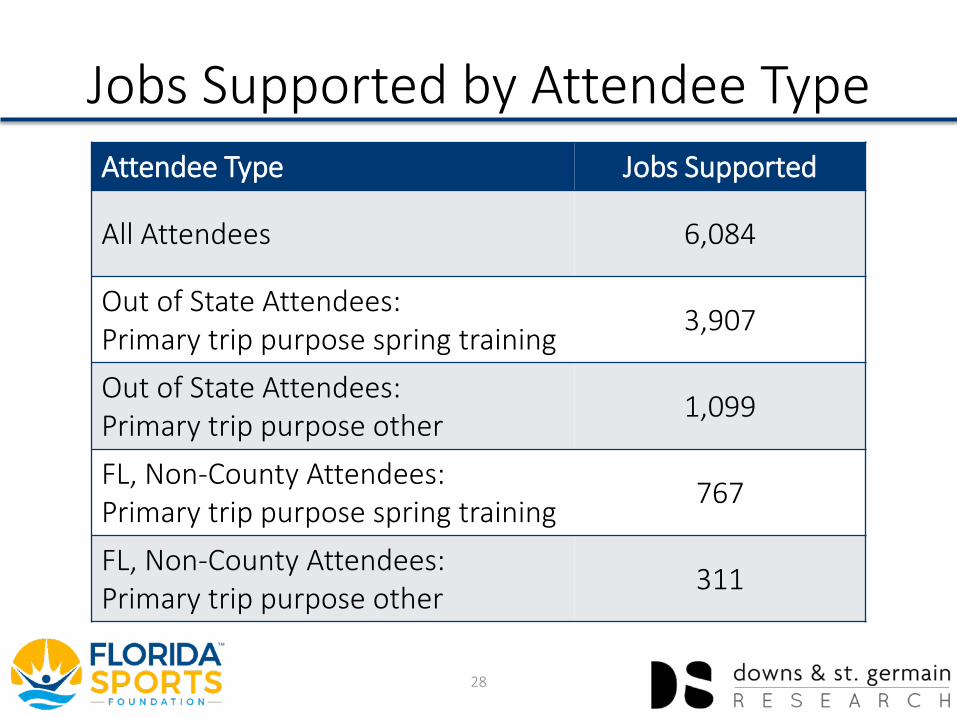
Jobs Supported by Attendee TypeAttendee Type Jobs Supported
All Attendees 6,084
Out of State Attendees: Primary trip purpose spring training 3,907
Out of State Attendees: Primary trip purpose other 1,099
FL, Non-County Attendees: Primary trip purpose spring training 767
FL, Non-County Attendees: Primary trip purpose other 311
28
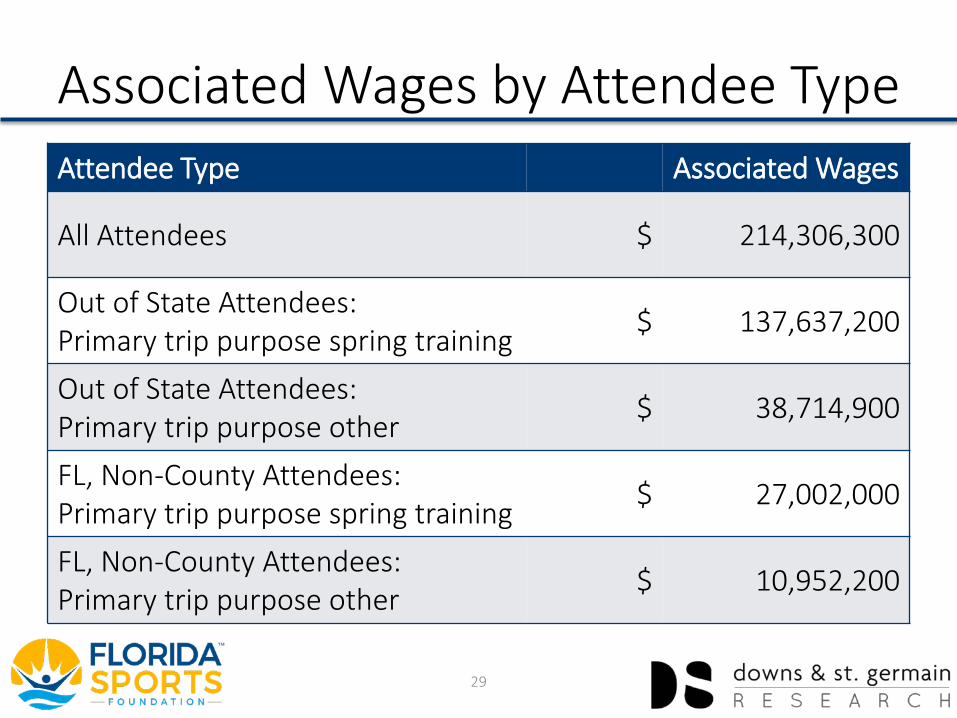
Associated Wages by Attendee TypeAttendee Type Associated Wages
All Attendees $ 214,306,300
Out of State Attendees: Primary trip purpose spring training $ 137,637,200
Out of State Attendees: Primary trip purpose other $ 38,714,900
FL, Non-County Attendees: Primary trip purpose spring training $ 27,002,000
FL, Non-County Attendees: Primary trip purpose other $ 10,952,200
29
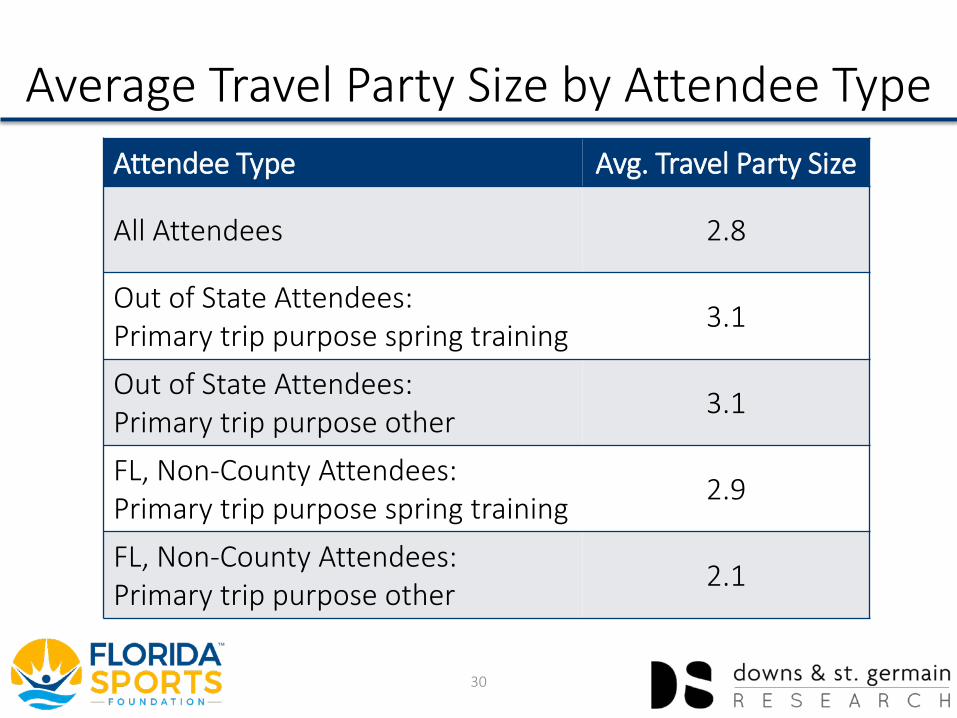
Average Travel Party Size by Attendee TypeAttendee Type Avg. Travel Party Size
All Attendees 2.8
Out of State Attendees: Primary trip purpose spring training 3.1
Out of State Attendees: Primary trip purpose other 3.1
FL, Non-County Attendees: Primary trip purpose spring training 2.9
FL, Non-County Attendees: Primary trip purpose other 2.1
30
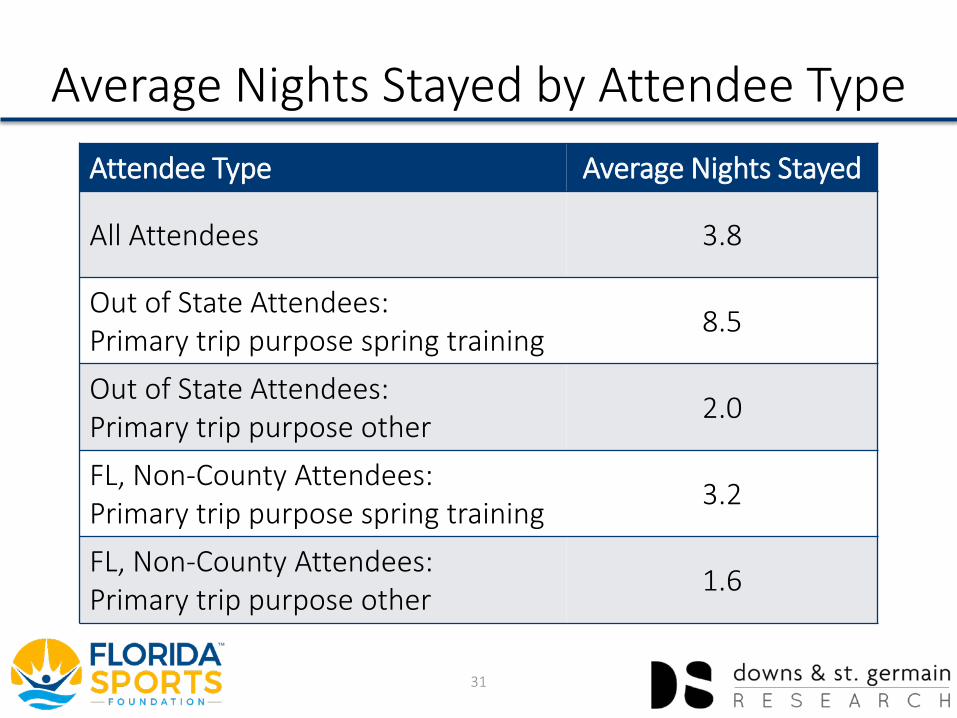
Average Nights Stayed by Attendee TypeAttendee Type Average Nights Stayed
All Attendees 3.8
Out of State Attendees: Primary trip purpose spring training 8.5
Out of State Attendees: Primary trip purpose other 2.0
FL, Non-County Attendees: Primary trip purpose spring training 3.2
FL, Non-County Attendees: Primary trip purpose other 1.6
31
Economic Impact – Team Spending
32

Economic Impact Profile
in Economic Impact
in Wages
$67,485,700
Jobs
710$23,482,700
33
in Direct Spending$33,912,4001
MLB Spring Training team operating expenses, generated:
1 Based on spending figures provided by Major League Baseball

Economic Impact Profile
in Economic Impact
in Wages
$25,884,200
Jobs
229$11,359,600
34
in Direct Spending$13,007,1001
MLB Spring Training stadium operating expenses, generated:
1 Based on spending figures provided by Major League Baseball
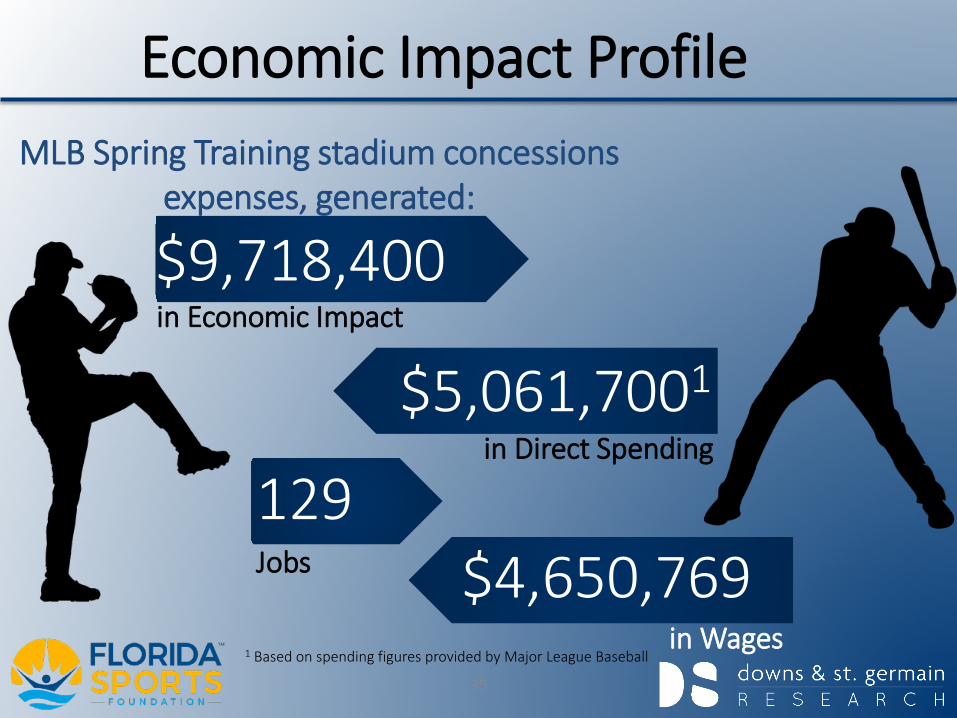
Economic Impact Profile
in Economic Impact
in Wages
$9,718,400
Jobs
129$4,650,769
35
in Direct Spending$5,061,7001
MLB Spring Training stadium concessions expenses, generated:
1 Based on spending figures provided by Major League Baseball
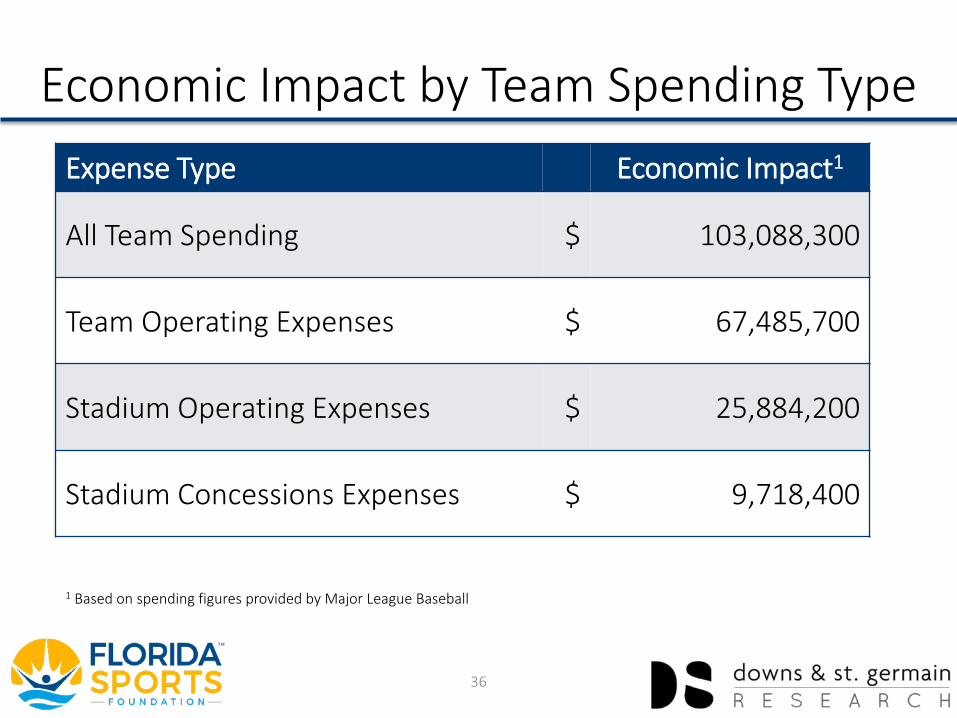
Economic Impact by Team Spending TypeExpense Type Economic Impact1
All Team Spending $ 103,088,300
Team Operating Expenses $ 67,485,700
Stadium Operating Expenses $ 25,884,200
Stadium Concessions Expenses $ 9,718,400
36
1 Based on spending figures provided by Major League Baseball
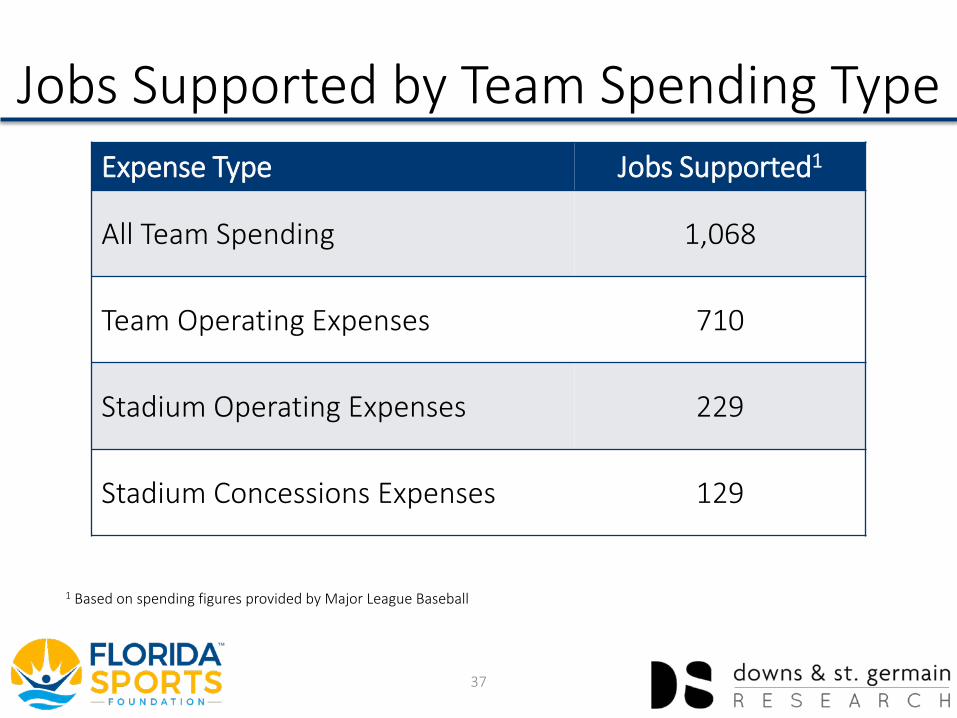
Jobs Supported by Team Spending TypeExpense Type Jobs Supported1
All Team Spending 1,068
Team Operating Expenses 710
Stadium Operating Expenses 229
Stadium Concessions Expenses 129
37
1 Based on spending figures provided by Major League Baseball
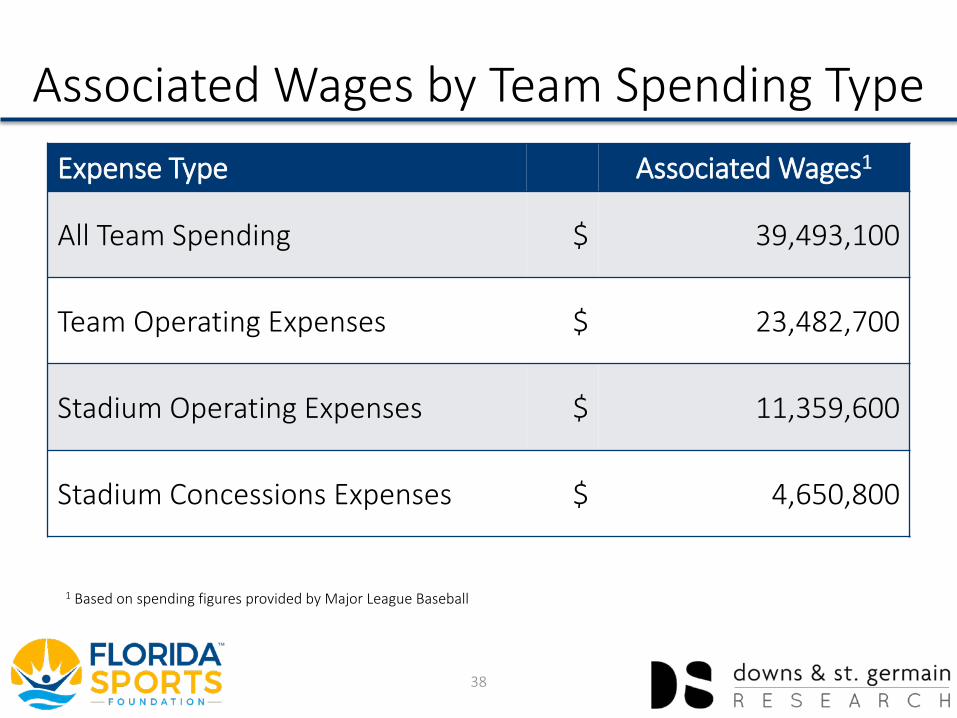
Associated Wages by Team Spending TypeExpense Type Associated Wages1
All Team Spending $ 39,493,100
Team Operating Expenses $ 23,482,700
Stadium Operating Expenses $ 11,359,600
Stadium Concessions Expenses $ 4,650,800
38
1 Based on spending figures provided by Major League Baseball
Additional Attendee Information
39
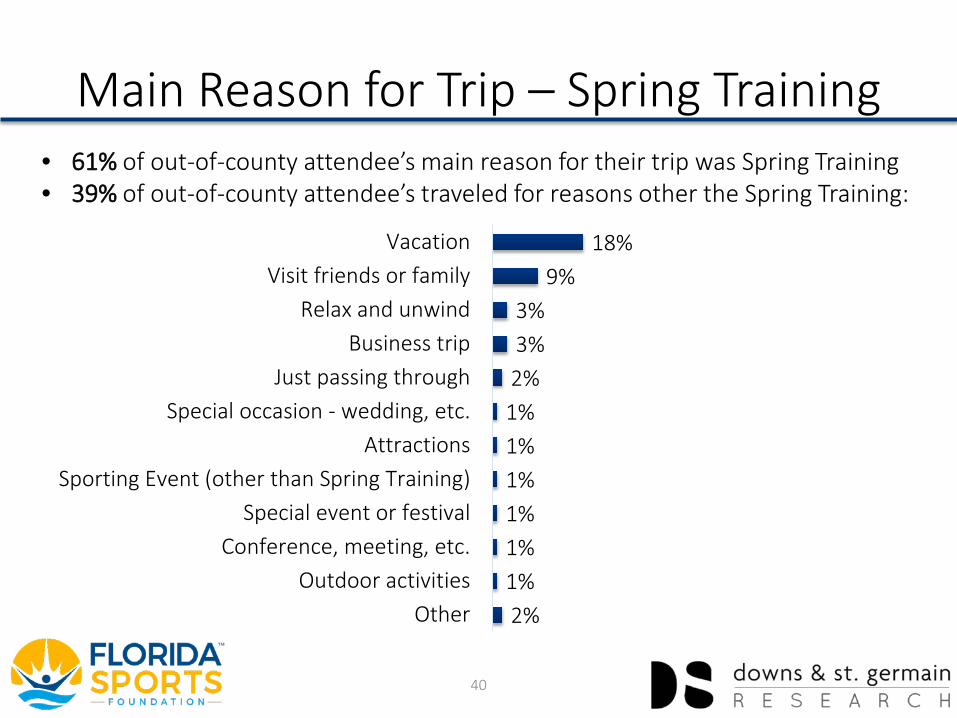
Main Reason for Trip – Spring Training
18%9%
3%3%2%1%1%1%1%1%1%2%
VacationVisit friends or family
Relax and unwindBusiness trip
Just passing throughSpecial occasion - wedding, etc.
AttractionsSporting Event (other than Spring Training)
Special event or festivalConference, meeting, etc.
Outdoor activitiesOther
40
• 61% of out-of-county attendee’s main reason for their trip was Spring Training• 39% of out-of-county attendee’s traveled for reasons other the Spring Training:
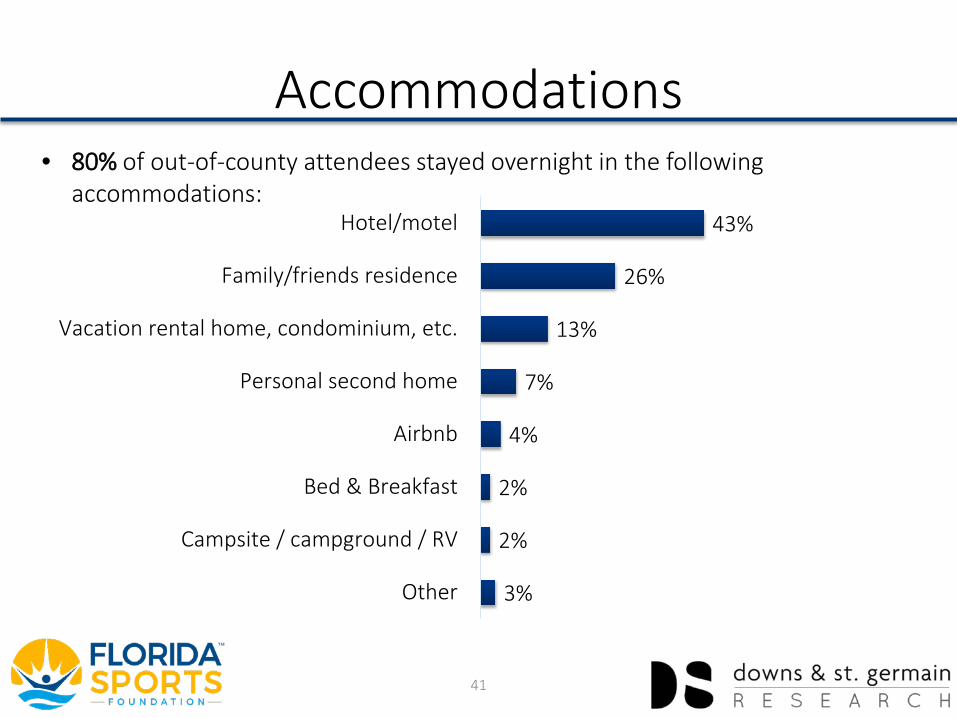
Accommodations
43%
26%
13%
7%
4%
2%
2%
3%
Hotel/motel
Family/friends residence
Vacation rental home, condominium, etc.
Personal second home
Airbnb
Bed & Breakfast
Campsite / campground / RV
Other
41
• 80% of out-of-county attendees stayed overnight in the following accommodations:
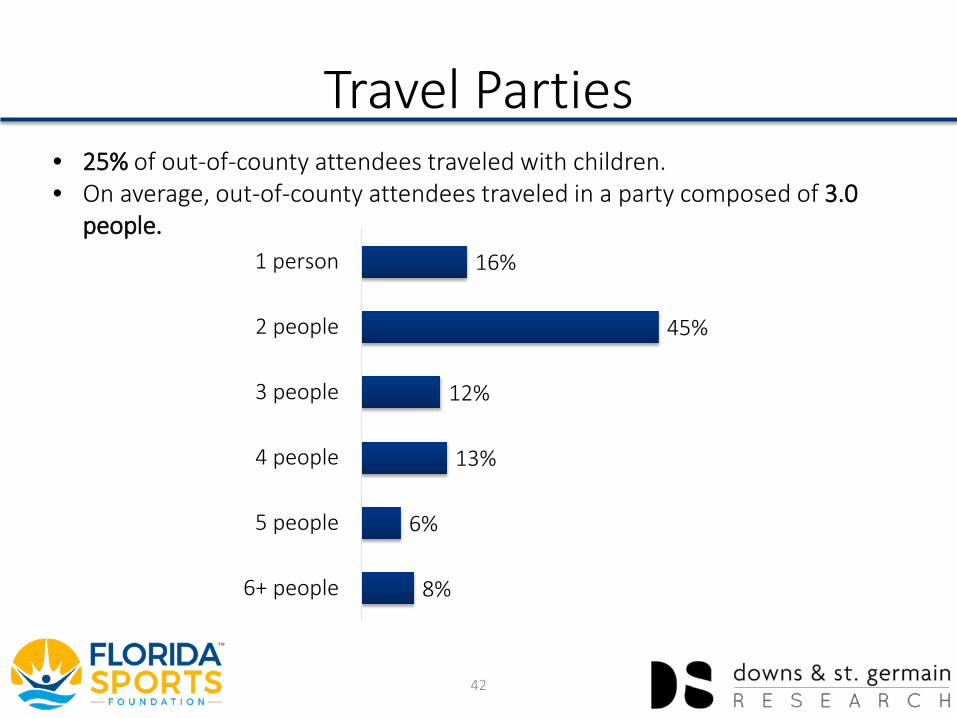
Travel Parties
16%
45%
12%
13%
6%
8%
1 person
2 people
3 people
4 people
5 people
6+ people
42
• 25% of out-of-county attendees traveled with children.• On average, out-of-county attendees traveled in a party composed of 3.0
people.
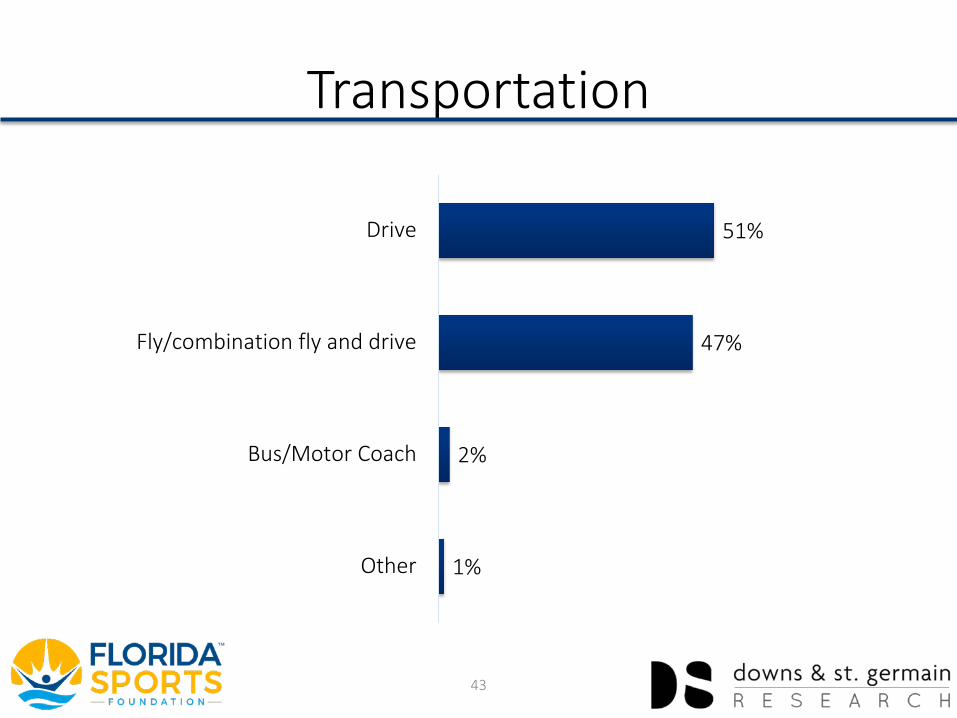
Transportation
51%
47%
2%
1%
Drive
Fly/combination fly and drive
Bus/Motor Coach
Other
43
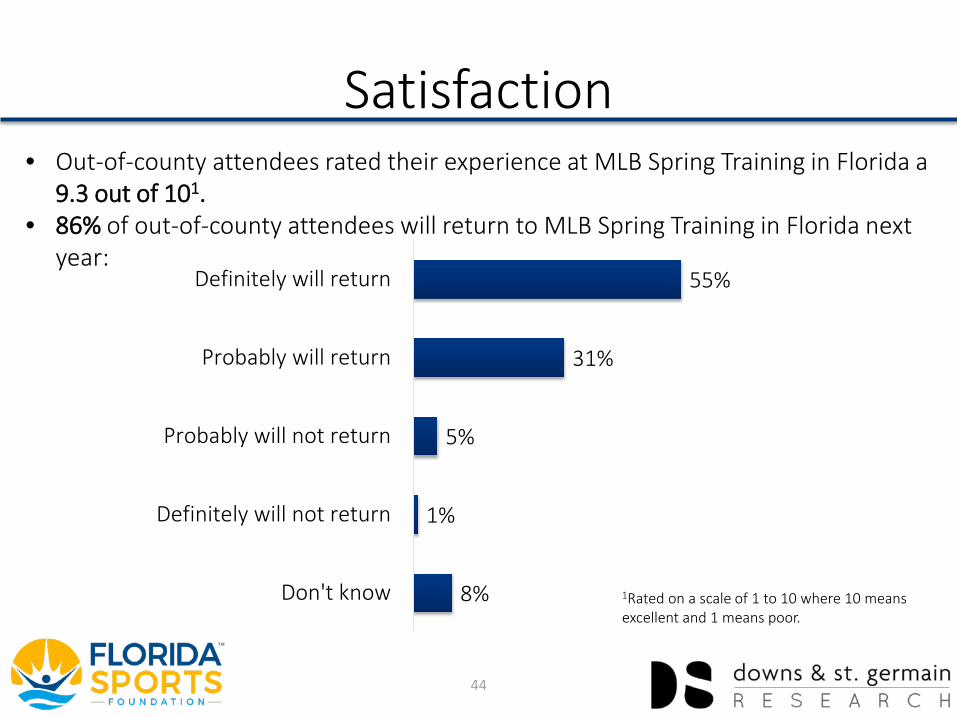
Satisfaction
55%
31%
5%
1%
8%
Definitely will return
Probably will return
Probably will not return
Definitely will not return
Don't know
44
• Out-of-county attendees rated their experience at MLB Spring Training in Florida a 9.3 out of 101.
• 86% of out-of-county attendees will return to MLB Spring Training in Florida next year:
1Rated on a scale of 1 to 10 where 10 means excellent and 1 means poor.
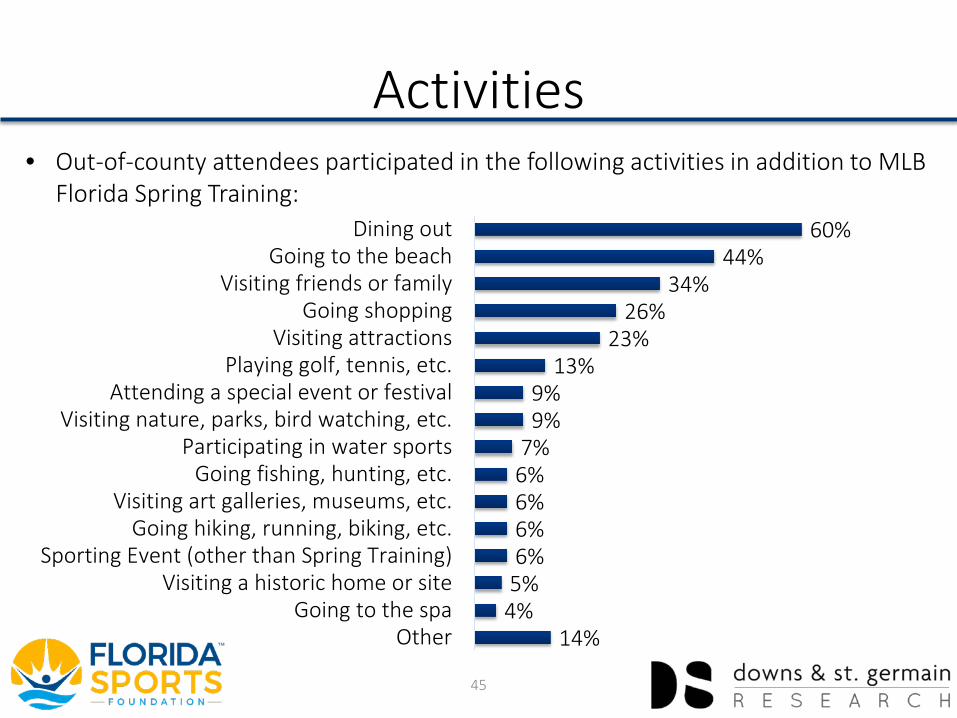
Activities
60%44%
34%26%
23%13%
9%9%
7%6%6%6%6%
5%4%
14%
Dining outGoing to the beach
Visiting friends or familyGoing shopping
Visiting attractionsPlaying golf, tennis, etc.
Attending a special event or festivalVisiting nature, parks, bird watching, etc.
Participating in water sportsGoing fishing, hunting, etc.
Visiting art galleries, museums, etc.Going hiking, running, biking, etc.
Sporting Event (other than Spring Training)Visiting a historic home or site
Going to the spaOther
45
• Out-of-county attendees participated in the following activities in addition to MLB Florida Spring Training:
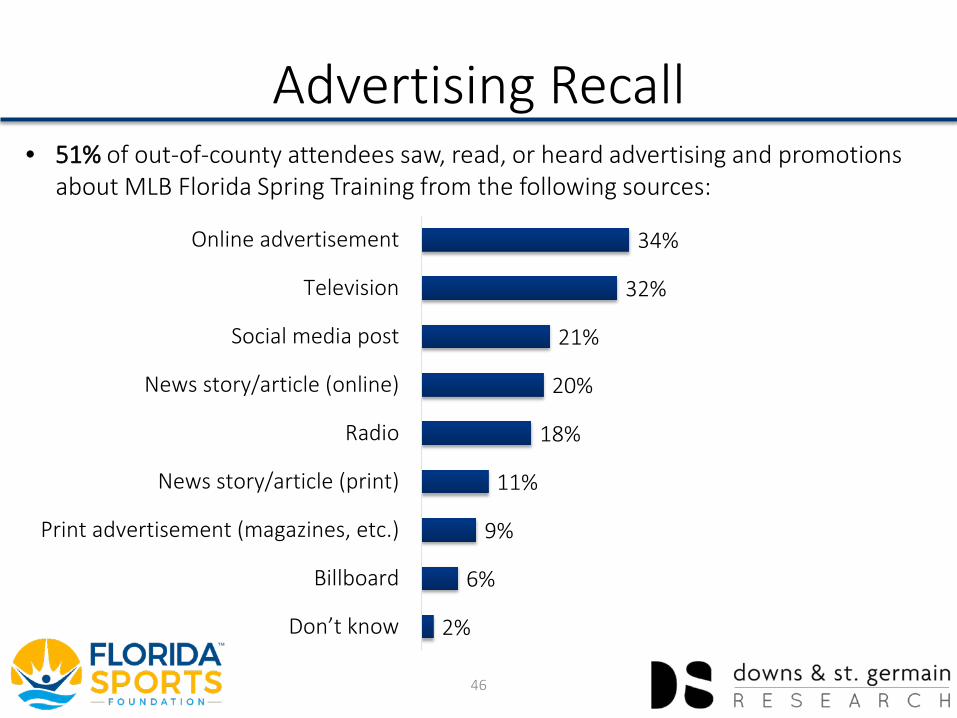
Advertising Recall
34%
32%
21%
20%
18%
11%
9%
6%
2%
Online advertisement
Television
Social media post
News story/article (online)
Radio
News story/article (print)
Print advertisement (magazines, etc.)
Billboard
Don’t know
46
• 51% of out-of-county attendees saw, read, or heard advertising and promotions about MLB Florida Spring Training from the following sources:

Demographics
47
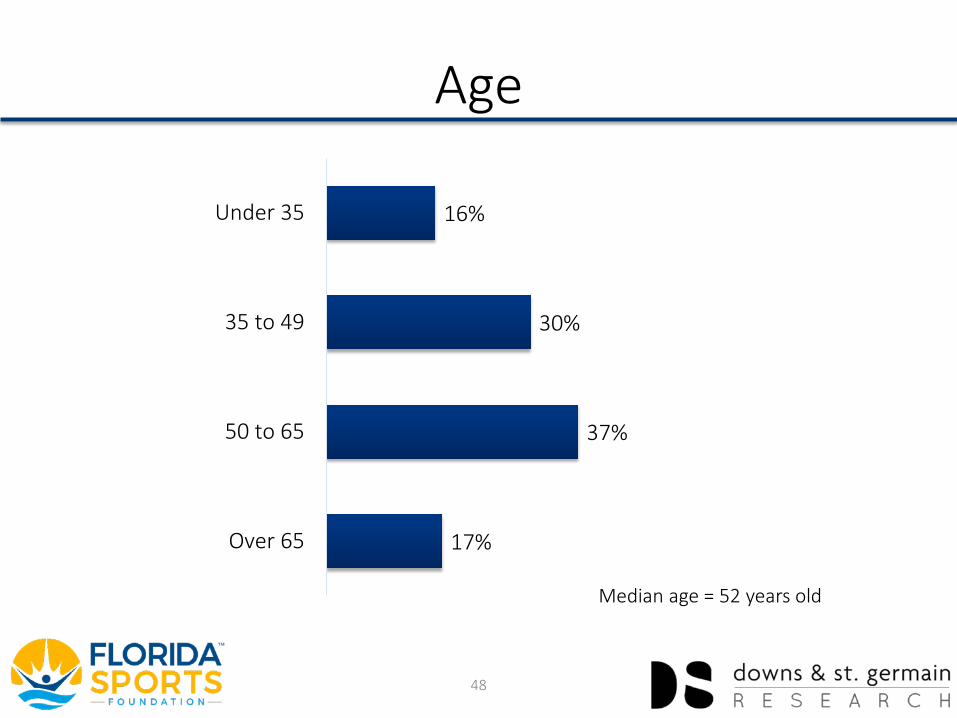
Age
16%
30%
37%
17%
Under 35
35 to 49
50 to 65
Over 65
48
Median age = 52 years old
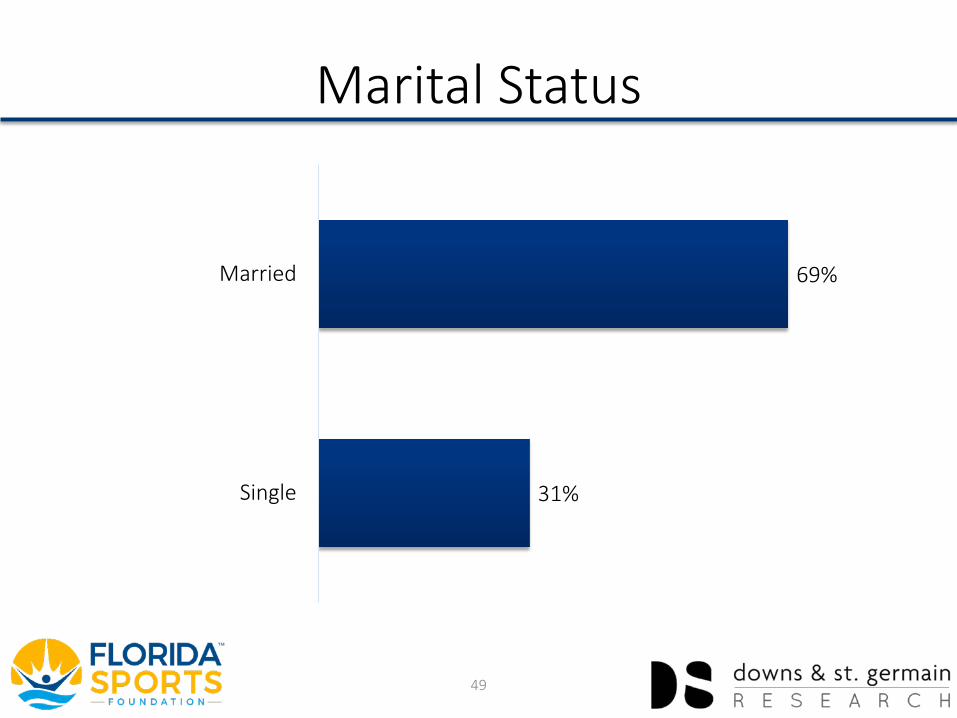
Marital Status
69%
31%
Married
Single
49
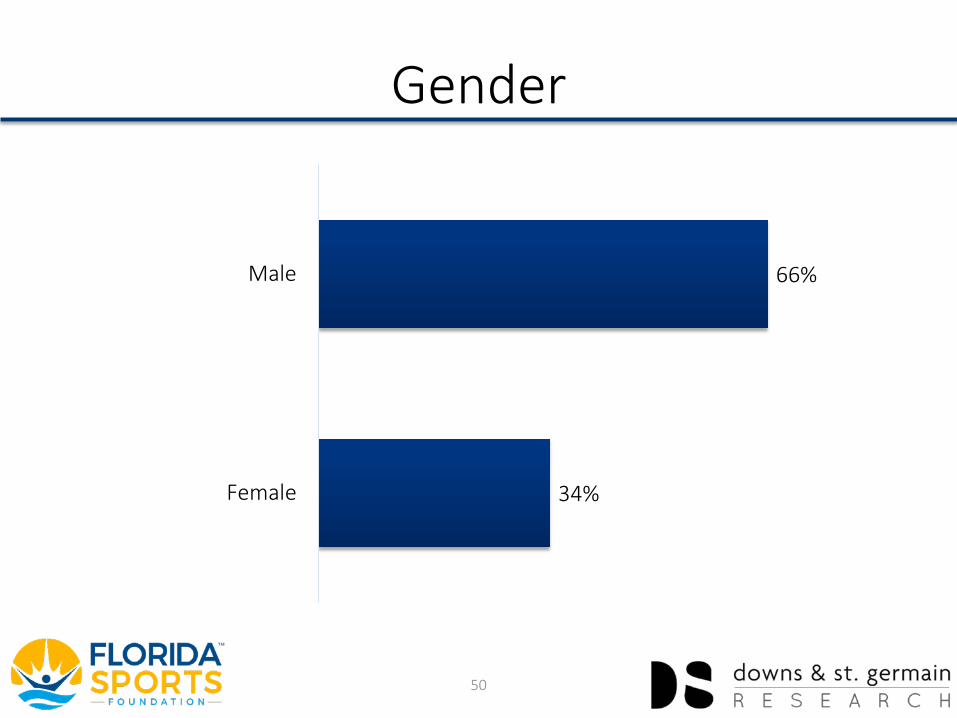
Gender
66%
34%
Male
Female
50
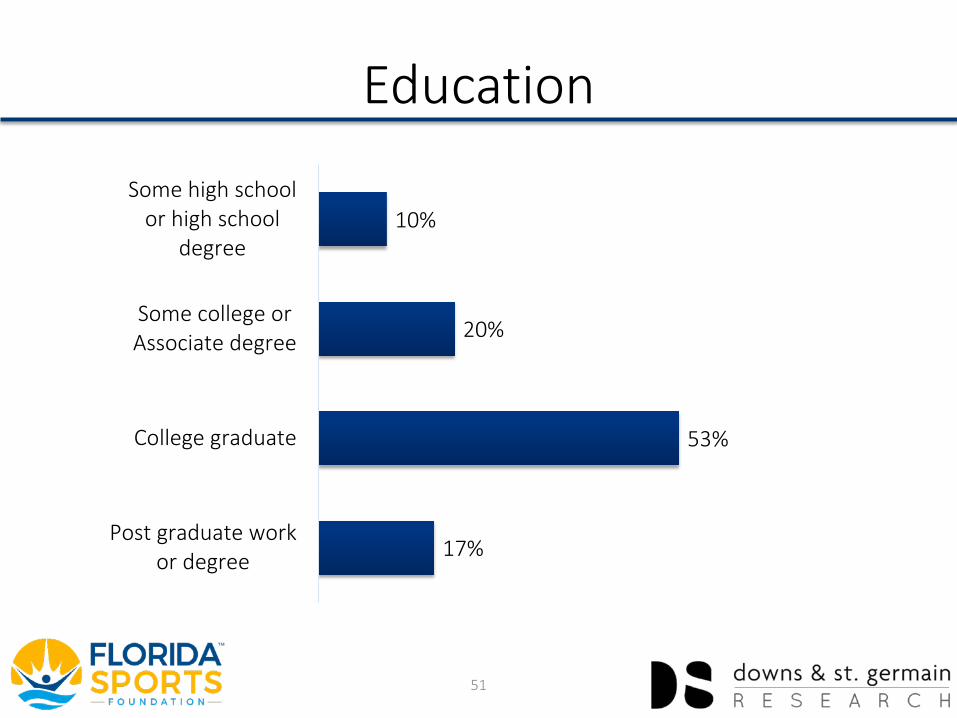
Education
10%
20%
53%
17%
Some high schoolor high school
degree
Some college orAssociate degree
College graduate
Post graduate workor degree
51
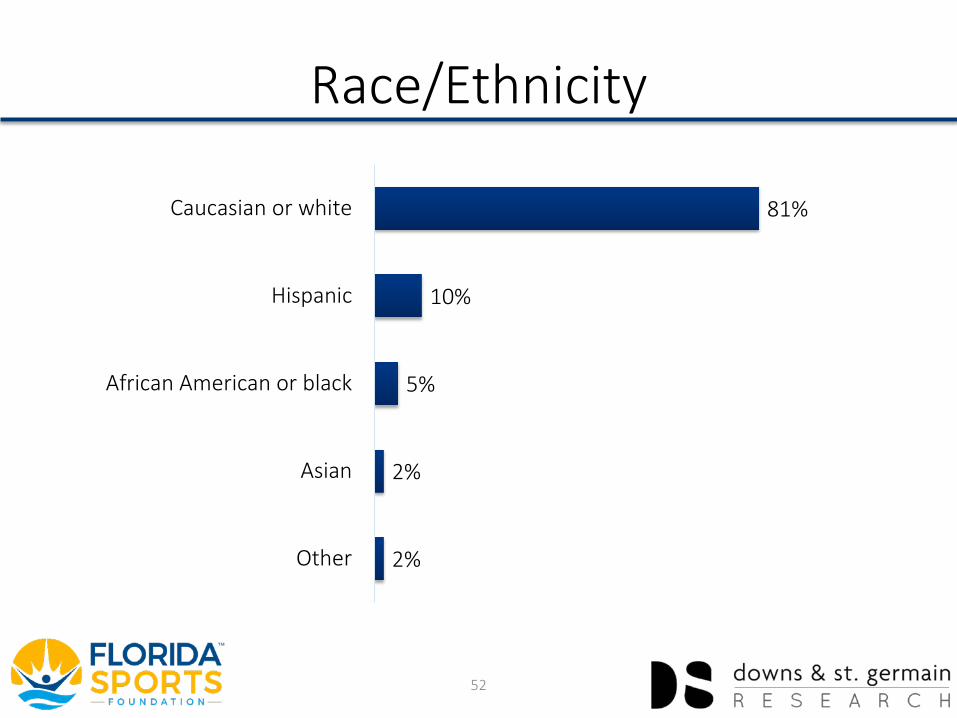
Race/Ethnicity
81%
10%
5%
2%
2%
Caucasian or white
Hispanic
African American or black
Asian
Other
52
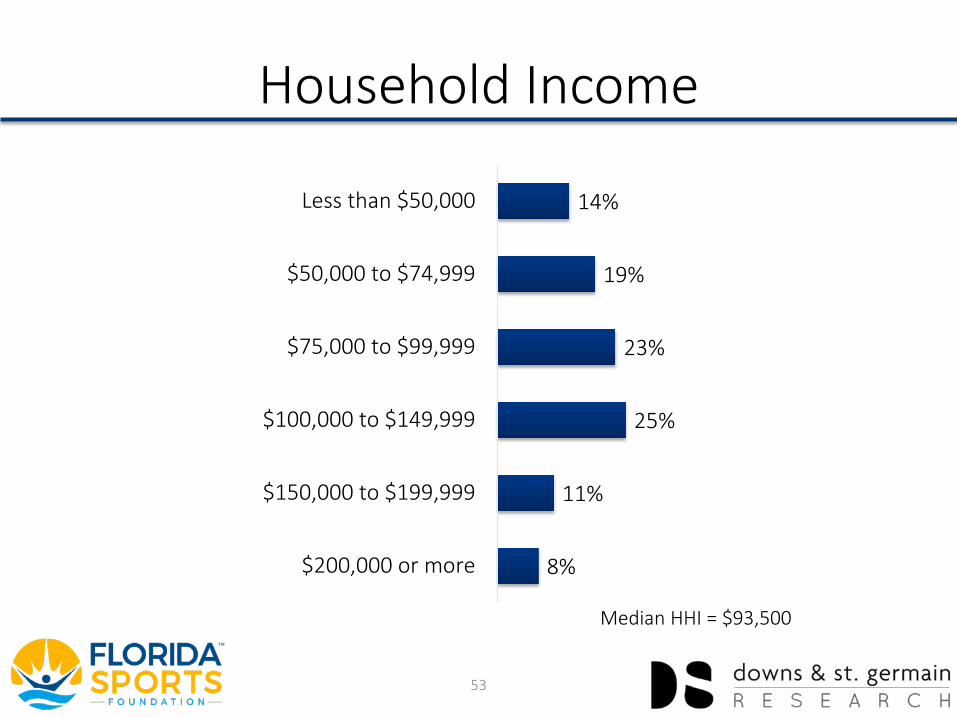
Household Income
14%
19%
23%
25%
11%
8%
Less than $50,000
$50,000 to $74,999
$75,000 to $99,999
$100,000 to $149,999
$150,000 to $199,999
$200,000 or more
53
Median HHI = $93,500
Methodology• The economic impact of MLB Florida Spring Training
was based on data from the following sources:
• Interviews conducted by Downs & St. Germain Research with 2,311 attendees of MLB Florida Spring Training,
• Attendance and expenditure figures from MLB, and• Tourism database at Downs & St. Germain Research.
54
Methodology
• Total economic impact of 2018 MLB Spring Training on the state of Florida is a function of direct spending by visitors in Florida & induced + indirect effects of this spending.• Indirect effects are increased business spending resulting from Spring
Training dollars.• Induced effects are increased household spending resulting from Spring
Training dollars.• Downs & St. Germain Research uses IMPLAN to calculate the economic
multiplier.• IMPLAN models the way dollars are spent and re-spent in other sectors of the
economy, generating waves of economic activity, called multiplier effects. • Over 1,500 organizations use IMPLAN, which has been used to model the economic
impact of tourism since 1992. Agencies such as FEMA, EPA, Federal Reserve Bank, and Bureau of Land Management use IMPLAN.
Joseph St. Germain, Ph.D., President, [email protected] Phillip Downs, Ph.D., Senior Partner, [email protected]
Rachael Anglin, Senior Project Director, [email protected] & St. Germain Research
1-800-564-3182: www.dsg-research.com
2018 MLB Florida Spring TrainingEconomic Impact Study
56