Embed Size (px)
Citation preview
2018 INVESTOR & ANALYST DAY
December 13, 2018
Forward Looking StatementsStatements in this presentation that are not strictly historical, including any statements regarding events or developments that we anticipate will or may occur in the future are "forward-looking" statements within the meaning of the federal securities laws. There are a number of important factors that could cause actual results, developments and business decisions to differmaterially from those suggested or indicated by such forward-looking statements and you should not place undue reliance on any such forward-looking statements. These factors include,among other things, Danaher’s ability to complete the previously-announced spin-off of its Dental business on the currently contemplated timeline and achieve the intended benefits,deterioration of or instability in the economy, the markets we serve and the financial markets, developments and uncertainties in U.S. policy stemming from the current administration, suchas changes in U.S. trade and tariff policies and the reaction of other countries thereto, contractions or growth rates and cyclicality of markets we serve, competition, our ability to develop andsuccessfully market new products and technologies and expand into new markets, the potential for improper conduct by our employees, agents or business partners, our compliance withapplicable laws and regulations (including regulations relating to medical devices and the health care industry), our ability to effectively address cost reductions and other changes in thehealth care industry, our ability to successfully identify, consummate and integrate appropriate acquisitions and strategic investments and successfully complete divestitures and otherdispositions, our ability to integrate the businesses we acquire and achieve the anticipated benefits of such acquisitions, contingent liabilities relating to acquisitions, investments anddivestitures (including tax-related and other contingent liabilities relating to past and future split-offs or spin-offs), security breaches or other disruptions of our information technologysystems or violations of data privacy laws, the impact of our restructuring activities on our ability to grow, risks relating to potential impairment of goodwill and other intangible assets,currency exchange rates, tax audits and changes in our tax rate and income tax liabilities, changes in tax laws applicable to multinational companies, litigation and other contingent liabilitiesincluding intellectual property and environmental, health and safety matters, the rights of the United States government to use, disclose and license certain intellectual property we license ifwe fail to commercialize it, risks relating to product, service or software defects, product liability and recalls, risks relating to product manufacturing, the impact of our debt obligations on ouroperations and liquidity, our relationships with and the performance of our channel partners, uncertainties relating to collaboration arrangements with third parties, commodity costs andsurcharges, our ability to adjust purchases and manufacturing capacity to reflect market conditions, reliance on sole sources of supply, the impact of deregulation on demand for ourproducts and services, labor matters, international economic, political, legal, compliance and business factors (including the impact of the UK's decision to leave the EU), disruptions relatingto man-made and natural disasters, and pension plan costs. Additional information regarding the factors that may cause actual results to differ materially from these forward-lookingstatements is available in our SEC filings, including our 2017 Annual Report on Form 10-K and Quarterly Report on Form 10-Q for the third quarter of 2018. These forward-looking statementsspeak only as of the date of this presentation and except to the extent required by applicable law, the Company does not assume any obligation to update or revise any forward-lookingstatement, whether as a result of new information, future events and developments or otherwise.
With respect to the non-GAAP financial measures referenced in the following presentation, the accompanying information required by SEC Regulation G can be found in the back of thepresentation and in the “Investors” section of Danaher’s web site, www.danaher.com, under the heading “Events & Presentations,” and event name “Danaher 2018 Investor & AnalystMeeting.” Unless otherwise indicated, all references in this presentation (1) to Company-specific financial metrics relate only to the continuing operations of Danaher’s business; (2) to“growth” or other period-to-period changes refer to year-over-year comparisons; (3) to Operating Profit below the segment level exclude amortization; (4) to “today” refers to the Company’sestimated 2018 performance (“2018E”); and (5) to “2018 YTD“ refers to the first nine months of 2018. This presentation treats 2018E as the Company’s most recent fiscal year unlessotherwise indicated. We may also describe certain products and devices which have applications submitted and pending for certain regulatory approvals.
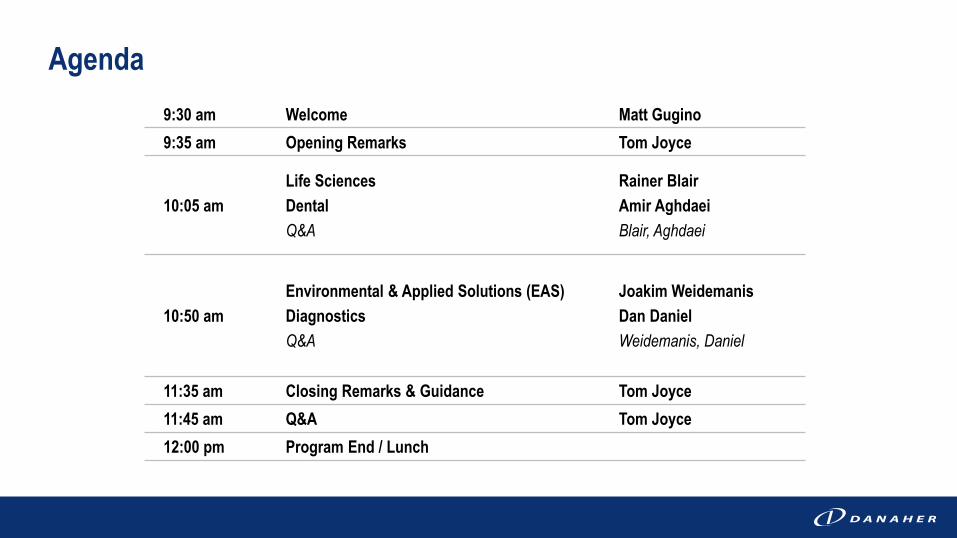
Agenda9:30 am Welcome Matt Gugino9:35 am Opening Remarks Tom Joyce
10:05 amLife SciencesDentalQ&A
Rainer BlairAmir AghdaeiBlair, Aghdaei
10:50 amEnvironmental & Applied Solutions (EAS)DiagnosticsQ&A
Joakim WeidemanisDan DanielWeidemanis, Daniel
11:35 am Closing Remarks & Guidance Tom Joyce11:45 am Q&A Tom Joyce12:00 pm Program End / Lunch


OPENING REMARKSTom Joyce, President & CEO
2018 INVESTOR & ANALYST DAY
Running the Danaher playbook: how we create long-term value
What You’ll Hear Today
Terrific results this year driven by DBS
Building and evolving into a stronger, better Danaher
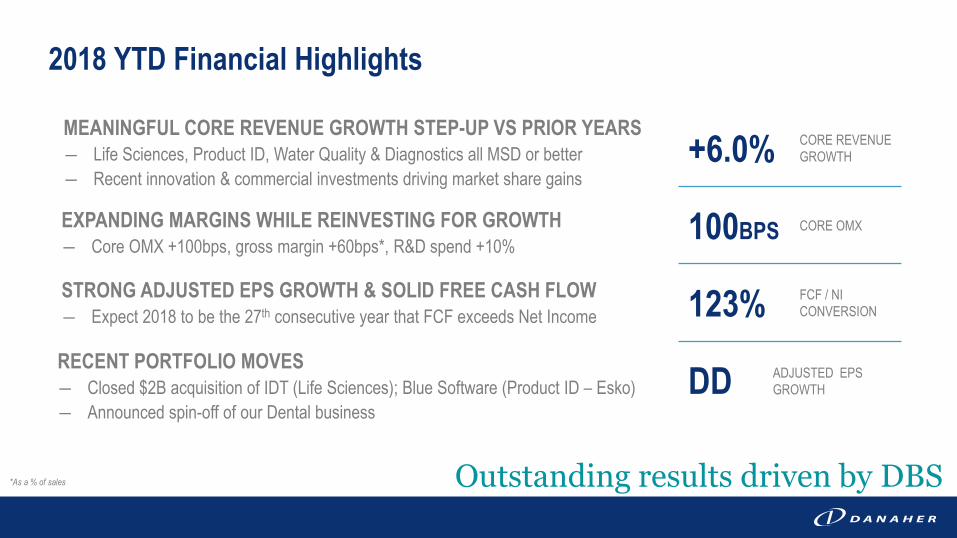
2018 YTD Financial Highlights
STRONG ADJUSTED EPS GROWTH & SOLID FREE CASH FLOW― Expect 2018 to be the 27th consecutive year that FCF exceeds Net Income
EXPANDING MARGINS WHILE REINVESTING FOR GROWTH― Core OMX +100bps, gross margin +60bps*, R&D spend +10%
RECENT PORTFOLIO MOVES― Closed $2B acquisition of IDT (Life Sciences); Blue Software (Product ID – Esko)― Announced spin-off of our Dental business
MEANINGFUL CORE REVENUE GROWTH STEP-UP VS PRIOR YEARS― Life Sciences, Product ID, Water Quality & Diagnostics all MSD or better― Recent innovation & commercial investments driving market share gains
*As a % of sales Outstanding results driven by DBS
+6.0% CORE REVENUE GROWTH
100BPS CORE OMX
123% FCF / NI CONVERSION
DD ADJUSTED EPS GROWTH
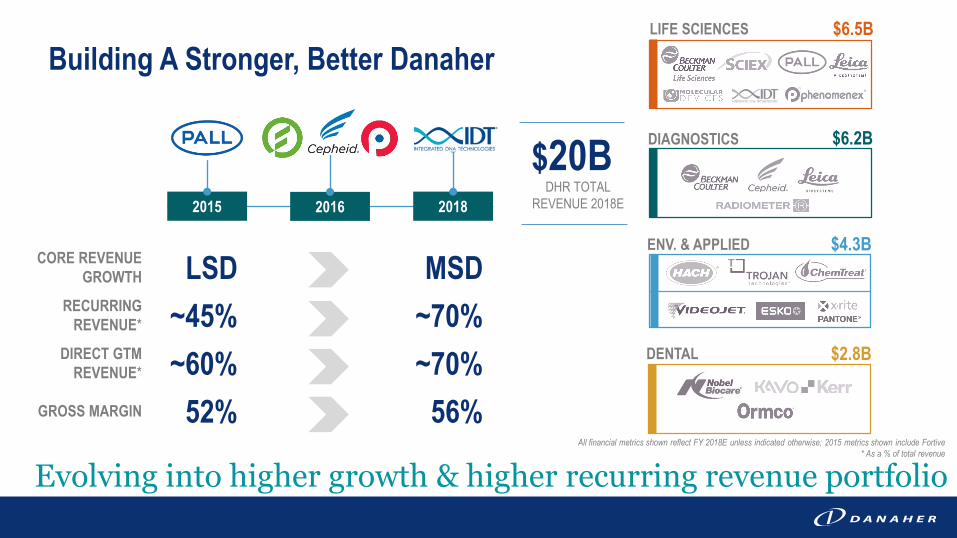
Building A Stronger, Better Danaher
Evolving into higher growth & higher recurring revenue portfolio
2015 2016 2018
CORE REVENUE GROWTH LSD MSD
RECURRING REVENUE* ~45% ~70%
DIRECT GTM REVENUE* ~60% ~70%
GROSS MARGIN 52% 56%All financial metrics shown reflect FY 2018E unless indicated otherwise; 2015 metrics shown include Fortive
* As a % of total revenue
LIFE SCIENCES $6.5B
DENTAL $2.8B
DIAGNOSTICS $6.2B
ENV. & APPLIED $4.3B
$20BDHR TOTAL
REVENUE 2018E
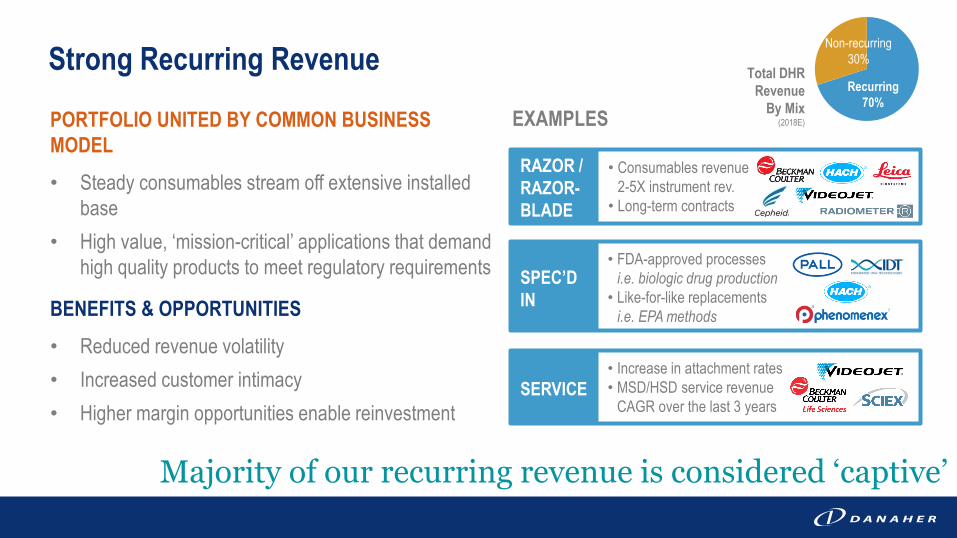
Majority of our recurring revenue is considered ‘captive’
Strong Recurring Revenue
PORTFOLIO UNITED BY COMMON BUSINESS MODEL• Steady consumables stream off extensive installed
base• High value, ‘mission-critical’ applications that demand
high quality products to meet regulatory requirements
BENEFITS & OPPORTUNITIES• Reduced revenue volatility• Increased customer intimacy• Higher margin opportunities enable reinvestment
EXAMPLES
RAZOR / RAZOR-BLADE
• Consumables revenue 2-5X instrument rev.
• Long-term contracts
SPEC’D IN
SERVICE
• FDA-approved processes i.e. biologic drug production
• Like-for-like replacements i.e. EPA methods
• Increase in attachment rates• MSD/HSD service revenue
CAGR over the last 3 years
Total DHR Revenue
By Mix (2018E)
Recurring70%
Non-recurring30%
LIFE SCIENCES DIAGNOSTICS DENTAL
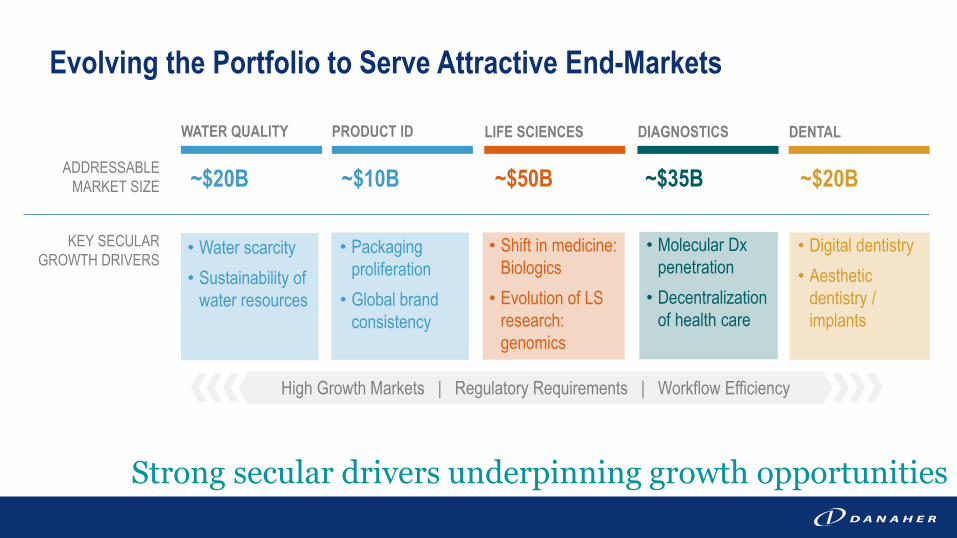
~$50B ~$35B ~$20B ~$20B
KEY SECULAR GROWTH DRIVERS
ADDRESSABLE MARKET SIZE
Strong secular drivers underpinning growth opportunities
WATER QUALITY
~$10B
PRODUCT ID
Evolving the Portfolio to Serve Attractive End-Markets
• Shift in medicine: Biologics
• Evolution of LS research: genomics
• Water scarcity • Sustainability of
water resources
• Digital dentistry• Aesthetic
dentistry / implants
• Packaging proliferation
• Global brand consistency
• Molecular Dxpenetration
• Decentralization of health care
High Growth Markets | Regulatory Requirements | Workflow Efficiency
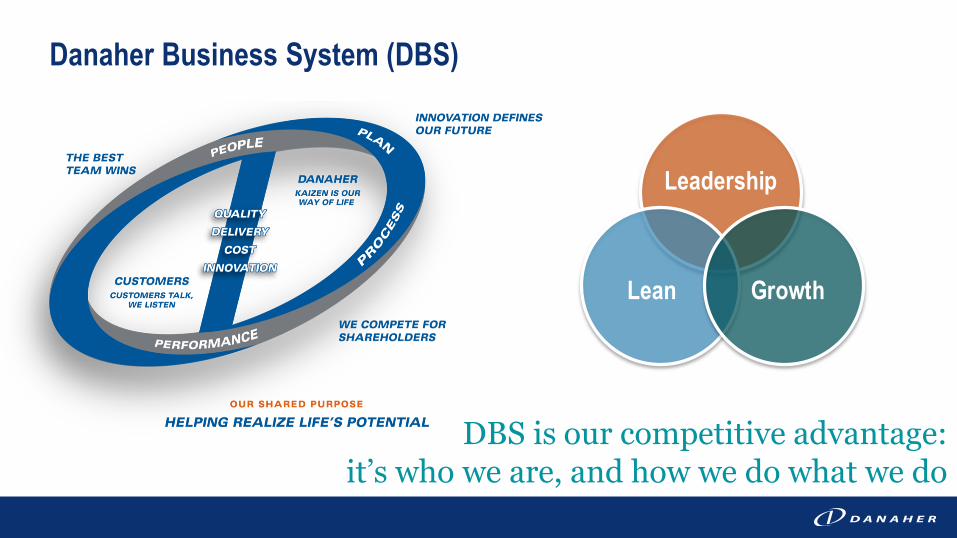
Danaher Business System (DBS)
DBS is our competitive advantage: it’s who we are, and how we do what we do
Leadership
Lean Growth
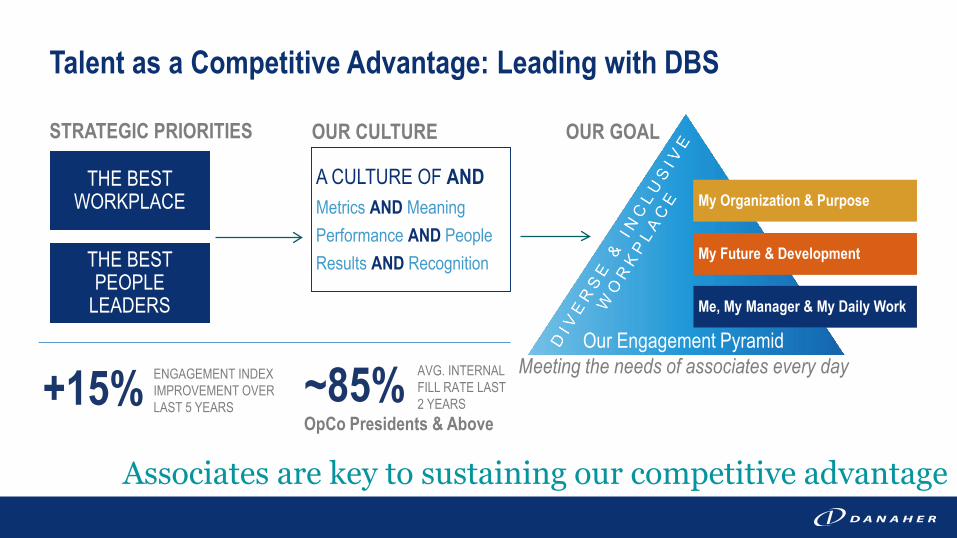
My Organization & Purpose
My Future & Development
Me, My Manager & My Daily Work
A CULTURE OF ANDMetrics AND MeaningPerformance AND PeopleResults AND Recognition
THE BEST WORKPLACE
THE BEST PEOPLE
LEADERS
STRATEGIC PRIORITIES OUR CULTURE OUR GOAL
Our Engagement PyramidMeeting the needs of associates every day
Talent as a Competitive Advantage: Leading with DBS
Associates are key to sustaining our competitive advantage
+15% ENGAGEMENT INDEX IMPROVEMENT OVER LAST 5 YEARS
OpCo Presidents & Above ~85% AVG. INTERNAL
FILL RATE LAST 2 YEARS
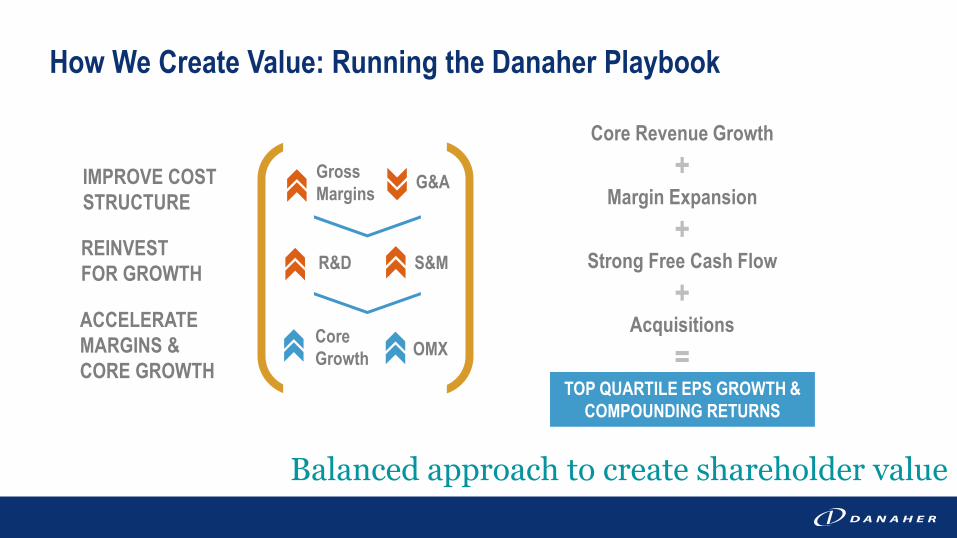
Core Revenue Growth+
Margin Expansion+
Strong Free Cash Flow+
Acquisitions=
TOP QUARTILE EPS GROWTH &COMPOUNDING RETURNS
How We Create Value: Running the Danaher Playbook
IMPROVE COST STRUCTURE
Balanced approach to create shareholder value
G&A
S&M
OMXCore Growth
R&D
GrossMargins
REINVEST FOR GROWTH
ACCELERATE MARGINS & CORE GROWTH
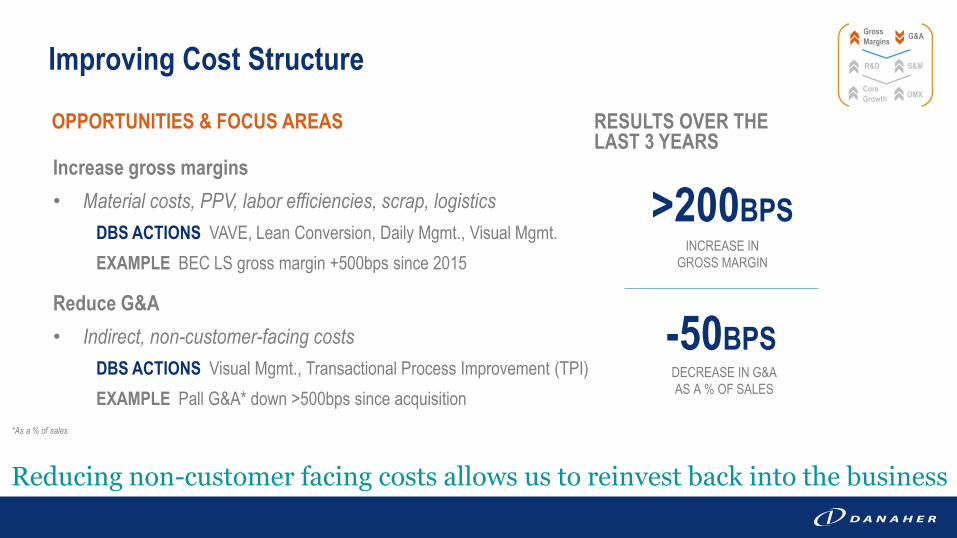
Reducing non-customer facing costs allows us to reinvest back into the business
Improving Cost Structure
Increase gross margins• Material costs, PPV, labor efficiencies, scrap, logistics
DBS ACTIONS VAVE, Lean Conversion, Daily Mgmt., Visual Mgmt.EXAMPLE BEC LS gross margin +500bps since 2015
Reduce G&A• Indirect, non-customer-facing costs
DBS ACTIONS Visual Mgmt., Transactional Process Improvement (TPI)EXAMPLE Pall G&A* down >500bps since acquisition
RESULTS OVER THE LAST 3 YEARS
-50BPSDECREASE IN G&A AS A % OF SALES
G&A
S&M
OMXCore Growth
R&D
GrossMargins
>200BPSINCREASE IN
GROSS MARGIN
OPPORTUNITIES & FOCUS AREAS
*As a % of sales
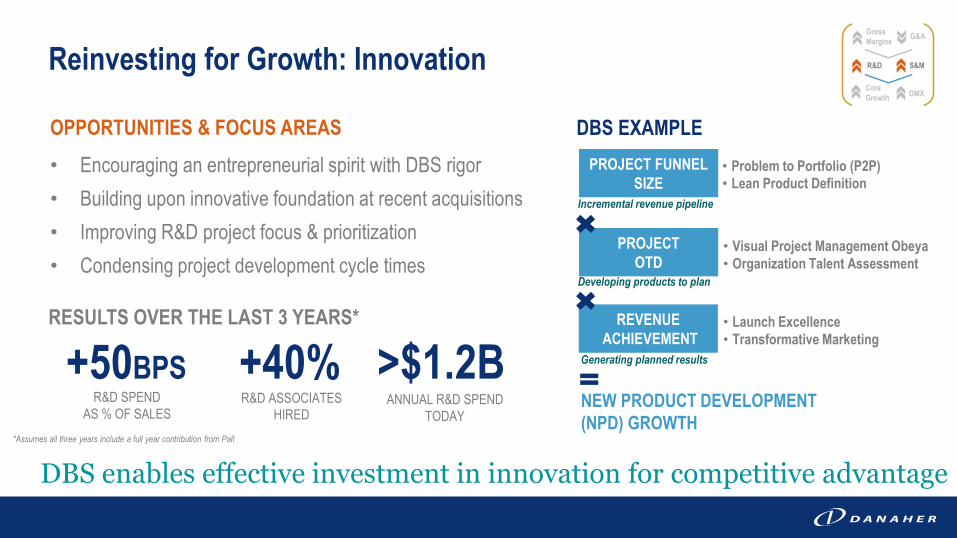
Reinvesting for Growth: Innovation
OPPORTUNITIES & FOCUS AREAS• Encouraging an entrepreneurial spirit with DBS rigor• Building upon innovative foundation at recent acquisitions• Improving R&D project focus & prioritization• Condensing project development cycle times
DBS enables effective investment in innovation for competitive advantage
PROJECT FUNNEL SIZE
PROJECT OTD
REVENUEACHIEVEMENT
DBS EXAMPLE• Problem to Portfolio (P2P)• Lean Product Definition
• Visual Project Management Obeya• Organization Talent Assessment
• Launch Excellence• Transformative Marketing
Generating planned results
Developing products to plan
Incremental revenue pipeline
+50BPSR&D SPEND
AS % OF SALES
RESULTS OVER THE LAST 3 YEARS*
+40%R&D ASSOCIATES
HIRED
>$1.2BANNUAL R&D SPEND
TODAY
G&A
S&M
OMXCore Growth
R&D
GrossMargins
*Assumes all three years include a full year contribution from Pall
NEW PRODUCT DEVELOPMENT (NPD) GROWTH
G&A
S&M
OMXCore Growth
R&D
GrossMargins
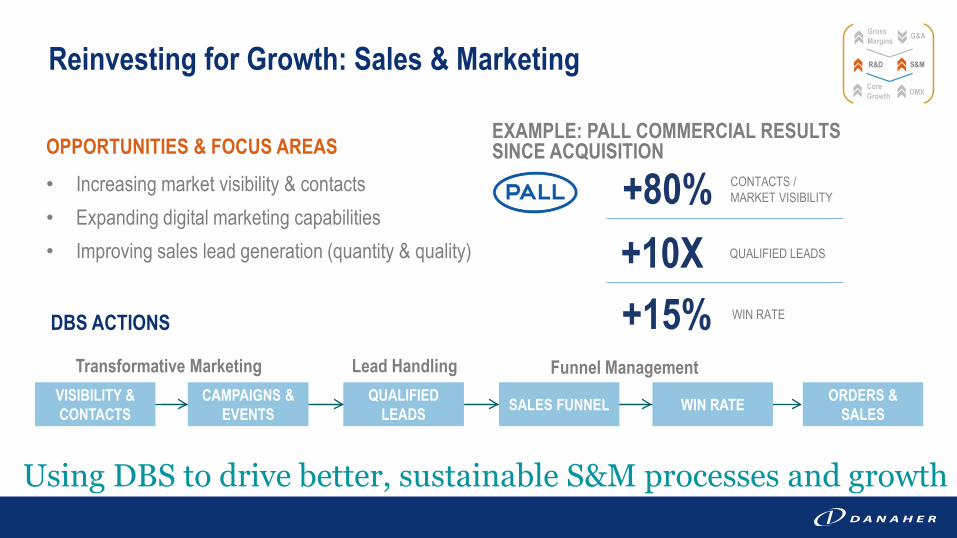
Using DBS to drive better, sustainable S&M processes and growth
Reinvesting for Growth: Sales & Marketing
OPPORTUNITIES & FOCUS AREAS• Increasing market visibility & contacts• Expanding digital marketing capabilities• Improving sales lead generation (quantity & quality)
VISIBILITY & CONTACTS SALES FUNNEL WIN RATEQUALIFIED
LEADSCAMPAIGNS &
EVENTS
DBS ACTIONS
ORDERS & SALES
Transformative Marketing Lead Handling Funnel Management
CONTACTS / MARKET VISIBILITY+80%
WIN RATE+15%
EXAMPLE: PALL COMMERCIAL RESULTS SINCE ACQUISITION
QUALIFIED LEADS+10X
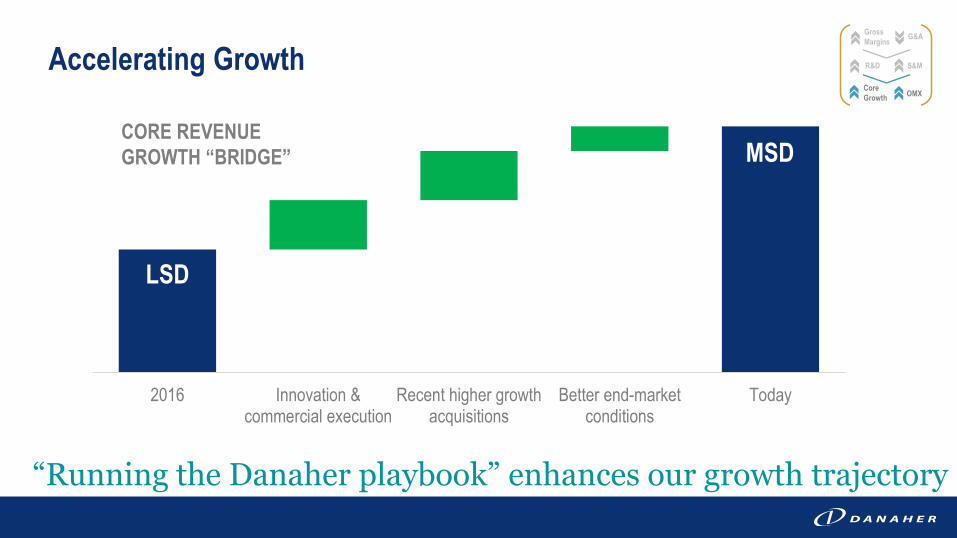
“Running the Danaher playbook” enhances our growth trajectory
Accelerating Growth
2016 Innovation &commercial execution
Recent higher growthacquisitions
Better end-marketconditions
Today
LSD
MSD
G&A
S&M
OMXCore Growth
R&D
GrossMargins
CORE REVENUE GROWTH “BRIDGE”
MARKET
COMPANY
VALUATION
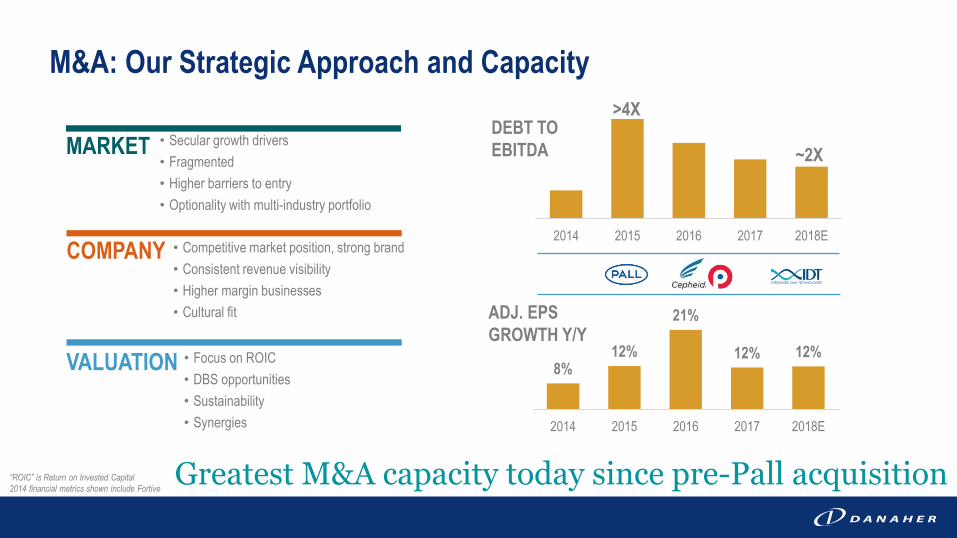
M&A: Our Strategic Approach and Capacity
• Secular growth drivers• Fragmented• Higher barriers to entry• Optionality with multi-industry portfolio
• Competitive market position, strong brand• Consistent revenue visibility• Higher margin businesses• Cultural fit
• Focus on ROIC• DBS opportunities• Sustainability• Synergies
Greatest M&A capacity today since pre-Pall acquisition“ROIC” is Return on Invested Capital2014 financial metrics shown include Fortive
2014 2015 2016 2017 2018E
>4XDEBT TO EBITDA ~2X
8%12%
21%
12% 12%
2014 2015 2016 2017 2018E
ADJ. EPSGROWTH Y/Y
Focused on creating long-term shareholder value
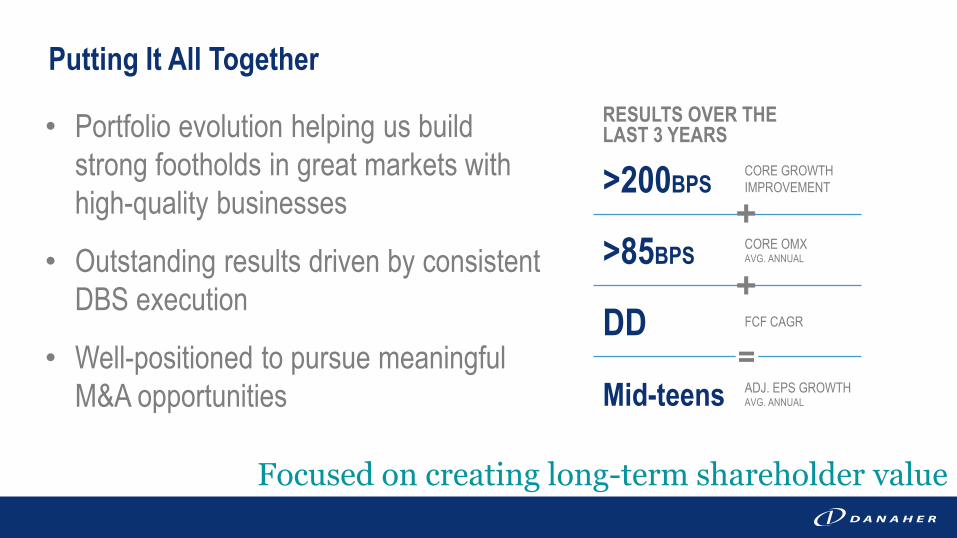
Putting It All Together
>200BPSCORE GROWTH IMPROVEMENT
>85BPS CORE OMXAVG. ANNUAL
DD FCF CAGR
Mid-teens ADJ. EPS GROWTHAVG. ANNUAL
=
RESULTS OVER THE LAST 3 YEARS• Portfolio evolution helping us build
strong footholds in great markets with high-quality businesses
• Outstanding results driven by consistent DBS execution
• Well-positioned to pursue meaningful M&A opportunities


LIFE SCIENCESRainer Blair, Executive Vice President
2018 INVESTOR & ANALYST DAY
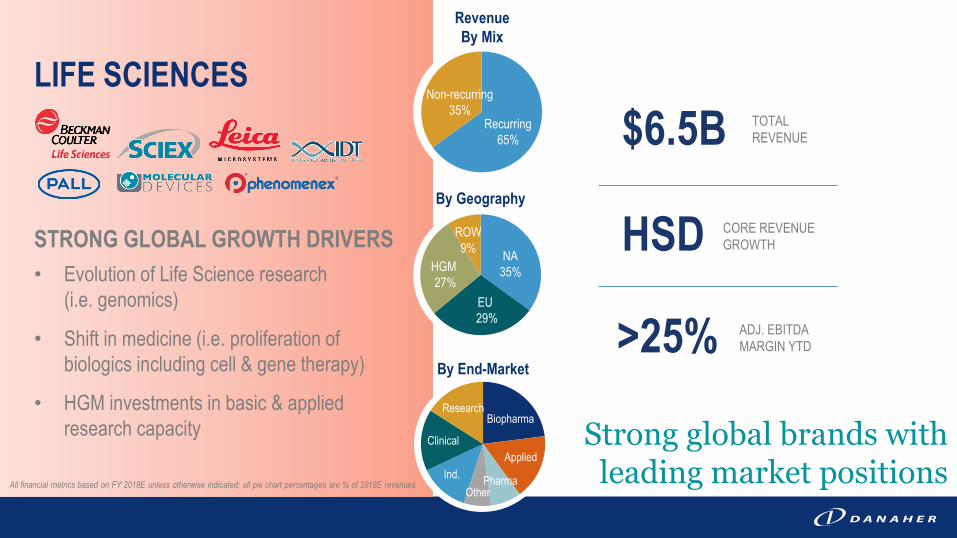
Strong global brands with leading market positions
LIFE SCIENCESTOTAL REVENUE
ADJ. EBITDAMARGIN YTD
CORE REVENUEGROWTH
$6.5B
HSD
>25%
RevenueBy Mix
By Geography
By End-Market
Biopharma /Pharma
Research
Applied
Recurring65%
Non-recurring35%
ROW9% NA
35%
EU29%
HGM27%
STRONG GLOBAL GROWTH DRIVERS• Evolution of Life Science research
(i.e. genomics)
• Shift in medicine (i.e. proliferation of biologics including cell & gene therapy)
• HGM investments in basic & applied research capacity
Ind.
Clinical
BiopharmaResearch
Applied
PharmaOther
All financial metrics based on FY 2018E unless otherwise indicated; all pie chart percentages are % of 2018E revenues
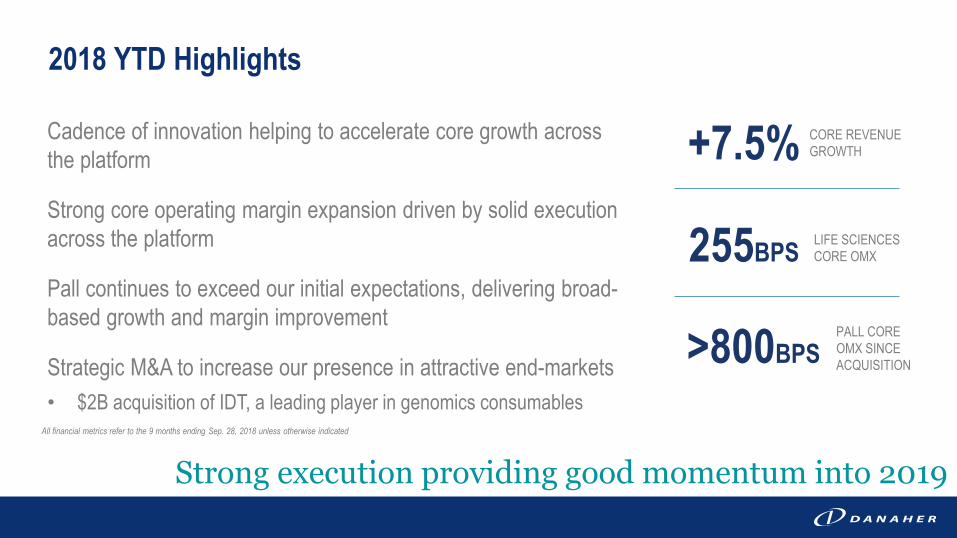
Cadence of innovation helping to accelerate core growth across the platform
Strong core operating margin expansion driven by solid execution across the platform
Pall continues to exceed our initial expectations, delivering broad-based growth and margin improvement
Strategic M&A to increase our presence in attractive end-markets• $2B acquisition of IDT, a leading player in genomics consumables
2018 YTD Highlights
Strong execution providing good momentum into 2019
LIFE SCIENCES CORE OMX255BPS
PALL CORE OMX SINCE ACQUISITION>800BPS
CORE REVENUE GROWTH+7.5%
All financial metrics refer to the 9 months ending Sep. 28, 2018 unless otherwise indicated
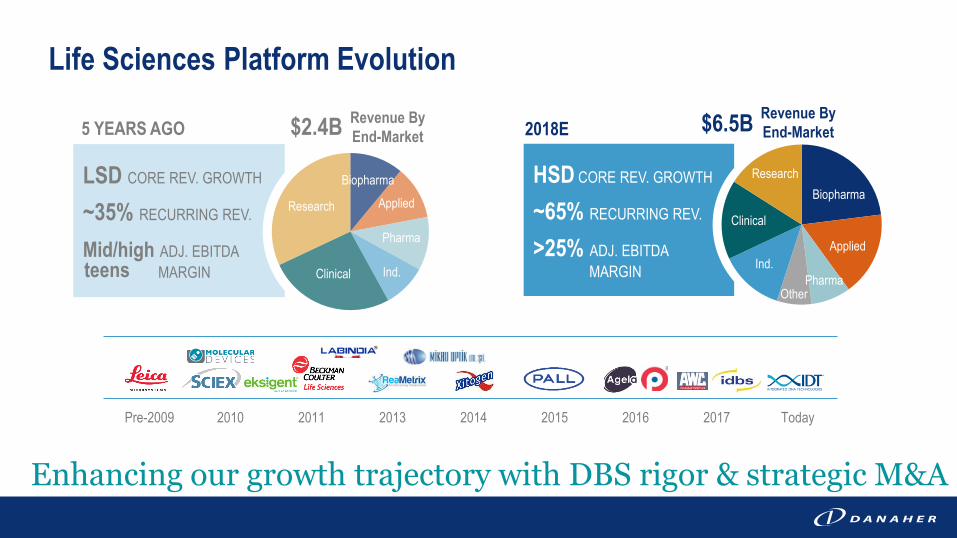
Life Sciences Platform Evolution
Enhancing our growth trajectory with DBS rigor & strategic M&A
LSD CORE REV. GROWTH
~35% RECURRING REV.
Mid/high ADJ. EBITDA MARGIN
5 YEARS AGO
HSD CORE REV. GROWTH
~65% RECURRING REV.
>25% ADJ. EBITDA MARGIN
2018E
Pre-2009 2010 2011 2013 2014 2015 2016 2017 Today
Revenue ByEnd-Market$2.4B
Ind.Clinical
Biopharma
Research Applied
Pharma
Revenue ByEnd-Market$6.5B
Ind.
Clinical
BiopharmaResearch
Applied
PharmaOther
teens
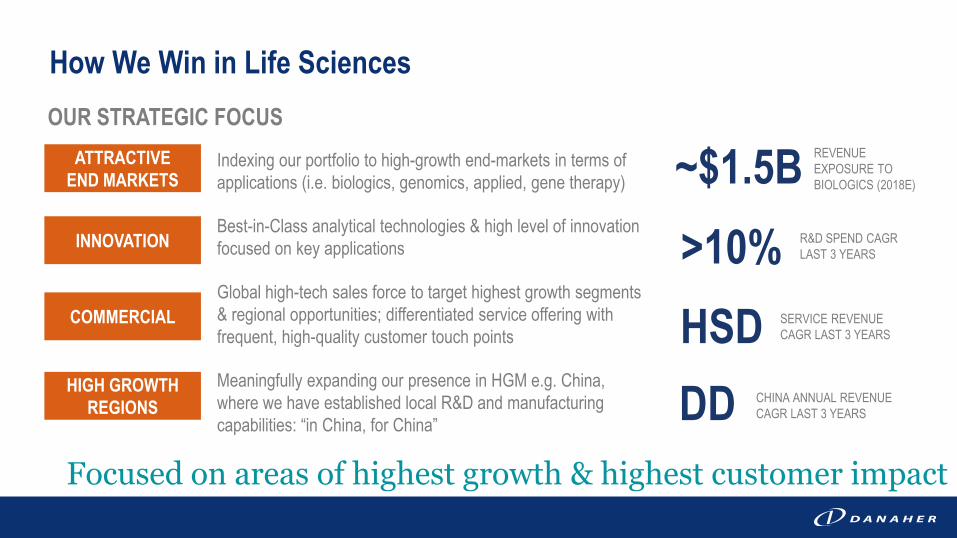
Focused on areas of highest growth & highest customer impact
How We Win in Life SciencesOUR STRATEGIC FOCUS
Indexing our portfolio to high-growth end-markets in terms of applications (i.e. biologics, genomics, applied, gene therapy)
Best-in-Class analytical technologies & high level of innovation focused on key applications
Global high-tech sales force to target highest growth segments & regional opportunities; differentiated service offering with frequent, high-quality customer touch points
Meaningfully expanding our presence in HGM e.g. China, where we have established local R&D and manufacturing capabilities: “in China, for China”
INNOVATION
COMMERCIAL
HIGH GROWTH REGIONS
ATTRACTIVE END MARKETS
SERVICE REVENUE CAGR LAST 3 YEARSHSD
R&D SPEND CAGR LAST 3 YEARS>10%
REVENUE EXPOSURE TO BIOLOGICS (2018E)~$1.5B
CHINA ANNUAL REVENUE CAGR LAST 3 YEARSDD
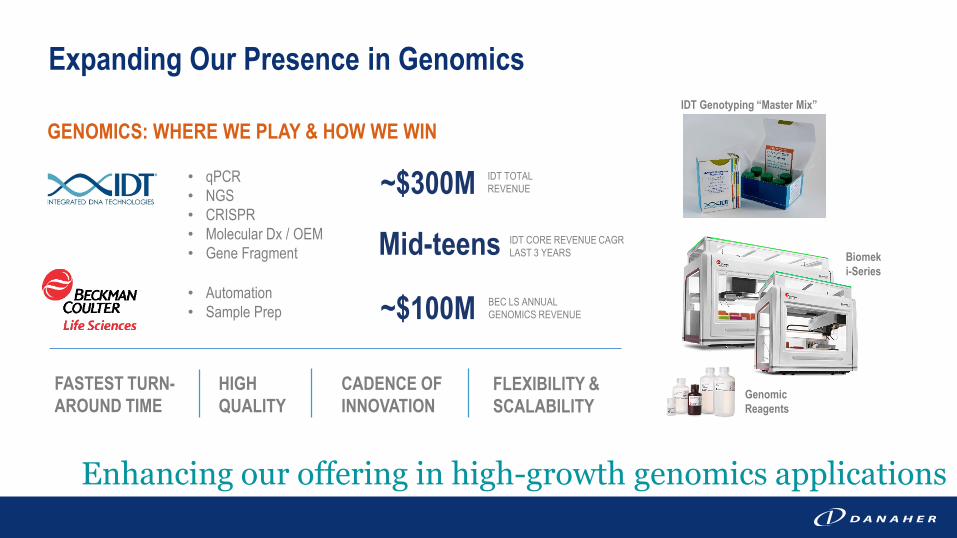
Enhancing our offering in high-growth genomics applications
Expanding Our Presence in Genomics
GENOMICS: WHERE WE PLAY & HOW WE WIN
FASTEST TURN-AROUND TIME
• qPCR• NGS• CRISPR• Molecular Dx / OEM• Gene Fragment
HIGH QUALITY
IDT TOTAL REVENUE~$300M
IDT CORE REVENUE CAGR LAST 3 YEARSMid-teens
• Automation• Sample Prep
BEC LS ANNUAL GENOMICS REVENUE~$100M
CADENCE OF INNOVATION
FLEXIBILITY & SCALABILITY
Biomeki-Series
Genomic Reagents
IDT Genotyping “Master Mix”
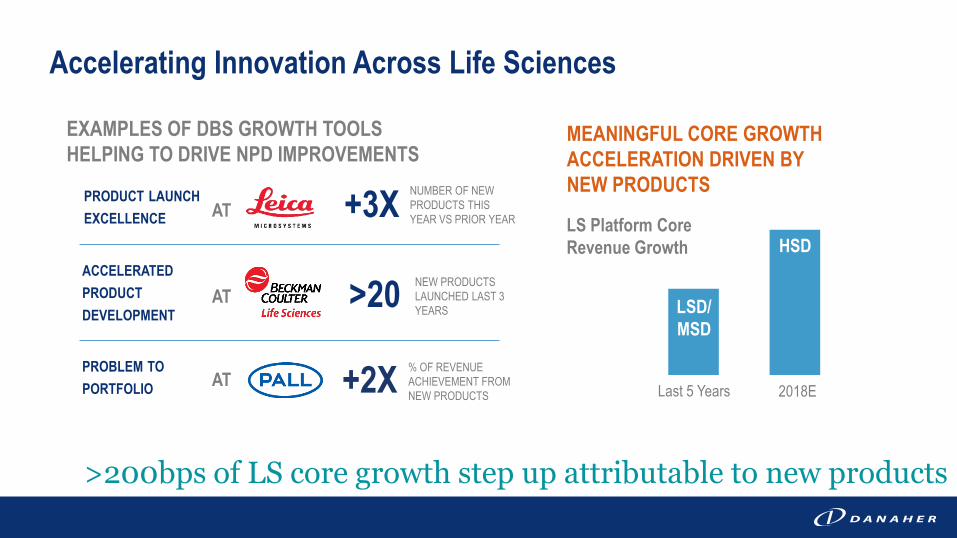
>200bps of LS core growth step up attributable to new products
+3XLS Platform Core Revenue Growth
Accelerating Innovation Across Life Sciences
NUMBER OF NEW PRODUCTS THIS YEAR VS PRIOR YEAR
>20 NEW PRODUCTS LAUNCHED LAST 3 YEARS
MEANINGFUL CORE GROWTH ACCELERATION DRIVEN BY NEW PRODUCTS
Last 5 Years 2018E
HSD
LSD/MSD
% OF REVENUE ACHIEVEMENT FROM NEW PRODUCTS+2X
ACCELERATEDPRODUCTDEVELOPMENT
PRODUCT LAUNCHEXCELLENCE
PROBLEM TOPORTFOLIO
EXAMPLES OF DBS GROWTH TOOLS HELPING TO DRIVE NPD IMPROVEMENTS
AT
AT
AT
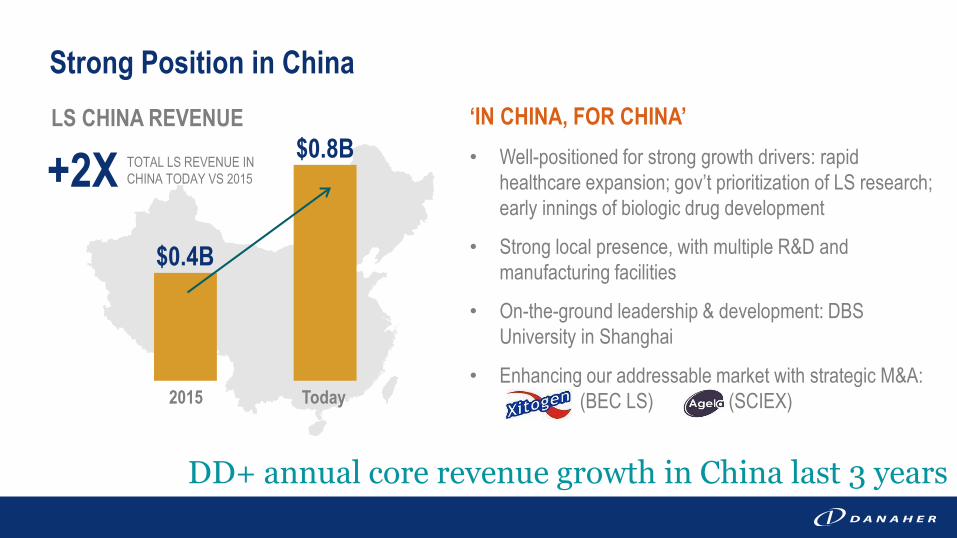
Strong Position in China
DD+ annual core revenue growth in China last 3 years
‘IN CHINA, FOR CHINA’• Well-positioned for strong growth drivers: rapid
healthcare expansion; gov’t prioritization of LS research; early innings of biologic drug development
• Strong local presence, with multiple R&D and manufacturing facilities
• On-the-ground leadership & development: DBS University in Shanghai
• Enhancing our addressable market with strategic M&A: (BEC LS) (SCIEX)Today2015
+2XLS CHINA REVENUE
TOTAL LS REVENUE IN CHINA TODAY VS 2015
$0.8B
$0.4B
Evolving our Life Sciences platform to focus on the most attractive parts of the market and increase recurring revenue
Nearly $1B presence in China provides meaningful opportunities to benefit from long-term secular growth drivers in the region
Enhancing our competitive advantage through DBS-driven innovation and lean execution
Summary


DENTALAmir Aghdaei, Group Executive
2018 INVESTOR & ANALYST DAY
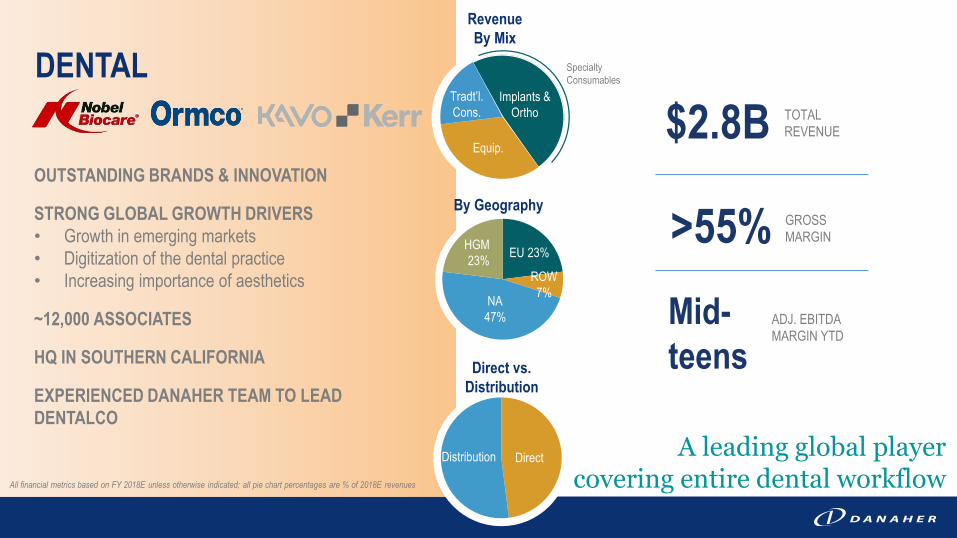
ROW7%NA
47%
EU 23%HGM23%
RevenueBy Mix
By Geography
DENTALTOTAL REVENUE
ADJ. EBITDAMARGIN YTD
$2.8B
Mid-teensDirect vs.
Distribution
DirectDistribution A leading global player covering entire dental workflow
OUTSTANDING BRANDS & INNOVATION
STRONG GLOBAL GROWTH DRIVERS• Growth in emerging markets• Digitization of the dental practice• Increasing importance of aesthetics
~12,000 ASSOCIATES
HQ IN SOUTHERN CALIFORNIA
EXPERIENCED DANAHER TEAM TO LEAD DENTALCO
GROSSMARGIN>55%
Specialty Consumables
Implants & Ortho
Equip.
Tradt’l.Cons.
All financial metrics based on FY 2018E unless otherwise indicated; all pie chart percentages are % of 2018E revenues
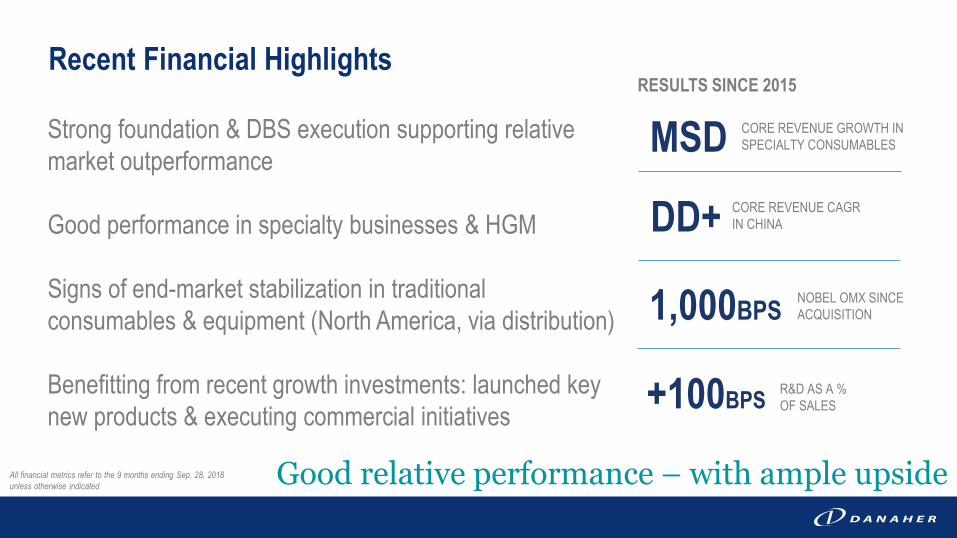
Strong foundation & DBS execution supporting relative market outperformance
Good performance in specialty businesses & HGM
Signs of end-market stabilization in traditional consumables & equipment (North America, via distribution)
Benefitting from recent growth investments: launched key new products & executing commercial initiatives
Recent Financial Highlights
Good relative performance – with ample upside
R&D AS A % OF SALES+100BPS
All financial metrics refer to the 9 months ending Sep. 28, 2018 unless otherwise indicated
NOBEL OMX SINCE ACQUISITION1,000BPS
RESULTS SINCE 2015
CORE REVENUE GROWTH IN SPECIALTY CONSUMABLESMSD
CORE REVENUE CAGR IN CHINADD+
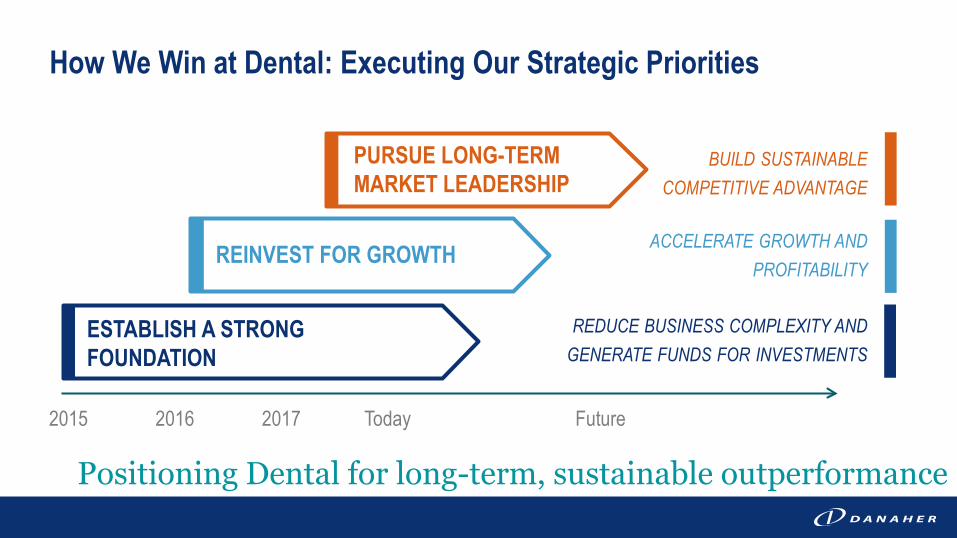
PURSUE LONG-TERM MARKET LEADERSHIP
REINVEST FOR GROWTH
ESTABLISH A STRONG FOUNDATION
How We Win at Dental: Executing Our Strategic Priorities
2015 2016 2017 Today Future
Positioning Dental for long-term, sustainable outperformance
REDUCE BUSINESS COMPLEXITY ANDGENERATE FUNDS FOR INVESTMENTS
ACCELERATE GROWTH ANDPROFITABILITY
BUILD SUSTAINABLECOMPETITIVE ADVANTAGE
Today Future
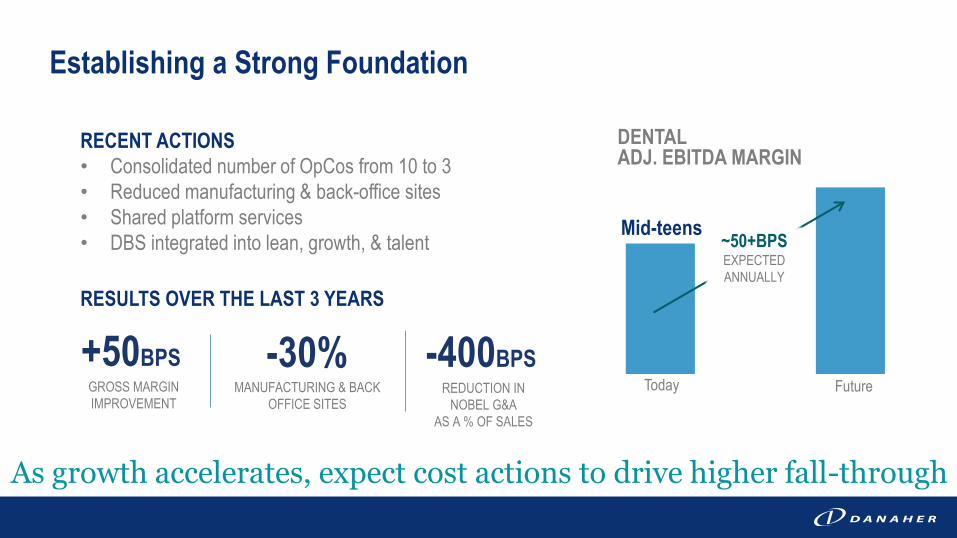
Establishing a Strong Foundation
RECENT ACTIONS• Consolidated number of OpCos from 10 to 3• Reduced manufacturing & back-office sites• Shared platform services• DBS integrated into lean, growth, & talent
RESULTS OVER THE LAST 3 YEARS
+50BPSGROSS MARGIN IMPROVEMENT
-30%MANUFACTURING & BACK
OFFICE SITES
As growth accelerates, expect cost actions to drive higher fall-through
Mid-teens
DENTALADJ. EBITDA MARGIN
~50+BPS EXPECTEDANNUALLY
-400BPSREDUCTION IN
NOBEL G&A AS A % OF SALES
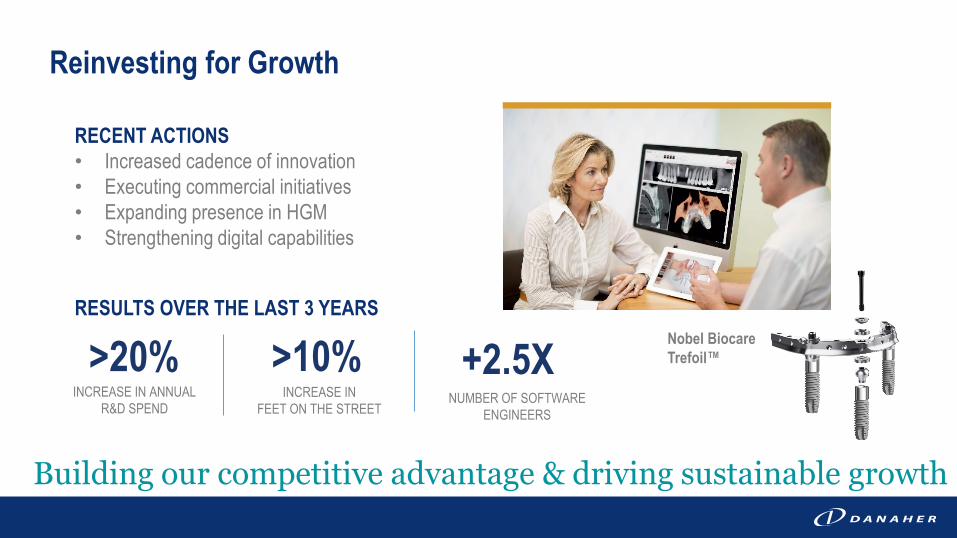
Reinvesting for Growth
Building our competitive advantage & driving sustainable growth
RECENT ACTIONS• Increased cadence of innovation• Executing commercial initiatives• Expanding presence in HGM• Strengthening digital capabilities
RESULTS OVER THE LAST 3 YEARS
>20%INCREASE IN ANNUAL
R&D SPEND
>10%INCREASE IN
FEET ON THE STREETNUMBER OF SOFTWARE
ENGINEERS
+2.5X Nobel BiocareTrefoil™
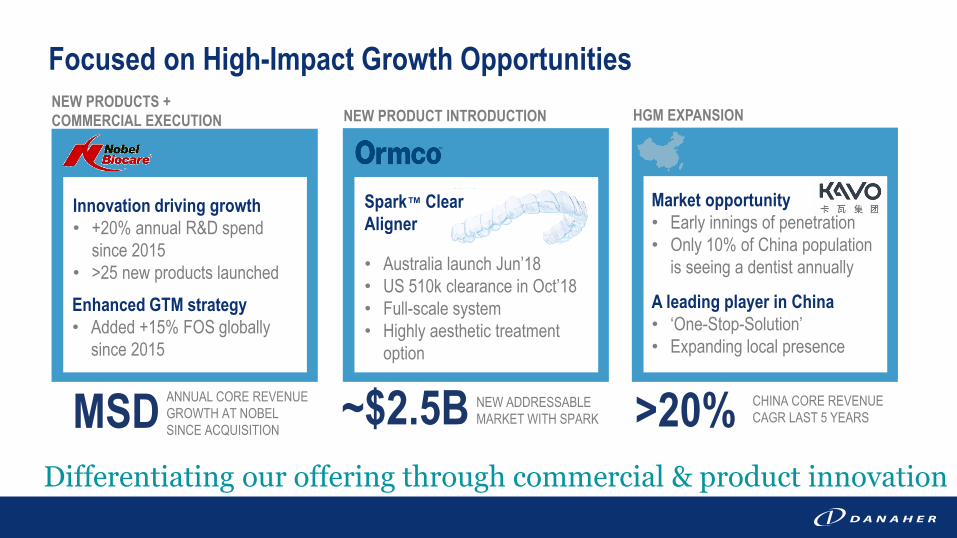
Focused on High-Impact Growth Opportunities
Differentiating our offering through commercial & product innovation
NEW ADDRESSABLE MARKET WITH SPARK~$2.5BANNUAL CORE REVENUE
GROWTH AT NOBEL SINCE ACQUISITIONMSD
NEW PRODUCTS + COMMERCIAL EXECUTION NEW PRODUCT INTRODUCTION HGM EXPANSION
Enhanced GTM strategy• Added +15% FOS globally
since 2015
Innovation driving growth• +20% annual R&D spend
since 2015• >25 new products launched
Spark™ Clear Aligner
• Australia launch Jun’18• US 510k clearance in Oct’18• Full-scale system• Highly aesthetic treatment
option
A leading player in China• ‘One-Stop-Solution’ • Expanding local presence
Market opportunity• Early innings of penetration• Only 10% of China population
is seeing a dentist annually
CHINA CORE REVENUE CAGR LAST 5 YEARS>20%
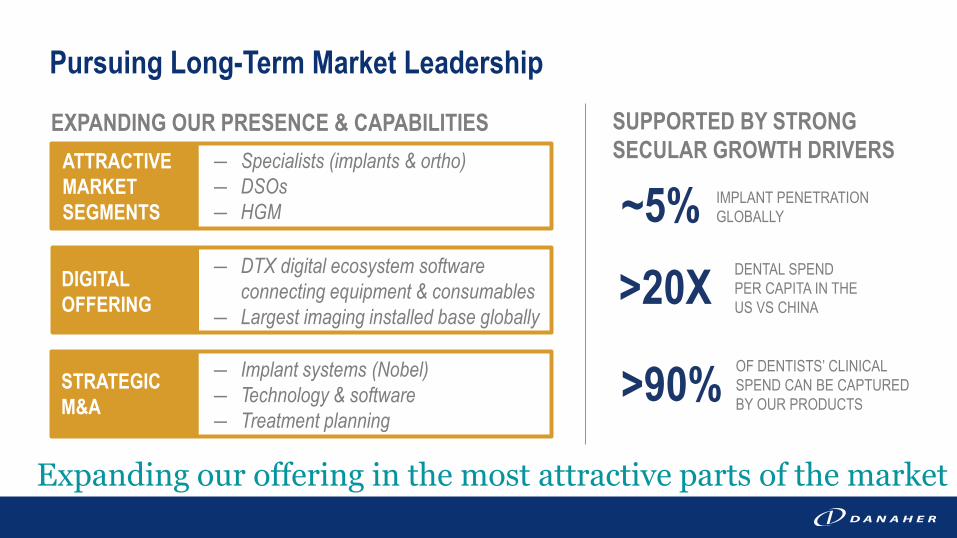
Pursuing Long-Term Market LeadershipSUPPORTED BY STRONG SECULAR GROWTH DRIVERS
IMPLANT PENETRATION GLOBALLY~5%
Expanding our offering in the most attractive parts of the market
ATTRACTIVE MARKET SEGMENTS
DIGITAL OFFERING
STRATEGIC M&A
― Specialists (implants & ortho)― DSOs― HGM
― DTX digital ecosystem software connecting equipment & consumables
― Largest imaging installed base globally
― Implant systems (Nobel)― Technology & software― Treatment planning
EXPANDING OUR PRESENCE & CAPABILITIES
OF DENTISTS’ CLINICAL SPEND CAN BE CAPTURED BY OUR PRODUCTS>90%
DENTAL SPENDPER CAPITA IN THEUS VS CHINA>20X
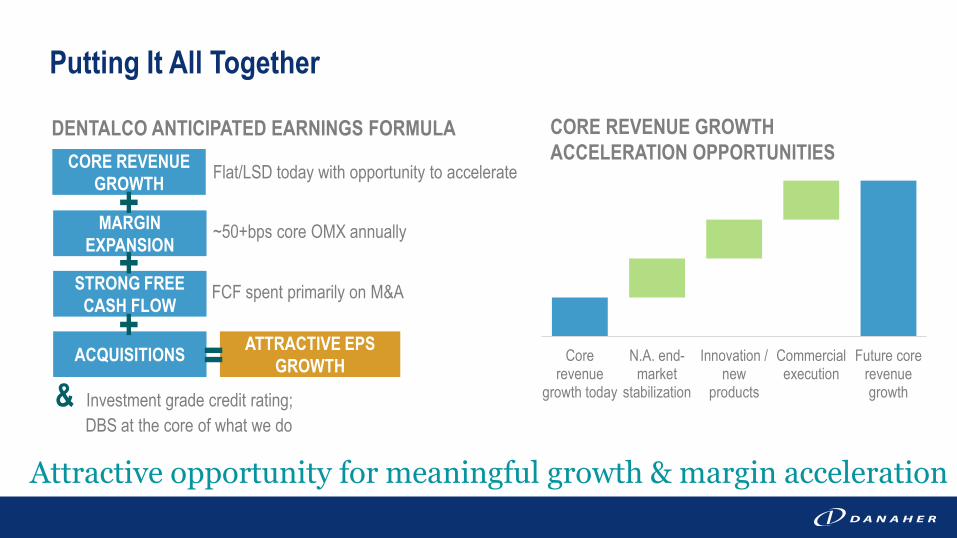
Putting It All Together
Attractive opportunity for meaningful growth & margin acceleration
Corerevenue
growth today
N.A. end-market
stabilization
Innovation /new
products
Commercialexecution
Future corerevenuegrowth
CORE REVENUE GROWTH
MARGIN EXPANSION
STRONG FREE CASH FLOW
ACQUISITIONS
+++ ATTRACTIVE EPS
GROWTH=
Flat/LSD today with opportunity to accelerate
~50+bps core OMX annually
FCF spent primarily on M&A
& Investment grade credit rating;DBS at the core of what we do
DENTALCO ANTICIPATED EARNINGS FORMULA CORE REVENUE GROWTHACCELERATION OPPORTUNITIES
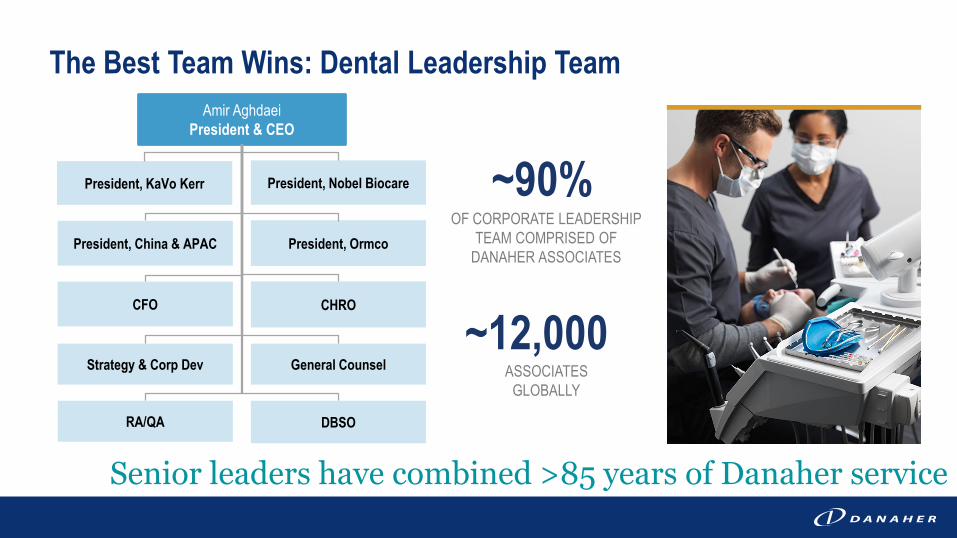
The Best Team Wins: Dental Leadership Team
Senior leaders have combined >85 years of Danaher service
OF CORPORATE LEADERSHIP TEAM COMPRISED OF
DANAHER ASSOCIATES
ASSOCIATES GLOBALLY
~90%
~12,000
Amir AghdaeiPresident & CEO
DBSO
President, China & APAC
CFO
General CounselStrategy & Corp Dev
CHRO
President, Nobel BiocarePresident, KaVo Kerr
President, Ormco
RA/QA
Comprehensive offering and increasing exposure to the most attractive areas of the Dental market
Strong foundation for core revenue growth acceleration and meaningful margin improvement
Attractive earnings growth profile with significant upside
Summary

ENVIRONMENTAL & APPLIED SOLUTIONSJoakim Weidemanis, Executive Vice President
2018 INVESTOR & ANALYST DAY
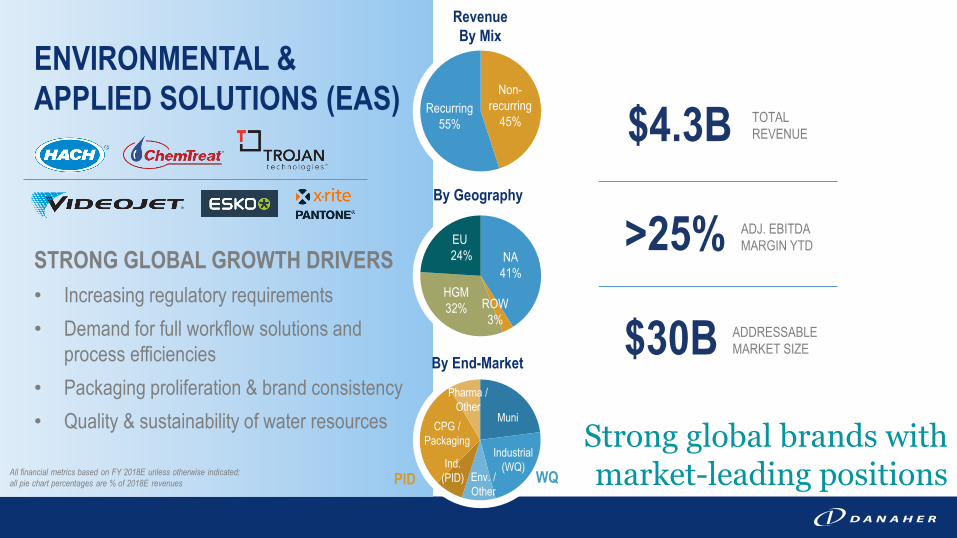
TOTAL REVENUE
ADDRESSABLEMARKET SIZE
$4.3B
$30B
ENVIRONMENTAL & APPLIED SOLUTIONS (EAS)
RevenueBy Mix
By Geography
By End-Market
Muni
ROW3%
NA41%
EU24%
HGM32%
Non-recurring
45%Recurring
55%
Industrial(WQ)
Env. /Other
Strong global brands with market-leading positions
ADJ. EBITDA MARGIN YTD>25%
STRONG GLOBAL GROWTH DRIVERS• Increasing regulatory requirements• Demand for full workflow solutions and
process efficiencies• Packaging proliferation & brand consistency• Quality & sustainability of water resources
Ind. (PID)
CPG / Packaging
Pharma / Other
WQPIDAll financial metrics based on FY 2018E unless otherwise indicated; all pie chart percentages are % of 2018E revenues
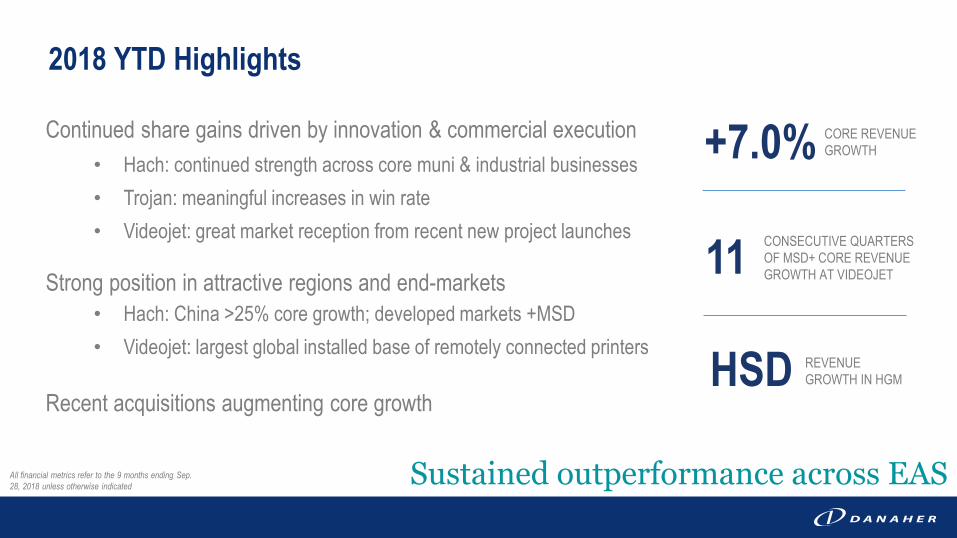
Continued share gains driven by innovation & commercial execution• Hach: continued strength across core muni & industrial businesses• Trojan: meaningful increases in win rate• Videojet: great market reception from recent new project launches
Strong position in attractive regions and end-markets• Hach: China >25% core growth; developed markets +MSD • Videojet: largest global installed base of remotely connected printers
Recent acquisitions augmenting core growth
2018 YTD Highlights
Sustained outperformance across EAS
CORE REVENUE GROWTH+7.0%
CONSECUTIVE QUARTERS OF MSD+ CORE REVENUE GROWTH AT VIDEOJET11
REVENUE GROWTH IN HGMHSD
All financial metrics refer to the 9 months ending Sep. 28, 2018 unless otherwise indicated
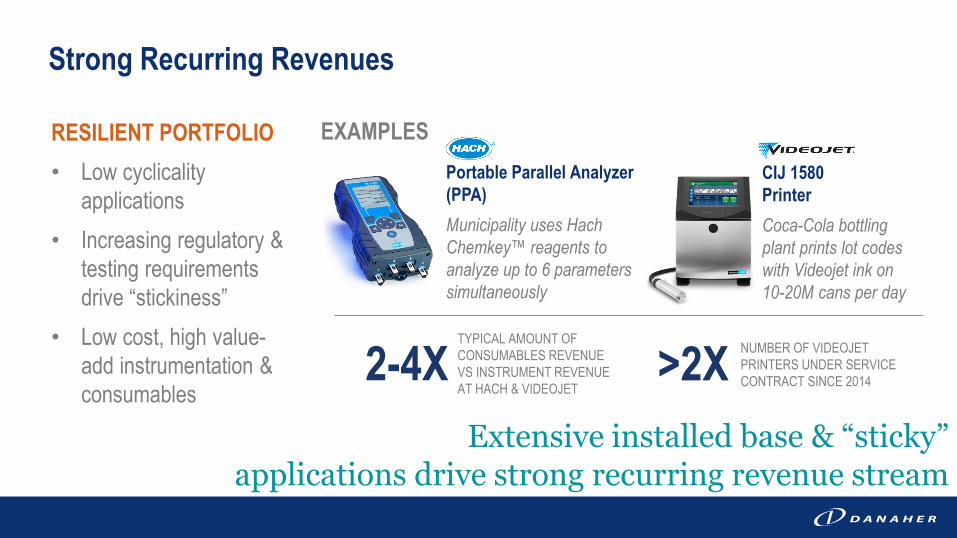
Strong Recurring Revenues
Extensive installed base & “sticky” applications drive strong recurring revenue stream
NUMBER OF VIDEOJET PRINTERS UNDER SERVICE CONTRACT SINCE 2014>2X
EXAMPLESRESILIENT PORTFOLIO• Low cyclicality
applications• Increasing regulatory &
testing requirements drive “stickiness”
• Low cost, high value-add instrumentation & consumables
CIJ 1580 PrinterCoca-Cola bottling plant prints lot codes with Videojet ink on 10-20M cans per day
Portable Parallel Analyzer (PPA)Municipality uses Hach Chemkey™ reagents to analyze up to 6 parameters simultaneously
TYPICAL AMOUNT OF CONSUMABLES REVENUE VS INSTRUMENT REVENUEAT HACH & VIDEOJET
2-4X
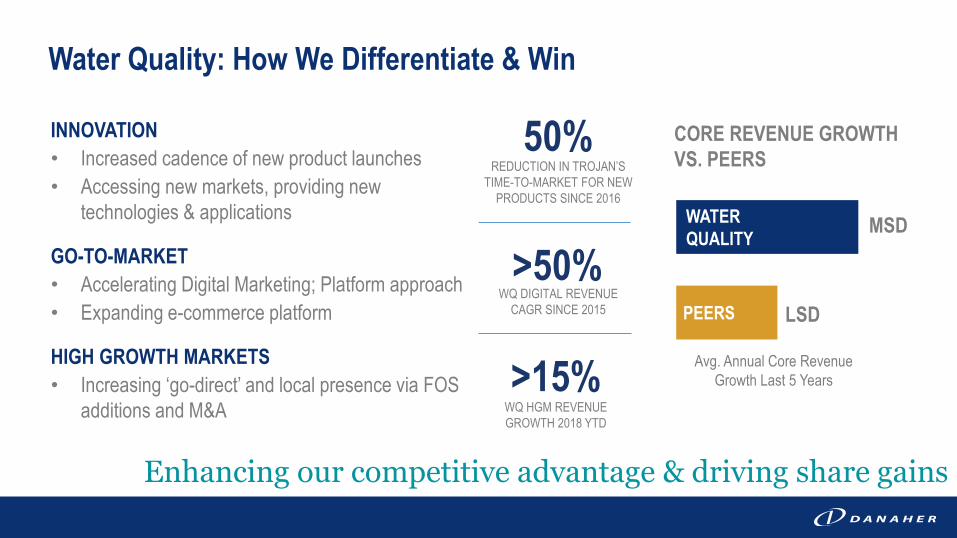
Water Quality: How We Differentiate & Win
CORE REVENUE GROWTH VS. PEERS
Enhancing our competitive advantage & driving share gains
MSD
LSDPEERS
Avg. Annual Core Revenue Growth Last 5 Years
WATER QUALITY
INNOVATION• Increased cadence of new product launches• Accessing new markets, providing new
technologies & applications
GO-TO-MARKET• Accelerating Digital Marketing; Platform approach• Expanding e-commerce platform
HIGH GROWTH MARKETS• Increasing ‘go-direct’ and local presence via FOS
additions and M&A
REDUCTION IN TROJAN’S TIME-TO-MARKET FOR NEW
PRODUCTS SINCE 2016
50%
>50%WQ DIGITAL REVENUE
CAGR SINCE 2015
>15%WQ HGM REVENUE GROWTH 2018 YTD
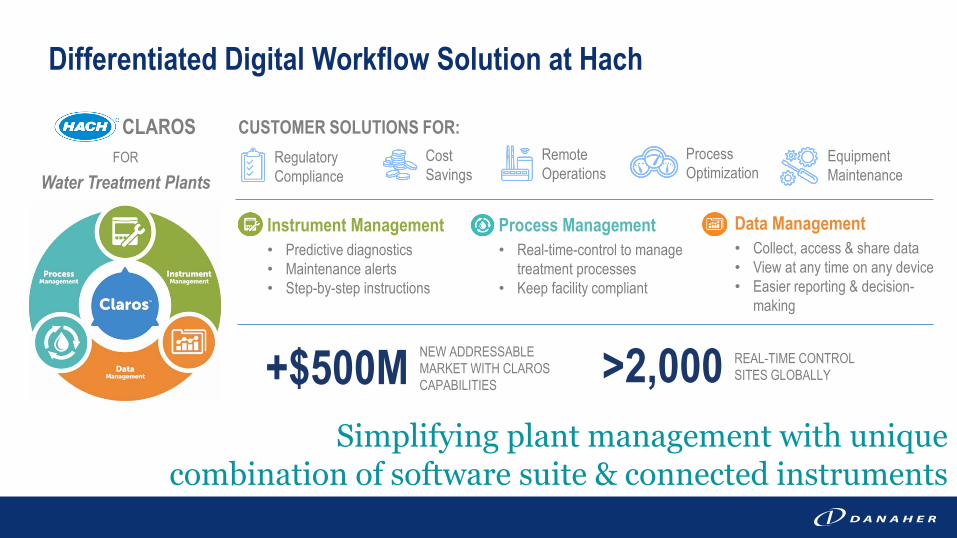
Differentiated Digital Workflow Solution at Hach
Simplifying plant management with unique combination of software suite & connected instruments
Instrument Management• Predictive diagnostics• Maintenance alerts• Step-by-step instructions
Data Management• Collect, access & share data• View at any time on any device• Easier reporting & decision-
making
Process Management• Real-time-control to manage
treatment processes• Keep facility compliant
CLAROS CUSTOMER SOLUTIONS FOR:Regulatory Compliance
Cost Savings
Remote Operations
Process Optimization
Equipment Maintenance
NEW ADDRESSABLE MARKET WITH CLAROS CAPABILITIES+$500M REAL-TIME CONTROL
SITES GLOBALLY>2,000
FOR
Water Treatment Plants
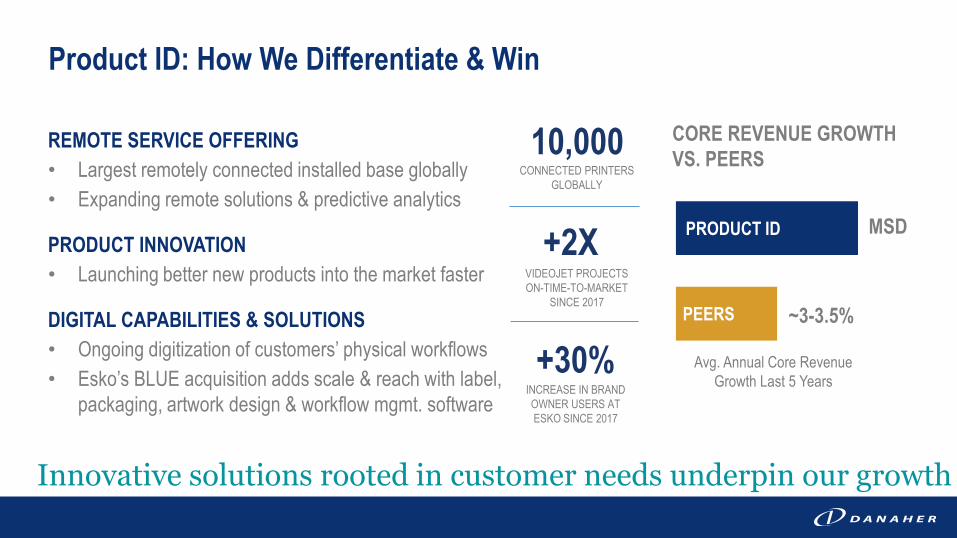
Product ID: How We Differentiate & Win
CORE REVENUE GROWTH VS. PEERS
Innovative solutions rooted in customer needs underpin our growth
MSD
~3-3.5%PEERS
Avg. Annual Core Revenue Growth Last 5 Years
PRODUCT ID
REMOTE SERVICE OFFERING• Largest remotely connected installed base globally• Expanding remote solutions & predictive analytics
PRODUCT INNOVATION• Launching better new products into the market faster
DIGITAL CAPABILITIES & SOLUTIONS• Ongoing digitization of customers’ physical workflows• Esko’s BLUE acquisition adds scale & reach with label,
packaging, artwork design & workflow mgmt. software
CONNECTED PRINTERS GLOBALLY
10,000
+2XVIDEOJET PROJECTS ON-TIME-TO-MARKET
SINCE 2017
+30%INCREASE IN BRAND OWNER USERS AT ESKO SINCE 2017
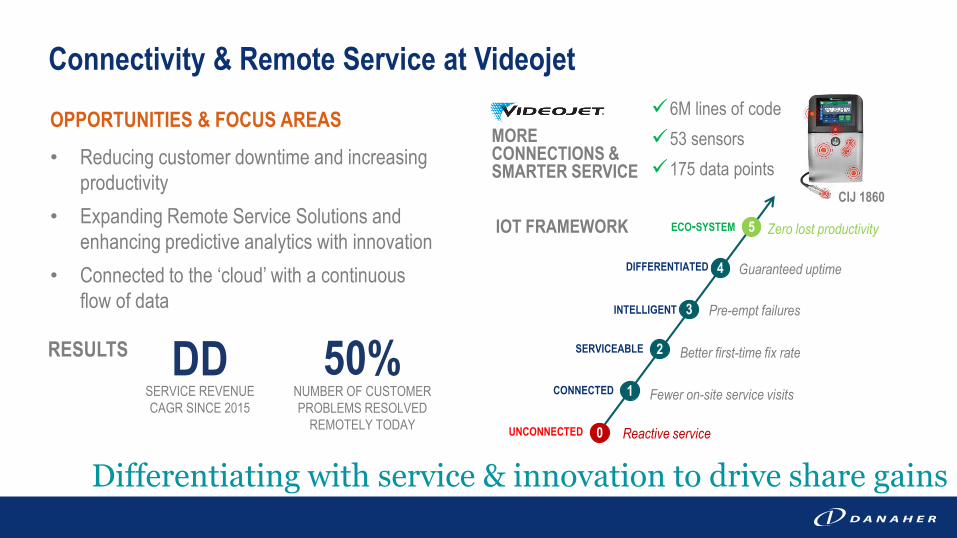
Connectivity & Remote Service at Videojet
Differentiating with service & innovation to drive share gains
SERVICE REVENUE CAGR SINCE 2015
DD
OPPORTUNITIES & FOCUS AREAS• Reducing customer downtime and increasing
productivity• Expanding Remote Service Solutions and
enhancing predictive analytics with innovation• Connected to the ‘cloud’ with a continuous
flow of data
RESULTS
NUMBER OF CUSTOMER PROBLEMS RESOLVED
REMOTELY TODAY
50%
IOT FRAMEWORK
MORE CONNECTIONS & SMARTER SERVICE
6M lines of code53 sensors175 data points
ECO-SYSTEM
SERVICEABLE
INTELLIGENT
DIFFERENTIATED
UNCONNECTED
CONNECTED
Reactive service
Pre-empt failures
Better first-time fix rate
Zero lost productivity
1
0
2
3
4
5
Guaranteed uptime
Fewer on-site service visits
CIJ 1860
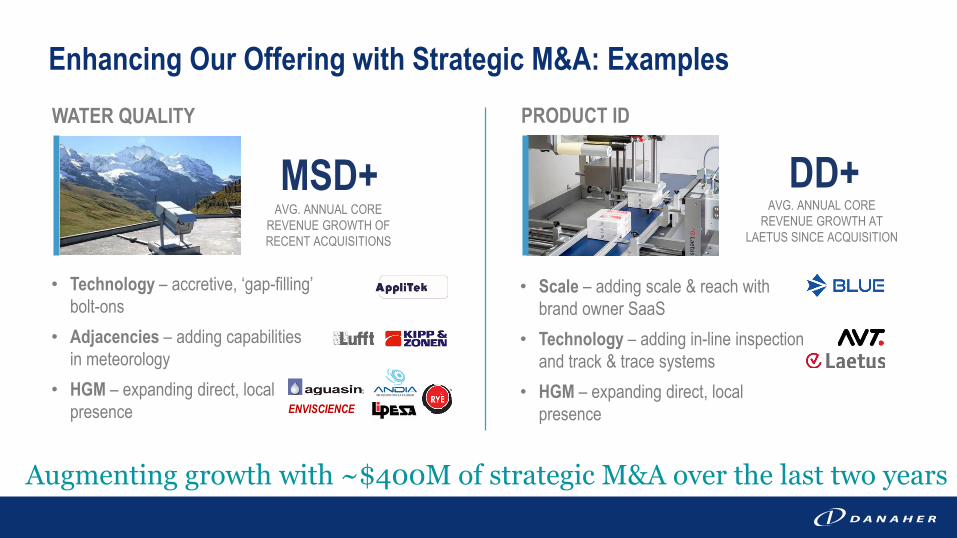
Enhancing Our Offering with Strategic M&A: Examples
Augmenting growth with ~$400M of strategic M&A over the last two years
• Technology – accretive, ‘gap-filling’ bolt-ons
• Adjacencies – adding capabilities in meteorology
• HGM – expanding direct, local presence
WATER QUALITY PRODUCT ID
MSD+AVG. ANNUAL CORE
REVENUE GROWTH OF RECENT ACQUISITIONS
ENVISCIENCE
DD+AVG. ANNUAL CORE
REVENUE GROWTH AT LAETUS SINCE ACQUISITION
• Scale – adding scale & reach with brand owner SaaS
• Technology – adding in-line inspection and track & trace systems
• HGM – expanding direct, local presence
Well-positioned in attractive end-markets and applications, with strong recurring revenues off a market-leading installed base
Differentiated product offering & customer support driving sustained market outperformance
Continuing to pursue high-impact organic & inorganic growth opportunities
Summary
DIAGNOSTICSDan Daniel, Executive Vice President
2018 INVESTOR & ANALYST DAY
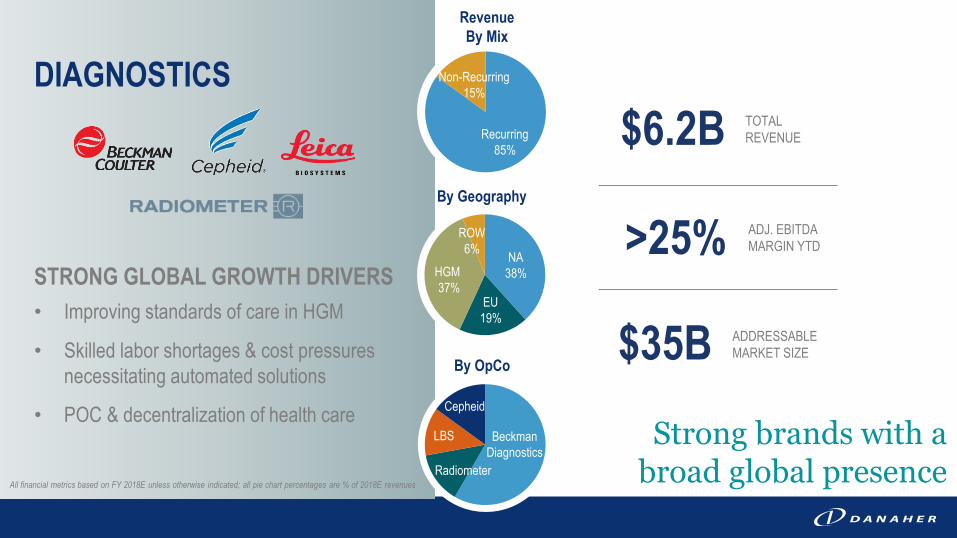
Strong brands with a broad global presence
TOTAL REVENUE
ADJ. EBITDAMARGIN YTD
ADDRESSABLE MARKET SIZE
$6.2B
$35B
>25%
RevenueBy Mix
By Geography
By OpCo
Beckman Diagnostics
Radiometer
LBS
Cepheid
Recurring85%
Non-Recurring15%
All financial metrics based on FY 2018E unless otherwise indicated; all pie chart percentages are % of 2018E revenues
ROW6% NA
38%
EU19%
HGM37%STRONG GLOBAL GROWTH DRIVERS
• Improving standards of care in HGM
• Skilled labor shortages & cost pressures necessitating automated solutions
• POC & decentralization of health care
DIAGNOSTICS
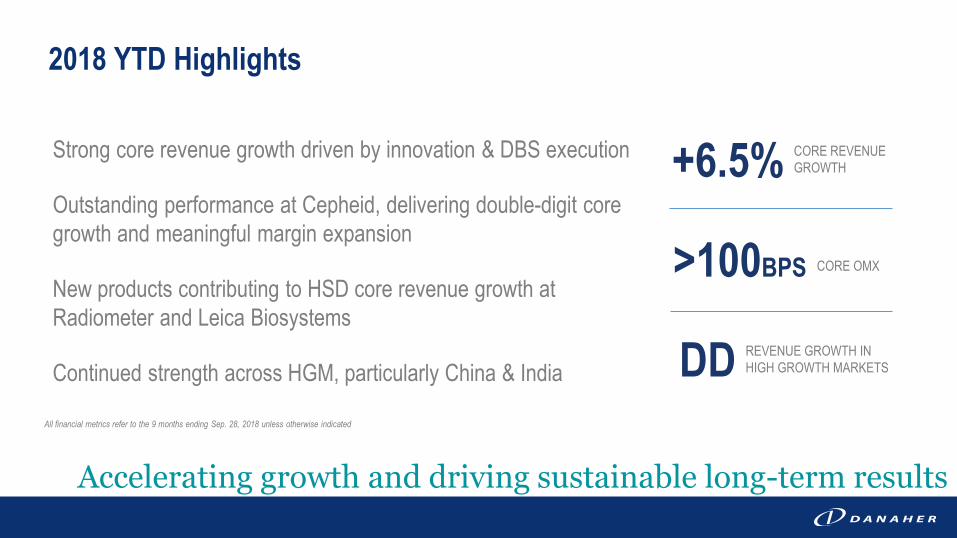
Strong core revenue growth driven by innovation & DBS execution
Outstanding performance at Cepheid, delivering double-digit core growth and meaningful margin expansion
New products contributing to HSD core revenue growth at Radiometer and Leica Biosystems
Continued strength across HGM, particularly China & India
2018 YTD Highlights
Accelerating growth and driving sustainable long-term results
CORE REVENUE GROWTH+6.5%
CORE OMX>100BPS
REVENUE GROWTH IN HIGH GROWTH MARKETSDD
All financial metrics refer to the 9 months ending Sep. 28, 2018 unless otherwise indicated
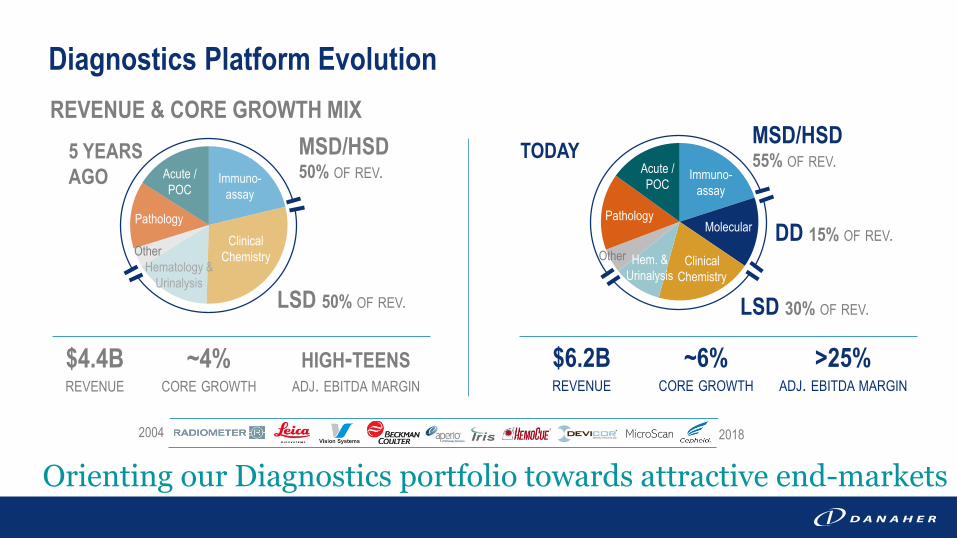
Diagnostics Platform Evolution
Orienting our Diagnostics portfolio towards attractive end-markets
5 YEARS AGO Immuno-
assay
Pathology
ClinicalChemistry
Molecular
Acute /POC
OtherClinical
Chemistry
Acute /POC
Hematology &Urinalysis
Other
Immuno-assay
Pathology
MSD/HSD50% OF REV.
Hem. &Urinalysis
LSD 50% OF REV. LSD 30% OF REV.
DD 15% OF REV.
MSD/HSD55% OF REV.
$4.4BREVENUE
~4%CORE GROWTH
HIGH-TEENSADJ. EBITDA MARGIN
$6.2B REVENUE
~6%CORE GROWTH
>25%ADJ. EBITDA MARGIN
TODAY
REVENUE & CORE GROWTH MIX
MicroScan2004 2018
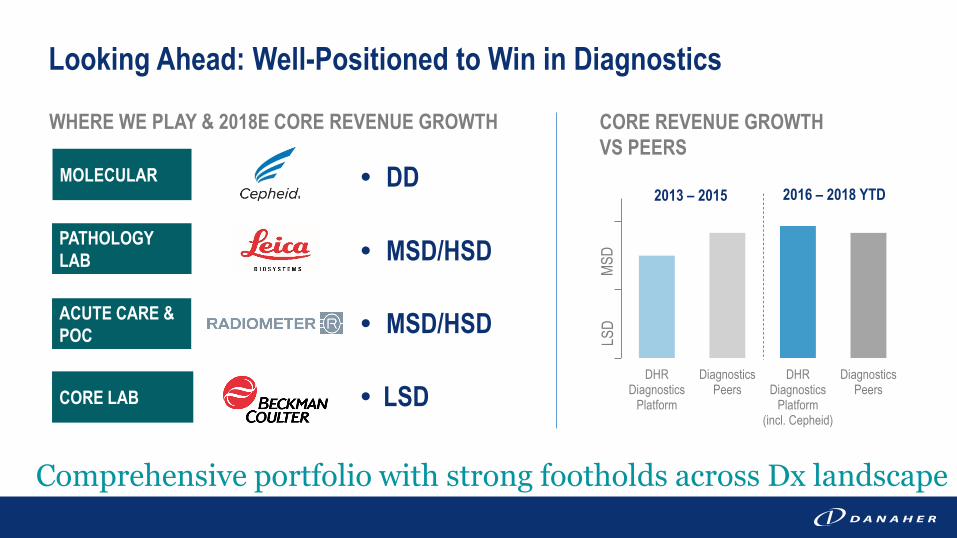
Looking Ahead: Well-Positioned to Win in Diagnostics
Comprehensive portfolio with strong footholds across Dx landscape
DHRDiagnostics
Platform
DiagnosticsPeers
DHRDiagnostics
Platform(incl. Cepheid)
DiagnosticsPeers
CORE REVENUE GROWTH VS PEERS
2013 – 2015
• LSD
PATHOLOGY LAB
ACUTE CARE & POC
CORE LAB
WHERE WE PLAY & 2018E CORE REVENUE GROWTH
2016 – 2018 YTD
LSD
MSD• MSD/HSD
• MSD/HSD
MOLECULAR • DD
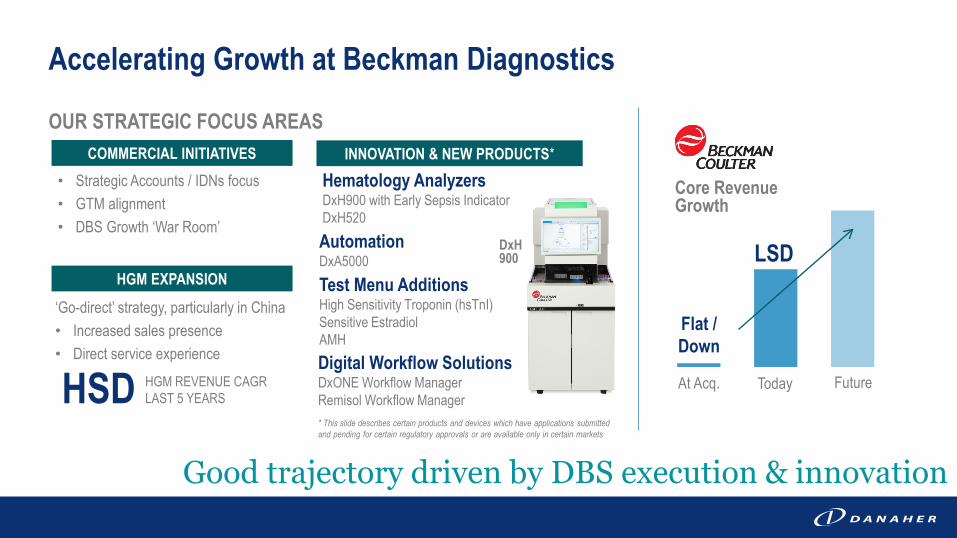
Accelerating Growth at Beckman Diagnostics
Good trajectory driven by DBS execution & innovation
At Acq. Future
Flat /Down
LSD
Core Revenue Growth
INNOVATION & NEW PRODUCTS*
OUR STRATEGIC FOCUS AREAS
Today
Hematology AnalyzersDxH900 with Early Sepsis Indicator DxH520AutomationDxA5000Test Menu AdditionsHigh Sensitivity Troponin (hsTnI) Sensitive EstradiolAMH
COMMERCIAL INITIATIVES
HGM EXPANSION
• Strategic Accounts / IDNs focus• GTM alignment• DBS Growth ‘War Room’
‘Go-direct’ strategy, particularly in China• Increased sales presence• Direct service experience
HSD HGM REVENUE CAGRLAST 5 YEARS
* This slide describes certain products and devices which have applications submitted and pending for certain regulatory approvals or are available only in certain markets
Digital Workflow SolutionsDxONE Workflow ManagerRemisol Workflow Manager
DxH900
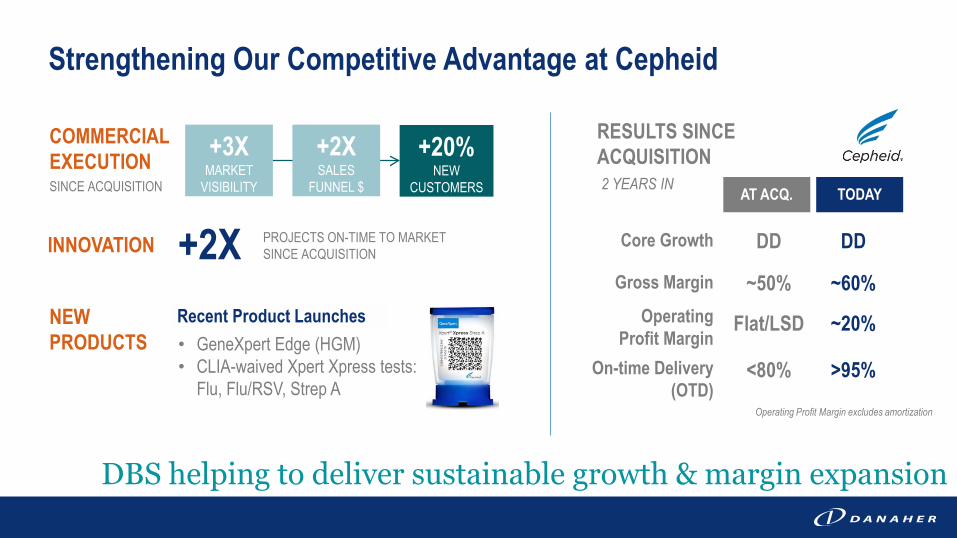
Strengthening Our Competitive Advantage at Cepheid
DBS helping to deliver sustainable growth & margin expansion
DD DD
~50% ~60%
Flat/LSD ~20%
<80% >95%
AT ACQ. TODAY2 YEARS IN
Core Growth
Gross Margin
Operating Profit Margin
On-time Delivery (OTD)
COMMERCIAL EXECUTIONSINCE ACQUISITION
INNOVATION
NEW PRODUCTS
+3XMARKET
VISIBILITY
+2XSALES
FUNNEL $
+20%NEW
CUSTOMERS
+2X PROJECTS ON-TIME TO MARKET SINCE ACQUISITION
• GeneXpert Edge (HGM)• CLIA-waived Xpert Xpress tests:
Flu, Flu/RSV, Strep A
Recent Product Launches
RESULTS SINCE ACQUISITION
Operating Profit Margin excludes amortization
Strong portfolio of Diagnostics businesses oriented towards higher-growth, attractive parts of the market
Well-positioned for growth acceleration opportunities
Cepheid continues to drive meaningful improvements with strong DBS execution
Summary
SUMMARY & OUTLOOKTom Joyce, President & CEO
2018 INVESTOR & ANALYST DAY
What You Heard Today
Strategically building a better, stronger Danaher: increasing recurring revenues & accelerating core revenue growth
Strong DBS execution is our foundation for creating long-term shareholder value
Outstanding 2018 results driven by broad-based strength
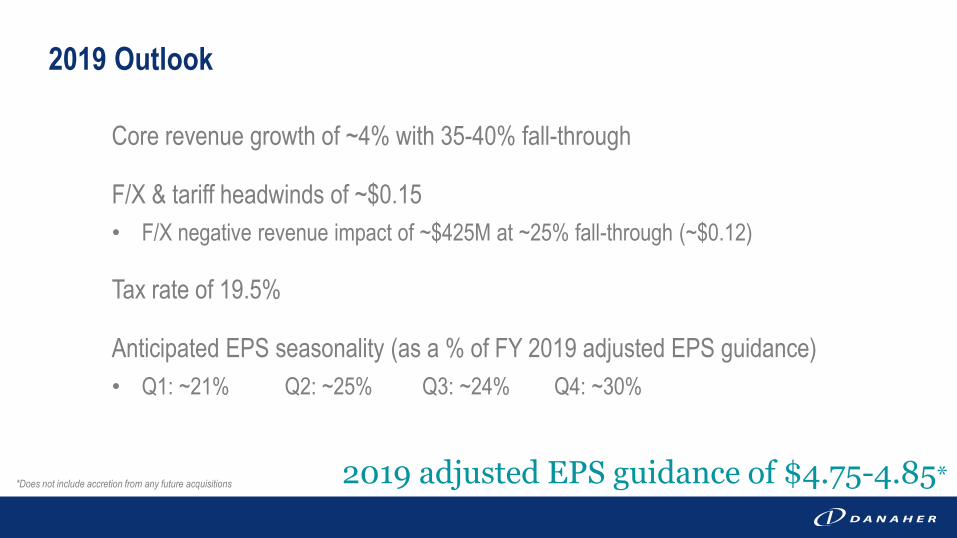
2019 Outlook
Core revenue growth of ~4% with 35-40% fall-through
F/X & tariff headwinds of ~$0.15• F/X negative revenue impact of ~$425M at ~25% fall-through (~$0.12)
Tax rate of 19.5%
Anticipated EPS seasonality (as a % of FY 2019 adjusted EPS guidance)• Q1: ~21% Q2: ~25% Q3: ~24% Q4: ~30%
2019 adjusted EPS guidance of $4.75-4.85**Does not include accretion from any future acquisitions
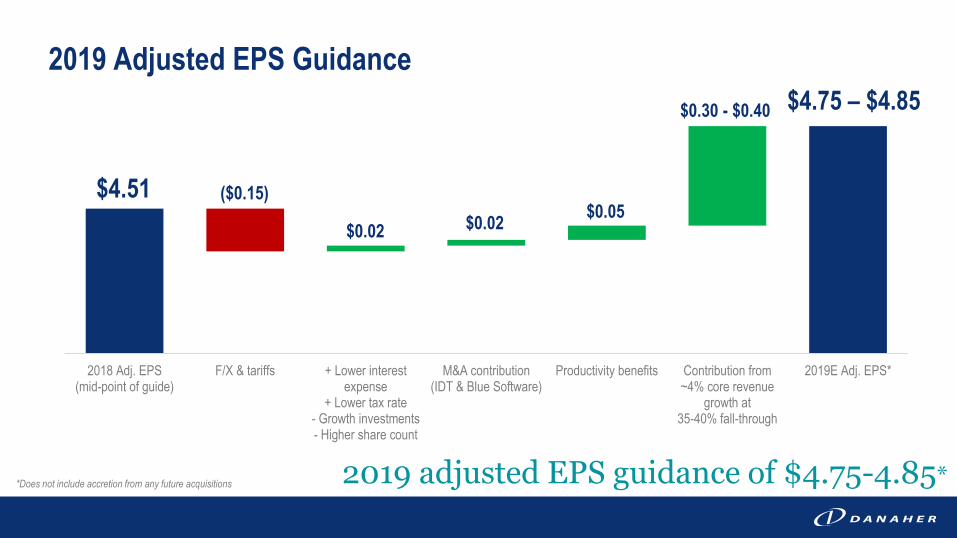
2019 Adjusted EPS Guidance
2018 Adj. EPS(mid-point of guide)
F/X & tariffs + Lower interestexpense
+ Lower tax rate- Growth investments- Higher share count
M&A contribution(IDT & Blue Software)
Productivity benefits Contribution from~4% core revenue
growth at35-40% fall-through
2019E Adj. EPS*
$4.51
$4.75 – $4.85
($0.15)$0.02$0.02
$0.30 - $0.40
2019 adjusted EPS guidance of $4.75-4.85**Does not include accretion from any future acquisitions
$0.05
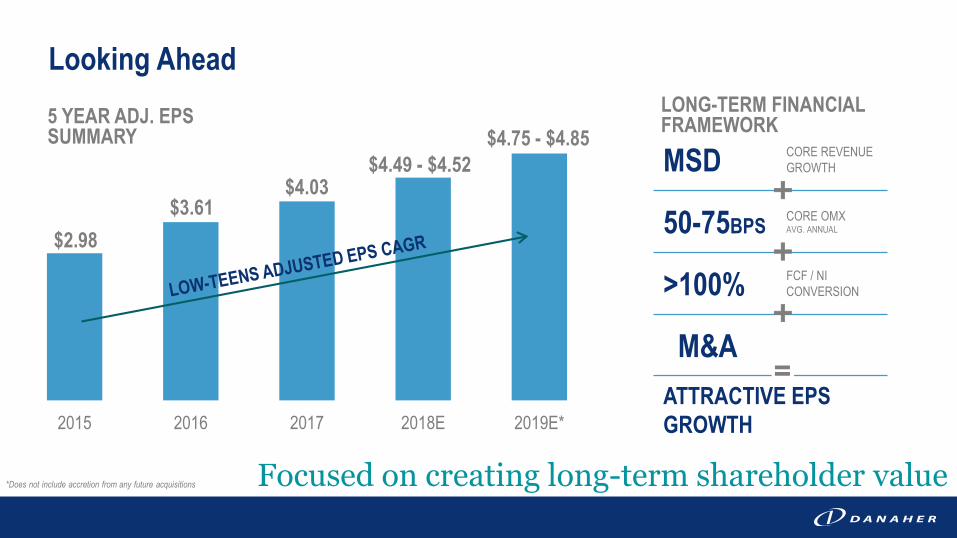
Looking Ahead
Focused on creating long-term shareholder value
2015 2016 2017 2018E 2019E*
$2.98
$4.03$3.61
$4.49 - $4.52
*Does not include accretion from any future acquisitions
$4.75 - $4.85MSD CORE REVENUE
GROWTH
50-75BPS CORE OMXAVG. ANNUAL
>100% FCF / NI CONVERSION
M&AATTRACTIVE EPS GROWTH
LONG-TERM FINANCIAL FRAMEWORK5 YEAR ADJ. EPS
SUMMARY
=

67
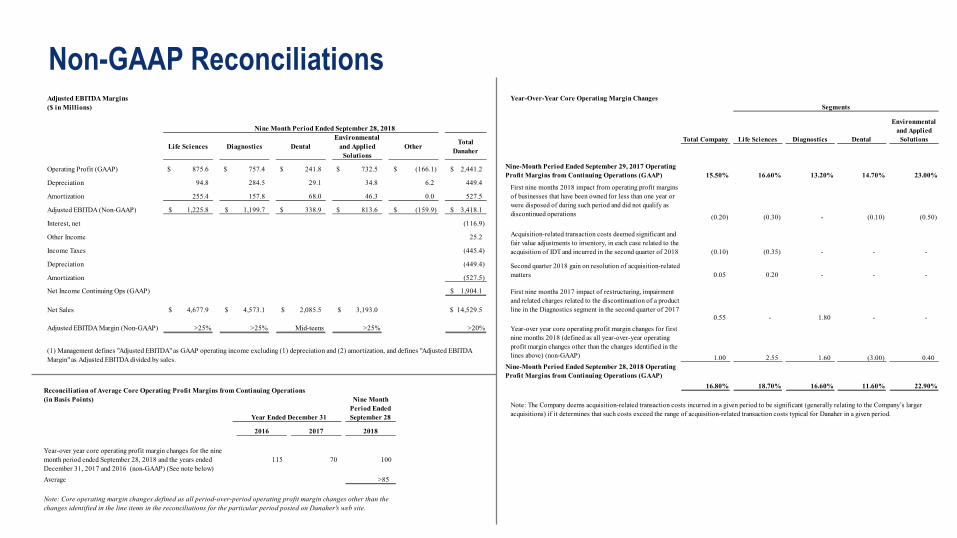
Non-GAAP ReconciliationsAdjusted EBITDA Margins($ in Millions)
Life Sciences Diagnostics DentalEnvironmental
and Applied Solutions
Other Total Danaher
Operating Profit (GAAP) 875.6$ 757.4$ 241.8$ 732.5$ (166.1)$ 2,441.2$
Depreciation 94.8 284.5 29.1 34.8 6.2 449.4
Amortization 255.4 157.8 68.0 46.3 0.0 527.5
Adjusted EBITDA (Non-GAAP) 1,225.8$ 1,199.7$ 338.9$ 813.6$ (159.9)$ 3,418.1$
Interest, net (116.9)
Other Income 25.2
Income Taxes (445.4)
Depreciation (449.4)
Amortization (527.5)
Net Income Continuing Ops (GAAP) 1,904.1$
Net Sales 4,677.9$ 4,573.1$ 2,085.5$ 3,193.0$ 14,529.5$
Adjusted EBITDA Margin (Non-GAAP) >25% >25% Mid-teens >25% >20%
Nine Month Period Ended September 28, 2018
(1) Management defines "Adjusted EBITDA" as GAAP operating income excluding (1) depreciation and (2) amortization, and defines "Adjusted EBITDA Margin" as Adjusted EBITDA divided by sales.
Year-Over-Year Core Operating Margin Changes
Total Company Life Sciences Diagnostics Dental
Environmental and Applied
Solutions
15.50% 16.60% 13.20% 14.70% 23.00%
First nine months 2018 impact from operating profit margins of businesses that have been owned for less than one year or were disposed of during such period and did not qualify as discontinued operations (0.20) (0.30) - (0.10) (0.50)
Acquisition-related transaction costs deemed significant and fair value adjustments to inventory, in each case related to the acquisition of IDT and incurred in the second quarter of 2018 (0.10) (0.35) - - -
Second quarter 2018 gain on resolution of acquisition-related matters 0.05 0.20 - - -
First nine months 2017 impact of restructuring, impairment and related charges related to the discontinuation of a product line in the Diagnostics segment in the second quarter of 2017
0.55 - 1.80 - - Year-over year core operating profit margin changes for first nine months 2018 (defined as all year-over-year operating profit margin changes other than the changes identified in the lines above) (non-GAAP) 1.00 2.55 1.60 (3.00) 0.40
16.80% 18.70% 16.60% 11.60% 22.90%
Segments
Nine-Month Period Ended September 29, 2017 Operating Profit Margins from Continuing Operations (GAAP)
Nine-Month Period Ended September 28, 2018 Operating Profit Margins from Continuing Operations (GAAP)
Note: The Company deems acquisition-related transaction costs incurred in a given period to be significant (generally relating to the Company’s larger acquisitions) if it determines that such costs exceed the range of acquisition-related transaction costs typical for Danaher in a given period.
Reconciliation of Average Core Operating Profit Margins from Continuing Operations(in Basis Points) Nine Month
Period Ended September 28
2016 2017 2018
115 70 100
Average >85
Note: Core operating margin changes defined as all period-over-period operating profit margin changes other than the changes identified in the line items in the reconciliations for the particular period posted on Danaher's web site.
Year Ended December 31
Year-over year core operating profit margin changes for the nine month period ended September 28, 2018 and the years ended December 31, 2017 and 2016 (non-GAAP) (See note below)
68
Non-GAAP Reconciliations($ in Millions)
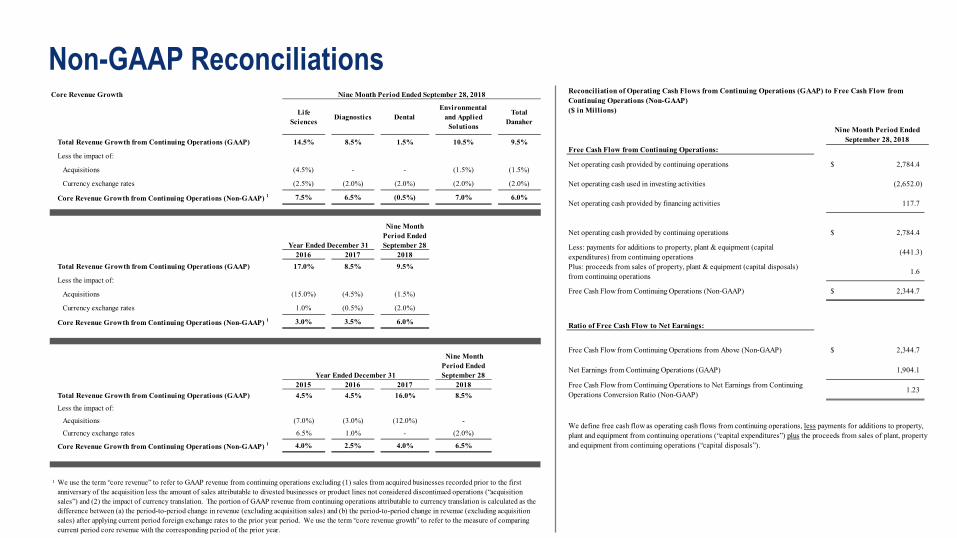
Free Cash Flow from Continuing Operations:
Net operating cash provided by continuing operations 2,784.4$
Net operating cash used in investing activities (2,652.0)
Net operating cash provided by financing activities 117.7
Net operating cash provided by continuing operations 2,784.4$
Less: payments for additions to property, plant & equipment (capital expenditures) from continuing operations (441.3)
Plus: proceeds from sales of property, plant & equipment (capital disposals) from continuing operations 1.6
Free Cash Flow from Continuing Operations (Non-GAAP) 2,344.7$
Ratio of Free Cash Flow to Net Earnings:
Free Cash Flow from Continuing Operations from Above (Non-GAAP) 2,344.7$
Net Earnings from Continuing Operations (GAAP) 1,904.1
Free Cash Flow from Continuing Operations to Net Earnings from Continuing Operations Conversion Ratio (Non-GAAP) 1.23
Reconciliation of Operating Cash Flows from Continuing Operations (GAAP) to Free Cash Flow from Continuing Operations (Non-GAAP)
Nine Month Period Ended September 28, 2018
We define free cash flow as operating cash flows from continuing operations, less payments for additions to property, plant and equipment from continuing operations (“capital expenditures”) plus the proceeds from sales of plant, property and equipment from continuing operations (“capital disposals”).
Core Revenue Growth
Life Sciences Diagnostics Dental
Environmental and Applied
Solutions
Total Danaher
Total Revenue Growth from Continuing Operations (GAAP) 14.5% 8.5% 1.5% 10.5% 9.5%
Less the impact of:
Acquisitions (4.5%) - - (1.5%) (1.5%)
Currency exchange rates (2.5%) (2.0%) (2.0%) (2.0%) (2.0%)
Core Revenue Growth from Continuing Operations (Non-GAAP) 1 7.5% 6.5% (0.5%) 7.0% 6.0%
Nine Month Period Ended September 28
2016 2017 2018Total Revenue Growth from Continuing Operations (GAAP) 17.0% 8.5% 9.5%
Less the impact of:
Acquisitions (15.0%) (4.5%) (1.5%)
Currency exchange rates 1.0% (0.5%) (2.0%)
Core Revenue Growth from Continuing Operations (Non-GAAP) 1 3.0% 3.5% 6.0%
Nine Month Period Ended September 28
2015 2016 2017 2018Total Revenue Growth from Continuing Operations (GAAP) 4.5% 4.5% 16.0% 8.5%
Less the impact of:
Acquisitions (7.0%) (3.0%) (12.0%) -
Currency exchange rates 6.5% 1.0% - (2.0%)
Core Revenue Growth from Continuing Operations (Non-GAAP) 1 4.0% 2.5% 4.0% 6.5%
1
Year Ended December 31
We use the term “core revenue” to refer to GAAP revenue from continuing operations excluding (1) sales from acquired businesses recorded prior to the first anniversary of the acquisition less the amount of sales attributable to divested businesses or product lines not considered discontinued operations (“acquisition sales”) and (2) the impact of currency translation. The portion of GAAP revenue from continuing operations attributable to currency translation is calculated as the difference between (a) the period-to-period change in revenue (excluding acquisition sales) and (b) the period-to-period change in revenue (excluding acquisition sales) after applying current period foreign exchange rates to the prior year period. We use the term “core revenue growth” to refer to the measure of comparing current period core revenue with the corresponding period of the prior year.
Nine Month Period Ended September 28, 2018
Year Ended December 31
69
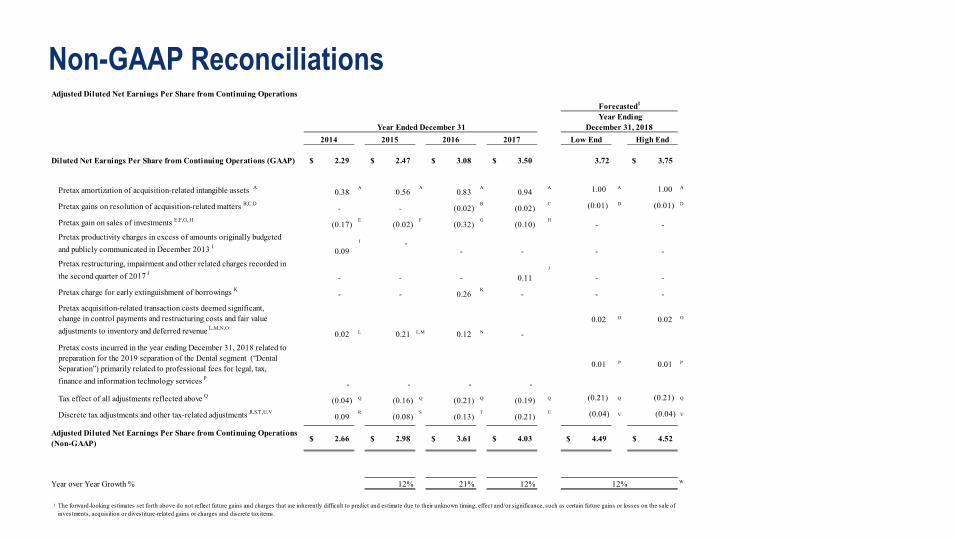
Non-GAAP ReconciliationsAdjusted Diluted Net Earnings Per Share from Continuing Operations
2014 2015 2016 2017 Low End High End
Diluted Net Earnings Per Share from Continuing Operations (GAAP) 2.29$ 2.47$ 3.08$ 3.50$ 3.72 3.75$
Pretax amortization of acquisition-related intangible assets A 0.38 A
0.56 A
0.83 A
0.94 A 1.00 A 1.00 A
Pretax gains on resolution of acquisition-related matters B,C,D- - (0.02)
B(0.02)
C (0.01) D (0.01) D
Pretax gain on sales of investments E,F,G, H(0.17)
E(0.02)
F(0.32)
G(0.10)
H- -
Pretax productivity charges in excess of amounts originally budgeted and publicly communicated in December 2013 I 0.09
I - - - - -
Pretax restructuring, impairment and other related charges recorded in the second quarter of 2017 J
- - - 0.11 J
- -
Pretax charge for early extinguishment of borrowings K - - 0.26 K
- - -
Pretax acquisition-related transaction costs deemed significant, change in control payments and restructuring costs and fair value adjustments to inventory and deferred revenue L,M,N,O
0.02 L 0.21 L,M 0.12 N -
0.02 O 0.02 O
Pretax costs incurred in the year ending December 31, 2018 related to preparation for the 2019 separation of the Dental segment (“Dental Separation”) primarily related to professional fees for legal, tax, finance and information technology services P
- - - -
0.01 P 0.01 P
Tax effect of all adjustments reflected above Q(0.04) Q (0.16) Q (0.21) Q (0.19) Q (0.21) Q (0.21) Q
Discrete tax adjustments and other tax-related adjustments R,S,T ,U,V0.09
R(0.08)
S(0.13)
T(0.21)
U (0.04) V (0.04) V
2.66$ 2.98$ 3.61$ 4.03$ 4.49$ 4.52$
Year over Year Growth % 12% 21% 12% W
1 The forward-looking estimates set forth above do not reflect future gains and charges that are inherently difficult to predict and estimate due to their unknown timing, effect and/or significance, such as certain future gains or losses on the sale of investments, acquisition or divestiture-related gains or charges and discrete tax items.
12%
Year Ended December 31
Adjusted Diluted Net Earnings Per Share from Continuing Operations (Non-GAAP)
Forecasted1
Year Ending December 31, 2018
70
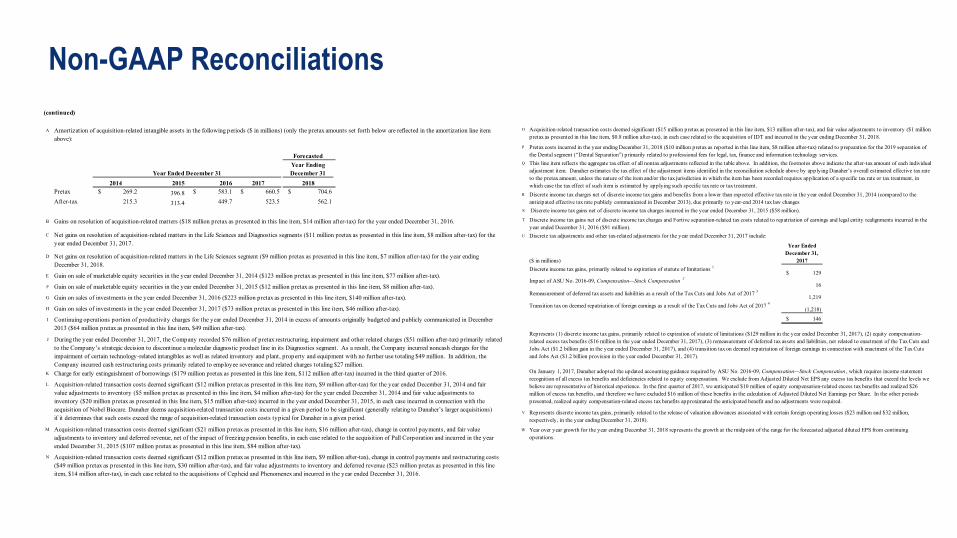
Non-GAAP Reconciliations(continued)
A
ForecastedYear Ending December 31
2014 2015 2016 2017 2018Pretax $ 269.2 396.8 $ 583.1 $ 660.5 $ 704.6 After-tax 215.3 313.4 449.7 523.5 562.1
B
C
D
E
F
G
H
I
J
K
L
M
N Acquisition-related transaction costs deemed significant ($12 million pretax as presented in this line item, $9 million after-tax), change in control payments and restructuring costs ($49 million pretax as presented in this line item, $30 million after-tax), and fair value adjustments to inventory and deferred revenue ($23 million pretax as presented in this line item, $14 million after-tax), in each case related to the acquisitions of Cepheid and Phenomenex and incurred in the year ended December 31, 2016.
Charge for early extinguishment of borrowings ($179 million pretax as presented in this line item, $112 million after-tax) incurred in the third quarter of 2016.
Amortization of acquisition-related intangible assets in the following periods ($ in millions) (only the pretax amounts set forth below are reflected in the amortization line item above):
Year Ended December 31
Gains on resolution of acquisition-related matters ($18 million pretax as presented in this line item, $14 million after-tax) for the year ended December 31, 2016.
Net gains on resolution of acquisition-related matters in the Life Sciences and Diagnostics segments ($11 million pretax as presented in this line item, $8 million after-tax) for the year ended December 31, 2017.
Gain on sale of marketable equity securities in the year ended December 31, 2014 ($123 million pretax as presented in this line item, $77 million after-tax).
Net gains on resolution of acquisition-related matters in the Life Sciences segment ($9 million pretax as presented in this line item, $7 million after-tax) for the year ending December 31, 2018.
Gain on sale of marketable equity securities in the year ended December 31, 2015 ($12 million pretax as presented in this line item, $8 million after-tax).
Gain on sales of investments in the year ended December 31, 2016 ($223 million pretax as presented in this line item, $140 million after-tax).
Gain on sales of investments in the year ended December 31, 2017 ($73 million pretax as presented in this line item, $46 million after-tax).
Continuing operations portion of productivity charges for the year ended December 31, 2014 in excess of amounts originally budgeted and publicly communicated in December 2013 ($64 million pretax as presented in this line item, $49 million after-tax).
During the year ended December 31, 2017, the Company recorded $76 million of pretax restructuring, impairment and other related charges ($51 million after-tax) primarily related to the Company’s strategic decision to discontinue a molecular diagnostic product line in its Diagnostics segment. As a result, the Company incurred noncash charges for the impairment of certain technology-related intangibles as well as related inventory and plant, property and equipment with no further use totaling $49 million. In addition, the Company incurred cash restructuring costs primarily related to employee severance and related charges totaling $27 million.
Acquisition-related transaction costs deemed significant ($12 million pretax as presented in this line item, $9 million after-tax) for the year ended December 31, 2014 and fair value adjustments to inventory ($5 million pretax as presented in this line item, $4 million after-tax) for the year ended December 31, 2014 and fair value adjustments to inventory ($20 million pretax as presented in this line item, $15 million after-tax) incurred in the year ended December 31, 2015, in each case incurred in connection with the acquisition of Nobel Biocare. Danaher deems acquisition-related transaction costs incurred in a given period to be significant (generally relating to Danaher’s larger acquisitions) if it determines that such costs exceed the range of acquisition-related transaction costs typical for Danaher in a given period.
Acquisition-related transaction costs deemed significant ($21 million pretax as presented in this line item, $16 million after-tax), change in control payments, and fair value adjustments to inventory and deferred revenue, net of the impact of freezing pension benefits, in each case related to the acquisition of Pall Corporation and incurred in the year ended December 31, 2015 ($107 million pretax as presented in this line item, $84 million after-tax).
O
P
Q
R
S
T
U
($ in millions)
Year Ended December 31,
2017Discrete income tax gains, primarily related to expiration of statute of limitations 1
$ 129 Impact of ASU No. 2016-09, Compensation—Stock Compensation 2
16 Remeasurement of deferred tax assets and liabilities as a result of the Tax Cuts and Jobs Act of 2017 3
1,219
(1,218)
$ 146
V
W
This line item reflects the aggregate tax effect of all nontax adjustments reflected in the table above. In addition, the footnotes above indicate the after-tax amount of each individual adjustment item. Danaher estimates the tax effect of the adjustment items identified in the reconciliation schedule above by applying Danaher’s overall estimated effective tax rate to the pretax amount, unless the nature of the item and/or the tax jurisdiction in which the item has been recorded requires application of a specific tax rate or tax treatment, in which case the tax effect of such item is estimated by applying such specific tax rate or tax treatment.Discrete income tax charges net of discrete income tax gains and benefits from a lower than expected effective tax rate in the year ended December 31, 2014 (compared to the anticipated effective tax rate publicly communicated in December 2013), due primarily to year-end 2014 tax law changes
Represents discrete income tax gains, primarily related to the release of valuation allowances associated with certain foreign operating losses ($23 million and $32 million, respectively, in the year ending December 31, 2018).
Acquisition-related transaction costs deemed significant ($15 million pretax as presented in this line item, $13 million after-tax), and fair value adjustments to inventory ($1 million pretax as presented in this line item, $0.8 million after-tax), in each case related to the acquisition of IDT and incurred in the year ending December 31, 2018.
Pretax costs incurred in the year ending December 31, 2018 ($10 million pretax as reported in this line item, $8 million after-tax) related to preparation for the 2019 separation of the Dental segment (“Dental Separation”) primarily related to professional fees for legal, tax, finance and information technology services.
Discrete income tax gains net of discrete income tax charges incurred in the year ended December 31, 2015 ($58 million).
Discrete income tax gains net of discrete income tax charges and Fortive separation-related tax costs related to repatriation of earnings and legal entity realignments incurred in the year ended December 31, 2016 ($91 million). Discrete tax adjustments and other tax-related adjustments for the year ended December 31, 2017 include:
Transition tax on deemed repatriation of foreign earnings as a result of the Tax Cuts and Jobs Act of 2017 4
Represents (1) discrete income tax gains, primarily related to expiration of statute of limitations ($129 million in the year ended December 31, 2017), (2) equity compensation-related excess tax benefits ($16 million in the year ended December 31, 2017), (3) remeasurement of deferred tax assets and liabilities, net related to enactment of the Tax Cuts and Jobs Act ($1.2 billion gain in the year ended December 31, 2017), and (4) transition tax on deemed repatriation of foreign earnings in connection with enactment of the Tax Cuts and Jobs Act ($1.2 billion provision in the year ended December 31, 2017).
On January 1, 2017, Danaher adopted the updated accounting guidance required by ASU No. 2016-09, Compensation—Stock Compensation , which requires income statement recognition of all excess tax benefits and deficiencies related to equity compensation. We exclude from Adjusted Diluted Net EPS any excess tax benefits that exceed the levels we believe are representative of historical experience. In the first quarter of 2017, we anticipated $10 million of equity compensation-related excess tax benefits and realized $26 million of excess tax benefits, and therefore we have excluded $16 million of these benefits in the calculation of Adjusted Diluted Net Earnings per Share. In the other periods presented, realized equity compensation-related excess tax benefits approximated the anticipated benefit and no adjustments were required.
Year over year growth for the year ending December 31, 2018 represents the growth at the midpoint of the range for the forecasted adjusted diluted EPS from continuing operations.
71
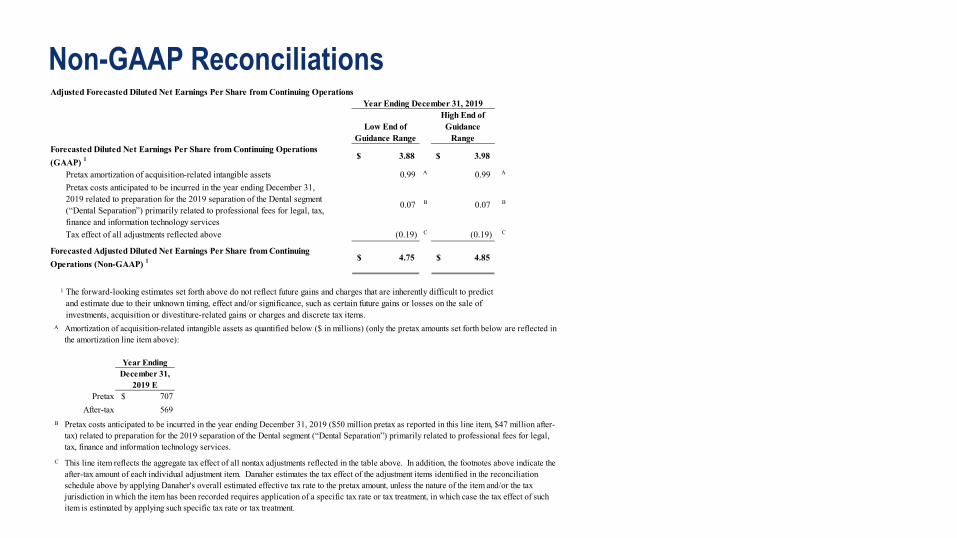
Non-GAAP ReconciliationsAdjusted Forecasted Diluted Net Earnings Per Share from Continuing Operations
Low End of Guidance Range
High End of Guidance
Range
3.88$ 3.98$
Pretax amortization of acquisition-related intangible assets 0.99 A 0.99 A
Pretax costs anticipated to be incurred in the year ending December 31, 2019 related to preparation for the 2019 separation of the Dental segment (“Dental Separation”) primarily related to professional fees for legal, tax, finance and information technology services
0.07 B 0.07 B
Tax effect of all adjustments reflected above (0.19) C (0.19) C
4.75$ 4.85$
1 The forward-looking estimates set forth above do not reflect future gains and charges that are inherently difficult to predict and estimate due to their unknown timing, effect and/or significance, such as certain future gains or losses on the sale of investments, acquisition or divestiture-related gains or charges and discrete tax items.
Year Ending December 31, 2019
Forecasted Diluted Net Earnings Per Share from Continuing Operations (GAAP) 1
Forecasted Adjusted Diluted Net Earnings Per Share from Continuing Operations (Non-GAAP) 1
A
Year EndingDecember 31,
2019 EPretax $ 707
After-tax 569B
C
Amortization of acquisition-related intangible assets as quantified below ($ in millions) (only the pretax amounts set forth below are reflected in the amortization line item above):
Pretax costs anticipated to be incurred in the year ending December 31, 2019 ($50 million pretax as reported in this line item, $47 million after-tax) related to preparation for the 2019 separation of the Dental segment (“Dental Separation”) primarily related to professional fees for legal, tax, finance and information technology services.
This line item reflects the aggregate tax effect of all nontax adjustments reflected in the table above. In addition, the footnotes above indicate the after-tax amount of each individual adjustment item. Danaher estimates the tax effect of the adjustment items identified in the reconciliation schedule above by applying Danaher's overall estimated effective tax rate to the pretax amount, unless the nature of the item and/or the tax jurisdiction in which the item has been recorded requires application of a specific tax rate or tax treatment, in which case the tax effect of such item is estimated by applying such specific tax rate or tax treatment.