Embed Size (px)
Citation preview
INVESTMENTSSTATISTICAL DIGEST
2018
INTRODUCTIONThere were 10,992 mutual funds registered with the Cayman Islands Monetary Authority (CIMA)at the end of 2018, up 433 from 2017.
Number of Funds:
Registered Funds 7,654 (2017: 7,331)Master Funds 2,946 (2017: 2,816)Administered Funds 317 (2017: 331)Licensed Funds 75 (2017: 81)
Total Assets increased by 6% while Ending Net Assets decreased by 3% as at December 31 2018,when compared to the similar period in 2017, despite the slight increase in the total number offunds as at year end 2018. Net loss of US$30 billion was significantly below the amount reportedin 2017 and dividends were US$2 billion lower.
Total Assets: US$7.350 trillion (2017: US$6.936 trillion)Net Asset Value (NAV): US$3.916 trillion (2017: US$4.033 trillion)Gross Notional Exposure: US$9.264 trillion (2017: US$8.453 trillion)Net (Loss) Income: US$-30 billion (2017: US$383 billion)Dividends: US$36 billion (2017: US$38 billion)
In 2018, total subscriptions and redemptions were down US$141 billion (12%) and US$134 billion(11%), respectively compared to 2017. The net outflow, which was a result of redemptionsexceeding subscriptions by US$30 billion, was offset by asset appreciation during the year. At yearend, there was a decrease in total Net Assets of US$117 billion.
About 69% of the Cayman Islands’ funds are managed by firms in the United States (US) withDelaware and New York accounting for 3,425 (48%) of the 4,972 US managed funds. The CaymanIslands provides Net Asset Value (NAV) calculation services for 3,386 funds (38%) and registrarand transfer agent services (RTA) for 3,712 funds (42%) of all Cayman Islands funds.
The decline in the number of funds appears to have levelled off following a rebound from the effectsof the 2008 financial crisis, when the number of funds fell to 9,258 in 2011 but increased to thehighest level at 11,379 two years later in 2013. Since then, the number of funds has declined by1% in 2015, 3% in 2016, 0.3% in 2017 and increased by 4.10% in 2018.

2Cayman Islands Monetary Authority
Table of ContentsTable of Acronyms...................................................................................................3Global Economic Outlook.....................................................................................4-5Graphs for Economic Outlook................................................................................. 6Highlights.................................................................................................................7Financial Position - All Funds...................................................................................8Asset Allocation - All Funds....................................................................................9Financial Position & Asset Allocation - Registered Funds......................................10Financial Position & Asset Allocation - Master Funds............................................ 10Financial Position & Asset Allocation - Administered Funds...................................12Financial Position & Asset Allocation - Licensed Funds..........................................13Portfolio Investments by Jurisdiction........................................................................14Portfolio Investments by Jurisdiction - Short Positions.............................................15Legal Holder of Funds..............................................................................................16Investment Strategy.............................................................................................17-18Subscriptions, Redemptions and Net Asset Flowsby Investment Strategy........................................................................................19-20Change in Net Assets, Dividends and Net Incomeby Investment Strategy........................................................................................21-22Net Assets by Investment Manager Location - USA.................................................23Net Assets by Investment Manager Location - Other...............................................24Net Asset Value (NAV) Calculation Location............................................................25Registrar and Transfer Agent (RTA) Calculation Location........................................26NAV and RTA Sub-Delegated Location....................................................................27Minimum Initial Subscription....................................................................................28Fund Size by Total Assets........................................................................................29Economic Functions of Investment Funds...............................................................30
Table of AcronymsCIMA - Cayman Islands Monetary Authority
CPIS - Coordinated Portfolio Investment Survey
EFT - Electronic Funds Transfers
ESO - Economics and Statistics Office
ETF - Exchange Traded Funds
FAR - Funds Annual Return
FSI - Financial Soundness Indicator
GDP - Gross Domestic Product
GFSR - Global Financial Stability Report
GNE - Gross Notional Exposure
IIP - International Investment Position
IMF - International Monetary Fund
ISD - Investment Supervision Division
LT - Long Term
MSCI - Morgan Stanley Capital International
NAV - Net Asset Value
RTA - Registrar and Transfer Agent
ST - Short Term
UK - United Kingdom
USA/US - United States of America
US$ - United States Dollar
4Cayman Islands Monetary Authority
Global Economic Outlook2019-2020
According to the IMF report on global economic outlook October2018, growth is projected to pick up by 3.4% in 2020 (a 0.2% pointsdownward revision compared with April 2018 forecast), reflectingprimarily a projected improvement in economic performance in anumber of emerging markets in Latin America, the Middle East, andemerging and developing Europe that are under macroeconomicstrain. Yet, with uncertainty about prospects for several of thesecountries, a projected slowdown in China and the United States,and prominent downside risks, a much more subdued pace ofglobal activity could well materialize. To forestall such an outcome,policies should decisively aim at defusing trade tensions,reinvigorating multilateral cooperation, and providing timelysupport to economic activity where needed. To strengthenresilience, policymakers should address financial vulnerabilitiesthat pose risks to growth in the medium term. Making growth moreinclusive, which is essential for securing better economic prospectsfor all, should remain an overarching goal.
Markets sold off sharply in the fourth quarter of 2018, broadlyacross asset classes, amid growing signs of a slowing globaleconomy and rising concerns about US-China trade tensions.Against a backdrop of rising downside risks, policymakers acrossthe globe took steps to prevent a sharper deceleration of theeconomy. Such a forceful response supported market sentimentand triggered a sharp rebound in risk assets. Despite theimprovement, financial markets remain susceptible to a suddentightening in financial conditions. Potential triggers include a sharprepricing of risk, an intensification of trade tensions, a furtherslowdown in global economic activity, or political shocks.
Financial conditions tightened since the October 2018 GlobalFinancial Stability Report (GFSR) but remained relativelyaccommodative, notably in the US. After sharp declines in thefourth quarter of 2018, financial markets rebounded strongly inearly 2019 on growing optimism about US-China trade negotiationsand as major central banks adopted a more patient and flexibleapproach to monetary policy normalization. Such a dovish shift inthe outlook for monetary policy in advanced economies has helpedsustain positive market sentiment despite growing signs ofweakening global growth (as discussed in the April 2019 WorldEconomic Outlook).
While financial conditions were accommodative, vulnerabilitiescontinued to build. The tightening in financial conditions in thefourth quarter of 2018 was too short-lived to meaningfully slow thebuildup of vulnerabilities, leaving medium-term risks to globalfinancial stability broadly unchanged. Financial vulnerabilities wereelevated in the sovereign, corporate, and nonbank financial sectorsin several systemically important countries.As the credit cyclematures, corporate sector vulnerabilities—which appear elevatedin about 70% of systemically important countries (by GDP)— couldamplify an economic downturn. This report presents acomprehensive assessment of balance sheet vulnerabilities acrossfinancial and nonfinancial sectors, and focuses on a number ofspecific vulnerabilities in advanced and emerging marketeconomies.
For the foreseeable future, several risks could trigger a renewedsell-off of risk assets that will likely facilitate further buildup ofvulnerabilities. These vulnerabilities could be exposed in the eventof a sharp tightening in financial conditions. Possible triggersinclude the following:
A sharper-than-expected global growth slowdown; disappointingeconomic data releases could lead to further earningsdowngrades, poor credit performance, and a repricing of riskassets. A lack of policy space (monetary or fiscal) to accommodateadverse shocks would amplify this risk.
Unexpected shifts to a less dovish outlook for monetary policy inadvanced economies: In the US investor sentiment has improvedsince the Federal Reserve signaled a change in its stance, andmarkets have rallied. A change in expectations stemming fromstronger-than-expected economic data releases or the possibilitythat investors have taken too benign a view regarding the outlookfor monetary policy in the United States could lead to a sharprepricing of risk assets. In this event, pressures on emergingmarkets could resume through disruptions in cross-border capitalflows.
Protracted trade tensions: Expectations of a positive outcome inthe US-China trade negotiations have lifted asset valuations intrade-dependent sectors, even though China’s export orders haveebbed. An escalation of trade tensions would likely trigger arenewed sell-off.A stalemate in the Brexit process threatens to unsettle financialmarkets, damage investors’ confidence, adversely affect businessinvestment, and give rise to some operational and contractualuncertainties in Europe and the United Kingdom (UK).
The European Union (EU) adopted time-limited equivalencedecisions for UK central counterparties and central securitiesdepositaries in the event of a no-deal Brexit. The UK has also putin place temporary permission measures. In addition, post crisisreforms and supervisory actions have strengthened the liquiditypositions of banks, dealers, and insurance companies. Authoritiesurged market participants to prepare for all Brexit outcomes andthe private sector has reportedly undertaken a number of steps.Insurance companies are making good progress in restructuringtheir business in order to continue to serve their customers afterBrexit and there has also been some limited private sector actionto transfer derivative contracts. Although reduced compared to theprevious GFSR, risks remain, including around the continuedperformance of lifecycle events on some uncleared derivativecontracts; operational risks for banks, insurers, and assetmanagers; and market-wide issues such as reduced marketliquidity, and risk management challenges and supervisoryconstraints. Market liquidity has proven resilient thus far, althoughthere has been heightened volatility in the gilt market aroundsignificant Brexit-related announcements.

Global Economic Outlook2019-2020
Source: Global Financial Stability Report 2019 3 (a)
5Investments Statistical Digest 2018
6Cayman Islands Monetary Authority
1At the date of compilation of this issue of the Digest 8,932 funds had successfully filed a FAR.2 The data presented consists of 6,141 Registered Funds, 2,507 Master Funds, 221 Administered Funds, and 63 Licensed Funds.* Due to rounding subtotals may differ from the total sum
2018 2017Net Asset Value US$3.916 trillion US$4.033 trillionTotal Assets US$7.350 trillion US$6.936 trillionGross Notional Exposure US$9.264 trillion US$8.453 trillionTotal Subscriptions US$1.049 trillion US$1.190 trillionTotal Redemptions US$1.079 trillion US$1.213 trillionNet (Loss) Income US$(30 billion) US$383 billionDividends US$36 billion US$38 billionTotal performance fees US$11 billion US$22 billionReturn on Gross Assets -0.41% 5.52%Return on Net Assets -0.76% 9.50%Top location of Investment Managers by ending net assets United States of America (68%) United States of America (69%)Primary location for Net Asset Value (NAV) calculation services Cayman Islands (39%) Cayman Islands (37%)Primary location for Registrar and Transfer Agent (RTA) services Cayman Islands (42%) Cayman Islands (40%)% of Funds requiring a minimum initial investment of US$1M or more 51% 52%Top two investment strategies Multi-Strategy (24%)
Long/Short Equity (18%)Multi-Strategy (25%)Long/Short Equity (19%)
% of total number of funds with leverage at 100% or more Registered Funds - 54%Master Funds - 54%Administered Funds - 20%Licensed Funds - 35%
Registered Funds - 64%Master Funds - 59%Administered Funds - 32%Licensed Funds - 44%
Side pockets implemented during the year to separate liquid assets 349 funds 335 fundsGate on redemptions implemented during the year 445 funds 393 fundsEquity interest redeemed during the year 893 funds 872 fundsTrading of equities suspended during the year 541 funds 501 fundsFunds currently subject to regulatory investigation 61 funds 75 fundsFunds with intention to terminate 1,101 (12%) 1,077 funds (12%)
Figure 1 (amounts in U$)
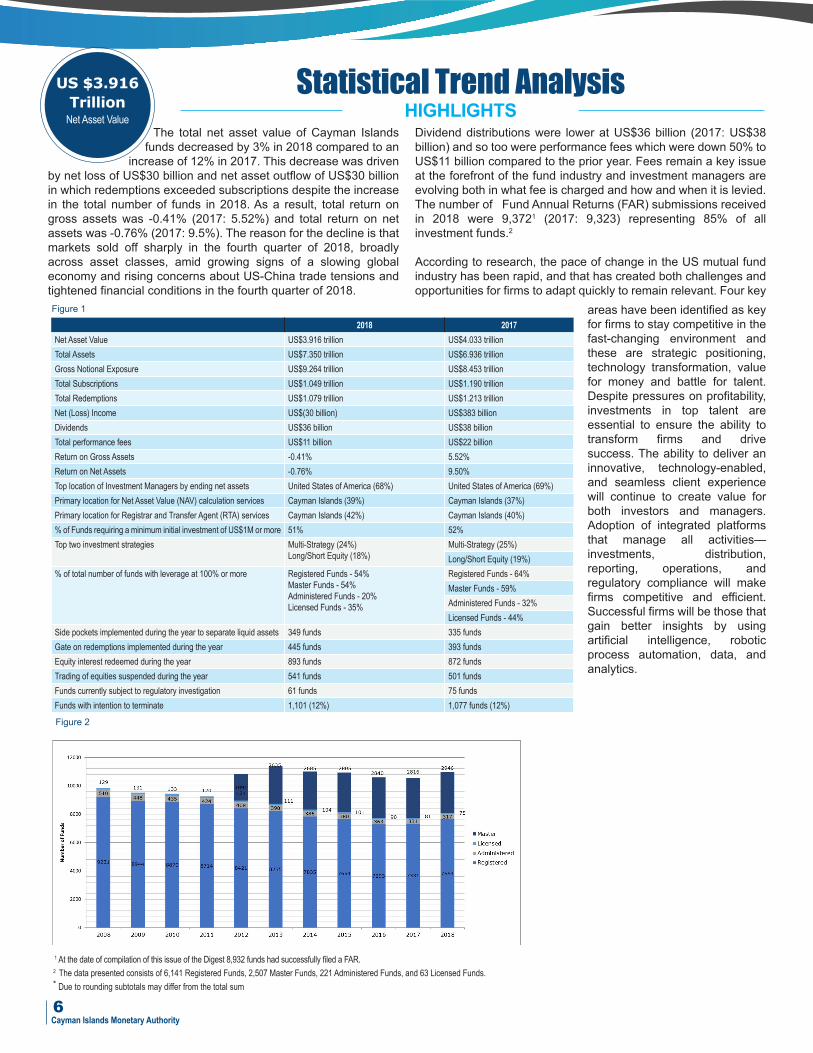
The total net asset value of Cayman Islandsfunds decreased by 3% in 2018 compared to an
increase of 12% in 2017. This decrease was drivenby net loss of US$30 billion and net asset outflow of US$30 billionin which redemptions exceeded subscriptions despite the increasein the total number of funds in 2018. As a result, total return ongross assets was -0.41% (2017: 5.52%) and total return on netassets was -0.76% (2017: 9.5%). The reason for the decline is thatmarkets sold off sharply in the fourth quarter of 2018, broadlyacross asset classes, amid growing signs of a slowing globaleconomy and rising concerns about US-China trade tensions andtightened financial conditions in the fourth quarter of 2018.
Dividend distributions were lower at US$36 billion (2017: US$38billion) and so too were performance fees which were down 50% toUS$11 billion compared to the prior year. Fees remain a key issueat the forefront of the fund industry and investment managers areevolving both in what fee is charged and how and when it is levied.The number of Fund Annual Returns (FAR) submissions receivedin 2018 were 9,3721 (2017: 9,323) representing 85% of allinvestment funds.2
According to research, the pace of change in the US mutual fundindustry has been rapid, and that has created both challenges andopportunities for firms to adapt quickly to remain relevant. Four key
HIGHLIGHTSStatistical Trend AnalysisUS $3.916
TrillionNet Asset Value
Figure 1
Figure 2
areas have been identified as keyfor firms to stay competitive in thefast-changing environment andthese are strategic positioning,technology transformation, valuefor money and battle for talent.Despite pressures on profitability,investments in top talent areessential to ensure the ability totransform firms and drivesuccess. The ability to deliver aninnovative, technology-enabled,and seamless client experiencewill continue to create value forboth investors and managers.Adoption of integrated platformsthat manage all activities—investments, distribution,reporting, operations, andregulatory compliance will makefirms competitive and efficient.Successful firms will be those thatgain better insights by usingartificial intelligence, roboticprocess automation, data, andanalytics.

Total subscriptions of US$1.049trillion were 12% lower than in2017 and total redemptions ofUS$1.079 trillion were 11%lower. In 2018, there was a netasset outflow of US$30 billioncompared to net outflow ofUS$23 billion in 2017. Perindustry sources, the leadingreasons for redemptions byinvestors was underperformance relative tobenchmarks or targets, level ofreturns not justifying fees and theavailability of alternateinvestments such as ExchangeTraded Funds.4
The total net loss of US$30billion as at December 31, 2018was significantly lower thanUS$383 billion in incomereported in 2017. The US-Chinatrade war had a significantimpact on financial performancein the last quarter of 2018. As aresult, the return on gross assetsin 2018 dropped to -0.41% whencompared to 2017 and the returnon net assets was -0.76%, downfrom 9.5% in 2017.
The decline in net assets in 2018was driven by several factorsthat weighed on global stockmarkets and foreign exchangemarkets, particularly in the fourthquarter. Chief among them wasthe fear of a severe slowdown inglobal economic growth,stemming in part from lower-than-expected economic growthin China and deteriorating traderelations between China and theUS. In 2018, US stocks fell 5.3%.Stock markets elsewhere in theworld also weakened. Forexample, European stockmarkets fell 14.3% in 2018, whileAsia-Pacific stock markets fell13.3%. In addition, the eurodepreciated 4.5% against the USdollar in 2018, reducing the valueof euro denominated assetswhen measured in US dollars. Inthe Asia-Pacific region in 2018,the Australian dollar depreciated10% and the Chinese renminbidepreciated 5% against the USdollar.4
3 The increase from the 2017 ending net assets to the 2018 opening net assets is attributed to new fund authorisations, de-registrations andregulatory waivers during 2017, resulting in a different set of funds filing a 2017 FAR when compared to 2016.
*Due to rounding, subtotals may differ from the total sum.
4Source 2019 Investment Company Factbook.
Statistical Trend AnalysisFigure 3 (a)
Figure 3 (b)
Change
inFin
ancia
lPositio
n(US
$Billions)
Financia
lPositio
n(US
$Billions)
FINANCIAL POSITION - ALL FUNDS
Financial Position (US$ Billions)3 2018 2017 $ Change % ChangeOpening Net Assets 4,012 3,711 302 8%
Subscriptions 1,049 1,191 (142) -12%
Redemptions (1,079) (1,213) (134) -11%
Dividends / Distributions (36) (38) 2 -5%
Net (Loss) Income (30) 383 (413) -108%
Ending Net Assets 3,916 4,033 (117) -2.90%
Total Assets 7,350 6,936 414 5.97%
Gross Notional Exposure 9,264 8,453 811 9.59%Return on Gross Assets -0.41% 5.53%
Return on Net Assets -0.76% 9.50%
$ Change
Total AssetsEnding Net AssetsNet Income/(Net Loss)
Gross NotionalExposure
Dividends/Distibutions
RedemptionSubscriptionOpening Net Assets-200-100
0200400600800
1,0001,2001,4001,600
130 (4%)-30 (2%) -94 (7%)
255 (199%)441 (12%)
794 (13%)
1,345 (19%)
-8 (27%)
-2000
0
2000
4000
6000
8000
10000
12000
TotalAssets
Gross NotionalExposure
EndingNet Assets
Net Income /(Net Loss)
Dividends /Distributions
RedemptionsSubscriptionsOpeningNet Assets
2017 Value (US$Billions)2018 Value (US$Billions)
3,711
1,049 1,190
(1,079) (1,213)
(38) (30) -30
383
3,916 4,033
6,9377,350
9,2648,453
4,012
7Investments Statistical Digest 2018

8Cayman Islands Monetary Authority
Figure 4
Total
Assets(US$
Billio
ns)
Change
inFin
ancia
lPositio
n(US
$Billions)
Despite challenging financialmarkets in 2018, overall demandfor worldwide regulated long-termfunds (equity, bond, and mixed/other) as measured by net salescalculated as total sales less totalredemptions plus net exchanges,remained positive. Total ending netassets for Long Bonds increased byUS$610 billion due in part toincrease in net sales in Asia-Pacificin 2018. There were decreases ofUS$170 billion in Long Equities,US$81 billion in Master Funds,US$501 billion in Short Bonds andUS$28 billion in Other Funds. Thelargest decline in equity fundinvestments occurred in the UnitedStates, where equity fundsrecorded US$85 billion in net salesin 2018 compared with US$306billion in 2017. Although indexequity funds in the US had strongnet sales in 2018, they were downfrom their historical peak in 2017. Inaddition, outflows from activelymanaged equity funds in the UScontinued in 2018. In Europe, netsales of equity funds were strong atthe start of 2018, as stock pricesaround the world were rising. LongBonds, in which the pricedecreases as interest ratesincrease and provides investorswith safety amidst the fear of arecession, increased by 24.85% in2018. Long Bonds continue to bethe most prominent asset typerepresenting 33.09% of total netassets (2017: 24.85%). Flows toLong Equities, which were down12.19%, tend to rise and fall withstock prices and in 2018, investorswere attracted to equity funds dueto increased economic activityaround the globe, includingemerging markets as internationalequities were very attractive on aprice-earnings basis. Short Bonds,an investment in which theinvestment manager sells first andbuys later in anticipation that theprice will drop, experienced thehighest growth at 34.55% whileOther Financial InstrumentsLiabilities increased by 30.45%, in2018. Gross Notional Exposure ofUS$9.2 trillion was 9.59% higherthan in 2017.
5The data presented in the asset allocation table was gathered from the funds that elected to completethe asset allocation section of the FAR.
*Due to rounding, subtotals may differ from the total sum.
Statistical Trend AnalysisASSET ALLOCATION - ALL FUNDS
-1000
-2000
-3,000
-500
0
500
1000
1500
2000
2,500
3000
OtherAssetsLess
Liabilities
OtherFinancial
InstrumentsLiabilities
OtherFinancialInstruments
Assets
DerivativesLiabilities
DerivativesAssets
MoneyMarket
InstrumentsOtherFunds
ShortBonds
LongBonds
ShortEquities
LongEquities
MasterFunds
2018 Value (US$Billions)2017 Value (US$Billions)
1,291 1,2241,394
(1,951)(1,450)
55 51
(170)(138)
3,065
2,455
(21) (16)
1,372
(532)(606)
257221
367 396167 200 157161
OtherFinancial
InstrumentsLiabilities
OtherAssetsLess
Liabilities
OtherFinancial
InstrumentsAssets
DerivativesLiabilities
DerivativesAssets
MoneyMarket
Instruments
OtherFunds
ShortBonds
LongBonds
ShortEquities
LongEquities
MasterFunds
(81)
74
(501)
6(32)
4(5)
(35)(170)
610
29
43
(400)(600)(800)
(200)(100)
0100200400600800
1000
$ Change
Asset Allocation 5 2018 Value(US$ Billions)
2018% Allocated
2017 Value(US$ Billions)
2017% Allocated
$ Change(US$ Billions) % Change
Master Funds 1,291 13.92% 1,372 16.22% (81) -5.91%
Long Equities 1,224 13.21% 1,394 16.48% (170) -12.19%
Short Equities (532) 5.75% (606) 7.16% 74 -12.22%
Long Bonds 3,065 33.09% 2,455 29.03% 610 24.85%
Short Bonds (1,951) 21.06% (1,450) 17.15% (501) 34.55%
Other Funds 367 3.96% 396 4.68% (29) -7.32%
Money Market Instruments 167 1.80% 161 1.91% 6 3.87%
Derivatives Assets 200 2.16% 157 1.86% 43 27.56%
Derivatives Liabilities (170) 1.83% (138) 1.64% (32) 22.95%
Other Financial Instruments Assets 55 0.59% 51 0.61% 4 7.82%
Other Financial Instruments Liabilities (21) 0.23% (16) 0.19% (5) 30.45%
Other assets less liabilities 222 2.40% 257 3.06% (35) -13.62%
Total Net Asset Value 3,916 100% 4,033 100% (117) -2.89%
Gross Notional Exposure 9,264 8,453 811 9.59%
6The increase from the 2017 ending net assets to the 2018 opening net assets is attributed to new fund authorisations, de-registrations andregulatory waivers during 2018, resulting in a different set of funds filing a 2018 FAR when compared to 2017.
7 The data presented in the asset allocation table was gathered from the funds that elected tocomplete the asset allocation section of the FAR.
*Due to rounding, subtotals may differ from the total sum.
Statistical Trend Analysis
Financial Position(US$ Billions)6 2018 2017 $ Change % Change
Opening Net Assets 2,299 2,079 220 11%
Subscriptions 642 827 (185) -22%
Redemptions (621) (772) 151 -20%
Dividends/Distributions (19) (20) (1) -6%
Net (Loss) Income (29) 189 (218) -115%
Ending Net Assets 2,272 2,303 (27) -1%
Total Assets 2,646 2,708 (63) -2%
Gross Notional Exposure 2,648 2,715 (127) -5%
Asset Allocation7 2018Value(US$
Billions)
2018% Allocated
2017Value(US$
Billions)
2017% Allocated
$ Change(US$
Billions)
% Change
Master Funds 1,210 45.63% 1,273 46.87% (63) -4.91%
Long Equities 243 9.14% 262 9.66% (19) -7.24%
Short Equities (56) 2.11% (54) 1.99% (2) 3.62%
Long Bonds 628 23.69% 592 21.81% 36 6.09%
Short Bonds (93) 3.50% (102) 3.76% 9 -9.06%
Other Funds 226 8.54% 225 8.29% 1 0.60%
Money Market Instruments 30 1.15% 42 1.56% (12) -28.45%
Derivatives Assets 39 1.48% 34 1.27% 5 14.55%
Derivatives Liabilities (31) 1.16% (41) 1.52% 10 -24.17%
Other Financial Instruments Assets 24 0.89% 22 0.82% 2 8.97%
Other Financial Instruments Liabilities (8) 0.31% (8) 0.31% 0 0.00%
Other assets less liabilities 60 2.41% 58 2.14% 2 10.34%
Total Net Asset Value 2,272 100% 2,303 100% (31) -1.15%
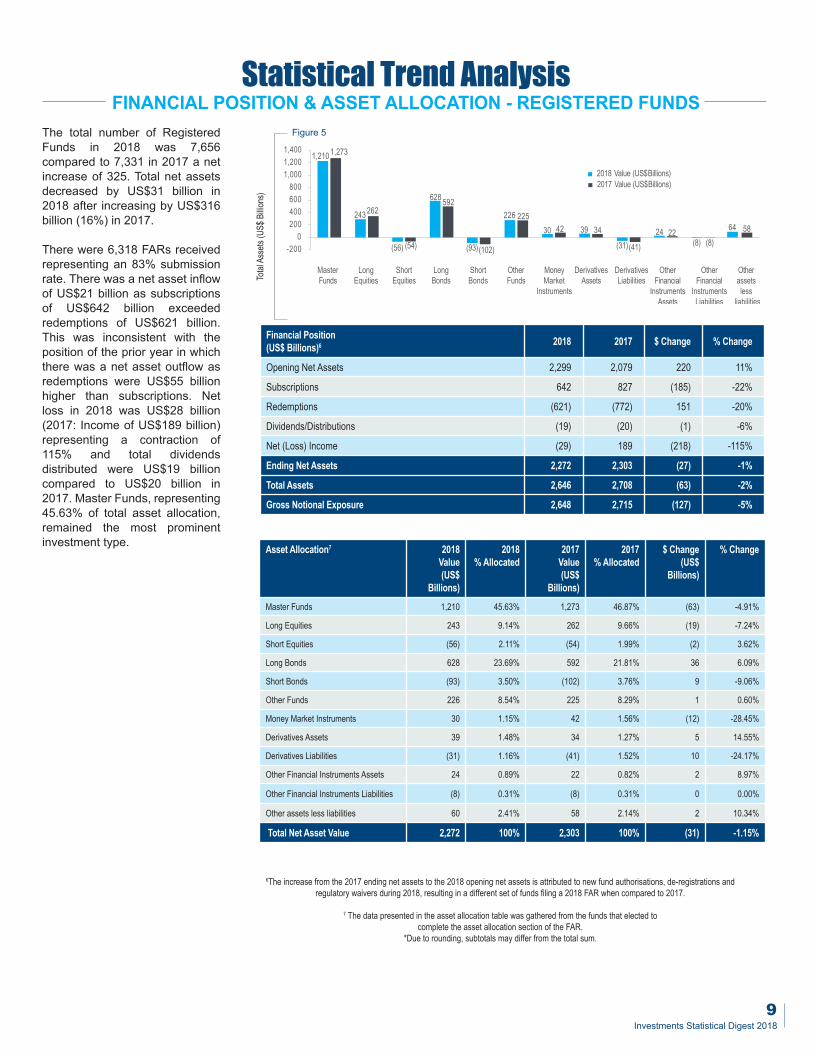
FINANCIAL POSITION & ASSET ALLOCATION - REGISTERED FUNDSThe total number of RegisteredFunds in 2018 was 7,656compared to 7,331 in 2017 a netincrease of 325. Total net assetsdecreased by US$31 billion in2018 after increasing by US$316billion (16%) in 2017.
There were 6,318 FARs receivedrepresenting an 83% submissionrate. There was a net asset inflowof US$21 billion as subscriptionsof US$642 billion exceededredemptions of US$621 billion.This was inconsistent with theposition of the prior year in whichthere was a net asset outflow asredemptions were US$55 billionhigher than subscriptions. Netloss in 2018 was US$28 billion(2017: Income of US$189 billion)representing a contraction of115% and total dividendsdistributed were US$19 billioncompared to US$20 billion in2017. Master Funds, representing45.63% of total asset allocation,remained the most prominentinvestment type.
1,273
262
(56)
592
(93)
226
30 39
(31)24
(8)
64
1,210
243
(54)
628
(102)
22542 34
(41)22
(8)58
-2000
200400600800
1,0001,2001,400
MasterFunds
LongEquities
ShortEquities
LongBonds
ShortBonds
OtherFunds
MoneyMarket
Instruments
DerivativesAssets
DerivativesLiabilities
OtherFinancial
InstrumentsAssets
OtherFinancial
InstrumentsLiabilities
Otherassetsless
liabilities
2018 Value (US$Billions)2017 Value (US$Billions)
Figure 5
Total
Assets(US$
Billio
ns)
9Investments Statistical Digest 2018

10Cayman Islands Monetary Authority
8The increase from the 2017 ending net assets to the 2018 opening net assets is attributed to new fund authorisations,de-registrations and regulatory waivers during 2018, resulting in a different set of funds filing a 2018 FAR when compared to 2017.
*Due to rounding, subtotals may differ from the total sum.
Statistical Trend AnalysisFINANCIAL POSITION & ASSET ALLOCATION - MASTER FUNDS
The total net assets in MasterFunds decreased by 4% (2017:8%) to US$1,549 billion downfrom US$1,608 billion in 2017.This was due to a decrease inthe number of Master Funds ona year on year basis. As in theprior year, there was a net assetoutflow of US$47 billion (2017:US$74 billion) as redemptions ofUS$423 billion exceededsubscriptions of US$376 billion.Total net income decreased by99% (US$179 billion). Dividendsdistributed were consistent atUS$12 billion, same as in 2017.Long Bonds which account forabout a third of total assetallocation increased by 31.71%in 2018 and Other FinancialInstruments Liabilities weredown 61.53%. The number ofFARs received for Master Fundswas 2,669 or a 91% submissionrate.
Financial Position (US$ Billions)8 2018 2017 $ Change % ChangeOpening Net Assets 1,606 1,513 93 6%
Subscriptions 376 326 50 15%
Redemptions (423) (400) (23) 5%
Dividends / Distributions (12) (12) 0 0%
Net Income 2 181 (179) -99%
Ending Net Assets 1,549 1,608 (66) -4%
Total Assets 4,601 4,099 502 12%
Gross National Exposure 6,357 5,614 743 13%
Gross Notional Exposure 6,522 5,614 73 22%
Asset Allocation9 2018 Value(US$ Billions)
2018% Allocated
2017 Value(US$ Billions)
2017% Allocated
$ Change(US$ Billions)
%Change
Master Funds 58 0.90% 71 1.25% (13) -18.34%
Long Equities 963 14.79% 1,103 19.51% (140) -12.65%
Short Equities (476) 7.31% (551) 9.74% 75 -13.58%
Long Bonds 2,407 36.91% 1,828 32.32% 579 31.71%
Short Bonds (1,858) 28.49% (1,348) 23.84% (510) 37.85%
Other Funds 121 2.67% 150 2.66% (29) -19.47%
Money Market Instruments 134 2.07% 116 2.04% 18 15.57%
Derivatives Assets 160 2.45% 122 2.15% 38 31.44%
Derivatives Liabilities (139) 1.73% (97) 1.71% (42) 43.18%
Other Financial Instruments Assets 27 0.43% 24 0.42% 3 14.64%
Other Financial Instruments Liabilities (13) 0.20% (8) 0.14% (5) 61.53%
Other assets less liabilities 165 2.43% 198 3.53% (40) -20.20%
Total Net Asset Value 1,549 100% 1,608 100% (66) -4.10%
Figure 6
Total
Assets(US$
Billio
ns)
MasterFunds
LongEquities
ShortEquities
LongBonds
ShortBonds
OtherFunds
MoneyMarket
Instruments
DerivativesAssets
DerivativesLiabilities
OtherFinancial
InstrumentsAssets
OtherFinancial
InstrumentsLiabilities
Otherassetsless
liabilities
2018 Value (US$Billions)2017 Value (US$Billions)
58
1,103
(551)
2,407
(1,858)
150 116 160
(139)
27(13)
15871
963
(476)
1,828
(1,348)
121 134 122
(97)24
(8)
198
-1,000
-2,000
-2,500
-500
0
500
1,000
1,500
2,000
3,000
Financial Position (US$ Billions)10 2018 2017 $ Change % ChangeNet Income 74 83 (12) -10%
Subscriptions 22 26 (4) -14%
Redemptions (26) (31) 4 14%
Dividends / Distributions (4) (5) 1 -20%
Net (Loss) Income (2) 9 (11) -126%
Ending Net Assets 64 82 (18) -22%
Total Assets 68 87 (20) -23%
Gross Notional Exposure 63 84 (21) -25%
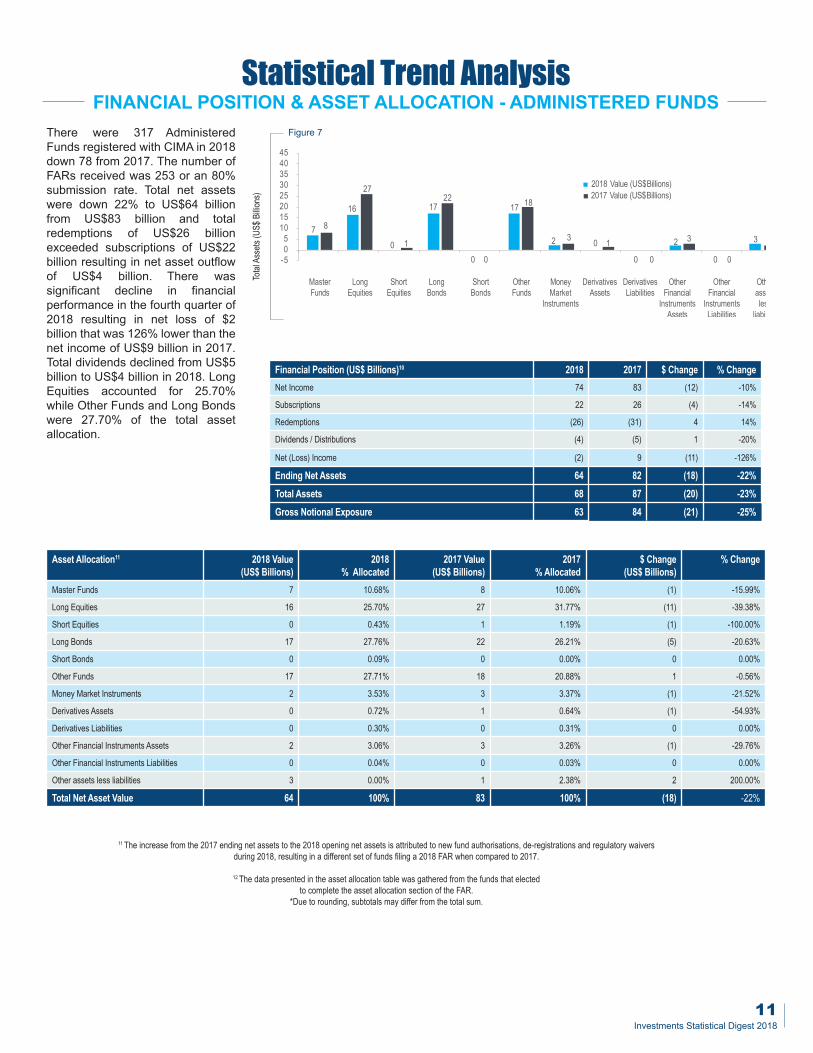
FINANCIAL POSITION & ASSET ALLOCATION - ADMINISTERED FUNDSThere were 317 AdministeredFunds registered with CIMA in 2018down 78 from 2017. The number ofFARs received was 253 or an 80%submission rate. Total net assetswere down 22% to US$64 billionfrom US$83 billion and totalredemptions of US$26 billionexceeded subscriptions of US$22billion resulting in net asset outflowof US$4 billion. There wassignificant decline in financialperformance in the fourth quarter of2018 resulting in net loss of $2billion that was 126% lower than thenet income of US$9 billion in 2017.Total dividends declined from US$5billion to US$4 billion in 2018. LongEquities accounted for 25.70%while Other Funds and Long Bondswere 27.70% of the total assetallocation.
11The increase from the 2017 ending net assets to the 2018 opening net assets is attributed to new fund authorisations, de-registrations and regulatory waiversduring 2018, resulting in a different set of funds filing a 2018 FAR when compared to 2017.
12The data presented in the asset allocation table was gathered from the funds that electedto complete the asset allocation section of the FAR.
*Due to rounding, subtotals may differ from the total sum.
Statistical Trend Analysis
Asset Allocation11 2018 Value(US$ Billions)
2018% Allocated
2017 Value(US$ Billions)
2017% Allocated
$ Change(US$ Billions)
% Change
Master Funds 7 10.68% 8 10.06% (1) -15.99%
Long Equities 16 25.70% 27 31.77% (11) -39.38%
Short Equities 0 0.43% 1 1.19% (1) -100.00%
Long Bonds 17 27.76% 22 26.21% (5) -20.63%
Short Bonds 0 0.09% 0 0.00% 0 0.00%
Other Funds 17 27.71% 18 20.88% 1 -0.56%
Money Market Instruments 2 3.53% 3 3.37% (1) -21.52%
Derivatives Assets 0 0.72% 1 0.64% (1) -54.93%
Derivatives Liabilities 0 0.30% 0 0.31% 0 0.00%
Other Financial Instruments Assets 2 3.06% 3 3.26% (1) -29.76%
Other Financial Instruments Liabilities 0 0.04% 0 0.03% 0 0.00%
Other assets less liabilities 3 0.00% 1 2.38% 2 200.00%
Total Net Asset Value 64 100% 83 100% (18) -22%
MasterFunds
LongEquities
ShortEquities
LongBonds
ShortBonds
OtherFunds
MoneyMarket
Instruments
DerivativesAssets
DerivativesLiabilities
OtherFinancial
InstrumentsAssets
OtherFinancial
InstrumentsLiabilities
Otherassetsless
liabilities
7 8
16
0
17
0
18
2 0
0
2
0
3
27
1
22
0
17
3 1
0
3
0
1
-505
1015202530354045
2018 Value (US$Billions)2017 Value (US$Billions)
Figure 7
Total
Assets(US$
Billio
ns)
11Investments Statistical Digest 2018

There were 6 fewer Licensed Funds in 2018 compared to 2017. 69 FARs were received representing a 92% submission rate. Total net assetswere US$31 billion (2017: US$40 billion) 22.50% lower than in 2017. Total subscriptions of US$9 billion equaled redemptions of US$9 billion,net loss was US$1 billion (2017: Net income of US$4 billion) and dividends were US$1 billion (2017: US$1 billion). Investments in MasterFunds which accounted for 50.35% of total net asset allocation were lower in 2018 as were Other Funds down 66.67%.
12The increase from the 2017 ending net assets to the 2018 opening net assets is attributed to new fund authorisations, de-registrations and regulatory waivers during 2018,resulting in a different set of funds filing a 2018 FAR when compared to 2017.
*Due to rounding, subtotals may differ from the total sum.
Statistical Trend AnalysisFINANCIAL POSITION & ASSET ALLOCATION - LICENSED FUNDS
Figure 8
Financial Position (US$ Billions)12 2018 2017 $ Change % ChangeOpening Net Assets 33 36 (3) 8%
Subscriptions 9 11 (2) -18%
Redemptions (9) (10) 1 -10%
Dividends/Distributions (1) (1) 0 0%
Net (Loss) Income (1) 4 (5) -125%
Ending Net Assets 31 40 (9) -22.50%
Total Assets 35 42 (7) -16.67%
Gross Notional Exposure 31 40 (9) -22.50%
Asset Allocation13 2018 Value(US$ Billions)
2018% Allocated
2017 Value(US$ Billions)
2017% Allocated
$ Change(US$ Billions) % Change
Master Funds 15 50.35% 20 50.00% (5) -25.00%
Long Equities 1 4.83% 2 5.00% (1) 50.0%
Long Bonds 13 40.80% 13 32.50% 0 0.00%
Other Funds 1 2.11% 3 7.50% (2) 66.67%
Derivative Assets 1 1.91% 0 -0.96% 1 0.00
Other Financial Instruments Assets 0 0.00% 2 6.37% (2) 0.00%
Total Net Asset Value 31 100% 40 100% (9) 22.50%
Total
Assets(US$
Billio
ns)
15
2
13 13
21
20
1
3
00 001234567810121415162025
Master Funds Long Equities Long Bonds Other Funds Other Assets lessLiabilities
2 2
Other FinancialInstruments Assets
DerivativeLiabilities
2018 Value (US$Billions)2017 Value (US$Billions)
12Cayman Islands Monetary Authority

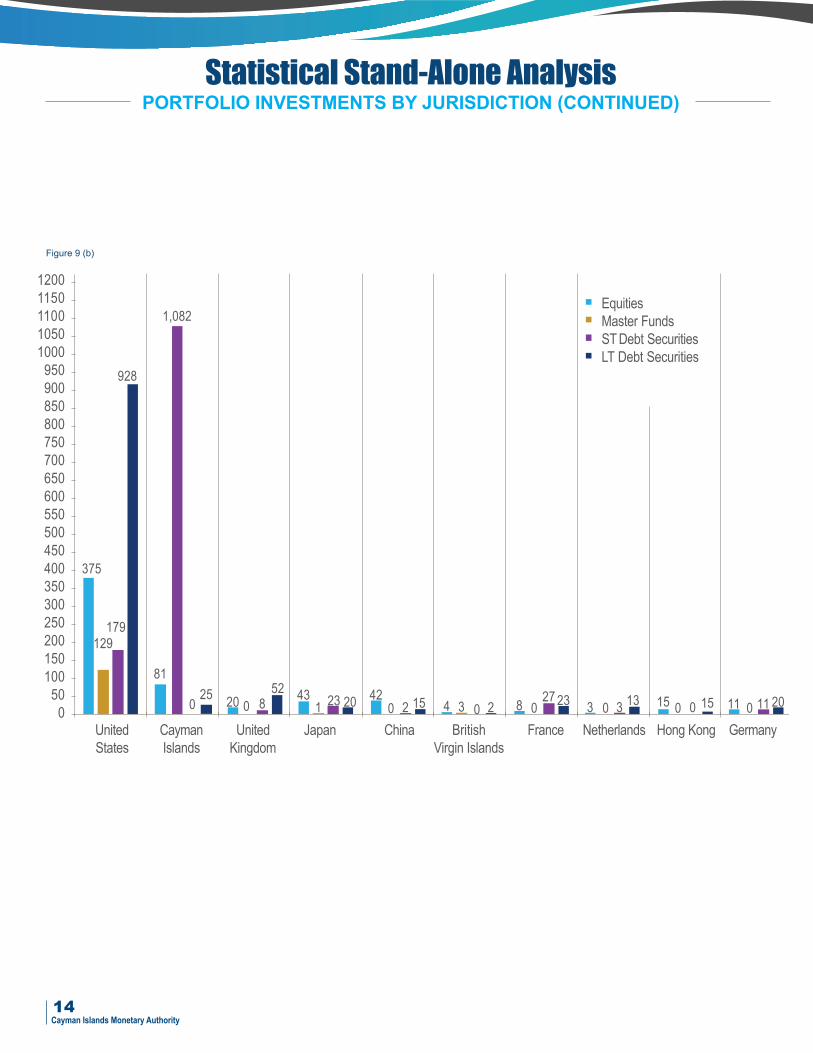
The data in Figure 9 (a) is based on the jurisdiction of the issuer ofsecurities held by the fund and is collected to facilitate participationin the annual International Monetary Fund’s Coordinated PortfolioInvestment Survey. As expected, the majority of securities areissued by the US capital markets followed by investments attributedto Cayman Islands Master Funds.
The investment by Cayman Islands funds in Master Fundsincreased by US$14 billion over the prior year. Consistent with thenegative performance of the stock market in 2018, equityinvestments in the US decreased by US$98 billion. Investments inequity securities issued by companies in China remained the sameat US$42 billion between 2017 and 2018, as the capital marketsthere continued to grow in size and sophistication. Investments insecurities issued in Germany rose by US$22 billion and Canada by
US$9 billion, while the investment allocation to other developedcountries such as Australia and Luxembourg and offshore centerssuch as Bermuda and Singapore increased.
Figure 9 (a)
Statistical Stand-Alone AnalysisPORTFOLIO INVESTMENTS BY JURISDICTION
Jurisdiction of Issuer(Amounts in US$ Billions)
Total Portfolio Assets Equities Master Funds ST Debt Securities LT Debt Securities
2018 2017 2018 2017 2018 2017 2018 2017 2018 2017United States 1,612 1,312 375 473 129 126 179 107 928 606
Cayman Islands 1,189 1,180 81 101 1,082 1,068 0 0 25 11
United Kingdom 80 71 20 18 0 0 8 21 52 32
Japan 87 60 43 44 1 1 23 7 20 8
China 58 53 42 42 0 0 2 2 15 9
British Virgin Islands 8 43 4 5 3 36 0 0 2 2
France 58 40 8 8 0 0 27 15 23 17
Netherlands 20 29 3 8 0 0 3 8 13 13
Hong Kong 20 25 15 19 0 0 0 1 5 5
Ireland 32 21 11 12 0 7 11 0 20 2
Germany 42 20 11 9 16 0 1 3 4 8
Canada 25 16 10 6 0 0 2 2 13 8
Curacao 23 16 0 0 23 16 0 0 0 0
Denmark 2 4 0 2 0 0 0 0 2 2
Sweden 8 1 3 0 0 0 0 0 6 1
Other Developed Countries 110 86 20 24 9 8 20 11 61 43
Developing Asia and the Pacific 27 25 19 17 0 0 1 1 8 7
Other Offshore Centres 19 21 12 11 4 5 0 1 2 4
Developing Latin America and the Caribbean 21 20 8 7 0 0 1 1 12 12
Developing Europe 8 9 3 4 0 0 0 0 5 5
Developing Africa and the Middle East 9 9 4 3 0 0 0 0 5 6
Total 3,458 3,070 694 813 1,267 1,267 279 180 1,219 801
13Investments Statistical Digest 2018
14Cayman Islands Monetary Authority
Statistical Stand-Alone AnalysisPORTFOLIO INVESTMENTS BY JURISDICTION (CONTINUED)
Figure 9 (b)
0
20015010050
250300350
500550
700750
400450
600650
800850
11001150
10001050
900950
1200
UnitedStates
CaymanIslands
UnitedKingdom
Japan GermanyFranceBritishVirgin Islands
China Netherlands Hong Kong
EquitiesMaster FundsSTDebt SecuritiesLT Debt Securities
375
928
129179
81
025 20 158
52 431 023 20 42
0 00 3 0 3 0 02 215 11 11 208 27 13234 1530
1,082
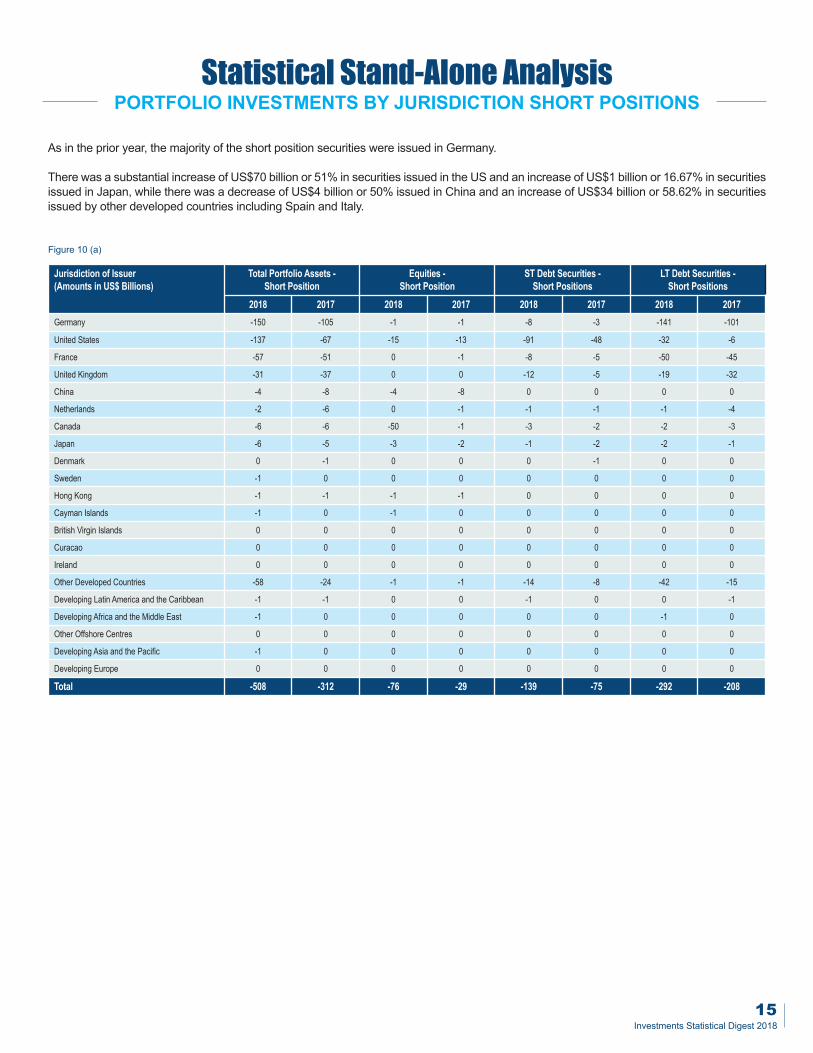
Figure 10 (a)
Statistical Stand-Alone AnalysisPORTFOLIO INVESTMENTS BY JURISDICTION SHORT POSITIONS
Jurisdiction of Issuer(Amounts in US$ Billions)
Total Portfolio Assets -Short Position
Equities -Short Position
ST Debt Securities -Short Positions
LT Debt Securities -Short Positions
2018 2017 2018 2017 2018 2017 2018 2017Germany -150 -105 -1 -1 -8 -3 -141 -101
United States -137 -67 -15 -13 -91 -48 -32 -6
France -57 -51 0 -1 -8 -5 -50 -45
United Kingdom -31 -37 0 0 -12 -5 -19 -32
China -4 -8 -4 -8 0 0 0 0
Netherlands -2 -6 0 -1 -1 -1 -1 -4
Canada -6 -6 -50 -1 -3 -2 -2 -3
Japan -6 -5 -3 -2 -1 -2 -2 -1
Denmark 0 -1 0 0 0 -1 0 0
Sweden -1 0 0 0 0 0 0 0
Hong Kong -1 -1 -1 -1 0 0 0 0
Cayman Islands -1 0 -1 0 0 0 0 0
British Virgin Islands 0 0 0 0 0 0 0 0
Curacao 0 0 0 0 0 0 0 0
Ireland 0 0 0 0 0 0 0 0
Other Developed Countries -58 -24 -1 -1 -14 -8 -42 -15
Developing Latin America and the Caribbean -1 -1 0 0 -1 0 0 -1
Developing Africa and the Middle East -1 0 0 0 0 0 -1 0
Other Offshore Centres 0 0 0 0 0 0 0 0
Developing Asia and the Pacific -1 0 0 0 0 0 0 0
Developing Europe 0 0 0 0 0 0 0 0
Total -508 -312 -76 -29 -139 -75 -292 -208
As in the prior year, the majority of the short position securities were issued in Germany.
There was a substantial increase of US$70 billion or 51% in securities issued in the US and an increase of US$1 billion or 16.67% in securitiesissued in Japan, while there was a decrease of US$4 billion or 50% issued in China and an increase of US$34 billion or 58.62% in securitiesissued by other developed countries including Spain and Italy.
15Investments Statistical Digest 2018

16Cayman Islands Monetary Authority
Statistical Stand-Alone AnalysisPORTFOLIO INVESTMENTS BY JURISDICTION SHORT POSITIONS
ShortP
ositio
ns-Tota
lAssets
(US$
Billio
ns)
Figure 10 (b)
UnitedStates
UnitedKingdom
JapanFrance SwedenCanadaGermany DenmarkNetherlands
0
-20
-40
-60
-80
-100
-120
-140
-160
Equities - Short PositionsST Debt Securities - Short PositionsLT DebtSecurities - Short Positions
-141
-91
-50
-8
-32
0 -1 -1-15
-8-1 0 0
-12-2 -2 0 0 000 0-1-3-3
-50
-19
China
-4 0 0

Figure 11 below provides the jurisdictions where the mutual fund investor holds more than 10% of the net asset value of the fund.14 Therewere 100 countries where investors own at least 10% of a fund. Consistent with the prior year, the majority of investors holding more than10% of the funds were from the US, Cayman Islands and Japan.
Statistical Stand-Alone AnalysisLEGAL HOLDER OF FUNDS
15 A fund can have legal holders of nore than 10% in many countries, therefore the total number of re-sponses exceeded the number of FAR submissions received.*Due to rounding, subtotals may differ from the total sum.
Figure 11
Jurisdiction Number of fundswith Legal Holderowning more than10% of the Fund
2018 2017
United States 3,981 3178
Cayman Islands 3,666 3054
Japan 1,195 1102
Switzerland 843 832
United Kingdom 884 723
Hong Kong 732 563
Luxembourg 574 507
British Virgin Islands 492 463
Guernsey 305 402
China 367 288
Ireland 270 273
Canada 320 246
Saudi Arabia 48 238
Singapore 292 230
Brazil 172 141
Australia 164 137
Bermuda 133 135
Bahamas 126 128
Jersey 110 89
Netherlands 101 79
Liechtenstein 66 66
Belgium 49 62
Taiwan, Province ofChina
62 62
United Arab Emirates 72 61
Israel 71 56
Bahrain 26 53
Curacao 49 43
Malta 52 43
Finland 46 39
Jurisdiction Number of fundswith Legal Holderowning more than10% of the Fund
2018 2017
Kuwait 39 39
Sweden 44 39
Isle of Man 39 34
Republic of Korea 31 30
Germany 34 29
Malaysia 28 28
Panama 30 26
Cyprus 24 23
South Africa 28 23
Andorra 19 19
U.S. Virgin Islands 16 19
France 35 17
Thailand 17 17
Barbados 15 16
Denmark 17 15
Monaco 14 15
Qatar 15 15
Mauritius 14 13
India 15 10
New Zealand 16 10
Lebanon 13 11
Mexico 15 11
Italy 10 9
Samoa 11 9
Austria 12 8
Greece 6 8
Norway 9 8
Chile 10 7
Oman 5 7
Argentina 7 6
Jurisdiction Number of fundswith Legal Holderowning more than10% of the Fund
2018 2017
Ecuador 1 1
Egypt 4 1
Hungary 0 1
Iceland 2 1
Jamaica 0 1
Jordan 1 1
Kyrgyzstan 0 1
Latvia 0 1
Liberia 2 1
Nigeria 2 1
Peru 0 1
Puerto Rico 2 1
Saint Vincent and theGrenadines
1 1
Spain 6 1
Sri Lanka 1 1
Trinidad and Tobago 3 1
Tunisia 0 1
Vanuatu 1 1
Venezuela 2 1
Zimbabwe 0 1
Channel Islands 1 0
Grenada 1 0
Kenya 1 0
Jurisdiction Number of fundswith Legal Holderowning more than10% of the Fund
2018 2017
Belize 5 6
Gibraltar 6 6
Indonesia 7 5
Marshall Islands 5 5
Portugal 7 5
Seychelles 3 5
Saint Kitts and Nevis 6 4
Swaziland 8 4
Turkey 4 4
Anguilla 4 3
Cook Islands 1 3
Libyan Arab Jamahiriya 5 3
Philippines 1 3
Russian Federation 7 3
Turks and Caicos Is-lands
3 3
Botswana 3 2
Macao 5 2
Saint Lucia 2 2
Slovenia 2 2
Uruguay 5 2
Aruba 0 1
Bolivia 0 1
Brunei Darussalam 2 1
Bulgaria 1 1
Christmas Island 0 1
Colombia 3 1
Costa Rica 3 1
Dominican Republic 2 1
17Investments Statistical Digest 2018
18Cayman Islands Monetary Authority
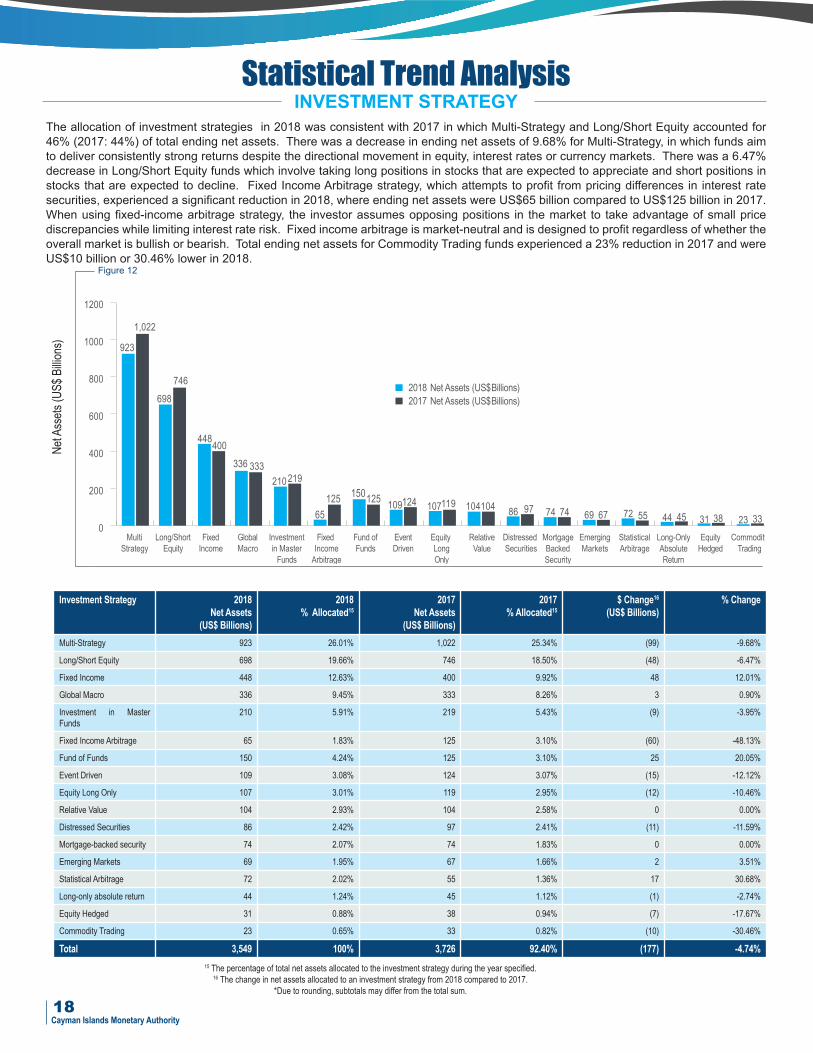
The allocation of investment strategies in 2018 was consistent with 2017 in which Multi-Strategy and Long/Short Equity accounted for46% (2017: 44%) of total ending net assets. There was a decrease in ending net assets of 9.68% for Multi-Strategy, in which funds aimto deliver consistently strong returns despite the directional movement in equity, interest rates or currency markets. There was a 6.47%decrease in Long/Short Equity funds which involve taking long positions in stocks that are expected to appreciate and short positions instocks that are expected to decline. Fixed Income Arbitrage strategy, which attempts to profit from pricing differences in interest ratesecurities, experienced a significant reduction in 2018, where ending net assets were US$65 billion compared to US$125 billion in 2017.When using fixed-income arbitrage strategy, the investor assumes opposing positions in the market to take advantage of small pricediscrepancies while limiting interest rate risk. Fixed income arbitrage is market-neutral and is designed to profit regardless of whether theoverall market is bullish or bearish. Total ending net assets for Commodity Trading funds experienced a 23% reduction in 2017 and wereUS$10 billion or 30.46% lower in 2018.
Statistical Trend Analysis
15 The percentage of total net assets allocated to the investment strategy during the year specified.16 The change in net assets allocated to an investment strategy from 2018 compared to 2017.
*Due to rounding, subtotals may differ from the total sum.
INVESTMENT STRATEGY
Investment Strategy 2018Net Assets
(US$ Billions)
2018% Allocated15
2017Net Assets
(US$ Billions)
2017% Allocated15
$ Change16
(US$ Billions)% Change
Multi-Strategy 923 26.01% 1,022 25.34% (99) -9.68%
Long/Short Equity 698 19.66% 746 18.50% (48) -6.47%
Fixed Income 448 12.63% 400 9.92% 48 12.01%
Global Macro 336 9.45% 333 8.26% 3 0.90%
Investment in MasterFunds
210 5.91% 219 5.43% (9) -3.95%
Fixed Income Arbitrage 65 1.83% 125 3.10% (60) -48.13%
Fund of Funds 150 4.24% 125 3.10% 25 20.05%
Event Driven 109 3.08% 124 3.07% (15) -12.12%
Equity Long Only 107 3.01% 119 2.95% (12) -10.46%
Relative Value 104 2.93% 104 2.58% 0 0.00%
Distressed Securities 86 2.42% 97 2.41% (11) -11.59%
Mortgage-backed security 74 2.07% 74 1.83% 0 0.00%
Emerging Markets 69 1.95% 67 1.66% 2 3.51%
Statistical Arbitrage 72 2.02% 55 1.36% 17 30.68%
Long-only absolute return 44 1.24% 45 1.12% (1) -2.74%
Equity Hedged 31 0.88% 38 0.94% (7) -17.67%
Commodity Trading 23 0.65% 33 0.82% (10) -30.46%
Total 3,549 100% 3,726 92.40% (177) -4.74%
Figure 12
NetA
ssets
(US$
Billio
ns)
0
200
400
600
800
1000
1200
MultiStrategy
Long/ShortEquity
FixedIncome
GlobalMacro
Investmentin MasterFunds
Fund ofFunds
EventDriven
DistressedSecurities
EquityLongOnly
RelativeValue
FixedIncomeArbitrage
EmergingMarkets
StatisticalArbitrage
CommodityTrading
MortgageBackedSecurity
EquityHedged
Long-OnlyAbsoluteReturn
2017 Net Assets (US$Billions)2018 Net Assets (US$Billions)
923
1,022
698
400448
333336219210
109 119107 104104 9786 74 74 7269 67 55 4544 3831 3323
125 125 12465
150
746

Statistical Trend AnalysisInvestments in funds which utilise Insurance Linked Securities strategies reported an increase in total net asset of US$2 billion or 13.33%.Insurance Linked Securities are broadly defined as financial instruments whose values are driven by insurance loss events such as hurricanes,floods and cyber attacks. Such instruments which have been employed by insurers eager to transfer risk and tap new sources of capital marketfunding hold great appeal for investors as interest rates remain near historic lows and investors continue to look for yields in alternative assetsclasses and they are not correlated with stock market and other asset classes. Investment in Insurance Linked catastrophe bonds which areissued for both life and property/casualty sectors grew in 2018 despite the amounts paid out as result of natural disasters. Given the extent oflosses and their impact on the market, some had expected investors to either back-off from investments in catastrophe insurance risks ordemand price increases, but the market remained resilient in 2018. Multi-Manager investment products which consist of multiple specialisedfunds overseen by managers with different investment styles and allow for diversification without sacrificing return, experienced a 33.33%reduction in 2018 with ending net assets of US$8 billion (2017: US$12 billion).
INVESTMENT STRATEGY (CONTINUED)
17 The percentage of total net assets allocated to the investment strategy during the year specified.18 The change in net assets allocated to an investment strategy from 2018 compared to 2017.
*Due to rounding, subtotals may differ from the total sum.
Investment Strategy 2018Net Assets
(US$ Billions)
2018% Allocated17
2017Net Assets
(US$ Billions)
2017% Allocated17
$ Change18
(US$ Billions)% Change
Equity Market Neutral 28 0.71% 32 0.79% (4) -13.86%
Activism 23 0.60% 27 0.67% (4) -13.01%
Managed Futures 27 0.69% 20 0.50% 7 34.84%
Macro Investment 20 0.52% 19 0.47% 1 6.74%
Insurance Linked Securities 17 0.42% 15 0.37% 2 10.54%
Private Equity 17 0.44% 15 0.37% 2 13.69%
Volatility Arbitrage 15 0.39% 14 0.35% 1 7.84%
Merger & Other Arbitrage 11 0.28% 12 0.30% (1) -8.67%
Multi-Manager 8 0.21% 12 0.30% (4) -31.35%
Market Neutral 11 0.27% 11 0.27% 0 -3.39%
Convertible Arbitrage 9 0.22% 10 0.25% (1) -12.69%
Passive management/In-dex tracking
63 1.61% 6 0.15% 1 -8.33%
Real Estate 11 0.28% 6 0.15% 5 81.69%
Foreign Exchange 3 0.09% 2 0.05% 1 69.03%
Other 104 2.32% 106 2.63% (2) -1.89%
Total 367 9.06% 307 7.61% 2 0.65%
Table from Figure 12 3,549 90.94% 3,726 92.40% -177 -4.74%
Total Net Asset Value 3,916 100% 4,033 100% -175 -4.34%
Figure 13
NetA
ssets
(US$
Billio
ns)
120
100
80
60
40
20
0Merger &Other
Arbitrage
Real EstatePassiveManagement/Index Tracking
Multi-Manager
ConvertibleArbitrage
InsuranceLinked
Securities
MarketNeutral
VolatillityArbitrage
PrivateEquity
MacroInvestment
ManagedFutures
Activism
2017 Net Assets (US$Billions)2018 Net Assets (US$Billions)
11 1120 20 1519
27 2728 3223
Equity MarketNeutral
11 8 121217 15 15 1417109 66 611
ForeignExchange
3 2Other
106104
19Investments Statistical Digest 2018

Overall demand for mutual funds as measured by net cash flow - subscriptions less redemptions rebounded in the US in 2018 following twoconsecutive years of outflows. However, Cayman Islands funds experienced a net asset outflow for the second consecutive year asredemptions of US$1,079 billion exceeded total subscriptions of US$1,049 billion. Most of the investment strategies detailed in figure 14reported net outflows although Fixed Income and Fixed IncomeArbitrage saw net inflows of US$39 billion and US$1 billion, respectively. Thenet subscriptions to these fund types can be attributed to actions taken by the Federal Reserve which increased interest rates three times in2018. Secondly, investments in mutual funds are influenced by demographics and over the past decade, the aging of baby boomers hasboosted flows to bond funds; as investors age, they tend to shift to fixed-income products for yield and safety relative to equities. Multi-Strategyfunds which allow fund managers the flexibility to capitalise on the best opportunities in their varied skill sets and allows capital to be allocatedfrom less attractive strategies to those offering superior opportunities are very popular with investors. However, for the last two years, therehas been a net asset outflow and in 2018 redemptions exceeded subscriptions by US$36 billion (2017: US$59 billion). Nevertheless this fundstrategy which represents 24.07% of total ending net assets in 2018 continues to be the most popular as Multi-Strategy funds offer investorsaccess to a variety of strategies, provide considerable capacity and enhance risk-adjusted returns of a diversified or concentrated investmentportfolio.
Statistical Trend AnalysisSUBSCRIPTIONS, REDEMPTIONS AND NET ASSET FLOWS
BY INVESTMENT STRATEGY
Investment Strategy 2018Subscriptions(US$ Billions)
2018Redemptions(US$ Billions)
2018Net Asset Flows
(US$ Billions)
2017Subscriptions(US$ Billions)
2017Redemptions(US$ Billions)
2017Net Asset Flows
(US$ Billions)
Change in Net As-set Flows
(US$ Billions)Multi-Strategy 199 (235) (36) 176 (235) (59) 27
Long/Short Equity 146 (175) (29) 130 (149) (19) (10)
Fixed Income 211 (172) 39 218 (169) 49 (10)
Global Macro 79 (90) (11) 96 (93) 4 (14)
Investment in Master Funds 54 (54) 0 54 (48) 6 (6)
Fixed Income Arbitrage 17 (17) 1 32 (20) 12 (12)
Fund of Funds 9 (10) (1) 197 (212) (15) 15
Event Driven 33 (49) (16) 40 (46) (6) (9)
Equity Long Only 37 (25) 12 26 (24) 2 10
Relative Value 16 (24) (8) 26 (24) 2 (10)
Distressed Securities 16 (19) (3) 17 (23) (6) 3
Emerging Markets 16 (13) 3 14 (11) 3 (0)
Mortgage-backed security 12 (9) 3 21 (24) (3) 6
Statistical Arbitrage 19 (19) 0 14 (8) 6 (6)
Long-only absolute return 11 (8) 3 9 (9) (0) 3
Equity Hedged 7 (10) (3) 8 (10) (2) (1)
Commodity Trading 8 (10) (2) 13 (15) (2) 0
Total 890 (939) (49) 1,091 (1,120) (29) (20)
Figure 14
NetA
ssets
Flows
-(US
$Billions)
-30
-40
-50
-60
-20
-10
0
10
20
30
40
50
60
Long-onlyabsolutereturn
EmergingMarkets
StatisticalArbitrage
CommodityTrading
MortgagebackedSecurity
EquityHedged
RelativeValue
FixedIncomeArbitrage
DistressedSecurities
EventDriven
Investmentin MasterFunds
GlobalMacro
FixedIncome
EquityLongOnly
Long/ShortEquity
MultiStrategy
Fund ofFunds
2018 Net Asset Flows (US$Billions)2017 Net Asset Flows (US$Billions)
(59)
(36)
(19)
(29)
4939
(11)
4 206
06
12
0(1)
(6) (3) (6) (3)
212
3 3 3 3
(8)(15) (16)
0
(3) (2)(2) (2)
20Cayman Islands Monetary Authority
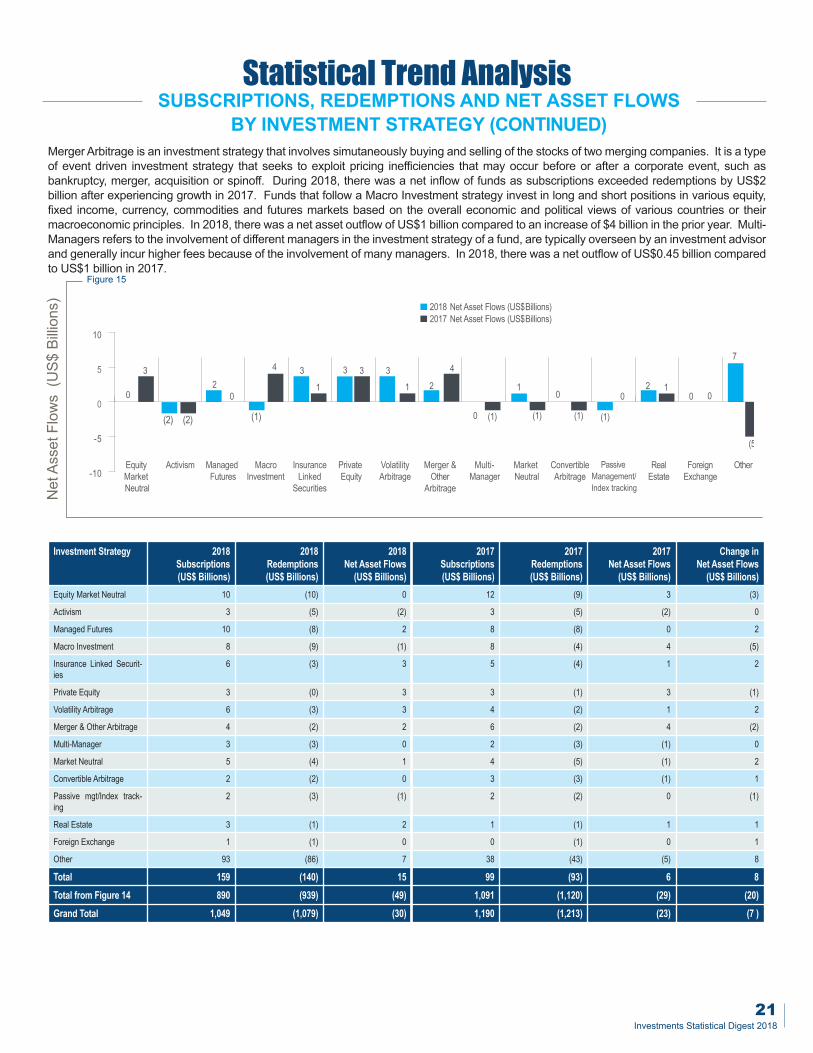
MergerArbitrage is an investment strategy that involves simutaneously buying and selling of the stocks of two merging companies. It is a typeof event driven investment strategy that seeks to exploit pricing inefficiencies that may occur before or after a corporate event, such asbankruptcy, merger, acquisition or spinoff. During 2018, there was a net inflow of funds as subscriptions exceeded redemptions by US$2billion after experiencing growth in 2017. Funds that follow a Macro Investment strategy invest in long and short positions in various equity,fixed income, currency, commodities and futures markets based on the overall economic and political views of various countries or theirmacroeconomic principles. In 2018, there was a net asset outflow of US$1 billion compared to an increase of $4 billion in the prior year. Multi-Managers refers to the involvement of different managers in the investment strategy of a fund, are typically overseen by an investment advisorand generally incur higher fees because of the involvement of many managers. In 2018, there was a net outflow of US$0.45 billion comparedto US$1 billion in 2017.
SUBSCRIPTIONS, REDEMPTIONS AND NET ASSET FLOWSBY INVESTMENT STRATEGY (CONTINUED)
Statistical Trend Analysis
Investment Strategy 2018Subscriptions(US$ Billions)
2018Redemptions(US$ Billions)
2018Net Asset Flows
(US$ Billions)
2017Subscriptions(US$ Billions)
2017Redemptions(US$ Billions)
2017Net Asset Flows
(US$ Billions)
Change inNet Asset Flows
(US$ Billions)Equity Market Neutral 10 (10) 0 12 (9) 3 (3)
Activism 3 (5) (2) 3 (5) (2) 0
Managed Futures 10 (8) 2 8 (8) 0 2
Macro Investment 8 (9) (1) 8 (4) 4 (5)
Insurance Linked Securit-ies
6 (3) 3 5 (4) 1 2
Private Equity 3 (0) 3 3 (1) 3 (1)
Volatility Arbitrage 6 (3) 3 4 (2) 1 2
Merger & Other Arbitrage 4 (2) 2 6 (2) 4 (2)
Multi-Manager 3 (3) 0 2 (3) (1) 0
Market Neutral 5 (4) 1 4 (5) (1) 2
Convertible Arbitrage 2 (2) 0 3 (3) (1) 1
Passive mgt/Index track-ing
2 (3) (1) 2 (2) 0 (1)
Real Estate 3 (1) 2 1 (1) 1 1
Foreign Exchange 1 (1) 0 0 (1) 0 1
Other 93 (86) 7 38 (43) (5) 8
Total 159 (140) 15 99 (93) 6 8
Total from Figure 14 890 (939) (49) 1,091 (1,120) (29) (20)
Grand Total 1,049 (1,079) (30) 1,190 (1,213) (23) (7 )
Figure 15
NetAs
setF
lows(US$
Billio
ns)
-10
-5
0
5
10
OtherPrivateEquity
VolatilityArbitrage
RealEstate
Merger &Other
Arbitrage
PassiveManagement/Index tracking
EquityMarketNeutral
ForeignExchange
ManagedFutures
MacroInvestment
Activism MarketNeutral
InsuranceLinked
Securities
ConvertibleArbitrage
Multi-Manager
32
4
012
0
(2) (2) (1)
4 3 3 3
1 10
20 0
0
1
(1) (1)
0
(1)(1)
7
(5)
3
2018 Net Asset Flows (US$Billions)2017 Net Asset Flows (US$Billions)
21Investments Statistical Digest 2018

22Cayman Islands Monetary Authority
CHANGEINNETASSETS,DIVIDENDS&NETINCOMEBYINVESTMENTSTRATEGYFigure 16The decline in net assets in 2018
was driven by several factorsthat weighed on global stockmarkets and foreign exchangemarkets, particularly in the fourthquarter. Chief among them wasthe fear of a severe slowdown inglobal economic growth,stemming in part from lower-than-expected economic growthin China and deteriorating traderelations between China and theUS. Total ending assets wereUS$96 billion lower than at thebeginning of the year.Investment performance andtherefore net income is governedby monetary policies whichvaried around the globe. Whiledevelopments in US interestrates may play a role inEuropean bond fund investors’behavior, these effects likelywere compounded by theannouncement from theEuropean Central Bank (ECB) inJune that it intended to terminateits quantitative easing scheme atthe end of 2018. Following thisnews, investors may haveexpected the value of longer-duration bonds to decline andinterest rate volatility to increaseonce the ECB stoppedpurchasing long-dated bonds.Net income for this strategy typewas US$120 billion in 2017compared to a net loss of US$27billion in 2018 .
AmountsinUS$
Billio
ns
19 Calculated as 2018 Ending Net Assets minus 2018 Opening Net Assets
Statistical Trend Analysis
Investment Strategy(Amounts in US$ billions)
2018Opening
Net Assets
2018Ending Net
Assets
2018 Changein Net
Assets19
2018 Di-vidends
2017 Di-vidends
2018 NetIncome/
Net Loss
2017 NetIncome/
Net Loss
Multi-Strategy 988 923 (65) (5) (11) (15) 91
Long/Short Equity 751 698 (53) (5) (2) (27) 120
Fixed Income 422 448 26 (5) (5) 0 16
Global Macro 331 336 5 0 0 17 12
Investment in Master Funds 214 210 (4) (1) (2) (3) 19
Fixed Income Arbitrage 63 65 2 (1) (2) 1 5
Fund of Funds 74 150 76 (6) (2) 2 11
Event Driven 117 109 (8) 0 0 0 10
Equity Long Only 114 107 (7) (2) (5) (8) 23
Relative Value 107 104 (3) 0 0 4 7
Distressed Securities 91 86 (5) (1) (1) 2 11
Emerging Markets 72 69 (3) 0 (1) (4) 9
Mortgage-backed security 67 74 7 0 0 2 9
Statistical Arbitrage 63 72 9 0 0 9 5
Long-only absolute return 46 44 (2) 0 0 (2) 8
Equity Hedged 33 31 (2) 0 0 1 5
Commodity Trading 24 23 (1) 0 0 (1) 0
Total 3,577 3,549 (28) (26) (31) (22) 361
70
60
50
35
30
25
20
15
10
5
0
-20
-40
-50
-60
-70
2018 Change in Net Assets2018 Dividends
9 9
(8) (7)(2)
2
(3) (2) (2) (1)(4)
24 7
00 0
000 02
(5)(1)
12 1
76
26
17
(0)(4)
(1) (1)(6)(3) (3)
5
(53)
(65)
(5)(15)
(5)(27)
(8)(5) (0)
2018 Net Income / Net Loss
0 (1) (1)0
MultiStrategy
Long/ShortEquity
FixedIncome
GlobalMacro
Investmentin MasterFunds
Fund ofFunds
EventDriven
DistressedSecurities
EquityLongOnly
RelativeValue
FixedIncomeArbitrage
EmergingMarkets
StatisticalArbitrage
CommodityTrading
MortgageBackedSecurity
EquityHedged
Long-OnlyAbsoluteReturn

CHANGEINNETASSETS,DIVIDENDS&NETINCOMEBYINVESTMENTSTRATEGY(CONTINUED)Equity Market Neutral which describes an investment strategy where the manager attempts to exploit differences in stock prices by being longand short in closely related stocks, within the same sector, industry and country reported ending net assets of US$28 billion in 2018 an increaseof US$2 billion. Unlike the prior year in which total losses were US$2 billion, in 2018 net loss was US$4 billion. Private Equity is an alternativeinvestment class and consists of capital that is not listed on a public exchange. The boom years for private equity occurred just before thefinancial crisis and continued to offer investment opportunities as pension funds and other investors provide a line of credit for companies thatare unable to tap into the coporate bond market. Total ending assets at year end were US$17 billion with net income of US$1 billion anddividends of US$3 billion distributed during the year.
AmountsinUS$
Billio
ns
8
6
4
3
2
1
0
-2
-4
-6
-10
80 OtherForeignExchange
MacroInvestment
EquityMarketNeutral
PassiveManagement /
Index
RealEstate
Merger &Other
Arbitrage
PrivateEquity
VolatilityArbitrage
ManagedFutures
Activism MarketNeutral
InsuranceLinked
Securities
ConvertibleArbitrage
MultiManager
2018 Change in Net Assets2018 Dividends
00 00
(5)
(2) (2)
0
1
00 0
00 0 00 0 0
1 1
0 0
(6)
(83)
(7)
2018 Net Income / Net Loss
1
0
(1) (1)(2)
8
(3)
(1)
0
3 33
1 111 11
0 0
Figure 17
20Calculated as 2018 Ending Net Assets minus 2018 Opening Net Assets
Statistical Trend Analysis
Investment Strategy(Amounts in US$ billions)
2018 OpeningNet Assets
2018 EndingNet Assets
2018 Change inNet Assets20
2018Dividends
2017Dividends
2018Net Income/
Net Loss
2017Net Income/
Net LossEquity Market Neutral 32 28 (4) 0 0 0 2
Activism 28 23 (5) 0 0 (2) 3
Managed Futures 26 27 1 0 0 (2) 0
Macro Investment 21 20 (1) 0 0 0 1
Insurance Linked Securities 16 17 1 (1) (1) (1) 0
Private Equity 16 17 1 (3) (3) 1 2
Volatility Arbitrage 12 15 3 0 0 1 0
Merger & Other Arbitrage 8 11 3 0 0 1 0
Multi-Manager 10 8 (2) 0 0 0 1
Market Neutral 10 11 1 0 0 0 0
Convertible Arbitrage 8 9 1 0 0 0 1
Passive management/Index tracking 55 63 8 0 0 0 1
Real Estate 8 11 3 0 0 1 0
Foreign Exchange 2 3 1 0 0 0 (1)
Other 183 104 (79) (6) (3) (7) 12
Total 435 367 (68) (10) (7) (8) 22
Total from Figure 16 3,577 3,549 (28) (26) (31) (22) 361
Grand Total 4,012 3,916 (96) (39) (38) (30) 383
23Investments Statistical Digest 2018

24Cayman Islands Monetary Authority
NET ASSETS BY INVESTMENT MANAGER LOCATION - USAThe number of funds managed by companies in the US were down by 155 (2017: down 55) and total net assets at US$2,675 billion werelower than in 2017. Companies in Delaware and New York which managed 48.44% of all funds remained the top two locations asinvestment managers concentrate in locations where the industry began. Total net assets of US$51 billion (2017: US$119 billion) weremanaged by Illinois based companies and reported one of the largest declines of 57.11%. California based companies reported anincrease in the total assets managed by US$347 billion or 2.92% higher than 2017. The number of funds managed by companies in Iowawas up by one but total assets decreased by 12.64% to US$4 billion from US$5 billion.
Statistical Trend Analysis
InvestmentManagerLocation
2018Number of
Funds
2018Net Assets
(US$ Billions)
2018% Allocated
2017Number of Funds
2017Net Assets
(US$ Billions)
2017% Allocated
$ Change(US$ Billions)
% Change
Delaware 2,114 1,231 31.44% 2,100 1,193 29.58% 38 3.17%
New York 1,311 666 17.00% 1,352 753 18.67% (87) -11.57%
California 465 347 8.85% 468 337 8.36% 10 2.92%
Connecticut 179 55 1.41% 191 69 1.71% (14) -19.85%
Illinois 166 51 1.31% 176 119 2.95% (68) -57.11%
Massachusetts 177 127 3.25% 175 70 1.74% 57 81.99%
Florida 118 54 1.38% 106 43 1.07% 11 25.84%
New Jersey 79 44 1.11% 87 45 1.12% (1) -2.21%
Texas 63 14 0.37% 64 25 0.62% (11) -44.40%
Minnesota 43 22 0.57% 48 21 0.52% 1 4.79%
Virginia 29 12 0.32% 32 13 0.32% -1 -7.97%
Maryland 8 5 0.12% 9 4 0.10% 1 32.59%
Rhode Island 3 0 0.01% 6 8 0.20% (8) -103.63%
Iowa 8 4 0.11% 6 5 0.12% (1) -12.64%
Other US states 209 43 1.10% 307 77 1.91% (34) -44.26%
Total USA 4,972 2,675 68.34% 5,127 2,782 68.98% (107) -3.85%
14 25 22 12 5 0 4 4377
1,1931,231
666753
347
55 51127
54 4544437011969
337
21 13 4 8 5
1,4001,2001,000900800700600500400300200100
0
Other U
SStates
Rhode
Island
Iowa
Maryla
ndVirg
iniaTexas
Minnes
otaFlorida
New Jersey
Illinois
Massachu
setts
Conne
cticut
California
New York
Deleware
2017 Net Assets (US$Billions)2018 Net Assets (US$Billions)
Figure 18
NetAs
sets(US$
Billio
ns)

NET ASSETS BY INVESTMENT MANAGER LOCATION - OTHERIn 2018, total ending net assets of US$1,241 billion managed in the category of Other countries were lower than US$1,251 billion in 2017.There were increases in NAV of funds managed by Jersey (up US$14 billion) and other Euro countries such as Germany, the Netherlandsand Spain. The number of funds managed by other Euro countries increased to 121 and the total assets increased to US$28 billion up fromUS$2 billion in 2017. Brazil and Hong Kong reported reductions in ending net assets managed of 10.59% and 8.88% respectively, althoughthe number of funds managed in Brazil remained at 182 and those managed in Hong Kong were up by 364. The United Kingdom (UK)remained the largest asset management center in Europe and is globally second only to the US. However, the uncertain political backdropand the prospect of more turbulence as the UK navigates the Brexit negotiations are concerning for UK fund managers, especially whereassets are managed in the UK for funds domicled in the EU. The outcome of the negotiations is likely to affect the number of investmentmanagers that remain in the UK.
Statistical Trend Analysis
Investment Man-agerLocation
2018Number
of Funds
2018Net Assets
(US$Billions)
2018%
Allocated
2017Number
of Funds
2017Net Assets
(US$Billions)
2017%
Allocated
$Change
(US$Billions)
%Change
United Kingdom 933 401 10.24% 1,007 421 10.44% (20) -4.76%
Hong Kong 445 76 1.94% 809 182 4.51% (106) -58.21%
Cayman Islands 1,434 300 7.66% 532 91 2.26% 208 227.76%
Sinagpore 377 82 2.10% 383 131 3.25% (49) -37.37%
Switzerland 191 89 2.28% 226 79 1.96% 10 13.06%
Brazil 182 42 1.07% 182 47 1.17% (5) -10.59%
Japan 120 29 0.73% 141 31 0.77% (3) -8.88%
Jersey 86 89 2.27% 88 75 1.86% 14 18.93%
France 40 19 0.48% 35 20 0.50% (1) -7.16%
Luxembourg 14 1 0.04% 27 26 0.64% (25) -94.50%
Ireland 12 9 0.23% 16 11 0.27% (2) -17.95%
Other Euro coun-tries
121 28 0.73% 23 2 0.05% 26 1342.32%
Other countries 445 76 1.94% 727 135 3.34% (59) -43.55%
Total - Other 4,400 1,241 31.69% 4,196 1,251 31.02% (10) 1319.07%
Total - USA 4,972 2,675 68.34% 5,127 2,782 68.98% (107) -3.85%
Grand Total 9,372 3,916 100% 9,323 4,033 100% (117) -2.90%
Figure 19
NetAs
sets(US$
Billio
ns)
50
0
100
150
200
250
300
350400450
401 421
76
182
76
300
91 82131
89 897942 47 29 31
135
75
19 20 26 9 11 28 21
2017 Net Assets (US$Billions)2018 Net Assets (US$Billions)
Other C
ountries
Other E
uroCountries
Ireland
Luxembou
rgFranceJap
anBrazil
CaymanIslands
Switzerlan
d
Singap
oreJersey
HongKon
g
United
Kingdo
m
25Investments Statistical Digest 2018

26Cayman Islands Monetary Authority
NET ASSET VALUE (NAV) CALCULATION LOCATIONThe number of funds usingCayman Islands companiesoffering NAV calculation servicesincreased by 128 and totalending net assets wereUS$1,518 billion, up 2.16% from2017. This represents over athird of all NAV calculationlocations and the CaymanIslands reported the highestgrowth in terms of number offunds and ending net assetsduring the year. The US21 andIreland are the second and thirdmost popular destinations with30.67% and 14.33% of endingnet assets respectively. During2018, NAV calculation serviceswere provided to fewer funds inthe US and Ireland but the totalending assets increased. NAVcalculation services provided bycompanies in Curacao continuedto decrease with three fewerfunds and net assets which wereas high as US$115 billion in 2015up by US$2 billion to US$55billion. In 2018, Malta remaineda top 15 location providing NAVcalculation services with 103funds and US$4 billion.
Statistical Trend Analysis
NAV Calculation Location 2018Number
of Funds
2018Net Assets
(US$ Billions)
Percentage ofTotal NAV
2017Number
of Funds
2017Net Assets
(US$ Billions)
Percentage ofTotal NAV
Cayman Islands 3,386 1,518 38.81% 3,258 1,478 36.65%
United States 2,453 1,200 30.67% 2,545 1,222 30.30%
Ireland 1,192 561 14.33% 1,379 697 17.28%
Bermuda 758 269 6.89% 656 257 6.37%
Hong Kong 407 62 1.58% 345 58 1.44%
Singapore 292 60 1.53% 228 45 1.12%
Curacao 120 55 1.42% 123 72 1.79%
Luxembourg 163 52 1.34% 191 53 1.31%
Australia 27 51 1.31% 102 51 1.26%
Canada 81 42 1.06% 98 16 0.40%
Brazil 91 11 0.29% 53 9 0.22%
Netherlands 47 7 0.18% 20 47 1.17%
Malta 103 4 0.11% 91 5 0.12%
Other 252 24 0.48% 234 23 0.57%
Total 9,372 3,916 100% 9,323 4,033 100%
21Top five US states: New York, Massachusetts, Delaware, Pennsylvania and Connecticut
Figure 20
NetAs
sets(US$
Billio
ns)
16001550150014501400125012001150110010501000950900850800750700650600550500450400350300250200150100500
1,478
1,518
1,200 1,222
561
697
269 257
62 55 53 42 51 51 475 2324411 16 7 9
58 60 45 5272
2017 Net Assets (US$Billions)2018 Net Assets (US$Billions)
Malta
Other
Netherlan
dsBrazil
Singap
ore
HongKon
g
Austra
lia
Luxemnbo
urgCanada
Curacao
Bermu
daIreland
United
States
CaymanIslands
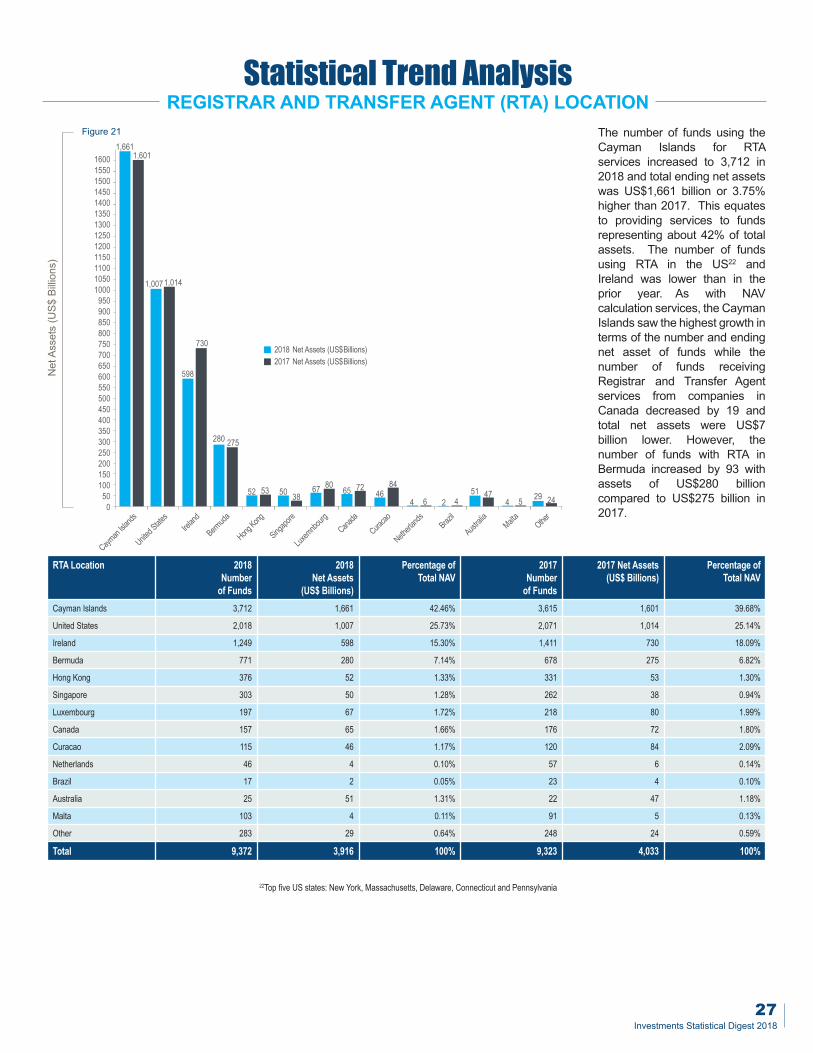
REGISTRAR AND TRANSFER AGENT (RTA) LOCATIONThe number of funds using theCayman Islands for RTAservices increased to 3,712 in2018 and total ending net assetswas US$1,661 billion or 3.75%higher than 2017. This equatesto providing services to fundsrepresenting about 42% of totalassets. The number of fundsusing RTA in the US22 andIreland was lower than in theprior year. As with NAVcalculation services, the CaymanIslands saw the highest growth interms of the number and endingnet asset of funds while thenumber of funds receivingRegistrar and Transfer Agentservices from companies inCanada decreased by 19 andtotal net assets were US$7billion lower. However, thenumber of funds with RTA inBermuda increased by 93 withassets of US$280 billioncompared to US$275 billion in2017.
Statistical Trend Analysis
22Top five US states: New York, Massachusetts, Delaware, Connecticut and Pennsylvania
RTA Location 2018Number
of Funds
2018Net Assets
(US$ Billions)
Percentage ofTotal NAV
2017Number
of Funds
2017 Net Assets(US$ Billions)
Percentage ofTotal NAV
Cayman Islands 3,712 1,661 42.46% 3,615 1,601 39.68%
United States 2,018 1,007 25.73% 2,071 1,014 25.14%
Ireland 1,249 598 15.30% 1,411 730 18.09%
Bermuda 771 280 7.14% 678 275 6.82%
Hong Kong 376 52 1.33% 331 53 1.30%
Singapore 303 50 1.28% 262 38 0.94%
Luxembourg 197 67 1.72% 218 80 1.99%
Canada 157 65 1.66% 176 72 1.80%
Curacao 115 46 1.17% 120 84 2.09%
Netherlands 46 4 0.10% 57 6 0.14%
Brazil 17 2 0.05% 23 4 0.10%
Australia 25 51 1.31% 22 47 1.18%
Malta 103 4 0.11% 91 5 0.13%
Other 283 29 0.64% 248 24 0.59%
Total 9,372 3,916 100% 9,323 4,033 100%
1600155015001450140013501300125012001150110010501000950900850800750700650600550500450400350300250200150100500
1,6011,661
1,0141,007
730
598
280 275
5352 50 3867 80
65 7246
84
4 6 2 451 47
4 5 29 24
2017 Net Assets (US$Billions)2018 Net Assets (US$Billions)
Malta
Other
Netherlan
dsBrazil
Singap
ore
HongKon
g
Austra
lia
Luxemnbo
urgCanada
Curacao
Bermu
daIreland
United
States
CaymanIslands
Figure 21
NetAs
sets(US$
Billio
ns)
27Investments Statistical Digest 2018

28Cayman Islands Monetary Authority
NAV & RTA SUB-DELEGATED LOCATIONNAV and RTA services offered by Cayman Islands companies are sub-delegated to a number of other countries, with Singapore, Canada,Hong Kong and Ireland being the most popular locations. Fund administration encompasses the middle- and back-office functions necessaryto operate the fund, and includes clerical and fund accounting services, data processing, recordkeeping, internal audits, and compliance andrisk management functions. The primary motivation behind this arrangement is cost, with these countries providing economies of scale forback office and other administrative functions that cannot be achieved in the Cayman Islands.
STATISTICAL STAND-ALONE ANALYSIS
Figure 22
Figure 23RTA Sub-delegated Loc-ation
2018Number
of Funds
2018Net Assets
(US$ Millions)
2017Number
of Funds
2017Net Assets
(US$ Millions)Hong Kong 214 39,031 193 33,736
Ireland 211 85,535 188 79,134
Singapore 196 36,857 179 25,840
Canada 178 73,400 169 84,358
United States24 64 16,707 49 15,997
Australia 18 382 20 1,711
Cayman Islands 12 6,655 14 7,086
Netherlands 10 1,788 10 1,770
United Arab Emirates 9 421 4 320
South Africa 2 219 2 94
Luxembourg 1 245 1 130
Isle of Man 0 0 0 0
Malta 0 0 0 0
Mauritius 1 11 1 143
Other 2,796 1,399,954 2,785 1,350,527
Total 3,712 1,661,205 3,615 1,600,846
NAV Sub-delegated Loc-ation
2018Number
of Funds
2018Net Assets
(US$ Millions)
2017Number
of Funds
2017Net Assets
(US$ Millions)Singapore 243 47,567 233 39,353
Canada 234 147,691 203 173,199
Hong Kong 220 43,054 192 37,354
Ireland 251 111,715 187 91,539
United States23 127 50,863 142 58,165
Australia 20 637 24 1,985
Cayman Islands 20 7,558 23 8,202
Luxembourg 1 1,398 11 1,398
Netherlands 10 1,788 10 1,770
United Arab Emirates 8 419 4 320
South Africa 1 21 1 17
Bermuda 1 122 1 104
Brazil 1 395 1 400
Isle of Man 0 0 0 0
Malta 0 0 0 0
Mauritius 0 0 0 0
Other 2,249 1,105,095 2,226 1,064,343
Total 3,386 1,518,325 3,258 1,478,150
23Top US states for NAV sub-delegated: New Jersey, New York, Delaware, North Carolina and California24Top US states for RTA sub-delegated: New York, Illinois, California, Delaware and Pennsylvania

MINIMUM INITIAL SUBSCRIPTIONThe majority (40%) of Registered Funds which cater to institutional as well as high net worth individuals require a minimum initial subscriptionof between US$100,000 to US$499,999. Master Funds which are funded by feeder funds require a higher minimum initial subscription ofbetween US$1,000,000 and US$4,999,999 for the majority (41%) of funds. Administered Funds require less than US$50,000 (53%) of itsfunds and Licensed Funds also known as retail funds also require minimum initial subscription of less than US$50,000 for the majority (72%)of funds.
STATISTICAL STAND-ALONE ANALYSIS
Minimum Initial SubscriptionAmount (US$)
RegisteredFunds
% MasterFunds
% AdministeredFunds
% LicensedFunds
%
Greater than $10,000,000 409 6% 179 7% 6 2% 0 0%
$5,000,000 - $9,999,999 733 12% 458 17% 3 1% 0 0%
$1,000,000 - $4,999,999 1,922 31% 1,081 41% 14 6% 6 9%
$500,000 - $999,999 428 7% 131 5% 9 4% 1 1%
$100,000 - $499,999 2,665 40% 657 25% 53 21% 6 9%
$50,000-$99,999 142 2% 53 2% 30 12% 6 9%
Less Than $50,000 82 2% 110 4% 138 53% 50 72%
Total 6,381 100% 2,669 100% 253 100% 69 100%
0%
10%
20%
30%
40%
50%
60%
70%
80%
Registered Funds Master Funds Administered Funds Licensed Funds
Greater than $10,000,000$5,000,000 - $9,999,999$1,000,000 - $4,999,999$500,000 - $999,999$100,000 - $499,999$50,000-$99,999Less Than $50,000
6%
12%
31%40%
21%
7%2% 2%
7% 6%5% 2% 4%4% 2% 1% 0% 0% 1%9% 9%9%
25%17% 12%
41%
53%
72%
Figure 24
%ofFu
nds
29Investments Statistical Digest 2018
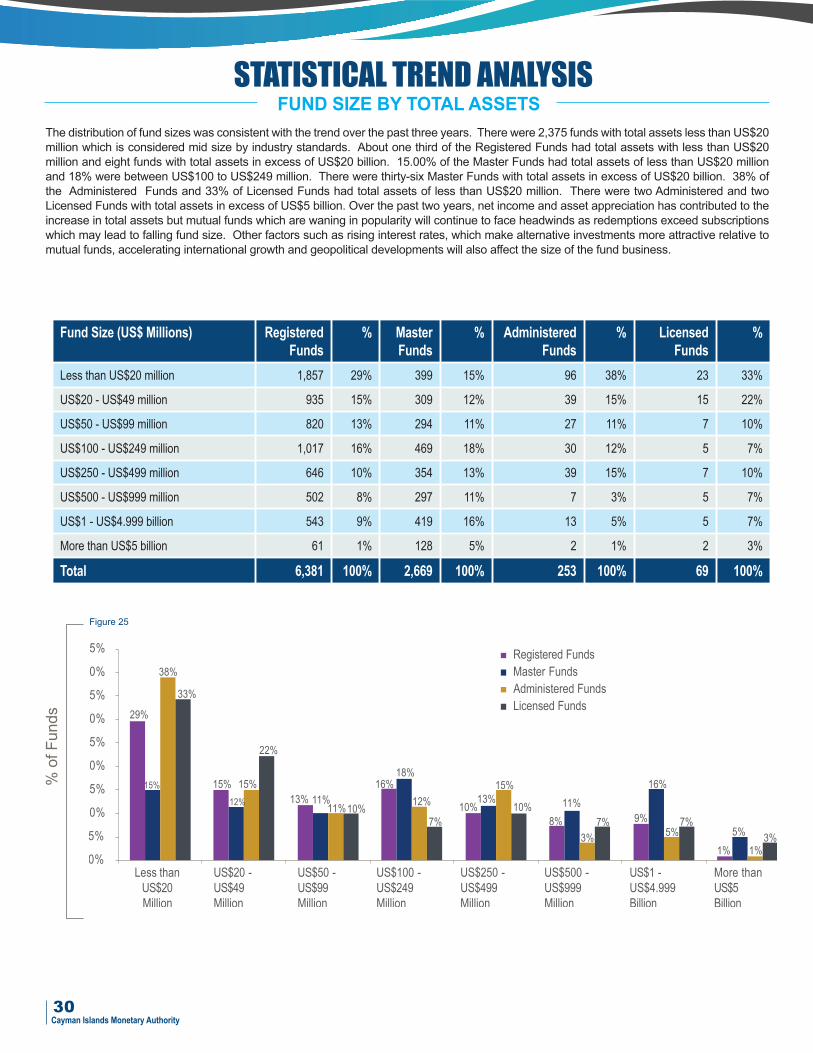
30Cayman Islands Monetary Authority
FUND SIZE BY TOTAL ASSETSSTATISTICAL TREND ANALYSIS
The distribution of fund sizes was consistent with the trend over the past three years. There were 2,375 funds with total assets less than US$20million which is considered mid size by industry standards. About one third of the Registered Funds had total assets with less than US$20million and eight funds with total assets in excess of US$20 billion. 15.00% of the Master Funds had total assets of less than US$20 millionand 18% were between US$100 to US$249 million. There were thirty-six Master Funds with total assets in excess of US$20 billion. 38% ofthe Administered Funds and 33% of Licensed Funds had total assets of less than US$20 million. There were two Administered and twoLicensed Funds with total assets in excess of US$5 billion. Over the past two years, net income and asset appreciation has contributed to theincrease in total assets but mutual funds which are waning in popularity will continue to face headwinds as redemptions exceed subscriptionswhich may lead to falling fund size. Other factors such as rising interest rates, which make alternative investments more attractive relative tomutual funds, accelerating international growth and geopolitical developments will also affect the size of the fund business.
Fund Size (US$ Millions) RegisteredFunds
% MasterFunds
% AdministeredFunds
% LicensedFunds
%
Less than US$20 million 1,857 29% 399 15% 96 38% 23 33%
US$20 - US$49 million 935 15% 309 12% 39 15% 15 22%
US$50 - US$99 million 820 13% 294 11% 27 11% 7 10%
US$100 - US$249 million 1,017 16% 469 18% 30 12% 5 7%
US$250 - US$499 million 646 10% 354 13% 39 15% 7 10%
US$500 - US$999 million 502 8% 297 11% 7 3% 5 7%
US$1 - US$4.999 billion 543 9% 419 16% 13 5% 5 7%
More than US$5 billion 61 1% 128 5% 2 1% 2 3%
Total 6,381 100% 2,669 100% 253 100% 69 100%
0%
5%
10%
15%
20%
25%
30%
35%
40%
45%
Less thanUS$20Million
US$20 -US$49Million
US$50 -US$99Million
US$100 -US$249Million
US$250 -US$499Million
US$500 -US$999Million
US$1 -US$4.999Billion
More thanUS$5Billion
Registered FundsMaster FundsAdministered FundsLicensed Funds
29%
38%
33%
15% 15%
22%
13% 11%11%
16%18%
12%
7%10%
13%15%
10%8%
3%7% 9%
5%7%
1%5% 3%
1%
16%
11%10%
15%
12%
Figure 25
%ofFu
nds

ECONOMIC FUNCTIONS OF INVESTMENT FUNDSSTATISTICAL TREND ANALYSIS
The Cayman Islands Monetary Authority continued its participation in the annual Non-Bank Financial Intermediation (NBFI) monitoring exerciseconducted by the Financial Stability Board (FSB). The comprehensive monitoring of global trends, innovations, adaptations and risks of NBFIis a key priority for the FSB and an important element of its efforts to enhance the resilience of NBFI. The annual monitoring exercise seeks toassess global trends and risks in NBFI, and to identify financial entity types or activities for which size or rapid growth, in combination withheightened risks, may call for policy responses by the relevant authorities. This monitoring exercise also helps authorities deepen theirunderstanding of NBFI and identify areas for further improvements in data availability and analysis. NBFI (previously referred to as ShadowBanking) is defined as credit intermediation involving entities and activities (fully or partialy) outside the regular banking system. Mitigating thebuild-up of systemic risk, strengthening overall financial stability oversight and ultimately transforming NBFI into “resilient market-basedfinancing” are key financial reform priorities for the G20 countries and the FSB. As detailed in Figure 26, the total assets of Cayman Islandshedge funds25 continued to increase.
Economic Functions 2018(US$
billions)
2017(US$
billions)
2016(US$
billions)
2015(US$
billions)
2014(US$
billions)Money Market Funds - variable NAV26 1 5 2 4 5
Fund of Funds 177 229 231 246 275
Fixed Income Funds 549 536 436 364 306
Mixed and Other Funds 634 692 431 685 695
Hedge funds 3,891 3,825 3,255 2,904 2,917
Total Potential Credit Intermediation 6,010 5,287 4,355 4,203 4,198
Equity Funds27 1,340 1,649 1,787 1,504 1,407
Total Assets 7,350 6,936 6,142 5,707 5,605
1,000,000
2,000,0003,000,000
4,000,000
5,000,000
6,000,0007,000,000
2018 2017 2016 2015 2014
Fund of Funds Fixed income Funds Mixed and Other Funds Equity Funds Hedge Funds Total AssetsMMFs - Variable NAV
AmountsinUSD
millions
26Hedge Funds as defined for the NBFI Monitorig Project are funds with a gross leverage ratio (GNE/NAV) exceeding 125%.
27While CIMA is able to collect statistics from funds on their investments in money market instruments, the MMFs – variable NAV represents CIMA’s preliminary assessment of these types of funds, fromlimited information submitted through the FAR reporting. However to improve the accuracy of the report, further work is needed in obtaining specific information on the type of funds classified as money
market funds, through enhancements to the FAR. Money market funds include commercial paper, T-bills and certificates of deposits but exclude cash and due to/from brokers.
28Equity Funds invest principally in equity securities and therefore are assessed as not engaging in credit intermediation*Due to rounding, subtotals may differ from the total sum.
Figure 26
31Investments Statistical Digest 2018

32Cayman Islands Monetary Authority
Glossary of TermsActivism – investors targeting companies they believe areundervalued based on financial statement statistics or investmentmanagers that are equipped with more suitable financial incentivesand organizational structures for pursuing agendas such as corporategovernance.Arbitrage – a fund which tries to take advantage of pricediscrepancies for the same asset in different markets. Convertiblesare hybrid securities that combine a straight bond with an equityoption.Asset Allocation – the process of dividing investments amongdifferent kinds of assets/liabilities, such as private or publicly tradedequities, bonds, currencies, real estate, derivative securities, andover-the-counter contracts.Blockchain – continuously growing list of records, called blocks,which are linked and secured using cryptography. An open,distributed ledger that can record transactions between two partiesefficiently and in a verifiable and permanent way.Commodity Strategy – a strategy that invests in commoditysecurities, usually through futures contracts. The underlying asset orliability in a commodity derivative security is a future quantity of aphysical substance, such as food, grains, and metals, which twoparties have agreed to trade at a predetermined price.Collateralised Swaps – financial security collateralised by swaps ofdifferent maturities and credit quality and issued in tranchesrepresenting the order in which losses from the portfolio aredistributed.Corporate Governance – the set of processes, customs, policies,laws and institutions affecting the way a corporation is directed,administered or controlled and includes the relationships among themany stakeholders involved and the goals for which the corporationis governed. The objective is to ensure accountability of actions anddecisions made during the course of business.Distressed Debt Strategy – a strategy that invests in the security ofa company undergoing or expected to undergo bankruptcy orrestructuring in an effort to avoid insolvency.Dividends/Distributions – a payment of a portion of a hedge fund’snet asset or equity to the shareholders, declared by the fund’s boardof directors.Dynamic Trading – a strategy that involves rebalancing hedgepositions as market conditions change.Economic Function – as defined by the Financial Stability Board,one of the five areas in which the activities of Shadow Banking can beclassified.Emerging Markets Strategy – a strategy that invests in the financialmarkets of developing countries, usually in small markets with shortoperating histories.Equity Hedged – buys stocks that are undervalued and short-sellsstocks that are overvalued.Equity Market Neutral – hedge fund strategy that seeks to exploitinvestment opportunities unique to some specific group of stocks
while maintaining a neutral exposure to broad groups of stocksdefined for example by sector, industry, market capitalisation, countryor region.Event Driven Strategy – a strategy that seeks to exploit relativemispricing between securities whose issuers are involved inmergers, divestitures, restructurings or other corporate events.Exempted Company – a company carrying on business activitiesprimarily outside of the Cayman Islands.Exempted Limited Partnership – the Exempted Limited PartnershipLaw (2014 Revision) makes it possible to form limited partnerships foroffshore investors. Such a partnership may not undertake businesswith the public in the Cayman Islands, other than as necessary for thecarrying on of business outside of Cayman. A partner may be ageneral or limited partner as well as corporations with or withoutlimited liability.Exempted Segregated Portfolio Company (SPC) – a type ofexempted company, which allows the separation of assets andliabilities between different segregated portfolios, established underone company.Exempted Trust – as defined under the Trusts Law (2011 Revision)a trust where none of the beneficiaries is not and is not likely at anytime to be resident or domiciled in the Islands.FAR – Is the Fund Annual Return which is required to be filed withCIMA pursuant to the Mutual Funds (Annual Returns) Regulations(2018 Revision).FinTech – Financial technology that aims to compete with traditionalfinancial methods in the delivery of financial servicesFixed Income Strategy – a strategy that focuses on purchasingsecurities with specific interest rates, such as a bond, money marketinstrument, or preferred stock.Foreign Exchange – purchase and sale of foreign currencies tomeet investment objectives.Fund of Funds – a hedge fund which invests in the shares of otherhedge funds. These funds are designed to achieve greaterdiversification than traditional hedge funds.Generally Accepted Accounting Principles (GAAP) – a widely-accepted set of rules, principles, conventions, standards, andprocedures for reporting financial information. US GAAP wasestablished by the Financial Accounting Standards Board (FASB) inthe US.Global Macro Strategy – a strategy that invests in securitiesthroughout the world. Additional risks associated with global macrostrategies include currency fluctuations and political and economicinstability.Global Trading – closed-end or exchange traded fund that caninvest in companies located anywhere in the world, including theinvestor’s own country. These funds provide more globalopportunities for diversification and act as a hedge against inflationand currency risks.Gross Notional Exposure – a measure of the economic or market

exposure of the funds’ positions including the value of leveragedassets.Hedge Fund – a private investment vehicle, usually owned by highnet-worth, sophisticated individuals and institutional investors, whichallows for the aggressive use of investment strategies that aretypically unavailable to conventional mutual funds, including shortselling, leverage, program trading, swaps, arbitrage, and otherderivatives. The net assets are managed by an investment manager/advisor or management company, to which investors in the hedgefund pay a performance fee and management fee.Industry Best Practice – a framework or methodology that throughextensive analytical research and testing trials, has deliveredsuccessful outcomes, and is proven to reliably lead to a most-desiredresult each time.Industry Standard – an adopted policy or procedure that fulfils theexpectations held by industry stakeholders regarding an entity’s useof resources, operational polices or procedures or quality of end-product or service offered.International Financial Reporting Standards (IFRS) – standardsand interpretations adopted by the International AccountingStandards Board (IASB).Insurance Linked Securities – financial instruments whose valuesare driven by insurance loss events.Investment Manager – an individual, group of individuals or entitythat performs investment management or advisory services to ahedge fund.Investment Strategy – an investment plan of acquiring andmanaging the assets and liabilities that is designed to effectivelyachieve the investment objectives of the fund, while taking intoaccount certain investment restrictions and risk tolerance levels.Leverage – the use of various financial instruments or borrowedcapital, such as margin, to increase the potential return of aninvestmentLong-only absolute return – funds that aim to deliver positive returnregardless of market conditions by balancing traditional longer-termequity investments with other investment techniques with the aim ofcontinuing to generate a positive return even when the value of amarket falls.Long/Short Strategy – a strategy that focuses on the current andspeculative future prices of a security. Having a long position indicatesownership of a security, and appears as an asset on the balancesheet. A short position is the obligation to sell a certain quantity of asecurity at a particular price in the future, which appears as a liabilityon the balance sheet.Managed Futures – investment in government securities, futurescontracts and options on futures contracts.Market Neutral Strategy – a strategy that aims to produce almost thesame profit regardless of market circumstances.Master Fund – as defined under the Mutual Funds Law (2015Revision) means a company, partnership or unit trust that -
a) is established or incorporated, as the case may be, in the Islands;b) issues equity interests to one or more investors;c) holds investments and conducts trading activities for the principalpurpose of implementing the overall investment strategy of theregulated feeder fund;d) has one or more regulated feeder funds either directly or throughan intermediary entity established to invest in the master fund; ande) is not licensed under the Banks and Trust Companies Law (2016Revision) or the Insurance Law, 2010, or registered under theBuilding Societies Law (2014 Revision) or the Friendly Societies Law(1998 Revision).Master/Feeder Fund – a feeder hedge fund typically raisesshareholder capital and invests the proceeds into the shares of amaster hedge fund. The master hedge fund conducts the purchasingand selling of portfolio investments using the proceeds received fromthe feeder fund investor.Minimum Initial Subscription – the minimum amount an investormust initially subscribe into a hedge fund.Mortgage-backed securities – an asset-backed security whosecash flows are backed by the principal and interest payments of a setof mortgage loans.Multi-Strategy – a combination of investment strategies used withinthe same hedge fund to manage the assets and liabilities andgenerally achieve a high degree of diversification.Mutual Fund Administrator – as defined under the Mutual FundsLaw (2015 Revision) means a person who conducts mutual fundadministration in or from the Islands and includes a company formedunder the Companies Law, a foreign company registered pursuant toPart IX of the Companies Law, a limited partnership registered underthe Partnership Law (2013 Revision) or an Exempted LimitedPartnership registered under the Exempted Limited Partnership Law(2014 Revision) that conducts mutual fund administration outside theIslands.NetAsset Value (NAV) – the monetary market value of a fund, basedon the fair value of the underlying assets minus the fair value of theliabilities. Net asset value per share of the fund is calculated as thetotal net assets divided by the number of shares outstanding.NAV Calculation Agent – an administrative service provider thatperforms the accounting function, including the compilation andreconciliation of portfolio assets and liability positions and thecalculation of the total net asset value of the hedge fund. This alsoincludes verifying, accruing or calculating other operational assetsand liabilities, such as cash, prepaid expenses, subscriptionsreceived in advance or fees payable. The NAV calculation agent mayalso be responsible for independently pricing the investments held inthe portfolio, depending on the service contract.Net Income – the amount remaining after expenses and losses aresubtracted from a hedge fund’s revenue earned over a period.Revenues include realised gains from the purchase/sale ofinvestments, as well as unrealised gains from the change in fair value
Glossary of Terms (CONTINUED)
33Investments Statistical Digest 2018

Scale: US$1 Trillion = US$1,000,000,000,000US$1 Billion = US$1,000,000,000US$1 Million = US$1,000,000
of investments held in the portfolio. Revenues also include interestand dividends earned from investments held in the portfolio.Expenses include fees payable to the investment manager, such asperformance and management fees, legal fees, and administrationfees, accounting fees and audit fees. Losses include those realisedfrom the sale of investments and unrealised losses from the changein fair value of investments held in the portfolio.Net Subscriptions – the total value of subscriptions less the totalvalue to redemptions over a period to result in a net increase or netdecrease of cash flows resulting from shareholder activity.Passive Management/Index – managing of a mutual fund by relyingon automatic adjustments such as tracking index instead of makingpersonal judgments.Plain Vanilla Securities - The most basic or standard version of afinancial instrument.Private Equity – collective investment scheme used for makinginvestments in various equity (and to a lesser extent debt) securitiesof companies that are not publicly traded or on an exchange.Real Estate Mutual Fund – type of investment made up of securitiesusually stocks, of companies that purchase real estate with moneycollected from investors.REEFS – Regulatory Enhanced Electronic Forms Submissions – e-reporting system used by CIMA to receive FAR, offering documents,new applications and registrations and changes to existing licenseinformation such as directors, investment managers and addresses.Relative Value Strategy – a strategy that measures the value of onesecurity relative to another by comparing the securities using certainmeasurements, and determining the degree a security is under orover-valued.Redemption – the total or partial return of an investor’s ownershipstake in the hedge fund in exchange for proceeds calculated at aprice equal to the net asset value per share of the hedge fund.Registrar and Transfer Agent (RTA) – an agent that processes
shareholder subscriptions, redemptions and transfers. A register ofshareholder ownership is also maintained for the fund on an on-goingbasis.Registrar of Companies – a government body that is within theCayman Island’s General Registry. Registration is governed by theCompanies Law (2018 Revision). It is responsible for registration ofcompanies, limited partnerships and exempted trusts.Return on Gross Assets – a measure of a hedge fund’sperformance, calculated as the net income of a period divided by thetotal gross assets, expressed as a percentage.Return on Net Assets – a measure of a hedge fund’s performance,calculated as the net income of a period divided by the total netassets, expressed as a percentage.Shadow Banking – the Financial Stability Board broadly definesshadow banking as credit intermediation involving entities andactivities that are outside of the official banking system.Short position – investment strategy whereby the investmentmanager sells shares of borrowed stock in the open market with theexpectation that the price of the stock will decrease over time at whichpoint the shares are repurchased in the open market and returned tothe ownerStand-Alone – A hedge fund that invests mainly in individualsecurities.Subscription – the act of institutional or individual investorspurchasing equity interests of a hedge fund by subscribing an initialminimum monetary amount or subsequent amount in exchange forownership of shares or units in the entity at a price equal to the netasset value of the hedge fund.Total Assets – the sum of current and long-term assets owned by anentity. Three characteristics of an asset are that its future benefit ofcontributing to income generation is probable, the entity can controlaccess to the asset or benefit, and a transaction rise to the transfer ofownership, or risks and rewards associated with that ownership, hasoccurred.
Glossary of Terms (CONTINUED)
34Cayman Islands Monetary Authority

Personal Notes

36Cayman Islands Monetary Authority
PO Box 10052
SIX, Cricket Square
Grand Cayman KY1 - 1001
CAYMAN ISLANDS
General Office: 345-949-7089
Fax: 345-949-9730
www.cima.ky
© Copyright 2018 Cayman Islands Monetary Authority. All text and charts in this document are the copyrighted works ofthe Cayman Islands Monetary, unless otherwise stated. Any redistribution or reproduction, in whole or in part, without the
permission of the Cayman Islands Monetary Authority, is strictly prohibited.