Embed Size (px)
Citation preview


2018 Investment Conference Agenda
From Focus Comes Growth and Profitability
- Alex Davern, President and CEO
10:00 AM
Growth in Target Customer Segments Based on Our Software-Defined Platform
- Eric Starkloff, EVP Global Sales & Marketing
Q&A
Reorient Sales Organization to Unlock Growth Potential
- Jason Green, Sr. VP Global Sales
Focusing to Deliver Growth and Profitability
- Karen Rapp, CFO
Q&A
Break and Lunch in room12:30 PM
Afternoon Keynote1:00 PM
Expo Tours2:15 PM

Safe Harbor WarningDuring today’s presentations, we will make projections or other forward-looking statements regarding the future financial
performance of the company or future events, including our strategic goals, priorities, vision, market share gains, performance
relative to peers, operating leverage, target operating model, M&A strategy, market growth and trends, growth plans (including in
the semiconductor, transportation and aero/defense markets), marketing strategy, guidance, improved profitability, market
opportunities, and product features and performance. We wish to caution you that such statements are just predictions and that
actual events or results may differ materially. We refer you to the documents the company files regularly with the Securities and
Exchange Commission, specifically the company’s most recent Form 10-K filed on February 22, 2018 and Form 10-Q filed on May
1, 2018. These documents contain and identify important factors that could cause our actual results to differ materially from those
contained in our projections or forward-looking statements.
Non-GAAP Information:
In certain of today’s presentations, we have included certain non-GAAP financial results with respect to some or all of the following
items: revenue, gross margin, research and development and other operating expenses, operating margin, operating income, net
income, and diluted EPS. Our non-GAAP results exclude, as applicable, the impact of stock-based compensation, amortization of
acquisition-related intangibles, acquisition accounting for deferred revenue, acquisition-related adjustments, acquisition-related
transaction costs, restructuring charges, foreign exchange loss on acquisitions, taxes levied on the transfer of acquired intellectual
property, and impairment of minority cost basis investments. In each of our quarterly earnings press releases since March 31,
2006, we have included a reconciliation of our GAAP results to our non-GAAP results for the applicable periods and such press
releases are available on our website at ni.com/nati. For periods prior to March 31, 2006, our non-GAAP results are the same as
our GAAP results. We also include information in this presentation about our year-over year (YOY) GAAP revenue growth
excluding the effect of our current largest customer. We have included a reconciliation of such YOY revenue growth (excluding our
largest customer) to our GAAP YOY revenue growth on our website at ni.com/nati.

ni.com
From Focus Comes Growth and Profitability
Alex Davern
CEO
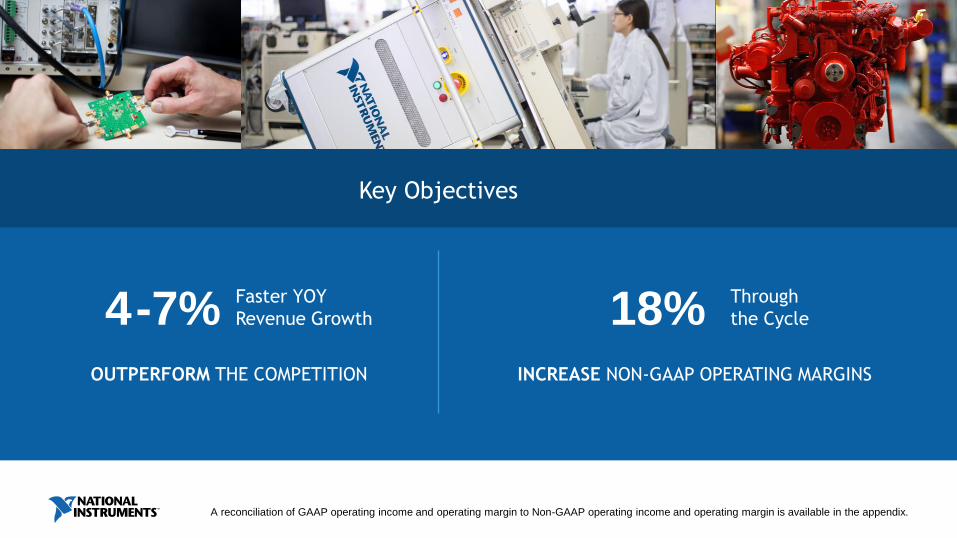
OUTPERFORM THE COMPETITION
4-7% Faster YOY
Revenue Growth
INCREASE NON-GAAP OPERATING MARGINS
18% Through
the Cycle
Key Objectives
A reconciliation of GAAP operating income and operating margin to Non-GAAP operating income and operating margin is available in the appendix.

OPERATING
MARGINS
REVENUE
GROWTH
EMPLOYEE
DEVELOPMENT
CUSTOMER
RELATIONS
2017 Priorities
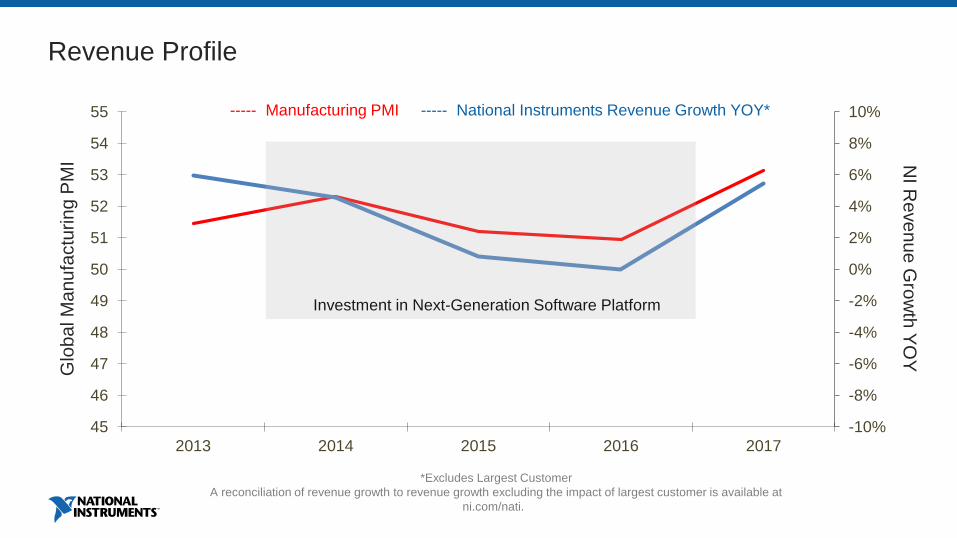
Revenue Profile
-10%
-8%
-6%
-4%
-2%
0%
2%
4%
6%
8%
10%
45
46
47
48
49
50
51
52
53
54
55
2013 2014 2015 2016 2017
Glo
ba
l M
an
ufa
ctu
rin
g P
MI
----- Manufacturing PMI ----- National Instruments Revenue Growth YOY*
NI R
eve
nu
e G
row
th Y
OY
Investment in Next-Generation Software Platform
*Excludes Largest Customer
A reconciliation of revenue growth to revenue growth excluding the impact of largest customer is available at
ni.com/nati.
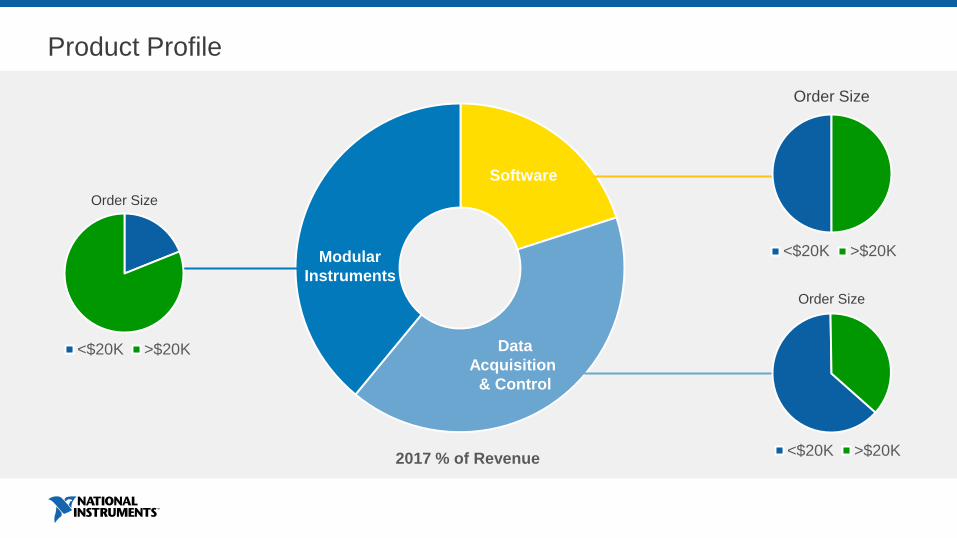
Software
Data
Acquisition
& Control
Modular
Instruments
<$20K >$20K
<$20K >$20K
Product Profile
2017 % of Revenue
Order Size
Order Size
Order Size
<$20K >$20K

REVENUE UP 4% YoY
Double digit growth in Software
Broad Strength
Double digit growth in Data
Acquisition & Control
Single-Digit decline in Modular
Instruments due to:
• End-of-life low ROI products
• Mobile device supply chain
Concentrated Weakness
Q1 Record Revenue
-$5M
-$10M

Non-GAAP EPS improvement of 24% YOY, up 63% over Q1 2016
$ in t
ho
usan
ds
Fully Diluted EPSRevenue
Q1 Record Revenue
A reconciliation of GAAP fully diluted earnings per share to Non-GAAP fully diluted earnings per share is available in the appendix.

XX
RECORD Revenue
RECORD EPS
for a 2nd Quarter at the
mid-point of guidance
Modular Instruments
mid single-digit
POSITIVE order growth
CONFIRMED GUIDANCE
Continued DOUBLE-DIGIT
order growth for
Software
Data Acquisition & Control
CONTINUED YOY ORDER
GROWTH
Q2 Update May 21, 2018
RETURN to YOY ORDER
GROWTH
ni.com
NI Vision and Strategic Plan for Growth

OUTPERFORM THE COMPETITION
4-7% Faster YOY
Revenue Growth
INCREASE NON-GAAP OPERATING MARGINS
18% Through
the Cycle
Key Objectives
A reconciliation of GAAP operating income and operating margin to Non-GAAP operating income and operating margin is available in the appendix.

Revenue Profitability*
$1,050
$1,100
$1,150
$1,200
$1,250
$1,300
$1,350
$1,400
2013 2014 2015 2016 2017 2018*
$0
$20
$40
$60
$80
$100
$120
$140
$160
$180
$200
2013 2014 2015 2016 2017 2018*
Transition Starting Point
*Non-GAAP Net Income
A reconciliation of GAAP net income to Non-GAAP net income is available in the appendix.

Leadership Priorities
4-7%Faster Than
the Competition
18%*Through
The Cycle
*Non-GAAP Operating Margin
Introduce New Core Strategic Vision to Drive Focus
Deliver Our Platform Priorities
Accelerate Growth by Targeting Customer Segments
Reorient our Direct Sales Channel to Optimize Growth
Deliver on Our Profit Opportunity
Outperform the Market
A reconciliation of GAAP operating income and operating margin to Non-GAAP operating income and operating margin is available in the appendix.
ni.com
“The best performing of your businesses is likely to be the one furthest under its potential.”
—Profit From The Core, Chris Zook

0
300
600
900
Mill
ions
Industry
Revenue Delta 2017-2012 Revenue 2012
0
300
600
900
Mill
ions
Product Line
0
300
600
900
<$20K >$20K
Mill
ions
Software
Data Acquisition & Control
Modular
Instruments
All Other
Industries
Semiconductor
Transportation
Aerospace/Defense
Products Customer Segments Order Size
Revenue 2012 Revenue Growth 2012-2017
5 Year View Growth Engines$
Mill
ions
$ M
illio
ns
$ M
illio
ns
Excludes Largest Customer

0
300
600
900
Mill
ions
Industry
Revenue Delta 2017-2012 Revenue 2012
0
300
600
900
Mill
ions
Product Line
0
300
600
900
<$20K >$20K
Mill
ions
Excludes Largest Customer
A reconciliation of revenue to revenue excluding customer is available in the appendix.
Software
Data Acquisition & Control
Modular
Instruments
All Other
Industries
Semiconductor
Transportation
Aerospace/Defense
Products Customer Segments Order Size
Revenue 2012 Revenue Growth 2012-2017
5 Year View Growth Engines$
Mill
ions
$ M
illio
ns
$ M
illio
ns

NI equips engineers and scientists with systems
that accelerate productivity, innovation, and discovery.
M I S S I O N S TAT E M E N T

NI MODULAR
HARDWARE
NI PRODUCTIVE
DEVELOPMENT
SOFTWARE
NI SYSTEMS AND
DATA MANAGEMENT
NI SERVICES AND SUPPORT
NI PLATFORMN
I E
CO
SY
ST
EM
NI E
CO
SY
ST
EM
THIRD PARTY
SOFTWARE
THIRD PARTY
HARDWARE
ni.com
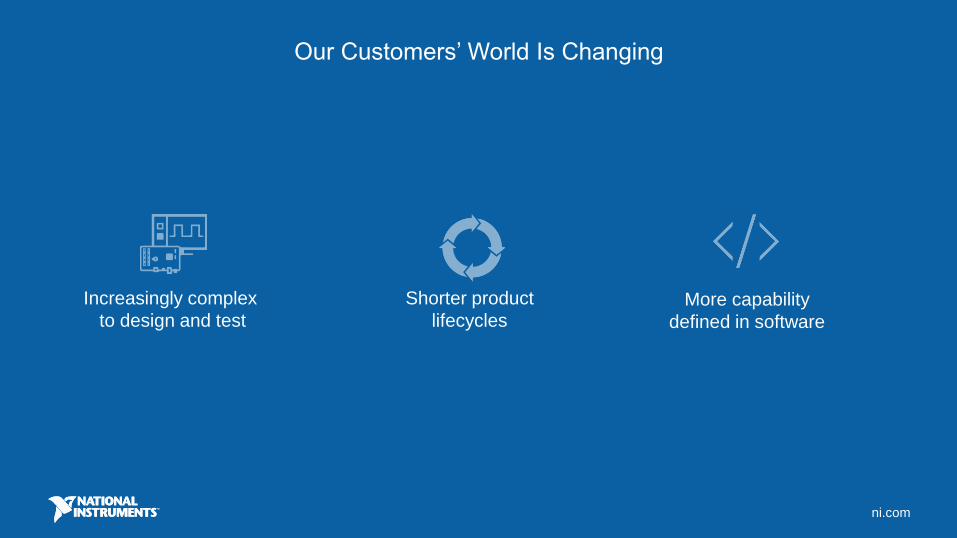
Our Customers’ World Is Changing
More capability
defined in software
Increasingly complex
to design and test
Shorter product
lifecycles
ni.com
From focus comes growth
ni.com
To Be the Leader in Software-Defined Automated Test
and Automated Measurement Systems
NI’s Core Strategic Vision

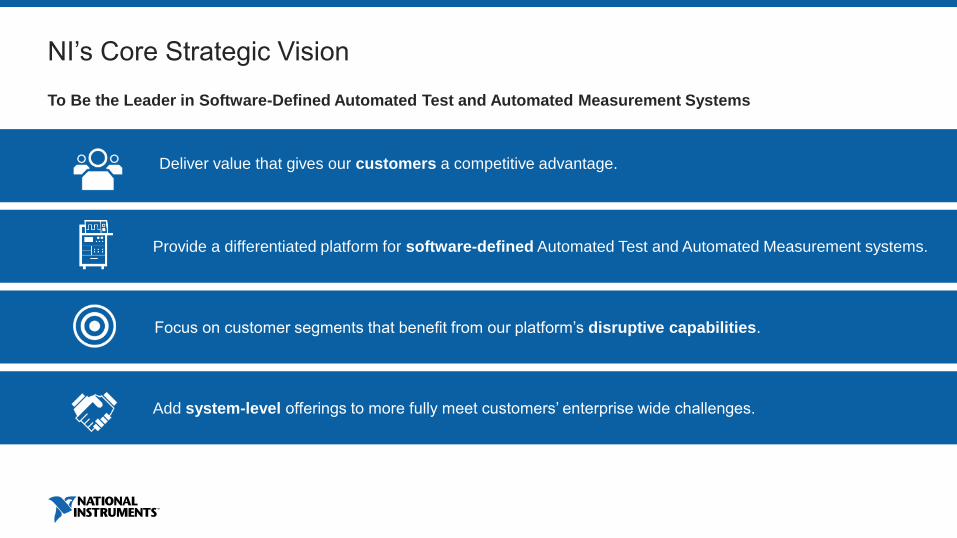
To Be the Leader in Software-Defined Automated Test and Automated Measurement Systems
NI's Core Strategic Vision
Deliver value that gives our customers a competitive advantage.
Provide a differentiated platform for software-defined Automated Test and Automated Measurement systems.
Add system-level offerings to more fully meet customers’ enterprise wide challenges.
Focus on customer segments that benefit from our platform’s disruptive capabilities.

Outperform the Competition, growth 4-7% Faster
Leadership Priorities
Introduce New Core Strategic Vision to Drive Focus
Deliver Our Platform Priorities
*Non-GAAP Operating Margins
Accelerate Growth by Targeting Customer Segments
Reorient our Direct Sales Channel to Optimize Growth
Deliver on Our 18% Non-GAAP
Profit Opportunity
Complete our NI Software Platform Investment
Expand Data Acquisition Portfolio
Accelerate Growth of Modular Instruments
4-7%Faster Than
the Competition18%*
Through
The Cycle
A reconciliation of GAAP operating income and operating margin to Non-GAAP operating income and operating margin is available in the appendix.
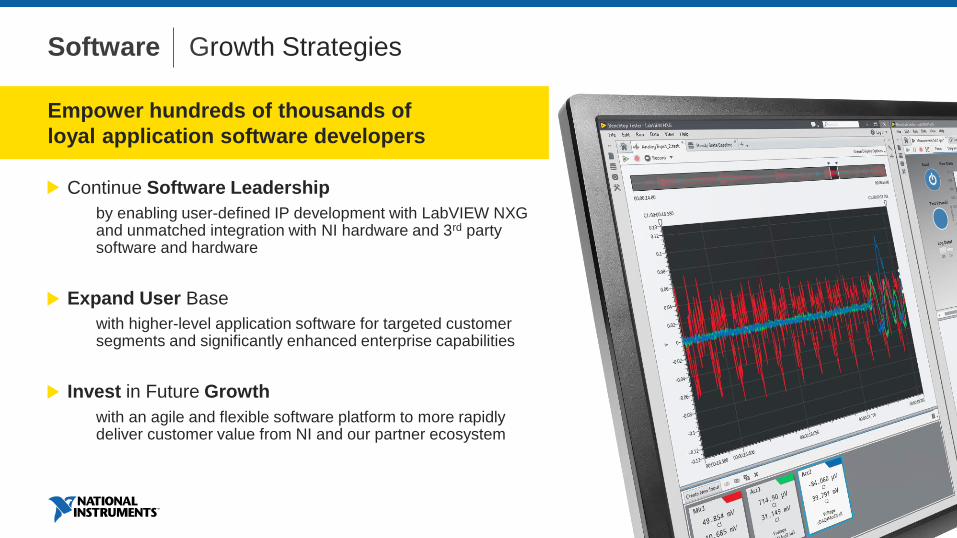
Continue Software Leadership
by enabling user-defined IP development with LabVIEW NXG and unmatched integration with NI hardware and 3rd party software and hardware
Expand User Base
with higher-level application software for targeted customer segments and significantly enhanced enterprise capabilities
Invest in Future Growth
with an agile and flexible software platform to more rapidly deliver customer value from NI and our partner ecosystem
Software Growth Strategies
Empower hundreds of thousands of
loyal application software developers

Data Acquisition and Control Growth Strategies
Provide differentiated value where automated
systems interact with the physical world
Continue Software Leadership
by delivering new value through LabVIEW NXG and application-specific software
Expand User Base
through new distributed and rugged products
Invest in Future Growth
with new platform capabilities for targeted
customer segments

Modular Instruments Growth Strategies
Grow market share in automated validation
and automated production test
Continue Software Leadership
by delivering new value through LabVIEW NXG, significantly enhanced enterprise capabilities, and the ability to build IP into NI instruments through LabVIEW FPGA
Expand User Base
by being first-to-market for next-generation standards and technologies, such as 5G NR, automotive radar and more
Invest in Future Growth
with new platform capabilities for targeted customer segments
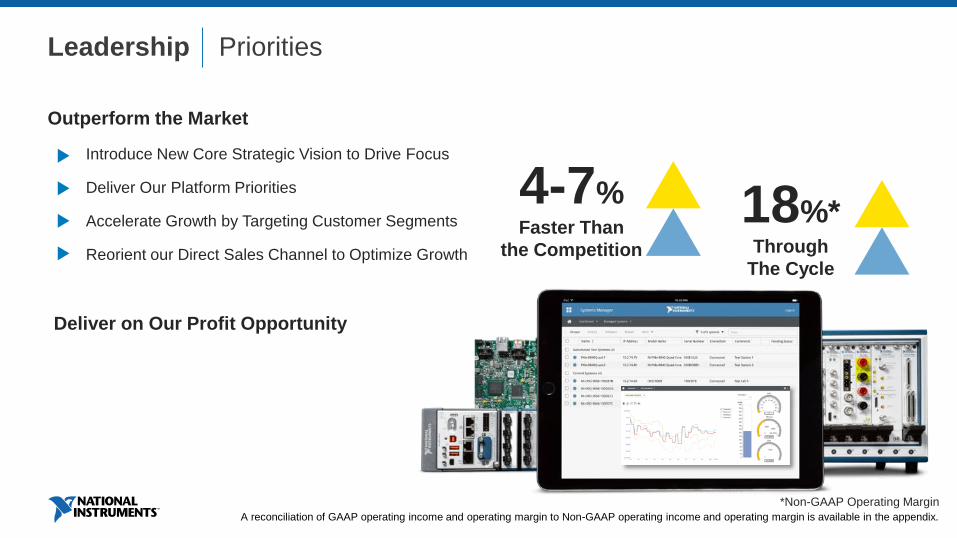
Leadership Priorities
4-7%Faster Than
the Competition
18%*Through
The Cycle
*Non-GAAP Operating Margin
Introduce New Core Strategic Vision to Drive Focus
Deliver Our Platform Priorities
Accelerate Growth by Targeting Customer Segments
Reorient our Direct Sales Channel to Optimize Growth
Deliver on Our Profit Opportunity
Outperform the Market
A reconciliation of GAAP operating income and operating margin to Non-GAAP operating income and operating margin is available in the appendix.

ni.com
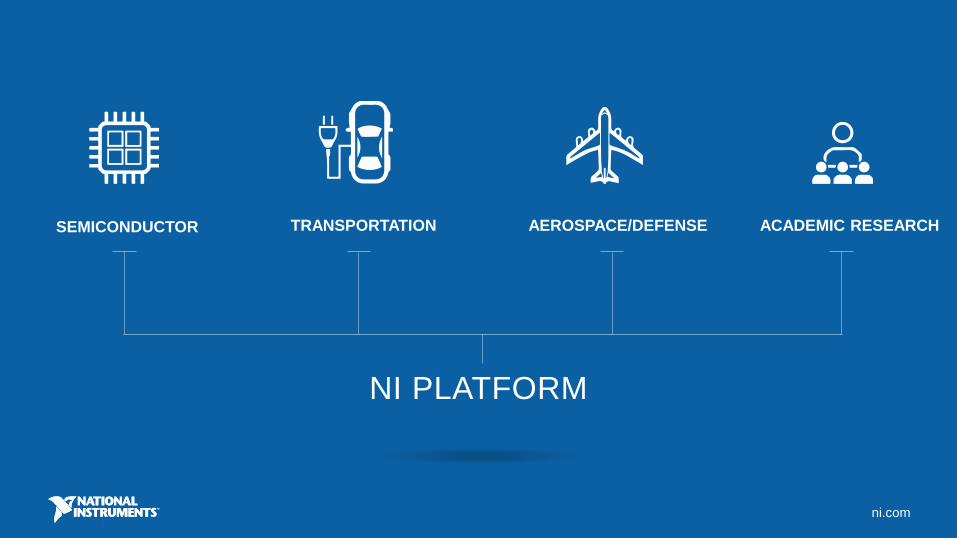
NI PLATFORM
SEMICONDUCTOR TRANSPORTATION AEROSPACE/DEFENSE ACADEMIC RESEARCH

TIER 1 ACCOUNTS | Account-Based Model
TIER 2 ACCOUNTS | Account-Based Model
TIER 3 ACCOUNTS | Geography-Based Model
Sales A New Approach
Percentages of 2017 Annual Revenue
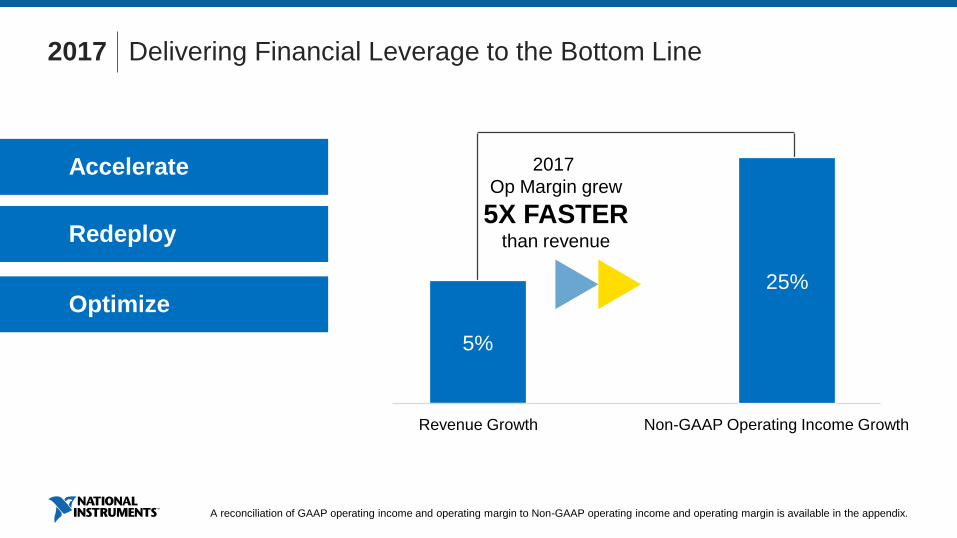
2017 Delivering Financial Leverage to the Bottom Line
5%
25%
Revenue Growth Non-GAAP Operating Income Growth
2017
Op Margin grew
5X FASTERthan revenue
Accelerate
Redeploy
Optimize
A reconciliation of GAAP operating income and operating margin to Non-GAAP operating income and operating margin is available in the appendix.
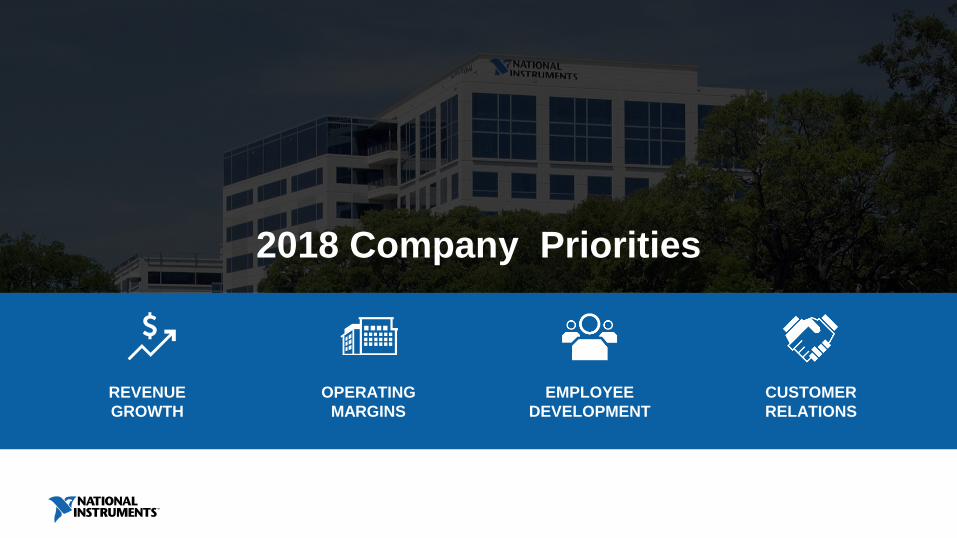
OPERATING
MARGINS
REVENUE
GROWTH
EMPLOYEE
DEVELOPMENT
CUSTOMER
RELATIONS
2018 Company Priorities

Record Revenue
$1,000
$1,050
$1,100
$1,150
$1,200
$1,250
$1,300
$1,350
$1,400
2012 2013 2014 2015 2016 2017 2018*
* Mid-Point of Analyst’s Consensus as of May 21, 2018

OUTPERFORM THE COMPETITION
4-7% Faster YOY
Revenue Growth
INCREASE NON-GAAP OPERATING MARGINS
18% Through
the Cycle
Key Objectives
A reconciliation of GAAP operating income and operating margin to Non-GAAP operating income and operating margin is available in the appendix.
ni.com
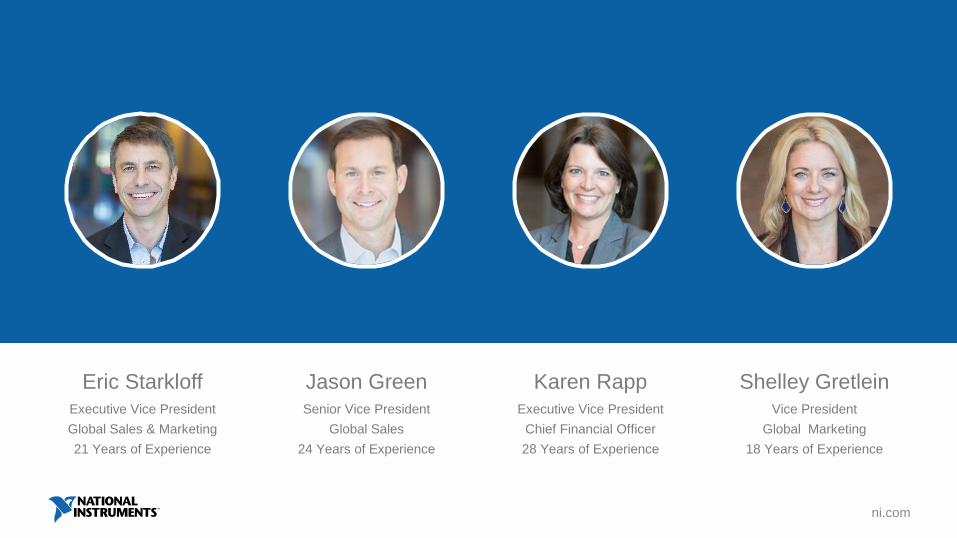
Eric StarkloffExecutive Vice President
Global Sales & Marketing
21 Years of Experience
Shelley GretleinKaren RappExecutive Vice President
Chief Financial Officer
28 Years of Experience
Vice President
Global Marketing
18 Years of Experience
Jason GreenSenior Vice President
Global Sales
24 Years of Experience

ni.com
Growth in Target Customer Segments based on our Software-Defined Platform
Eric Starkloff
Executive Vice President, Global Sales and Marketing

Our Customers’ World Is Changing
More capability
defined in software
Increasingly complex
to design and test
Shorter product
lifecycles

Our Customers’ World Is Changing
More capability
defined in software
Increasingly complex
to design and test
Shorter product
lifecycles
Multiband Power Amplifier Advanced Driver Assist System (ADAS)
A
D
C
D
A
C
PM
IC
A
D
CD
A
C
> 20X the bands and channels
> 500 hours to test
> 2.7X ADAS sensor revenue by 2022
> Software content in cars increasing by 15% CAGR
To Be the Leader in Software-Defined Automated Test and Automated Measurement Systems
NI’s Core Strategic Vision
Deliver value that gives our customers a competitive advantage.
Provide a differentiated platform for software-defined Automated Test and Automated Measurement systems.
Add system-level offerings to more fully meet customers’ enterprise wide challenges.
Focus on customer segments that benefit from our platform’s disruptive capabilities.

NI MODULAR
HARDWARE
NI PRODUCTIVE
DEVELOPMENT
SOFTWARE
NI SYSTEMS AND
DATA MANAGEMENT
NI SERVICES AND SUPPORT
NI PLATFORMN
I E
CO
SY
ST
EM
NI E
CO
SY
ST
EM
THIRD PARTY
SOFTWARE
THIRD PARTY
HARDWARE

Our Customers’ Challenges Are More Software-Centric
Millions
A Boeing 787 runs on 7 million lines of code
Microsoft Windows contains 50 million lines of code
150 million lines of code in the Ford F-150
100 120 140 160 180 20020 40 60 800
The amount of software in vehicles is increasing with a CAGR of 10-15%
Lin
es o
f C
od
e
Source: InformationisBeautiful.net

NI’s Software Position Drives Loyalty and Long Term Revenue
NI accounts that use
LabVIEW purchase
10Xmore than NI
hardware-only
accounts

Intentional Investments to Strengthen our Software Advantage
2014 2015 2016 2017 2018
Overall Application
Software Investment
% Next-Generation
Software Platform Investment
Opportunity
To Re-Invest

Shared Software Platform
MODERN EDITOR
DATA CAPTURE AND
STORAGE
ENGINEERING UI
ELEMENTS
HELP AND LEARNING
COMPILER
SERVICES
INSTALLATION
AND DISTRIBUTION
HARDWARE
CONFIGURATION
SYSTEMS
MANAGEMENT
UX DESIGN
PATTERNS
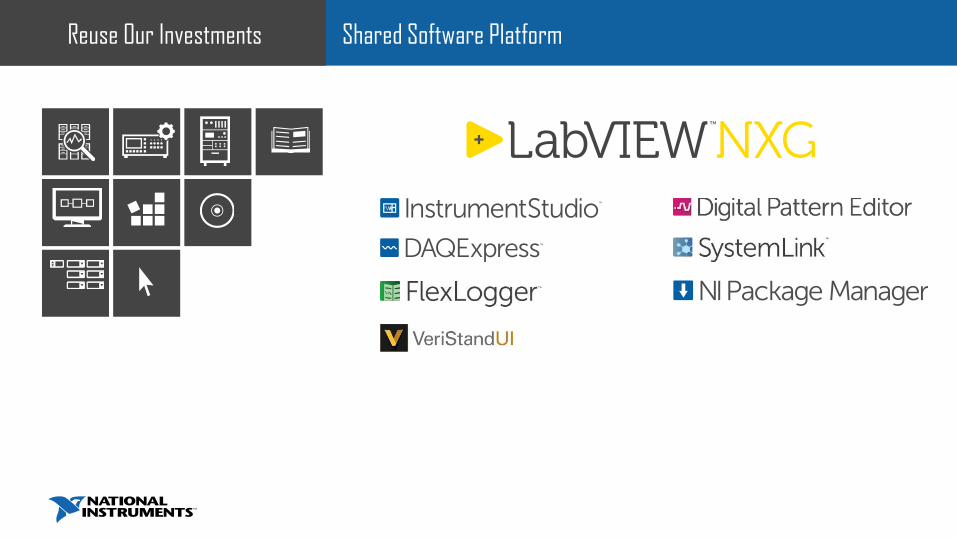
Shared Software PlatformReuse Our Investments

…
Programming Environment
Device Drivers
Application Software
Measurement IP
Systems and
Data Management
…
…
More than LabVIEW A Comprehensive Software Stack

-6%
-4%
-2%
0%
2%
4%
6%
8%
10%
Q2-14 Q3-14 Q4-14 Q1-15 Q2-15 Q3-15 Q4-15 Q1-16 Q2-16 Q3-16 Q4-16 Q1-17 Q2-17 Q3-2017 Q4-2017 Q1-2018
TTM Growth
Strengthening Software Sales After Re-Building
Next-Generation Software Platform Investment
Trailing Twelve Months of Software Revenue Growth
Q3-17 Q4-17 Q1-18
Tw
elv
e m
onth
avera
ge Y
oY
% g
row
th
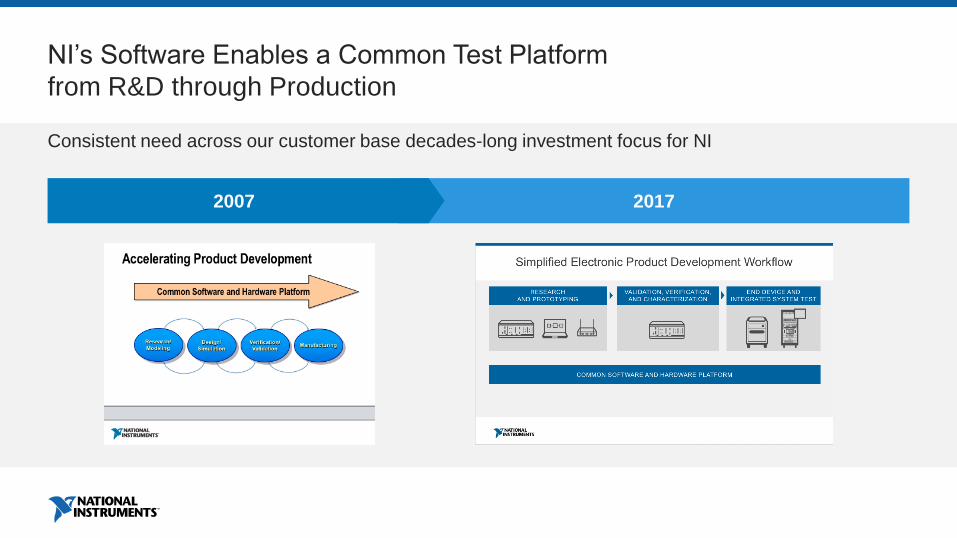
NI’s Software Enables a Common Test Platform
from R&D through Production
Consistent need across our customer base decades-long investment focus for NI
2007 2017
ni.com
NI PLATFORM
SEMICONDUCTOR TRANSPORTATION AEROSPACE/DEFENSE ACADEMIC RESEARCH
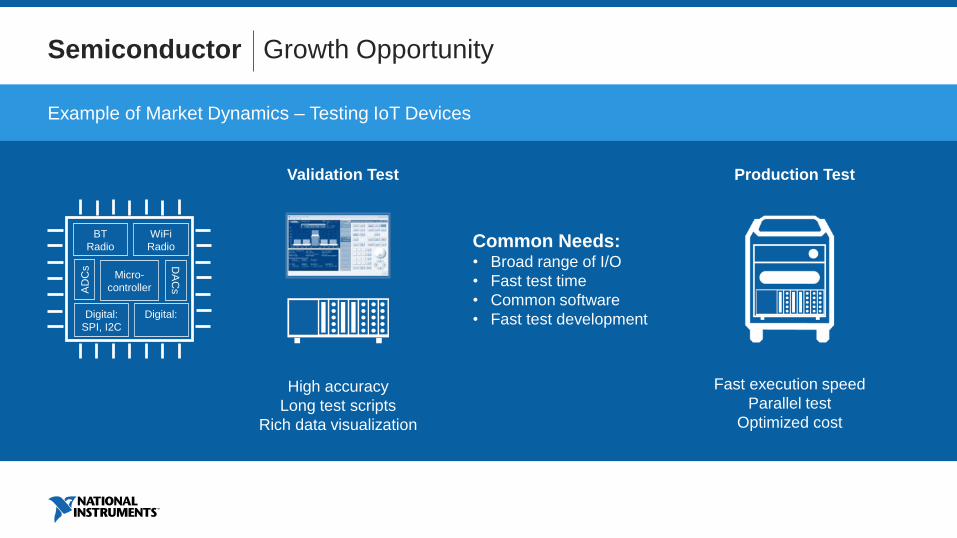
Example of Market Dynamics – Testing IoT Devices
Production TestValidation Test
WiFi
Radio
BT
Radio
Digital:Digital:
SPI, I2C
Micro-
controllerAD
Cs D
AC
s
Fast execution speed
Parallel test
Optimized cost
High accuracy
Long test scripts
Rich data visualization
Common Needs:• Broad range of I/O
• Fast test time
• Common software
• Fast test development
Semiconductor Growth Opportunity

5G Creating New Challenges for our Customers
Downstream applications influenced by 5G adoption
5G Semiconductor test
market opportunity
IoT
Automotive
Consumer
Electronics
5G prototyping market
opportunity
5G is a technology inflection, not a market
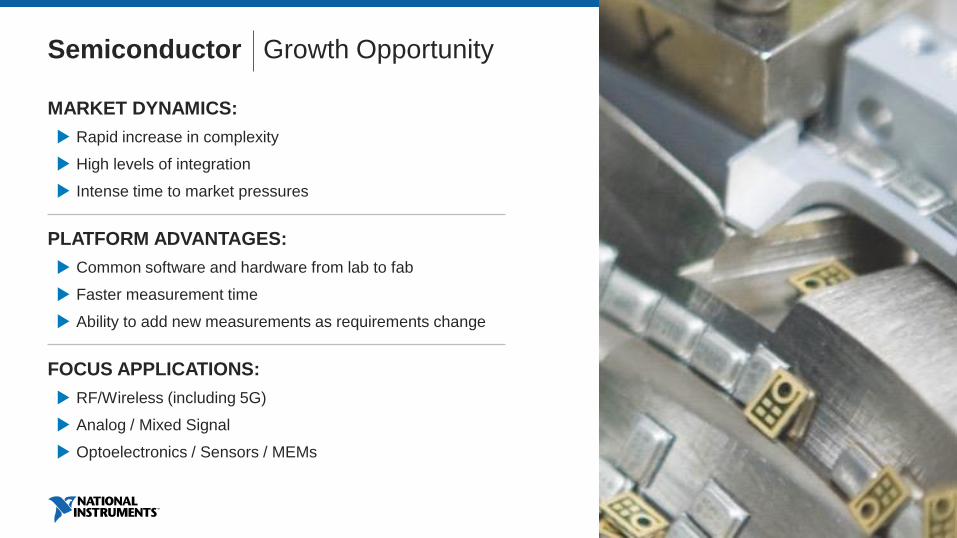
PLATFORM ADVANTAGES:
Common software and hardware from lab to fab
Faster measurement time
Ability to add new measurements as requirements change
FOCUS APPLICATIONS:
RF/Wireless (including 5G)
Analog / Mixed Signal
Optoelectronics / Sensors / MEMs
MARKET DYNAMICS:
Rapid increase in complexity
High levels of integration
Intense time to market pressures
Semiconductor Growth Opportunity
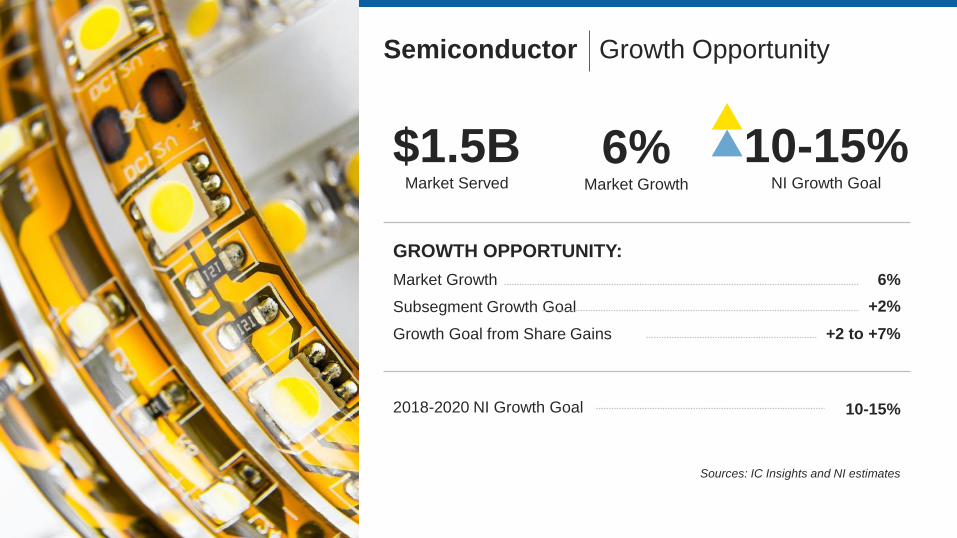
Semiconductor Growth Opportunity
GROWTH OPPORTUNITY:
Market Growth
Subsegment Growth Goal
Growth Goal from Share Gains
2018-2020 NI Growth Goal
6%
+2%
+2 to +7%
10-15%
$1.5BMarket Served
6%Market Growth
10-15%NI Growth Goal
Sources: IC Insights and NI estimates

Semiconductor Growth Opportunity
NI Currently has a Leadership Position
in Standardized Lab Test
500+ NI PXI systems sold to semiconductor
characterization each year
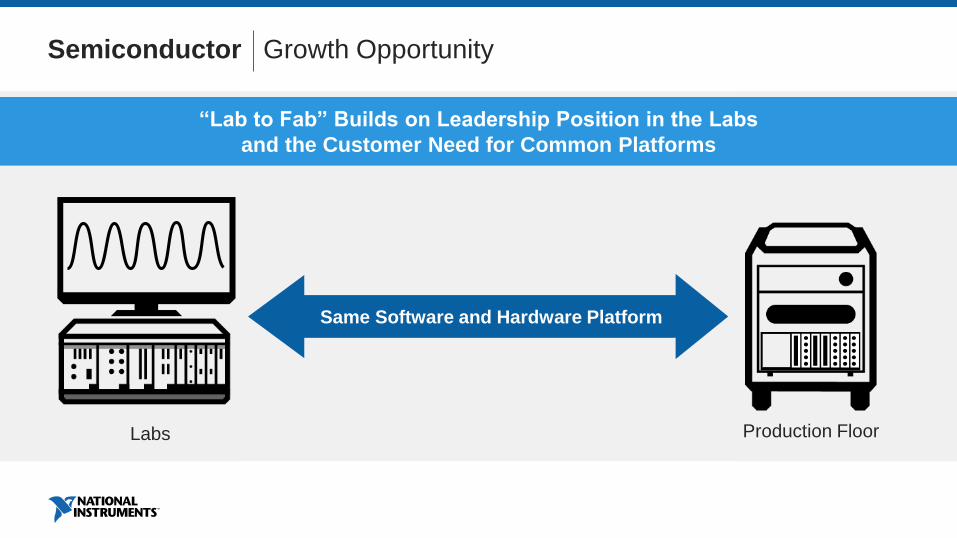
Semiconductor Growth Opportunity
“Lab to Fab” Builds on Leadership Position in the Labs
and the Customer Need for Common Platforms
Labs Production Floor
Same Software and Hardware Platform
NI Service & Support
Technical Support Training Repair and Calibration
Installation & Bring-Up Onsite Maintenance
Ecosystem
Load Board Development Test Programs
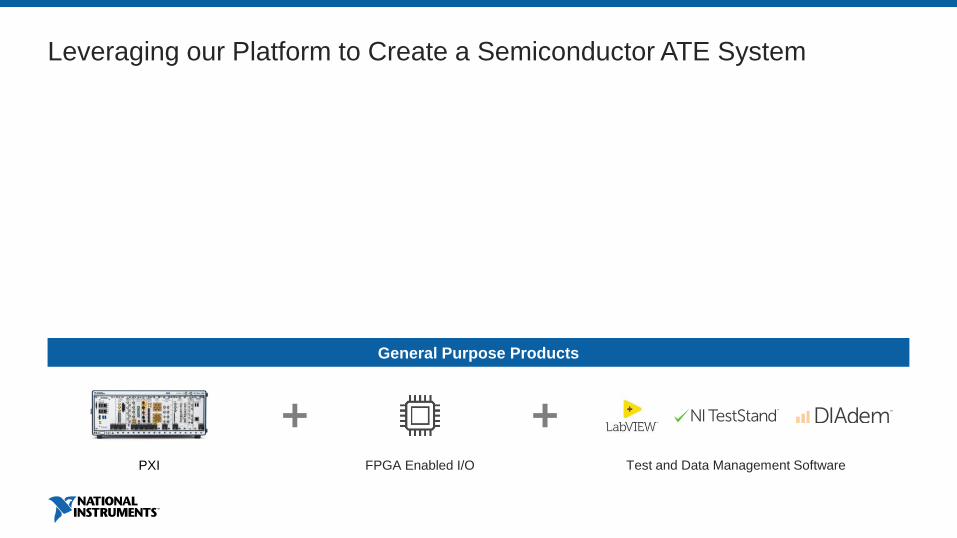
Semiconductor ATE System Targeted Products
Semiconductor Test System SoftwareSystem Enclosure Standard Docking and Interfacing
General Purpose Products
PXI FPGA Enabled I/O Test and Data Management Software
Leveraging our Platform to Create a Semiconductor ATE System

ni.com
Full ROI in 21 months
for the NI STS
Improved test
throughput 2X
Up to 70% time savings
from standardizing on
NI software

PLATFORM ADVANTAGES:
Real-time software
Ability to connect to many I/O types and sensors
Flexibility – can update system quickly
FOCUS APPLICATIONS:
ADAS
Electrification
MARKET DYNAMICS:
Electronic content increasing 30%+
Increasing sensors (from 4.6B to 22B units)
Electrification CAGR >20%
Transportation Growth Opportunity
Sources: Yole, Wood Mackenzie, Strategy Analytics and NI Estimates
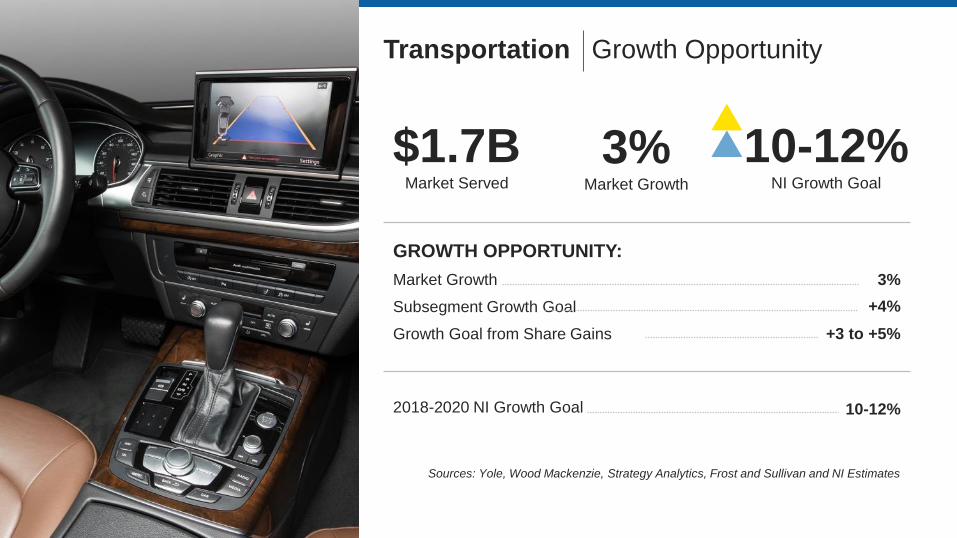
Transportation Growth Opportunity
GROWTH OPPORTUNITY:
Market Growth
Subsegment Growth Goal
Growth Goal from Share Gains
2018-2020 NI Growth Goal
3%
+4%
+3 to +5%
10-12%
$1.7BMarket Served
3%Market Growth
10-12%NI Growth Goal
Sources: Yole, Wood Mackenzie, Strategy Analytics, Frost and Sullivan and NI Estimates

NI Service & Support
Technical Support Training
Repair and Calibration Startup Assistance
Ecosystem
System Integration Fault Insertion Load Board Development
Custom Signal Conditioning Software Integration
Hardware-in-the-loop Targeted Products
SLSC
General Purpose Products
PXI FPGA Enabled I/O
Software Test Rack Infrastructure Automotive Network Interfaces
Leveraging our Platform to Create an Automotive HIL System
Test and Data Management Software

ni.com
Creating a Global Standard
Hardware in the Loop System
“This system dramatically reduced workload and was a huge advantage
for Mazda. Testing time and required man hours were reduced by
90% compared to our old methods, resulting in hundreds of millions of
yen saved per year”
Tomohiko Adachi, Mazda
General Purpose Products

PLATFORM ADVANTAGES:
Complete software stack for automated test
Real-time software, FPGAs, software defined radio
FOCUS APPLICATIONS:
Radar and Spectrum Record/Playback
Software-Defined Radios & Transponders
Production and Maintenance ATE
MARKET DYNAMICS:
Demonstrated need for modular and software-based platform
Long service life requirements
Increasing in global defense R&D budgets
Aerospace / Defense Growth Opportunity
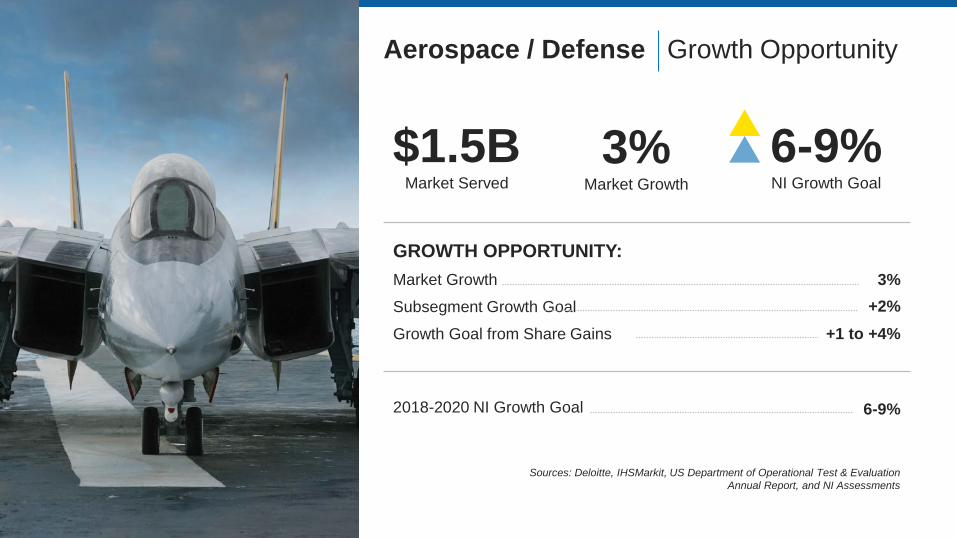
Aerospace / Defense Growth Opportunity
GROWTH OPPORTUNITY:
Market Growth
Subsegment Growth Goal
Growth Goal from Share Gains
2018-2020 NI Growth Goal
3%
+2%
+1 to +4%
6-9%
$1.5BMarket Served
3%Market Growth
6-9%NI Growth Goal
Sources: Deloitte, IHSMarkit, US Department of Operational Test & Evaluation
Annual Report, and NI Assessments

NI Service & Support
Technical Support and Training Repair and Calibration
Life-Cycle Planning Obsolescence Management
Ecosystem
Cabling & Mass Interconnects Test Adapters & Fixture Design
Test Program Set (TPS) Development
Aerospace ATE Targeted Products
Test System
Fleet Management
General Purpose Products
Hardware and
Measurement Abstraction Test Rack Infrastructure Avionics Buses
High-Power
Instruments
PXI FPGA Enabled I/O
Leveraging our Platform to Create an Aerospace ATE System
Test and Data Management Software
ni.com
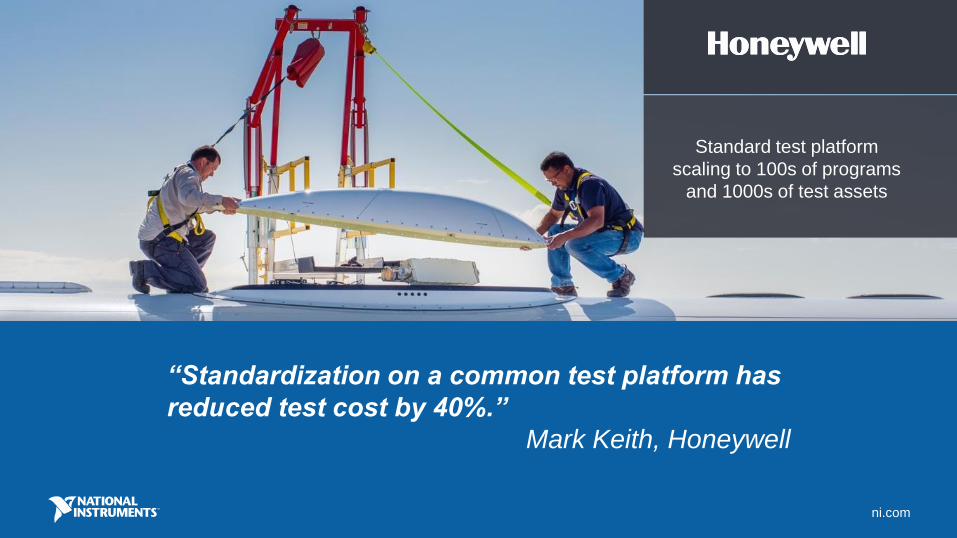
“Standardization on a common test platform has
reduced test cost by 40%.”
Mark Keith, Honeywell
Standard test platform
scaling to 100s of programs
and 1000s of test assets

ni.com
NI PLATFORM
SEMICONDUCTOR TRANSPORTATION AEROSPACE/DEFENSE ACADEMIC RESEARCH

ni.com
Q&A


ni.com
Reorient Sales Organization to Unlock Growth Potential
Jason Green
Sr. Vice President, Global Sales

Focus on Customer Engagement

To Be the Leader in Software-Defined Automated Test and Automated Measurement Systems
NI's Core Strategic Vision
Deliver value that gives our customers a competitive advantage.
Provide a differentiated platform for software-defined Automated Test and Automated Measurement systems.
Add system-level offerings to more fully meet customers’ enterprise wide challenges.
Focus on customer segments that benefit from our platform’s disruptive capabilities.
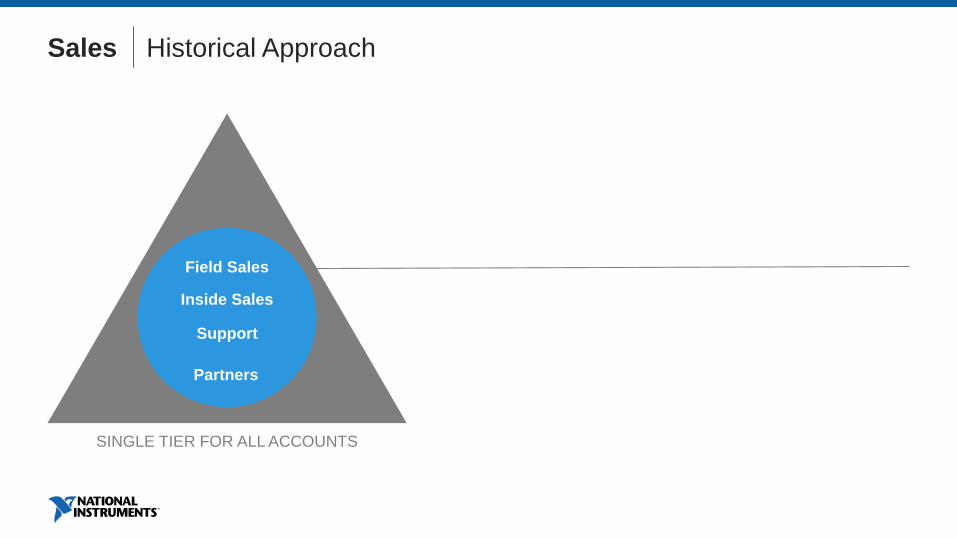
Sales Historical Approach
SINGLE TIER FOR ALL ACCOUNTS
Field Sales
Partners
Inside Sales
Support
$1.3 Billion ORGANIZATION
35,000 CUSTOMERS
Sales Historical Approach

Sales A New Approach

Sales A New Approach

TIER 1 ACCOUNTS | ~100 Accounts
TIER 2 ACCOUNTS | ~5,000 Accounts
TIER 3 ACCOUNTS | ~30,000 Accounts
Sales A New Approach
Account-Based Model
Generate Demand in Target Customer Segments
Geography-Based Model
Serve Customer Requests and Prioritize Digital
Account-Based Model
Build Partnerships with High-Potential Accounts27%
57%
16%
Percentages of 2017 Annual Revenue
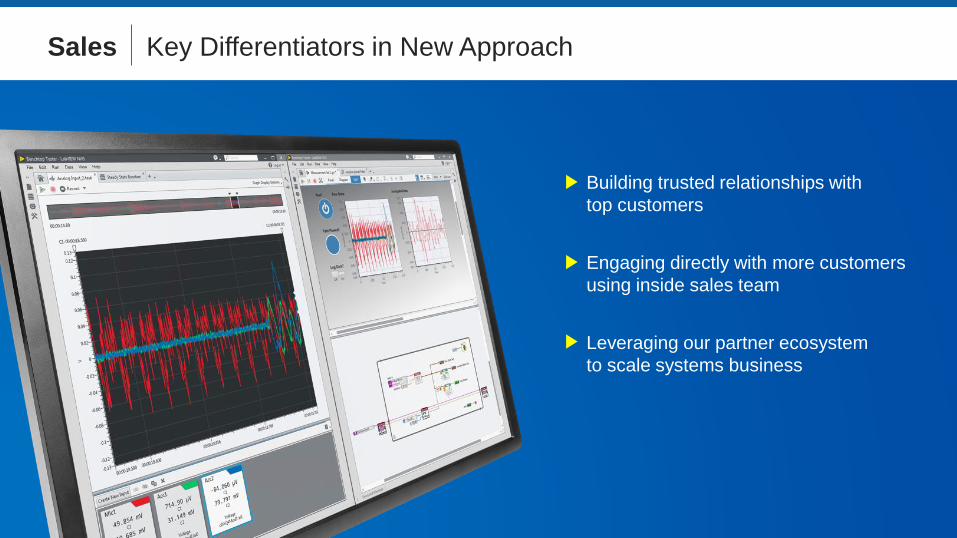
Sales Key Differentiators in New Approach
Building trusted relationships with
top customers
Engaging directly with more customers
using inside sales team
Leveraging our partner ecosystem
to scale systems business
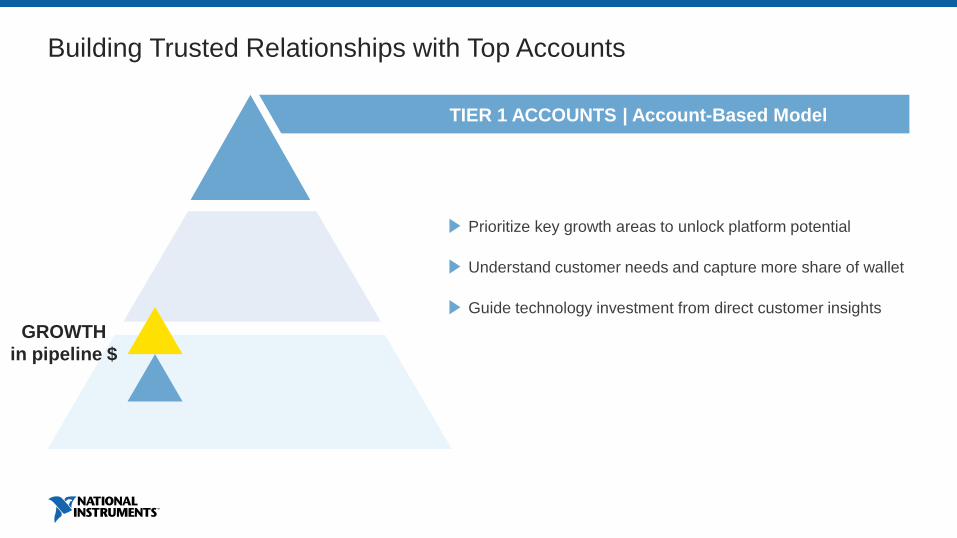
Building Trusted Relationships with Top Accounts
Prioritize key growth areas to unlock platform potential
Understand customer needs and capture more share of wallet
Guide technology investment from direct customer insights
About 100 accounts, 27% of revenue
Build Partnerships with High-Potential Accounts
TIER 1 ACCOUNTS | Account-Based Model
GROWTH
in pipeline $
ni.com
“We will change our schedule to align to your recommendation.”
–Manager for Production Test
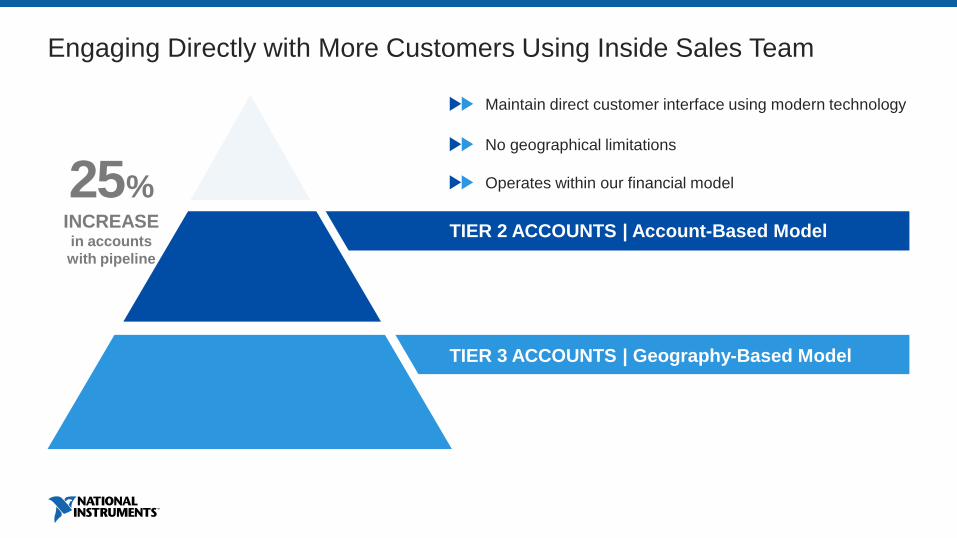
Engaging Directly with More Customers Using Inside Sales Team
Maintain direct customer interface using modern technology
No geographical limitations
Operates within our financial model
TIER 2 ACCOUNTS | Account-Based Model
TIER 3 ACCOUNTS | Geography-Based Model
About 5,000 accounts, 57% of revenue
About 30,000 accounts, 16% of revenue
Generate Demand in Target Customer Segments
Serve Customer Requests and Prioritize Digital
25%INCREASEin accounts
with pipeline
ni.com
Opening new opportunity pipeline with customers who
previously didn’t consider NI
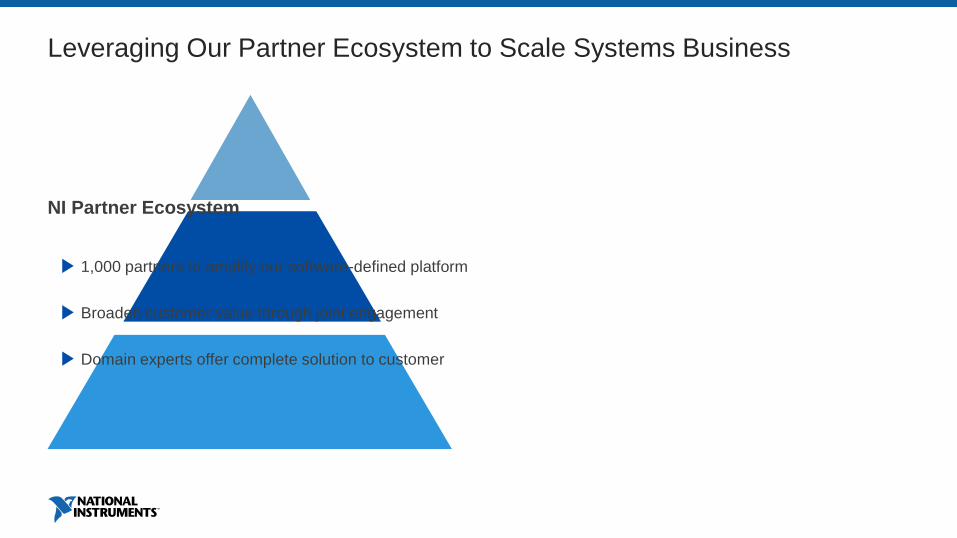
Leveraging Our Partner Ecosystem to Scale Systems Business
NI Partner Ecosystem
1,000 partners to amplify our software-defined platform
Broaden customer value through joint engagement
Domain experts offer complete solution to customer

ni.com
Increasing customer’s confidence, realized business
value and success through partner relationships
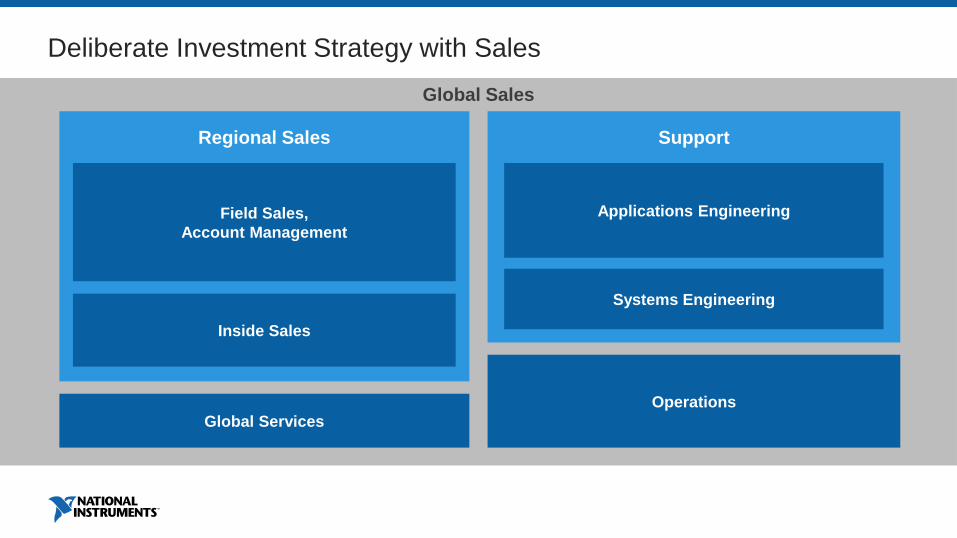
Deliberate Investment Strategy with Sales
Global Sales
Regional Sales
Field Sales,
Account Management
Inside Sales
Global Services
Support
Applications Engineering
Systems Engineering
Operations
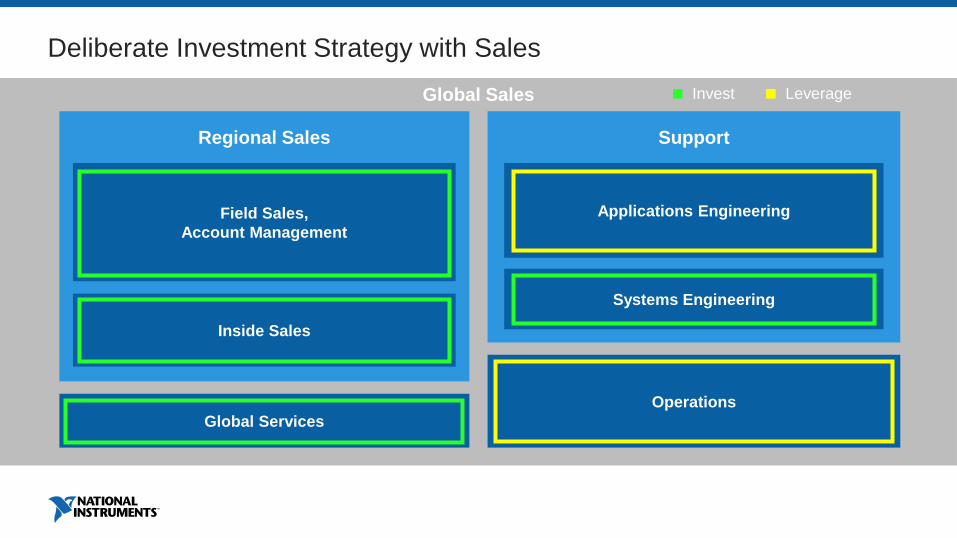
Deliberate Investment Strategy with Sales
Global Sales
Regional Sales
Field Sales,
Account Management
Inside Sales
Global Services
Support
Applications Engineering
Systems Engineering
Operations
Invest Leverage

Focus on Customer Engagement

ni.comNI CONFIDENTIAL
Focusing to Deliver Growth and Profitability
Karen Rapp
CFO
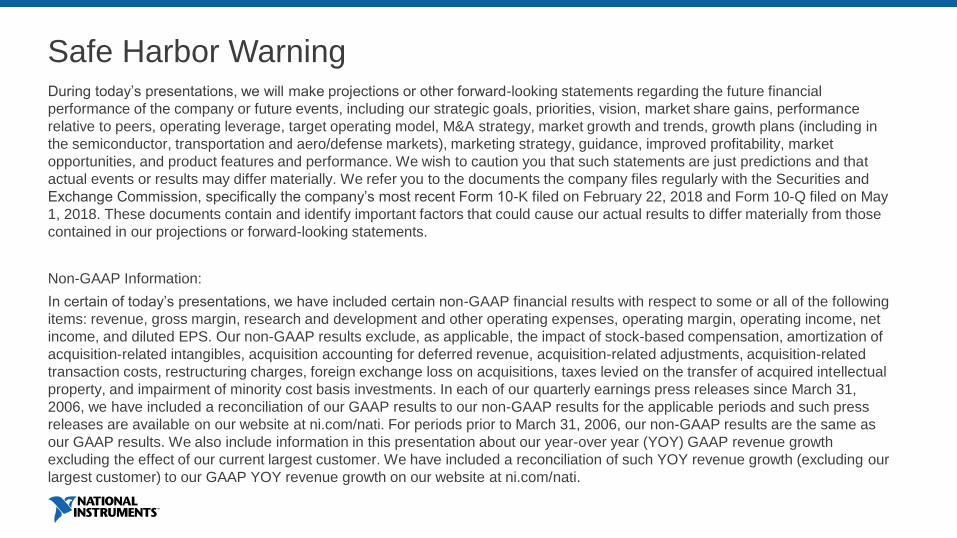
Safe Harbor WarningDuring today’s presentations, we will make projections or other forward-looking statements regarding the future financial
performance of the company or future events, including our strategic goals, priorities, vision, market share gains, performance
relative to peers, operating leverage, target operating model, M&A strategy, market growth and trends, growth plans (including in
the semiconductor, transportation and aero/defense markets), marketing strategy, guidance, improved profitability, market
opportunities, and product features and performance. We wish to caution you that such statements are just predictions and that
actual events or results may differ materially. We refer you to the documents the company files regularly with the Securities and
Exchange Commission, specifically the company’s most recent Form 10-K filed on February 22, 2018 and Form 10-Q filed on May
1, 2018. These documents contain and identify important factors that could cause our actual results to differ materially from those
contained in our projections or forward-looking statements.
Non-GAAP Information:
In certain of today’s presentations, we have included certain non-GAAP financial results with respect to some or all of the following
items: revenue, gross margin, research and development and other operating expenses, operating margin, operating income, net
income, and diluted EPS. Our non-GAAP results exclude, as applicable, the impact of stock-based compensation, amortization of
acquisition-related intangibles, acquisition accounting for deferred revenue, acquisition-related adjustments, acquisition-related
transaction costs, restructuring charges, foreign exchange loss on acquisitions, taxes levied on the transfer of acquired intellectual
property, and impairment of minority cost basis investments. In each of our quarterly earnings press releases since March 31,
2006, we have included a reconciliation of our GAAP results to our non-GAAP results for the applicable periods and such press
releases are available on our website at ni.com/nati. For periods prior to March 31, 2006, our non-GAAP results are the same as
our GAAP results. We also include information in this presentation about our year-over year (YOY) GAAP revenue growth
excluding the effect of our current largest customer. We have included a reconciliation of such YOY revenue growth (excluding our
largest customer) to our GAAP YOY revenue growth on our website at ni.com/nati.
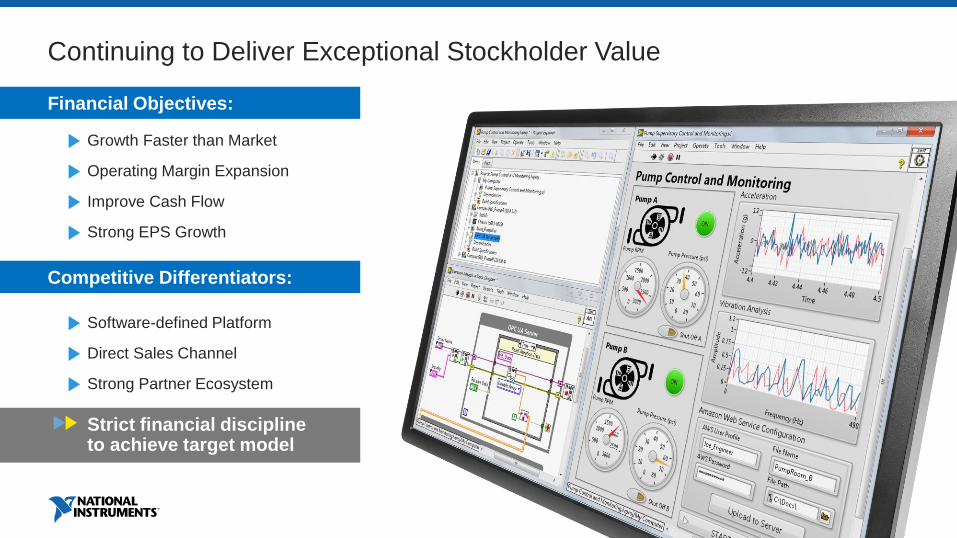
Continuing to Deliver Exceptional Stockholder Value
Financial Objectives:
Strict financial discipline to achieve target model
Growth Faster than Market
Operating Margin Expansion
Improve Cash Flow
Strong EPS Growth
Software-defined Platform
Direct Sales Channel
Strong Partner Ecosystem
Competitive Differentiators:

2017 Year of Record Revenue
$1,173
$1,244
$1,225
$1,289
$1,228
2013 2014 2015 2016 2017
5%INCREASE
YOY in 2017
$ Millions USD

2017 Continued Share Gains

2017
Over $20K
56%
Under $20K
44%
Over $20K
33%
2007
Under $20K
67%
% Order Size
$ M
illio
n, U
SD
2017 Moving Up the Value Chain with Systems Growth
11%10 YR CAGR
Revenue from
Orders Over
$20k
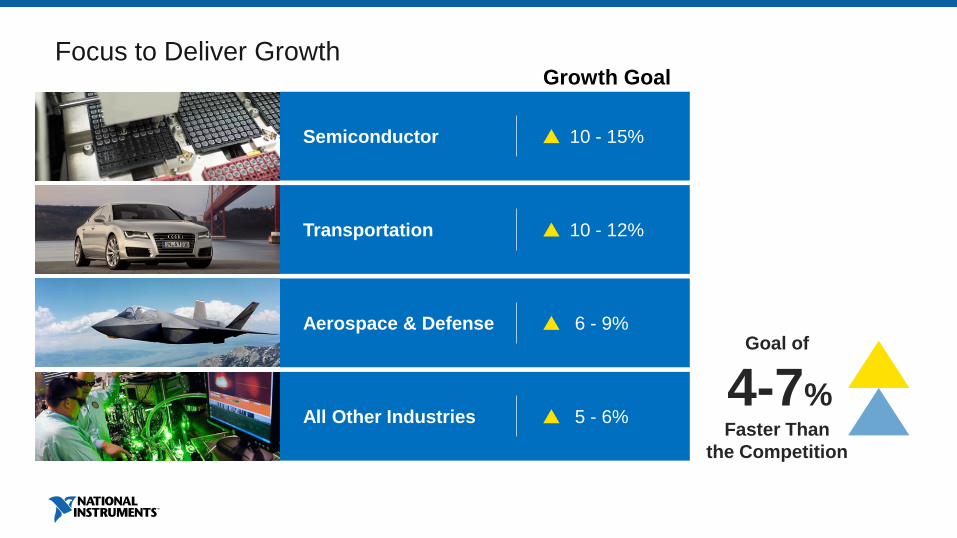
Semiconductor
Transportation
Aerospace & Defense
Focus to Deliver Growth
All Other Industries
10 - 15%
10 - 12%
6 - 9%
5 - 6%
Goal of
4-7%Faster Than
the Competition
Growth Goal

Non-GAAP Gross Margin Strength
Robust Software + Hardware Platform
continues to create value for our customers
A reconciliation of GAAP gross margin to Non-GAAP gross margin is available in the appendix
76%Average
0.0%
20.0%
40.0%
60.0%
80.0%
100.0%
20
07
20
08
20
09
20
10
20
11
20
12
20
13
20
14
20
15
20
16
20
17
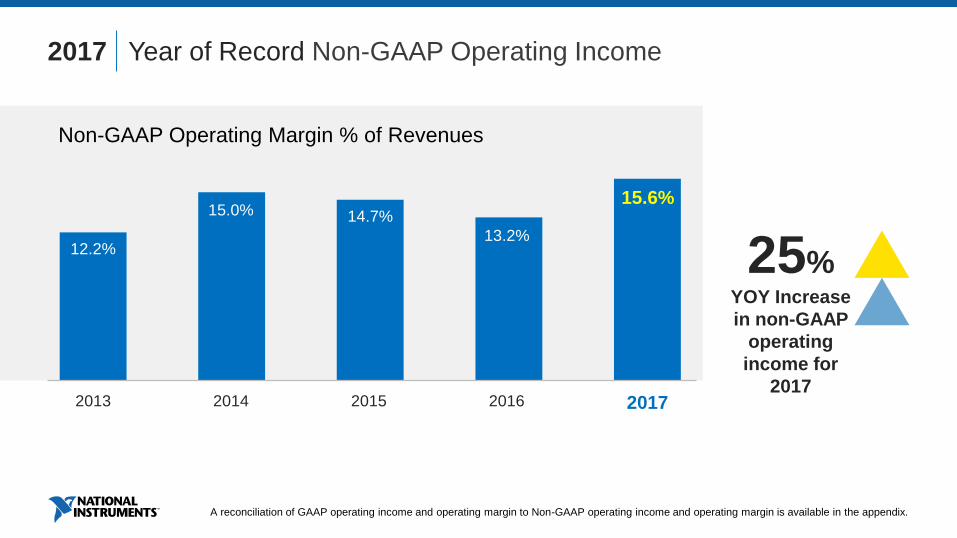
12.2%
15.0% 14.7%15.6%
13.2%
2017 Year of Record Non-GAAP Operating Income
2013 2014 2015 2016 2017
25%YOY Increase
in non-GAAP
operating
income for
2017
A reconciliation of GAAP operating income and operating margin to Non-GAAP operating income and operating margin is available in the appendix.
Non-GAAP Operating Margin % of Revenues

$110
$156
$128
$160
$120
2017 Record Non-GAAP Net Income
2013 2014 2015 2016 2017
33%YOY Increase
A reconciliation of GAAP net income to Non-GAAP net income is available in the appendix
$ Millions USD

2017 Year of Record Cash Provided by Operations
$169
$195
$169
$224
$200
2013 2014 2015 2016 2017
14%
16%
14%
16%
17%
Cash Provided by Operations
as % of Revenue
Cash Provided by Operations
Cash Provided by Operations $ Millions USD

$2.2B
$685M
$261M
$247M
Objective of long-term, sustainable value for investors
Disciplined and Consistent Capital Allocation Priorities
10 years Deployed Capital $3.4B | 2008 – 2017Purpose
R&D Investment
Dividends
Share Repurchase
Acquisitions
Organic Growth
Return Capital to Investors
Return Capital to Investors
Strategic Acquisitions

$-
$20
$40
$60
$80
$100
$120
2003 2004 2005 2006 2007 2008 2009 2010 2011 2012 2013 2014 2015 2016 2017
Consistent Return of Cash Through DividendsD
istr
ibu
ted
Div
iden
ds, $M
-
0.20
0.40
0.60
0.80
1.00
1.20
1.40
1.60
1.80
Div
iden
d P
er
Sh
are
($)
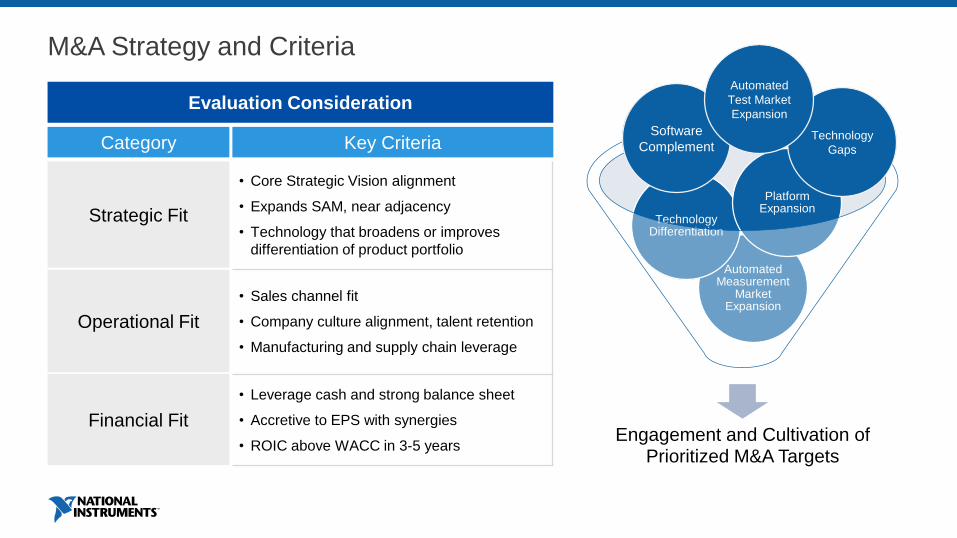
Engagement and Cultivation of Prioritized M&A Targets
Automated Measurement
Market Expansion
Technology Differentiation
Platform Expansion
Software
ComplementTechnology
Gaps
Automated
Test Market
ExpansionEvaluation Consideration
Category Key Criteria
Strategic Fit
Operational Fit
Financial Fit
• Core Strategic Vision alignment
• Expands SAM, near adjacency
• Technology that broadens or improves
differentiation of product portfolio
• Sales channel fit
• Company culture alignment, talent retention
• Manufacturing and supply chain leverage
• Leverage cash and strong balance sheet
• Accretive to EPS with synergies
• ROIC above WACC in 3-5 years
M&A Strategy and Criteria
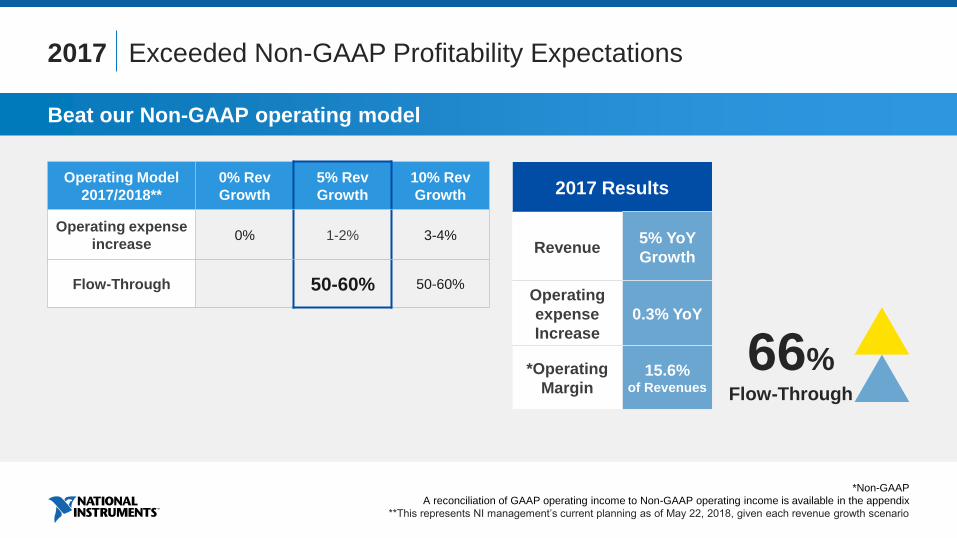
Beat our Non-GAAP operating model
Operating Model
2017/2018**
0% Rev
Growth
5% Rev
Growth
10% Rev
Growth
Operating expense
increase0% 1-2% 3-4%
Flow-Through 50-60% 50-60%
2017 Results
Revenue5% YoY
Growth
Operating
expense
Increase
0.3% YoY
*Operating
Margin 15.6%
of Revenues
*Non-GAAP
A reconciliation of GAAP operating income to Non-GAAP operating income is available in the appendix
**This represents NI management’s current planning as of May 22, 2018, given each revenue growth scenario
2017 Exceeded Non-GAAP Profitability Expectations
66%Flow-Through
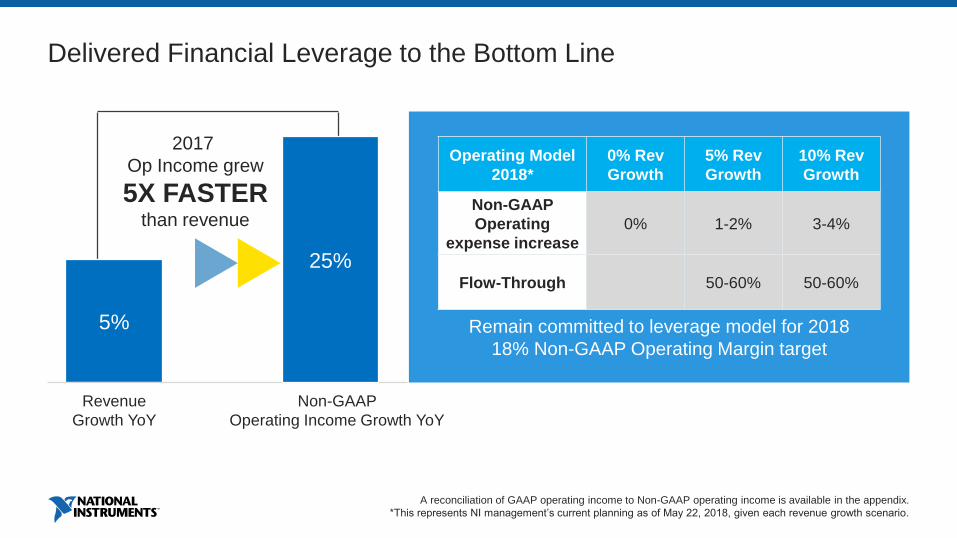
5%
25%
Revenue
Growth YoY
Non-GAAP
Operating Income Growth YoY
2017
Op Income grew
5X FASTERthan revenue
Operating Model
2018*
0% Rev
Growth
5% Rev
Growth
10% Rev
Growth
Non-GAAP
Operating
expense increase
0% 1-2% 3-4%
Flow-Through 50-60% 50-60%
Remain committed to leverage model for 2018
18% Non-GAAP Operating Margin target
A reconciliation of GAAP operating income to Non-GAAP operating income is available in the appendix.
*This represents NI management’s current planning as of May 22, 2018, given each revenue growth scenario.
Delivered Financial Leverage to the Bottom Line

Non-GAAP Operating margin goal of 18% through the economic cycle
Revenue Growth Scenarios 0% Growth 5% Growth 10% Growth
Expense Growth 0% 2-3% 4-5%
Non-GAAP Operating Margin % 17% 18-19% 20-21%
Flow-Through 0% 45-50% 50-55%
2019 Non-GAAP Operating Model*
*This represents NI management’s current planning as of May 22, 2018, given each revenue growth scenario.
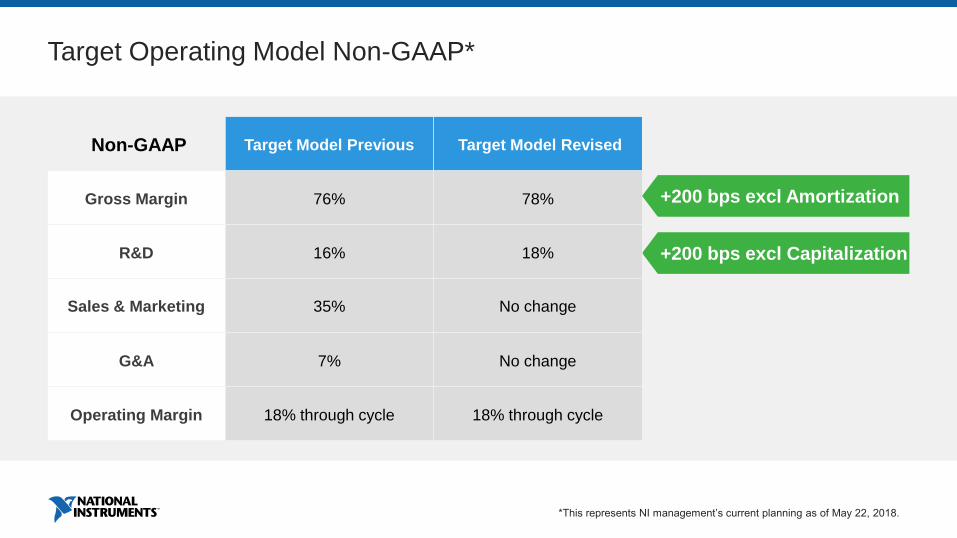
Target Operating Model Non-GAAP*
Non-GAAP Target Model Previous Target Model Revised
Gross Margin 76% 78%
R&D 16% 18%
Sales & Marketing 35% No change
G&A 7% No change
Operating Margin 18% through cycle 18% through cycle
+200 bps excl Amortization
+200 bps excl Capitalization
*This represents NI management’s current planning as of May 22, 2018.

Strategic Financial Plan to Maximize Shareholder Return
Maximize Total Shareholder Return
and Deliver on our Profit Opportunity
Focused: Aligned on Core Strategic Vision
Disciplined: Leverage platform to take market share
Results driven: Execution of operating model

OUTPERFORM THE COMPETITION
4-7% Faster YOY
Revenue Growth
INCREASE NON-GAAP OPERATING MARGINS
18% Through
the Cycle
Key Objectives
A reconciliation of GAAP operating income and operating margin to Non-GAAP operating income and operating margin is available in the appendix.


NI Strengthening Market Position
Unique Cost and Time-to-Market Advantages
Aligned to Major Technology Disruptions Driving Innovation
Focused on Best Opportunities for Growth
Delivering Significant Operating Leverage
ni.com
Q&A


Appendix Historical GAAP to Non-GAAP Reconciliations (in $USD thousands)

Appendix Historical GAAP to Non-GAAP Reconciliations