Embed Size (px)
Citation preview

0
2018 Diverse Asset Management Firm Assessment
Final Report January 2019
Professor Josh Lerner, Harvard Business School Ann Leamon, Bella Private Markets Richard Sessa, Bella Private Markets
Rahat Dewan, Bella Private Markets Samuel Holt, Bella Private Markets
Acknowledgements: Funding for this report was provided by The John S. and James L. Knight Foundation, which is gratefully acknowledged. The authors would also like to thank the Diverse Asset Managers Initiative (DAMI) for laying the foundation for this research and the external reviewers who provided helpful feedback. The advisory group includes Rukaiyah Adams (Meyer Memorial Trust), David Blood (Generation Investment Management), Doug Brown (Exelon Corporation), Gilbert Garcia (Garcia, Hamilton and Associates), Robert Greene (National Association of Investment Companies), Renae Griffin (GCM Grosvenor), Carolina Huaranca (Kapor Capital), Kenneth Jones (Annie E. Casey Foundation), Janet McKinley (Advance Global Capital), Lesa Mitchell (Techstars, Kansas City), Maria Stamolis (Canyon Partners), and Kevin Stephenson (Cambridge Associates).

1
Table of Contents Page I. Executive Summary .............................................................................................................. 3
II. Related Studies ...................................................................................................................... 7
Mutual Funds .............................................................................................................................. 7
Hedge Funds ............................................................................................................................... 9
Real Estate ................................................................................................................................ 12
Workplace Diversity .................................................................................................................. 12
III. Data ...................................................................................................................................... 12
Industry Employment ................................................................................................................ 13
Mutual Funds ............................................................................................................................ 14
Hedge Funds ............................................................................................................................. 16
Private Equity and Real Estate ................................................................................................. 18
General Data Limitations ......................................................................................................... 20
IV. Methodology and Results ................................................................................................... 20
Mutual Funds ........................................................................................................................... 23
Current State of Diverse Ownership for Mutual Funds ........................................................ 23 Timeline of Diverse Ownership for Mutual Funds ............................................................... 34 Performance of Diverse-Owned Mutual Funds .................................................................... 37 Institutional Investor Types for Diverse-Owned Mutual Funds ........................................... 40
Hedge Funds ............................................................................................................................ 44
Current State of Diverse Ownership for Hedge Funds ......................................................... 44 Timeline of Diverse Ownership for Hedge Funds ................................................................ 54 Performance of Diverse-Owned Hedge Funds ..................................................................... 57
Private Equity ........................................................................................................................... 61
Current State of Diverse Ownership for Private Equity ....................................................... 61 Diverse Ownership Trends for Private Equity ...................................................................... 70 Performance of Diverse-Owned PE Funds ........................................................................... 73 Institutional Investor Types for Diverse-Owned PE Firms .................................................. 75
Real Estate ................................................................................................................................ 78
Current State of Diverse Ownership for Real Estate ............................................................ 78 Diverse Ownership Trends for Real Estate .......................................................................... 87 Performance of Diverse-Owned Real Estate Funds ............................................................. 90
V. Conclusion ........................................................................................................................... 92
VI. Appendix .............................................................................................................................. 93
Mutual Fund Performance ........................................................................................................ 93
Hedge Fund Performance ......................................................................................................... 96

2
Private Equity Performance ..................................................................................................... 99
Real Estate Performance ........................................................................................................ 101
Top-Quartile Performance ...................................................................................................... 103

3
I. Executive Summary The asset management industry is a cornerstone of the global economy—the value of global assets under management (AUM) stood at $69.1 trillion USD in 2016.1 Asset managers facilitate the movement of capital from investors to entrepreneurs, growing ventures, and restructuring enterprises. Beyond the size and importance of the industry, many observers have pointed to its lack of diversity.2 To address this concern, the John S. and James L. Knight Foundation partnered with Bella Private Markets to study the diversity within ownership of U.S. asset managers in our 2017 Diverse Asset Management Project Firm Assessment. The study concluded that women and minorities were dramatically underrepresented in mutual funds, hedge funds, private equity (PE), and real estate. In this report, the Knight Foundation along with Professor Josh Lerner (Harvard Business School) and Bella Private Markets update our previous study using revised data and enhanced methodology. The most significant change being the availability of new ownership diversity data on PE and real estate funds, allowing us to study real estate performance for the first time. As in our prior study, we focus on four major asset classes: mutual funds, hedge funds, PE, and real estate. We have three main objectives: to better characterize the ownership diversity of U.S. asset managers; to examine the impact of diverse ownership on financial performance; and to study the composition of institutional investors that invest with diverse managers. Our study relies on a number of public, commercial, and hand-compiled datasets. For mutual funds and hedge funds, we use the commercial databases eVestment and Hedge Fund Research (HFR) to identify women- and minority-owned firms. While these databases do not contain the entire population of mutual funds and hedge funds, they represent the most comprehensive data sources that provide information on diverse ownership. For PE and real estate, we merge commercial datasets from Preqin with hand-compiled lists of diverse managers. Although definitions of diverse-owned firms vary slightly across our data sources, our report defines diversity based on the share of equity held by diverse owners. Typically, firms are considered women-owned or minority-owned if at least 25% of firm ownership is held by women or minorities. Firms may be classified as both women-owned and minority-owned if they have substantial levels of ownership held by women and minorities. Because of data limitations, we define diverse PE and real estate firms using a 50% equity threshold. Moreover, our definition of “minority” includes racial/ethnic minorities (e.g., Hispanic, Black, Asian, and Native American) but does not include other underrepresented groups such as veterans or disabled persons. Occasionally, we use the term “diverse-owned” to refer to the broader group of women-owned and minority-owned firms. In this section, we briefly summarize our report’s main findings and discuss the results for each asset class. More detailed discussions of our data, methodology, and results can be found throughout the remainder of our report.
1 Boston Consulting Group, “Global Asset Management 2017: The Innovator’s Advantage,” report, July 2017. 2 See, for example, (1) Maxey, Daisy, “Where Are the Female Fund Managers?” The Wall Street Journal, July 6, 2015; (2) De Avila, Joseph, “NYC Seeks Diversity Among Its Asset Managers,” The Wall Street Journal, April 30, 2015.

4
Mutual Funds: This section uses data on institutional mutual funds from the eVestment Traditional Database which includes mutual funds, separately-managed accounts (SMAs), co-mingled funds, and a limited number of exchange-traded funds (ETFs). With these data, we investigate the current state of diversity for this asset class, construct a timeline of diverse managers, analyze the performance of these diverse firms, and describe the types of institutional investors engaged with these firms.
Current State of Diverse Ownership for Mutual Funds: We identify 136 women-owned and 120 minority-owned firms, managing $430 billion and $191 billion in AUM. For women, the 136 firms represent 9.9% of firms and 0.8% of total industry AUM. For minorities, these numbers represent 8.8% of firms and 0.4% of total industry AUM. Timeline of Diverse Ownership for Mutual Funds: We identify diverse firms for every quarter from Q1 2011 through Q4 2017 and find underrepresentation of diverse-owned firms throughout this time period. While there are no distinct trends in the representation of women- or minority-owned firms, funds, or AUM, we do observe an upward trend in the amount of AUM. However, for minority-owned firms, this upward trend ends in the middle of 2015, and we see a distinct drop in AUM through Q4 2017. Since the sample size is small, this decline may be explained by the exit (or change in ownership type) of a few large minority-owned firms or funds. Performance of Diverse-Owned Mutual Funds: As a whole, the evidence suggests that the performance of funds managed by diverse-owned firms is statistically no different than the performance of those managed by non-diverse firms. This analysis examines multiple performance metrics and controls for a number of firm- and fund-level characteristics that may be related to performance (e.g. asset focus, firm size, and fund size). A separate look at the distribution of returns shows that diverse funds often have top-quartile returns, with 26% of women-owned and 29% of minority-owned funds in the top quartile, on average. Institutional Investor Types for Diverse-Owned Mutual Funds: Based on the most recent data from Q4 2017, we examine the mix of institutional investor types associated with diverse and non-diverse firms. Public funds and corporate clients have the largest amount of AUM invested in women- and minority-owned funds, but these investor types are heavy investors in mutual funds in general. We find that investments from public funds, foundations, endowments, high net worth individuals, and family offices represent a larger share of AUM in a typical women- or minority-owned fund, compared to non-diverse funds.
Hedge Funds: Using data from Hedge Fund Research (HFR), we analyze the current state of diversity in the hedge fund space; construct a timeline of diverse managers; and analyze the performance of these diverse managers. It is important to note that there are a number of hedge fund databases

5
with varying coverage of the hedge fund population, and our findings for hedge funds represent the analysis of only one database. While this database only covers roughly half of the hedge fund industry, it contains detailed demographic information on firm ownership that is crucial to this report.
Current State of Diverse Ownership for Hedge Funds: We find diverse-owned hedge funds are underrepresented, with 4.6% and 8.9% of firms owned by women and minorities. Women-owned firms control only 1.5% of hedge fund assets, and minority-owned firms manage 2.7% of assets. Timeline of Diverse Ownership for Hedge Funds: We find that since 2010, women- and minority-owned hedge have gained representation in the industry. Also, growth in the representation of women and minorities has accelerated since January 2016. However, women- and minority-owned firms are still underrepresented in the industry. Performance of Diverse-Owned Hedge Funds: We find no conclusive evidence that the performance of diverse-owned hedge funds differs significantly from the performance of non-diverse funds. The analysis uses several performance metrics and controls for relevant firm- and fund-level characteristics. Analysis of top-quartile performance shows that 26% of women funds and 28% of minority funds exhibit top-quartile returns, on average.
Private Equity and Real Estate: Unlike mutual fund and hedge fund managers, who typically invest in publicly traded securities, PE and real estate funds make highly illiquid investments over long time horizons. As a result, we might expect to find differences in both the level of diversity and its effects on performance within these asset classes. We identify women- and minority-owned PE and real estate firms using Preqin databases merged with hand-compiled lists of diverse asset managers. Because data collection on diversity is relatively new for PE and real estate, it is possible that our database misses a few diverse-owned asset managers. While we are confident in the data coverage of diverse-owned PE firms, data coverage for real estate remains an obstacle for diversity research. As a result, we provide a thorough examination of diversity in PE and real estate, but we are forced to omit the institutional investor analysis for real estate firms because of prohibitively small samples.
Current State of Diverse Ownership for PE: Only 5.2% of PE firms are women-owned, and they manage approximately 3.4% of industry assets. Minority-owned firms represent 3.9% of all PE firms and manage 3.8% of industry assets. Current State of Diverse Ownership for Real Estate: Of the 967 real estate firms in our dataset, 1.8% are women-owned and 2.2% are minority-owned. Representation is lower when measured by AUM, with women-owned firms controlling 0.8% of total industry AUM and minority-owned firms controlling 1.2% of total industry AUM.

6
Timeline of Diverse Ownership for PE and Real Estate: There is some evidence of an increase in the representation of women- and minority-owned PE and real estate firms since 2006, in terms of the number of funds raised and amount of capital raised. However, diverse groups are still underrepresented, and small sample sizes prevent a detailed analysis. Performance of Diverse-Owned PE and Real Estate Funds: Among PE asset managers, we find little evidence that women- or minority-ownership impacts fund returns. There is some weak evidence, however, that minority-owned real estate funds underperform non-diverse funds. We note that this difference performance is not statistically significant when using net IRRs as our measure of performance. Institutional Investor Types for Diverse-Owned PE Funds: We examine the composition of institutional investors committing capital to diverse-owned PE firms relative to a random sample of PE firms from Preqin. These data show the representation in terms of the number of LPs, not in terms of AUM, since such data are not available. On average, we find that diverse-owned PE firms have fewer institutional investors relative to our random sample.
Concluding Remarks: Our findings regarding diverse-owned asset managers are broadly consistent with previous research on diverse-managed funds. We find that, for most asset classes, diverse-owned firms exhibit returns that are not significantly different relative to non-diverse firms; however, they have low levels of representation in every asset class. One exception is real estate, where we find some weak evidence that minority-owned funds underperform non-minority-owned funds. We note, however, that this result has only marginal statistical significance and does not hold across all specifications. In addition, we find no evidence of a performance differential between women-owned and non-women-owned real estate funds. We hope that this report sheds light on the state of diversity in the asset management industry and encourages additional data collection. Importantly, we highlight value of data sources that provide comprehensive and detailed reporting of diverse ownership and diverse management. Creating a publicly-available, non-proprietary database with this information should be a top priority for the institutional investment community. It is our hope that our research increases awareness and knowledge of this topic and encourages enhanced data reporting in the future. The report is organized as follows: we first discuss the previous work on this topic in the Related Studies section. We then discuss the specifics of our data and the creation of each dataset in the Data section; the casual reader may wish to skip this section. In the Methodology and Results section, we describe and present results for all asset classes. At the beginning of each asset class, we provide a brief summary of key results followed by a more in-depth discussion. The Conclusion section summarizes our key findings and takeaways. Descriptive statistics and estimates for the performance analyses are available in the attached Appendix.

7
II. Related Studies A limited number of studies examine diversity in asset management and the performance of diverse funds. Most of the existing literature, however, looks almost exclusively at the diversity of fund managers, rather than fund owners. The most significant obstacle to diversity research is the lack of data. Some researchers have used proxy methods to look at gender diversity by identifying fund managers with female first names or female prefixes. Classifying racial/ethnic diversity, however, is more difficult. Therefore, the bulk of the research has been on female managers, not minority managers; the few studies that focus on racial/ethnic diversity have limited sample sizes. Previous efforts are also skewed in terms of asset class. Most studies focus on hedge funds or mutual funds, particularly when examining performance. There are a handful of studies that investigate private equity, but those analyzing performance are hindered by small and potentially biased samples of diverse firms. For real estate, there has been virtually no research on the extent of diversity or the performance of diverse real estate funds. The rest of this section details prior literature by asset class; we first review studies that investigate the number and demographics of diverse funds and then discuss any available performance studies. Mutual Funds A report from Morningstar documents the lack of female managers in its commercial database of mutual funds.3 Women account for 9.4% of all portfolio managers, and most of those women are part of mixed-gender teams. Only 2% of mutual funds and assets are run exclusively by women, while 78% of funds and 74% of assets are managed exclusively by men. A subsequent report from Morningstar delves deeper and examines the performance of female-run funds relative to male-run funds.4 It utilizes three statistical tests: Fama-Macbeth regressions, portfolio-based tests, and event studies. In the Fama-Macbeth regressions, the more robust of the tests, the study controls for fees, fund of funds, fund age and fund size, which explain most cross-sectional variance in average returns and address the shortcomings of previous analyses. The paper finds no significant difference in performance among funds managed by men, women, or mixed gender teams. The study concludes that performance cannot explain the lack of gender diversity in the mutual fund industry. Three academic articles investigate the performance and investments in women-owned or women-managed mutual funds. These studies find that gender, generally, has little or no effect on performance, but women experience significantly lower fund inflows. Niessen-Ruenzi and Ruenzi (2015) examine net inflows for U.S. equity mutual funds from 1992 to 2009. They link fund- and manager-characteristics from Morningstar with performance data from the Center for Research in Securities Prices (CRSP) Survivor-Bias-Free Mutual Fund
3 Laura Pavlenko Lutton and Erin Davis, “Morningstar Research Report: Fund Managers by Gender,” online report, June 2015. 4 Madison Sargis and Kathryn Wing, “Fund Managers by Gender: Through the Performance Lens,” online report, March 2018.

8
database. Their regression results show that female-managed funds have lower inflows after controlling for fund-level characteristics. Moreover, the highest performing funds with female management would receive greater inflows of investments to the fund if they were run by men. Niessen-Ruenzi and Ruenzi also conduct a controlled experiment to understand why women-managed funds receive fewer investments. They present participants with two S&P 500 index funds, disguised as Fund A and Fund B, and are asked to allocate 100 units of investment between the two funds. A female manager and male manager are randomly assigned between the two funds and everything else presented to the participants is held constant. Thus, any difference in overall levels of investment between male- and female-managed funds is caused by the name, and implied gender, of the manager. The authors find significantly smaller inflows to female-managed funds relative to male-managed funds. In addition, the authors test for implicit gender bias in investing and link this to investment decisions. They utilize an implicit association test (IAT) that measures how quickly participants match stereotypical grouping of words (e.g. men and finance) versus non-stereotypical pairings (e.g. women and finance). Niessen-Ruenzi and Ruenzi find that participants with greater bias contribute significantly less to women-managed funds in the experimental investment task, controlling for participant-level characteristics such as gender, college major, financial literacy, and investment experience. Results indicate that implicit bias explains, in large part, the reduced inflows to female-managed funds. Two older studies also use the Morningstar database of mutual funds but limit their analysis to different sub-asset classes; their results are consistent with empirical findings from Niessen-Ruenzi and Ruenzi (2015). The first, from Atkinson, Baird, and Frye (2003), limits the sample to all taxable fixed income funds that were at least five years old.5 They identify 72 female-managed funds within this sample and find no difference between female- and male-managed fixed income funds in terms of performance or risk. Despite the similarities in performance, female-managed funds have significantly lower inflows than male-managed funds. This effect is significant for the first year of a fund and for pooled inflows over the tenure of a fund. The second study, from Bliss and Potter (2002), looks only at mutual funds that focus on domestic and international equity.6 Using regression models, they too find no evidence that performance is significantly different between male and female mutual fund managers. In summary, there is no prior evidence that female mutual fund managers are less competent than their male peers. Despite the fact that they are just as good at generating returns for their investors, female managers see significantly lower inflows into their funds. Experimental evidence suggests that implicit bias on the part of investors may partially explain the reluctance to invest with female-managed mutual funds.
5 Stanley M. Atkinson, Samantha Boyce Baird, and Melissa B. Frye, “Do Female Mutual Fund Managers Manage Differently?” The Journal of Financial Research 26(1): 1-18, Spring 2003. 6 Richard T. Bliss and Mark E. Potter, “Mutual Fund Managers: Does Gender Matter?” Journal of Business and Economic Studies 8(1): 1-17, 2002.

9
Hedge Funds Several reports identify diverse hedge funds and compare their performance to industry benchmarks using Hedge Fund Research (HFR) data. A report by Barclays Capital identifies 170 diverse firms as of March 2011.7 The firms managed approximately 300 funds and $48 billion, which represented 3.3% of all funds and 2.4% of total AUM. In addition, diverse hedge funds have stronger performance in terms of absolute and risk-adjusted returns. They also conclude that diverse firms significantly outperform the hedge fund industry in both up and down markets. “Women in Alternative Investments,” a report from KPMG (formerly published by Rothstein Kass) using HFR’s database finds strong performance for the subset of women-owned or -managed funds.8 Their annual report identifies women-owned or women-managed funds and constructs a diverse performance index. Results show that women-owned or -managed hedge funds consistently outperform industry benchmarks. In addition, they conclude that women-owned or -managed funds have superior risk-adjusted returns, stronger performance during downturns, and lower drawdowns relative to all hedge funds. While these studies are suggestive, they do not control for confounding factors such as fund size, structure, and strategy. A recent academic paper by Aggarwal and Boyson (2016) uses regression models to examine the performance of female-managed hedge funds, controlling for a number of fund-level characteristics.9 The authors use Thomson-Reuters data from 1994 through 2013 and include both active and dead funds. They identify female managers with “Miss,” “Ms.,” or “Mrs.” in the prefix field; for managers with no prefix listed, they check first names for distinctly female names. They identify 244 funds managed exclusively by women and 195 funds with both male and women managers; together, the funds represent 4.6% of all hedge funds in the Thomson-Reuters universe. Regression analyses of hedge fund performance control for manager gender, AUM, fund age, fund structure, and fund strategy. They also control for fund survivorship since “survivor bias” is a well-known artifact of hedge fund data that distorts performance metrics.10 Data collection is biased toward surviving funds, which are also the strongest performing funds, so performance metrics are likely biased upward by these “survivors.” In regression models that do not control for firm survival, Aggarwal and Boyson observe no statistical differences in performance between female-managed and male-managed funds. When controlling for survivorship, however, they find that female-managed funds significantly outperform male-managed funds.
7 Barclays Capital, “Affirmative Investing: Women and Minority Owned Hedge Funds,” online report, June 2011. 8 KPMG, “Breaking Away: The path forward for women in alternatives,” online report, September 2015; Meredith Jones, “Women in Alternative Investments: A Marathon, Not a Sprint,” online report for Rothstein Kass Institute, December 2013; Meredith Jones, “Women in Alternative Investments: Building Momentum in 2013 and Beyond,” online report for Rothstein Kass Institute, December 2012. 9 Rajesh Aggarwal and Nicole M. Boyson, “The Performance of Female Hedge Fund Managers,” Review of Financial Economics 29: 23-26, 2016. 10 Mila Getmansky, Peter A. Lee, and Andrew W. Lo, “Hedge Funds: A Dynamic Industry in Transition,” working paper, July 28, 2015.

10
The authors further investigate what causes hedge funds to fail. Small fund size and poor past performance predict failure for both male- and female-managed funds. Being a female-managed fund or being open to new investment is not significantly tied to failure per se, but the combination of being female-managed and open to new investment is a significant predictor of failure.11 Together, these results suggest that female-managed funds may struggle to raise capital, but those female-managed funds that can raise sufficient capital, and survive, are actually outperforming the surviving funds that are male-managed. These results correspond with survey results and anecdotal evidence regarding women in the hedge fund industry. For example, women in senior management positions are surveyed every year for the report “Women in Alternative Investments,” and they commonly cite access to capital as a primary challenge.12 Interestingly, these female fund managers indicate that raising capital is more important for success than is exceptional fund performance. In summary, the evidence shows that hedge funds with diverse management have been successful and often outperform non-diverse hedge funds. There is more evidence on gender diversity, with multiple reports documenting the strong performance of women-managed funds. Nonetheless, it is clear that women still have a difficult time raising capital, and this severely affects their ability to run a successful fund. Private Equity Recent reports document the low representation of women and minorities in PE, especially within venture capital (VC) firms. For example, Preqin quantifies the representation of senior-level women in its commercial PE database.13 In North America, women represent just 10.5% of senior employees in PE as of 2016. Another report from Pensions & Investments also uses Preqin data and evaluates gender diversity in PE for several job titles.14 Women held 16.5% of investment professional roles, 11.7% of senior management roles, and 6.5% of partner or managing partner positions in global private equity. The extent of manager diversity is reportedly even lower in the VC industry. The Information worked with the venture firm Social + Capital to quantify diversity in VC.15 They classify the gender and race/ethnicity for 522 senior-level investment professionals at 71 of the biggest U.S. VC firms, finding that only 8.6% of senior venture capitalists were women. They found that Hispanics and African-Americans are also dramatically underrepresented in VC, comprising 1.3% and less than 1% of all senior venture capitalists. Richard Kerby utilizes a similar method
11 In other words, funds that have not yet reached their desired scale in terms of AUM. 12 KPMG, “Breaking Away: The path forward for women in alternatives,” online report, September 2015; Meredith Jones, “Women in Alternative Investments: A Marathon, Not a Sprint,” online report for Rothstein Kass Institute, December 2013; Meredith Jones, “Women in Alternative Investments: Building Momentum in 2013 and Beyond,” online report for Rothstein Kass Institute, December 2012. 13 Preqin, “Women in Private Equity,” online report, March 2016. 14 Arleen Jacobius, “Private Equity is Changing, But Still a Man’s World,” Pension & Investments, April 6, 2015. 15 Peter Schulz, “Future List: The Venture Capital Firms Best Positioned for the Future,” The Information, October 6, 2015; Peter Schulz, “Introducing The Information’s Future List,” The Information, October 2015.

11
to identify black investors for a TechCrunch article.16 He finds that African-Americans make up only 1.5% of nearly 2,000 VC investment professionals. A working paper from Gompers, Mukharlyamov, Weisburst, and Yuhai (2014) investigates gender effects in VC. The authors hand-collect data on gender, education, and work experience for VC investors from 1975 to 2003.17 They identify 212 female venture capitalists who represent 6.1% of all venture capitalists. In addition, they find that female venture capitalists are somewhat less successful as measured by initial public offerings (IPOs). The authors use regression models to control for industry, year, ethnicity, education, and work experience. Despite controlling for these demographic characteristics, the gender effect persists. Gompers et al (2014) use regression models to control for industry, year, ethnicity, education, and work experience. Despite controlling for these demographic characteristics, the gender effect persists. In addition, they test a model including performance for the investor, their firm, and any co-investors. They find that all three prior success measures have positive effects on performance. In other words, investments are more likely to succeed if the investor, firm, and co-investors have a track record of success. These variables, however, do not fully explain why women venture capitalists are less successful. Next, the authors include interactions between gender and each prior success variable. The results show that women, in particular, do not always benefit from the track record of their colleagues; only the women at firms with other female venture capitalists benefit from the prior success of their firm. In fact, the results suggest that the inability of most female venture capitalists to capture firm-level benefits can explain, in large part, their underperformance. Finally, the authors conduct a survey of women in VC to further elucidate these mechanisms. Results show that most women in VC feel like they do not receive as much formal or informal feedback as their male peers. They find that women at larger firms with other women VCs feel less disadvantaged compared to their male peers, and these findings are consistent with their empirical results. A 2012 report by the National Association of Investment Companies (NAIC), the trade group for diverse-owned and -managed PE firms, examines the performance of its member firms.18 The report compiles data for 14 firms from 1998 through 2011, and measures NAIC firms’ performance compared to industry benchmarks. NAIC firms are younger and have lower AUM. In terms of performance, NAIC firms are upper quartile for almost every year of the study. This evidence demonstrates that some diverse firms are performing well compared to the PE industry as a whole. However, the sample size is small, and the firms are all sourced from a trade association, which may introduce some biases in the types of firms that are included. For
16 Richard Kerby, “Why are There So Few Black Investors?” TechCrunch, March 10, 2015. 17 Paul A. Gompers, Vladimir Mukharlyamov, Emily Weisburst, and Yuhai Xuan, “Gender Effects in Venture Capital,” working paper, May 2014. 18 National Association of Investment Companies, “The Financial Return of NAIC Firms: Minority and Diverse Private Equity Mangers and Funds Focused on the U.S. Emerging Domestic Market,” online report, September 2012.

12
these reasons, it is difficult to tell whether these results are indicative for all diverse-owned and diverse-managed PE firms. The 2013 publication of “Women in Alternative Investments” examines performance for a very limited sample of women-owned or -managed PE firms.19 The report was only able to obtain performance data for six women-owned or -managed PE firms. Performance of these firms is stronger than the industry performance benchmark, but it is difficult to glean much from these results since the sample size is limited. Real Estate Previous research tells us little about the diversity of real estate firms and even less about their performance. One report from Preqin utilizes data on the 37,000 staff and 3,300 firms in its commercial database of real estate investment firms.20 Preqin reports that 22% of employees in real estate investment firms are women, but only 9% of senior positions are held by women. For investment roles, there is even less gender diversity: women represent 11% of all investing positions and only 5% of senior investing positions. Workplace Diversity Our study contributes to several lines of academic research, including diversity in the workplace and more specifically, diversity in financial services and asset management. In that vein, the literature on diverse work environments has shown that gender, racial, and ethnic diversity can have positive effects on team dynamics and team performance. For instance, Hoogendoorn, Oosterbeek and van Praag conduct a field experiment of undergraduate students in business studies who must develop a start-up as part of their curriculum.21 They observe that gender-diverse teams perform better than non-diverse teams in terms of sales and profits. Another study by Badal and Harter finds that business units with greater gender diversity exhibit stronger financial performance.22 A study by Orlando Richard examines racial diversity in the banking industry, finding that racial diversity adds value to the firm, as measured by firm productivity, return on equity, and market performance.23 III. Data Our study relies on several data sources. Three commercial databases—Hedge Fund Research (HFR), eVestment (mutual funds), and Preqin (private equity and real estate)—allow us to identify the diverse ownership status of asset managers. Our hedge fund and mutual fund data
19 Meredith Jones, “Women in Alternative Investments: A Marathon, Not a Sprint,” online report for Rothstein Kass Institute, December 2013. 20 Preqin, “Women in Private Real Estate,” online report, Real Estate Spotlight 10(3): 6-7, May 2016. 21 Sander Hoogendoorn, Hessel Oosterbeek, and Mirjam van Praag, “The Impact of Gender Diversity on the Performance of Business Teams: Evidence from a Field Experiment,” Management Science 59(7): 1514-1528, July 2013. 22 Sangeeta Badal and James K. Harter, “Gender Diversity, Business-Unit Engagement, and Performance,” Journal of Leadership & Organizational Studies 21(4): 354-365, November 2014. 23 Orlando Richard, “Racial Diversity, Business Strategy, and Firm Performance: A Resource-Based View,” Academy of Management Journal 43(2): 164-177, April 2000.

13
provide information on the share of equity held by diverse owners. Private equity (PE) and real estate data are less detailed, but still indicate whether at least 50% of a firm’s equity is held by women or minorities. We should note, however, that data collection on PE and real estate diversity is still in its infancy and may not include every diverse manager. Therefore, for PE and real estate, we combine commercially available datasets with hand-compiled lists of diverse-owned firms to improve data reliability. Throughout the report we characterize differences between diverse and non-diverse asset managers using a number of firm- and fund-specific variables. Some of our datasets include historical, performance, and investor information, which we utilize to study diversity trends; the financial performance of diverse managers; and the composition of institutional investors supplying capital to diverse asset managers. In this section, we briefly summarize each major data source. Industry Employment While our primary interest lies in examining diversity in the ownership of asset managers, ownership is not equivalent to employment. It is possible for diverse ownership to increase while diverse employment declines, or vice versa. As a result, we analyze employment data from the U.S. Equal Employment Opportunity Commission (EEOC) to document diversity trends in the U.S. asset management industry. The EEOC maintains annual statistics on the racial and gender composition of the American workforce. Industries are classified according to five-digit North American Industry Classification System (NAICS) codes.24 The asset classes considered in our study do not have matching NAICS industry codes. Therefore, in our analysis of national employment trends, we combine the following three NAICS codes to proxy for the asset managers included in our report:
• Portfolio Management • Open End Investment Funds • Other Financial Vehicles
From 2004 through 2006, employment totals are available for nine occupational categories, and we focus on the “Officials & Managers” category over these years. Starting in 2007, the “Officials & Managers” category is split into “Executive/Senior Level Officials & Managers” and “First/Mid-Level Officials & Managers.” Consequently, from 2007 onward we focus on the “Executive/Senior Level” category. It should be noted that the selected NAICS industries serve as a rough proxy for the asset classes considered in our study. We include the industry employment analysis to complement our findings on diverse ownership and provide a more complete picture of diversity trends.
24 For more information on NAICS classifications, please see: http://www.laworks.net/downloads/lmi/naicsoverview.pdf.

14
Mutual Funds For mutual funds, we use the Traditional Database from eVestment, a leading commercial data provider for institutional investors frequently used in academic research.25 The database covers more than 40,000 active and inactive investment vehicles including mutual funds, separately managed accounts (SMAs), comingled trust funds, and exchange-traded funds (ETFs); together, mutual funds and SMAs comprise the vast majority of database observations. eVestment collects quarterly data on firms and funds, including AUM, fund performance, fund strategy, and firm location. Starting in Q1 2011, eVestment provides firm-reported data on the share of firm ownership held by women and the following minority groups: African-American, Asian, and Hispanic. We use eVestment data through Q4 2017 and restrict our sample to U.S.-based asset managers.26 The sample contains approximately 2,500 firms and their 20,000 funds. The dataset includes a limited number of firms based in Puerto Rico, which we consider part of the U.S. for our analysis. We make several other sample restrictions:
• To examine the current state of diversity, we are interested in the level of diverse ownership among current asset managers. Therefore, we restrict the data to active funds for the current state of diversity section.
• For 99.94% of these funds, the asset class is listed as Equity, Fixed Income, or Balanced/Multi-Asset. The remaining 0.06% of funds are listed as Alternatives or Real Estate. We disregard these data points since these two asset classes make up such a small proportion of the eVestment universe and are covered by other sections of this report.
• We drop the small number of fund of funds (FoFs), since any AUM with FoFs will be double counted if the underlying fund investments are included in the dataset.
• We group firms into U.S. regional categories: Northeast, South, Midwest, and West. These four regional categories are based on the office address of the firm, using the U.S. Census Bureau state regional categories and grouping Puerto Rico and the Virgin Islands with the South.27
After these restrictions, our sample of current U.S.-based asset managers for mutual funds includes approximately 1,400 firms and 12,000 funds. From this universe, we have identified subsets of women- and minority-owned firms with substantial (25-49%) or majority ownership (50%+) in Q4 2017. For some analyses, we combine the substantial and majority ownership subsets and examine all women-owned firms with 25%+ ownership (n = 136 firms in Q4 2017)
25 See, for example: Jennifer Bender, P. Brett Hammond, and William Mok, “Can Alpha Be Captured by Risk Premia?” Journal of Portfolio Management 40(2): 18-29, Winter 2014. 26 Throughout our study we use a broad definition of the term “mutual fund” for ease of exposition. Our mutual fund sample consists of all funds in the eVestment Traditional Database. While many eVestment observations are institutional mutual funds, the sample also includes some SMAs, trusts, and ETFs. 27 The regions are defined as follows. Northeast: Connecticut, Maine, Massachusetts, New Hampshire, New Jersey, New York, Pennsylvania, Rhode Island, Vermont. South: Alabama, Arkansas, Delaware, Florida, Georgia, Kentucky, Louisiana, Maryland, Mississippi, North Carolina, Oklahoma, Puerto Rico, South Carolina, Tennessee, Texas, Virgin Islands, Virginia, Washington, DC, West Virginia. Midwest: Illinois, Indiana, Iowa, Kansas, Michigan, Minnesota, Missouri, Nebraska, Ohio, South Dakota, North Dakota, Wisconsin. West: Alaska, Arizona, California, Colorado, Hawaii, Idaho, Montana, Nevada, New Mexico, Oregon, Utah, Washington, Wyoming.

15
or all minority-owned firms with 25%+ ownership (n = 119 firms in Q4 2017). Please note that there may be some overlap between the subsets of women- and minority-owned firms, since firms can be owned by both women and minorities. For the trends and performance analysis, we use quarterly data starting in Q1 2011, the first quarter that diverse ownership is reported, through Q4 2017. For each quarter, we identify all active funds and firms. Among the active funds and firms each quarter, we identify funds and firms with women ownership (25%+) or minority ownership (25%+). Again, in any given quarter, there may be some overlap between the categories of women-owned and minority-owned firms, as these are not mutually exclusive definitions. For the trends analysis, we find the number of funds and firms for both diverse categories for each quarter, as well as the total AUM with women- and minority-owned firms. For the performance analysis, we use the same dataset to analyze the effect of diverse ownership on quarterly returns. We estimate a number of regression models to evaluate performance, controlling for ownership type as well as other relevant variables that may be correlated with performance. We use complete case analysis, and only include fund-quarter observations with non-missing data for performance, firm and fund characteristics, and ownership type. The institutional investor section relies on fund-level AUM data by client type as of Q4 2017. These data describe the types of clients that have capital invested with each asset manager. The table below provides eVestment definitions for each investor type AUM variable, which are reported in millions of USD.28 Investor Type eVestment Definition of AUM by Investor Type Corporate Sum of assets managed for corporations, regardless of account type (i.e.,
Defined Benefit, Defined Contribution). Public Fund Sum of assets managed for public fund clients regardless of account type. Superannuation Sum of assets for Superannuations, which are government-regulated
investment strategies designed to provide a person with an income upon their retirement. Superannuation schemes are commonly found in Australia and New Zealand.
Union/Multi-Employer
Sum of assets managed for union or multi-employer fund clients regardless of account type.
Foundations & Endowments
Sum of assets managed for a client whose assets, funds, or property are donated to an institution, individual, or group as a source of income.
Healthcare Sum of assets managed for clients in a healthcare organization (for profit and nonprofit).
28Again, some values appear to be reported by the firms in total dollars, so we cross-reference these variables with a separately reported variable for fund AUM. The sum of AUM across client types should not be greater than the total fund AUM. Therefore, for the investor type analysis, we drop any observations where this is the case. In calculating the sum of AUM across client types, we do not include AUM in “Defined Contribution” since this category is not mutually exclusive of all other categories. For instance, “Corporate,” “Public Fund,” and “Union/Multi-Employer” categories may also include AUM from defined contribution plans.

16
Insurance The sum of assets managed on behalf of insurance companies. Insurance companies often invest pooled assets to further grow available capital and finance additional operations.
High Net Worth Individuals
This is the sum of assets managed directly for a high net worth individual or family office.
Sub-Advised This is the sum of assets whose day-to-day management is handled by a third party hired by the primary manager.
Wrap Accounts Includes platform programs in which investors pay a single fee for all services associated with their account as opposed to per-transaction fees. This variable is a sum of assets managed for these types of programs.
Supranationals Sum of assets managed for supranationals, which are international organizations whose member states share decision-making power. Membership is voluntary and decisions by the group follow majority rule. The European Union and World Trade Organization are both supranationals.
Defined Contribution
This is the sum of assets managed for Defined Contribution plans, such as a retirement plan in which the employer and/or employee contribution specified amounts (e.g., 401(k), 403(b), etc.). This category is independent of the other asset breakdowns (i.e., an investor can be listed as defined contribution as well as another client type).
Hedge Funds For hedge funds, we use Hedge Fund Research (HFR) data, a leading provider of hedge fund data. Our final dataset is comprised of 2,980 firms and 6,932 funds reporting between January 2005 to May 2018. These data include variables such as strategy, geographic focus, geographic location, fund size, and performance. The standard commercial database also includes a diversity variable to indicate whether the fund is substantially owned by women or minorities. HFR has provided supplemental proprietary data for this project that include diverse ownership type (women vs. minority) and level of ownership (substantial vs. majority). The HFR range for substantial ownership is 25-50% ownership, and the threshold for majority ownership is 51%+ ownership. Using these diversity identifiers, we categorize hedge funds into five ownership groups: substantial women ownership, majority women ownership, substantial minority ownership, majority minority ownership, and non-diverse ownership. Unlike our mutual fund data, firm-level diversity indicators for hedge fund managers do not change over time. To make progress, we assume that any firm identified as diverse in the HFR database has always been diverse. While this may appear to be a strong assumption, it seems unlikely that diverse ownership would change frequently over time. HFR has good coverage of hedge funds relative to other commercial databases and is frequently used for academic research on the hedge fund industry.29 It does not, however, capture the total
29 See for example: Juha Joenväärä, Robert Kosowski, and Pekka Tolonen, “Hedge Fund Performance: What Do We Know?” SSRN working paper, March 2016.

17
universe of hedge funds.30 Hence, we almost surely do not capture the entire population of diverse-owned hedge funds in our study. Although it would be preferable to combine multiple hedge fund databases for this analysis, we use the HFR database exclusively because it provides identifiers for diverse-owned firms. To our knowledge, no other hedge fund database provides similar data on diverse ownership. We make several adjustments to prepare HFR data for analysis:
• HFR separates fund characteristics, performance, and assets into active and dead databases, with funds grouped by their reporting status. We utilize data for both active and dead funds when examining trends and evaluating fund performance.
• When analyzing the current state of hedge fund diversity, we only include active funds and exclude any funds that are no longer reporting.
• We restrict our sample to U.S.-based firms (including U.S. territories). • While all firms are U.S.-based, some report assets denominated in foreign currencies.
Assets denominated in foreign currencies are converted to USD based on monthly exchange rates provided by S&P Capital IQ.
• Because most diverse firms are classified as majority-diverse-owned and few firms are classified as substantially-diverse-owned, we combine substantial and majority categories to create one variable to denote women ownership and one variable to denote minority ownership for a number of the analyses.
• While the current state analysis relies on the most recently reported fund AUM value, trends are constructed using monthly assets. Reporting of monthly assets is more limited compared to the coverage of most recently reported AUM.
• The fund characteristics and diversity data are merged with the monthly assets data. For a fund to be included in the trends analysis, it must have data available on its characteristics (e.g., industry focus, manager location, AUM, etc.), the diversity of its ownership, and its assets in a given month.
• Similarly, for a fund to be included in the performance analysis, it must have data available on its characteristics, the diversity of its ownership, and monthly performance. For this analysis, we rely on self-reported monthly returns data.
In addition to analyzing the data by diverse group, the HFR database allows us to investigate other demographic breakdowns for the current state of diversity analysis. These breakdowns include regional investment focus, manager location, and fund strategy:
• Regional investment focus has three categories––North American, Global, and Other––based on where the manager targets investments. 31
• We group firms into four U.S. regions by manager location using the same definitions as for mutual funds: Northeast, South, Midwest, and West.
30 See, for example: (1) Andrew J. Patton, Tarun Ramadorai, and Michael Streatfield, “Change You Can Believe In? Hedge Fund Data Revisions,” SSRN working paper, March 2013; (2) Juha Joenväärä, Robert Kosowski, and Pekka Tolonen, “Hedge Fund Performance: What Do We Know?” SSRN working paper, March 2016. 31 “Other” focus category includes funds targeting: Latin America, Asia, Europe, the Middle East, Emerging Markets, or Pan-American investments.

18
• Fund strategies include equity hedge, event driven, fund of funds, macro, relative value, and other. 32
In this analysis, we do not consider funds of hedge funds since they typically have a distinct structure, size, fee arrangement, and performance profile compared to direct investments. In addition, any AUM with FoFs will be double counted if the sub-fund investments are also in the dataset. This could overstate the amount of capital in the industry and skew the results, misrepresenting the AUM allocated to diverse versus non-diverse firms. For these reasons, we drop any observations that list FoF as the strategy type. Private Equity and Real Estate Our research on PE and real estate managers relies on data from Preqin, a commercial data provider for the alternative asset industry. Preqin is among the top sources of data for the alternative assets industry and is one of the two databases most often used in PE research.33 Preqin’s databases provide access to a number of variables of interest and boast coverage over a relatively long time period, with particularly strong coverage from 2000 onward. In addition, Preqin identifies diverse ownership for PE and real estate firms listed in its databases. It should be noted, however, that data collection on diversity is a recent development. As a result, we cannot guarantee that our study has identified every diverse-owned PE or real estate manager. Nevertheless, we supplement Preqin’s diversity identifies with our own hand-compiled lists of diverse asset managers. These lists were gathered by searching through publicly available records from pension funds, government agencies, and non-profit organizations. The table below summarizes the public sources for lists of diverse-owned PE and real estate firms.
Source Asset Class Association of Black Foundation Executives (ABFE) Directory of Minority and Women-Owned Investment Management Firms
Private Equity, Real Estate
Dow Jones Private Equity Analyst Report, 2012 Private Equity Illinois Municipal Retirement Fund Private Equity,
Real Estate Maryland Governor's Office of Minority Affairs
Private Equity
Office of the New York State Comptroller Private Equity, Real Estate
The lists of diverse PE and real estate firms from the sources above were matched to demographic and fundraising data from Preqin based on firm name. The final list of diverse managers with accompanying data in Preqin comprises 146 women-owned and 106 minority-owned PE firms and 17 women-owned and 21 minority-owned real estate firms. We make a
32 “Other” strategy category includes blockchain, and risk-party funds. 33 Robinson, David and Berk Sensoy, “Private Equity in the 21st Century: Liquidity, Cash Flows, and Performance 1984-2010,” NBER Working Paper, July 15, 2011.

19
number of adjustments to both the PE and real estate databases from Preqin before merging them with our list of diverse-owned firms:
• Funds of funds are dropped from our datasets, for the reasons discussed in previous sections.
• Managers based outside the U.S. are dropped. • For PE and real estate, the data are limited to funds with vintage years 2006 to 2017,
allowing us to construct a sample of funds that should be currently operating based on the typical life of funds with a limited partnership structure.
• Regional locations of firms are assigned based on the associated office address and follow the same state/territory groupings as in the hedge fund analysis.
• The AUM for each firm is calculated as the sum of the final size for each of a firm’s funds raised from January 2006 through December 2017. Fund size and firm AUM calculations are reported in 2009 U.S. dollars.
• For the PE database, Preqin classifies fund types into a number of different categories. We regroup these funds into three broad groups: PE, VC, and real estate.34 To avoid double counting, we drop all PE funds categorized as real estate, as each of these funds is also listed in the real estate database.
Because PE and real estate funds generally do not report intermediate valuations in Preqin, the timeline analyses include the number of funds closed each year and their AUM. For our PE performance analysis, we use net multiples and net IRRs, sourced from Preqin’s database, as our outcome variables. It should be noted that more funds report net multiples than net IRRs. Hence, our preferred specifications use net multiples. Similarly, for real estate funds, we use multiples and net IRRs from Preqin’s database. The final analysis examines the institutional investors in PE firms. Because of the small sample size of real estate funds, we only consider PE for this analysis. For each diverse PE firm, we obtain the names of limited partners (LPs) from Preqin and classify them into several investor types. Gathering data in this way is prohibitively time-intensive for all firms in our dataset. Therefore, we take a random sample of 100 PE firms from the dataset and store the names and types of LPs associated with each firm. Although most firms in our random sample have data on institutional investors, firms without Preqin investor data are dropped and replaced by firms with LP data to avoid a downward bias in investor counts. It is important to note two potential issues with the data used in the analysis of institutional investor types for PE firms. First, the coverage of LPs in the Preqin investor database is not as comprehensive as many of its other fund characteristic variables. Small, private LPs may be underrepresented in these data, as they may have less stringent reporting requirements than large
34 PE includes Buyout, Growth, Mezzanine, Co-Investment Multi-Manager, Co-Investment, Balanced, Direct Secondaries, Distressed Debt, Hybrid, PIPE, Natural Resources, Timber, Special Situations, Turnaround, Secondaries, Infrastructure, Infrastructure Fund of Funds, Infrastructure Secondaries, Fund of Funds, and Hybrid Fund of Funds. VC includes Early Stage, Early Stage: Seed, Early Stage: Start-Up, Expansion/Late State, Venture (General), and Venture Debt. Real Estate includes Real Asset, Real Asset Fund of Funds, Real Estate, Real Estate Co-Investment, Real Estate Fund of Funds, and Real Estate Secondaries.

20
public LPs. Second, we do not know how large the commitment sizes are in each LP/investor pair. Because of these data limitations, the results for this section should be interpreted cautiously. General Data Limitations At this point, it is worth mentioning several of the data limitations and potential biases that may be present in our databases. The first, backfill bias, occurs when a fund starts contributing to a database and reports its past performance.35 Only funds with strong historical performance have incentives to report retroactive data. Sometimes, a firm will have multiple funds and will selectively report only the funds with strong returns. Therefore, “backfilling” will overstate the overall level of performance in the database and will make it look as though most funds perform very well in their early years. Survivorship bias is another well-documented bias in commercial databases and occurs when lower performing funds are abandoned by the asset management firm, leaving only high performing funds.36 As a result, the overall level of performance is biased upwards by the “survivors” that remain in the database. Furthermore, data providers rely largely on voluntary reporting by the funds, and there are a number of factors that may influence a fund’s decision to contribute data to a provider. For example, funds that underperform have less incentive to make their performance data public, which biases the overall level of performance upward in most databases. Similarly, funds that are accepting new capital or firms that are raising a new fund may report data as a way of advertising, particularly if recent performance has been strong. Anecdotally, however, some of the top hedge funds that are closed to new assets will not bother reporting to databases. Finally, biases can result from the burden of reporting. There are a number of commercial databases for each asset class, and many small firms may not have the resources to report to all of them. Most databases do not represent the full universe of funds, and they may be biased toward larger firms. Despite these data concerns, we accept the data sources as given. Throughout this report, we acknowledge the flaws in the data and, where possible, provide robustness checks to mitigate concerns of these data biases influencing the report’s primary findings. IV. Methodology and Results Industry Employment
To begin, we examine secular trends in diverse employment using data from the EEOC, which collect aggregate employment totals for the financial industry since 2004. Because ownership is not equivalent to employment, it is possible that diverse ownership could increase while diverse
35 Mila Getmansky, Peter A. Lee, and Andrew W. Lo, “Hedge Funds: A Dynamic Industry in Transition,” working paper, July 28, 2015. 36 Rajesh K. Aggarwal and Philippe Jorion, “Hidden Survivorship in Hedge Fund Returns,” Financial Analysts Journal 66(2): 69-74, March 2010.

21
employment falls. Consequently, a thorough analysis of employment trends is an important component of our study. To proxy for the U.S. asset management industry, we aggregate employment totals across three relevant industries: Portfolio Management, Open-End Investment Funds, and Other Financial Vehicles. As discussed in the Data section, starting in 2007, the “Officials & Managers” job category was divided into two groups: “Executive/Senior Level Officials & Managers” and “First/Mid-Level Officials & Managers.” We consider two job categories for this analysis: one that looks at just the senior level executives since 2007 and one that examines the group of all officials and managers. The second category is calculated by adding the two officials and managers groups in years since 2007. The data for minorities as a percentage of senior executives show a different trend. Since 2008, minority representation in senior executive positions has shown a slight upward trend through 2015, increasing from 8% to 12%. This trend is mirrored in the representation of minorities in the group of all officials and managers, which has increased in the decade between 2004 and 2015. These trends are shown in Figure 2. Our discussion of aggregate employment data offers some insight into the general trends of the industry. We should note, however, that diversity among executives tends to be higher than the levels of diverse ownership in the asset management industry presented in the remainder of our study. Figure 1 shows women executives as a percentage of all industry executives. Since data collection began for senior executives, the representation of women in senior executive positions has stagnated at just above 20%. The exception to this trend is between years 2007 and 2008, where there is a sharp decrease in the participation of women in senior executive positions. While this could be an effect of the Great Recession, it could also be a data quality issue, as 2007 was the first year of the manager breakdown into two categories. For all officials and managers, we use data on gender diversity going back to 2004. The representation of

22
women among all officials and managers shows a steady decline between 2004 and 2015, starting at 38% and ending at 30%. The data for minorities as a percentage of senior executives show a different trend. Since 2008, minority representation in senior executive positions has shown a slight upward trend through 2015, increasing from 8% to 12%. This trend is mirrored in the representation of minorities in the group of all officials and managers, which has increased in the decade between 2004 and 2015. These trends are shown in Figure 2. Our discussion of aggregate employment data offers some insight into the general trends of the industry. We should note, however, that diversity among executives tends to be higher than the levels of diverse ownership in the asset management industry presented in the remainder of our study. Figure 1. Representation of women as a percentage of total employment in each job category.

23
Figure 2. Representation of minorities as a percentage of total employment in each job category.
0%
10%
20%
30%
40%
2004 2005 2006 2007 2008 2009 2010 2011 2012 2013 2014 2015
Women Executives (%)Portfolio Management, Open-End Investment Funds, Other Financial Vehicles
All Officials & Managers Senior Executives
0%
5%
10%
15%
20%
2004 2005 2006 2007 2008 2009 2010 2011 2012 2013 2014 2015
Minority Executives (%)Portfolio Management, Open-End Investment Funds, Other Financial Vehicles
All Officials & Managers Senior Executives

24
Mutual Funds Summary: For mutual funds, we use historical data from eVestment to identify women- and minority-owned firms for every quarter from Q1 2011 through Q4 2017. We find that diverse firms are underrepresented, with women- and minority-owned firms representing 10% and 8.7% of all mutual funds. To examine performance, we estimate various regression models to quantify the relationship between diverse ownership and fund returns. The evidence suggests that the performance of diverse firms is not significantly different from the performance of non-diverse firms, after controlling for relevant variables. A separate look at performance shows that many diverse-owned funds achieve top quartile returns. On average, 26% and 29% of women- and minority-owned funds rank in the top quartile each quarter. Using data from Q4 2017, we also examine the mix of institutional investor types associated with diverse firms and non-diverse firms. We find that investments from public funds make up a larger share of assets for average women-owned and minority-owned funds. Similarly, foundations, endowments, high net worth individuals, and family offices are proportionally more invested in diverse-owned funds compared to non-diverse funds.
Current State of Diverse Ownership for Mutual Funds Mutual funds are professionally managed investment vehicles that typically invest in publicly traded securities. In the U.S., many relatively small investors use mutual funds as a means of preserving capital, growing wealth, or saving for retirement. Because of their ubiquity, we begin by examining the current state of diversity for the mutual fund industry using eVestment’s database. Error! Reference source not found., Error! Reference source not found., and Error! Reference source not found. show the number of firms, funds, and AUM of diverse-owned firms relative to the universe of mutual funds.37 We often distinguish between “significant” and “majority” ownership, which allows us to form more nuanced conclusions. “Significant” ownership refers to firms with between 25% and 49% diverse ownership, and “majority” ownership refers to those with between 50% and 100% diverse ownership. We find that diverse-owned firms comprise a small share of all firms and an even smaller fraction of the $51 trillion assets under management (AUM) in US-based mutual funds. Women-owned firms represent 10.0% of all firms, 5.4% of all funds, and just 0.8% of total AUM. Minority-owned firms, which make up 8.7% of firms, 4.0% of funds, and only 0.4% of AUM, have lower representation compared to women-owned firms.
37 All assets under management figures (AUM) are reported in inflation adjusted 2009 U.S. dollars.

25
Figure 3. Diverse mutual fund firms out of 1,366 total firms (totals in parentheses).
Figure 4. Diverse mutual funds out of 11,460 total funds (totals in parentheses).
26
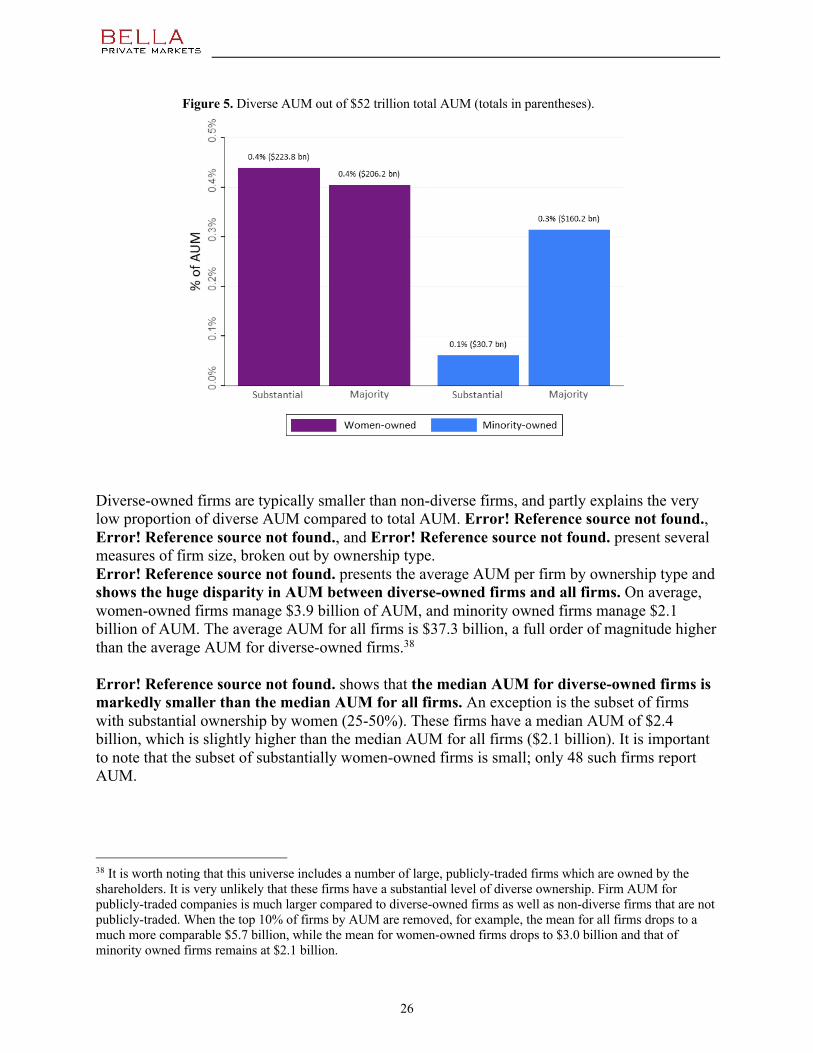
Figure 5. Diverse AUM out of $52 trillion total AUM (totals in parentheses).
Diverse-owned firms are typically smaller than non-diverse firms, and partly explains the very low proportion of diverse AUM compared to total AUM. Error! Reference source not found., Error! Reference source not found., and Error! Reference source not found. present several measures of firm size, broken out by ownership type. Error! Reference source not found. presents the average AUM per firm by ownership type and shows the huge disparity in AUM between diverse-owned firms and all firms. On average, women-owned firms manage $3.9 billion of AUM, and minority owned firms manage $2.1 billion of AUM. The average AUM for all firms is $37.3 billion, a full order of magnitude higher than the average AUM for diverse-owned firms.38 Error! Reference source not found. shows that the median AUM for diverse-owned firms is markedly smaller than the median AUM for all firms. An exception is the subset of firms with substantial ownership by women (25-50%). These firms have a median AUM of $2.4 billion, which is slightly higher than the median AUM for all firms ($2.1 billion). It is important to note that the subset of substantially women-owned firms is small; only 48 such firms report AUM.
38 It is worth noting that this universe includes a number of large, publicly-traded firms which are owned by the shareholders. It is very unlikely that these firms have a substantial level of diverse ownership. Firm AUM for publicly-traded companies is much larger compared to diverse-owned firms as well as non-diverse firms that are not publicly-traded. When the top 10% of firms by AUM are removed, for example, the mean for all firms drops to a much more comparable $5.7 billion, while the mean for women-owned firms drops to $3.0 billion and that of minority owned firms remains at $2.1 billion.

27
Figure 6. Average firm AUM by ownership type (billions of 2009 USD).
Figure 7. Median firm AUM by ownership type (billions of 2009 USD).
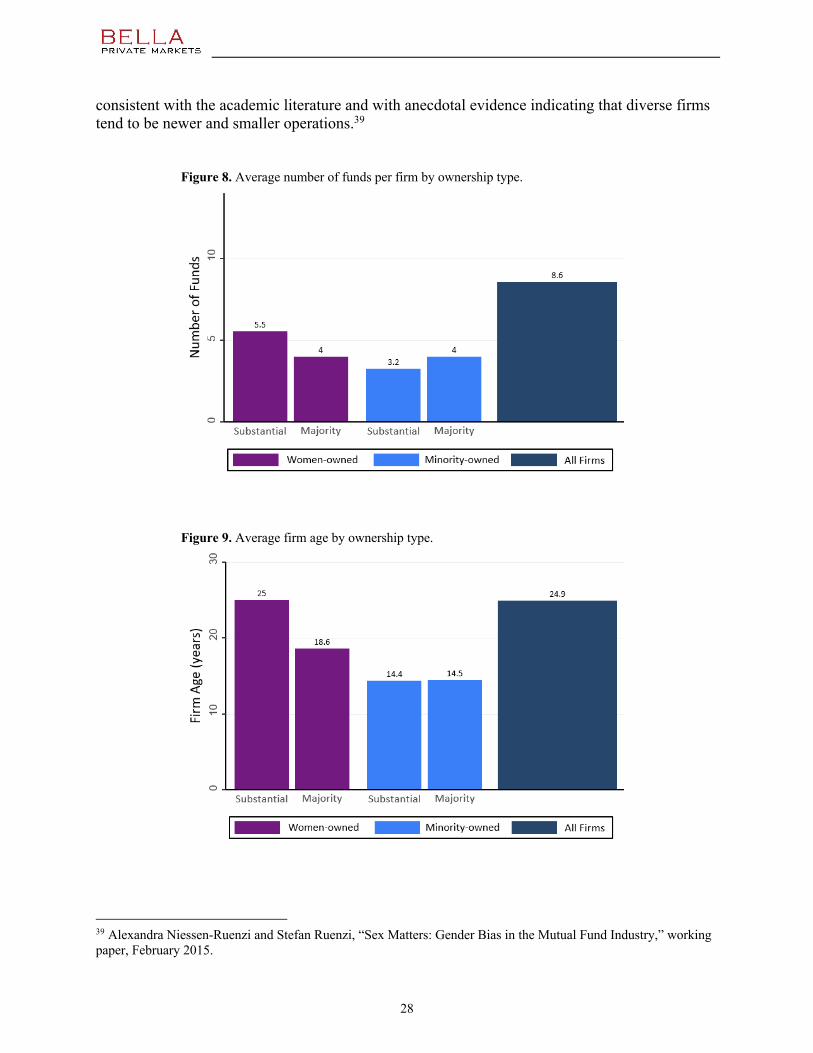
In addition, Figure 8 shows that, on average, diverse firms manage fewer funds. We also find that diverse firms tend to be younger relative to all firms. Figure 9 shows that minority-owned firms are the youngest. Again, we see that firms with substantial women ownership are the exception, as they are similar to all firms. Overall, these results for mutual funds are
28
consistent with the academic literature and with anecdotal evidence indicating that diverse firms tend to be newer and smaller operations.39
Figure 8. Average number of funds per firm by ownership type.
Figure 9. Average firm age by ownership type.
39 Alexandra Niessen-Ruenzi and Stefan Ruenzi, “Sex Matters: Gender Bias in the Mutual Fund Industry,” working paper, February 2015.

29
We also examine the distribution of firms by location to see if diverse firms are concentrated in particular regions. Error! Reference source not found. shows the representation of diverse firms as shares of total firms in each region. Diverse firms are best represented in the West, where women-owned and minority-owned firms each comprise 13% of all firms. While the Northeast has the greatest number of diverse firms (n = 47 women-owned firms; 41 minority-owned firms), they represent a smaller share of all firms in the region. Similarly, Error! Reference source not found. shows representation using AUM. By this measure, the West has the greatest amount of diverse AUM in absolute terms (owing mostly to women-owned firms), whereas the South has the highest representation relative to the region’s AUM.
Figure 10. Diverse mutual fund firms by region as a percentage of all regional firms.

30
Figure 11. Diverse mutual fund AUM by region as a percentage of region’s total AUM.
Next, we look at how women-owned and minority-owned firms are distributed across fund-level characteristics. Mutual funds can be further classified by the sub-asset classes of equity, fixed income and balanced/multi-asset. Figure 12 and Figure 13 examine how diverse-owned firms are distributed within each sub-asset class. Figure 12 presents the sub-asset shares by fund count. Whereas equity and fixed income funds have a fairly similar composition in term of diverse-owned funds, balanced/multi-asset funds are far less likely to be women-owned or minority-owned. Women-owned firms are best represented in equity, where they make up 6.5% of funds, followed by fixed income (4.7%), and balanced/multi-asset funds (2.7%). Similarly, minority-owned funds make up 5.3% of equity funds, 2.7% of fixed income funds and just 1.0% of balanced/multi-asset funds. Looking at the picture in terms of AUM, we see a similar story, with one anomaly. We once more see that minority-owned funds are best represented in equity, with 0.7% of AUM, followed by fixed income (0.3%) and balanced/multi-asset (0.03%). However, women-owned funds are now best represented in fixed income funds, making up 2.4% of total AUM.40 Equity funds have 1.2% of AUM owned by women, followed by balanced/multi-asset (0.3%).
40 However, it should be noted that this is due to one firm which makes up over 73% of total women-owned AUM in fixed income funds. Were it not for this, the pattern in Figure 12 would repeat here.

31
Figure 12. Diverse mutual funds as percentage of total funds in sub-asset class.
Figure 13. Diverse mutual fund AUM as percentage of sub-asset class AUM.
The main strategies for mutual funds are core, growth, passive index, and value. We look at the distribution of ownership for the funds following each of these strategies, first by number of funds (Error! Reference source not found.) and then by AUM (Error! Reference source not found.). Both women-owned and minority-owned firms are best represented by growth (7.3% and 6.0% respectively), followed by core (6.8% and 5.4%), value (6.3% and 4.9%), and lastly passive index (5.7% and 2.5%). Looking at AUM, women-owned funds are now best represented

32
in core (1.6%), followed by growth (1.2%), value (1.1%) and finally passive index (0.6%). Minority-owned funds are most likely to be found in growth (1.1%), followed by core (0.8%), value (0.7%) and passive index (0.1%). Because of the economies of scale associated with setting up a passive index strategy, small firms may not have the resources to offer these products.41 Since diverse-owned funds are usually smaller than average, this may explain why diverse-owned funds are under-represented in passive index funds, in terms of the number of funds and AUM. Figure 14. Diverse mutual funds as percentages of total funds in strategy.
41 Hortense Bioy, Jose Garcia-Zarate, Caroline Gutman, Kenneth Lamont, and Gordon Rose, “A Guided Tour of the European ETF Marketplace,” online report for Morningstar, November 2014.

33
Figure 15. Diverse mutual fund AUM as percentage of total AUM in strategy.
The final characteristic we examine for mutual funds is geographic investment focus. We find that 63% of funds in our dataset are focused on U.S. investments, which is unsurprising as we only look at U.S.-headquartered funds. Figure 16 shows that U.S. focused funds and funds focused on “other” regions (such as emerging markets, or EAFE42 countries) have a similar degree of female ownership: 6.2% and 5.6%, respectively. Minority-owned firms on the other hand, have a notably higher degree of representation in funds focused on “other” regions – 7.2%, compared to 3.9% of U.S. focused funds. “Global” focused firms exhibit the lowest degree of women-ownership and minority-ownership at 3.2% and 2.1%. Error! Reference source not found. tells a similar story, with women-owned funds similarly represented across U.S. focused funds and “other” focused funds, and a markedly high degree of minority-ownership in funds focused on “other” regions.
42 Europe, Australasia and Far East

34
Figure 16. Diverse mutual funds as percentages of total funds in geographic focus.
Figure 17. Diverse mutual fund AUM as percentage of total AUM in geographic focus.
The results above demonstrate that diverse and non-diverse firms differ in a number of ways. It is clear that the level of ownership, whether substantial or majority, is related to a number of asset manager characteristics. Our findings suggest that it will be important to control for differences in ownership levels in our performance regressions.

35
Timeline of Diverse Ownership for Mutual Funds Next, we examine how diverse representation in the mutual fund industry may have changed over time. First, we identify firms with women ownership (25%+) or minority ownership (25%+) for each quarter from Q1 2011 through Q4 2017. Next, we calculate the proportion of diverse-owned firms, diverse-owned funds, and diverse-owned AUM compared to the industry totals in each quarter. Figure 18, Figure 19, and Figure 20 show the representation over time of diverse firms, funds, and AUM.
Firm Count: In Figure 18, minority-owned firms comprise 6.9% to 8.7% of all firms in each quarter. The representation of minority firms increases over the period, from 7.6% of firms in Q1 2011 to 8.7% of all firms in Q4 2017. Women-owned firms make up 9.0% to 11.6% of all firms in any given quarter; representation of women firms decreases slightly over the period, from 11.6% of firms to 10.6% of firms. Figure 18. Timeline of diverse-owned mutual fund management firms.
Fund Count: As shown in Figure 19, the total representation of diverse-owned funds is lower than the representation of diverse-owned firms. This finding is consistent with the current state of diversity (as of Q4 2017), which shows that diverse-owned firms tend to be smaller operations

36
with fewer funds and lower AUM. Funds with women ownership represent 4.7% to 5.8% of all funds in a given quarter, while funds with minority ownership comprise 3.5% to 4.3% of the total. Similar to the firm analysis, we also show fluctuations in fund shares over time. Over the entire period, both the women- and minority-owned categories stay nearly constant in proportion to all funds (5.3% to 5.2% for women-owned firms; 3.94% to 3.90% for minority-owned firms). Figure 19. Timeline of mutual funds managed by diverse-owned firms.
AUM: Using AUM, we find that diverse-owned firms represent a very small fraction of total AUM each quarter ( Figure 20). Women-owned firms comprise between 0.8% and 1.1% of total AUM by quarter, while minority-owned firms comprise 0.4% to 1.0% of AUM per quarter. These changes are associated with fairly large swings in assets from quarter to quarter. During this period, the amount of AUM ( Figure 21) managed by women-owned firms is $271 billion at the minimum in Q3 2011 and $430 billion at the maximum in Q4 2017. AUM for minority-owned firms ranges from a low of $174 billion in Q2 2017 to a high of $365 billion in Q2 2015. The proportion of AUM managed by women-owned funds decreases slightly between the beginning and end of the period (1.0% to 0.8% of total AUM). However, the amount of AUM managed by women-owned firms increases from $313 billion in Q1 2011 to $430 billion in Q4 2017. For minority-owned firms, the proportion of AUM and amount of AUM decrease over this period (0.9% to 0.4% of total AUM; $294 billion to $191 billion AUM). In summary,

37
Figure 18 and Figure 19 show that minority-owned firms and fund shares are relatively stable compared to AUM. On the other hand, there is some evidence that diverse representation, as measured by AUM, may be declining in recent years. We should note that the exit of a large minority-owned firm or fund could produce a large drop in AUM with minority-owned firms. In the data, we would see an “exit” for multiple reasons: (1) a change in ownership so that a firm no longer meets the threshold for diverse ownership – this would include scenarios where a firm successfully grows and non-diverse individuals are added to the ownership group; (2) a firm shuts down and stops reporting to the database; or (3) a firm is still active but stops reporting to the database. Figure 20. Timeline of the proportion of mutual fund AUM by diverse ownership type.

38
Figure 21. Timeline of AUM (USD billion) managed by diverse-owned mutual fund management firms.
Performance of Diverse-Owned Mutual Funds In this section, we use regression analysis to examine the performance of diverse-owned mutual funds. In particular, we estimate the effects of women- and minority-ownership on fund performance, after controlling for relevant fund characteristics. In our sample, we restrict our observations to firms that provide responses on the percentage of diverse ownership for at least one of the following groups in eVestment: Woman, African-American, Asian, Hispanic, and All Minority (which considers both women and racial/ethnic minority ownership together). Next, we create indicator variables for women-owned firms (25%+) and minority-owned firms (25%+) for each quarter. In separate specifications, we look at substantial ownership (25-49%) and majority ownership (50%+).43
43 If percent women ownership is missing but minority ownership is non-missing, then we assume the firm does not fall into the substantial- or majority-women-ownership categories. We make the same assumption for firms with missing values for percent minority ownership but non-missing values for women ownership. As stated above, firms must have non-missing values for either the percent women ownership or percent minority ownership to be included in the main regressions. We also perform robustness checks where we include the firms that do not report any diversity data. We assume that these firms with missing data for women and minority ownership are non-diverse in this robustness check regression (i.e., do not have substantial levels of either women ownership or minority ownership).

39
To measure performance, we use fund-level quarterly returns data from eVestment for Q1 2011 through Q4 2017. In addition to unadjusted quarterly returns, we compute market-adjusted returns and estimate regressions using these market-adjusted returns as the dependent variable. Market-adjusted returns capture the excess returns on an investment above the expected return (i.e., the predicted return, based on that fund’s risk, the market return, and the risk-free rate), given the risk-free rate and level of risk (beta) associated with the investment type.44 These metrics—returns and market-adjusted returns—treat every fund-quarter observation equally. In addition, we examine returns and market-adjusted returns where observations are weighted by the lagged fund AUM. We first look at the differences between diverse-owned funds and non-diverse-owned funds for each performance metric without controlling for any other variables. Table A in the Appendix presents average quarterly performance by diversity status. Specifically, we compute simple averages across fund-quarter observations for each ownership category. In terms of quarterly returns, the diverse-ownership categories do not show any significant difference in average performance compared to the average for all funds. For market-adjusted returns, we find that women-owned and minority-owned funds slightly underperform. For capital-weighted returns, we find that funds managed by minority-owned firms outperform, while funds managed by women-owned firms underperform. For market-adjusted returns (equal-weighted and capital-weighted), we find that women-owned and minority-owned funds slightly underperform, on average. Note that statistics in Table A rely on returns data from multiple years and for mutual funds where the underlying assets may be public equity, fixed income, or balanced/multi-asset. These averages do not control for any variables that may be related to performance, such as quarter or sub-asset class, and therefore, do not isolate the true effect of diverse ownership. These summary statistics are intended to provide an overview of the performance data for mutual funds. Next, we perform regressions of each performance measure and control for a number of relevant firm and fund characteristics. Several studies indicate that firm and fund size are linked with performance.45 Therefore, we control for fund and firm assets from the previous quarter.46 Since
44 Market-adjusted returns are calculated as the difference between actual quarterly returns and expected quarterly returns. Actual quarterly returns for each fund come from eVestment. We use the capital asset pricing model (CAPM) to calculate the expected return for each fund for each quarter: !(#) = #! + ((#" − #!) where !(#) is the expected return, #! is the risk-free rate, #" is the market return, and ( is the beta measure of volatility. For the risk-free rate, we use quarterly averages of the U.S. 3-month Treasury bill rate, provided by the U.S. Federal Reserve. Quarterly index returns are specific to asset class: (1) S&P 500 index returns for equity; (2) Barclays U.S. Aggregate index returns for fixed income; (3) weighted average (60%/40%) of S&P500 index returns and Barclays U.S. Aggregate index returns for balanced/multi-asset funds. The latter mimics a “normal” balanced fund, as opposed to “aggressive” or “conservative” funds which may be weighted more towards equity or fixed income assets, respectively (See, for example, Andrea Frazzini and Lasse Heje Pedersen, “Betting Against Beta,” Journal of Financial Economics 111(1): 1-25, January 2014). Beta values are calculated using the same asset-class specific indices. (For calculation of betas, see footnote 51 below.) 45 See for example: (1) Joseph Chen, Harrison Hong, Ming Huang, Jeffery D. Kubik, “Does Fund Size Erode Mutual Fund Performance? The Role of Liquidity and Organization,” The American Economic Review 94(5): 1276-1302, December 2004. (2) John A. Haslem, H. Kent Baker, David M. Smith, “Performance and Characteristics of Actively Managed Retail Mutual Funds with Diverse Expense Ratios,” SSRN working paper, July 2008. 46 We use log-transformed AUM.
40
different fund types are associated with different performance and risk profiles, all regressions contain fixed effects (FE) for asset class (e.g., equity, fixed income, and balanced/multi-asset), strategy (e.g., core, growth, value, and passive index), and regional focus (e.g., U.S., Europe, Asia, Africa, Latin America, and Global). To control for market fluctuations, we include quarter fixed effects, and most specifications also include quarter-asset class fixed effects, since certain fund types may perform better under different market conditions. Alternative specifications control directly for beta (a measure of fund volatility)47 and survivorship (whether the fund was still active as of Q4 2017). To briefly summarize our approach, we estimate a series of six regressions that quantify the effect of diverse ownership on performance and test the robustness of our findings:
1. Base Regression. In this base model, we examine the effect of women and minority ownership on unadjusted quarterly returns, controlling for fund assets (lagged one quarter), firm assets (lagged one quarter), and fixed effects for several fund characteristics.
2. Base Regression with Additional Controls. This model expands the Base Regression by adding beta (a measure of volatility) and a variable to indicate whether the fund is active.
3. Market-Adjusted Regression. This regression is similar to the Base Regression with Additional Controls, using market-adjusted quarterly returns as the dependent variable. Since the calculation of market-adjusted returns incorporates beta directly, this specification excludes beta as an explanatory variable.
4. Capital-Weighted Regression. This version of the Base Regression weights observations by lagged fund assets. For this reason, we exclude lagged fund assets as an explanatory variable.
5. Capital-Weighted Regression with Additional Controls. This model is the same as the Base Regression with Additional Controls, except that observations are weighted by lagged fund assets. Again, we exclude lagged fund assets as an explanatory variable, since it is used for the weighting.
6. Capital-Weighted Market-Adjusted Regression. This model is the capital-weighted version of the Market-Adjusted Regression, where observations are weighted by lagged fund assets.
47 Betas are calculated as the correlation between a fund’s quarterly returns and the returns of the index for the same time period. For equity funds and fixed income funds, we use S&P 500 index returns and Barclays Aggregate U.S. index returns, respectively, as the indices for calculating beta. For balanced/multi-asset funds, we use a weighted average of 60% S&P 500 index and 40% Barclays U.S. Aggregate index. For each quarter-fund observation, we calculate a 12-quarter rolling beta using the funds’ actual quarterly returns and the asset-class-specific index returns for the past three years.

41
This set of six regressions is estimated twice, first using indicators for all women- and minority-owned firms (25%+ ownership) and then with separate indicators for substantial (25-49%) and majority (50%+) ownership. Output from these sets of regressions can be found in Tables B and C of the Appendix. We find that larger firms are generally associated with higher returns, though this effect is not significant in regressions of market-adjusted returns. Furthermore, smaller funds are similarly associated with higher returns. In terms of asset class, compared to balanced/multi-asset products, equity products typically exhibit higher returns (equally-weighted and capital-weighted). Fixed income products on the other hand display lower returns compared to balanced/multi-asset, except in the market-adjusted specifications where they show slightly higher returns. We find that higher beta values are associate d with higher returns. We also find that active funds tend to see significantly higher returns. The indicators for firms with 25%+ women ownership and 25%+ minority ownership are insignificant for every specification in Table B. Further, all other regressions in Table B do not show any performance difference between women-owned firms and non-women-owned firms. Table C tells a similar story, looking separately at substantially- and majority-women-owned firms and substantially- and majority-minority-owned firms. In most specifications, we find no significant differences in performance between diverse-owned firms and non-diverse firms, with only two exceptions. The coefficient for substantially minority-owned firms in the capital-weighted regressions (with and without controls) are positive and significant at the 10% level. Taken as a whole, there is little evidence that women- or minority-ownership affects fund performance. We perform a number of robustness checks that substantiate our findings. First, we re-estimate all regressions, but include firms without data on diverse ownership. We assume that these firms do not belong to any diverse category. Second, we estimate the same models using just the subset of equity and balanced/multi-asset funds, to see if the inclusion of fixed income products is driving the results. Third, we include firm age as an explanatory variable since diverse firms tend to be younger, and firm age may be correlated with survival, capital inflows, and performance. Finally, we drop the top 5% largest firms from the dataset to diminish the influence of large, publicly-traded companies, and we re-estimate the regression models.48 The results from each robustness check are generally consistent with the initial analysis, pointing to similar performance between diverse and non-diverse firms. While the regression results don’t provide evidence for a difference in average performance between diverse and non-diverse firms (after controlling for many relevant factors), we are also interested in those firms with above-average returns. In particular, how many women- and minority-owned funds have top-quartile performance? For this analysis, we find the proportions of women- and minority-owned mutual funds with top-quartile returns for each quarter, and we
48 Unfortunately, we could not identify the subset of privately-held companies in a systematic way without dropping a large number of relevant observations. Therefore, we use firm size as a proxy for public ownership and exclude the top 5% largest firms.
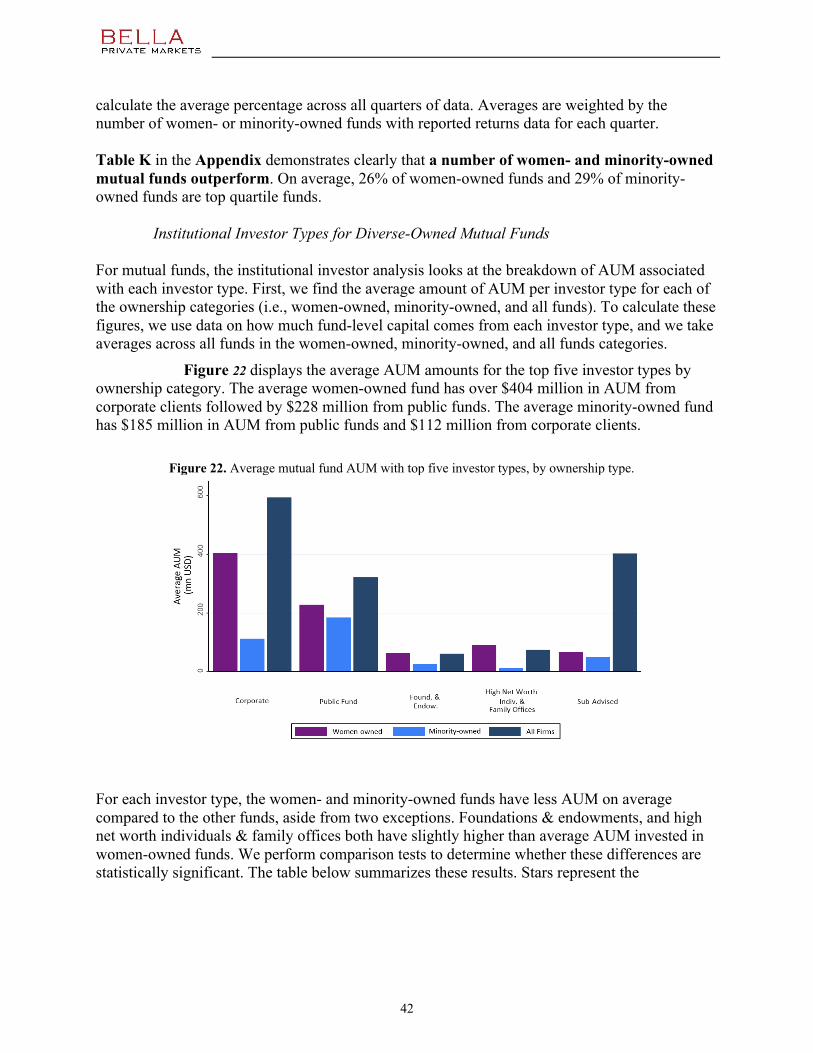
42
calculate the average percentage across all quarters of data. Averages are weighted by the number of women- or minority-owned funds with reported returns data for each quarter. Table K in the Appendix demonstrates clearly that a number of women- and minority-owned mutual funds outperform. On average, 26% of women-owned funds and 29% of minority-owned funds are top quartile funds.
Institutional Investor Types for Diverse-Owned Mutual Funds For mutual funds, the institutional investor analysis looks at the breakdown of AUM associated with each investor type. First, we find the average amount of AUM per investor type for each of the ownership categories (i.e., women-owned, minority-owned, and all funds). To calculate these figures, we use data on how much fund-level capital comes from each investor type, and we take averages across all funds in the women-owned, minority-owned, and all funds categories. Figure 22 displays the average AUM amounts for the top five investor types by ownership category. The average women-owned fund has over $404 million in AUM from corporate clients followed by $228 million from public funds. The average minority-owned fund has $185 million in AUM from public funds and $112 million from corporate clients. Figure 22. Average mutual fund AUM with top five investor types, by ownership type.
For each investor type, the women- and minority-owned funds have less AUM on average compared to the other funds, aside from two exceptions. Foundations & endowments, and high net worth individuals & family offices both have slightly higher than average AUM invested in women-owned funds. We perform comparison tests to determine whether these differences are statistically significant. The table below summarizes these results. Stars represent the

43
significance level for the comparison of women- or minority-owned averages to the averages for all funds.49
Corporate
Clients Public Funds
Foundations &
Endowments
High Net Worth Individuals & Family Offices
Sub-Advised Funds
Women-Owned Funds $404.3 mn $228.2 mn** $64.2 mn $91.2 mn $68.0 mn***
Minority-Owned Funds $112.0 mn*** $185.1 mn*** $27.3 mn*** $12.9 mn*** $50.0 mn***
All Funds $593.0 mn $321.4 mn $61.0 mn $75.8 mn $403.0 mn
Minority-owned funds in particular have significantly less AUM for each investor type, on average, compared to the universe of all funds. We find the difference between amounts invested in women-own funds and all funds to be significant only for public funds and sub-advised funds. Women have significantly lower AUM for these investor types. The amount of fund AUM for each ownership type is closely tied to the size of the fund. These differences between diverse and non-diverse funds, then, can be explained by the fact that women- and minority-owned funds are typically smaller. Because of this, we also look at the average representation of investor types within a fund. For each fund, we calculate the ratio of AUM from each investor type compared to the fund’s total AUM. For example, suppose Mutual Fund A has $500 million in AUM with $250 million from corporate investors, $125 million from a public fund, and $125 million from an endowment. The distribution of AUM distribution for Mutual Fund A is 50% corporate, 25% public funds, and 25% foundations and endowments. We calculate these distributions for each fund, and we find the average percentage representation for each investor type for women-owned funds, minority-owned funds, and all funds. Figure 23 shows the representation of investor types for each ownership type. Public fund investments make up 10% of the AUM for other funds, but represent a much greater proportion of AUM for diverse-owned mutual funds. These investments make up 23% of AUM for women-owned funds and 31% of AUM for minority-owned funds, on average. Similarly, investments from foundations & endowments and high net worth individuals & family offices make up a greater fraction of the AUM for women- and minority-owned funds compared to other funds.
49 Number of stars indicates confidence level that the difference is not due to random chance. * = 90% confidence, ** = 95% confidence, *** = 99% confidence.

44
Figure 23. Average percentage of mutual fund AUM with top five investor types, by ownership type.
Again, we perform comparison tests to examine whether the representation of each investor type is statistically different for women- and minority-owned funds compared to all funds. Results from these tests are summarized in the table below, with asterisks representing the level of confidence regarding each comparison test.
Corporate
Clients Public Funds
Foundations &
Endowments
High Net Worth Individuals & Family Offices
Sub-Advised Funds
Women-Owned Funds 12.2%* 22.5%*** 7.5%*** 20.5%** 7.8%***
Minority-Owned Funds 12.7% 31.4%*** 7.1%*** 18.8%*** 6.5%***
All Funds 14.1% 9.9% 3.9% 10.0% 13.3%
The analysis regarding investor type representation shows that public funds, foundations & endowments, and high net worth individuals & family offices make up a significantly greater portion of AUM for women-owned and minority-owned mutual funds. AUM from sub-advised funds represents a significantly lower proportion of AUM for women- and minority-owned mutual funds. Representation of corporate clients is similar across ownership categories, but somewhat less for women, with a degree of significance, compared to all funds.

45
Hedge Funds Summary: We use data from Hedge Fund Research (HFR) to identify women- and minority-owned hedge fund managers. We find that even though diverse representation has increased since January 2010, women- and minority-owned firms remain underrepresented, accounting for 4.6% and 8.9% of firms in the industry. We examine whether diverse-ownership impacts hedge fund performance using a series of six regression models that account for relevant fund characteristics. Overall, we do not find conclusive evidence that women- or minority-owned funds perform differently relative to non-diverse funds. Finally, we find that, on average, 25.6% of women-owned and 28.5% of minority-owned funds achieve top quartile returns.
Current State of Diverse Ownership for Hedge Funds
Hedge funds offer attractive investment opportunities to sophisticated investors. In general, hedge fund investors must be accredited, meaning that they meet a minimum threshold for income or assets.50 Unlike passive mutual funds, hedge funds use active portfolio management in an attempt to achieve above market returns. As a result, they may adopt aggressive strategies and use financial derivatives or leverage to “hedge” against the rise and fall of the public equity market. Given these differences, we assess the current state of diversity for hedge funds as a distinct asset class. Our hedge fund analysis utilizes HFR’s detailed performance, fund, and diversity datasets.51 Our final dataset includes 2,980 firms and 6,932 funds operating between 2005 and 2018. For the current state analysis, we restrict the data to 1,125 active firms and 2,436 active funds reporting assets. The data allow us to classify diverse-owned funds into six distinct groups: substantially women- and minority-owned (25% to 50% diverse ownership); majority women- and minority-owned (50%+ diverse ownership); and women- and minority-owned (25%+ diverse ownership). Using fund characteristics, we divide our observations based on firm and fund location, strategy, and investment focus. We should note that the data do not capture 100% of the hedge fund industry. Therefore, all results should be read as indicative rather than the final word on hedge fund diversity. A more detailed discussion of the data can be found in Data. We find that hedge funds suffer from a lack of diversity at both the firm- and fund-level. Figure 24 indicates that women- and minority-owned firms make up 4.6% and 8.9% of all hedge fund managers. In Figure 25, we find diverse representation to be even lower at the fund-level: approximately 3.4% and 6.1% of funds are women- and minority-owned.
50 See, for example, https://www.investor.gov/introduction-investing/basics/investment-products/hedge-funds. 51 All assets under management (AUM) figures are reported in inflation adjusted 2009 U.S. dollars.

46
Figure 24. Diverse hedge fund firms out of 1,125 total firms (total in parentheses).
Figure 25. Diverse hedge funds out of 2,436 total funds (total in parentheses).
Next, we measure diverse representation using assets under management (AUM). Figure 26 shows that the share of AUM managed by diverse-owned firms is even smaller than the diverse share of total firms. Women-owned firms manage 1.5% of hedge fund AUM, increasing only slightly to 2.7% for minority-owned firms.
0.4% (4)
4.2% (47)
0.6% (7)
8.3% (93)
02
46
8
% o
f All
HF
Firm
s
Substantial Majority Substantial Majority
Women-owned Minority-owned

47
Figure 26. Diverse hedge fund AUM of $1.07 trillion total AUM (total AUM is in parentheses).52
A possible explanation for the low level of diversity, by AUM, is the relatively small scale of diverse firms compared to all funds. Figure 27 displays average AUM for women-owned, minority-owned, and all firms. The average AUM for both women-owned and minority-owned firms, at approximately $290 million and $260 million, is less than a third of the size of the average AUM for all firms. We observe a similar pattern when looking at the median AUM for firms by ownership type, displayed in Figure 28. The median firm size for all firms is $74.9 million. The median minority-owned firm manages $38.1 million worth of assets, while the median women-owned firm manages $25.0 million.
52 Firm-level AUM is calculated by summing all fund-level AUM. This was done because firm-level assets include assets of firms not only operating in the hedge fund sector, such as Blackstone and PIMCO, and firm-level totals grossly overstated the size of hedge fund AUM. The calculated $1.07 trillion AUM is lower than most reported numbers for the hedge fund industry because the public HFR data set is only a sample of the entire industry and does not claim to cover the industry as a whole.
0.04% ($0.4 bn)
1.5% ($16.5 bn)
0.1% ($1.5 bn)
2.6% ($28.4 bn)
0.5
11.
52
2.5
% o
f Tot
al H
F AU
M
Substantial Majority Substantial Majority
Women-owned Minority-owned

48
Figure 27. Average hedge fund AUM by ownership type (millions of 2009 USD).
Figure 28. Median hedge fund AUM by ownership type (millions of 2009 USD).
Another possible explanation for diverse-owned hedge fund underrepresentation rests in the average number of funds each firm raises. Figure 29 shows diverse-owned firms tend to raise fewer funds compared to all firms. An exception is the substantially women-owned population. This finding, however, should be interpreted with caution as there are only four substantially women-owned firms. Further research into why diverse-owned firms manage fewer funds, on average, could yield interesting insights.
$270.9 mn $259.5 mn
$844.9 mn
0
200
400
600
800AU
M (m
illion
s of
200
9 U
SD)
Women-owned Minority-owned All Firms
$25.0 mn
$38.1 mn
$74.9 mn
0
20
40
60
80
AUM
(milli
ons
of 2
009
USD
)
Women-owned Minority-owned All Firms

49
Figure 29. Average number of hedge funds per firm by ownership type.
Next, we discuss hedge fund diversity by location, fund strategy, and geographic focus. For these breakdowns, we combine substantial and majority categories into one category each for women-owned and minority-owned groups.53 While we use firm-level data for manager location, for fund strategy and geographic focus we must use fund-level data, as these two variables may be different for different funds within the same firm. To begin, we explore whether diversity varies based on geographic location and show firm counts and AUM over four regions: Northeast, Midwest, West, and South. Figure 30 indicates that the highest proportion of women- and minority-owned firms, on an absolute and relative basis, is found in the Northeast. There are 31 women-owned firms representing 5.2% of all firms in the region. 65 minority-owned firms represent 10.9% of firms in the Northeast. Overall, the percentage of women-owned firms stays consistent throughout all four regions, ranging from 4.3% to 5.2%. There is greater variance for minority-owned firms, with a range of 7.0% to 10.9%.
53 As defined before, “substantially diverse-owned” requires a firm or fund to be 25% to 50% diverse-owned, and “majority diverse-owned” requires a firm or fund to be 51% or more diverse-owned. Combining the two categories creates the “diverse-owned” category with 25% or more diverse ownership.
2.5
1.6 1.5
1.3
2.2
0
.5
1
1.5
2
2.5AV
G N
umbe
r of F
unds
Per
Firm
Substantial Majority Substantial Majority All Firms
Women-owned Minority-owned All Firms

50
Figure 30. Diverse hedge fund firms by region as a percentage of all regional firms.
Switching to diverse AUM as a percentage of total regional AUM, we find greater differences between regions. As reported in Figure 31, the South shows the highest level of diversity, where women-owned firms manage 2.7% of the total AUM and minority-owned firms manage 4.4%. The Midwest has the lowest women-owned share of AUM at 0.8%. The West shows the lowest minority representation at 1.0%. Looking at total AUM, we find that the Northeast contains the highest value of diverse-owned AUM with $12.3 billion and $23.0 billion for women-owned and minority-owned firms. This observation is in line with the results from the firm count by region, as the Northeast is home to the most women-owned and minority-owned firms.
5.2% (31)
10.9% (65)
4.3% (5)
8.5% (10)
4.7% (10)
7.5% (16)
4.5% (9)
7.0% (14)0
24
68
10
% o
f Reg
iona
l Firm
s
Northeast Midwest West South
Women-owned Minority-owned

51
Figure 31. Diverse hedge fund AUM by region as a percentage of region’s total AUM (total AUM is in parentheses).
After finding clear differences in hedge fund diversity between regions, the next stage of our analysis looks to see if any differences exist based on fund strategy. Here we group hedge funds into five classes: Equity Hedge, Event Driven, Macro, Relative Value, and Other as described in our Data section. As shown in Figure 32, women-owned and minority-owned funds are best represented on a relative and absolute basis in the Equity Hedge strategy. There are 54 women-owned funds that comprise 5.1% of all Equity Hedge funds. Minority-owned funds account for 75, or 7.1%, of the strategy’s funds. For minority-owned funds, there is little change in the percentage of funds among the strategies. This holds true for women-owned funds when not considering the Equity Hedge strategy. The Other category results should not be viewed as descriptive as there are only 52 total funds employing this strategy.
1.6%($12.3 bn)
2.9%($23.0 bn)
0.8%($0.5 bn)
1.1%($0.7 bn) 1.0%
($1.0 bn)1.0%
($1.0 bn)
2.7%($3.4 bn)
4.4%($5.4 bn)
01
23
45
% o
f Reg
iona
l AU
M
Northeast Midwest West South
Women-owned Minority-owned

52
Figure 32. Diverse hedge fund firms as percentage of total firms in strategy (total fund count in parentheses).
When measuring the diverse-owned share of AUM by strategy, women- and minority-owned funds have the highest representation in Event Driven funds. Figure 33 shows that women-owned funds represent 3.6% of the strategy’s AUM, and minority-owned funds account for 7.6%. However, when analyzing total AUM, we observe that the Macro strategy contains the highest level of diverse AUM. Women-owned Macro AUM totals $23.1 billion—$17.3 billion more than the next largest strategy, Relative Value. Minority-owned funds employing a Macro strategy account for $25.4 billion.
5.1% (54)
7.1%(75)
2.9%(9)
5.1%(16)
2.8%(14)
6.6%(33)
1.9%(10)
5.4%(28)
0.0%(0)
3.8%(2)
02
46
8
% o
f Stra
tegy
Firm
s
Equity Hedge Event Driven Macro Relative Value Other
Women-owned Minority-owned

53
Figure 33. Diverse hedge fund AUM as percentage of total strategy AUM (total AUM in parentheses).
The final breakdown for hedge funds is by geographic focus. Although each firm is based in the U.S., some funds target investments in certain regions or countries while others use a global approach for investment. We group funds into three categories for geographic focus: North America, Global, and Other as described in Data. Figure 34 demonstrates that the Other regional investment focus contains the largest percentage of women- and minority-owned funds by far at 9.6% and 12.8%. This reflects a smaller overall number of funds with that focus. On an absolute basis, however, North America and Global focus contain a larger number of diverse-owned funds. Women-owned funds are most highly concentrated in the Global category, with 38 funds. For minority-owned funds, the North America and Global focus each contain 67.
1.0%($3.7 bn)
2.8%($9.6 bn)
3.6%($5.6 bn)
7.6%($9.8 bn)
2.8%($23.1 bn)
3.3%($25.4 bn)
1.2%($5.8 bn)
2.9%($18.7 bn)
0.5%($1.0 bn)
0.0%($0.0 bn)
02
46
8
% o
f A
UM
by
Str
ate
gy
Equity Hedge Event Driven Macro Relative Value Other
Women-owned Minority-owned

54
Figure 34. Diverse hedge funds as percentages of total funds in geographic focus (totals in parentheses).
We find similar results when looking at diverse-managed AUM by fund focus. Figure 35 shows that Other regional focus contains the highest percentage of women-owned and minority-owned AUM at 7.8% and 9.5%. When switching to total AUM, the Global focus contains the most diverse-managed AUM, with the AUM of women-owned funds at $26.4 billion, and minority-owned AUM at $30.5 billion.
2.8%(34)
5.6%(67)
3.5%(38)
6.2%(67)
9.6%(15)
12.8%(20)
05
1015
% o
f Fun
ds b
y F
ocu
s
North America Global Other
Women-owned Minority-owned

55
Figure 35. Diverse hedge fund AUM as percentage of total AUM in geographic focus (totals in parentheses).
Timeline of Diverse Ownership for Hedge Funds Next, we move beyond the current state of diversity in the hedge fund industry and discuss how diversity has changed over time. While not a predictive exercise, the analysis provides historical trends and insight into how those tendencies might play out in the future by graphing the following metrics for women-owned and minority-owned funds: the number of diverse-owned funds as a percentage of total fund count, the diverse-owned AUM as a percentage of total AUM, and the sum of diverse-owned AUM. These metrics are calculated on a monthly basis from January 2010 through December 2017. It should be noted that the analysis relies on monthly data that has imperfect coverage. Therefore, the analysis should be considered indicative of overall trends in the hedge fund industry rather than representative of the true level of diversity at any individual point in time. Fund Count: Figure 36 shows women- and diverse-owned funds as a percentage of all hedge funds on a monthly basis. The graph indicates an increase in diverse representation, with the percentage of minority-owned funds just below 4.0% of the total fund count in January 2010 and increasing to roughly 6.3% by December 2017. The percentage of women-owned funds also increased, from slightly more than 2.0% to approximately 3.5% over the same period.
0.9%($7.0 bn)
4.0%($28.0 bn)
1.7%($26.4 bn)
2.2%($30.5 bn)
7.8%($4.8 bn)
9.5%($6.0 bn)
02
46
810
% o
f AU
M b
y Fo
cus
North America Global Other
Women-owned Minority-owned

56
Figure 36. Fund count of women- and minority-owned firms by month, as a percentage of all hedge funds with reported assets in that month.
AUM Percentage:
Figure 37 displays the evolution of women- and diverse-owned funds’ proportion of total hedge fund AUM on a monthly basis since 2010. The percentage of AUM controlled by diverse-owned funds has grown consistently over the period. Minority-owned funds exhibited the most growth, starting below 2% in January of 2010 and ending above 3% by the end of 2017. In particular, growth accelerated for minority-owned AUM beginning in January 2016 and continued through the end of 2017. The exception to this trend is from December 2014 to January 2015, where there is a noticeable drop in AUM. The decline is largely attributable to the exit of one large minority-owned fund. Women-owned AUM has grown since 2010, albeit at a slower pace, starting at just below 1.0% of total AUM and finishing slightly under 2.0% by the end of 2017.
2%
3%
4%
5%
6%
7%
% o
f HF
Fund
s
Jan 2
010
Jan 2
012
Jan 2
014
Jan 2
016
Jan 2
018
Jan 2
011
Jan 2
013
Jan 2
015
Jan 2
017
Women-owned Minority-owned

57
Figure 37. Amount of AUM managed by women- and minority-owned firms by month, as a percentage of all hedge funds with reported assets in that month.
Total AUM: The same trend displayed in Figure 37 is found when graphing the change of total AUM with diverse-owned funds. Figure 38 shows that minority-owned AUM increased from approximately $10 billion to slightly over $25 billion from January 2010 to the end of 2017. Women-owned AUM experienced faster growth, approximately tripling from roughly $5 billion to nearly $15 billion over the same period. The growth in diverse AUM as a percentage of all AUM, then, is a result of increasing flows into diverse-owned funds, and not a drop in total hedge fund AUM.
1%
1.5%
2%
2.5%
3%
% o
f Tot
al A
UM
Jan 2
010
Jan 2
012
Jan 2
014
Jan 2
016
Jan 2
011
Jan 2
013
Jan 2
015
Jan 2
017
Jan 2
018
Women-owned Minority-owned

58
Figure 38. Timeline of diverse hedge fund AUM.
Performance of Diverse-Owned Hedge Funds We now turn our attention to the performance of women-owned and minority-owned hedge funds. Because of the difficulty in collecting diversity data, research into the financial returns of diverse-owned hedge funds has been limited. In this section, we contribute to this research using diversity and monthly returns data from HFR. In particular, we examine whether there are significant differences in performance between diverse and non-diverse hedge funds. Diverse-owned funds are defined as those having at least 25% women or minority ownership. We use several different performance measures: unadjusted monthly returns, market-adjusted monthly returns, capital-weighted monthly returns, and market-adjusted capital-weighted monthly returns.54 Table D presents average performance for women-owned, minority-owned, and non-diverse funds from January 2005 to May 2018.55 Across our four performance metrics, we find that, on average, minority-owned funds outperform women-owned funds and non-diverse funds. The only exception is the capital-weighted market-adjusted returns, where non-diverse funds outperform minority-owned funds. Note that these summary statistics do not control for any fund-level characteristics such as size, location, or other characteristics that may be relevant to
54 For market-adjusted returns: we use the capital asset pricing model (CAPM) to calculate the expected return for a fund in each month and subtract this number from the fund’s actual performance to get the market-adjusted return. The expected return is calculated as !(#) = #! + ((#" − #!) where #! is the risk-free rate and #" is the market return. For the risk-free rate, we use monthly averages of the U.S. 3-month Treasury bill rate, provided by the U.S. Federal Reserve. The beta calculation is described in the following footnote. For capital-weighted returns, each observation is weighted by the lagged fund AUM (i.e., the fund assets at the end of the previous quarter). 55 The sample includes all US-based hedge funds, excluding funds-of-funds.
5
10
15
20
25To
tal A
UM
(bill
ions
of 2
009
USD
)
Jan 2
010
Jan 2
012
Jan 2
014
Jan 2
016
Jan 2
018
Jan 2
011
Jan 2
013
Jan 2
015
Jan 2
017
Women-owned Minority-owned

59
performance. Therefore, the simple averages in Table D are not conclusive results for women-owned and minority-owned fund performance. Next, we estimate six regression models to isolate the effects of diverse ownership on fund performance. These models control for fund assets, manager location, fund strategy, month and month-strategy fixed effects. Output from each of these regressions is shown in the Appendix.
1. Base Regression. In this base model, we investigate the effect of women and minority ownership on monthly returns, controlling for fund assets in the previous month and several fund-specific fixed characteristics, such as region, strategy, and time.
2. Base with Additional Controls Regression. This model expands the Base Regression by adding a variable to indicate whether the fund is active (based on HFR’s classification as of May 2018) and another variable with the fund betas, as a measure of volatility.56
3. Market-Adjusted Regression. The Market-Adjusted Regression makes two changes to the Base with Additional Controls Regression. First, we use market-adjusted monthly returns as the dependent variable. Second, we exclude the beta variable, as it is used in the calculation of the dependent variable.57
4. Capital-Weighted Base Regression. This version of the Base Regression weights the observations by the previous month’s fund assets. We exclude fund assets as an independent variable. This gives larger firms more weight in the model’s calculations.
5. Capital-Weighted with Additional Controls Regression. This model takes the Base with Additional Controls and weights the observations by the previous month’s fund assets. The fund assets variable is therefore excluded from the regression.
6. Capital-Weighted Market-Adjusted Regression. This model is the capital-weighted version of the Market-Adjusted Regression (Model 3).
56 Betas are calculated by regressing the fund’s monthly return on the HFRX North America Index and a constant. The unit of observation is the fund-month (i.e., each fund’s performance in each month). We use data from January 2005 through May 2018. Betas are calculated using 36 months of data, starting from 36 months before a given date. For example, to calculate the beta for a fund in December 2007, we would use data from January 2005 through December 2007 (i.e., 36 months) in the regression. 57 We use the capital asset pricing model (CAPM) to calculate the expected return for a fund in each month and subtract this number from the fund’s actual performance to get the market-adjusted return. The expected return is calculated as !(#) = #! + ((#" − #!) where #! is the risk-free rate and #" is the market return. For the risk-free rate, we use monthly averages of the U.S. 3-month Treasury bill rate, provided by the U.S. Federal Reserve. The beta calculation is described in the previous footnote.

60
Data for the HFRX North America index (used to calculate betas) starts in 2005. Therefore, for regressions 1 and 4, observations span January 2005 to May 2018. All other regressions use data from December 2007 through May 2018, because of the 36-month lag time required to calculate betas and market-adjusted returns. Table E in the Appendix shows the regression output for each model. In all six regressions, the estimated coefficient on women-owned is negative, but none of the coefficients are statistically significant at conventional levels.58 The results are more nuanced for minority-owned funds. Models (1) though (3) yield positive, and significant, coefficient estimates for minority-ownership. In model (1), the estimate for minority-ownership suggests the average minority-owned fund’s monthly rate of return is 0.179 percentage point higher than non-diverse hedge funds, all else held equal.59 Models (2) and (3) point to minority-owned monthly return outperformance with significant coefficients of 0.105 and 0.106.60 In line with prior research, controlling for fund size renders the minority-owned coefficient insignificant. Models (4) through (6) assign more weight to larger funds, and the insignificant minority-owned coefficients suggest that, on average, larger minority funds underperform in comparison to smaller minority funds. In light of our findings, we find little evidence that women ownership impacts hedge fund performance. The three significant, and positive, minority-owned coefficients do suggest some outperformance by minority-owned funds. However, the coefficients were not significant across all six models, and we cannot confidently conclude there is any significant minority outperformance relative to non-diverse funds. To facilitate comparisons across the other two asset classes, and to add a robustness check to the analysis, the six regressions were estimated after restricting the data to the period of January 2011 through December 2017. This is the same time period used for the hedge funds timeline and the mutual fund performance analysis. Table F in the Appendix shows the regression output from our robustness checks. We find similar magnitudes for our coefficient estimates; however, the estimates in models (1) through (3) lose significance. After exploring how the average diverse fund performs relative to the average non-diverse fund, we measure how often diverse-owned hedge funds obtain top-quartile returns. While there is much debate surrounding the persistence of performance in the asset management industry, it is nonetheless prudent to choose top funds with the hopes of obtaining outsized returns.61 Table K in the Appendix shows the average percentage of women- and minority-owned hedge funds achieving top quartile performance. We find that, on average, 26% of women-owned hedge
58 It is conventional to reject the null hypothesis of no difference in performance with p-values of 0.10, 0.05, or 0.01. 59 The model (1) minority-owned coefficient is significant with a p-value of 0.01 60 The model (2) and model (3) minority-owned coefficients are significant with a p-value of 0.10. 61 Discussions of persistence can be found at: Kaplan, S., Schoar, A.; “Private Equity Performance: Returns, Persistence, and Capital Flows”; The Journal of Finance, Vol 60, Issue 4; 2005; Harris, Robert S. and Jenkinson, Tim and Kaplan, Steven N. and Stucke, Rüdiger, Has Persistence Persisted in Private Equity? Evidence from Buyout and Venture Capital Funds (February 28, 2014). Darden Business School Working Paper No. 2304808; Fama-Miller Working Paper. Available at SSRN: https://ssrn.com/abstract=2304808 or http://dx.doi.org/10.2139/ssrn.2304808

61
funds and 29% of minority-owned hedge funds exhibit top-quartile returns from January 2005 through May 2018.
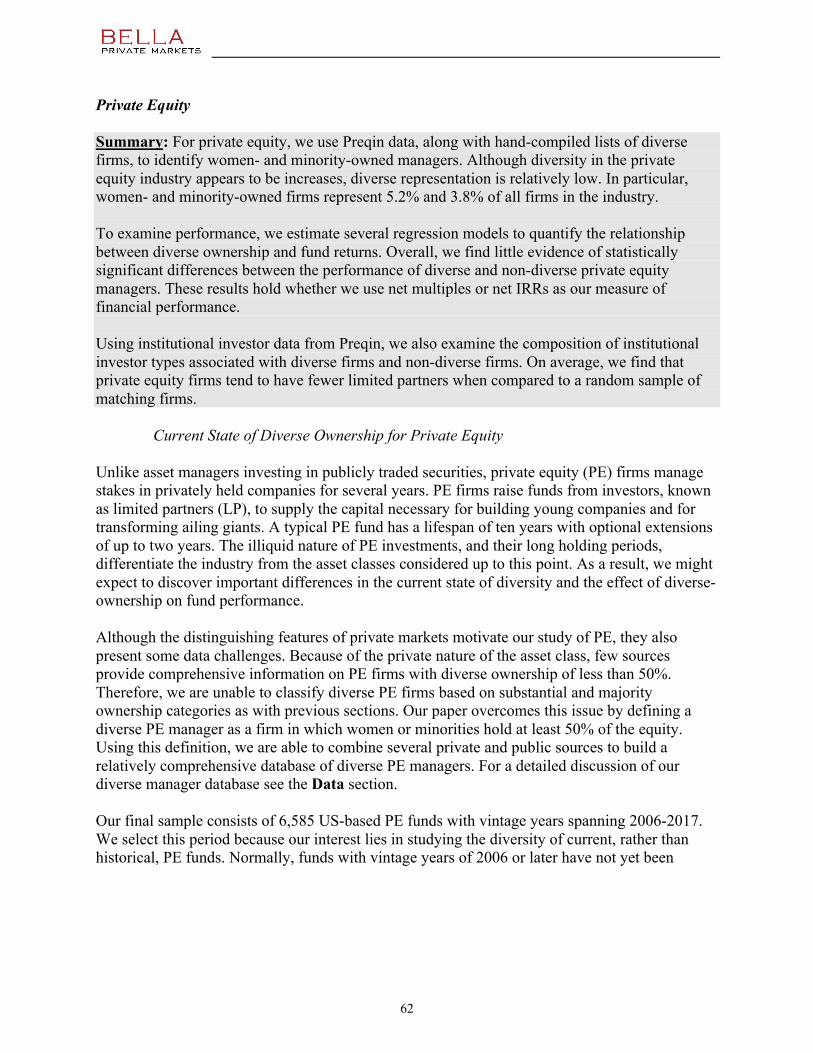
62
Private Equity Summary: For private equity, we use Preqin data, along with hand-compiled lists of diverse firms, to identify women- and minority-owned managers. Although diversity in the private equity industry appears to be increases, diverse representation is relatively low. In particular, women- and minority-owned firms represent 5.2% and 3.8% of all firms in the industry. To examine performance, we estimate several regression models to quantify the relationship between diverse ownership and fund returns. Overall, we find little evidence of statistically significant differences between the performance of diverse and non-diverse private equity managers. These results hold whether we use net multiples or net IRRs as our measure of financial performance. Using institutional investor data from Preqin, we also examine the composition of institutional investor types associated with diverse firms and non-diverse firms. On average, we find that private equity firms tend to have fewer limited partners when compared to a random sample of matching firms.
Current State of Diverse Ownership for Private Equity Unlike asset managers investing in publicly traded securities, private equity (PE) firms manage stakes in privately held companies for several years. PE firms raise funds from investors, known as limited partners (LP), to supply the capital necessary for building young companies and for transforming ailing giants. A typical PE fund has a lifespan of ten years with optional extensions of up to two years. The illiquid nature of PE investments, and their long holding periods, differentiate the industry from the asset classes considered up to this point. As a result, we might expect to discover important differences in the current state of diversity and the effect of diverse-ownership on fund performance. Although the distinguishing features of private markets motivate our study of PE, they also present some data challenges. Because of the private nature of the asset class, few sources provide comprehensive information on PE firms with diverse ownership of less than 50%. Therefore, we are unable to classify diverse PE firms based on substantial and majority ownership categories as with previous sections. Our paper overcomes this issue by defining a diverse PE manager as a firm in which women or minorities hold at least 50% of the equity. Using this definition, we are able to combine several private and public sources to build a relatively comprehensive database of diverse PE managers. For a detailed discussion of our diverse manager database see the Data section. Our final sample consists of 6,585 US-based PE funds with vintage years spanning 2006-2017. We select this period because our interest lies in studying the diversity of current, rather than historical, PE funds. Normally, funds with vintage years of 2006 or later have not yet been

63
liquidated by 2017. Finally, we report all assets under management (AUM) figures in inflation adjusted 2009 U.S. dollars.62 As with other asset classes in our study, PE is characterized by a surprisingly low level of diversity. Figure 39 shows the number of diverse PE firms by ownership type. In this study, we define a PE firm as an organization that has raised at least one PE fund between 2006 and 2017. In total, we identify 146 women-owned and 106 minority-owned firms representing 5.2% and 3.8% of all PE firms. A similar pattern appears when we plot diverse PE funds as shown in Figure 40. This is not surprising and reflects the fact that the average number of funds is similar among diverse and non-diverse firms. Interestingly, however, analyzing firm and fund counts alone provides an incomplete picture of diversity. Figure 41 reveals that women- and minority-owned firms manage 3.4% and 3.8% of total assets in PE. Figure 39. Diverse PE firms out of 2,814 total firms.
62 Unlike portfolios of public securities, PE funds do not report AUMs on a frequent basis. Therefore, we proxy for AUM using cumulative committed capital. That is, we sum the final sizes of all funds raised by a PE firm over 2006-2017. In reality, AUM vary over time because of changes in valuation and distributions to LPs.

64
Figure 40. Diverse PE funds out of 6,585 total funds.
Figure 41. Diverse AUM out of $3.16 trillion of total PE AUM.
It is apparent that, on average, minority-owned firms manage more in assets than women-owned firms. What is less clear, however, is how the size of diverse-owned firms compares to all firms. To shed light on this question, we show average and median AUMs by ownership type in Figure 42 and Figure 43. Minority-owned firms are roughly the same size as the typical PE firm whether measured by average or median AUMs. In stark contrast, however, the average (median)

65
women-owned firm manages $766 million ($89 million) compared to $1.2 billion ($166 million) for all PE firms. These figures also demonstrate that average AUMs are skewed upward by a small number of relatively large PE firms. Therefore, median AUMs are likely to be more representative indicators for the comparison of firm size. It should be noted that although our diversity database is extensive and relies on several sources, we do not claim to identify every diverse-owned PE firm. It is possible that larger diverse firms are easier to identify. For example, public pension funds may find it easier to invest with large funds and publicly report making diverse investments. To the extent that smaller diverse firms are excluded, estimates of the size of women- and minority-owned firms may have an upward bias. The fact that women- and minority-owned firms are not significantly larger than the typical PE firm gives us some confidence that this is unlikely to be a major issue. Figure 42. Average PE AUM by ownership type (millions of 2009 USD).

66
Figure 43. Median PE AUM by ownership type (millions of 2009 USD).
Next, we ask whether diverse representation in PE is related to a firm’s geographic location. Since diversity data are more complete for US-based managers we exclude foreign PE managers from our analysis. Figure 44 shows the representation of women- and minority-owned firms by geographic region. We should note that because of the small number of diverse firms, great care should be exercised when making comparisons across regions. Our results should be viewed as suggestive rather than as the final word on differences in regional diversity. Diverse representation, as measured by number of firms, is highest in the West with women- and minority-owned firms accounting for 7.2% and 5.1% of all firms in the region. In contrast, we find lower levels of diverse representation in the Midwest and South. Differences between regions are magnified when we examine diversity using shares of regional AUMs. Similar to the distribution of firm counts, Figure 45 shows the West as having the highest level of diverse ownership with women- and minority-owned firms managing 6.4% and 7.0% of the region’s total PE assets. In the Midwest, these same figures fall to 0.4% and 1.7%; and are 1.1% and 1.2% for the South. Diverse representation in the Northeast is similar to that for the US overall. Our findings suggest that national aggregate statistics are likely to mask noteworthy regional differences in diversity.

67
Figure 44. Diverse PE firms by region as a percentage of all regional firms (totals in parentheses).
Figure 45. Diverse PE AUM by region as a percentage of region’s AUM (totals in parentheses).
Having found important geographic differences in diversity, it is natural to ask whether diverse ownership in PE varies based on fund type or their investment focus. As a first step, we divide up our sample of funds according to their sub-asset class. For the majority of our analysis, PE includes the entire spectrum of private market investments from early stage venture capital through late stage investments such as leveraged buyouts. Here, however, we group PE funds
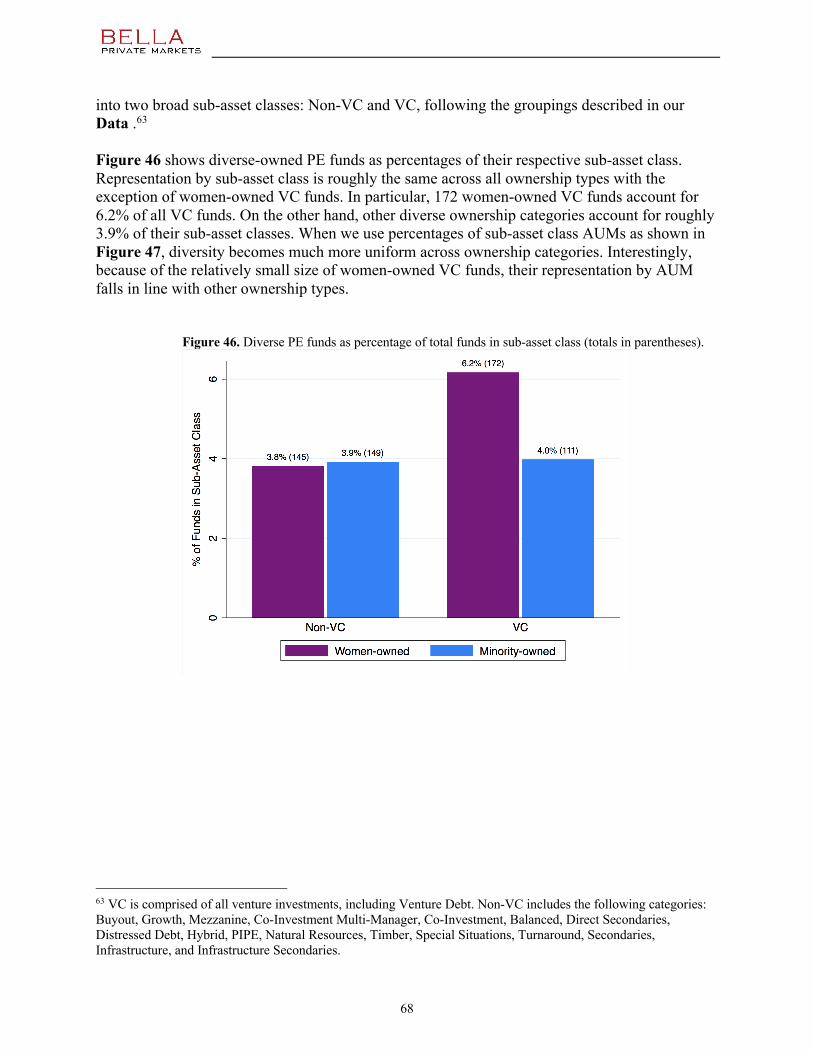
68
into two broad sub-asset classes: Non-VC and VC, following the groupings described in our Data .63 Figure 46 shows diverse-owned PE funds as percentages of their respective sub-asset class. Representation by sub-asset class is roughly the same across all ownership types with the exception of women-owned VC funds. In particular, 172 women-owned VC funds account for 6.2% of all VC funds. On the other hand, other diverse ownership categories account for roughly 3.9% of their sub-asset classes. When we use percentages of sub-asset class AUMs as shown in Figure 47, diversity becomes much more uniform across ownership categories. Interestingly, because of the relatively small size of women-owned VC funds, their representation by AUM falls in line with other ownership types. Figure 46. Diverse PE funds as percentage of total funds in sub-asset class (totals in parentheses).
63 VC is comprised of all venture investments, including Venture Debt. Non-VC includes the following categories: Buyout, Growth, Mezzanine, Co-Investment Multi-Manager, Co-Investment, Balanced, Direct Secondaries, Distressed Debt, Hybrid, PIPE, Natural Resources, Timber, Special Situations, Turnaround, Secondaries, Infrastructure, and Infrastructure Secondaries.

69
Figure 47. Diverse PE AUM as percentage of sub-asset class AUM (totals in parentheses).
Next, we ask whether diverse managers are similarly represented by geographic investment focus. Figure 48 shows diverse-owned PE funds as percentages of total funds by non-US and US focus. We exclude the small number of funds with geographically diversified investments. Unlike our results by sub-asset class, we find that women- and minority-owned funds are better represented among non-US focused PE funds. Specifically, women- and minority-owned funds account for 5.5% and 6.2% of non-US focused funds. In contrast, they represent only 4.7% and 3.7% of US-focused funds. As with our geographic location results, we find that using percentages of total AUM amplifies differences in diversity between geographic focus categories. In Figure 49, we see that women- and minority-owned firms manage 6.4% and 8.2% of non-US focused assets; however, they manage 3% and 3.3% of US focused assets. While we do not speculate on the causes of these differences, we believe that they are worth noting and exploring in future research.

70
Figure 48. Diverse PE funds as percentages of funds in geographic focus (totals in parentheses).
Figure 49. Diverse PE AUM as percentage of AUM in geographic focus (totals in parentheses).
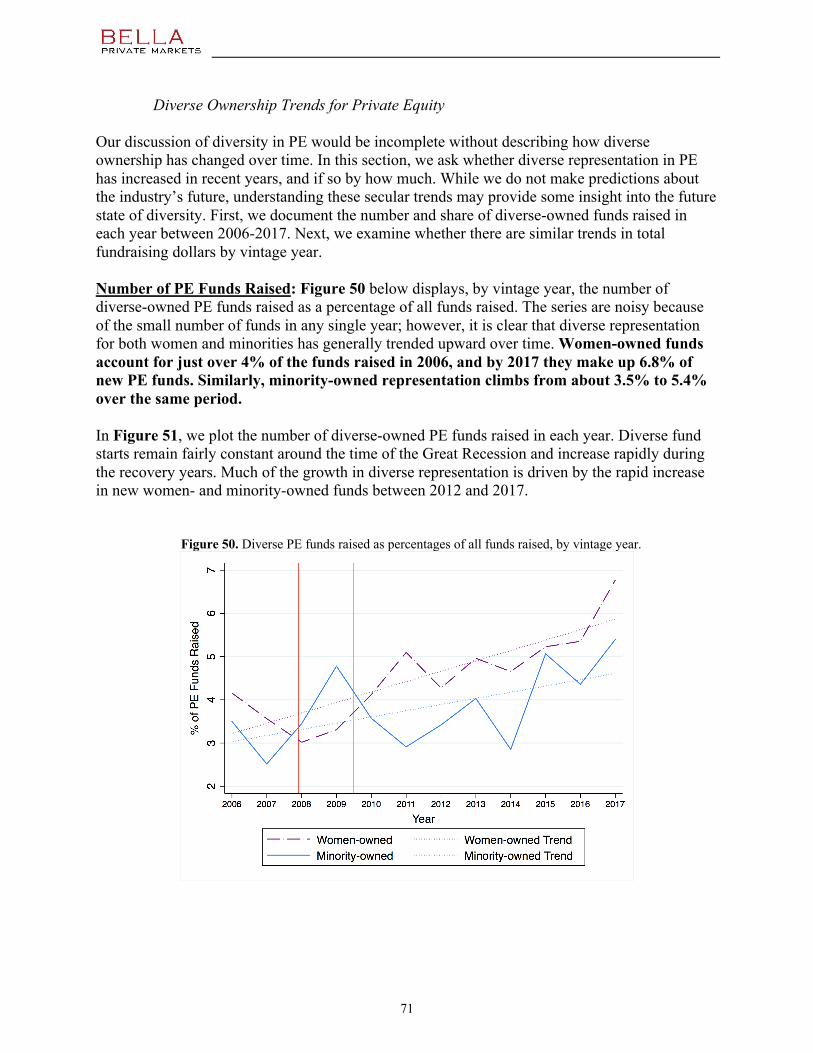
71
Diverse Ownership Trends for Private Equity Our discussion of diversity in PE would be incomplete without describing how diverse ownership has changed over time. In this section, we ask whether diverse representation in PE has increased in recent years, and if so by how much. While we do not make predictions about the industry’s future, understanding these secular trends may provide some insight into the future state of diversity. First, we document the number and share of diverse-owned funds raised in each year between 2006-2017. Next, we examine whether there are similar trends in total fundraising dollars by vintage year. Number of PE Funds Raised: Figure 50 below displays, by vintage year, the number of diverse-owned PE funds raised as a percentage of all funds raised. The series are noisy because of the small number of funds in any single year; however, it is clear that diverse representation for both women and minorities has generally trended upward over time. Women-owned funds account for just over 4% of the funds raised in 2006, and by 2017 they make up 6.8% of new PE funds. Similarly, minority-owned representation climbs from about 3.5% to 5.4% over the same period. In Figure 51, we plot the number of diverse-owned PE funds raised in each year. Diverse fund starts remain fairly constant around the time of the Great Recession and increase rapidly during the recovery years. Much of the growth in diverse representation is driven by the rapid increase in new women- and minority-owned funds between 2012 and 2017.
Figure 50. Diverse PE funds raised as percentages of all funds raised, by vintage year.

72
Figure 51. Number of diverse PE funds raised, by vintage year.
Trends in PE Fundraising: We now construct trendlines based on diverse shares of total PE fundraising. To calculate total fundraising by diverse-owned PE funds, we sum the final sizes of women- and minority-owned PE funds in each vintage year. Figure 52 shows diverse fundraising as a percentage of all PE capital raised from 2006-2017. As with the graphs for number of funds, these series fluctuate markedly as a consequence of the small number of diverse-owned funds raised each year. Nevertheless, we find that the capital raised by women- and minority-owned funds, as a share of total PE fundraising, has increased in recent years. The pattern for total fundraising dollars is similar to our findings for diverse PE funds raised. Figure 53 shows a slump in fundraising for both groups during the Great Recession with a sharp turnaround in its aftermath. Interestingly, the diverse fundraising trends for both ownership types closely track one another. Consistent with our results on the current state of diversity in PE, we find that minority-owned funds raise more capital than women-owned funds in a typical year. To conclude, we have found that despite the low current level of diversity in PE, diverse representation, whether measured by share of funds or fundraising dollars, has been increasing. Furthermore, these increases are a result of growth in the number of diverse funds and dollars under management rather than a decline in non-diverse PE activity.
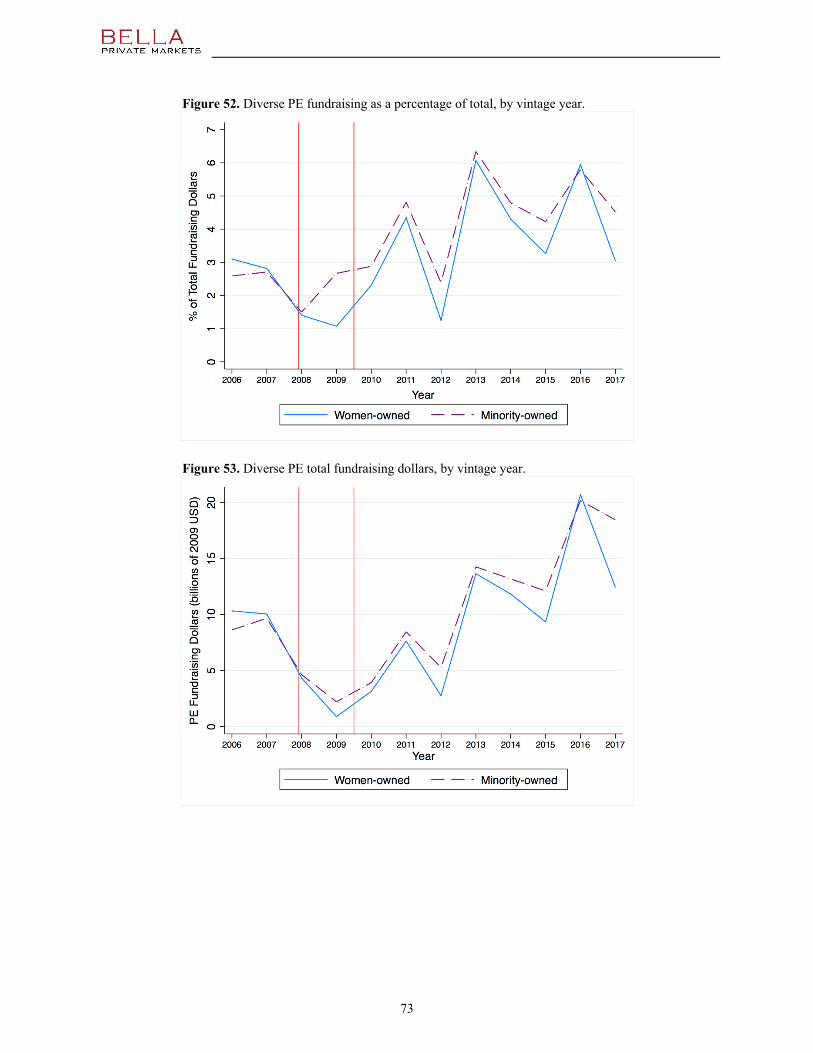
73
Figure 52. Diverse PE fundraising as a percentage of total, by vintage year.
Figure 53. Diverse PE total fundraising dollars, by vintage year.

74
Performance of Diverse-Owned PE Funds Having established the low, albeit increasing, level of diversity in PE, we now investigate whether performance differences exist among diverse and non-diverse funds. In recent years, many public initiatives have encouraged LPs to invest with women- and minority-owned PE managers. Despite efforts to improve diverse representation, research on diversity and investment performance is limited, due in no small part to the difficulty in obtaining data on diverse ownership. In this section, we study the relationship between diversity and performance using financial metrics obtained from Preqin. Unlike hedge funds and mutual funds, many PE funds do not report performance data on a frequent basis. Moreover, the realization of returns in illiquid PE investments often takes several years. For these reasons, our preferred performance metric is a PE fund’s most recently reported net multiple. The net multiple measures how many times investors earn, whether realized or not, back their committed capital after fees. For example, if a liquidated fund achieves a net multiple of 1.4, the LPs receive 1.4 times their committed capital in distributions after paying fees and carry. By construction, net multiples reflect fund performance since inception and thus provide longer time horizons for the measurement of financial gains. In addition, we use net IRRs as an alternative measure of fund performance. A fund’s net IRR is the discount rate on cash flows, after fees, required for the net present value of the investment to equal zero. Intuitively, IRRs can be thought of as a required rate of return that would make an investor indifferent between accepting or rejecting an investment. Net IRRs are useful for comparing investment projects over different time horizons. Since IRR information is missing for the last two years of our sample, all statistics using net IRRs utilize data from vintage years 2006-2015. In Table G in the Appendix, we present descriptive statistics on the performance of diverse and non-diverse PE funds. It is common for a small number of high performing funds to skew the distribution of returns. Therefore, we also show median returns by ownership type. While there is some variation in performance across ownership types, the differences appear economically small and none are statistically significant at conventional levels. The fortunes of PE funds, however, are influenced by a number of factors—many of which are correlated with diverse-ownership. As a result, simple comparisons of average performance by gender or minority status are likely to be misleading. For example, women-owned funds tend to be smaller than non-women-owned funds, and fund size may impact returns. Hence, the averages reported in Table G are potentially affected by both diverse-ownership and other fund characteristics. To isolate the effect of women- and minority-ownership on fund performance, we estimate models that control for relevant fund characteristics such as size, type, geographic focus, firm location, vintage year, and industry. The size of each fund is measured as the natural logarithm of final fund size in millions of 2009 US dollars.

75
We estimate the following four regressions:
1. Net Multiple Baseline Model This model includes indicators for women- and minority-ownership in addition to controls for fund size, fund type, vintage year, and vintage year-asset class interactions.
2. Net Multiple Additional Controls Model Here we extend the first model by including additional control variables for firm location, industry, and geographic focus.
3. Net IRR Baseline Model Rather than the investment multiple, this model uses net IRR as the dependent variable.
4. Net IRR Additional Controls Model Here we extend the previous model by including additional control variables for firm location, industry, and geographic focus.
Our estimation results are presented in Table H in the Appendix. In model (1), the average effects of women- and minority-ownership on performance are -0.13 and 0.08; however, these estimates are not statistically significant at conventional levels.64 The inclusion of additional controls in model (2) for industry, geographic focus, and location yields similar estimates of -0.12 and 0.08. In both specifications, larger funds are associated with lower net multiples. On average, a 10% increase in the final size of a PE fund reduces its net multiple by approximately 0.0049. While the magnitude of the effect of fund size may seem economically insignificant, there is a high degree of variation in fund size. Many small PE funds raise less than $100 million, while a few large funds exceed $1 billion. We also find that VC funds tend to have lower performance relative to similar non-VC funds. Models (3) and (4) estimate the same specifications using net IRR as the dependent variable. Once again, we find little evidence that women- and minority-ownership are associated with differences in financial performance. Moreover, the direction of the estimated effects on fund size and VC status are consistent with models (1) and (2). Finally, we compute the percentage of high performing diverse-owned funds. We find that 29.4% and 34.1% of women- and minority-owned funds achieve top quartile returns. To conclude, we find no indication of a relationship between diverse-ownership and PE fund performance. Our results hold whether examining differences in unconditional means or using regression models that control for relevant fund characteristics. Furthermore, we find consistent estimates using both net multiples or net IRRs as our measure of financial performance. It should be noted that diverse PE ownership data are still relatively new and are continuously improving. Therefore, we believe future attempts to explore diversity and fund performance in greater detail would be worthwhile.
64 It is conventional to reject the null hypothesis of no difference in performance with p-values of 0.10, 0.05, or 0.01.

76
Institutional Investor Types for Diverse-Owned PE Firms In this section, we examine the types of institutional investors that commit capital to diverse-owned PE firms. Thus far, we have examined the current state of diversity for PE firms and their financial performance relative to non-diverse firms. Without access to investments from institutional investors, however, PE managers would struggle to raise funds. To shed light on this topic, we examine the composition of LPs for the average PE firm across different ownership types. Our data on institutional investors come from the Preqin PE database. We begin by collecting lists of LPs who have committed capital to the women- and minority-owned PE firms in our diverse asset manager database. While there are many different types of LPs that fund PE firms, we focus on five major categories: public pensions, private pensions, PE funds of funds, insurance companies, and foundations & endowments. These institutional investors are selected as they are the five most common LPs observed in our data. To compare diverse-owned PE firms to the overall PE industry, we collect a random sample of 100 firms that meet the selection criteria of our current state analysis. Specifically, we draw 100 PE firms from a universe of US-based, non-funds of funds PE firms with vintage years 2006-2017. The random sample is compared to all women- and minority-owned firms in our diverse asset manager database. The table below shows the number of institutional investors of each type for the average PE firm.65 For example, the average women-owned PE firm has 3.77 public pension investors, followed by 2.17 foundations & endowments investors, and so on. On average, we find that diverse-owned PE firms tend to have fewer LP relative to our sample of matching firms. This is largely a result of our random sample containing larger PE firms with many LPs. This suggests that, on average, diverse-owned PE firms are much more reliant on a small number of institutional investors relative to the PE industry overall. We also display these averages graphically in Figure 54.
65 The asterisks in Table 3 and Table 4 indicate whether the means for our diverse-owned PE funds are significantly different from the random sample mean. *** p<0.01, ** p<0.05, * p<0.1
Public Pension Private Pension PE Funds of Funds Insurance Companies Foundations & EndowmentsWomen-Owned 3.77* 1.9*** 1.33** 1.22*** 2.17**Minority-Owned 6.47 2.86** 1.88 1.48** 2.13**
Sample of 100 Matching Firms 6.59 5.74 2.83 2.89 5.16
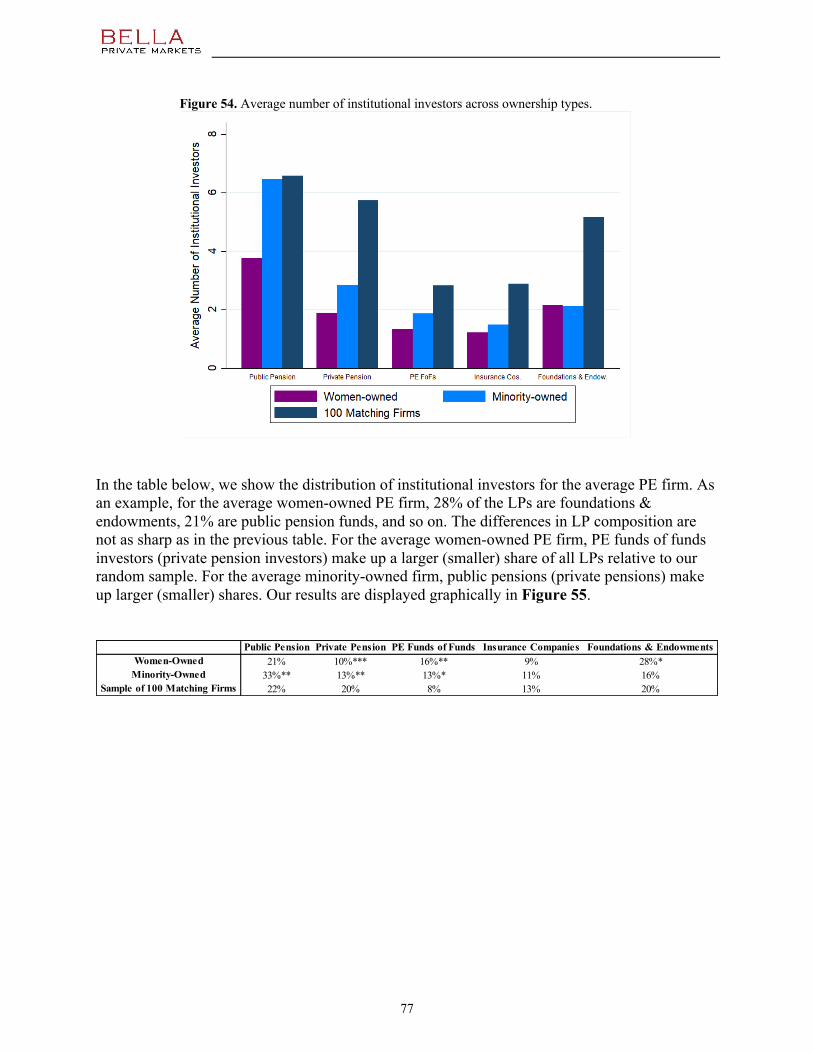
77
Figure 54. Average number of institutional investors across ownership types.
In the table below, we show the distribution of institutional investors for the average PE firm. As an example, for the average women-owned PE firm, 28% of the LPs are foundations & endowments, 21% are public pension funds, and so on. The differences in LP composition are not as sharp as in the previous table. For the average women-owned PE firm, PE funds of funds investors (private pension investors) make up a larger (smaller) share of all LPs relative to our random sample. For the average minority-owned firm, public pensions (private pensions) make up larger (smaller) shares. Our results are displayed graphically in Figure 55.
Public Pension Private Pension PE Funds of Funds Insurance Companies Foundations & EndowmentsWomen-Owned 21% 10%*** 16%** 9% 28%*
Minority-Owned 33%** 13%** 13%* 11% 16%Sample of 100 Matching Firms 22% 20% 8% 13% 20%

78
Figure 55. LP percentages by institutional investor type.

79
Real Estate Summary: For real estate, we again use Preqin data, along with hand-compiled lists of diverse firms, to identify women- and minority-owned managers. As with other asset classes, we find surprising low levels of diverse representation in real estate. Specifically, women- and minority-owned firms represent 1.8% and 2.2% of all firms in the industry. To examine performance, we estimate regression models similar to those used for private equity to quantify the relationship between diverse ownership and returns. Overall, we find little evidence of statistically significant differences between the performance of women-owned and non-women-owned real estate funds. We find some marginal evidence that minority-owned funds underperform relative to non-minority-owned funds when we use multiples as our outcome measure. We note, however, that these differences disappear when using net IRR as our dependent variable.
Current State of Diverse Ownership for Real Estate Real estate is an essential feature of the US economy—consumers and firms rely on real estate properties for housing and production. To some, such assets also offer attractive investment opportunities. According to Preqin, the value of private equity real estate deals grew from $67 billion in 2012 to $164 billion in 2017.66 Unlike traditional private equity (PE), however, real estate investing involves a unique set of challenges. Because portfolio properties are durable, investment returns hinge on decisions of location and scale. Consequently, real estate managers require skills specific to their industry. For these reasons, this section examines real estate funds as a separate asset class. We should note that among the asset classes considered in our study, data collection in real estate poses the greatest challenge. It is likely that our diverse real estate managers database excludes some women- and minority-owned firms. As a result, our estimates probably understate the true level of diversity within the industry. Nevertheless, we take our data as given and document the characteristics of known diverse managers. As with PE, we define women- and minority-ownership using a 50% equity threshold. Our final sample includes 2,852 US-based real estate funds over vintage years 2006-2017. As with our PE analysis, we select this period because our interest lies in the diversity status of current funds. By 2017, the funds in our dataset are either still active or have only recently been liquidated. Once again, we report all assets under management (AUM) figures in 2009 US dollars.67 Figure 56 shows the number of diverse real estate firms by ownership type. In this section, we define a real estate firm as an organization that has raised at least one real estate fund between 2006 and 2017. In total, we identify 17 women-owned and 21 minority-owned firms
66 Preqin. Real Estate Spotlight. Volume 13 Issue 3. March 2018. 67 Unlike portfolios of public securities, real estate funds do not report AUMs on a frequent basis. Therefore, we proxy for AUM using cumulative committed capital. That is, we sum the final sizes of all funds raised by a real estate firm over 2006-2017. In reality, AUM vary over time because of changes in valuation and distributions.

80
representing 1.8% and 2.2% of all real estate firms. Minority representation is higher than women representation whether measured by firms, funds, or AUM. Figure 57 and Figure 58 show diverse ownership as percentages of total funds and total AUM. The level of diversity in real estate is lowest when measured by AUM, with women and minorities accounting for 0.8% and 1.2% of total real estate AUM. Figure 56. Diverse real estate firms out of 967 total firms.
Figure 57. Diverse real estate funds out of 2,852 total funds.

81
Figure 58. Diverse real estate AUM out of $970.3 billion of total real estate AUM.
The relatively low level of diversity as measured by AUM indicates that, on average, women- and minority-owned firms manage fewer assets. We show average and median AUMs by ownership type in Figure 59 and Figure 60. On average, minority- and women-owned real estate firms are roughly the same size with $517 million and $577 million in AUM. On the other hand, the average AUM for all firms stands at about $1.1 billion. Figure 60 shows that median AUMs for women- and minority-owned firms are approximately $318 million and $434 million. Interestingly, median AUM for all firms is only $222 million—suggesting that the AUMs of non-diverse firms are skewed upward by a few extremely large real estate firms. As with PE, medians better reflect the size of a typical real estate fund by ownership type.

82
Figure 59. Average real estate AUM by ownership type (millions of 2009 USD).
Figure 60. Median real estate AUM by ownership type (millions of 2009 USD).
Next, we examine diverse representation in real estate by geographic location. As with PE, diversity data are more complete for US-headquartered asset managers and we therefore exclude foreign real estate managers from our analysis. Figure 61 shows the representation of women- and minority-owned firms by geographic region. We should note that because of the small number of diverse firms, caution should be exercised when comparing diversity across regions. In some cases, the number of diverse firms per region is too small for meaningful comparisons.

83
Our aim is to display diversity by region to provide a better picture of our data. For minority-owned firms, representation (measured as percentages of regional firms) is highest in the Midwest at 3.3% and lowest in the West at 1.5%. For women-owned firms, representation is highest in the West at 2.3% and lowest in the South at 1.1%. Overall, however, there do not appear to be major differences in diversity across the four major regions. Regional differences become apparent when we measure diversity using percentages of AUM. Figure 62 shows the Midwest has the greatest amount of diversity with women and minority AUM representing 2.2% and 3.8% of regional AUM. In contrast, the Northeast has the lowest level of diversity with women and minority regional asset shares at 0.4% and 0.6%. The West and South have roughly similar levels of diversity across ownership types with the exception of women AUM representing only 0.7% of AUM in the West.
Figure 61. Diverse real estate firms as a percentage of all regional firms (totals in parentheses).

84
Figure 62. Diverse real estate AUM as a percentage of regional AUM (totals in parentheses).
Since real estate funds adopt different investment strategies, we consider diversity status across five major sub-asset classes: Core/Core-Plus, Debt, Distressed, Opportunistic, and Value Added. Core: Refers to low risk real estate investments with little or no leverage applied in transactions. Core-Plus: Similar to core investments, but with a moderate level of risk and more leverage. Debt: Investments in residential or commercial real estate debt. These investments may carry a variety of risk profiles. Distressed: Includes debt and equity investments to recapitalize real estate properties. Opportunistic: Investments in idiosyncratic events that create abnormal profit opportunities. Value Added: Generally high risk, high reward investments in properties that require operational improvements. Figure 63 shows diverse-owned real estate funds as percentages of their respective sub-asset class. Women representation is highest for Core/Core-Plus where women-owned funds account for 2.0% of all funds in the sub-asset class. Women-owned funds have the lowest representation among opportunistic funds at 0.7%. Differences in diverse representation appear larger for minority-owned funds. Minority representation is highest among value added funds at 2.7% and is lowest for debt funds at 0.5%. The overall pattern of diversity remains similar when we examine diverse shares of AUM by sub-asset class. A key difference is that representation percentages are smaller when using AUM in lieu of number of funds. This reflects the smaller average sizes of women- and minority-owned real estate funds.

85
Figure 63. Diverse real estate funds as percentage of funds in sub-asset class (totals in parentheses).
Figure 64. Diverse real estate AUM as percentage of sub-asset class AUM (totals in parentheses).
In addition to the choice of strategy, real estate investors often select a particular property focus. For example, a real estate fund may specialize in making residential or commercial investments. We explore diversity levels across six broad property focuses: diversified, hotels, niche, office, operating companies, and retail.

86
Figure 65 plots women- and minority-ownership as percentages of funds within each property focus. Some ownership categories (e.g. women-owned hotel focused funds) do not have any real estate funds within a given property focus, and these bars take on a value of 0%. It is obvious that women representation is lowest for the hotel property focus—as we do not identify any women-owned funds in the category. On the other hand, women representation is highest for operating companies where they own 4.5% of funds within the specialty. We find an absence of minority-owned real estate funds in the niche and operating companies sectors. Surprisingly, minority-owned real estate funds account for a 11.5% of the hotel focus. Figure 66 shows representation by property focus using share of property focus AUM. By and large, the overall pattern of diversity remains similar. In most cases, representation falls when using AUMs instead of funds because of the smaller average sizes of diverse-owned funds. One notable exception is the increase in minority representation for operating companies from 4.5% of total funds to 6.0% of AUM. Although it is difficult to draw strong conclusions because of our small sample size, our data hint at potentially important differences in diversity by property focus.

87
Figure 65. Diverse real estate funds as percentages of total funds in property focus.
Figure 66. Diverse real estate AUM as percentage of total AUM in property focus.

88
Diverse Ownership Trends for Real Estate In this section, we analyze secular trends in the diverse ownership of real estate funds. As with PE, many of our time series are noisy because of the small number of diverse real estate funds raised in any particular vintage year. In addition, because real estate presents the greatest challenge for data collection our results should be viewed with a focus on the overall trend rather than on year to year changes. We first document the number and share of diverse-owned funds raised in each year between 2006 and 2017. Next, we examine whether there are similar trends in total capital raised by vintage year. Number of Real Estate Funds Raised: Figure 67 below displays, for each vintage year, the number of diverse-owned real estate funds raised as a percentage of all funds raised. Women-owned funds account for 0.9% of the funds raised in 2006, and by 2017 they make up 1.8% of total funds raised. Similarly, minority-owned representation climbs from 0.0% to 2.1% over the same period. In Figure 68, we plot the number of diverse-owned real estate funds raised by vintage year. In each year, between zero and six women- or minority-owned funds are raised. Because of the small number of funds, we avoid a detailed analysis of the year to year variation in the time series. There is some evidence, however, that the number of diverse funds raised per year may be increasing over time.
Figure 67. Diverse real estate funds raised as percentages of all funds raised, by vintage year.

89
Figure 68. Number of diverse real estate funds raised, by vintage year.
Trends in Real Estate Fundraising: We now construct trendlines based on diverse shares of total real estate fundraising. To calculate total fundraising by diverse-owned real estate funds, we sum the final sizes of women- and minority-owned real estate funds in each vintage year. Figure 69 shows diverse fundraising as a percentage of all real estate capital raised in each year from 2006-2017. Using AUMs, we find an upward trend for women representation with no clear pattern for minority representation. Figure 70 shows a spike in minority fundraising prior to the Great Recession, followed by a collapse in 2008 and an upward trend from 2009 to 2017. This is largely a result of the increase in the number of minority funds raised in 2007. For women, there appears to be a gradual increase in the amount of fundraising from 2006 to 2017. In closing, we have found some evidence that diverse representation has been increasing in recent years, particularly for women-owned funds. We leave to future researchers a more detailed analysis of secular trends as diversity databases continue to improve.

90
Figure 69. Diverse real estate fundraising as a percentage of total, by vintage year.
Figure 70. Diverse real estate total fundraising dollars, by vintage year.

91
Performance of Diverse-Owned Real Estate Funds This section examines whether there are differences in financial performance among diverse and non-diverse real estate funds. The real estate funds considered in this study are similar in structure to the PE funds. In fact, most real estate funds in our data are structured as limited partnerships or limited liability corporations. As a result, we estimate statistical models similar to those used in our PE analysis. Many real estate funds do not report performance data on a frequent basis. In addition, performance information on net multiples, that is multiples after subtracting fees and carry, is not available. Therefore, we use the most recently reported multiples and net IRRs available in our Preqin dataset. A fund’s multiple measures the number of times an investor receives back her initial investment. Net IRR is the discount rate on cash flows, after fees, required for the net present value of the investment to equal zero. Net IRRs are useful for comparing investment projects over different time horizons. Since IRR information is missing for the last two years of our sample, all statistics using net IRRs utilize data from vintage years 2006-2015. Table I in the Appendix reports descriptive statistics on financial performance for women-owned, minority-owned, and non-diverse-owned real estate funds. Since performance measures can suffer from skewness, we report both average and median values. Real estate fund performance, however, is determined by a number of factors—many of which are correlated with diverse-ownership. As a result, simple comparisons of average performance by gender or minority status are likely to be misleading. Hence, the averages reported in Table I are potentially affected by both diverse-ownership and other fund characteristics. To isolate the effect of women- and minority-ownership on fund performance, we estimate models that control for relevant fund characteristics such as size, type, geographic focus, firm location, vintage year, and property focus. The size of each fund is measured as the natural logarithm of final fund size in millions of constant 2009 USD. We estimate the following four regressions:
1. Multiple Baseline Model This model includes indicators for women- and minority-ownership in addition to controls for fund size, fund type, vintage year, and vintage year-asset class interactions.
2. Multiple Additional Controls Model Here we extend the first model by including additional control variables for firm location, property type, and geographic focus.
3. Net IRR Baseline Model Rather than the investment multiple, this model uses net IRR as the dependent variable.

92
4. Net IRR Additional Controls Model Here we extend the previous model by including additional control variables for firm location, property type, and geographic focus.
Our estimation results are presented in Table J in the Appendix. It is important to understand that the extremely small dataset makes these results very unreliable. In model (1), the average effects of women- and minority-ownership on performance are 0.05 and -0.22; however, only the estimate effect of minority-ownership on performance is statistically significant. Our preferred specification, model (2), includes additional controls for property type, geographic focus, and location and yields estimates of 0.04 and -0.15. We should note that, again, only the estimated impact of minority ownership is statistically significant at the 10% level. These results mean, that on average, minority-owned real estate funds have a multiple that is 0.15 lower than a non-minority-owned fund, holding all else constant. As with private equity, we find that larger funds are associated with lower multiples. Models (3) and (4) estimate the same specifications using net IRR as the dependent variable. Here, we find little evidence that women- and minority-ownership are associated with differences in financial performance. This may be a function of the smaller sample size as fewer funds report net IRR returns. Finally, we compute the percentage of high performing diverse-owned funds. We find that 26.7% and 17.9% of women- and minority-owned funds achieve top quartile returns. To conclude, we find some suggestive evidence that minority-owned real estate funds underperform non-minority-owned funds. However, our results do not hold for all model specifications. Moreover, data collection on diversity in the real estate industry is by far the most incomplete of any asset class we consider. Therefore, we interpret our results with some mild trepidation and encourage future research on the relationship between diversity and real estate fund performance.

Page 93
93
V. Conclusion This study aims to provide a comprehensive examination of diversity in the ownership of asset management firms and to quantify the level of ownership across a variety of measures. For this project, the Knight Foundation contracted with Bella Private Markets to update and enhance the 2017 Diverse Asset Management Project Firm Assessment. We consider four asset classes: mutual funds, hedge funds, private equity (PE), and real estate. The primary focus of this project is quantifying the number of diverse-owned firms, funds, and the diverse-owned share of assets under management (AUM). Where possible, we also investigate secular trends, financial performance, and institutional investors associated with diverse-owned firms. Our findings are summarized by asset class below: Mutual Funds: Women- and minority-owned firms are underrepresented, whether measured by number of firms, number of funds, or amount of AUM. Over the past six years, the representation of diverse-owned firms has fluctuated, but there is no clear upward or downward trend. We do not find evidence of differences in performance among diverse and non-diverse mutual funds. Therefore, weak performance is unlikely to be a contributing factor to underrepresentation. Hedge Funds: Similarly, we note an underrepresentation of diverse-owned firms in the hedge fund industry, though there is some evidence for increased representation since 2010. The performance analysis provides no conclusive evidence that the performance of diverse-owned hedge funds is worse than the performance of non-diverse hedge funds. Private Equity and Real Estate: We find low representation of diverse-owned firms in PE and real estate. In our timeline analysis, we find some evidence of an increase in the representation of women- and minority-owned firms since 2006—particularly for PE. In our performance study, we find no evidence that women- or minority-ownership significantly impacts returns. For real estate, we find weak evidence that minority-owned funds underperform non-minority-owned funds. We note, however, that our results are unreliable because of small sample sizes. Finally, we document that diverse PE managers tend to have fewer limited partners relative to all PE firms.
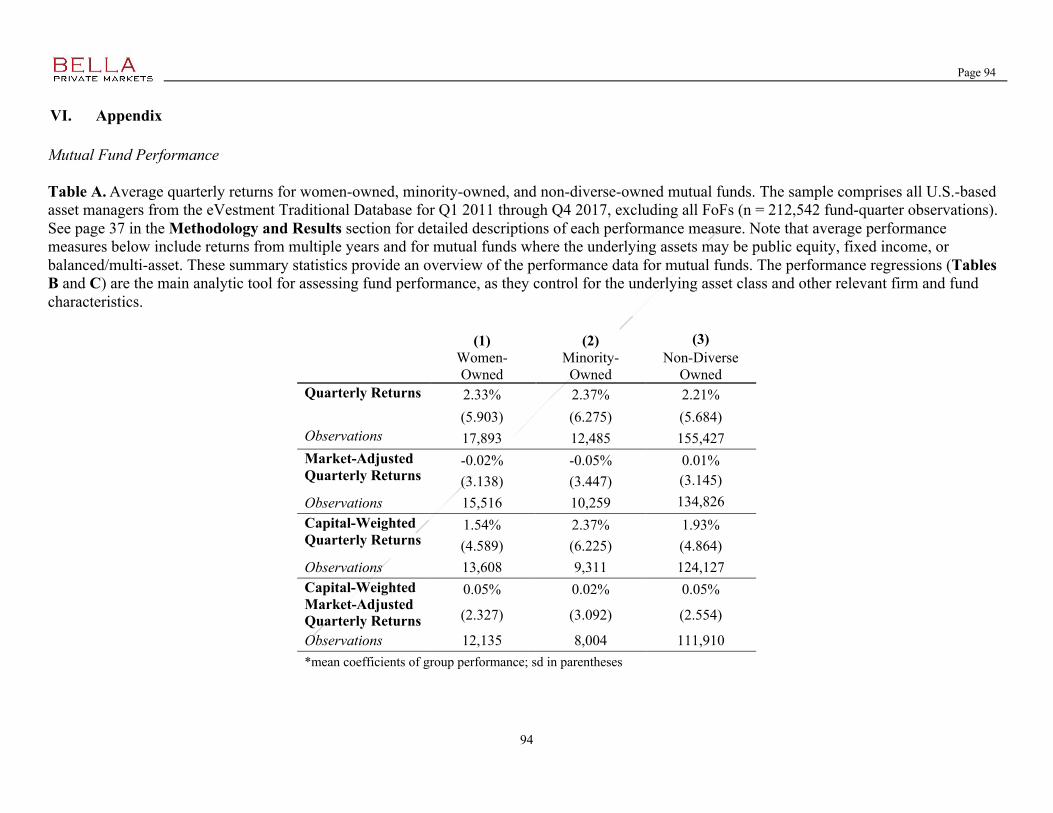
Page 94
94
VI. Appendix Mutual Fund Performance Table A. Average quarterly returns for women-owned, minority-owned, and non-diverse-owned mutual funds. The sample comprises all U.S.-based asset managers from the eVestment Traditional Database for Q1 2011 through Q4 2017, excluding all FoFs (n = 212,542 fund-quarter observations). See page 37 in the Methodology and Results section for detailed descriptions of each performance measure. Note that average performance measures below include returns from multiple years and for mutual funds where the underlying assets may be public equity, fixed income, or balanced/multi-asset. These summary statistics provide an overview of the performance data for mutual funds. The performance regressions (Tables B and C) are the main analytic tool for assessing fund performance, as they control for the underlying asset class and other relevant firm and fund characteristics.
(1) (2) (3)
Women-Owned
Minority-Owned
Non-Diverse Owned
Quarterly Returns 2.33% 2.37% 2.21% (5.903) (6.275) (5.684)
Observations 17,893 12,485 155,427 Market-Adjusted Quarterly Returns
-0.02% -0.05% 0.01% (3.138) (3.447) (3.145)
Observations 15,516 10,259 134,826 Capital-Weighted Quarterly Returns
1.54% 2.37% 1.93% (4.589) (6.225) (4.864)
Observations 13,608 9,311 124,127 Capital-Weighted Market-Adjusted Quarterly Returns
0.05% 0.02% 0.05%
(2.327) (3.092) (2.554)
Observations 12,135 8,004 111,910 *mean coefficients of group performance; sd in parentheses

Page 95
95
Table B. Performance regressions using indicators for firms with 25%+ ownership held by women and/or minorities. The sample includes fund-quarter observations for U.S.-based asset managers from the eVestment Traditional Database for Q1 2011 through Q4 2017 (excluding all FoFs). For equity and fixed income asset classes, the coefficients represent the difference in performance compared to the balanced/multi-asset category. We control for quarter, strategy and geographic focus fixed effects. We also control for quarter-asset class fixed effects, except for specifications with market adjusted quarterly returns. Additional information on explanatory variables can be found in the Data section. (1) (2) (3) (4) (5) (6) VARIABLES Qtr. Returns Qtr. Returns
(Add’l Controls) Market-Adjusted
Qtr. Returns Capital-
Weighted Qtr. Returns
Capital-Weighted Capital-Weighted Qtr. Returns Market-Adjusted (Add’l Controls) Qtr. Returns Women-Owned -0.0115 0.00746 -0.0331 -0.00617 -0.000128 -0.0539 (0.0513) (0.0523) (0.0615) (0.0518) (0.0525) (0.0631) Minority-Owned 0.00511 0.00489 -0.0767 0.0162 0.0130 -0.0534 (0.0452) (0.0444) (0.0620) (0.0483) (0.0476) (0.0712) Lagged Firm Assets (log) 0.0299*** 0.0287*** 0.0113 0.0160** 0.0130** 0.00118
(0.00693) (0.00735) (0.00920) (0.00644) (0.00625) (0.00789) Lagged Fund Assets (log) -0.0354*** -0.0342*** -0.0178**
(0.00624) (0.00660) (0.00759) Asset Class = Equity 1.550*** 1.570*** 0.155** 1.483*** 1.526*** 0.101 (0.183) (0.170) (0.0708) (0.162) (0.158) (0.0726) Asset Class = Fixed Income -3.373*** -3.247*** 0.531*** -3.434*** -3.290*** 0.507*** (0.179) (0.167) (0.0817) (0.155) (0.153) (0.0891) Beta 0.347*** 0.340*** (0.0900) (0.0992) Product Status = Active 0.285*** 0.312*** 0.196*** 0.240*** (0.0431) (0.0507) (0.0434) (0.0551) Constant 2.048* 1.584 -0.169 2.392*** 2.033** -0.285 (1.054) (1.166) (0.573) (0.811) (0.827) (0.558) Observations 135,316 121,979 121,979 132,234 119,927 119,927 R-squared 0.714 0.723 0.142 0.713 0.721 0.142
Clustered standard errors by firm in parentheses *** p<0.01, ** p<0.05, * p<0.1

Page 96
96
Table C. Performance regressions using indicators for substantial women ownership (25-49%), majority women ownership (50%+), substantial minority ownership (25-49%), and majority minority ownership (50%+). The sample includes fund-quarter observations for U.S.-based asset managers from the eVestment Traditional Database for Q1 2011 through Q4 2017 (excluding all FoFs). For equity and fixed income asset classes, the coefficients represent the difference in performance compared to the balanced/multi-asset category. We control for quarter, strategy and geographic focus fixed effects. We also control for quarter-asset class fixed effects, except for specifications with market-adjusted quarterly returns. (1) (2) (3) (4) (5) (6) VARIABLES Qtr. Returns Qtr. Returns
(Add’l Controls) Market-Adjusted
Qtr. Returns Capital-Weighted
Qtr. Returns Capital-Weighted Capital-Weighted
Qtr. Returns Market-Adjusted (Add’l Controls) Qtr. Returns Substantially Women-Owned -0.0752 -0.0474 -0.108 -0.0516 -0.0361 -0.111 (0.0815) (0.0836) (0.102) (0.0873) (0.0890) (0.105) Majority Women-Owned 0.0343 0.0474 0.0261 0.0248 0.0226 -0.0118 (0.0583) (0.0584) (0.0633) (0.0555) (0.0546) (0.0646) Substantially Minority-Owned 0.176 0.168 0.0180 0.257* 0.245* 0.137 (0.127) (0.128) (0.168) (0.143) (0.144) (0.172) Majority Minority-Owned -0.0142 -0.0143 -0.0863 -0.0146 -0.0176 -0.0772 (0.0462) (0.0455) (0.0650) (0.0482) (0.0473) (0.0748) Firm Assets (mn USD)
Lagged 1 period 0.0300*** 0.0287*** 0.0114 0.0157** 0.0127** 0.000849 (0.00693) (0.00736) (0.00922) (0.00642) (0.00621) (0.00787)
Fund Assets (mn USD) Lagged 1 period
-0.0354*** -0.0343*** -0.0178** (0.00623) (0.00660) (0.00758)
Asset Class = Equity 1.550*** 1.569*** 0.152** 1.482*** 1.525*** 0.101 (0.183) (0.170) (0.0696) (0.162) (0.158) (0.0724) Asset Class = Fixed Income -3.371*** -3.245*** 0.529*** -3.434*** -3.289*** 0.508*** (0.179) (0.167) (0.0807) (0.155) (0.154) (0.0889) Beta 0.347*** 0.340*** (0.0901) (0.0997) Product Status = Active 0.285*** 0.313*** 0.195*** 0.239*** (0.0431) (0.0506) (0.0434) (0.0552) Constant 2.048* 1.585 -0.171 2.396*** 2.039** -0.284 (1.058) (1.169) (0.573) (0.813) (0.829) (0.557) Observations 135,317 121,980 121,980 132,096 119,847 119,847 R-squared 0.714 0.723 0.142 0.714 0.722 0.142
Clustered standard errors by firm in parentheses *** p<0.01, ** p<0.05, * p<0.1

Page 97
97
Hedge Fund Performance Table D. The average performance of diverse-owned hedge funds. The sample comprises all U.S.-based hedge funds from HFR, excluding funds of hedge funds. For detailed descriptions of each performance measure, please see the Methodology and Results section.
(1) (2) (3)
Women-Owned
Minority-Owned
Non-Diverse Owned
Monthly Returns 0.59% 0.72% 0.54% (4.427) (4.716) (4.792)
Observations 10,361 17,019 412,886 Market-Adjusted Monthly Returns
0.19% 0.27% 0.20% (3.861) -4.173 (3.997)
Observations 5,871 8,691 223,442 Capital-Weighted Monthly Returns
0.33% 0.42% 0.37% (4.033) (3.364) (3.124)
Observations 10,216 16,749 406,203 Capital-Weighted Market-Adjusted Monthly Returns
-0.04% 0.10% 0.16%
(3.637) (3.038) (2.651)
Observations 5,769 8,499 219,097 *mean coefficients of group performance; sd in parentheses

Page 98
98
Table E. Performance regressions using fund-month observations for U.S.-based hedge funds from HFR (excluding funds of hedge funds) from all available years. Each regression controlled for region, strategy, month, and strategy-month fixed effects. Additional information on explanatory variables can be in the Data section. For detailed descriptions of each performance measure, see the Methodology and Results section.
(1) (2) (3) (4) (5) (6) VARIABLES Monthly
Returns Monthly Returns (Add'l controls)
Market-Adjusted Monthly Returns
Capital Weighted Monthly Returns
Capital Weighted Monthly Returns (Add'l controls)
Capital Weighted Market. Adjusted Monthly Returns
Women-Owned -0.0403 -0.0522 -0.0707 -0.0466 -0.107 -0.106 (0.0607) (0.0571) (0.0648) (0.0638) (0.0937) (0.0999) Minority-Owned 0.179*** 0.105* 0.106* 0.0291 0.00657 -0.0292 (0.0579) (0.0586) (0.0622) (0.0450) (0.0621) (0.0718) ln(Fund Assets)
Lagged 1 Period -0.0639*** (0.00794)
-0.0341*** (0.00902)
-0.0278*** (0.00912)
Product Status = Active 0.466*** 0.472*** 0.269*** 0.261*** (0.0300) (0.0300) (0.0593) (0.0582) Beta -0.0337 -0.181*** (0.0239) (0.0383) Constant 4.126*** -4.352*** 0.0466 4.026*** -4.760*** 0.0659 (0.193) (0.266) (0.200) (0.330) (0.442) (0.387) Observations 421,343 231,378 231,378 421,343 231,378 231,378 R-squared 0.170 0.214 0.134 0.299 0.326 0.248
Clustered standard errors by firm in parentheses *** p<0.01, ** p<0.05, * p<0.1

Page 99
99
Table F. Performance regressions for U.S.-based hedge funds (excluding funds of hedge funds). The sample includes fund-month observations from January 2011 through December 2017. Each regression controls for region, strategy, month, and strategy-month fixed effects. Additional information on explanatory variables can be found in the Data section. For detailed descriptions of each performance measure, see the Methodology and Results section. (1) (2) (3) (4) (5) (6) VARIABLES Monthly Returns Monthly Returns
(Add'l controls) Market Adjusted Monthly Returns
Capital Weighted Monthly Returns
Capital Weighted Monthly Returns (Add'l controls)
Capital Weighted Market Adjusted Monthly Returns
Women-Owned -0.0907 -0.0452 -0.0668 -0.0517 -0.0332 -0.0517 (0.0609) (0.0501) (0.0625) (0.0783) (0.0748) (0.0915) Minority-Owned 0.104 0.0698 0.0767 0.0241 0.0125 -0.0110 (0.0634) (0.0549) (0.0606) (0.0644) (0.0688) (0.0667) Fund Assets (mn USD)
Lagged 1 Period -0.0519***
(0.0108) -0.0159* (0.00857)
-0.0128 (0.00903)
Product Status = Active 0.449*** 0.438*** 0.251*** 0.247*** (0.0311) (0.0307) (0.0757) (0.0817) Beta 0.0597** -0.00551 (0.0288) (0.0662) Constant 3.218*** 3.160*** 0.956*** 2.349*** 2.372*** 0.402 (0.218) (0.274) (0.205) (0.393) (0.398) (0.310) Observations 206,845 155,201 155,201 206,845 155,201 155,201 R-squared 0.147 0.168 0.088 0.281 0.297 0.235
Clustered standard errors by firm in parentheses *** p<0.01, ** p<0.05, * p<0.1
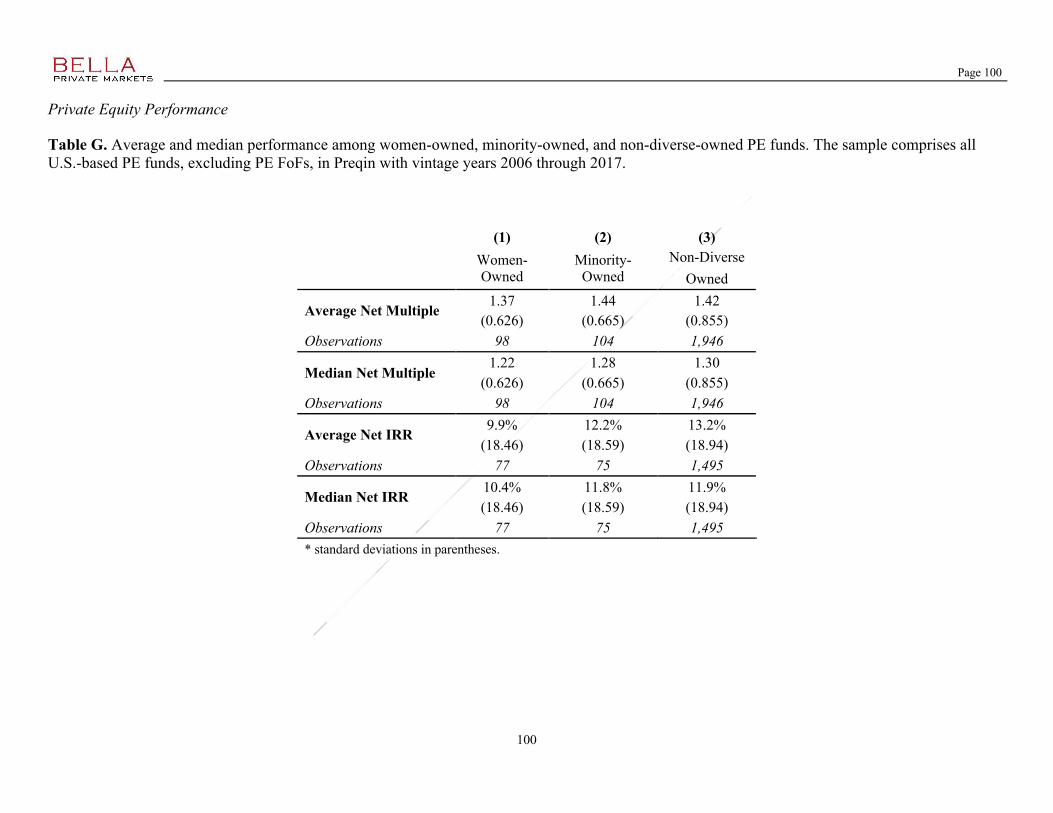
Page 100
100
Private Equity Performance
Table G. Average and median performance among women-owned, minority-owned, and non-diverse-owned PE funds. The sample comprises all U.S.-based PE funds, excluding PE FoFs, in Preqin with vintage years 2006 through 2017.
(1) (2) (3)
Women-Owned
Minority-Owned
Non-Diverse Owned
Average Net Multiple 1.37 1.44 1.42 (0.626) (0.665) (0.855)
Observations 98 104 1,946
Median Net Multiple 1.22 1.28 1.30
(0.626) (0.665) (0.855) Observations 98 104 1,946
Average Net IRR 9.9% 12.2% 13.2% (18.46) (18.59) (18.94)
Observations 77 75 1,495
Median Net IRR 10.4% 11.8% 11.9% (18.46) (18.59) (18.94)
Observations 77 75 1,495 * standard deviations in parentheses.

Page 101
101
Table H. Performance regressions for U.S.-based PE funds in Preqin with vintage years 2006 through 2017, excluding funds of funds. The coefficients for the variable “Fund Type = VC” represent the difference in performance for venture capital funds compared to the subset of non-venture PE funds. Coefficients for each of the geographic location variables (i.e., “West,” “Midwest,” and “South”) compare performance of funds in each of these regions with the excluded region (“Northeast”). Additional information on explanatory variables can be found in the Data section. For detailed descriptions of each performance measure, see the Methodology and Results section.
(1) (2) (3) (4) VARIABLES Net Multiple Net Multiple Net IRR Net IRR Women-Owned -0.130 -0.118 -3.866* -3.210 (0.0803) (0.0824) (2.030) (2.020) Minority-Owned 0.0803 0.0812 0.457 1.106 (0.0777) (0.0825) (2.083) (2.100) ln(Final Fund Size) -0.0418*** -0.0490** -0.901** -1.027** (0.0162) (0.0199) (0.416) (0.431) VC -0.253** -0.297*** -4.479** -5.763*** (0.111) (0.115) (1.853) (2.035) West 0.0530 0.152 (0.0508) (1.215) Midwest 0.0767 0.931 (0.0502) (1.288) South -0.104*** -1.590 (0.0371) (1.719) Year FE Yes Yes Yes Yes Year-Asset FE Yes Yes Yes Yes Industry FE No Yes No Yes Focus FE No Yes No Yes Constant 1.808*** 1.905*** 13.41*** 13.09*** (0.142) (0.216) (3.047) (3.634) Observations 2,057 2,057 1,585 1,585 R-squared 0.094 0.116 0.043 0.066
Clustered standard errors by firm in parentheses *** p<0.01, ** p<0.05, * p<0.1

Page 102
102
Real Estate Performance Table I. Average and median performance among women-owned, minority-owned, and non-diverse-owned real estate funds. The sample comprises all U.S.-based real estate funds, excluding PE FoFs, in Preqin with vintage years 2006 through 2017.
(1) (2) (3)
Women-Owned
Minority-Owned
Non-Diverse Owned
Average Multiple 1.31 1.22 1.32 (0.244) (0.481) (0.448)
Observations 18 30 916
Median Multiple 1.28 1.35 1.27 (0.244) (0.481) (0.448)
Observations 18 30 916
Average Net IRR 16.9% 13.4% 10.8% (7.264) (21.71) (13.64)
Observations 15 26 741
Median Net IRR 14.0% 11.7% 11.7% (7.264) (21.71) (13.64)
Observations 15 26 741 * standard deviations in parentheses.

Page 103
103
Table J. Performance regressions for U.S.-based PE funds in Preqin with vintage years 2006 through 2017, excluding funds of funds. The variable “Debt Focused” takes a value of unity if the real estate fund falls into the debt sub-asset class. The regional dummy variables capture effects relative to the omitted Northeast region.
(1) (2) (3) (4) VARIABLES Multiple Multiple Net IRR Net IRR Women-Owned 0.0489 0.0361 1.300 0.832 (0.0921) (0.0920) (3.223) (3.123) Minority-Owned -0.217** -0.153* -0.416 0.830 (0.103) (0.0922) (5.013) (5.480) ln(Final Fund Size) -0.0500*** -0.0379*** -0.800* -0.472 (0.0126) (0.0133) (0.432) (0.465) Debt Focused -0.104 -0.210 -9.489 -2.727 (0.154) (0.193) (9.740) (4.484) West -0.0334 -0.972 (0.0360) (1.179) Midwest -0.0237 1.813 (0.0420) (1.551) South 0.0195 0.321 (0.0456) (1.449) Year FE Yes Yes Yes Yes Year-Asset FE Yes Yes Yes Yes Property FE No Yes No Yes Focus FE No Yes No Yes Constant 1.331*** 1.065*** 2.815 -3.992 (0.0888) (0.124) (3.156) (3.950) Observations 948 886 767 710 R-squared 0.302 0.351 0.276 0.331
Clustered standard errors by firm in parentheses *** p<0.01, ** p<0.05, * p<0.1
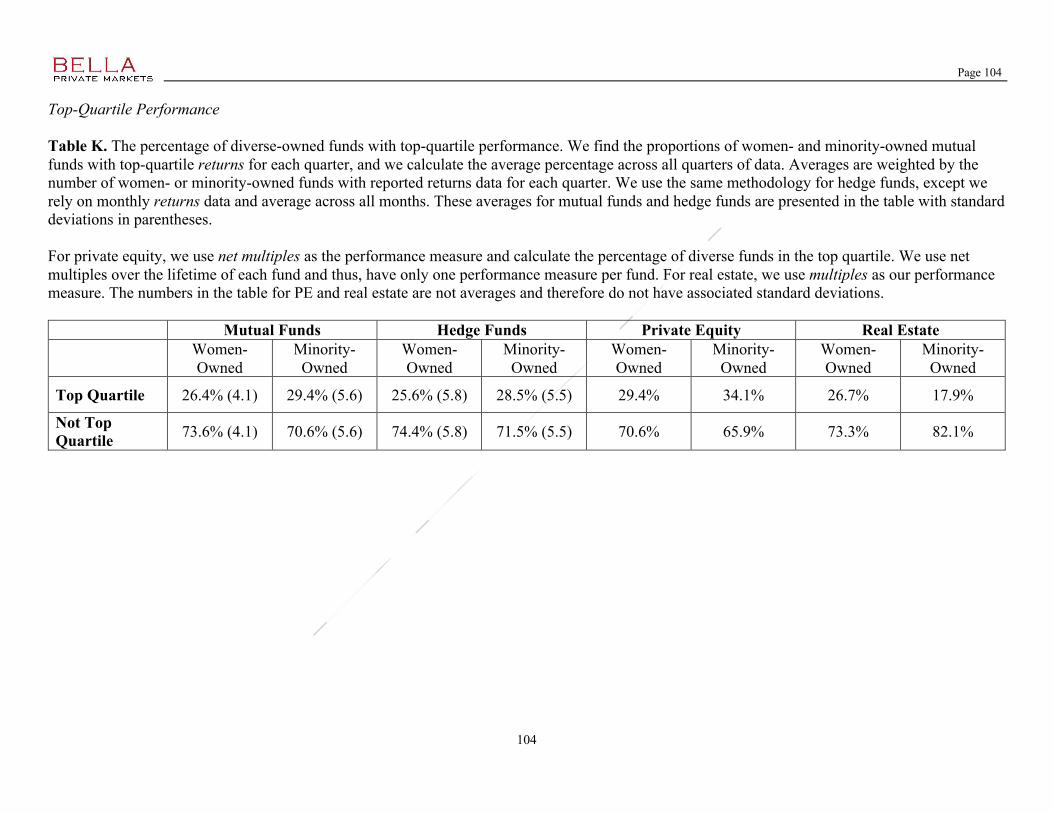
Page 104
104
Top-Quartile Performance Table K. The percentage of diverse-owned funds with top-quartile performance. We find the proportions of women- and minority-owned mutual funds with top-quartile returns for each quarter, and we calculate the average percentage across all quarters of data. Averages are weighted by the number of women- or minority-owned funds with reported returns data for each quarter. We use the same methodology for hedge funds, except we rely on monthly returns data and average across all months. These averages for mutual funds and hedge funds are presented in the table with standard deviations in parentheses. For private equity, we use net multiples as the performance measure and calculate the percentage of diverse funds in the top quartile. We use net multiples over the lifetime of each fund and thus, have only one performance measure per fund. For real estate, we use multiples as our performance measure. The numbers in the table for PE and real estate are not averages and therefore do not have associated standard deviations. Mutual Funds Hedge Funds Private Equity Real Estate Women-
Owned Minority-
Owned Women-Owned
Minority-Owned
Women-Owned
Minority-Owned
Women-Owned
Minority-Owned
Top Quartile 26.4% (4.1) 29.4% (5.6) 25.6% (5.8) 28.5% (5.5) 29.4% 34.1% 26.7% 17.9%
Not Top Quartile 73.6% (4.1) 70.6% (5.6) 74.4% (5.8) 71.5% (5.5) 70.6% 65.9% 73.3% 82.1%