Embed Size (px)
Citation preview

2018FINANCIAL REPORT

1 INDEPENDENT AUDITORS’ REPORT 3 MANAGEMENT’S DISCUSSION AND ANALYSIS 15 FINANCIAL STATEMENTS 20 NOTES TO FINANCIAL STATEMENTS49 SCHEDULES OF REQUIRED SUPPLEMENTARY INFORMATION BOARD OF REGENTS AND ADMINISTRATIVE OFFICERSINSIDE
BACK COVER
1 Prior to 2018, this number represents headcount for core faculty (Professorial, Instructional and Research). Starting in 2018, this number represents full time faculty from all campuses including the Medical Centers.2 Full time equivalents - restated (historically) using centralized data source and enterprise definitions3 Includes Valley Medical Center and Northwest Hospital in 2018 and 2013 only4 Net of scholarship allowances of $154,854,000 in 2018, $135,354,000 in 2013 and $69,027,000 in 20085 Stated at fair value6 Gross square footage, all campuses
University Facts
Table of Contents
FISCAL YEAR 2018 Academic Year
2017–2018
FISCAL YEAR 2013 Academic Year
2012–2013
FISCAL YEAR 2008 Academic Year
2007–2008
STUDENTS
Autumn Enrollment (headcount)Undergraduate 41,670 36,785 32,355Graduate 14,059 12,782 10,591Professional 2,126 1,999 1,803TOTAL 57,855 51,566 44,749
Professional and Continuing Education – Course and Conference Registrations 79,503 74,922 56,097
Number of Degrees Awarded Bachelor’s 11,179 9,782 8,181Master’s 4,514 3,906 2,904Doctoral 820 763 622Professional 551 566 504TOTAL 17,064 15,017 12,211
FACULTY 1 4,380 4,356 3,984
FACULTY AND STAFF2 30,932 26,315 24,468
RESEARCH FUNDING – ALL SOURCES (in thousands of dollars) $ 1,350,767 $ 1,122,933 $ 1,010,941
SELECTED REVENUES (in thousands of dollars)
Net Patient Service and Other Medical-Related Revenues 3 $ 2,710,758 $ 1,971,451 $ 968,215Gifts, Grants, and Contracts 1,627,139 1,458,196 1,115,974Tuition and Fees 4 989,912 808,053 419,690Auxiliary Enterprises and Other Revenues 660,442 473,167 312,515Investment Income 404,412 341,241 77,379State Appropriations (Operating) 362,267 218,165 388,485
SELECTED EXPENSES (in thousands of dollars)
Medical-Related 3 $ 2,335,063 $ 1,785,696 $ 748,832Instruction, Academic Support and Student Services 1,981,058 1,426,386 1,193,775Research and Public Service 834,139 803,980 654,468Institutional Support and Physical Plant 836,674 687,481 524,900Auxiliary Enterprises 494,956 203,615 161,807
CONSOLIDATED ENDOWMENT FUND 5 (in thousands of dollars) $ 3,407,000 $ 2,347,000 $ 2,161,000
SQUARE FOOTAGE 6 (in thousands of square feet) 25,700 21,773 18,535

Independent Auditors’ Report
The Board of Regents University of Washington:
Report on the Financial Statements We have audited the accompanying financial statements of the business-type activities and the discretely presented component unit of the University of Washington (the University), an agency of the state of Washington, as of and for the year ended June 30, 2018, and the related notes to the financial statements, which collectively comprise the University’s basic financial statements as listed in the table of contents.
Management’s Responsibility for the Financial Statements Management is responsible for the preparation and fair presentation of these financial statements in accordance with U.S. generally accepted accounting principles; this includes the design, implementation, and maintenance of internal control relevant to the preparation and fair presentation of financial statements that are free from material misstatement, whether due to fraud or error.
Auditors’ Responsibility Our responsibility is to express opinions on these financial statements based on our audit. We conducted our audit in accordance with auditing standards generally accepted in the United States of America. Those standards require that we plan and perform the audit to obtain reasonable assurance about whether the financial statements are free from material misstatement.
An audit involves performing procedures to obtain audit evidence about the amounts and disclosures in the financial statements. The procedures selected depend on the auditors’ judgment, including the assessment of the risks of material misstatement of the financial statements, whether due to fraud or error. In making those risk assessments, the auditor considers internal control relevant to the entity’s preparation and fair presentation of the financial statements in order to design audit procedures that are appropriate in the circumstances, but not for the purpose of expressing an opinion on the effectiveness of the entity’s internal control. Accordingly, we express no such opinion. An audit also includes evaluating the appropriateness of accounting policies used and the reasonableness of significant accounting estimates made by management, as well as evaluating the overall presentation of the financial statements.
We believe that the audit evidence we have obtained is sufficient and appropriate to provide a basis for our audit opinions.
Opinions In our opinion, the financial statements referred to above present fairly, in all material respects, the respective financial position of the business-type activities and the discretely presented component unit of the University of Washington as of June 30, 2018, and the respective changes in financial position and, where applicable, cash flows thereof for the year then ended in accordance with U.S. generally accepted accounting principles.
KPMG LLP is a Delaware limited liability partnership and the U.S. member firm of the KPMG network of independent member firms affiliated with KPMG International Cooperative (“KPMG International”), a Swiss entity.
KPMG LLPSuite 29001918 Eighth AvenueSeattle, WA 98101

Unaudited – see accompanying notes to financial statements
2
Emphasis of Matters As discussed in note 1 to the financial statements, the financial statements of the University of Washington, an agency of the state of Washington, are intended to present the financial position, the changes in financial position, and where applicable, cash flows of only the respective portion of the governmental activities, the business-type activities, each major fund, and the aggregate remaining fund information of the state of Washington that are attributable to the transactions of the University of Washington and its discretely presented component unit. They do not purport to, and do not, present fairly the financial position of the state of Washington as of June 30, 2018, the changes in its financial position or, where applicable, its cash flows for the year then ended, in accordance with U.S. generally accepted accounting principles. Our opinion is not modified with respect to this matter.
As discussed in note 1 to the financial statements, on July 1, 2017, the University adopted new accounting guidance requiring governments providing postemployment benefits other than pensions (OPEB) to employees of state and local government employers to recognize the OPEB liability, as well as recognize most changes in the OPEB liability within benefits expense. Our opinion is not modified with respect to this matter.
As discussed in note 1 to the financial statements, on July 1, 2017, the University adopted new accounting guidance requiring governments receiving irrevocable split-interest agreements to recognize assets, liabilities, and deferred inflows of resources at the inception of the agreement. Our opinion is not modified with respect to this matter.
Other Matters Required Supplementary Information
U.S. generally accepted accounting principles require that the management’s discussion and analysis on pages 3 through 14, and the schedules of required supplementary information on pages 49 through 51, be presented to supplement the basic financial statements. Such information, although not a part of the basic financial statements, is required by the Governmental Accounting Standards Board who considers it to be an essential part of financial reporting for placing the basic financial statements in an appropriate operational, economic, or historical context. We have applied certain limited procedures to the required supplementary information in accordance with auditing standards generally accepted in the United States of America, which consisted of inquiries of management about the methods of preparing the information and comparing the information for consistency with management’s responses to our inquiries, the basic financial statements, and other knowledge we obtained during our audit of the basic financial statements. We do not express an opinion or provide any assurance on the information because the limited procedures do not provide us with sufficient evidence to express an opinion or provide any assurance.
Other Information
Our audit was conducted for the purpose of forming an opinion on the financial statements that collectively comprise the University’s basic financial statements. The accompanying information under the table of contents titled “University Facts” is presented for purposes of additional analysis and is not a required part of the basic financial statements. This information has not been subjected to the auditing procedures applied in the audit of the basic financial statements, and accordingly, we do not express an opinion or provide any assurance on it.
Seattle, WAOctober 19, 2018

FINANCIAL REPORT 2018 / 3
Unaudited – see accompanying notes to financial statements
MANAGEMENT’S DISCUSSION & ANALYSIS

UNIVERSITY OF WASHINGTON / 4
Unaudited – see accompanying notes to financial statements Unaudited – see accompanying notes to financial statements
Management’s Discussion and Analysis
Key Financial Results for Fiscal Years 2018 and 2017
(in millions) 2018 2017Total operating revenues $ 5,172 $ 4,893Total operating expenses 5,859 5,666 Operating loss (687) (773)State appropriations 362 342Gifts 167 166Investment income 404 442Other nonoperating revenues, net 244 185 Increase in net position 490 362Net position, beginning of year 6,267 6,053Cumulative effect of accounting changes (described below): GASB 73 – UW Supplemental Retirement pension – (215) GASB 75 – Other post-employment benefits (1,660) – GASB 81 – Split interest agreements – 67Net position, beginning of year as restated 4,607 5,905Net position, end of year $ 5,097 $ 6,267
The discussion and analysis below provides an overview of the financial position and activities of the University of Washington (“University”) for the year ended June 30, 2018. This discussion has been prepared by management, and since it includes highly summarized data, should be read in conjunction with the financial statements and accompanying notes which follow this section.
Financial Highlights for Fiscal Year 2018The University recorded a decrease in net position of $1.2 billion in fiscal year 2018, compared to an increase of $214 million in fiscal year 2017. GASB Statement No. 75, which was implemented in 2018, changed the way the University reflects costs associated with other post-employment benefits (OPEB), was the primary reason for this decrease in net position. Positive operating results helped to partially offset the impact from this accounting change, and contributed $490 million in 2018, compared to $362 million in 2017.
OPERATING REVENUESOperating revenues increased $279 million, or 6%, in 2018 driven by strong gains associated with each of the University’s core missions. Student tuition and fees increased $48 million as a result of operating fee increases together with growing student enrollment. Net patient services revenue increased $139 million due to greater patient volumes and case acuity. Grant and contract revenue increased $50 million, driven by a $23 million increase in revenue from Federal sponsors, and an $18 million increase from nongovernmental sponsors, most notably the Bill & Melinda Gates Foundation.
OPERATING EXPENSESOperating expenses increased $193 million, or 3%, in 2018 mostly driven by increased costs associated with employee salaries and benefits. Salaries expense increased $80 million due to merit increases, and benefits expense increased $61 million primarily due to the implementation of GASB Statement No. 75 which requires the University to begin reporting costs associated with OPEB benefits as they are earned instead of based on cash funding.
NONOPERATING REVENUESRevenues from nonoperating and other sources increased $42 million, or 4%, in 2018 primarily due to $20 million of additional state operating appropriations and an $85 million capital gift from the Bill & Melinda Gates Foundation for the University’s Population Health Initiative. These were offset, however, by a $37 million decrease in investment income for the year, and a $38 million decrease in capital appropriations as a result of having no state capital budget for the first six months of fiscal year 2018. The University adjusts the carrying value of investments to market value each year, with the change recorded as investment income or loss.
Governmental Accounting Standards Board (GASB) principles require that revenues from state appropriations, investment income and gifts be considered nonoperating while the expenses funded from these revenues are categorized as operating. As a result, the University will typically reflect an operating loss on its Statements of Revenues, Expenses and Changes in Net Position.
CHANGES IN ACCOUNTING STANDARDSThe University implemented GASB Statement No. 73, “Accounting and Financial Reporting for Pensions and Related Assets That Are Not Within the Scope of GASB Statement 68, and Amendments to Certain Provisions of GASB Statements 67 and 68” during fiscal year 2017. This statement changed how the University reports its obligation for retiree benefits associated with the University of Washington Supplemental Retirement Plan (UWSRP). Prior to implementing this Statement, the UWSRP pension liability was being ratably accrued over several years, and UWSRP pension expense was equal to the actuarially determined Annual Required Contribution. Under Statement No. 73, the University must record the total pension liability, and most changes in the total pension liability are now reflected in pension expense in the period of the change, while others are reported as Deferred Inflows or Deferred Outflows of Resources, and amortized to expense over future periods. With the adoption of GASB Statement No. 73, unrestricted net position was restated at July 1, 2016 by a decrease of $215 million for the difference between the beginning total pension liability and the amount previously reported as the UWSRP pension liability.
The University implemented GASB Statement No. 75, “Accounting and Financial Reporting for Postemployment Benefits Other Than Pensions” (OPEB) during fiscal year 2018. As a result of implementing Statement No. 75, the University has recognized its proportionate share of the state of Washington’s actuarially determined total OPEB liability, deferred inflows of resources and deferred outflows of resources, and OPEB expense. Prior to adopting this Statement the University’s financial statements did not reflect any OPEB liability or associated deferred inflows or outflows, and reported OPEB expense based on cash contributions paid to the OPEB plan administrator. In addition to the reporting changes described above, unrestricted net position was restated at July 1, 2017 by a decrease of $1.7 billion. Fiscal year 2018 financial results reflect application of the accounting

FINANCIAL REPORT 2018 / 5
Unaudited – see accompanying notes to financial statements
changes required by Statement No. 75, but those changes have not been applied to fiscal year 2017 amounts due to the constraints of available information from the Washington State Office of the State Actuary.
The University also implemented GASB Statement No. 81, “Irrevocable Split-Interest Agreements” during fiscal year 2018. This Statement changes the way that governments reflect resources received pursuant to irrevocable split-interest agreements, both at inception and throughout the life of the associated contract. Specifically, where the University has a remainder interest in a trust that is also managed by the University, revenues will no longer be recognized when the asset is acquired and upon periodic revaluation, but will instead be recorded as a deferred inflow of resources and recognized at termination of the contract. This change has resulted in the restatement of July 1, 2016 restricted non-expendable net position together with an increase in deferred inflows. Additionally, where the University has a lead interest in a trust that is not managed by the University, revenues will now be recognized both when the asset is received or communicated to the University, and upon periodic revaluation. These events were previously not reflected in the financial statements of the University. This change has also resulted in the restatement of July 1, 2016 restricted non-expendable net position, together with an increase in investments. The net impact of implementing these accounting changes has been an increase in beginning restricted non-expendable net position of $67 million. Fiscal years 2017 and 2018 in this management’s discussion and analysis both reflect application of the accounting changes required by Statement No. 81. This is different than the Basic Financial Statements following this section, which reflect these restatements applied as of July 1, 2017 due to the single-year presentation.
Using the Financial StatementsThe University’s financial statements are prepared in accordance with GASB principles, which establish standards for external financial reporting for public colleges and universities. GASB standards require that financial statements be presented on a consolidated basis in order to focus on the University as a whole. These financial statements include the following components:
• Independent Auditors’ Report presents an unmodified opinion prepared by our auditors, KPMG LLP, on the fairness in all material respects of our financial statements.
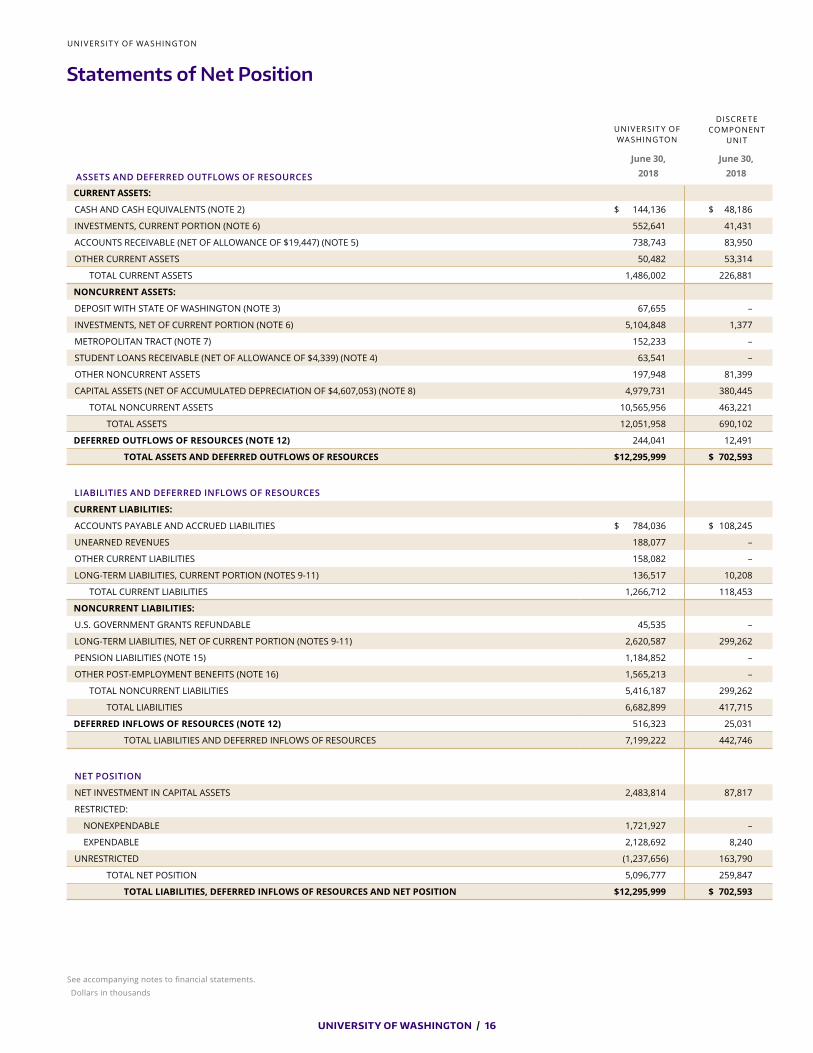
• Statements of Net Position present the assets and deferred outflows of resources, liabilities and deferred inflows of resources, and net position of the University at a point in time (June 30, 2018). Their purpose is to present a financial snapshot of the University. This statement aids the reader in determining the assets available to continue the University’s operations, how much the University owes to employees and vendors, whether the University has any deferred outflows or inflows other than assets or liabilities, and provides a picture of net position and its availability for expenditure by the University.
• Statements of Revenues, Expenses and Changes in Net Position present the total revenues earned and expenses incurred by the University for operating, nonoperating and other related activities, during a period of time (the fiscal
year ended June 30, 2018). Their purpose is to assess the University’s operating and nonoperating activities.
• Statements of Cash Flows present cash receipts and payments of the University during a period of time (the fiscal year ended June 30, 2018). Their purpose is to assess the University’s ability to generate net cash flows and meet its obligations as they come due.
• Notes to the Financial Statements present additional information to support the financial statements. Their purpose is to clarify and expand on the information in the financial statements. Notes are referenced in this discussion to indicate where details of the financial highlights may be found.
The University has had a strategic alliance with Valley Medical Center, a Washington public hospital district, since 2011. GASB standards require that this entity be presented as a discrete component unit of the University; therefore, its financial position at June 30, 2018, and results of operations for the year ended June 30, 2018, are reported in a separate column for financial statement presentation purposes (see Note 1 to the Financial Statements). The analysis which follows includes the consolidated balances of the University of Washington and its blended component units, but excludes the financial position and results of operations of Valley Medical Center.
Financial HealthSTATEMENTS OF NET POSITIONA summarized comparison of the University’s assets, liabilities, deferrals and net position as of June 30, 2018 and 2017, is shown below:
Summarized Statements of Net Position
Current assets include those that may be used to support current operations, and consist primarily of cash, short-term investments and accounts receivable. Current liabilities generally are due and payable over the course of the following fiscal year, and include
(in millions) 2018 2017Current assets $ 1,486 $ 1,427Noncurrent assets: Capital assets, net 4,980 4,737 Investments, net of current portion 5,105 4,834 Other 481 454Total assets 12,052 11,452
Deferred outflows 244 269 Total assets and deferred outflows 12,296 11,721Current liabilities 1,267 1,315Noncurrent liabilities: Bonds payable 2,334 2,275 Pensions and OPEB 2,750 1,422 Other 332 287 Total liabilities 6,683 5,299Deferred inflows 516 155 Total liabilities and deferred inflows 7,199 5,454Net position $ 5,097 $ 6,267

UNIVERSITY OF WASHINGTON / 6
Unaudited – see accompanying notes to financial statements Unaudited – see accompanying notes to financial statements
Management’s Discussion and Analysis
accounts payable and other accrued liabilities, unearned revenues, and the current portion of long-term debt.
The excess of current assets over current liabilities of $219 million in 2018, and $112 million in 2017, reflects the continuing ability of the University to meet its short-term obligations. Current assets increased $59 million,or 4%, in 2018 mostly due to an $80 million increase in cash, offset by a $33 million decrease in short term investments. Current liabilities decreased $48 million, or 4%, during the year, due in part to an $87 million decrease in the accrual for investment purchases not yet settled, $16 million decrease in the current portion of Revenue Bonds Payable, and a $10 million decrease in the current portion of the self-insurance reserve. These were partly offset by a $23 million increase in commercial paper debt.
Noncurrent assets increased $541 million, or 5%, in 2018 driven by an increase in long-term investments of $271 million as a result of strong investment returns during the year, an increase in capital assets of $243 million, and a $17 million increase in the University’s equity interest in the Seattle Cancer Care Alliance.
Noncurrent liabilities increased $1.4 billion, or 36%, during 2018 primarily due to implementation of GASB Statement No. 75. The ending OPEB liability, recognized for the first time in 2018 due to the requirements of Statement No. 75, was $1.6 billion. In addition, the long-term portion of bonds payable increased during the year by $59 million due to the net increase in general revenue bonds outstanding. These were offset by a decrease in the University’s pension liabilities of $238 million during the year, primarily those representing the University’s proportionate share of the pension plans administered by the Washington Department of Retirement Systems (DRS). The DRS net pension liability was favorably impacted during the year by stronger than expected investment returns on pension plan assets.
Deferred outflows of resources and deferred inflows of resources primarily represent pension and OPEB-related deferrals, and the University’s remainder interest in split-interest agreements. The decrease in deferred outflows of $25 million, or 9%, in 2018 primarily reflects the University’s proportionate share of a decrease in the state-wide amounts reported by the DRS due to differences between projected and actual investment earnings on pension plan assets, offset by the first-time deferral of $25 million representing post-measurement date OPEB contributions associated with the implementation of GASB Statement No. 75. Deferred inflows were impacted during 2018 by the University’s corresponding proportionate share of an increase in the state-wide difference between projected and actual earnings on pension plan assets (total deferred outflow and deferred inflow change for 2018 equaled $190 million). This was accompanied by the first-time deferral of $216 million representing the University’s proportionate share of state-wide deferred inflows related to changes in actuarial assumptions used in the 2018 OPEB valuation.
Endowment and Other InvestmentsInvestment returns provide an important source of revenue for the University’s programs. Among the funds invested by the University are endowments, operating reserves, life income trusts, annuities and gifts.
Endowed gifts supply permanent capital and an ongoing stream of current earnings to the University. Most endowments are commingled in the Consolidated Endowment Fund (CEF), a diversified investment fund. As in a mutual fund, each individual endowment maintains a separate identity and owns units in the fund.
The CEF has experienced considerable growth over the past 10 years due to gifts and endowment returns. The number of individual endowments in the CEF has grown significantly, from 3,118 at June 30, 2009 to 4,904 at June 30, 2018. The market value of the CEF has similarly increased from $1.6 billion at June 30, 2009 to $3.4 billion at June 30, 2018.
The impact to program support has been substantial, with $929 million distributed over the past 10 years touching every part of the University. Programs supported by endowment returns include academic programs, scholarships, fellowships, professorships, chairs and research activities. Under the Board of Regents’ approved long-term spending policy for the CEF, quarterly distributions to programs are made based on an annual percentage rate of 4%, applied to the five-year rolling average of the CEF’s market valuation. An additional 1% is distributed to support fundraising and stewardship activities (0.80%) and investment management (0.20%). Similar to program distributions, the fee is based on the endowment’s five-year average market value.
The University of Washington Board of Regents is vested by statute with responsibility for the University’s properties and investments, and for establishing investment policy. The University of Washington Investment Management Company (UWINCO), led by the Chief Investment Officer, carries out the day-to-day activities of the investment portfolios. The University of Washington Investment Management Company Board (“UWINCO Board”), which consists of both Board of Regents’ members and external investment professionals, serves as an advisory board to UWINCO.
Endowment portfolios are commonly managed around a core set of objectives focused on the need to provide support for endowed programs in perpetuity. The Board of Regents, in conjunction with the UWINCO Board, establishes the policy asset allocation judged to be most appropriate for the University from a long-term potential return and risk perspective. The policy asset allocation is reviewed annually for its continuing fit with the University’s risk profile and with consideration of the changing dynamics of the capital markets.
The CEF asset allocation includes two clearly defined categories of investments: those which facilitate growth or appreciation (Capital Appreciation), and those which preserve endowment values (Capital Preservation). At June 30, 2018, 72% of the CEF was invested in Capital Appreciation and 28% in Capital Preservation. Following an expectation that market returns for equities will exceed bonds over the next decade, a medium-term objective is maintained of generally overweighting equity-oriented strategies with a focus on quality companies and downside protection. The University also maintains ample liquidity within Capital Preservation to meet its funding
(continued)

FINANCIAL REPORT 2018 / 7
Unaudited – see accompanying notes to financial statements
requirements, as well as to take advantage of market dislocations if opportunities arise.
For the fiscal year ending June 30, 2018, the CEF returned +9.6% versus +7.3% for the passive benchmark. The CEF’s Real Assets and Private Equity strategies led absolute returns this year. The CEF’s Capital Appreciation and Capital Preservation portfolios substantially outperformed their respective passive benchmarks.
All major equity indexes posted gains in 2018, led by US equities. Trade tensions and policy uncertainty appear to be on the rise. Forecasted returns have been trending down and a lower return, high-volatility environment is expected.
Key projects placed in service during 2018 include:
• Willow Hall – $83 million. Phase 4a of the Housing Master Plan included demolition of the existing McCarty Hall and construction of a new McCarty Hall along with Madrona and Willow Halls. Willow was available for occupancy in June 2018, whereas the remaining two facilities opened in September. Willow is a 221-unit residential building with various size units, most including private baths, and a dining facility called Center Table.
• New Burke Museum – $68 million. The existing Burke Museum was constructed in 1962 as a two-story brick building with 69,000 gross square feet (GSF). This project provided a new building to address the limitations and shortcomings of the existing facility, which does not meet contemporary standards for museum environments, collections storage, or public-use facilities. The new building size is 110,000 GSF.
• Fluke Hall Renovation – $36 million. This project renovated the Washington Nano Fabrication Facility (WNF) located on the first floor of Fluke Hall. The scope of work included roof replacement and refurbishment of other existing building infrastructure to allow the building to serve as a long-term core University research facility supporting academic research, industry partnership and a commercialization incubator.
• University of Washington Medical Center Expansion Phase 2 – $31 million. This project included a build-out of three bed floors and the OR suite within the new Montlake Tower (Phase 1), and renovation of approximately 125,000 square feet within the existing Cascade and Pacific Towers.
Debt The University’s Debt Policy governs the type and amount of debt the University may incur. It is designed to maintain access to capital markets and to minimize the risk-adjusted cost of capital.
The University’s debt portfolio consists primarily of fixed rate debt in the form of Revenue Bonds and General Obligation Bonds. As of June 30, 2018, the University had $2.3 billion of bonds and notes payable outstanding, an increase of 2% from June 30, 2017. Debt outstanding on the Metropolitan Tract is not included in these amounts (see Note 7).
Bonds and Notes Payable (in millions)
Consolidated Endowment Fund Market Value (in millions)
$3,500
$3,000
$2,500
$2,000
$1,500
$1,000
$500
$0
IN M
ILLI
ON
S
$2,154
$1,649
$1,830
$2,111
$2,347
$2,833
$3,076$2,968
2009 2010 2011 2012 2013 2014 2015 2016 2017 2018
$3,144
$3,407
The CEF has consistently maintained solid relative performance, beating both the passive benchmark and the median returns for public peers over most periods.
A portion of the University’s operating funds are invested in the CEF. As of June 30, 2018, these funds comprise $643 million of the CEF market value.
Capital ImprovementsThe University continues to expand its campuses and renovate existing facilities to meet the needs of its students, patients, faculty and staff. Significant capital asset expenditures (greater than $20 million) during fiscal year 2018 included $119 million for Phase 4a of the Housing Master Plan and the construction of McCarty, Madrona and Willow student residential buildings, $70 million for the Life Sciences Building, $44 million for the Bill & Melinda Gates Center for Computer Science & Engineering, $28 million for the new Burke Museum, and $25 million for Phase 2 of the University of Washington Medical Center expansion.
Sources of Funds
6% STATE FUNDING FOR OPERATIONS AND CAPITAL EXPENDITURES
3% OTHER
31% PATIENT SERVICES23% GRANTS ANDCONTRACTS
6% GIFTS
6% INVESTMENT INCOME
6% AUXILIARY ENTERPRISES
4% SALES AND SERVICES OFEDUCATIONAL DEPARTMENTS
15% TUITION AND FEES
22% INSTRUCTION
13% RESEARCH
9% ACADEMIC SUPPORT
3% SCHOLARSHIPS &FELLOWSHIPS
8% AUXILIARY
7% DEPRECIATION/AMORTIZATION
2% OTHER
3% OPERATION & MAINTENANCE OF PLANT
4% INSTITUTIONAL SUPPORT
29% MEDICAL RELATED
Uses of Funds
4% GENERAL OBLIGATION BONDS$95
95% GENERAL REVENUE BONDS$2,169
1% NOTES PAYABLE AND OTHER
$29

UNIVERSITY OF WASHINGTON / 8
Unaudited – see accompanying notes to financial statements Unaudited – see accompanying notes to financial statements
Management’s Discussion and Analysis
Moody’s Fiscal Year 2017 Public College and University Rating Distribution
(As of the June 2018 Moody’s Median Report)
NUMBER OF INSTITUTIONS
Aaa
Aa1
Aa2
Aa3
A1
A2
A3
Baa
0 10 20 30 40 50
13
8
12
19
49
41
31
14
UW
(in millions) 2018 2017Net investment in capital assets $ 2,484 $ 2,455Restricted: Nonexpendable 1,722 1,603 Expendable 2,129 1,859 Unrestricted (1,238) 350 Total net position $ 5,097 $ 6,267
In February 2018, the University issued $134 million of tax-exempt General Revenue bonds with an all-in true interest cost of 3.48%. Proceeds were used to fund various facilities including the construction of new residential housing (Phase 4a of the Housing Master Plan) and the new Life Sciences Building.
The University has a $250 million commercial paper program, which is typically used to fund project expenditures until long-term funding is secured. As of June 30, 2018, there was $90 million in commercial paper outstanding.
Credit ratings are an indicator of the University’s effectiveness in managing its financial resources. During fiscal year 2018, both Moody’s (Aaa) and Standard and Poor’s (AA+) reaffirmed the University’s credit ratings, though Moody’s did place the University on negative credit watch. These strong ratings carry substantial advantages for the University: continued and wider access to capital markets, lower interest rates on bonds, and the ability to negotiate favorable bond terms. The University’s short-term credit ratings were also affirmed at P-1 (Moody’s) and A-1+ (Standard and Poor’s).
Net PositionThe difference between total assets and deferred outflows, and total liabilities and deferred inflows, is referred to as net position or “equity”. Over time, the change in net position is one indicator of the improvement or decline in the University’s overall financial health when considered with nonfinancial factors such as enrollment, research awards, patient levels, and the condition of facilities.
The University reports its “equity” in four categories:
• Net Investment in Capital Assets – This is the University’s total investment in capital assets, net of accumulated depreciation and amortization and outstanding debt obligations related to those capital assets.
• Restricted Net Position:
– Nonexpendable net position, primarily endowments, represents gifts to the University’s permanent endowment funds. These are funds on which the donor or other external party has imposed the restriction that the corpus is not available for expenditure, but rather for investment purposes only, in order to produce income that is to be expended for the purposes specified.
– Expendable net position consists of resources which the University is legally or contractually obligated to spend in accordance with time or purpose restrictions placed by donors and/or other external parties, and includes the net appreciation of permanent endowments.
• Unrestricted Net Position – This is all other funds available to the University for any purpose associated with its mission. Unrestricted net position is not subject to externally imposed stipulations, but often is internally designated for specific purposes.
The University’s net position at June 30, 2018 and 2017 is summarized as follows:
Categories of Net Position
The Board of Regents typically authorizes the long-term debt (excluding commercial paper) issuance on a fiscal year basis. For fiscal year 2019, the Board authorized $102 million of issuance in July. Any increase would require additional approval by the Board.
Debt beyond fiscal year 2019 is managed through a process in which the University estimates debt capacity. Updated annually, key debt related financial metrics are benchmarked to peer institutions. Current estimates assume outstanding debt will remain flat for the next five years.
Net investment in capital assets increased $29 million, or 1%, in 2018. This balance typically increases as debt is paid off, or when the University funds fixed asset purchases without the use of external financing, for example by using internal reserves. This balance decreases as assets are depreciated. The increase in 2018 reflects greater additions to net capital assets during the year than the associated increase in capital asset-related debt, reflecting continued capital spend on previously approved projects together with a reduced pace for new debt issuances.
Restricted nonexpendable net position increased $119 million, or 7%, in 2018. This primarily reflects the receipt of $96 million of new endowment gifts during the year, together with investment income and an increase in the market value of underwater endowment investments.
(continued)

FINANCIAL REPORT 2018 / 9
Unaudited – see accompanying notes to financial statements
Sources of Funds
6% STATE FUNDING FOR OPERATIONS AND CAPITAL EXPENDITURES
3% OTHER
31% PATIENT SERVICES23% GRANTS ANDCONTRACTS
6% GIFTS
6% INVESTMENT INCOME
6% AUXILIARY ENTERPRISES
4% SALES AND SERVICES OFEDUCATIONAL DEPARTMENTS
15% TUITION AND FEES
22% INSTRUCTION
13% RESEARCH
9% ACADEMIC SUPPORT
3% SCHOLARSHIPS &FELLOWSHIPS
8% AUXILIARY
7% DEPRECIATION/AMORTIZATION
2% OTHER
3% OPERATION & MAINTENANCE OF PLANT
4% INSTITUTIONAL SUPPORT
29% MEDICAL RELATED
Uses of Funds
4% GENERAL OBLIGATION BONDS$95
95% GENERAL REVENUE BONDS$2,169
1% NOTES PAYABLE AND OTHER
$29
(in millions) 2018 2017Unrestricted net position, as reported $ (1,238) $ 350 Impact of GASB 68 - Pensions 706 762 Impact of GASB 75 - OPEB 1,764 – Unrestricted net position, excluding pensions and OPEB $ 1,232 $ 1,112
(in millions) 2018 2017
Tuition and fees $ 990 $ 942
Patient services 2,008 1,869
Grants and contracts 1,409 1,359
Other operating revenues 765 723
Total operating revenues 5,172 4,893
Salaries and benefits 3,661 3,519
Other Operating Expenses 2,198 2,147
Operating Loss (687) (773)
State appropriations 362 342
Gifts 167 166
Investment income 404 442
Other nonoperating revenues 321 262
Interest on capital asset-related debt (77) (77)
Increase in Net Position $ 490 $ 362
Restricted expendable net position increased $270 million, or 15%, in 2018. This category is primarily affected by new operating and capital gifts, and earnings or losses on restricted investments, including endowments. Unrealized gains in the market value for the CEF of $219 million were the primary reason for the increase during the year, offset by $77 million of realized losses. Additionally, unspent capital gifts increased $73 million as a result of giving by the Bill & Melinda Gates Foundation to the University’s Population Health Initiative.
Unrestricted net position decreased $1.6 billion in 2018, primarily due to the impact of restating fiscal year 2018 beginning net position as a result of implementing GASB Statement No. 75. The change in accounting treatment required by Statement No. 75 reduced beginning unrestricted net position by $1.7 billion, representing the University’s proportionate share of the state of Washington’s beginning total OPEB liability, less OPEB contributions paid by the University in the prior fiscal year. Excluding the impact of this accounting change, unrestricted net position increased by $72 million, or 21%, in 2018. Operating losses associated with unrestricted activities were $435 million for the year, together with interest expense on capital asset-related debt of $77 million. These were offset by $362 million of state operating appropriations, and $213 million of investment income on unrestricted investments.
At June 30, 2018, Unrestricted Net Position reflects a deficit of $1.2 billion due to the implementation of GASB Statement No. 68 (pensions) during fiscal year 2015, and the implementation of Statement No. 75 (OPEB) during fiscal year 2018. These Statements require the University to record its proportionate share of the state of Washington’s actuarially determined liabilities for pensions and OPEB. As a result of implementation, Unrestricted Net Position is negative despite historically positive operating results. The University’s Unrestricted Net Position, excluding the impacts from Statement No’s 68 and 75, is as follows:
Unrestricted Net Position Excluding Pensions and OPEB
STATEMENTS OF REVENUES, EXPENSES AND CHANGES IN NET POSITIONThe Statements of Revenues, Expenses and Changes in Net Position present the University’s results of operations and nonoperating items that result in the changes in net position for the year. In accordance with GASB reporting principles, revenues and expenses are classified as either operating or nonoperating. A condensed comparison of the University’s revenues, expenses and changes in net position for the years ended June 30, 2018 and 2017 follows:
Operating Results
The University’s operating loss decreased to $687 million in 2018, from $773 million in 2017. State appropriations are shown as nonoperating revenue, pursuant to GASB standards. If state appropriations were classified as operating revenue, the operating loss would have been $325 million in 2018, and $431 million in 2017.
The University has a diversified revenue base. No single source generated more than 31% of the total fiscal year 2018 revenues of $6.4 billion.

UNIVERSITY OF WASHINGTON / 10
Unaudited – see accompanying notes to financial statements Unaudited – see accompanying notes to financial statements
Management’s Discussion and Analysis
(in millions) 2018 2017Net Patient services $ 2,008 31% $ 1,869 31%Grants and contracts 1,468 23% 1,422 23%Tuition and fees 990 15% 942 15%Investment income 404 6% 442 7%Auxiliary enterprises 403 6% 374 6%Gifts 398 6% 289 5%State funding for operations 362 6% 342 6%Sales and services of educational departments 243 4% 217 4%State funding for capital projects 26 0% 64 1%Other 124 3% 144 2%
Total revenue – all sources $ 6,426 100% $ 6,105 100%
The following table summarizes revenues from all sources for the years ended June 30, 2018 and 2017:
Revenues from All Sources
Northwest Hospital & Medical Center (NWH) is a full-service medical facility with 281 beds, and treats approximately 10,000 inpatients per year. NWH joined UW Medicine in January, 2010. Specialized patient needs are met by the Stroke Center, Multiple Sclerosis Center, and other inpatient and outpatient services to the surrounding community.
UW Neighborhood Clinics (Neighborhood Clinics) is a network of clinics with 14 neighborhood locations throughout the greater Puget Sound area, providing primary, urgent and selected specialty care with a staff of 120 healthcare providers.
UW Physicians (UWP) is the physician practice group for more than 2,200 faculty physicians and healthcare providers associated with UW Medicine.
Airlift Northwest provides rapid emergency air transport services to critically ill or injured patients throughout Washington, Alaska, Montana and Idaho.
Joint Ventures – The University is also a participant in two joint ventures: Seattle Cancer Care Alliance and Children’s University Medical Group. The University’s share of these activities is reflected in the University’s financial statements.
In combination, these organizations (not including VMC) contributed $2,008 million in net patient services revenue in fiscal year 2018 and $1,869 million in fiscal year 2017. UWMC generated 59% of this revenue in 2018 and 60% in 2017. UWMC admissions were 19,350 in 2018, a 2% increase from 2017. The increase in net patient services revenue during 2018 was primarily due to strong volumes in inpatient stays, surgery cases, cardiology, pharmacy and solid organ transplants. Despite strong volumes, reimbursement pressures from payers have continued to result in reduced levels of reimbursement.
Grant RevenueOne of the largest sources of revenue (23%) continues to be grants and contracts. Total grant and contract revenue increased $55 million, or 4%, in 2018.
Federal revenue increased $23 million, or 2%, primarily driven by genome sequencing and HIV clinical service delivery projects within the National Institutes of Health and the Centers for Disease Control and Prevention.
State and local revenue saw a 10% increase largely attributable to a $9 million contract with the Washington State Department of Early Learning to implement a regional evaluation system, offer high-quality professional development opportunities to early learning professionals, and implement evidence-based curriculum training.
Consistent with 2017, increases to nongovernmental revenue were largely attributable to The Bill & Melinda Gates Foundation’s continued support of the University’s Institute for Health Metrics and Evaluation.
Grants and contracts provide the opportunity for graduate and undergraduate students to work with nationally recognized faculty in research as part of their educational experience.
Grant and contract revenue is earned when direct expenditures (such as researchers’ compensation or purchases of goods and services) are made; therefore, there is little effect on the University’s operating margin as a result of this direct expense reimbursement process.
Patient Services–UW MedicineThe financial statements of the University include the operations of the School of Medicine (SOM), three hospitals, associated physician group and clinics, Airlift Northwest, and the University’s share of two joint ventures. These entities, together with Harborview Medical Center (not included in the University’s financial statements – see Note 14) and shared services providing IT, accounting, and finance revenue cycle services, comprise UW Medicine. UW Medicine is governed and administered as an enterprise of the University whose mission is to improve the health of the public. UW Medicine also strives to facilitate the education of physicians and other health care providers, support research activities in collaboration with the SOM and render other services designed to achieve the “Triple Aim” which is to improve the healthcare experience for the individual, improve health of the population, and provide more affordable care.
Patient care activities included in the University’s financial statements include:
UW Medical Center (UWMC) is a 529-bed hospital that provides comprehensive healthcare services to the Puget Sound community and patients from throughout the Pacific Northwest and beyond. UWMC also serves as the major clinical, teaching and research site for students and faculty in the Health Sciences at the University. Over 19,000 patients receive inpatient care at UWMC each year. Specialized inpatient care needs are met by the Cancer Center, the Regional Heart Center, the Neonatal Intensive Care Unit and the Organ Transplantation program.
Valley Medical Center (VMC) is a 321-bed acute care hospital and network of clinics that treats over 18,000 inpatients per year, and is the oldest and largest public district hospital in the state of Washington. VMC joined UW Medicine in July, 2011. VMC’s Statement of Net Position and Statement of Revenues, Expenses and Changes in Net Position are presented in a discrete column on the financial statements of the University.
(continued)

FINANCIAL REPORT 2018 / 11
Unaudited – see accompanying notes to financial statementsUnaudited – see accompanying notes to financial statements
Operating Support for Instruction(in millions) 2018 2017
Operating tuition and fees $ 675 50% $ 639 50%
Fees for self-sustaining educational programs 315 23% 303 23%
Subtotal - tuition and fees 990 73% 942 73%
State operating appropriations 362 27% 342 27%
Total educational support $ 1,352 100% $ 1,284 100%
Net Investment Income(in millions) 2018 2017
Interest and dividends, net $ 72 $ 68
Metropolitan Tract net income 16 23
Seattle Cancer Care Alliance change in equity 17 15
Realized Gains 62 48
Unrealized Gains 237 288
Net investment income $ 404 $ 442
Facility and administrative expenses necessary to support grants and contracts are reimbursed by sponsors, along with direct costs, by an indirect cost recovery. The current indirect cost recovery rate for research grants is approximately 30 cents on every direct expenditure dollar.
Primary Nongrant Funding SourcesThe University relies primarily on student tuition and fees and state appropriations as revenue sources to support its nongrant-funded educational operating expenses. State support for education has increased during the last few fiscal years, but is still significantly below historical levels.
Noncapital state appropriations are considered nonoperating revenue under GASB principles, and are reflected in the nonoperating section of the Statements of Revenues, Expenses and Changes in Net Position; however, they are used solely for operating purposes.
Revenue from tuition and fees increased to $990 million, compared to $942 million in fiscal year 2017. These amounts are net of scholarship allowances of $155 million in 2018 and $159 million in 2017. The increase in 2018 was partially due to the state allowing a 2.2% operating fee increase in resident undergraduate tuition. Other tuition categories also contributed to this increase. Nonresident operating fees increased by 3%, graduate and professional operating fees increased by 0-10%, and fee-based program rates also increased by 0-10%. Increases varied by program. Some of the increase was also due to enrollment growth. Full-time equivalent (FTE) enrollment in undergraduate tuition and fee-based programs increased by 1.5% in the resident student category, and by 2.9% in the nonresident student category. FTE enrollment in graduate and professional tuition- and fee-based programs increased by 0.7% in the resident student category and by 3.1% in the nonresident student category.
Fees for self-sustaining educational programs (fee-supported programs) include the following amounts for fiscal years 2018 and 2017: UW Continuum College (the continuing education branch of the University) $113 million and $113 million, respectively, summer quarter tuition $55 million and $50 million, respectively, and for the combination of Business School and School of Medicine programs $60 million and $50 million, respectively.
Gifts, Endowments and Investment RevenuesNet investment income for the years ended June 30, 2018 and 2017 consisted of the following:
Net investment income decreased $38 million, or 9%, in 2018 primarily due to the change in realized and unrealized gains and losses during the year.
Donor support increased by $109 million, or 38%, to $398 million in 2018 from $289 million in 2017. Much of this increase was due to $85 million in support received from the Bill & Melinda Gates Foundation to benefit the University’s Population Health Initiative. The 2018 amount does not reflect $23 million received from the sale of premium seats to athletic events. This type of revenue was reported as gifts in 2017 due to their deductibility for federal tax purposes, but has been reported as operating revenue in 2018 due to passage of the Tax Cuts and Jobs Act of 2017. Gifts are a key and necessary source of support for a variety of purposes including capital improvements, scholarships, research, and endowments for various academic and research positions.
ExpensesTwo primary functions of the University, instruction and research, comprised 35% of total operating expenses. These dollars provided instruction to nearly 58,000 students and funded nearly 5,400 research awards. Medical-related expenses, such as those related to patient care, also continue to be one of the largest individual components.
Sources of Funds
6% STATE FUNDING FOR OPERATIONS AND CAPITAL EXPENDITURES
3% OTHER
31% PATIENT SERVICES23% GRANTS ANDCONTRACTS
6% GIFTS
6% INVESTMENT INCOME
6% AUXILIARY ENTERPRISES
4% SALES AND SERVICES OFEDUCATIONAL DEPARTMENTS
15% TUITION AND FEES
22% INSTRUCTION
13% RESEARCH
9% ACADEMIC SUPPORT
3% SCHOLARSHIPS &FELLOWSHIPS
8% AUXILIARY
7% DEPRECIATION/AMORTIZATION
2% OTHER
3% OPERATION & MAINTENANCE OF PLANT
4% INSTITUTIONAL SUPPORT
29% MEDICAL RELATED
Uses of Funds
4% GENERAL OBLIGATION BONDS$95
95% GENERAL REVENUE BONDS$2,169
1% NOTES PAYABLE AND OTHER
$29

UNIVERSITY OF WASHINGTON / 12
Unaudited – see accompanying notes to financial statements Unaudited – see accompanying notes to financial statements
Management’s Discussion and Analysis
(in millions) 2018 2017Operating expenses:
Educational and general instruction $ 1,268 22% $ 1,204 21%Research 785 13% 768 14%Public service 49 1% 39 1%Academic support 512 9% 507 9%Student services 53 1% 49 1%Institutional support 251 4% 240 4%Operation and maintenance of plant 201 3% 206 4%Scholarships and fellowships 149 3% 137 2%Auxiliary enterprises 495 8% 495 9%Medical-related 1,712 29% 1,658 29%Depreciation/amortization 384 7% 363 6%
Total operating expenses $ 5,859 100% $ 5,666 100%
A comparative summary of the University’s expenses by functional classification (purpose for which the costs are incurred) for the years ended June 30, 2018 and 2017 follows:
Operating Expenses by Function
Overall, the University’s operating expenses increased $193 million, or 3%, during 2018. Approximately 62% of amounts incurred for operating expenses in both 2018 and 2017 were related to faculty and staff compensation and benefits.
Expense associated with faculty and staff salaries increased $80 million, or 3%, in 2018. The impact from employee merit increases during the year was somewhat offset by an overall 1% reduction in University FTE’s.
Benefits expense increased $61 million, or 7%, in 2018 primarily due to the implementation of GASB Statement No. 75. Expenses associated with OPEB benefits used to be recorded as expense based on cash funding paid to the OPEB plan administrator. Implementation of Statement No. 75 now requires the University to record its proportionate share of the state of Washington’s actuarially determined OPEB expense, representing OPEB subsidies earned during the year by eligible employees, together with interest on the total OPEB liability and current amortization of other changes in that liability that do not immediately impact expense. For 2018, the difference between cash funding paid to the plan administrator and OPEB expense reflecting application of Statement No. 75 is an increase in expense of approximately $100 million. This increase in benefits expense was offset, however, by a $28 million reduction in expense associated with the defined-benefit pension plans administered by the DRS due to better than expected earnings on plan investments, and an $11 million reduction in pension expense associated with the UW Supplemental Retirement Plan.
Scholarships and fellowships expense increased $13 million, or 9%, in 2018. This category of student financial aid represents amounts paid directly to students for expenses other than tuition. Financial aid which reduces amounts owed for tuition
are reflected as scholarship allowances, and reported by the University as a reduction of gross tuition revenues. The combination of aid paid directly to students, and amounts which reduced the tuition owed by students, was 27% of gross tuition and fees revenue for both 2018 and 2017.
Utilities expense decreased $4 million, or 6%, during 2018 primarily due to a decrease in electricity usage across all University campuses.
Supplies and materials expense increased $41 million, or 8%, in 2018 primarily due to increased costs associated with drugs and medical supplies used at UW Medicine of $21 million, together with other, much smaller, increases associated with SOM and the University’s blended component units.
Economic Factors That May Affect the FutureSTATE OPERATING AND CAPITAL APPROPRIATIONSThe state of Washington, which provided 6% of the University’s total revenues in fiscal year 2018, continues to emerge from the recession with moderate economic growth and commensurate increases in state tax collections. However, additional state tax collections, as well as new revenue, were largely consumed by the state needing to meet court-mandated increases to K-12 education funding (McCleary v. Washington). As a result, non-mandatory state programs, including higher education, did not receive significant additional funding for the current 2017-19 biennium. Looking forward, state economic and revenue forecasts reflect a strong state economy, and projections for future state revenue collections continue to increase with each forecast.
During the 2013-15 biennium, the University committed to freezing resident undergraduate tuition rates in 2014 and 2015 in exchange for increases in state funding in both years. In the 2015-17 biennium, the state reduced resident undergraduate tuition rates to 5% below the 2015 rates in 2016, and to 15% below the 2015 rates in 2017. The state provided funds to offset the lost tuition revenue in both years. The same tuition policy allowed for future increases tied to a rolling average of median hourly wage in the state. Under this current policy, the state is allowing resident undergraduate tuition to increase by roughly 2.2% in each 2018 and 2019. While the legislature can always modify its policy, if current policy continues, resident undergraduate tuition increases will be limited to approximately 2% each year for the near future. The University’s Board of Regents continues to have broad tuition and fee setting authority for categories other than resident undergraduate tuition.
The University’s fiscal year 2019 general operating appropriation from the state (excluding certain amounts appropriated for specific purposes) is approximately $368 million. This amount is an increase from approximately $353 million in 2018 and $332 million in 2017. Recent increases are largely attributable to targeted investments in compensation, medical education,
(continued)

FINANCIAL REPORT 2018 / 13
Unaudited – see accompanying notes to financial statements
and science, technology, engineering and math (STEM) enrollments. The University’s priority requests to the state for the upcoming biennium include additional funding for competitive compensation for faculty and staff, increases in STEM enrollment slots, and support for safety net hospital and dental clinic operations.
After failing to pass a biennial state capital budget during their 2017 legislative session, the state approved a compromise 2017-19 biennial capital budget when they reconvened in 2018. Therefore, some projects that were slated to receive funding for the beginning of 2018 were delayed by several months. State funding for capital appropriations continues to be constrained, but the University received some state bonding capacity for critical capital projects. The University’s priority capital requests to the state include a health sciences education building, STEM-related buildings across all three campuses, and seismic upgrades.
UW MEDICINEThe healthcare industry, in general, and the acute care hospital business, in particular, are experiencing significant regulatory uncertainty based, in large part, on legislative efforts to significantly modify or repeal and potentially replace the Patient Protection and Affordable Care Act, as amended by the Health Care and Education Reconciliation Act of 2010 (Affordable Care Act or ACA). It is difficult to predict the full impact of these actions on future revenues and operations. Changes to the ACA may significantly impact UW Medicine.
The ability to increase profitability will depend, in part, on successfully executing UW Medicine strategies. In general, these strategies are intended to improve financial performance through reducing costs and streamlining the provision of clinical care, as well as mitigating the recent negative reimbursement trends being experienced within the market. With a continued focus on patient volumes shifting from inpatient to outpatient settings due to technological advancements and demand for care that is more convenient, affordable and accessible, and the industry-wide migration to value-based payment models as government and private payers shift risk to providers, successfully managing costs and efficiently delivering care are paramount.
UW Medicine/MultiCare AllianceIn July 2017, UW Medicine and MultiCare Health System (MultiCare) announced the formation of a new alliance that will expand access to high-quality healthcare and allow the two organizations to engage in joint activities to further the mission of each organization. Through the alliance, UW Medicine and MultiCare will provide cost-effective and clinically integrated healthcare in communities throughout the Puget Sound region while supporting the education of the next generation of clinicians and advancing research. The
parties’ joint activities will be guided by four core principles: the provision of high-quality, patient-centered care; a commitment to teaching and research; ensuring strong financial stewardship to deliver value to the payers of healthcare services; and a focus on improving the health of populations served by the alliance. In June 2018, the University Board of Regents approved formation of the Clinically Integrated Network (CIN) legal entity, which is expected to occur in late 2018.
UW Medicine Accountable Care NetworkIn 2014, UW Medicine formed an Accountable Care Network (ACN) with other selected healthcare organizations and healthcare professionals in Western Washington to form a care delivery network to assume responsibility for the healthcare of contracted patient populations to achieve the Triple Aim: improved healthcare experience for the individual, improved health of the population, and more affordable care.
• The ACN has contracted with the Washington Health Care Authority (HCA) to participate in its Puget Sound Accountable Care Program (ACP) as a healthcare benefit option for Public Employees Benefits Board (PEBB) members. The ACP is offered to all PEBB members who reside in Snohomish, King, Kitsap, Pierce, and Thurston counties. This contract with HCA covering PEBB members began January 1, 2016.
• A subset of the network members have also agreed to participate with the ACN in a contract with Premera as part of its Accountable Health System (AHS) product. As an AHS, the UW Medicine ACN will share in accountability for the quality and cost of healthcare for Premera members who select this plan. This product was sold both on and off the Washington Health Exchange in select counties with coverage that began January 1, 2016. The AHS must have 5,000 planwide members per product, per region for the UW Medicine ACN to share in financial savings and risk. The ACN is not at risk for the AHS product in 2017, but is at risk in calendar year 2018.
• The UW Medicine ACN also entered into an agreement to provide health care services to nonunion employees of a large local employer with coverage that began January 1, 2015.
These arrangements provide an opportunity for shared savings between the ACN and the contracted entity based on achieving quality and financial benchmarks. If certain financial benchmarks are not attained, UW Medicine, along with its network members, is at risk for reductions in payment levels from the contracted entity based on the agreement.
Investments in Information TechnologyIn July, 2018, the University Board of Regents granted approval to proceed with the UW Medicine clinical transformation program. This multi-year program will allow UW Medicine to improve patient engagement, physician and practitioner experience and to achieve business and operating efficiencies through development of foundational systems and improved staffing workflows. Patient engagement will be enhanced

UNIVERSITY OF WASHINGTON / 14
Unaudited – see accompanying notes to financial statements Unaudited – see accompanying notes to financial statements
Management’s Discussion and Analysis
through development of a single online patient portal for activities between the patient and UW Medicine. More online service opportunities and easy navigation will create additional opportunities for communication between the patient and their care team. UW Medicine will achieve business and operating efficiencies through simplification and standardization across operations and IT, resulting in revenue cycle improvements and optimized resource utilization. Total program costs are estimated to be $180 million. Program kick-off will be in November, 2018 with initial implementation occurring in April, 2020.
Northwest Hospital IntegrationIn February, 2018, the University Board of Regents granted approval to proceed with the dissolution of and subsequent integration of Northwest Hospital into UW Medical Center. Adopting a new model of one hospital on two campuses will provide many opportunities for cost savings and improved coordination of care. Upon dissolution of the Northwest Hospital corporation, Northwest Hospital assets and debts will be assumed by UW Medical Center and Northwest Hospital staff will become University employees. Full integration is expected to occur no later than January 1, 2020.
OTHERRising benefit costs, particularly for pensions and healthcare, continue to impact the University. Employer pension funding rates for the Public Employees Retirement System (PERS) pension plans increased 14% during fiscal year 2018, from 11.18% to 12.70% of covered salary, but will remain unchanged during fiscal year 2019. Likewise, the monthly employer base rate paid by the University for employee healthcare increased 3% during fiscal year 2018, from $888 to $913 per active employee, but will be mostly unchanged during fiscal year 2019. Both rates, however, are likely to continue increasing over the next few years.
(continued)

FINANCIAL REPORT 2018 / 15
Unaudited – see accompanying notes to financial statements
FINANCIALSTATEMENTS & NOTES
UNIVERSITY OF WASHINGTON / 16
Statements of Net Position
UNIVERSIT Y OF WA SHINGTON
DISCRETE COMPONENT
UNIT
ASSETS AND DEFERRED OUTFLOWS OF RESOURCES
CURRENT ASSETS:
CASH AND CASH EQUIVALENTS (NOTE 2) $ 144,136 $ 48,186
INVESTMENTS, CURRENT PORTION (NOTE 6) 552,641 41,431
ACCOUNTS RECEIVABLE (NET OF ALLOWANCE OF $19,447) (NOTE 5) 738,743 83,950
OTHER CURRENT ASSETS 50,482 53,314
TOTAL CURRENT ASSETS 1,486,002 226,881
NONCURRENT ASSETS:
DEPOSIT WITH STATE OF WASHINGTON (NOTE 3) 67,655 –
INVESTMENTS, NET OF CURRENT PORTION (NOTE 6) 5,104,848 1,377
METROPOLITAN TRACT (NOTE 7) 152,233 –
STUDENT LOANS RECEIVABLE (NET OF ALLOWANCE OF $4,339) (NOTE 4) 63,541 –
OTHER NONCURRENT ASSETS 197,948 81,399
CAPITAL ASSETS (NET OF ACCUMULATED DEPRECIATION OF $4,607,053) (NOTE 8) 4,979,731 380,445
TOTAL NONCURRENT ASSETS 10,565,956 463,221
TOTAL ASSETS 12,051,958 690,102
DEFERRED OUTFLOWS OF RESOURCES (NOTE 12) 244,041 12,491
TOTAL ASSETS AND DEFERRED OUTFLOWS OF RESOURCES $ 12,295,999 $ 702,593
LIABILITIES AND DEFERRED INFLOWS OF RESOURCES
CURRENT LIABILITIES:
ACCOUNTS PAYABLE AND ACCRUED LIABILITIES $ 784,036 $ 108,245
UNEARNED REVENUES 188,077 –
OTHER CURRENT LIABILITIES 158,082 –
LONG-TERM LIABILITIES, CURRENT PORTION (NOTES 9-11) 136,517 10,208
TOTAL CURRENT LIABILITIES 1,266,712 118,453
NONCURRENT LIABILITIES:
U.S. GOVERNMENT GRANTS REFUNDABLE 45,535 –
LONG-TERM LIABILITIES, NET OF CURRENT PORTION (NOTES 9-11) 2,620,587 299,262
PENSION LIABILITIES (NOTE 15) 1,184,852 –
OTHER POST-EMPLOYMENT BENEFITS (NOTE 16) 1,565,213 –
TOTAL NONCURRENT LIABILITIES 5,416,187 299,262
TOTAL LIABILITIES 6,682,899 417,715
DEFERRED INFLOWS OF RESOURCES (NOTE 12) 516,323 25,031
TOTAL LIABILITIES AND DEFERRED INFLOWS OF RESOURCES 7,199,222 442,746
NET POSITION
NET INVESTMENT IN CAPITAL ASSETS 2,483,814 87,817
RESTRICTED:
NONEXPENDABLE 1,721,927 –
EXPENDABLE 2,128,692 8,240
UNRESTRICTED (1,237,656) 163,790
TOTAL NET POSITION 5,096,777 259,847
TOTAL LIABILITIES, DEFERRED INFLOWS OF RESOURCES AND NET POSITION $ 12,295,999 $ 702,593
UNIVERSIT Y OF WA SHINGTON
See accompanying notes to financial statements.
Dollars in thousands
June 30, 2018
June 30, 2018

FINANCIAL REPORT 2018 / 17
REVENUES
OPERATING REVENUES:
STUDENT TUITION AND FEES (NET OF SCHOLARSHIP ALLOWANCE OF $154,854) $ 989,912 $ –
NET PATIENT SERVICE REVENUES (NET OF PROVISION FOR UNCOLLECTIBLE ACCOUNTS OF $29,411) 2,008,317 598,633
FEDERAL GRANTS AND CONTRACTS 1,048,088 –
STATE AND LOCAL GRANTS AND CONTRACTS 103,267 –
NONGOVERNMENTAL GRANTS AND CONTRACTS 257,966 –
SALES AND SERVICES OF EDUCATIONAL DEPARTMENTS 242,886 –
AUXILIARY ENTERPRISES:
HOUSING AND FOOD SERVICES 131,369 –
SPORTS PROGRAMS (NET OF SCHOLARSHIP ALLOWANCE OF $7,590) 91,924 –
OTHER AUXILIARY ENTERPRISES 179,574 –
OTHER OPERATING REVENUE 118,497 38,092
TOTAL OPERATING REVENUES 5,171,800 636,725
EXPENSES
OPERATING EXPENSES (NOTE 13):
SALARIES 2,736,630 315,905
BENEFITS 924,253 75,902
SCHOLARSHIPS AND FELLOWSHIPS 149,378 –
UTILITIES 59,884 5,179
SUPPLIES AND MATERIALS 588,476 83,246
PURCHASED SERVICES 844,729 73,613
DEPRECIATION/AMORTIZATION 384,004 33,167
OTHER 171,442 36,082
TOTAL OPERATING EXPENSES 5,858,796 623,094
OPERATING INCOME (LOSS) (686,996) 13,631
NONOPERATING REVENUES (EXPENSES)
STATE APPROPRIATIONS 362,267 –
GIFTS 166,721 –
INVESTMENT INCOME (NET OF INVESTMENT EXPENSE OF $10,790) 404,412 2,468
INTEREST ON CAPITAL ASSET-RELATED DEBT (76,642) (14,258)
PELL GRANT REVENUE 51,097 –
PROPERTY TAX REVENUE – 22,722
OTHER NONOPERATING REVENUES 4,749 15,723
NET NONOPERATING REVENUES 912,604 26,655
INCOME BEFORE OTHER REVENUES 225,608 40,286
CAPITAL APPROPRIATIONS 26,399 –
CAPITAL GRANTS, GIFTS AND OTHER 142,573 –
GIFTS TO PERMANENT ENDOWMENTS 95,890 –
TOTAL OTHER REVENUES 264,862 –
INCREASE IN NET POSITION 490,470 40,286
NET POSITION
NET POSITION – BEGINNING OF YEAR, AS RESTATED (NOTE 1) 4,606,307 219,561
NET POSITION – END OF YEAR $ 5,096,777 $ 259,847
Statements of Revenues, Expenses and Changes in Net Position
UNIVERSIT Y OF WA SHINGTON
See accompanying notes to financial statements.
Dollars in thousands
DISCRETE COMPONENT
UNITUNIVERSIT Y OF WA SHINGTON
Year ended June 30, 2018
Year ended June 30,2018

UNIVERSITY OF WASHINGTON / 18
Statement of Cash Flows
UNIVERSIT Y OF WA SHINGTON
CASH FLOWS FROM OPERATING ACTIVITIES
STUDENT TUITION AND FEES $ 958,966
PATIENT SERVICES 1,989,098
GRANTS AND CONTRACTS 1,376,235
PAYMENTS TO SUPPLIERS (567,439)
PAYMENTS FOR UTILITIES (59,381)
PURCHASED SERVICES (832,124)
OTHER OPERATING DISBURSEMENTS (169,606)
PAYMENTS TO EMPLOYEES (2,732,923)
PAYMENTS FOR BENEFITS (823,136)
PAYMENTS FOR SCHOLARSHIPS AND FELLOWSHIPS (149,378)
LOANS ISSUED TO STUDENTS (17,148)
COLLECTION OF LOANS TO STUDENTS 18,614
AUXILIARY ENTERPRISE RECEIPTS 401,799
SALES AND SERVICES OF EDUCATIONAL DEPARTMENTS 260,364
RECEIPTS FROM OUTSIDE AFFILIATED AGENCIES 904,189
DISBURSEMENTS TO OUTSIDE AFFILIATED AGENCIES (901,659)
OTHER RECEIPTS 116,012
NET CASH USED BY OPERATING ACTIVITIES (227,517)
CASH FLOWS FROM NONCAPITAL FINANCING ACTIVITIES
STATE APPROPRIATIONS 362,267
GIFTS AND GRANTS FOR OTHER THAN CAPITAL PURPOSES 51,097
PRIVATE GIFTS 132,796
PERMANENT ENDOWMENT RECEIPTS 95,890
DIRECT LENDING RECEIPTS 237,500
DIRECT LENDING DISBURSEMENTS (241,317)
OTHER 4,700
NET CASH PROVIDED BY NONCAPITAL FINANCING ACTIVITIES 642,933
CASH FLOWS FROM CAPITAL AND RELATED FINANCING ACTIVITIES
PROCEEDS FROM CAPITAL DEBT 186,339
STATE CAPITAL APPROPRIATIONS 24,228
CAPITAL GRANTS AND GIFTS RECEIVED 141,648
ACQUISITION AND CONSTRUCTION OF CAPITAL ASSETS (622,412)
PRINCIPAL PAYMENTS ON CAPITAL-RELATED DEBT AND LEASES (116,809)
INTEREST PAYMENTS ON CAPITAL-RELATED DEBT AND LEASES (90,401)
OTHER (1,205)
NET CASH USED BY CAPITAL AND RELATED FINANCING ACTIVITIES (478,612)
UNIVERSIT Y OF WA SHINGTON
Year Ended June 30, 2018

FINANCIAL REPORT 2018 / 19
See accompanying notes to financial statements.
Dollars in thousands
CASH FLOWS FROM INVESTING ACTIVITIES
PROCEEDS FROM SALES OF INVESTMENTS 10,549,300
DISBURSEMENTS FOR PURCHASES OF INVESTMENTS (10,493,626)
INVESTMENT INCOME 87,623
NET CASH PROVIDED BY INVESTING ACTIVITIES 143,297
NET INCREASE IN CASH AND CASH EQUIVALENTS 80,101
CASH AND CASH EQUIVALENTS-BEGINNING OF THE YEAR 64,035
CASH AND CASH EQUIVALENTS-END OF THE YEAR $ 144,136
RECONCILIATION OF OPERATING LOSS TO NET CASH USED BY OPERATING ACTIVITIES
OPERATING LOSS $ (686,996)
ADJUSTMENTS TO RECONCILE OPERATING LOSS TO NET CASH USED BY OPERATING ACTIVITIES:
DEPRECIATION/AMORTIZATION EXPENSE 384,004
CHANGES IN ASSETS, LIABILITIES, AND DEFERRED OUTFLOWS AND INFLOWS OF RESOURCES:
RECEIVABLES (52,983)
OTHER ASSETS (20,093)
PENSION AND OPEB RELATED DEFERRED OUTFLOWS AND INFLOWS OF RESOURCES 387,381
PENSION LIABILITIES (237,559)
OPEB LIABILITY (95,235)
ACCOUNTS PAYABLE AND ACCRUED LIABILITIES 59,732
UNEARNED REVENUE (7,776)
OTHER LONG-TERM LIABILITIES 40,541
U.S. GOVERNMENTAL GRANTS REFUNDABLE (4,373)
LOANS TO STUDENTS 5,840
NET CASH USED BY OPERATING ACTIVITIES $ (227,517)
NONCASH INVESTING, CAPITAL AND FINANCING ACTIVITIES
STOCK GIFTS $ 31,729
INCREASE IN INTEREST IN SEATTLE CANCER CARE ALLIANCE 17,332
NET UNREALIZED GAINS 237,197
EXTERNALLY MANAGED TRUSTS 112,821
TOTAL NONCASH INVESTING, CAPITAL AND FINANCING ACTIVITIES $ 399,079
UNIVERSIT Y OF WA SHINGTON
Year Ended June 30, 2018
Notes to Financial Statements
UNIVERSITY OF WASHINGTON / 20
NOTE 1:
Summary of Significant Accounting PoliciesFINANCIAL REPORTING ENTITYThe University of Washington (University), an agency of the state of Washington, is governed by a 10-member Board of Regents appointed by the governor and confirmed by the state senate.
The financial statements include the individual schools, colleges and departments of the University, the University of Washington Medical Center (UWMC), Portage Bay Insurance (a wholly-owned subsidiary of the University) and certain affiliated operations determined to be a part of the University’s financial reporting entity. Affiliated organizations are evaluated for inclusion in the reporting entity as component units based on the significance of their relationship with the University.
Harborview Medical Center (HMC), a component unit of King County, Washington, is a related party to the University, but is not reflected as part of the financial reporting entity (Note 14).
Component units are legally separate organizations for which the University is financially accountable. Financial accountability is demonstrated when one of several conditions exist such as when the University appoints a voting majority of the organization’s board, is able to impose its will on the organization, receives specific financial benefit or incurs specific financial burdens from the organization, or the organization is fiscally dependent on the University. These entities may be reported in the financial statements of the University in one of two ways: the component units’ amounts may be blended with the amounts reported by the University, or they may be shown in a separate column, depending on the application of the criteria of Governmental Accounting Standards Board (GASB) code section 2600, “Reporting Entity and Component Unit Presentation and Disclosure”. All component units of the University meet the criteria for blending except Valley Medical Center. It is reported discretely since it has a separate board of directors, it does not provide services exclusively to the University, and it is not a nonprofit corporation with the University being the sole corporate member.
BLENDED COMPONENT UNITSThe following entities are presented as blended component units of the University. Financial information for these affiliated organizations is available from their respective administrative offices.
MEDICAL ENTITIESNorthwest Hospital & Medical Center (NWH)NWH is a Washington nonprofit corporation formed in 1949, whose sole corporate member is the University. NWH is a 281 licensed-bed, full-service medical facility primarily serving the healthcare needs of residents of King and Snohomish counties in Washington. NWH had operating revenues of $370,770,000 in 2018.
The Association of University Physicians dba UW Physicians (UWP)UWP is a Washington nonprofit corporation formed in 1983 for the exclusive benefit of the University of Washington School of Medicine (SOM). UWP employs SOM faculty and bills and collects for their clinical services as an agent for the SOM. UWP had operating revenues of $329,817,000 in 2018.
UW Medicine Neighborhood Clinics (Neighborhood Clinics)The Neighborhood Clinics is a Washington nonprofit corporation formed in 1996 for the benefit of the SOM, UWP and its affiliated medical centers, HMC and UWMC, exclusively for charitable, scientific and educational purposes. Neighborhood Clinics was organized to coordinate and develop patient care in a community clinical setting. They enhance the academic environment of the SOM by providing additional sites of primary care practice and training for faculty, residents and students. Neighborhood Clinics had operating revenues of $27,851,000 in 2018.
REAL ESTATE ENTITIESThe entities listed below are nonprofit corporations that were formed to acquire or construct certain real properties for the benefit of the University in fulfilling its educational, medical or scientific research missions. These entities issue tax-exempt and taxable bonds to finance these activities.
• Washington Biomedical Research Properties I
• Washington Biomedical Research Properties II
• Washington Biomedical Research Facilities 3
• Washington Biomedical Research Properties 3.2
• Washington Biomedical Research Properties 3.3

FINANCIAL REPORT 2018 / 21
These entities collectively had net capital assets of $360,479,000, and long-term debt of $370,803,000, in 2018. These amounts are reflected in the University’s financial statements.
DISCRETELY PRESENTED COMPONENT UNITValley Medical CenterThe University and Public Hospital District No. 1 of King County, a Washington public hospital district dba Valley Medical Center (VMC), participate in a Strategic Alliance Agreement. Under this agreement, VMC is managed as a discretely presented component unit of the University. VMC owns and operates a 321-bed full-service acute care hospital and 45 clinics located throughout southeast King County. The audited financial statements of VMC are available by contacting VMC at 400 S. 43rd Street, Renton, Washington 98055 or online at the following address: valleymed.org/about-us/financial-information.
JOINT VENTURESThe University, together with Seattle Children’s Hospital and Fred Hutchinson Cancer Research Center, established the Seattle Cancer Care Alliance (SCCA). The SCCA integrates the cancer research, teaching and clinical cancer programs of all three institutions to provide state-of-the-art cancer care. Each member of the SCCA has a one-third interest. The University accounts for its interest in the SCCA under the equity method and has recorded $159,149,000 in Other Assets, together with $17,332,000 in Investment Income, for its share of the joint venture in 2018.
The University and Seattle Children’s Hospital established Children’s University Medical Group (CUMG) to assist the organizations in carrying out their pediatric patient care, charitable, educational, and scientific missions. CUMG employs SOM faculty physicians, and bills and collects for their services as an agent for the SOM. The University records revenue from CUMG based on the income distribution plan effective December 31, 2008. The University’s patient services receivable (Note 5) includes amounts due from CUMG of $17,552,000 in 2018.
BASIS OF ACCOUNTINGThe financial statements of the University have been prepared in accordance with GASB, code section Co5, “Colleges and Universities”. The University is reporting as a special-purpose government engaged in business-type activities (BTA). In accordance with BTA reporting, the University presents Management’s Discussion and Analysis, Statements of Net Position, Statements of Revenues, Expenses and Changes in Net Position, Statement of Cash Flows and Notes to the Financial Statements. The financial statements are prepared using the economic resources measurement focus and the accrual basis of accounting.
Under the accrual basis of accounting, revenue is recognized when earned, and expense is recorded when an obligation has been incurred. Significant intra-entity transactions have been eliminated. The University reports capital assets net of accumulated depreciation/amortization (as applicable), and reports depreciation/amortization expense in the Statements of Revenues, Expenses and Changes in Net Position.
On July 1, 2017, the University adopted GASB Statement No. 75, “Accounting and Financial Reporting for Postemployment Benefits Other Than Pensions” (OPEB), which establishes new actuarial methods and discount rate standards for the measurement and recognition of the cost of postemployment benefits provided to the employees of state and local governmental employers. This Statement replaces the requirements of GASB Statement No. 45, “Accounting and Financial Reporting by Employers for Postemployment Benefits Other than Pensions.” As a result of implementing Statement No. 75, the University has recognized its proportionate share of the state of Washington’s actuarially determined total OPEB liability, deferred inflows of resources and deferred outflows of resources, and OPEB expense. Prior to adopting this Statement the University’s financial statements did not reflect any OPEB liability or associated deferred inflows or outflows, and reported OPEB expense based on cash contributions paid to the OPEB plan administrator. In addition to the reporting changes described above, implementation of this Statement resulted in the restatement of fiscal year 2018 beginning Unrestricted Net Position, reducing it by $1,660,447,000. The University’s Statement of Net Position, Statement of Revenues, Expenses and Changes in Net Position, and the Statement of Cash Flows present only one fiscal year, since the change in accounting treatment required by Statement No. 75 is not able to be applied to the prior fiscal year due to the constraints of available information.
On July 1, 2017, the University adopted GASB Statement No. 81, “Irrevocable Split-Interest Agreements.” Irrevocable split-interest agreements are a specific type of giving arrangement used by donors to provide resources to two or more beneficiaries, including governments. This Statement changes the way that governments reflect resources received pursuant to irrevocable split-interest agreements, both at inception and throughout the life of the associated contract. Specifically, where the University has a remainder interest in a trust that is also managed by the University, revenues will no longer be recognized when the asset is received and upon periodic revaluation, but will instead be deferred and recognized at termination of the contract. This change has resulted in the restatement of fiscal year 2018 beginning

Notes to Financial Statements
UNIVERSITY OF WASHINGTON / 22
Restricted Non-Expendable Net Position, reducing it by $47,172,000, together with an increase in Deferred Inflows. Where the University has a lead interest in a trust that is not managed by the University, revenues will now be recognized both when the asset is received and upon periodic revaluation. These events were previously not reflected in the financial statements of the University. Revenue will also continue to be recognized as periodic payments are received, the same as prior to GASB 81. This change has also resulted in the restatement of fiscal year 2018 beginning Restricted Non-Expendable Net Position, increasing it by $112,820,000, together with an increase in Investments. The net impact of implementing these accounting changes has been an increase in beginning Restricted Non-Expendable Net Position of $65,648,000.
With the adoption of GASB Statements No. 75 and No. 81, net position was restated at July 1, 2017. Below is a reconciliation of total net position as previously reported at June 30, 2017, to the restated net position.
(Dollars in thousands)
NET POSITION AT JUNE 30, 2017, AS PREVIOUSLY REPORTED $ 6,201,106 ADOPTION OF GASB STATEMENT NO. 75 (1,660,447)
ADOPTION OF GASB STATEMENT NO. 81 65,648
NET POSITION AT JULY 1, 2017, AS RESTATED $ 4,606,307
ACCOUNTING STANDARDS IMPACTING THE FUTUREIn November 2016, the GASB issued Statement No. 83, “Certain Asset Retirement Obligations,” which will be effective for the fiscal year ending June 30, 2019. An Asset Retirement Obligation (ARO) is a legally enforceable liability associated with the retirement of a tangible capital asset. Governments that have legal obligations to perform future tangible asset retirement activities will need to recognize a liability and offsetting deferred outflow of resources when incurred and reasonably estimable. The basis of the estimate is the current value of the future outlays expected to be incurred, and is to be adjusted annually for inflation and any changes of relevant factors. The deferral is to be recognized as expense in a systematic and rational manner over the life of the tangible capital asset. The liability is derecognized as retirement costs are paid. Required disclosures include information about the nature of a government’s AROs, the methods and assumptions used for the estimates of the liabilities, and the estimated remaining useful life of the associated tangible capital assets. The University’s 2015 Decommissioning Funding Plan, prepared in accordance with Washington Administrative Code 246-235-075, has estimated disposal and clean-up costs related to several Cyclotrons used in research and medical services of approximately $100,000,000 and discussions are underway to determine the applicability of this standard to University X-ray and MRI machines.
In January 2017, the GASB issued Statement No. 84, “Fiduciary Activities,” which will be effective for the fiscal year ending June 30, 2020. This Statement establishes criteria for identifying fiduciary activities of all state and local governments. Governments with activities meeting the criteria should present a Statement of Fiduciary Net Position and a Statement of Changes in Fiduciary Net Position. Custodial assets held for three months or less are exempt from the reporting requirements. The University will be required to report fiduciary activities that do not meet the exception criteria, primarily consisting of funds invested by other agencies and organizations in the Consolidated Endowment Fund.
In June 2017, the GASB issued Statement No. 87, “Leases,” which will be effective for the fiscal year ending June 30, 2021. This Statement changes the current classification of lease arrangements as either operating or capital leases, and establishes a single model for lease accounting based on the foundational principle that leases represent a financing transaction associated with the right to use an underlying asset. This Statement applies to contracts that convey the right to use a non-financial asset in an exchange or exchange-like transaction for a term exceeding 12 months. Lessees will be required to recognize a lease liability and an intangible right-to-use lease asset, and lessors will be required to recognize a lease receivable and a deferred inflow of resources. The University is currently analyzing the impact from implementation of this Statement.
In March 2018, the GASB issued Statement No. 88, “Certain Disclosures Related to Debt, including Direct Borrowings and Direct Placements,” which will be effective for the fiscal year ending June 30, 2019. This Statement requires that additional essential information related to debt be disclosed in the Notes to Financial Statements such as unused lines of credit, assets pledged as collateral, significant default and termination events with finance-related consequences, and significant subjective acceleration clauses. This Statement also requires that currently existing disclosure requirements related to long-term liabilities be provided for direct borrowings and direct placements of debt separately from other debt disclosures. The Statement will not impact the recognition or measurement of liabilities, and will have no impact on the University’s net position.
(continued)

FINANCIAL REPORT 2018 / 23
In June 2018, the GASB issued Statement No. 89, “Accounting for Interest Cost Incurred before the End of a Construction Period,” which will be effective for the fiscal year ending June 30, 2021. This Statement requires that interest cost incurred before the end of a construction period be recognized as expense in the period in which the cost is incurred for financial statements prepared using the economic resources measurement focus. As a result, these costs will no longer be included in the capitalized cost of capital assets reported by the University. This Statement will be applied on a prospective basis, and interest costs capitalized prior to implementation will continue to be recognized as those assets are depreciated. The University estimates that implementation of this Statement will result in approximately $10,000,000 of additional interest expense being recognized annually.
In August 2018, the GASB issued Statement No. 90, “Majority Equity Interests,” which will be effective for the fiscal year ending June 30, 2020. This Statement modifies previous guidance for reporting a government’s majority equity interest in a legally separate organization. When a majority equity interest meets the definition of an investment as defined by GASB, the equity interest is to be reported as an investment for financial reporting purposes and measured using the equity method. Majority equity interests that do not meet the definition of an investment are to be reported as a component unit. This Statement also provides guidance for valuing the acquisition of assets and liabilities of 100% equity interests that remain legally separate, and brings this reporting in line with existing standards that apply to acquisitions that do not remain legally separate. Initial review of the University’s equity interests has not revealed any majority interests that would fall within the scope of this Statement, however, further review is ongoing.
The preparation of financial statements in conformity with U.S. Generally Accepted Accounting Principles involves management estimates that affect the reported amounts of assets, liabilities, deferrals, revenues and expenses during the reporting period. Actual results could differ from those estimates; however, in each case, the University believes that allowances, reserves and estimates of expected liabilities are adequate.
The University estimates the pollution remediation liability (Note 9) by reviewing the current status of known polluted sites and developing estimates of cleanup costs. These estimates are subject to change due to improvements in technology, inflation, changes in the scope of work, and the pursuit of reimbursement from other responsible parties.
Allowances (Notes 4 and 5) are estimates based on the historical experience of the University and current economic circumstances with respect to the collectability of accounts and loans receivable.
The University’s share of pension and other post-employment benefit plan assets, liabilities, deferrals and expenses, are based on actuarial valuations prepared by an external actuary. The results of an actuarial valuation are estimates based on historical data, actuarial assumptions, and the demographics of the employee and retiree populations.
The self-insurance reserve (Note 17) is estimated through an externally prepared actuarial calculation using individual case-basis valuations and statistical analyses. Considerable variability is inherent in such estimates.
Alternative investments, which are not readily marketable, are carried at the estimated fair values provided by the investment managers. The University reviews and evaluates the values provided by the investment managers and agrees with the valuation methods and assumptions used in determining the fair value of the alternative investments. Those estimated fair values may differ significantly from the values that would have been used had a ready market for these securities existed.
OTHER ACCOUNTING POLICIESInvestments. Investments are carried at fair value. The fair value of all debt and equity securities with a readily determinable fair value is based on quotations from major securities exchanges.
Investments under long-term strategies are considered noncurrent. Short-term investments consist primarily of cash equivalents and fixed income vehicles which management has identified as available to meet the day-to-day obligations of the University.
Inventories. Inventories are carried at the lower of cost or market value and are reflected on the Statements of Net Position in Other Current Assets. Consumable inventories, consisting of expendable materials and supplies, are generally valued using the weighted-average method. Merchandise inventories are generally valued using the first-in, first-out method.
Capital Assets. Land, buildings, equipment, library books and intangibles are stated at cost or, if acquired by gift, at fair market value at the date of the gift. Additions, replacements, major repairs and renovations are capitalized. Depreciation and amortization are computed using the straight-line method over the estimated useful lives of the assets, generally 15 to 50 years for building components, 20 to 50 years for infrastructure and land improvements, 5 to 7 years for equipment, 15 years for library books, and 3 to 15 years for intangibles.
Capital assets which are financed by capital leases are depreciated in the same manner as other capital assets.

Notes to Financial Statements
UNIVERSITY OF WASHINGTON / 24
Interest incurred on capital asset-related debt was $91,799,000 in 2018. The University capitalized $15,157,000 of this cost in 2018.
Unearned Revenues. Unearned revenues occur when funds have been collected in advance of when the associated goods or services have been provided, such as advance ticket sales, summer quarter tuition and unspent cash advances on certain grants.
Cost-Sharing Pension Plans. The net pension asset or liability is measured as the University’s proportionate share of the collective total pension liability, less the fiduciary net position, of the cost-sharing pension plans in which the University participates. The total pension liability is determined by discounting projected benefit payments based on the benefit terms and legal agreements existing at the pension plan’s fiscal year-end. Projected benefit payments are required to be discounted using a single rate that reflects the expected rate of return on investments, to the extent that plan assets are available to pay benefits. The University’s proportionate share is determined based on the relationship of University contributions to total contributions to the plan by all participating employers. Pension expense is recognized for benefits earned during the period, interest on the unfunded liability and changes in benefit terms. Differences between expected and actual experience, and changes in assumptions about future economic or demographic factors, are reported as deferred inflows of resources or deferred outflows of resources, and are recognized over the average expected remaining service period for employees eligible for pension benefits. Differences between expected and actual investment returns are reported as deferred inflows of resources or deferred outflows of resources, and are recognized over five years. Contributions made to the plan subsequent to the measurement date and prior to the University’s fiscal year-end are reported as a deferred outflow of resources, and recognized in the subsequent fiscal year. The measurement date for the net pension asset or liability is June 30 of the prior fiscal year.
Single Employer Pension Plan (UW Supplemental Retirement Plan). The total pension liability is determined by discounting projected benefit payments for current participants and retirees, based on the benefit terms and legal agreements existing at the pension plan’s fiscal year-end. The discount rate used is the yield or index rate for 20 year tax-exempt general obligation municipal bonds with average credit rating AA/Aa or higher rating. Pension expense is recognized for benefits earned during the period, interest on the unfunded liability and changes in benefit terms. Differences between expected and actual experience, and changes in assumptions about future economic or demographic factors, are reported as deferred inflows of resources or deferred outflows of resources, and are recognized over the average expected remaining service period for employees eligible for pension benefits. The measurement date for the total pension liability is June 30, 2018.
Other Post Employment Benefits (OPEB). The total OPEB liability is measured as the University’s proportionate share of the state of Washington total OPEB liability, with proportionate share determined based on the relationship of the University’s healthcare-eligible headcount to the total healthcare-eligible headcount for the state. The total OPEB liability is determined by discounting projected benefit subsidies for current employees and retirees based on the discount rate required by GASB Statement No. 75 for OPEB plans which do not have assets residing in a qualified trust. OPEB expense is recognized for subsidies earned during the period, interest on the total OPEB liability and changes in benefit terms. Differences between expected and actual experience, and changes in assumptions about future economic or demographic factors, are reported as deferred inflows of resources or deferred outflows of resources, and are recognized over the average expected remaining service period for healthcare-eligible employees. Contributions made to the plan subsequent to the measurement date and prior to the University’s fiscal year-end are reported as a deferred outflow of resources, and recognized in the subsequent fiscal year. The measurement date for the total OPEB liability is June 30 of the prior fiscal year.
Split-Interest Agreements. Under such agreements, donors make gifts to the University but the University is not the sole beneficiary and receives either a lead interest (distributions during the term of the agreement) or a remainder interest (distribution of assets remaining at the end of the agreement). Charitable trusts, charitable gift annuities, pooled income funds and beneficial interests in charitable trusts are examples of split-interest gifts. Where the University holds a remainder interest in a trust that is also administered by the University, an asset related to these agreements is recorded at fair market value, a deferred inflow is recorded for the remainder value, and a liability is recorded equal to the present value of expected future distributions to the income beneficiaries. The liability is calculated using discount rates ranging from 3.3% to 7.5%. Additionally, donors have established and funded trusts which are administered by organizations other than the University. Under the terms of these trusts, the University has the irrevocable right to receive all or a portion of the income earned on the trust assets in perpetuity. The University does not control the assets held by the outside trusts but recognizes an interest in the trusts, based on the fair value of the assets contributed to the trusts, mostly as permanently restricted contributions. Fluctuation in the fair value of these assets are recorded annually as revenue and impact Restricted Non-Expendable Net Position.
Compensated Absences. University employees accrue annual leave at rates based on length of service, and for sick leave at the rate of one day per month. Sick leave balances, which are unlimited, can be converted to monetary compensation
(continued)

FINANCIAL REPORT 2018 / 25
annually at 25% of the employees’ normal compensation rate for any balance that exceeds 480 hours, or for any balance upon retirement or death. Annual leave accrued at June 30, 2018 was $126,990,000, and is included in Accounts Payable and Accrued Liabilities. Sick leave accrued at June 30, 2018 was $49,635,000 and is included in Long-Term Liabilities (Note 9).
Scholarship Allowances. Tuition and Fees are reported net of scholarship allowances that are applied to students’ accounts from external funds that have already been recognized as revenue by the University. Student aid paid directly to students is reported as scholarships and fellowships expense.
Net Patient Service Revenue. Patient service revenue is recorded at the estimated net realizable amounts from patients, third-party payers and others for services rendered, including estimated retroactive adjustments under reimbursement agreements with third-party payers. Retroactive adjustments are accrued on an estimated basis in the period the related services are rendered and adjusted in future periods as final settlements are determined. Revenue related to financial assistance provided to patients is excluded from net patient service revenue.
Third-party payer agreements with Medicare and Medicaid provide for payments at amounts different from established rates and are part of contractual adjustments to net patient service revenue. Medicare reimbursements are based on a tentative rate, with final settlement determined after submission of annual cost reports and audits thereof by the Medicare fiscal intermediary. The estimated final settlements for open years are based on preliminary cost findings after giving consideration to interim payments that have been received on behalf of patients covered under these programs.
For more information about Net Patient Service Revenue, see the audited financial statements of the UW Medicine Clinical Enterprise - UW Division, which are contained in the latest Bondholders Report at finance.uw.edu/treasury/bondholders/other-investor-material.
Financial Assistance. Financial assistance provides patient care without charge to patients who meet certain criteria under the financial assistance policy. Records are maintained to identify and monitor the level of financial assistance provided. These records include charges foregone for services and supplies furnished under the financial assistance policy to the uninsured and the underinsured. Collection of these amounts is not pursued and as such they are not reported as net patient service revenue. The cost of financial assistance provided is calculated based on the aggregate relationship of costs to charges. The estimated cost of financial assistance provided during 2018 was $21,943,000.
State Appropriations. The state of Washington appropriates funds to the University on both annual and biennial bases. This revenue is reported as nonoperating revenue in the Statements of Revenues, Expenses and Changes in Net Position when underlying expenditures are made.
Operating Activities. The University’s policy for reporting operating activities in the Statements of Revenues, Expenses and Changes in Net Position is to include activities that generally result from exchange transactions. Examples of exchange transactions are payments received for tuition, patient services or grants under which services are performed, as well as payments made for the delivery of goods or services. Certain other significant revenue streams used for operations, such as state appropriations, Pell grants, gifts and investment income are recorded as nonoperating revenues, as prescribed by GASB Statement No. 35.
Net Position. The University’s Net Position is classified as follows:
Net investment in capital assets: The University’s investments in capital assets, less accumulated depreciation/amortization, net of outstanding debt obligations related to capital assets;
Restricted net position – nonexpendable: Net position subject to externally-imposed requirements that it be maintained permanently by the University, including permanent endowment funds and annuity and life income trusts;
Restricted net position – expendable: Net position that the University is obligated to spend in accordance with restrictions imposed by external parties, generally for scholarships, research and departmental uses;
Unrestricted net position: Net position not subject to externally-imposed restrictions, but which may be designated for specific purposes by management or the Board of Regents.
Tax Exemption. The University, as an agency of the state of Washington, is not subject to federal income tax pursuant to Section 115 of the Internal Revenue Code, except for tax on unrelated business income and certain federal excise taxes.

Notes to Financial Statements
UNIVERSITY OF WASHINGTON / 26
(Dollars in thousands) 2018 NET PATIENT SERVICES $ 319,956 GRANTS AND CONTRACTS 204,602 DUE FROM OTHER AGENCIES 86,993 INVESTMENTS 57,092 SALES AND SERVICES 34,816 TUITION 12,563 STATE APPROPRIATIONS 7,688 ROYALTIES 3,090 OTHER 31,390 SUBTOTAL 758,190 LESS: ALLOWANCE FOR DOUBTFUL ACCOUNTS (19,447) TOTAL $ 738,743
NOTE 2:
Cash and Cash EquivalentsCash includes cash on hand, petty cash and bank deposits. Cash equivalents includes treasury securities with maturities of less than 90 days and money market funds with remaining maturities of one year or less at the time of purchase. Most cash, except for cash held at the University and cash held in foreign banks, is covered by the Federal Deposit Insurance Corporation (FDIC), or if greater than FDIC limits, by collateral held in a multiple financial institution collateral pool administered by the Washington Public Deposit Protection Commission.
NOTE 3:
Deposit with State of WashingtonState law requires the University to deposit certain funds with the state treasurer, who holds and invests the funds. These deposits include amounts held for the University’s permanent land grant funds, and the University building fee collected from students, and is recorded as a noncurrent asset on the Statement of Net Position. The fair value of these funds approximates the carrying value.
NOTE 4:
Student Loans ReceivableNet student loans of $63,541,000 at June 30, 2018 consist of $48,576,000 from Federal programs, and $14,965,000 from University programs. Interest income from student loans for the year ended June 30, 2018 was $1,673,000. These unsecured loans are made primarily to students who reside in the state of Washington.
NOTE 5:
Accounts ReceivableThe major components of accounts receivable as of June 30, 2018 were:
(continued)

FINANCIAL REPORT 2018 / 27
TABLE 1 – INVESTMENTS (Dollars in thousands)
INVESTMENTS BY FAIR VALUE LEVEL
Fair Value Measurement Inputs
2018
Quoted Prices in Active Markets for Identical
Assets (Level 1)
Significant Other Observable Inputs
(Level 2)
Significant Unobservable Inputs
(Level 3)
FIXED INCOME SECURITIES
U.S. TREASURY SECURITIES $ 652,611 $ 3,967 $ 648,644 $ –
U.S. GOVERNMENT AGENCY 545,478 10,879 534,599 –
MORTGAGE BACKED 231,974 – 231,974 –
ASSET BACKED 175,449 – 175,449 –
CORPORATE AND OTHER 495,926 72,390 423,536 –
TOTAL FIXED INCOME SECURITIES 2,101,438 87,236 2,014,202 –
EQUITY SECURITIES
GLOBAL EQUITY INVESTMENTS 719,261 711,232 8,029 –
PRIVATE EQUITY AND VENTURE CAPITAL FUNDS 27,224 – 25,885 1,339
REAL ESTATE 10,097 5,016 – 5,081
OTHER 11,385 6,917 – 4,468
TOTAL EQUITY SECURITIES 767,967 723,165 33,914 10,888
EXTERNALLY MANAGED TRUSTS 122,686 – – 122,686
TOTAL INVESTMENTS BY FAIR VALUE LEVEL 2,992,091 $ 810,401 $ 2,048,116 $ 133,574
INVESTMENTS MEASURED USING NET ASSET VALUE (NAV)
GLOBAL EQUITY INVESTMENTS 1,311,637
ABSOLUTE RETURN STRATEGY FUNDS 622,479
PRIVATE EQUITY AND VENTURE CAPITAL FUNDS 369,888
REAL ASSETS FUNDS 193,341
OTHER 48,228
TOTAL INVESTMENTS MEASURED USING NAV 2,545,573
TOTAL INVESTMENTS MEASURED AT FAIR VALUE 5,537,664
CASH EQUIVALENTS AT AMORTIZED COST 119,825
TOTAL INVESTMENTS $ 5,657,489
NOTE 6:
InvestmentsINVESTMENTS – GENERALThe University of Washington Board of Regents is vested by statute with responsibility for the University’s properties and investments, and for establishing investment policy. The University of Washington Investment Management Company (UWINCO), led by the Chief Investment Officer, carries out the day-to-day activities of the investment portfolios. The University of Washington Investment Management Company Board (“UWINCO Board”), which consists of both Board of Regents’ members and external investment professionals, serves as an advisory board to UWINCO.
The University holds significant amounts of investments that are measured at fair value on a recurring basis. Shown below is a tabular format for disclosing the levels within the fair value hierarchy. The three-tier hierarchy of inputs is summarized as follows:
• Level 1 Inputs – Quoted prices (unadjusted) in active markets for identical assets or liabilities that a government can access at the measurement date
• Level 2 Inputs – Inputs other than quoted prices included within Level 1 that are observable for an asset or liability, either directly or indirectly
• Level 3 Inputs – Unobservable inputs for an asset or liability

Notes to Financial Statements
UNIVERSITY OF WASHINGTON / 28
Fixed income and equity securities classified in Level 1 of the fair value hierarchy are valued using prices quoted in active markets for those securities. Fixed income and equity securities classified in Level 2 are valued using other observable inputs including quoted prices for similar securities and interest rates. Private equity, real assets and other investments classified in Level 3 are valued using either discounted cash flow or market comparable techniques.
The University’s interests in certain non-readily marketable alternative investments, such as hedge funds and private equity limited partnerships, are stated at fair value based on NAV estimates used as a practical expedient reported to the University by investment fund managers. The valuation method for investments measured using NAV per share (or its equivalent) is presented in the following table.
TABLE 2 – INVESTMENTS MEASURED USING NAV (Dollars in thousands)
2018 Fair ValueUnfunded
CommitmentsRedemption Frequency
(If Currently Eligible)Redemption
Notice Period
INVESTMENTS $ 1,311,637 $ 22,308 MONTHLY TO ANNUALLY 15-180 DAYS
ABSOLUTE RETURN STRATEGY FUNDS 622,479 – QUARTERLY TO ANNUALLY 30-90 DAYS
PRIVATE EQUITY AND VENTURE CAPITAL FUNDS 369,888 347,263 N/A -
REAL ASSETS FUNDS 193,341 55,105 N/A -
OTHER 48,228 850 QUARTERLY TO ANNUALLY 30-95 DAYS
TOTAL INVESTMENTS MEASURED USING NAV $ 2,545,573
1. Global Equity: This investment category includes public equity investments in separately managed accounts, long-only comingled funds, unconstrained limited partnerships, and passive market indices. For 2018, approximately 72% of the value of the investments in this category can be redeemed within 90 days, and 92% can be redeemed within one year.
2. Absolute Return: This category includes investments in stable income and low-to-medium beta funds. Management of these funds seeks low correlation to broad equity markets by investing in assets that exhibit low volatility, deep discounts, and/or hedges against market downturns. Approximately 88% of the value of the investments in this category can be redeemed within one year.
3. Private equity: This category includes buyout, venture, and special situations funds. These investments can never be redeemed with the funds. Distributions from each fund will be received as the underlying investments of the funds are liquidated. It is expected that the majority of underlying assets of the funds will be liquidated over the next 7 to 10 years.
4. Real assets: This category includes real estate, natural resources, and other hard assets. These investments can never be redeemed with the funds. Distributions from each fund will be received as the underlying investments of the funds are liquidated. It is expected that the majority of underlying assets of the funds will be liquidated over 7 to 10 years.
5. Other: This category consists of opportunistic investments and includes various types of non- investment grade and non-rated credit plus nominal equity exposure. Approximately 15% of the value of the investments in this category can be redeemed or anticipate distribution within one year. The remaining balance of these investments contain restrictions on redemption within one year or will be distributed as underlying investments are liquidated. It is expected that the underlying assets of the funds will be liquidated over the next 10 years.
INVESTMENT POOLSThe University combines most short-term cash balances into the Invested Funds Pool. At June 30, 2018, the Invested Funds Pool totaled $1,788,142,000. The Invested Funds Pool also owns units in the Consolidated Endowment Fund (CEF) valued at $643,098,000 at June 30, 2018. By University policy, departments with qualifying funds in the Invested Funds Pool receive distributions based on their average balances and on the type of balance. Campus depositors received 0.75% in fiscal year 2018. University Advancement received 3% of the average balances in endowment operating and gift accounts in fiscal year 2018. The difference between the actual earnings of the Invested Funds Pool and the calculated distributions is used to support activities benefiting all University departments.
The majority of the endowed funds are invested in the CEF, a pooled fund. Individual endowments purchase units in the pool on the basis of a per-unit valuation of the CEF at fair value on the last business day of the calendar quarter. Income is distributed based on the number of units held. RCW 24.55 of the Washington State Code and the Uniform Prudent Management of Institutional Funds Act allow for total return expenditure under comprehensive prudent standards.
Under the CEF spending policy approved by the Board of Regents, quarterly distributions to programs are based on an annual percentage rate of 4.0%, applied to the five-year rolling average of the CEF’s market valuation. Additionally, the policy allows for an administrative fee of 1.0% supporting campus-wide fundraising and stewardship activities (0.80%) and offsetting the internal cost of managing endowment assets (0.20%).
(continued)

FINANCIAL REPORT 2018 / 29
The University records its permanent endowments at the lower of original gift value or current market value in the Restricted Nonexpendable Net Position category. Of the endowments that are recorded at current market value, the net deficiency from the original gift value is $398,000 at June 30, 2018.
Net appreciation (depreciation) in the fair value of investments includes both realized and unrealized gains and losses on investments. The University realized net gains of $62,260,000 in fiscal year 2018 from the sale of investments. The calculation of realized gains and losses is independent of the net appreciation of the fair value of investments. Realized gains and losses on investments that have been held in more than one fiscal year and are sold in the current year include the net appreciation (depreciation) of these investments reported in the prior year(s). The net appreciation in the fair value of investments during the year ended June 30, 2018 was $299,457,000.
FUNDING COMMITMENTSThe University enters into contracts with investment managers to fund alternative investments. As of June 30, 2018, the University had outstanding commitments to fund alternative investments of $425,526,000. These commitments are expected to be called over a multi-year time frame, generally 2-5 years depending on the type of fund. The University believes it has adequate liquidity and funding sources to meet these obligations.
DERIVATIVESThe University’s investment policies allow investing in various derivative instruments, including futures, swaps and forwards, to manage exposures within or across the portfolio and to improve the portfolio’s risk/return profile.
Futures are financial contracts obligating the buyer to purchase an asset at a predetermined future date and price. Total return swaps involve commitments to pay interest in exchange for a market-linked return, both based on notional amounts. Derivative instruments are recorded on the contract date and are carried at fair value using listed price quotations or amounts that approximate fair value. The notional amount and fair value of investment derivative instruments outstanding at June 30, 2018, categorized by type, are as follows:
TABLE 3 – INVESTMENT DERIVATIVES (Dollars in thousands)
Notational Amount as of June 30 Fair Value as of June 30 Change in Fair Value
DESCRIPTION 2018 ASSET CLASSIFICATION 2018 INCOME CLASSIFICATION 2018
OPTIONS PURCHASED-PUTS $ 161 INVESTMENTS $ 137 INVESTMENT INCOME $ (24)
SWAPS FIXED INCOME - LONG 119,807 INVESTMENTS 119,010 INVESTMENT INCOME (797)
SWAPS FIXED INCOME SHORT (119,001) INVESTMENTS (115,391) INVESTMENT INCOME 3,610
FUTURES ON CONTRACTS - LONG 180,216 INVESTMENTS 180,268 INVESTMENT INCOME 52
FUTURES ON CONTRACTS - SHORT (64,727) INVESTMENTS (65,075) INVESTMENT INCOME (348)
Credit exposure represents exposure to counterparties relating to financial instruments, where gains exceed collateral held by the University or losses are less than the collateral posted by the University. There was no credit exposure as of June 30, 2018. No derivative instruments have been reclassified from a hedging instrument to an investment instrument.
Details on foreign currency derivatives are disclosed under Foreign Exchange Risk.
INTEREST RATE RISKInterest rate risk is the risk that changes in interest rates will adversely affect the fair value of fixed income securities. The University manages interest rate risk through its investment policies and the investment guidelines established with each manager. Each fixed income manager is assigned a maximum boundary for duration as compared to the manager’s relevant benchmark index. The goal is to allow ample freedom for the manager to perform, while controlling the interest rate risk in the portfolio. Effective duration is a commonly used measure of interest rate risk. The longer the duration, the more sensitive the portfolio is to changes in interest rates. The weighted average effective duration of the University’s fixed income portfolio was 1.74 years at June 30, 2018.
CREDIT RISKFixed income securities are also subject to credit risk, which is the risk that the issuer or other counterparty to a financial instrument will not fulfill its obligations, or that negative perceptions of the issuer’s ability to make these payments will cause prices to decline. Concentration of credit risk is the risk of loss attributed to the magnitude of a government’s investment in a single issuer. The University Investment Policies limit fixed income exposure to investment grade assets. The Investment Policy for the Invested Funds’ cash pool requires each manager to maintain an average quality rating of

Notes to Financial Statements
UNIVERSITY OF WASHINGTON / 30
“AA” as issued by a nationally recognized rating organization. The Invested Funds’ liquidity pool requires each manager to maintain an average quality rating of “A” and to hold 25% of their portfolios in government and government agency issues. The Investment Policy for the CEF reflects its long-term nature by specifying average quality rating levels by individual manager, but still restricting investment to investment grade credits.
Duration is a calculation of the number of years required to recover the true cost of a bond. The duration measures presented in Table 4 below represent a broad average across all fixed income securities held in the CEF, the Invested Funds Pool (IF or operating funds) and debt service reserve funds. The CEF and IF portfolios are managed to have a duration below their policy benchmarks to protect principal and provide liquidity to the overall portfolio.
Duration and credit risk figures at June 30, 2018 exclude $16,274,000 of fixed income securities held by component units. These amounts make up 0.77% of the University’s fixed income investments, and are not included in the duration figures detailed in Table 4.
The composition of fixed income securities at June 30, 2018, along with credit quality and effective duration measures, is summarized as follows:
TABLE 4 – FIXED INCOME: CREDIT QUALITY AND EFFECTIVE DURATION (Dollars in thousands)
2018
Investments U.S. GovernmentInvestment
Grade*Non-Investment
Grade Not Rated TotalDuration (in years)
U.S. TREASURY SECURITIES $ 648,644 $ – $ – $ – $ 648,644 1.85
U.S. GOVERNMENT AGENCY 540,529 – – – 540,529 2.85
MORTGAGE BACKED – 164,675 42,247 25,052 231,974 1.99
ASSET BACKED – 147,713 1,134 26,602 175,449 0.71
CORPORATE AND OTHER – 368,800 31,830 87,938 488,568 1.14
TOTAL $ 1,189,173 $ 681,188 $ 75,211 $ 139,592 $ 2,085,164 1.74
* Investment Grade securities are those that are rated BBB and higher by Standard and Poor’s or Baa and higher by Moody’s.
FOREIGN EXCHANGE RISKForeign exchange risk is the risk that investments denominated in foreign currencies may lose value due to adverse fluctuations in the value of the U.S. dollar relative to foreign currencies. The University’s investment policies permit investments in international equity and other asset classes, which can include foreign currency exposure. The University also enters into foreign currency forward contracts, futures contracts, and options to manage the foreign currency exposure. The University held non-U.S. denominated securities at June 30, 2018 of $1,458,133,000.
(Dollars in thousands) 2018
CHINESE RENMINBI (CNY) $ 232,898EURO (EUR) 161,709INDIAN RUPEE (INR) 154,962JAPANESE YEN (JPY) 141,518CANADIAN DOLLAR (CAD) 97,112BRAZIL REAL (BRL) 78,752BRITISH POUND (GBP) 78,660SOUTH KOREAN WON (KRW) 58,605HONG KONG DOLLAR (HKD) 55,290SWISS FRANC (CHF) 41,690MEXICAN PESO (MXN) 33,643TAIWANESE DOLLAR (TWD) 33,151RUSSIAN RUBLE (RUB) 30,289AUSTRALIAN DOLLAR (AUD) 24,972SWEDISH KRONA (SEK) 21,674ARGENTINE PESO (ARS) 19,925INDONESIAN RUPIAH (IDR) 17,949SOUTH AFRICAN RAND (ZAR) 17,856PHILIPPINE PESO (PHP) 13,943REMAINING CURRENCIES 143,535 TOTAL $ 1,458,133
TABLE 5 – INVESTMENTS DENOMINATED IN FOREIGN CURRENCY
(continued)

FINANCIAL REPORT 2018 / 31
(Dollars in thousands)Balance at
June 30, 2017Additions/ Transfers Retirements
Balance at June 30, 2018
LAND $ 144,211 $ 413 $ – $ 144,624INFRASTRUCTURE 310,088 1,265 55 311,298BUILDINGS 6,151,073 286,982 2,606 6,435,449FURNITURE, FIXTURES AND EQUIPMENT 1,476,943 106,634 67,257 1,516,320LIBRARY MATERIALS 364,491 14,253 1,989 376,755CAPITALIZED COLLECTIONS 7,248 117 – 7,365INTANGIBLE ASSETS 208,528 12,462 302 220,688CONSTRUCTION IN PROGRESS 349,699 221,651 4,562 566,788INTANGIBLES IN PROCESS 10,510 (2,190) 823 7,497 TOTAL COST 9,022,791 641,587 77,594 9,586,784LESS ACCUMULATED DEPRECIATION/AMORTIZATION:INFRASTRUCTURE 120,556 8,708 55 129,209BUILDINGS 2,600,309 218,775 2,597 2,816,487FURNITURE, FIXTURES AND EQUIPMENT 1,193,473 116,503 58,535 1,251,441
LIBRARY MATERIALS 273,171 14,140 1,521 285,790INTANGIBLE ASSETS 98,248 25,878 – 124,126 TOTAL ACCUMULATED DEPRECIATION/AMORTIZATION 4,285,757 384,004 62,708 4,607,053 CAPITAL ASSETS, NET $ 4,737,034 $ 257,583 $ 14,886 $ 4,979,731
NOTE 7:
Metropolitan TractThe University of Washington Metropolitan Tract (Metropolitan Tract), located in downtown Seattle, comprises approximately 11 acres of developed property including office space, retail space, residential apartments, parking, and a luxury hotel. This land was the original site of the University from 1861 until 1895 when the University moved to its present location on Lake Washington. Since the early 1900s, the University has managed the Metropolitan Tract by leasing to third party tenants, and ground leasing to entities responsible for developing and operating new buildings.
The balance as of June 30, 2018 of $152,233,000 represents the asset value net of operating liabilities and long-term debt on the property. The asset value is comprised primarily of land, buildings, building improvements and operating assets.
Total debt outstanding on the Metropolitan Tract was $31,300,000 as of June 30, 2018, which will be repaid by proceeds from the properties. The debt was issued in 2015 to refund commercial paper and acquire the leasehold on the Cobb Building. This amount is reflected in the balance for Metropolitan Tract on the Statement of Net Position, and is therefore not included in Note 9 or Note 11.
In 2014, the University entered into an agreement with Wright Runstad to undertake redevelopment of the Rainier Square (Predevelopment Agreement). The agreement commenced on November 1, 2014 and expires upon the completion of certain development milestones. The Predevelopment Agreement provides for the execution of a ground lease for the development of a multi-use office tower (Rainier Square Tower Lease) and a separate ground lease for a luxury hotel (Rainier Square Hotel Lease).
On September 12, 2017, the University executed the Rainier Square Tower Lease with Wright Runstad and amended the Predevelopment Agreement to allow for a separate future closing of the Rainier Square Hotel Lease. The Tower Lease has an 80 year term, requires Wright Runstad to complete development of the approved building in four years, is unsubordinated, and requires minimum ground rent during construction and 8% of adjusted gross revenue from the project thereafter. Demolition of the old Rainier Square building occurred in November 2017 and construction of the new Rainier Square Tower commenced thereafter.
In connection with the Tower Lease, the University executed an Operating Agreement with Wright Runstad that regulates how the existing Rainier Tower and the lessees of the Rainier Square Tower and the Rainier Square Hotel will operate shared mix use space on the Rainier Square block. The Predevelopment Agreement still applies to the Rainier Square Hotel Lease site.
NOTE 8:
Capital AssetsCapital asset activity for the period ended June 30, 2018 is summarized as follows:

Notes to Financial Statements
UNIVERSITY OF WASHINGTON / 32
(Dollars in thousands)Balance at
June 30, 2017Additions/Transfers Reductions
Balance at June 30, 2018
Current Portion 2018
VALLEY MEDICAL CENTER LIMITED TAX GENERAL OBLIGATION BONDS $ 238,359 $ – $ 8,509 $ 229,850 $ 8,260 REVENUE BONDS 14,318 – 1,725 12,593 1,870 BUILD AMERICA BONDS 61,155 – – 61,155 – NOTES PAYABLE & OTHER 5,555 561 244 5,872 78 TOTAL LONG-TERM LIABILITIES $ 319,387 $ 561 $ 10,478 $ 309,470 $ 10,208
CAPITAL LEASES
Year (Dollars in thousands) Future
Payments
2019 $ 2,791
2020 2,383
2021 2,054
2022 1,851
2023 1,494
THEREAFTER 120
TOTAL MINIMUM LEASE PAYMENTS 10,693
LESS: AMOUNT REPRESENTING INTEREST COSTS 591
PRESENT VALUE OF MINIMUM PAYMENTS $ 10,102
(Dollars in thousands)Balance at
June 30, 2017Additions/ Transfers Reductions
Balance at June 30, 2018
Current Portion2018
BONDS PAYABLE: GENERAL OBLIGATION BONDS PAYABLE (NOTE 11) $ 109,199 $ – $ 13,890 $ 95,309 $ 13,920 REVENUE BONDS PAYABLE (NOTE 11) 2,112,330 133,785 77,250 2,168,865 61,375 UNAMORTIZED PREMIUM ON BONDS 157,204 22,800 17,106 162,898 17,535 TOTAL BONDS PAYABLE 2,378,733 156,585 108,246 2,427,072 92,830NOTES PAYABLE AND CAPITAL LEASES: NOTES PAYABLE & OTHER – CAPITAL ASSET RELATED (NOTE 11) 26,639 6,537 5,620 27,556 5,507 NOTES PAYABLE & OTHER – NONCAPITAL ASSET RELATED (NOTE 11) 1,479 86 134 1,431 1,351 CAPITAL LEASE OBLIGATIONS (NOTE 10) 12,829 216 2,943 10,102 2,556 TOTAL NOTES PAYABLE AND CAPITAL LEASES 40,947 6,839 8,697 39,089 9,414OTHER LONG-TERM LIABILITIES: OBLIGATIONS UNDER SPLIT-INTEREST AGREEMENTS 54,683 8,214 5,712 57,185 5,712 POLLUTION REMEDIATION LIABILITY (NOTE 1) 21,000 – – 21,000 1,000 HMC ITS FUNDING (NOTE 14) 30,258 3,025 3,564 29,719 11,500 SICK LEAVE (NOTE 1) 46,771 6,066 3,202 49,635 4,061 SELF-INSURANCE (NOTE 17) 78,484 42,033 8,307 112,210 12,000 OTHER NONCURRENT LIABILITIES 19,206 2,133 145 21,194 – TOTAL OTHER LONG-TERM LIABILITIES 250,402 61,471 20,930 290,943 34,273 TOTAL LONG-TERM LIABILITIES $ 2,670,082 $ 224,895 $ 137,873 $ 2,757,104 $ 136,517
NOTE 10:
LeasesFuture minimum lease payments under capital leases, and the present value of the net minimum lease payments as of June 30, 2018, are as follows:
NOTE 9:
Long-Term LiabilitiesUNIVERSITY OF WASHINGTONLong-term liability activity for the period ended June 30, 2018 is summarized as follows:
COMPONENT UNIT Long-term liability activity for the period ended June 30, 2018 is summarized as follows:
(continued)

FINANCIAL REPORT 2018 / 33
Year (Dollars in Thousands) Future
Payments
2019 $ 77,380
2020 72,815
2021 62,720
2022 54,870
2023 48,397
2024 - 2028 115,060
2029 - 2033 52,831
2034 - 2038 56,224
2039 - 2043 63,917
2044 - 2048 75,102
2049 - 2053 82,084
2054 - 2058 97,545
2059 - 2063 109,630
TOTAL MINIMUM LEASE PAYMENTS $ 968,575
BONDS AND NOTES PAYABLE (Dollars in thousands)
STATE OF WASHINGTON GENERAL OBLIGATION BONDS
UNIVERSITY OF WASHINGTON GENERAL REVENUE BONDS
NOTES PAYABLE AND OTHER
Year Principal Interest Principal Interest Principal Interest2019 $ 13,920 $ 4,473 $ 61,375 $ 101,965 $ 6,858 $ 1,0012020 10,275 3,824 63,015 99,242 5,565 8132021 10,765 3,305 66,640 96,362 5,216 6242022 11,230 2,753 69,685 93,194 2,901 4692023 11,790 2,162 69,345 89,858 1,304 3552024 – 2028 35,705 3,528 370,220 397,394 4,509 1,0892029 – 2033 1,624 33 383,650 304,007 2,634 2642034 – 2038 – – 421,580 209,936 – –2039 – 2043 – – 477,385 95,182 – –2044 – 2048 – – 185,970 14,142 – – TOTAL PAYMENTS $ 95,309 $ 20,078 $ 2,168,865 $ 1,501,282 $ 28,987 $ 4,615
NOTE 11:
Bonds and Notes PayableThe bonds and notes payable at June 30, 2018 consist of state of Washington General Obligation and Refunding Bonds, University Revenue Bonds, and Notes Payable. These obligations have fixed interest rates ranging from 1.40% to 6.62%. Debt service requirements at June 30, 2018 were as follows:
OPERATING LEASESThe University has certain lease agreements in effect that are considered operating leases, which are primarily for leased building space. During the year ended June 30, 2018, the University recorded rent expense of $87,508,000 for these leases. Future lease payments as of June 30, 2018 are as follows:
State law requires that the University reimburse the state for debt service payments relating to its portion of the state of Washington General Obligation and Refunding Bonds from medical center patient revenues, tuition, timber sales and other revenues.
ISSUANCE ACTIVITYOn February 15, 2018, the University issued $133,785,000 in General Revenue & Refunding Bonds, 2018, at a premium of $22,800,000. The proceeds were used to fund various projects such as Phase 4a of the Housing Master Plan, and construction of the Life Sciences Building. In addition, proceeds were used to pay off $125,881,000 in commercial paper. The 2018 bonds have a coupon rate of 5.00%. The average life of the 2018 General Revenue Bonds is 15.62 years with final maturity on April 1, 2048.

Notes to Financial Statements
UNIVERSITY OF WASHINGTON / 34
OPERATING EXPENSES (Dollars in thousands) 2018
INSTRUCTION $ 1,267,799
RESEARCH 785,223
PUBLIC SERVICE 48,916
ACADEMIC SUPPORT 511,931
STUDENT SERVICES 51,950
INSTITUTIONAL SUPPORT 251,569
OPERATION & MAINTENANCE OF PLANT 201,101
SCHOLARSHIPS & FELLOWSHIPS 149,378
AUXILIARY ENTERPRISES 494,956
MEDICAL-RELATED 1,711,969
DEPRECIATION/AMORTIZATION 384,004
TOTAL OPERATING EXPENSES $ 5,858,796
NOTE 12:
Deferred Outflows and Deferred Inflows of ResourcesThe composition of deferred outflows and deferred inflows of resources at June 30 are summarized as follows:
COMMERCIAL PAPER PROGRAMThe University has a commercial paper program with a maximum borrowing limit of $250,000,000, payable from University general revenues. This short-term borrowing program is primarily used to fund capital expenditures. As of June 30, 2018, there was $90,000,000 in outstanding commercial paper recorded in Other Current Liabilities on the Statement of Net Position.
During fiscal year 2018, the University issued $178,000,000 of commercial paper debt. $125,881,000 of this was refunded with General Revenue Bonds, Series 2018, $6,119,000 was refunded with University funds and $23,000,000 was refunded with state appropriated funds.
SUBSEQUENT DEBT ACTIVITYOn July 16, 2018, the University repaid $25,000,000 of commercial paper debt with University funds.
On August 8, 2018, the University issued $35,000,000 of commercial paper. The proceeds will be used to fund the Life Sciences Building and Phase 4a of the Housing Master Plan.
NOTE 13:
Operating Expenses by FunctionOperating expenses by functional classification for the year ended June 30, 2018 are summarized as follows:
DEFERRED OUTFLOWS AND INFLOWS OF RESOURCES (Dollars in thousands)
2018 Pensions OPEBSplit-Interest Agreements Other Total
DEFERRED OUTFLOWS OF RESOURCES $ 189,227 $ 24,771 $ – $ 30,043 $ 244,041
DEFERRED INFLOWS OF RESOURCES 248,192 223,156 44,975 – 516,323
(continued)

FINANCIAL REPORT 2018 / 35
InstructionInstruction includes expenses for all activities that are part of an institution’s instructional programs. Expenses for credit and noncredit courses; academic, vocational, and technical instruction; and tutorial instruction are included in this category. The University’s professional and continuing education programs are also included.
ResearchThe research category includes all expenses for activities specifically organized to produce research, which are funded by federal, state, and private institutions.
Public ServicePublic service includes activities conducted primarily to provide non-instructional services to individuals and groups other than the University and its students, such as community service programs, conferences, institutes and general advisory services.
The activities of the University’s public radio stations, Center for Educational Leadership and clinical trials are included in this category.
Academic SupportAcademic support includes expenses incurred to provide support services for the institution’s primary missions: instruction, research, and public service. The activities of the University’s academic administration, libraries, museums and galleries, and information technology support for academic activities are included in this category.
Student ServicesThe student services category includes the Offices of Admissions and the University Registrar. The activities of the Center for Undergraduate Advising, Diversity, and Student Success, and the operations of the Rubenstein Pharmacy in the student health center are also included in this category.
Institutional SupportThe institutional support category includes central activities that manage long-range planning for the institution, such as planning and programming operations, legal services, fiscal operations, space management, procurement and activities concerned with community and alumni relations. The University’s central administration departments and information technology support for non-academic activities are included in this category.
Operation and Maintenance of PlantThe operation and maintenance of plant category includes the administration, operation, maintenance, preservation, and protection of the institution’s physical plant.
Scholarships and FellowshipsThis category includes expenses for scholarships and fellowships and other financial aid not funded from existing University resources. Financial aid funded from existing University resources are considered scholarship allowances, which are reflected as an offset to tuition revenues. Expenditure of amounts received from the Washington State Need grant, Washington Higher Education grant, and Pell grants are reflected in this manner.
Auxiliary EnterprisesAuxiliary enterprises furnish goods or services to students, faculty, staff or the general public. These units charge a fee directly related to the cost of the goods or services. A distinguishing characteristic of an auxiliary enterprise is that it operates as a self-supporting activity. The activities of the University’s Intercollegiate Athletics, Commuter Services and Housing and Food Services departments are included in this category.
Medical-relatedThe medical-related category includes all expenses associated with patient-care operations, including nursing and other professional services, general services, administrative services, and fiscal services. The activities of UWMC, UWP, NWH, Airlift Northwest and Neighborhood Clinics are included in this category.
Depreciation/AmortizationDepreciation and amortization reflect a periodic expensing of the cost of capitalized assets such as buildings, equipment, software or other intangible assets, spread over their estimated useful lives.

Notes to Financial Statements
UNIVERSITY OF WASHINGTON / 36
NOTE 14:
Related PartiesHarborview Medical Center (HMC), a hospital and Level I adult and pediatric trauma center located in Seattle, is a component unit of King County, Washington. It has been managed by the University under a management contract between King County and the University since 1967. In February 2016, the University and King County entered into a Hospital Services Agreement. The agreement has a ten-year term and may be renewed by the parties for two successive ten-year terms.
Under the Hospital Services Agreement, King County retains title to all real and personal properties acquired for King County with HMC capital or operating funds. These real and personal properties are recorded on HMC’s books and facility revenues for the operation of HMC are deposited in a King County account that is separate from general King County accounts.
The University is responsible for the operations of HMC, including the provision of medical, dental and management services. All of the individuals employed at HMC, including physicians, are employees of the University. HMC expenses, including payroll, are reimbursed to the University from HMC fund sources.
HMC revenues and expenses are not recognized in the University’s financial statements. The University’s financial statements do, however, include accounts receivable from HMC of $32,455,000 as of June 30, 2018, as well as HMC investments of $3,832,000, current accrued liabilities of $32,554,000 and long-term liabilities of $29,719,000.
Under an annual agreement, HMC provides strategic funding to Neighborhood Clinics. Funding from HMC to Neighborhood Clinics was $11,334,000 during fiscal year 2018, and is presented as Other Operating Revenue in the Statement of Revenues, Expenses and Changes in Net Position.
UW Medicine Information Technology operates as a self-sustaining activity of the University (ITS department). The ITS department records enterprise-wide information technology capital assets that are purchased for use by UW Medicine entities. The HMC ITS funding reflected in long-term liabilities (Note 9) of $29,719,000 at June 30, 2018, represents HMC’s funding of the enterprise-wide information technology capital assets which will be included in the recharge rates of the ITS department over the useful life of the assets.
The University of Washington Foundation (UWF) is a nonprofit organization that performs fundraising activities on behalf of the University. The UWF is not included in the University’s financial statements as a component unit because gifts and grants that are made to the UWF are immediately transferred to the University. In 2018, the UWF transferred $132,469,000 to the University in gifts and grants received on its behalf; these are included in the financial statements of the University. The remaining amounts retained by the UWF are not significant to the University’s financial statements.
The University of Washington Alumni Association is a tax-exempt entity that was established to connect and celebrate alumni and to support the University’s mission. The Alumni Association received $3,989,000 from the University in support of its operations in fiscal year 2018. These amounts were expensed by the University.
NOTE 15:
Pension PlansThe University offers four contributory pension plans: 1) the Washington State Public Employees’ Retirement System (PERS) plan, 2) the Washington State Teachers’ Retirement System (TRS) plan, 3) the Law Enforcement Officers’ and Fire Fighters’ Retirement System (LEOFF) plan, and 4) the University of Washington Retirement Plan (UWRP). PERS, TRS, and LEOFF are cost sharing multiple-employer defined-benefit pension plans administered by the Washington State Department of Retirement Systems (DRS). UWRP is a defined-contribution plan with a supplemental noncontributory defined-benefit plan component, and is administered by the University.
As of June 30, 2018, the University’s share of the total unfunded liabilities associated with the defined-benefit pension plans administered by the DRS was $772,371,000. The liability associated with the defined benefit pension plan administered by the University was $412,481,000, but does not reflect assets segregated in a separate investment account to pay future retiree benefits of $261,087,000. For the year ended June 30, 2018, total pension expense recorded by the University related to both the DRS and University plans was $92,338,000.
(continued)
FINANCIAL REPORT 2018 / 37
PLANS ADMINISTERED BY DRS
PLAN DESCRIPTIONPublic Employees’ Retirement SystemPERS retirement benefit provisions are contained in chapters 41.34 and 41.40 of the Revised Code of Washington (RCW). PERS is a cost-sharing multiple-employer retirement system comprised of three separate pension plans for membership purposes. PERS Plan 1 and PERS Plan 2 are defined-benefit plans, and PERS Plan 3 is a defined-benefit plan with a defined-contribution component. PERS members include higher education employees not participating in other higher education retirement programs.
For accounting purposes, PERS is reported as three separate plans. Plan 1 accounts for the defined benefits of Plan 1 members, Plan 2/3 accounts for the defined benefits of Plan 2 and Plan 3 members, and Plan 3 accounts for the defined-contribution portion of Plan 3 members. The defined-benefit portions of Plan 2 and Plan 3 are accounted for in the same pension trust fund, and all assets of Plan 2/3 may legally be used to pay the defined benefits of any of the Plan 2 or Plan 3 members or beneficiaries.
Teachers’ Retirement SystemTRS retirement benefit provisions are contained in chapters 41.32 and 41.34 of the RCW. TRS is a cost-sharing, multiple-employer retirement system, comprised of three separate pension plans for membership purposes; TRS Plan 1 and TRS Plan 2 are defined-benefit plans and TRS Plan 3 is a defined-benefit plan with a defined-contribution component. TRS eligibility for membership requires service as a certificated public school employee working in an instructional, administrative or supervisory capacity.
For accounting purposes, similar to PERS, TRS is reported as three separate plans. Plan 1 accounts for the defined benefits of Plan 1 members, Plan 2/3 accounts for the defined benefits of Plan 2 and Plan 3 members, and Plan 3 accounts for the defined-contribution portion of Plan 3 members. The defined-benefit portions of Plan 2 and Plan 3 are accounted for in the same pension trust fund, and all assets of Plan 2/3 may legally be used to pay the defined benefits of any of the Plan 2 or Plan 3 members or beneficiaries.
Law Enforcement Officers’ and Fire Fighters’ Retirement SystemLEOFF retirement benefit provisions are contained in chapter 41.26 of the RCW. LEOFF is a cost-sharing multiple- employer retirement system comprised of two separate pension plans for both membership and accounting purposes. The University participates in LEOFF Plan 2, which is a defined-benefit plan. LEOFF membership includes full-time, fully compensated, local law enforcement commissioned officers, firefighters, and as of July 24, 2005, emergency medical technicians.
VESTING AND BENEFITS PROVIDEDPERS Plan 1 and TRS Plan 1PERS Plan 1 and TRS Plan 1 provide retirement, disability and death benefits. Both plans are closed to new entrants. All members were vested after the completion of five years of eligible service. Retirement benefits are determined as two percent of the member’s average final compensation (AFC) times the member’s years of service. The AFC is the average of the member’s 24 highest-paid consecutive service months. The retirement benefit may not exceed 60% of the AFC.
Members are eligible for retirement from active status at any age with at least 30 years of service, at age 55 with at least 25 years of service, or at age 60 with at least five years of service. Members retiring from inactive status prior to the age of 65 may receive actuarially reduced benefits. Other benefits include duty and nonduty disability payments, an optional cost-of-living allowance, and a one-time duty-related death benefit, if the member is found eligible by the Washington State Department of Labor and Industries.
PERS Plan 2/3 and TRS Plan 2/3PERS Plan 2/3 and TRS Plan 2/3 provide retirement, disability and death benefits. PERS Plan 2 and TRS Plan 2 members are vested after completion of five years of eligible service. PERS Plan 3 and TRS Plan 3 members are vested in the defined-benefit portion of their plan after 10 years of service, or after five years of service if 12 months are earned after age 44. Retirement benefits are determined as 2% of the member’s AFC times the member’s years of service for Plan 2, and 1% of AFC times the member’s years of service for Plan 3. The AFC is the average of the member’s 60 highest-paid consecutive service months. There is no cap on years of service credit.
Members are eligible for retirement with a full benefit at age 65 with at least five years of service credit. Retirement before age 65 is considered early retirement. Members are eligible for early retirement with a reduced benefit at age 55 with at least 20 years of service credit. The benefit is reduced by a factor that varies according to age, for each year before age 65.

Notes to Financial Statements
UNIVERSITY OF WASHINGTON / 38
Retirement benefits are actuarially reduced to reflect the choice of a survivor benefit. Other benefits include duty and non-duty disability payments, a cost-of-living allowance (based on the Consumer Price Index) capped at three percent annually, and a one-time duty-related death benefit, if the member is found eligible by the Washington State Department of Labor and Industries.
LEOFF Plan 2LEOFF Plan 2 provides retirement, disability and death benefits. Members are vested after completing five years of eligible service. Retirement benefits are determined as 2% of the final average salary (FAS) per year of service, based on the member’s 60 highest-paid consecutive service months. Members are eligible for retirement with a full benefit at age 53 with at least five years of service credit. Members who retire prior to age 53 receive reduced benefits.
Other benefits include duty and non-duty disability payments, a cost-of-living allowance (based on the Consumer Price Index) capped at 3% annually, and a one-time duty-related death benefit if the member is found eligible by the Washington State Department of Labor and Industries.
FIDUCIARY NET POSITIONThe pension plans’ fiduciary net positions have been determined on the same basis as they are reported by the pension plans. DRS financial statements have been prepared in conformity with generally accepted accounting principles. The retirement plans are accounted for in pension trust funds using the flow of economic resources measurement focus and the accrual basis of accounting. Member contributions are recognized as revenues in the period in which the contributions are earned. Employer contributions are recognized when due, and the employer has made a formal commitment to provide the contributions. Benefits and refunds are recognized when due and payable, in accordance with the terms of each plan.
Chapter 43.33A of the RCW authorizes the Washington State Investment Board (WSIB) with investment management responsibility for the pension funds. Investments are reported at fair value, and unrealized gains and losses are included as investment income in the Statement of Changes in Fiduciary Net Position presented in the DRS Comprehensive Annual Financial Report. Purchases and sales of investments are recorded on a trade-date basis.
DRS publishes an annual report for retirement plans, which is available at drs.wa.gov/administration/annual-report/default.htm.
ACTUARIAL ASSUMPTIONSAccounting requirements dictate the use of assumptions to best estimate the impact that pension obligations will have on the University. The professional judgments used in determining these assumptions are important, and can significantly impact the resulting actuarial estimates. Differences between actual results compared to these assumptions could have a significant effect on the University’s financial statements.
The total pension liability for each DRS plan was determined by an actuarial valuation, conducted by the Washington State Office of the State Actuary (OSA). The University’s 2018 pension liability is based on an OSA valuation performed as of June 30, 2016, with the results rolled forward to the measurement date of June 30, 2017. The following actuarial assumptions have been applied to all prior periods included in the measurement:
INFLATION 3.0% TOTAL ECONOMIC INFLATION, 3.75% SALARY INFLATION
SALARY INCREASE EXPECTED TO GROW BY PROMOTIONS AND LONGEVITY IN ADDITION TO SALARY INFLATION ASSUMPTION OF 3.75%
INVESTMENT RATE OF RETURN 7.50%
Mortality rates were based on the RP-2000 Combined Healthy Table and Combined Disabled Table published by the Society of Actuaries’ Retirement Plans Experience Committee (RPEC). As recommended by the RPEC, the OSA applied offsets to the base table and recognized future improvements in mortality by projecting the mortality rates using 100% Scale BB. Mortality rates are applied on a generational basis, meaning members are assumed to receive additional mortality improvements in each future year, throughout their lifetimes.
The actuarial assumptions used in the June 30, 2016 valuation were based on the results of the 2007-2012 Experience Study Report and the 2015 Economic Experience Study. Additional assumptions for subsequent events and law changes are current as of the 2016 actuarial valuation report.
The long-term expected rate of return on pension plan investments was determined by the WSIB using a building block method in which a best estimate of expected future rates of return (expected returns, net of pension plan investment expense, but including inflation) are developed for each major asset class. Those expected returns make up one component of WSIB’s Capital Market Assumptions (CMAs). WSIB uses the CMAs and their target asset allocation to simulate future investment returns over various time horizons.
The long-term expected rate of return of 7.50% approximately equals the median of the simulated investment returns over a 50-year time horizon, adjusted to remove or damper any short-term changes that are not expected over the entire 50-year measurement period.
(continued)

FINANCIAL REPORT 2018 / 39
2018 (Measurement Date 2017)
Asset ClassTarget
Allocation
Long-Term Expected Arithmetic Real Rate of Return
FIXED INCOME 20.00% 1.70%
TANGIBLE ASSETS 5.00% 4.90%
REAL ESTATE 15.00% 5.80%
GLOBAL EQUITY 37.00% 6.30%
PRIVATE EQUITY 23.00% 9.30%
Best estimates of arithmetic real rates of return for each major asset class included in the target asset allocation for each pension plan, as of the measurement date of June 30, 2017, are summarized in the following table:
The inflation component used to create the above table is 2.20%, and represents WSIB’s most recent long-term estimate of broad economic inflation.
DISCOUNT RATEThe discount rate used to measure the total pension liabilities as of June 30, 2018 was 7.50%. The projection of cash flows used to determine the discount rate assumed that contributions from plan members will be made at contractually required rates, and that contributions from employers will be made at statutorily required rates, actuarially determined (including the component of PERS 2/3 and TRS 2/3 employer rates pertaining to the unfunded actuarial accrued liabilities for PERS 1 and TRS 1, respectively). Based on those assumptions, the fiduciary net position for each pension plan was projected to be sufficient to make all projected future benefit payments of the current plan members. Therefore, the long-term expected rate of return on pension plan investments was applied to all periods of projected benefit payments to determine the total pension liability.
Using the WSIB long-term expected rate of return, a 7.50% future investment rate of return on pension plan investments was assumed. The expected return on plan assets is the estimated long-term rate of return that will be earned on the investments used to fund the pension obligation. Contributions from plan members and employers were assumed to continue to be made at contractually required rates (including the component of PERS 2/3 and TRS 2/3 employer rates pertaining to the unfunded actuarial accrued liabilities for PERS 1 and TRS 1, respectively, as provided for in chapter 41.45 of the RCW).
SENSITIVITY OF THE NET PENSION LIABILITY (ASSET) TO CHANGES IN THE DISCOUNT RATEThe following table presents the University’s proportionate net pension liability calculated using the discount rate of 7.50% as well as what the net pension liability would be if it were calculated using a discount rate that is one-percentage-point lower (6.50%) or one-percentage-point higher (8.50%) than the current rate.
EMPLOYER CONTRIBUTION RATESEmployer contribution rates are developed in accordance with Chapter 41.45 of the RCW by the OSA, and include an administrative expense component that is currently set at 0.18% of compensation reported to DRS. The statute provides authority to the Pension Funding Council to adopt changes to economic assumptions and contribution rates. The contribution rates and required contributions for each DRS plan in which the University participates are shown in the table below.
DISCOUNT RATE SENSITIVITY – NET PENSION LIABILITY (ASSET) (Dollars in thousands) 2018
Plan 1% DecreaseCurrent
Discount Rate 1% Increase
PERS 1 $ 487,796 $ 400,426 $ 324,746
PERS 2/3 980,851 364,073 (141,285)
TRS 1 7,555 6,076 4,795
TRS 2/3 6,099 1,796 (1,699)
LEOFF 2 648 (2,995) (5,963)
Description (Dollars in Thousands) PERS 1 PERS 2/3a TRS 1 TRS 2/3a LEOFF 2
2018
CONTRIBUTION RATE 12.70% 12.70% 15.20% 15.20% 8.93%
CONTRIBUTIONS MADE $ 54,839 $ 79,047 $ 1,006 $ 1,053 $ 392a Plan 2/3 employer rate includes a component to address the Plan 1 unfunded actuarial accrued liability

Notes to Financial Statements
UNIVERSITY OF WASHINGTON / 40
PROPORTIONATE SHARE OF PENSION EXPENSE (Dollars in thousands)
PERS 1 PERS 2/3 TRS 1 TRS 2/3 LEOFF 2 TOTAL
YEAR ENDED JUNE 30, 2018 $ 23,229 $ 55,060 $ 1,747 $ 927 $ (144) $ 80,819
DEFERRED OUTFLOWS OF RESOURCES (Dollars in thousands)
2018 PERS 1 PERS 2/3 TRS 1 TRS 2/3 LEOFF 2 TOTAL
CHANGE IN ASSUMPTIONS $ – $ 3,867 $ – $ 21 $ 4 $ 3,892
DIFFERENCE BETWEEN EXPECTED AND ACTUAL EXPERIENCE – 36,889 – 448 132 37,469
CHANGE IN UNIVERSITY’S PROPORTIONATE SHARE – 10,216 – 1,038 276 11,530
UNIVERSITY CONTRIBUTIONS SUBSEQUENT TO THE MEASUREMENT DATE OF THE COLLECTIVE NET PENSION LIABILITY (a) 54,839 79,047 1,005 1,053 392 136,336
TOTAL $ 54,839 $ 130,019 $ 1,005 $ 2,560 $ 804 $ 189,227(a) Recognized as a reduction of the net pension liability as of June 30, 2019
DEFERRED INFLOWS OF RESOURCES (Dollars in thousands)
2018 PERS 1 PERS 2/3 TRS 1 TRS 2/3 LEOFF 2 TOTAL
DIFFERENCE BETWEEN PROJECTED AND ACTUAL EARNINGS ON PLAN INVESTMENTS, NET $ 14,943 $ 97,053 $ 257 $ 650 $ 672 $ 113,575
DIFFERENCE BETWEEN EXPECTED AND ACTUAL EXPERIENCE – 11,974 – 92 114 12,180
CHANGE IN UNIVERSITY’S PROPORTIONATE SHARE – – – – 239 239
TOTAL $ 14,943 $ 109,027 $ 257 $ 742 $ 1,025 $ 125,994
(Dollars in Thousands) PERS 1 PERS 2/3 TRS 1 TRS 2/3 LEOFF 2 TOTAL
2018
NET PENSION LIABILITY $ 400,426 $ 364,073 $ 6,076 $ 1,796 $ – $ 772,371
NET PENSION ASSET – – – – 2,995 2,995
UNIVERSITY PROPORTIONATE SHARECollective pension amounts are determined as of a measurement date, which can be no earlier than an employer’s prior fiscal year. The measurement date for the net pension liabilities recorded by the University as of June 30, 2018 was June 30, 2017. Employer contributions received and processed by the DRS during the fiscal year ended June 30, 2017 have been used as the basis for determining each employer’s proportionate share of the collective pension amounts reported by the DRS in their June 30, 2017 Schedules of Employer and Nonemployer Allocations. The University’s proportionate share for each DRS plan is shown in the table below.
UNIVERSITY AGGREGATED BALANCESThe University’s aggregated balance of net pension liabilities and net pension asset as of June 30, 2018 is presented in the table below.
PENSION EXPENSE, DEFERRED OUTFLOWS OF RESOURCES AND DEFERRED INFLOWS OF RESOURCESThe tables below summarize the University’s pension expense, deferred outflows of resources and deferred inflows of resources related to the DRS pension plans, together with the related future year impacts to pension expense from amortization of those deferred amounts. Note that deferred outflows of resources related to University contributions subsequent to the measurement date are recognized as a reduction of the net pension liability in the following year, and are not amortized to pension expense.
PROPORTIONATE SHARE
PLAN PERS 1 PERS 2/3 TRS 1 TRS 2/3 LEOFF 2
YEAR ENDED JUNE 30, 2018 8.44% 10.48% 0.20% 0.19% 0.22%
(continued)

FINANCIAL REPORT 2018 / 41
AMORTIZATION OF DEFERRED INFLOWS AND DEFERRED OUTFLOWS OF RESOURCES (a) (Dollars in thousands)
YEAR PERS 1 PERS 2/3 TRS 1 TRS 2/3 LEOFF 2 TOTAL
2019 $ (10,100) $ (34,293) $ (189) $ 27 $ (335) $ (44,890)
2020 3,189 13,561 71 361 43 17,225
2021 (741) (7,525) (6) 144 (71) (8,199)
2022 (7,291) (38,522) (133) (168) (323) (46,437)
2023 - 3,793 - 84 13 3,890
THEREAFTER - 4,931 - 317 60 5,308
TOTAL $ (14,943) $ (58,055) $ (257) $ 765 $ (613) $ (73,103)
(a) Negative amounts shown in the table above represent a reduction of expense
Amounts reported as deferred outflows of resources, exclusive of contributions made after the measurement date, and deferred inflows of resources will be recognized in pension expense as follows:
PLANS ADMINISTERED BY UNIVERSITY OF WASHINGTON
University of Washington Retirement PlanPLAN DESCRIPTIONUWRP, a single-employer 403(b) defined-contribution plan, is administered by the University. Faculty, librarians and professional staff are eligible to participate in the UWRP.
Contributions to the plan are invested by participants in annuity contracts or mutual fund accounts offered by one or more fund sponsors. Employees have at all times a 100% vested interest in their accumulations. Benefits from the plan are available upon separation or retirement at the member’s option. RCW 28B.10.400 et. seq. assigns the authority to the University of Washington Board of Regents to establish and amend benefit provisions.
The number of participants in the UWRP as of June 30, 2018 was 16,815.
Funding PolicyEmployee contribution rates, based on age, are 5%, 7.5% or 10% of salary. The University matches 100% of employee contributions. Within parameters established by the legislature, contribution requirements may be established or amended by the University of Washington Board of Regents. Employer contributions for the year ended June 30, 2018 were $122,840,000.
University of Washington Supplemental Retirement Plan (UWSRP)PLAN DESCRIPTION UWSRP, a single-employer 401(a) defined-benefit retirement plan administered by the University, operates in tandem with the 403(b) plan to supplement the expected defined-contribution retirement savings accumulated under the UWRP. The UWSRP was closed to new participants effective March 1, 2011. UWSRP membership requires participation in the UWRP.
VESTING AND BENEFITS PROVIDEDUWSRP retirement benefit provisions are contained in RCW 28B.10.400, et. seq. which assigns the authority to establish and amend benefit provisions to the University of Washington Board of Regents. Members are eligible for calculation of a possible retirement benefit under this plan when they have reached age 62 and have 10 years of service with the University. Upon retirement, a calculation is performed which compares “goal income” to “assumed income” to determine if benefits have been earned under the plan.
Goal income is the product of a service factor multiplied by average monthly compensation, and then by eligible years of participation. Average monthly compensation is defined as the average annual basic salary, not to exceed annual limits established by the Internal Revenue Code, paid to a participant for their highest 24 consecutive months of service.
NUMBER OF PARTICIPANTS As of June 30, 2018
ACTIVE EMPLOYEES 7,046
INACTIVE EMPLOYEES RECEIVING BENEFITS 696
INACTIVE EMPLOYEES ENTITLED TO, BUT NOT RECEIVING, BENEFITS 4
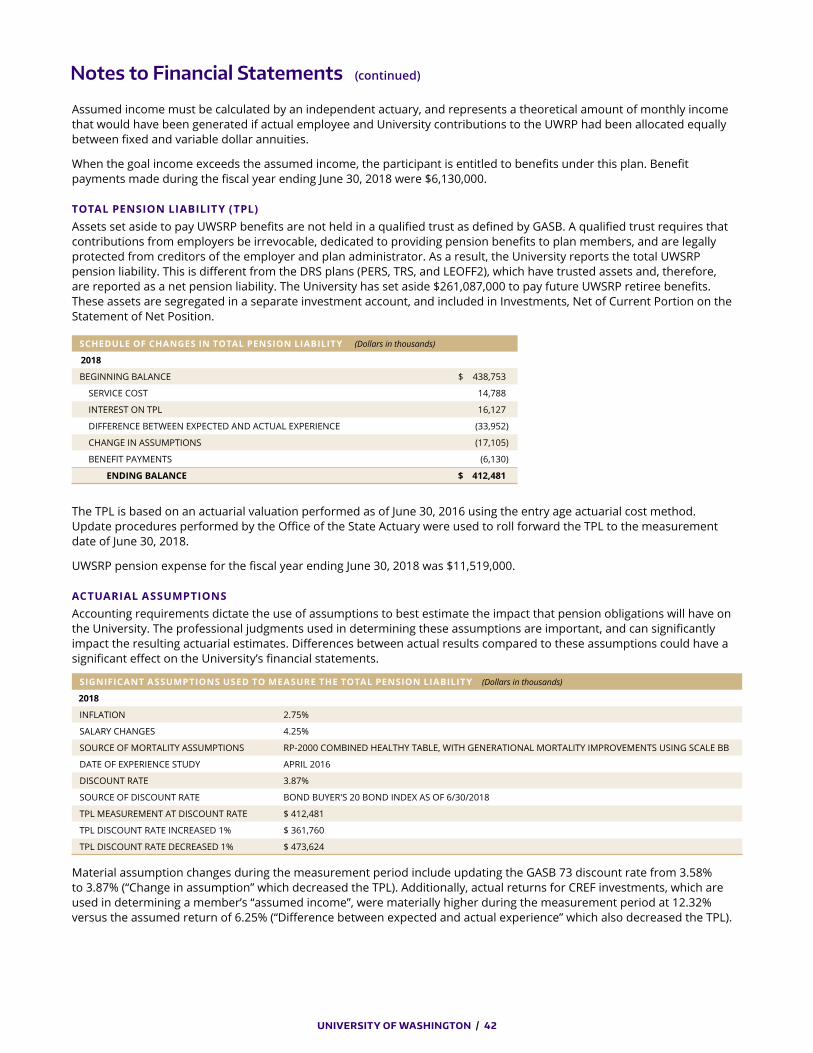
Notes to Financial Statements
UNIVERSITY OF WASHINGTON / 42
SCHEDULE OF CHANGES IN TOTAL PENSION LIABILITY (Dollars in thousands)
2018
BEGINNING BALANCE $ 438,753
SERVICE COST 14,788
INTEREST ON TPL 16,127
DIFFERENCE BETWEEN EXPECTED AND ACTUAL EXPERIENCE (33,952)
CHANGE IN ASSUMPTIONS (17,105)
BENEFIT PAYMENTS (6,130)
ENDING BALANCE $ 412,481
SIGNIFICANT ASSUMPTIONS USED TO MEASURE THE TOTAL PENSION LIABILITY (Dollars in thousands)
2018
INFLATION 2.75%
SALARY CHANGES 4.25%
SOURCE OF MORTALITY ASSUMPTIONS RP-2000 COMBINED HEALTHY TABLE, WITH GENERATIONAL MORTALITY IMPROVEMENTS USING SCALE BB
DATE OF EXPERIENCE STUDY APRIL 2016
DISCOUNT RATE 3.87%
SOURCE OF DISCOUNT RATE BOND BUYER'S 20 BOND INDEX AS OF 6/30/2018
TPL MEASUREMENT AT DISCOUNT RATE $ 412,481
TPL DISCOUNT RATE INCREASED 1% $ 361,760
TPL DISCOUNT RATE DECREASED 1% $ 473,624
Assumed income must be calculated by an independent actuary, and represents a theoretical amount of monthly income that would have been generated if actual employee and University contributions to the UWRP had been allocated equally between fixed and variable dollar annuities.
When the goal income exceeds the assumed income, the participant is entitled to benefits under this plan. Benefit payments made during the fiscal year ending June 30, 2018 were $6,130,000.
TOTAL PENSION LIABILITY (TPL)Assets set aside to pay UWSRP benefits are not held in a qualified trust as defined by GASB. A qualified trust requires that contributions from employers be irrevocable, dedicated to providing pension benefits to plan members, and are legally protected from creditors of the employer and plan administrator. As a result, the University reports the total UWSRP pension liability. This is different from the DRS plans (PERS, TRS, and LEOFF2), which have trusted assets and, therefore, are reported as a net pension liability. The University has set aside $261,087,000 to pay future UWSRP retiree benefits. These assets are segregated in a separate investment account, and included in Investments, Net of Current Portion on the Statement of Net Position.
The TPL is based on an actuarial valuation performed as of June 30, 2016 using the entry age actuarial cost method. Update procedures performed by the Office of the State Actuary were used to roll forward the TPL to the measurement date of June 30, 2018.
UWSRP pension expense for the fiscal year ending June 30, 2018 was $11,519,000.
ACTUARIAL ASSUMPTIONSAccounting requirements dictate the use of assumptions to best estimate the impact that pension obligations will have on the University. The professional judgments used in determining these assumptions are important, and can significantly impact the resulting actuarial estimates. Differences between actual results compared to these assumptions could have a significant effect on the University’s financial statements.
Material assumption changes during the measurement period include updating the GASB 73 discount rate from 3.58% to 3.87% (“Change in assumption” which decreased the TPL). Additionally, actual returns for CREF investments, which are used in determining a member’s “assumed income”, were materially higher during the measurement period at 12.32% versus the assumed return of 6.25% (“Difference between expected and actual experience” which also decreased the TPL).
(continued)

FINANCIAL REPORT 2018 / 43
DEFERRED INFLOWS OF RESOURCESThe tables below summarize the University’s deferred inflows of resources related to the UWSRP, together with the related future year impacts to pension expense from amortization of those deferred amounts:
DEFERRED INFLOWS OF RESOURCES (Dollars in thousands)
2018
DIFFERENCE BETWEEN EXPECTED AND ACTUAL EXPERIENCE $ 85,844
CHANGE IN ASSUMPTIONS 36,354
TOTAL $ 122,198
AMORTIZATION OF DEFERRED INFLOWS OF RESOURCES (a) (Dollars in thousands)
Year
2019 $ (19,397)
2020 (19,397)
2021 (19,397)
2022 (19,397)
2023 (19,397)
THEREAFTER (25,213)
TOTAL $ (122,198)
(a) Negative amounts shown in the table above represent a reduction of expense
NOTE 16:
Other Post Employment Benefits (OPEB)PLAN DESCRIPTIONOPEB are benefits provided to retired employees (and their spouses) beyond those provided by their pension plans. These programs for employees of the state of Washington are administered by the Washington State Health Care Authority (HCA). Per RCW 41.05.065, the Public Employees’ Benefits Board (PEBB), created within the HCA, is authorized to design benefits and determine terms and conditions of employee and retired employee participation and coverage. Benefits provided by this single-employer defined benefit OPEB plan include medical, prescription drug, life, dental, vision, disability, and long-term care insurance. Retirees have access to all of these benefits, however medical, prescription drug and vision insurance comprise the bulk of the monetary assistance, or subsidies, provided by PEBB OPEB.
The OPEB relationship between PEBB employers and their employees and retirees is not formalized in a contract or plan document. Rather, the benefits are provided in accordance with a substantive plan. A substantive plan is one in which the plan terms are understood by the employers and plan members. This understanding is based on communications between the employers and plan members and the historical pattern of practice with regard to the sharing of benefit costs. The understanding by the employer and plan members is that there is no contractual obligation to continue the substantive plan as an employee benefit on an ongoing basis. Nevertheless the actuarial assumptions used in the valuations presented in this footnote assume that this substantive plan will be carried forward into the future.
The HCA has two claim pools: one covering employees and non-Medicare eligible retirees, and the other covering retirees enrolled in Medicare Parts A and B. For retirees, participating employers provide two different subsidies: an implicit subsidy and an explicit subsidy.
The implicit subsidy, set up under RCW 41.05.022, is not a direct payment from the employer on behalf of the retiree. Retirees who are not yet eligible for Medicare benefits may currently continue to participate in the state’s non-Medicare community-rated health insurance risk pool. Claims experience for employees and non-Medicare eligible retirees are pooled when determining premiums. Therefore, these retired members pay a premium based on a pool of members that, on average, are younger and healthier. This results in an implicit subsidy since the premiums paid by retirees are lower than they would have been if the retirees were insured separately.
The explicit subsidy, permitted under RCW 41.05.085, is a straightforward, set dollar amount which lowers the monthly premium paid by members enrolled in Medicare Parts A and B. PEBB determines the amount of the explicit subsidy annually. The dollar amount of the explicit subsidy was set at $150 per member per month for fiscal year 2018.

Notes to Financial Statements
UNIVERSITY OF WASHINGTON / 44
The OPEB plan is currently available to employees who elect to continue coverage and pay the administratively established premiums at the time they retire. PEBB member data used in the valuation of the OPEB liability include members enrolled in a PEBB program as well as other active employees who were eligible to enroll but waived coverage.
The table below shows the University’s PEBB membership data as of June 30, 2018:
2018 (Measurement Date 2017)
ACTIVE EMPLOYEES 32,648
INACTIVE EMPLOYEES RECEIVING BENEFITS 8,626
INACTIVE EMPLOYEES ENTITLED TO, BUT NOT RECEIVING, BENEFITS 1,612
ACTUARIAL ASSUMPTIONS Accounting requirements dictate the use of assumptions to best estimate the impact that OPEB obligations will have on the University. The professional judgments used by the Washington State Office of the State Actuary (OSA) in determining the assumptions used to value the state of Washington OPEB liability are important, and can significantly impact the resulting actuarial estimates. Differences between actual results compared to these assumptions could have a significant effect on the University’s financial statements.
Material assumption changes during the measurement period include updating the discount rate as of each measurement date, as required by GASB 75. The discount rate used for the beginning TOL was 2.85% and the discount rate used for the ending TOL was 3.58%, resulting in a reduction of the TOL.
CHANGES IN THE TOTAL OPEB LIABILITYThe TOL for the state of Washington was determined by an actuarial valuation, conducted by the OSA, using data as of January 1, 2017. The TOL reported at June 30, 2018 was calculated as of the valuation date, and projected to the measurement date of June 30, 2017. OPEB implicit and explicit subsidies are funded by required contributions made by participating employers, such as the University. These contributions are made on behalf of all active, healthcare-eligible employees regardless of enrollment status. As such, the allocation method used to determine the University’s proportionate share of the statewide TOL is the relationship of University active, healthcare-eligible employee headcount to the corresponding statewide total.
The University’s proportionate share percentage was 26.9% and 27.0% as of June 30, 2018 and 2017, respectively.
SIGNIFICANT ASSUMPTIONS USED TO MEASURE THE TOTAL OPEB LIABILITY (TOL) (Dollars in thousands)
2018
INFLATION 3.00%
HEALTHCARE COST TREND RATE TREND RATE ASSUMPTIONS VARY SLIGHTLY BY MEDICAL PLAN. INITIAL RATE IS 7.00%, REACHING AN ULTIMATE RATE OF APPROXIMATELY 5.00% IN 2080.
SALARY INCREASE 3.75%, INCLUDING SERVICE-BASED SALARY INCREASES
SOURCE OF MORTALITY ASSUMPTIONS RP-2000 COMBINED HEALTHY TABLE AND COMBINED DISABLED TABLE, WITH FUTURE IMPROVEMENTS IN MORTALITY PROJECTED USING 100 PERCENT SCALE BB AND UPDATED BASED ON RESULTS OF THE 2007-2012 EXPERIENCE STUDY REPORT
DATE OF EXPERIENCE STUDY 2007-2012 EXPERIENCE STUDY REPORT
DISCOUNT RATE 3.58%
SOURCE OF DISCOUNT RATE BOND BUYER GENERAL OBLIGATION 20-BOND MUNICIPAL BOND INDEX AS OF 6/30/17 (MEASUREMENT DATE)
POST-RETIREMENT PARTICIPATION PERCENTAGE 65.00%
TOL MEASUREMENT AT DISCOUNT RATE $ 1,565,213
TOL DISCOUNT RATE INCREASED 1% $ 1,298,594
TOL DISCOUNT RATE DECREASED 1% $ 1,909,753
TOL MEASUREMENT AT HEALTHCARE COST TREND RATE $ 1,565,213
TOL HEALTHCARE COST TREND RATE INCREASED 1% $ 1,968,827
TOL HEALTHCARE COST TREND RATE DECREASED 1% $ 1,264,476
(continued)

FINANCIAL REPORT 2018 / 45
SCHEDULE OF CHANGES IN TOTAL OPEB LIABILITY (Dollars in thousands)
2018
BEGINNING BALANCE $ 1,685,909
SERVICE COST 106,112
INTEREST ON TOL 49,703
CHANGE IN ASSUMPTIONS (242,454)
BENEFIT PAYMENTS (25,330)
CHANGES IN PROPORTIONATE SHARE (8,727)
ENDING BALANCE $ 1,565,213
The OPEB plan is funded on a pay-as-you-go basis. Accordingly, contributions from employers to the HCA occur only when benefits become due (after retirement). No qualified trust fund has been established dedicated to these benefits and there are no associated assets. As a result, the University reports a proportionate share of the state’s total OPEB liability.
PROPORTIONATE SHARE OF OPEB EXPENSE (Dollars in Thousands)
YEAR ENDED JUNE 30, 2018 $ 127,921
DEFERRED OUTFLOWS OF RESOURCES (Dollars in Thousands)
2018
UNIVERSITY CONTRIBUTIONS SUBSEQUENT TO THE MEASUREMENT DATE OF THE COLLECTIVE TOTAL OPEB LIABILITY (a) $ 24,771
(a) Recognized as a reduction of the total OPEB Liability as of June 30, 2019
DEFERRED INFLOWS OF RESOURCES (Dollars in Thousands)
2018
CHANGE IN ASSUMPTIONS $ 215,515
CHANGES IN PROPORTION 7,641
TOTAL $ 223,156
AMORTIZATION OF DEFERRED INFLOWS OF RESOURCES (a) (Dollars in Thousands)
YEAR
2019 $ (27,894)
2020 (27,894)
2021 (27,894)
2022 (27,894)
2023 (27,894)
THEREAFTER (83,686)
TOTAL $ (223,156)
(a) Negative amounts shown in the table above represent a reduction of expense
OPEB EXPENSE, DEFERRED OUTFLOWS OF RESOURCES AND DEFERRED INFLOWS OF RESOURCESThe tables below summarize the University’s OPEB expense, deferred outflows of resources and deferred inflows of resources related to the OPEB plan, together with the related future year impacts to OPEB expense from amortization of those deferred amounts. Note that deferred outflows of resources related to University contributions subsequent to the measurement date are recognized as a reduction of the total OPEB liability in the following year, and are not amortized to OPEB expense.
Amounts reported as deferred inflows of resources will be recognized as a component of the University’s OPEB expense as follows:

Notes to Financial Statements
UNIVERSITY OF WASHINGTON / 46
NOTE 17:
Commitments and ContingenciesAuthorized expenditures for construction projects unexpended as of June 30, 2018 were $105,944,000. These expenditures will be funded from institutional reserves, debt proceeds and state appropriations.
The University receives and expends substantial amounts under federal and state grants, contracts and programs. This funding is used for research, student aid, Medical Center operations and other programs, and is subject to audit by governmental granting agencies. Certain grant and contract costs billed to the federal government are subject to audit under 2 CFR 200, “Uniform Administrative Requirements, Cost Principles, and Audit Requirements for Federal Awards.”
The University is also involved in various other claims and legal actions arising in the ordinary course of business. University management believes that any liabilities arising from these matters will not have a material effect on the University’s financial statements.
The University is exposed to risk of loss related to tort liability, injuries to employees and loss of property. The University purchases insurance protection for workers’ compensation as well as marine, aviation and certain other risks. The University also purchases insurance protection for loss of property at self-sustaining units, bond-financed buildings and where otherwise required by contract; otherwise, the risk of property loss is retained, unfunded. For medical professional, general, employment practices, automobile liability, and information security and privacy protection, the University maintains a program of self-insurance reserves and excess insurance coverage. The self-insurance reserve represents the estimated ultimate cost of settling claims resulting from events that have occurred on or before the Statements of Net Position date. The reserve includes the undiscounted amounts that will be required for future payments of claims that have been reported, and claims related to events that have occurred but have not yet been reported.
The self-insurance reserve is estimated through an actuarial calculation and included in Long-Term Liabilities. Changes in the self-insurance reserve for the year ended June 30, 2018 are noted below:
(Dollars in thousands) 2018
RESERVE AT BEGINNING OF FISCAL YEAR $ 78,484
INCURRED CLAIMS AND CHANGES IN ESTIMATES 42,033
CLAIM PAYMENTS (8,307)
RESERVE AT END OF FISCAL YEAR $ 112,210
REGULATORY COMPLIANCEThe healthcare industry is subject to numerous laws and regulations of federal, state, and local governments. These laws and regulations include, but are not limited to, matters such as licensure, accreditation, governmental healthcare program participation requirements, reimbursement for patient services, and Medicare and Medicaid fraud and abuse. Government agencies are actively conducting investigations concerning possible violations of fraud and abuse statutes and regulations by healthcare providers. Violations of these laws and regulations could result in expulsion from government healthcare programs, together with the imposition of significant fines and penalties, as well as significant repayments for patient services previously billed. Through its compliance program, UW Medicine maintains an effective and safe program for reporting and addressing potential regulatory concerns. Compliance with such laws and regulations can be subject to future government review and interpretation as well as regulatory actions known or unasserted at this time.
Between April 4 and April 12, 2018, the Washington State Department of Health on behalf of the Centers for Medicare and Medicaid Services (CMS) conducted a survey at UW Medical Center. In a letter dated May 15, 2018, CMS informed UW Medical Center that based on the results of the survey, UW Medical Center was not in compliance with certain Medicare Conditions of Participation. The deficiencies identified within the survey relate primarily to UW Medical Center’s relationship with the Seattle Cancer Care Alliance inpatient hospital located within the same building as UW Medical Center, including related policies, clinical areas, support services and personnel sharing between the two organizations. CMS has informed UW Medical Center that unless such deficiencies are remedied by November 15, 2018, UW Medical Center’s Medicare provider agreement could be terminated. CMS has discretion to extend that termination date. UW Medical Center is cooperating with CMS and has submitted a Plan of Correction (the Plan) in response to the CMS survey and is taking steps to comply with the components of the Plan. CMS is currently reviewing the proposed Plan. When CMS approves a Plan, UW Medicine management will take necessary actions to comply with that Plan so UW Medical Center continues to participate in the Medicare program.
(continued)

FINANCIAL REPORT 2018 / 47
(Dollars in thousands)Statements of Net Position – June 30, 2018
Combined Entities Eliminations
University of Washington
Total Blended Component
Units Medical Entities
Real Estate Entities
ASSETS TOTAL CURRENT ASSETS $ 1,486,002 $ (24,968) $ 1,315,967 $ 195,003 $ 161,358 $ 33,645NONCURRENT ASSETS: TOTAL OTHER ASSETS 5,586,225 (133,929) 5,537,440 182,714 157,842 24,872 CAPITAL ASSETS, NET 4,979,731 – 4,503,524 476,207 115,728 360,479 TOTAL ASSETS 12,051,958 (158,897) 11,356,931 853,924 434,928 418,996DEFERRED OUTFLOWS OF RESOURCES 244,041 – 237,148 6,893 6,893 – TOTAL ASSETS AND DEFERRED OUTFLOWS OF RESOURCES $ 12,295,999 $ (158,897) $ 11,594,079 $ 860,817 $ 441,821 $ 418,996
LIABILITIESTOTAL CURRENT LIABILITIES $ 1,266,712 $ (8,099) $ 1,139,878 $ 134,933 $ 97,011 $ 37,922TOTAL NONCURRENT LIABILITIES 5,416,187 (146,270) 5,040,769 521,688 145,217 376,471 TOTAL LIABILITIES 6,682,899 (154,369) 6,180,647 656,621 242,228 414,393DEFERRED INFLOWS OF RESOURCES 516,323 – 516,323 – – – TOTAL LIABILITIES AND DEFERRED INFLOWS OF RESOURCES 7,199,222 (154,369) 6,696,970 656,621 242,228 414,393
NET POSITIONNET INVESTMENT IN CAPITAL ASSETS 2,483,814 – 2,362,957 120,857 106,672 14,185RESTRICTED: NONEXPENDABLE 1,721,927 – 1,719,547 2,380 2,380 – EXPENDABLE 2,128,692 – 2,128,081 611 611 –UNRESTRICTED (1,237,656) (4,528) (1,313,476) 80,348 89,930 (9,582) TOTAL NET POSITION 5,096,777 (4,528) 4,897,109 204,196 199,593 4,603 TOTAL LIABILITIES, DEFERRED INFLOWS OF RESOURCES AND NET POSITION $ 12,295,999 $ (158,897) $ 11,594,079 $ 860,817 $ 441,821 $ 418,996
NOTE 18:
Blended Component UnitsCondensed combining statements for the University and its blended component units are shown below:
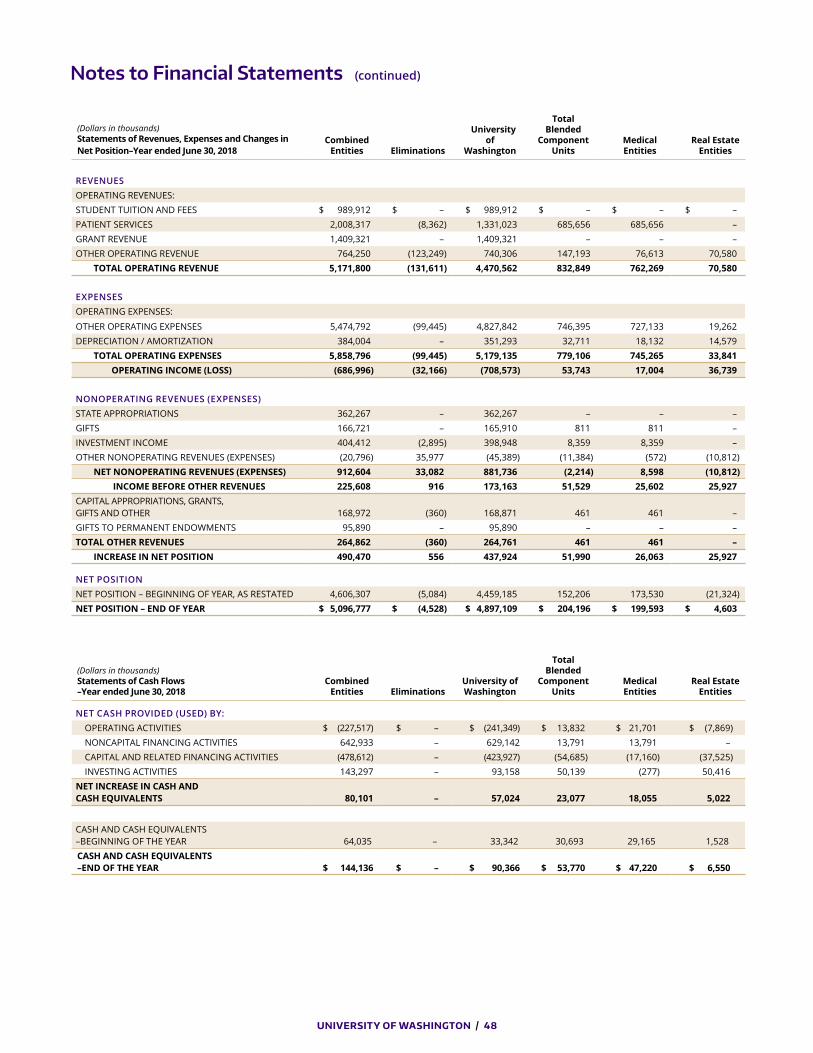
Notes to Financial Statements
UNIVERSITY OF WASHINGTON / 48
(Dollars in thousands)Statements of Revenues, Expenses and Changes in Net Position–Year ended June 30, 2018
Combined Entities Eliminations
University of
Washington
Total Blended
Component Units
Medical Entities
Real Estate Entities
REVENUES OPERATING REVENUES:STUDENT TUITION AND FEES $ 989,912 $ – $ 989,912 $ – $ – $ –PATIENT SERVICES 2,008,317 (8,362) 1,331,023 685,656 685,656 –GRANT REVENUE 1,409,321 – 1,409,321 – – –OTHER OPERATING REVENUE 764,250 (123,249) 740,306 147,193 76,613 70,580 TOTAL OPERATING REVENUE 5,171,800 (131,611) 4,470,562 832,849 762,269 70,580
EXPENSESOPERATING EXPENSES:
OTHER OPERATING EXPENSES 5,474,792 (99,445) 4,827,842 746,395 727,133 19,262DEPRECIATION / AMORTIZATION 384,004 – 351,293 32,711 18,132 14,579 TOTAL OPERATING EXPENSES 5,858,796 (99,445) 5,179,135 779,106 745,265 33,841 OPERATING INCOME (LOSS) (686,996) (32,166) (708,573) 53,743 17,004 36,739
NONOPERATING REVENUES (EXPENSES)STATE APPROPRIATIONS 362,267 – 362,267 – – –GIFTS 166,721 – 165,910 811 811 –INVESTMENT INCOME 404,412 (2,895) 398,948 8,359 8,359 –OTHER NONOPERATING REVENUES (EXPENSES) (20,796) 35,977 (45,389) (11,384) (572) (10,812) NET NONOPERATING REVENUES (EXPENSES) 912,604 33,082 881,736 (2,214) 8,598 (10,812) INCOME BEFORE OTHER REVENUES 225,608 916 173,163 51,529 25,602 25,927CAPITAL APPROPRIATIONS, GRANTS, GIFTS AND OTHER 168,972 (360) 168,871 461 461 –GIFTS TO PERMANENT ENDOWMENTS 95,890 – 95,890 – – –TOTAL OTHER REVENUES 264,862 (360) 264,761 461 461 – INCREASE IN NET POSITION 490,470 556 437,924 51,990 26,063 25,927
NET POSITIONNET POSITION – BEGINNING OF YEAR, AS RESTATED 4,606,307 (5,084) 4,459,185 152,206 173,530 (21,324)NET POSITION – END OF YEAR $ 5,096,777 $ (4,528) $ 4,897,109 $ 204,196 $ 199,593 $ 4,603
(Dollars in thousands)Statements of Cash Flows–Year ended June 30, 2018
Combined Entities Eliminations
University of Washington
Total Blended
Component Units
Medical Entities
Real Estate Entities
NET CASH PROVIDED (USED) BY: OPERATING ACTIVITIES $ (227,517) $ – $ (241,349) $ 13,832 $ 21,701 $ (7,869) NONCAPITAL FINANCING ACTIVITIES 642,933 – 629,142 13,791 13,791 – CAPITAL AND RELATED FINANCING ACTIVITIES (478,612) – (423,927) (54,685) (17,160) (37,525) INVESTING ACTIVITIES 143,297 – 93,158 50,139 (277) 50,416NET INCREASE IN CASH AND CASH EQUIVALENTS 80,101 – 57,024 23,077 18,055 5,022
CASH AND CASH EQUIVALENTS –BEGINNING OF THE YEAR 64,035 – 33,342 30,693 29,165 1,528CASH AND CASH EQUIVALENTS –END OF THE YEAR $ 144,136 $ – $ 90,366 $ 53,770 $ 47,220 $ 6,550
(continued)

FINANCIAL REPORT 2018 / 49
PERS 1 – SCHEDULE OF CONTRIBUTIONS(Dollars in thousands) 2018 2017 2016 2015
CONTRACTUALLY REQUIRED CONTRIBUTION $ 1,582 $ 1,788 $ 2,155 $ 2,058CONTRIBUTIONS IN RELATION TO THE CONTRACTUALLY REQUIRED CONTRIBUTION $ 1,578 $ 1,769 $ 2,155 $ 2,059CONTRIBUTION DEFICIENCY (EXCESS) $ 4 $ 19 $ – $ (1)UNIVERSITY’S COVERED-EMPLOYEE PAYROLL $ 1,074,943 $ 1,043,335 $ 987,405 $ 927,002CONTRIBUTIONS AS A PERCENTAGE OF COVERED-EMPLOYEE PAYROLL 0.15% 0.17% 0.22% 0.22%
(Amounts determined as of the fiscal year end)
PERS 1 – SCHEDULE OF PROPORTIONATE SHARE OF THE NET PENSION LIABILITY(Dollars in thousands) 2018 2017 2016 2015
UNIVERSITY’S PROPORTION OF THE NET PENSION LIABILITY 8.44% 8.46% 8.33% 8.28%UNIVERSITY’S PROPORTIONATE SHARE OF THE NET PENSION LIABILITY $ 400,426 $ 454,341 $ 435,853 $ 417,231UNIVERSITY’S COVERED-EMPLOYEE PAYROLL $ 1,043,335 $ 987,405 $ 927,002 $ 882,215UNIVERSITY’S PROPORTIONATE SHARE OF THE NET PENSION LIABILITY AS A PERCENTAGE OF COVERED-EMPLOYEE PAYROLL 38.38% 46.01% 47.02% 47.29%
PLAN FIDUCIARY NET POSITION AS A PERCENTAGE OF THE TOTAL PENSION LIABILITY 61.24% 57.03% 59.10% 61.19%(Amounts determined as of the measurement date)
PERS 2/3 – SCHEDULE OF CONTRIBUTIONS(Dollars in thousands) 2018 2017 2016 2015
CONTRACTUALLY REQUIRED CONTRIBUTION $ 134,239 $ 114,852 $ 107,424 $ 83,323CONTRIBUTIONS IN RELATION TO THE CONTRACTUALLY REQUIRED CONTRIBUTION $ 134,366 $ 114,968 $ 108,413 $ 83,342CONTRIBUTION DEFICIENCY (EXCESS) $ (127) $ (116) $ (989) $ (19)UNIVERSITY’S COVERED-EMPLOYEE PAYROLL $ 1,062,415 $ 1,027,338 $ 967,955 $ 904,661CONTRIBUTIONS AS A PERCENTAGE OF COVERED-EMPLOYEE PAYROLL 12.64% 11.18% 11.10% 9.21%
(Amounts determined as of the fiscal year end)
PERS 2/3 – SCHEDULE OF PROPORTIONATE SHARE OF THE NET PENSION LIABILITY(Dollars in thousands) 2018 2017 2016 2015
UNIVERSITY’S PROPORTION OF THE NET PENSION LIABILITY 10.48% 10.36% 10.20% 10.00%UNIVERSITY’S PROPORTIONATE SHARE OF THE NET PENSION LIABILITY $ 364,073 $ 521,777 $ 364,303 $ 202,225UNIVERSITY’S COVERED-EMPLOYEE PAYROLL $ 1,027,338 $ 967,955 $ 904,661 $ 856,839UNIVERSITY’S PROPORTIONATE SHARE OF THE NET PENSION LIABILITY AS A PERCENTAGE OF COVERED-EMPLOYEE PAYROLL 35.44% 53.91% 40.27% 23.60%PLAN FIDUCIARY NET POSITION AS A PERCENTAGE OF THE TOTAL PENSION LIABILITY 90.97% 85.82% 89.20% 93.29%
(Amounts determined as of the measurement date)
Schedules of Required Supplementary Information
TRS 1 – SCHEDULE OF CONTRIBUTIONS(Dollars in thousands) 2018 2017 2016 2015
CONTRACTUALLY REQUIRED CONTRIBUTION $ 48 $ 39 $ 38 $ 44CONTRIBUTIONS IN RELATION TO THE CONTRACTUALLY REQUIRED CONTRIBUTION $ 48 $ 40 $ 38 $ 42CONTRIBUTION DEFICIENCY (EXCESS) $ – $ (1) $ – $ 2UNIVERSITY’S COVERED-EMPLOYEE PAYROLL $ 13,986 $ 10,967 $ 7,813 $ 5,790CONTRIBUTIONS AS A PERCENTAGE OF COVERED-EMPLOYEE PAYROLL 0.34% 0.36% 0.49% 0.76%
(Amounts determined as of the fiscal year end)
TRS 1 – SCHEDULE OF PROPORTIONATE SHARE OF THE NET PENSION LIABILITY(Dollars in thousands) 2018 2017 2016 2015
UNIVERSITY’S PROPORTION OF THE NET PENSION LIABILITY 0.20% 0.16% 0.13% 0.10%UNIVERSITY’S PROPORTIONATE SHARE OF THE NET PENSION LIABILITY $ 6,076 $ 5,463 $ 4,049 $ 2,881UNIVERSITY’S COVERED-EMPLOYEE PAYROLL $ 10,967 $ 7,813 $ 5,790 $ 3,905UNIVERSITY’S PROPORTIONATE SHARE OF THE NET PENSION LIABILITY AS A PERCENTAGE OF COVERED-EMPLOYEE PAYROLL 55.40% 69.92% 69.93% 73.78%PLAN FIDUCIARY NET POSITION AS A PERCENTAGE OF THE TOTAL PENSION LIABILITY 65.58% 62.07% 65.70% 68.77%
(Amounts determined as of the measurement date)
Unaudited – see accompanying notes to financial statements

UNIVERSITY OF WASHINGTON / 50
TRS 2/3 – SCHEDULE OF CONTRIBUTIONS(Dollars in thousands) 2018 2017 2016 2015
CONTRACTUALLY REQUIRED CONTRIBUTION $ 2,036 $ 1,401 $ 956 $ 558CONTRIBUTIONS IN RELATION TO THE CONTRACTUALLY REQUIRED CONTRIBUTION $ 2,029 $ 1,410 $ 985 $ 555CONTRIBUTION DEFICIENCY (EXCESS) $ 7 $ (9) $ (29) $ 3UNIVERSITY’S COVERED-EMPLOYEE PAYROLL $ 13,664 $ 10,669 $ 7,507 $ 5,367CONTRIBUTIONS AS A PERCENTAGE OF COVERED-EMPLOYEE PAYROLL 14.90% 13.13% 12.73% 10.40%
(Amounts determined as of the fiscal year end)
TRS 2/3 – SCHEDULE OF PROPORTIONATE SHARE OF THE NET PENSION LIABILITY(Dollars in thousands) 2018 2017 2016 2015
UNIVERSITY’S PROPORTION OF THE NET PENSION LIABILITY 0.19% 0.15% 0.12% 0.08%UNIVERSITY’S PROPORTIONATE SHARE OF THE NET PENSION LIABILITY $ 1,796 $ 2,077 $ 969 $ 252 UNIVERSITY’S COVERED-EMPLOYEE PAYROLL $ 10,669 $ 7,507 $ 5,367 $ 3,391 UNIVERSITY’S PROPORTIONATE SHARE OF THE NET PENSION LIABILITY AS A PERCENTAGE OF COVERED-EMPLOYEE PAYROLL 16.83% 27.67% 18.05% 7.43%PLAN FIDUCIARY NET POSITION AS A PERCENTAGE OF THE TOTAL PENSION LIABILITY 93.14% 88.72% 92.48% 96.81%
(Amounts determined as of the measurement date)
LEOFF 2 – SCHEDULE OF CONTRIBUTIONS(Dollars in thousands) 2018 2017 2016 2015
CONTRACTUALLY REQUIRED CONTRIBUTION $ 400 $ 348 $ 384 $ 303CONTRIBUTIONS IN RELATION TO THE CONTRACTUALLY REQUIRED CONTRIBUTION $ 403 $ 352 $ 384 $ 300CONTRIBUTION DEFICIENCY (EXCESS) $ (3) $ (4) $ – $ 3UNIVERSITY’S COVERED-EMPLOYEE PAYROLL $ 4,487 $ 4,061 $ 4,474 $ 3,534CONTRIBUTIONS AS A PERCENTAGE OF COVERED-EMPLOYEE PAYROLL 8.91% 8.57% 8.58% 8.57%
(Amounts determined as of the fiscal year end)
LEOFF 2 – SCHEDULE OF PROPORTIONATE SHARE OF THE NET PENSION LIABILITY(Dollars in thousands) 2018 2017 2016 2015
UNIVERSITY’S PROPORTION OF THE NET PENSION LIABILITY (ASSET) 0.22% 0.25% 0.20% 0.21%UNIVERSITY’S PROPORTIONATE SHARE OF THE NET PENSION LIABILITY (ASSET) $ (2,995) $ (1,430) $ (2,083) $ (2,844)UNIVERSITY’S COVERED-EMPLOYEE PAYROLL $ 4,061 $ 4,474 $ 3,534 $ 3,581UNIVERSITY’S PROPORTIONATE SHARE OF THE NET PENSION LIABILITY (ASSET) AS A PERCENTAGE OF ITS COVERED-EMPLOYEE PAYROLL -73.74% -31.97% -58.94% -79.42%PLAN FIDUCIARY NET POSITION AS A PERCENTAGE OF THE TOTAL PENSION LIABILITY 113.36% 106.04% 111.67% 116.75%
(Amounts determined as of the measurement date)
UNIVERSITY OF WASHINGTON SUPPLEMENTAL RETIREMENT PLAN (UWSRP) SCHEDULE OF CHANGES IN THE TOTAL PENSION LIABILITY (TPL)
(Dollars in thousands) 2018 2017
TOTAL PENSION LIABILITY – BEGINNING $ 438,753 $ 512,372
SERVICE COST 14,788 19,892
INTEREST ON TPL 16,127 15,097
DIFFERENCES BETWEEN EXPECTED AND ACTUAL EXPERIENCE (33,952) (74,919)
CHANGES IN ASSUMPTIONS (17,105) (28,553)
BENEFIT PAYMENTS (6,130) (5,136)
TOTAL PENSION LIABILITY - ENDING $ 412,481 $ 438,753
UWSRP COVERED-EMPLOYEE PAYROLL $ 759,688 $ 801,161
TOTAL PENSION LIABILITY AS PERCENTAGE OF COVERED-EMPLOYEE PAYROLL 54.30% 54.76%
Schedules of Required Supplementary Information (continued)
Unaudited – see accompanying notes to financial statements
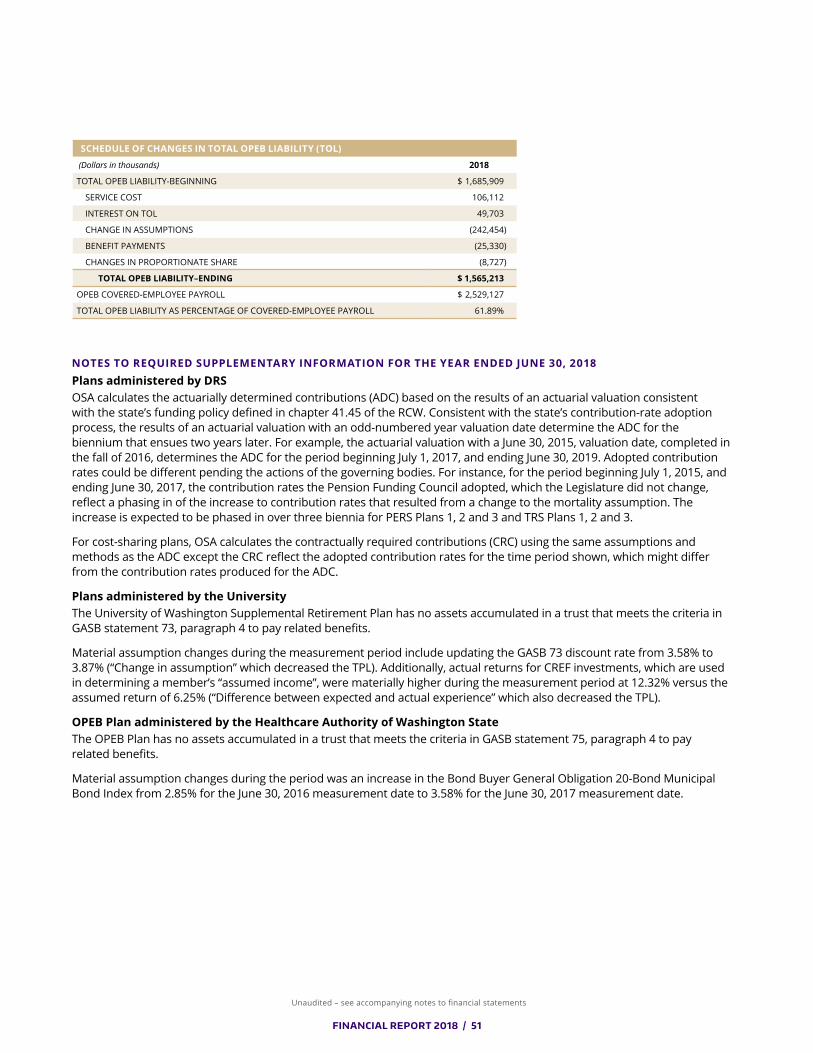
FINANCIAL REPORT 2018 / 51
NOTES TO REQUIRED SUPPLEMENTARY INFORMATION FOR THE YEAR ENDED JUNE 30, 2018Plans administered by DRSOSA calculates the actuarially determined contributions (ADC) based on the results of an actuarial valuation consistent with the state’s funding policy defined in chapter 41.45 of the RCW. Consistent with the state’s contribution-rate adoption process, the results of an actuarial valuation with an odd-numbered year valuation date determine the ADC for the biennium that ensues two years later. For example, the actuarial valuation with a June 30, 2015, valuation date, completed in the fall of 2016, determines the ADC for the period beginning July 1, 2017, and ending June 30, 2019. Adopted contribution rates could be different pending the actions of the governing bodies. For instance, for the period beginning July 1, 2015, and ending June 30, 2017, the contribution rates the Pension Funding Council adopted, which the Legislature did not change, reflect a phasing in of the increase to contribution rates that resulted from a change to the mortality assumption. The increase is expected to be phased in over three biennia for PERS Plans 1, 2 and 3 and TRS Plans 1, 2 and 3.
For cost-sharing plans, OSA calculates the contractually required contributions (CRC) using the same assumptions and methods as the ADC except the CRC reflect the adopted contribution rates for the time period shown, which might differ from the contribution rates produced for the ADC.
Plans administered by the UniversityThe University of Washington Supplemental Retirement Plan has no assets accumulated in a trust that meets the criteria in GASB statement 73, paragraph 4 to pay related benefits.
Material assumption changes during the measurement period include updating the GASB 73 discount rate from 3.58% to 3.87% (“Change in assumption” which decreased the TPL). Additionally, actual returns for CREF investments, which are used in determining a member’s “assumed income”, were materially higher during the measurement period at 12.32% versus the assumed return of 6.25% (“Difference between expected and actual experience” which also decreased the TPL).
OPEB Plan administered by the Healthcare Authority of Washington StateThe OPEB Plan has no assets accumulated in a trust that meets the criteria in GASB statement 75, paragraph 4 to pay related benefits.
Material assumption changes during the period was an increase in the Bond Buyer General Obligation 20-Bond Municipal Bond Index from 2.85% for the June 30, 2016 measurement date to 3.58% for the June 30, 2017 measurement date.
SCHEDULE OF CHANGES IN TOTAL OPEB LIABILITY (TOL)
(Dollars in thousands) 2018
TOTAL OPEB LIABILITY-BEGINNING $ 1,685,909
SERVICE COST 106,112
INTEREST ON TOL 49,703
CHANGE IN ASSUMPTIONS (242,454)
BENEFIT PAYMENTS (25,330)
CHANGES IN PROPORTIONATE SHARE (8,727)
TOTAL OPEB LIABILITY–ENDING $ 1,565,213
OPEB COVERED-EMPLOYEE PAYROLL $ 2,529,127
TOTAL OPEB LIABILITY AS PERCENTAGE OF COVERED-EMPLOYEE PAYROLL 61.89%
Unaudited – see accompanying notes to financial statements


This publication was prepared by Finance and Administration. Published November 2018.
The 2018 UW Financial Report and reports from previous years are available at annualreport.uw.edu.
For more information, contact Financial Accounting at 206.221.7845 or [email protected]
P H O T O G R A P H Y: UW Photo
D E S I G N , P R O D U C T I O N , A N D P R I N T C O O R D I N A T I O N: UW Creative Communications
V I S I T O U R W E B S I T E : uw.edu
© 2018 University of Washington
Printed on recycled paper containing 30% post-consumer fiber
B O A R D O F R E G E N T S *
Constance W. Rice, Chair
Joel Benoliel, Vice Chair
William S. Ayer
Joanne R. Harrell
Jeremy Jaech
Rogelio Riojas
Blaine Tamaki
David Zeeck
Kaitlyn Zhou
* As of October 19, 2018
A D M I N I S T R A T I V E O F F I C E R S *
Ana Mari Cauce President
Mark Richards Provost and Executive Vice President
Jeffrey Scott Executive Vice President Finance and Administration
Lou Cariello Vice President for Facilities
Rickey Hall Vice President for Minority Affairs and Diversity
Randy Hodgins Vice President for External Affairs
Vikram Jandhyala Vice President for Innovation Strategy
Mindy Kornberg Vice President for Human Resources
Connie Kravas Vice President for University Advancement
Brian McCartan Vice President for Finance
Aaron Powell Vice President for UW Information Technology
Paul G. Ramsey CEO, UW Medicine, Executive Vice President for Medical Affairs and Dean of the School of Medicine
Denzil Suite Vice President for Student Life