Embed Size (px)
Citation preview

ECONOMIC PROFILE2018
#TULSACHAMBERPRESENTED BY

B U S I N E S S & I N D U S T R Y S E R V I C E S
IMPROVING THE WAY YOU DO BUSINESS IS OUR BUSINESS
» Full-time Careers » Part-time Classes » Corporate Training(918) 828-5000
Broken Arrow Campus4000 W. Florence St.
Lemley Memorial Campus3420 S. Memorial Dr. » Health Sciences Center » S.T.E.M. Academy
Owasso Campus10800 N. 140 E. Ave.
Sand Springs Campus924 E. Charles Page Blvd.
Riverside Campus801 E. 91st St.
Peoria Campus3850 N. Peoria Ave.
Customized training to meet your needs. Enhancing your training and professional development is
more affordable than you might think. We meet with your team and offer our services in our facility or yours,
in less time and less money. Strengthen your workforce and gain a competitive edge today!

The 2018 Economic Profile is a publication of:Tulsa Regional Chamber, Economic DevelopmentWilliams Center Tower IOne West Third Street, Suite 100Tulsa, OK 74103Ph: 918.585.1201 · 800.624.6822 Fx: 918.585.8386GrowMetroTulsa.com
TABLE OF CONTENTS· 2017 Economic Summary ......................................................................................... 1
· Gross Product ............................................................................................................. 2
· Wage and Salary Employment ................................................................................. 3
· Industry Mix Employment ......................................................................................... 4
· Unemployment .......................................................................................................... 5
· Labor Force ................................................................................................................. 6
· Population ................................................................................................................... 7
· Per Capita Income ...................................................................................................... 8
· Average Weekly Earnings in Manufacturing .......................................................... 9
· Retail Sales ................................................................................................................10
· Residential Real Estate ............................................................................................11
· Non-Residential Real Estate ....................................................................................12
· Total Bankruptcies....................................................................................................13
· Business Bankruptcies .............................................................................................13
· Banking .....................................................................................................................14
· Travel Industry ..........................................................................................................15
· Port of Catoosa .........................................................................................................16
· Estimate of Annual Median Base Salaries .............................................................17
2018

D | 2018 ECONOMIC PROFILE
Photography & Video Since 19901442 E. 3rd Street
Tulsa OK, 74120918-587-2505
millerPHOTOGRAPHYinc.com
TULSA REGIONAL CHAMBER | 1
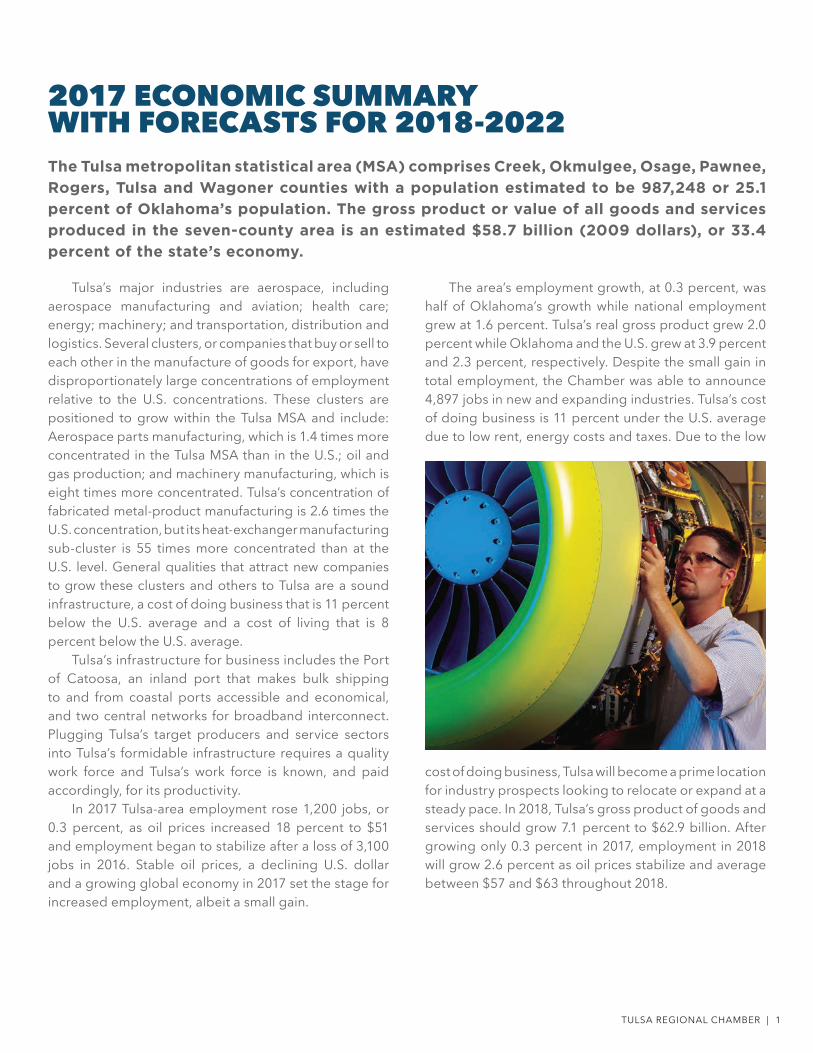
2017 ECONOMIC SUMMARY WITH FORECASTS FOR 2018-2022The Tulsa metropolitan statistical area (MSA) comprises Creek, Okmulgee, Osage, Pawnee,
Rogers, Tulsa and Wagoner counties with a population estimated to be 987,248 or 25.1
percent of Oklahoma’s population. The gross product or value of all goods and services
produced in the seven-county area is an estimated $58.7 billion (2009 dollars), or 33.4
percent of the state’s economy.
Tulsa’s major industries are aerospace, including aerospace manufacturing and aviation; health care; energy; machinery; and transportation, distribution and logistics. Several clusters, or companies that buy or sell to each other in the manufacture of goods for export, have disproportionately large concentrations of employment relative to the U.S. concentrations. These clusters are positioned to grow within the Tulsa MSA and include: Aerospace parts manufacturing, which is 1.4 times more concentrated in the Tulsa MSA than in the U.S.; oil and gas production; and machinery manufacturing, which is eight times more concentrated. Tulsa’s concentration of fabricated metal-product manufacturing is 2.6 times the U.S. concentration, but its heat-exchanger manufacturing sub-cluster is 55 times more concentrated than at the U.S. level. General qualities that attract new companies to grow these clusters and others to Tulsa are a sound infrastructure, a cost of doing business that is 11 percent below the U.S. average and a cost of living that is 8 percent below the U.S. average.
Tulsa’s infrastructure for business includes the Port of Catoosa, an inland port that makes bulk shipping to and from coastal ports accessible and economical, and two central networks for broadband interconnect. Plugging Tulsa’s target producers and service sectors into Tulsa’s formidable infrastructure requires a quality work force and Tulsa’s work force is known, and paid accordingly, for its productivity.
In 2017 Tulsa-area employment rose 1,200 jobs, or 0.3 percent, as oil prices increased 18 percent to $51 and employment began to stabilize after a loss of 3,100 jobs in 2016. Stable oil prices, a declining U.S. dollar and a growing global economy in 2017 set the stage for increased employment, albeit a small gain.
The area’s employment growth, at 0.3 percent, was half of Oklahoma’s growth while national employment grew at 1.6 percent. Tulsa’s real gross product grew 2.0 percent while Oklahoma and the U.S. grew at 3.9 percent and 2.3 percent, respectively. Despite the small gain in total employment, the Chamber was able to announce 4,897 jobs in new and expanding industries. Tulsa’s cost of doing business is 11 percent under the U.S. average due to low rent, energy costs and taxes. Due to the low
cost of doing business, Tulsa will become a prime location for industry prospects looking to relocate or expand at a steady pace. In 2018, Tulsa’s gross product of goods and services should grow 7.1 percent to $62.9 billion. After growing only 0.3 percent in 2017, employment in 2018 will grow 2.6 percent as oil prices stabilize and average between $57 and $63 throughout 2018.

2 | 2018 ECONOMIC PROFILE
GROSS PRODUCTTulsa MSA gross product, the value of all goods and services produced in Tulsa, is estimated to have been $58.7 billion (adjusted for inflation) in 2017, up 2.0 percent from 2016. Tulsa’s concentration in energy oil-related manufacturing relative to the state is reflected in slower growth than the state whereas the state’s production of goods and services grew 3.9 percent. Although Oklahoma’s economy is tied to oil and gas, Oklahoma’s 3.9 percent growth rate was appreciably higher the U.S. growth of 2.3 percent.
GROSS PRODUCT PROJECTIONSIn 2018, Tulsa’s gross product should grow 7.1 percent with more stable and higher oil prices than in 2017 and slowly growing oil-related employment levels. The state economy is tied not only to oil and gas, but a somewhat depressed agriculture sector and will grow 3.8 percent in 2018. The U.S. economy should grow 2.7 percent in 2017. Gross metro product for Tulsa will grow steadily after 2018 with average growth of 5.5 percent over the five-year period ended 2022, growing at a much higher rate than the state and nation.
GROSS PRODUCT GROWTH RATES 2013-2016, FORECAST 2017, 2018
GROSS METRO PRODUCT
PROJECTIONSYEAR TULSA MSA
ANNUAL GROWTH OK ANNUAL GROWTH U.S. ANNUAL GROWTH
2017* 58,683,240,000 2.0% 175,647,500,000 3.9% 17,092,671,750,000 2.3%
2018 62,866,950,000 7.1% 182,348,700,000 3.8% 17,558,890,500,000 2.7%
2018-2022 5.5% 3.3% 2.3%
*2017 value is estimated.
-4.0%
-2.0%
0.0%
2.0%
4.0%
6.0%
8.0%
201820172016201520142013
*2017 is estimated.Sources: Bureau of Economic Analysis, OSU Center for Applied Economic Research.
YEAR TULSA MSA ANNUAL GROWTH OK ANNUAL GROWTH U.S. ANNUAL GROWTH
2010 $42,758,000,000 -4.6% $142,114,000,000 0.1% $14,783,800,000,000 2.5%
2011 $48,186,000,000 12.7% $149,055,000,000 4.9% $15,020,575,000,000 1.6%
2012 $51,828,000,000 7.6% $157,405,000,000 5.6% $15,354,625,000,000 2.2%
2013 $55,415,000,000 6.9% $163,608,000,000 3.9% $15,612,175,000,000 1.7%
2014 $59,096,000,000 6.6% $170,463,000,000 4.2% $15,982,250,000,000 2.4%
2015 $59,505,000,000 0.7% $174,540,000,000 2.4% $16,397,200,000,000 2.6%
2016 $57,528,000,000 -3.3% $169,089,000,000 -3.1% $16,659,800,000,000 1.6%
2017* $58,683,240,000 2.0% $175,647,500,000 3.9% $17,092,671,750,000 2.3%
*2017 value is estimated.
TULSA
OK
U.S.
TULSA REGIONAL CHAMBER | 3
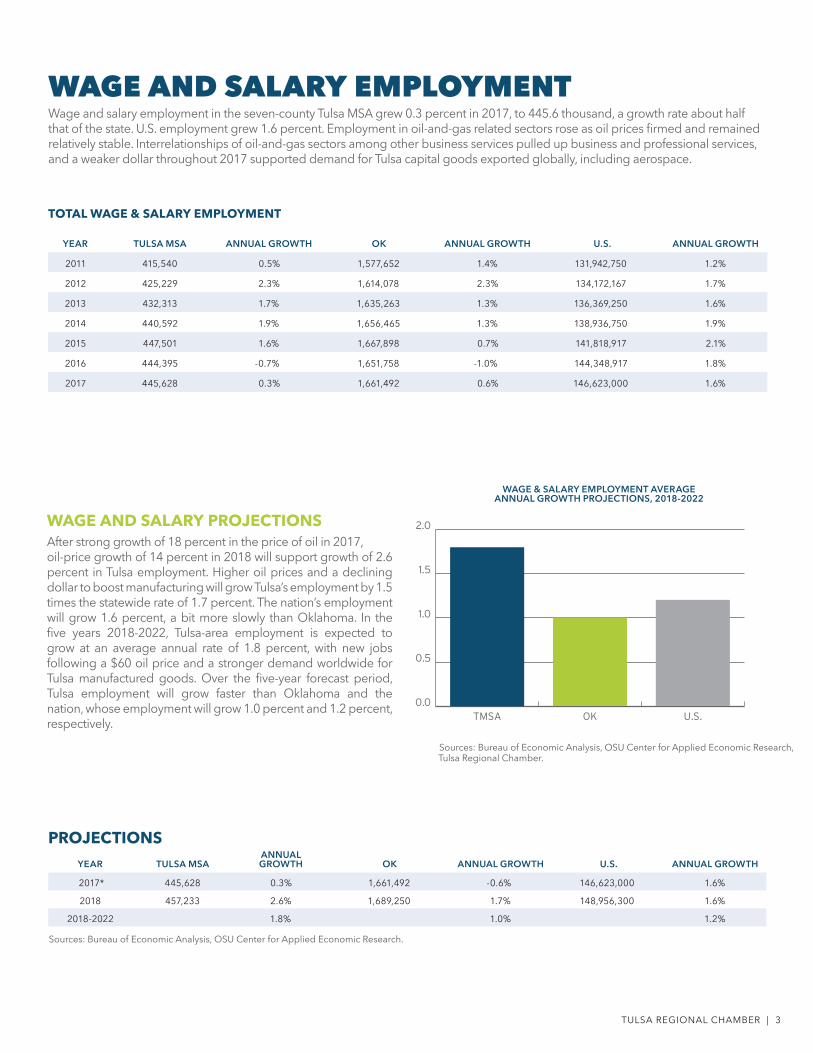
WAGE AND SALARY EMPLOYMENTWage and salary employment in the seven-county Tulsa MSA grew 0.3 percent in 2017, to 445.6 thousand, a growth rate about half that of the state. U.S. employment grew 1.6 percent. Employment in oil-and-gas related sectors rose as oil prices firmed and remained relatively stable. Interrelationships of oil-and-gas sectors among other business services pulled up business and professional services, and a weaker dollar throughout 2017 supported demand for Tulsa capital goods exported globally, including aerospace.
WAGE AND SALARY PROJECTIONSAfter strong growth of 18 percent in the price of oil in 2017, oil-price growth of 14 percent in 2018 will support growth of 2.6 percent in Tulsa employment. Higher oil prices and a declining dollar to boost manufacturing will grow Tulsa’s employment by 1.5 times the statewide rate of 1.7 percent. The nation’s employment will grow 1.6 percent, a bit more slowly than Oklahoma. In the five years 2018-2022, Tulsa-area employment is expected to grow at an average annual rate of 1.8 percent, with new jobs following a $60 oil price and a stronger demand worldwide for Tulsa manufactured goods. Over the five-year forecast period, Tulsa employment will grow faster than Oklahoma and the nation, whose employment will grow 1.0 percent and 1.2 percent, respectively.
WAGE & SALARY EMPLOYMENT AVERAGE ANNUAL GROWTH PROJECTIONS, 2018-2022
TOTAL WAGE & SALARY EMPLOYMENT
PROJECTIONSYEAR TULSA MSA
ANNUAL GROWTH OK ANNUAL GROWTH U.S. ANNUAL GROWTH
2017* 445,628 0.3% 1,661,492 -0.6% 146,623,000 1.6%
2018 457,233 2.6% 1,689,250 1.7% 148,956,300 1.6%
2018-2022 1.8% 1.0% 1.2%
Sources: Bureau of Economic Analysis, OSU Center for Applied Economic Research.
YEAR TULSA MSA ANNUAL GROWTH OK ANNUAL GROWTH U.S. ANNUAL GROWTH
2011 415,540 0.5% 1,577,652 1.4% 131,942,750 1.2%
2012 425,229 2.3% 1,614,078 2.3% 134,172,167 1.7%
2013 432,313 1.7% 1,635,263 1.3% 136,369,250 1.6%
2014 440,592 1.9% 1,656,465 1.3% 138,936,750 1.9%
2015 447,501 1.6% 1,667,898 0.7% 141,818,917 2.1%
2016 444,395 -0.7% 1,651,758 -1.0% 144,348,917 1.8%
2017 445,628 0.3% 1,661,492 0.6% 146,623,000 1.6%
0.0
0.5
1.0
1.5
2.0
U.S.OKTMSA
Sources: Bureau of Economic Analysis, OSU Center for Applied Economic Research, Tulsa Regional Chamber.
4 | 2018 ECONOMIC PROFILE
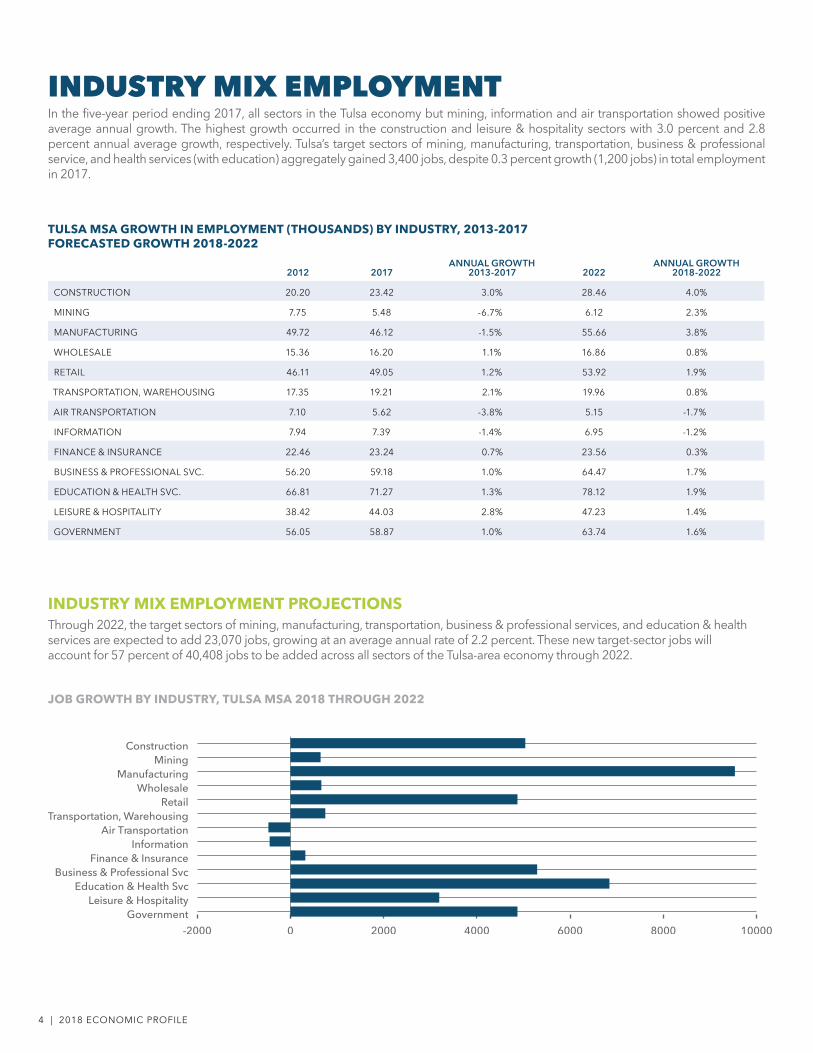
INDUSTRY MIX EMPLOYMENTIn the five-year period ending 2017, all sectors in the Tulsa economy but mining, information and air transportation showed positive average annual growth. The highest growth occurred in the construction and leisure & hospitality sectors with 3.0 percent and 2.8 percent annual average growth, respectively. Tulsa’s target sectors of mining, manufacturing, transportation, business & professional service, and health services (with education) aggregately gained 3,400 jobs, despite 0.3 percent growth (1,200 jobs) in total employment in 2017.
INDUSTRY MIX EMPLOYMENT PROJECTIONSThrough 2022, the target sectors of mining, manufacturing, transportation, business & professional services, and education & health services are expected to add 23,070 jobs, growing at an average annual rate of 2.2 percent. These new target-sector jobs will account for 57 percent of 40,408 jobs to be added across all sectors of the Tulsa-area economy through 2022.
JOB GROWTH BY INDUSTRY, TULSA MSA 2018 THROUGH 2022
TULSA MSA GROWTH IN EMPLOYMENT (THOUSANDS) BY INDUSTRY, 2013-2017 FORECASTED GROWTH 2018-2022
2012 2017ANNUAL GROWTH
2013-2017 2022ANNUAL GROWTH
2018-2022
CONSTRUCTION 20.20 23.42 3.0% 28.46 4.0%
MINING 7.75 5.48 -6.7% 6.12 2.3%
MANUFACTURING 49.72 46.12 -1.5% 55.66 3.8%
WHOLESALE 15.36 16.20 1.1% 16.86 0.8%
RETAIL 46.11 49.05 1.2% 53.92 1.9%
TRANSPORTATION, WAREHOUSING 17.35 19.21 2.1% 19.96 0.8%
AIR TRANSPORTATION 7.10 5.62 -3.8% 5.15 -1.7%
INFORMATION 7.94 7.39 -1.4% 6.95 -1.2%
FINANCE & INSURANCE 22.46 23.24 0.7% 23.56 0.3%
BUSINESS & PROFESSIONAL SVC. 56.20 59.18 1.0% 64.47 1.7%
EDUCATION & HEALTH SVC. 66.81 71.27 1.3% 78.12 1.9%
LEISURE & HOSPITALITY 38.42 44.03 2.8% 47.23 1.4%
GOVERNMENT 56.05 58.87 1.0% 63.74 1.6%
-2000 0 2000 4000 6000 8000 10000Government
Leisure & HospitalityEducation & Health Svc
Business & Professional SvcFinance & Insurance
InformationAir Transportation
Transportation, WarehousingRetail
WholesaleManufacturing
MiningConstruction

TULSA REGIONAL CHAMBER | 5
UNEMPLOYMENTThe unemployment rate in the Tulsa region declined from 5.0 percent in 2016 to 4.5 percent in 2017 as the Tulsa-area economy firmed with oil prices that were higher and more stable than in 2016. The labor force grew as 2,166 unemployed persons found jobs and an additional 607 job seekers entered the labor force and went to work in the Tulsa economy. Oil-and-gas employment continued to decline in 2017, but those losses were offset significantly by gains in construction, professional & business services, health care, warehousing & distribution and machinery manufacturing. At 4.5 percent, the 2017 unemployment rate approximates the full-employment unemployment rate, the rate at which no cyclical unemployment exists. That is, the only job-seekers have either quit a job and are looking for employment, or are unskilled and chronically unemployed. A rate below 4.5 percent is reflective of a tight labor market in which employers cannot find qualified workers to fill positions. More job training that is targeted specifically to jobs requiring new-technology skills and productivity will tend to bring the full-employment unemployment rate down from 4.5 percent to a level closer to 4.0.
UNEMPLOYMENT PROJECTIONSThe Tulsa MSA unemployment rate should average 3.7 percent in 2018, as many sectors such as manufacturing, specifically machinery, aerospace manufacturing and professional & business services show outsized growth. Growth in the labor force participation rate, a measure of the labor force as a percent of working-age population, will be stagnant or slightly down through 2022 as the baby boomer retirement continues in large numbers. The labor market is expected to be tight with job seekers having more difficulty getting jobs than in the last five years. The tight market could be relaxed, even at unemployment rates less than four percent if Tulsa can retain young workers and strong, intentional technical training takes hold to match work force to jobs.
UNEMPLOYMENT RATE WITH ACTUAL FOR 2017, FORECASTS FOR 2018, 2022
UNEMPLOYMENT RATE
YEAR TULSA MSA OK U.S.
2010 7.3% 6.8% 9.6%
2011 6.2% 5.9% 8.9%
2012 5.3% 5.2% 8.1%
2013 5.3% 5.3% 7.4%
2014 4.5% 4.5% 6.2%
2015 4.4% 4.4% 5.3%
2016 5.0% 4.9% 4.9%
2017 4.5% 4.3% 4.4%
2018 3.7% 3.9% 4.0%
2019 3.4% 3.7% 3.6%
2020 3.3% 3.8% 3.6%
2021 3.3% 3.8% 3.7%
2022 3.3% 3.9% 3.8% 2018 - 2022 projections.
0
1
2
3
4
52017
2018
2022
*U.S.*OK*Tulsa MSA
Sources: Oklahoma Employment Security Commission, OSU Center for Applied Economic Research.

6 | 2018 ECONOMIC PROFILE
LABOR FORCELabor force is defined as the sum of persons who are 16 years old or older who are working and those persons who are not currently working but who are actively seeking work. Growth in the Tulsa-area labor force was flat in 2016 with the number of persons losing jobs (3,155) slightly larger than the growth in unemployment (2,994) as energy and energy-related manufacturing experienced job losses concurrently with job gains in construction, health care and professional & business services. The labor force growth grew by 0.1 percent in 2017 with decline in the unemployment rate from 5.0 percent to 4.5 percent. This combination reflects an economy that turned to the upside as oil prices stabilized and the strength of the U.S. dollar subsided.
LABOR FORCE PROJECTIONSThe Tulsa-area labor force in 2018 will grow by 1.7 percent with a decline in the unemployment rate from 4.5 percent to 3.7 percent as people enter the labor force from within and from outside the MSA to take jobs and with expectation to get jobs. A tight labor market will persist as the need to fill jobs and the difficulty in finding persons with the correct skills continues in the period from 2018 through 2022. The economy will expand in 2018 through 2022 as the supply of qualified job applicants begins to match industry requirements more closely. The Tulsa MSA labor force should grow at an average annual rate of 1.0 percent in years 2018 through 2022, matching growth at the state level.
LABOR FORCE AVERAGE ANNUAL GROWTH PROJECTIONS, 2018-2022
PROJECTIONSYEAR TULSA MSA
ANNUAL GROWTH OK ANNUAL GROWTH U.S.
ANNUAL GROWTH
2017 476,252 0.1% 1,831,364 0.2% 160,310,167 0.7%2018 484,343 1.7% 1,865,479 1.9% 161,981,700 1.0%
2018-2022 1.01% 1.05% 0.96%
Sources: Oklahoma Employment Security Commission, OSU Center for Applied Economic Research.
LABOR FORCE
YEAR TULSA MSA ANNUAL GROWTH OK ANNUAL GROWTH U.S. ANNUAL GROWTH
2008 441,772 0.7% 1,746,488 1.2% 154,321,583 0.8%
2009 441,371 -0.1% 1,764,465 1.0% 154,188,500 -0.1%
2010 462,864 4.9% 1,768,349 0.2% 153,885,250 -0.2%
2011 458,900 -0.9% 1,772,733 0.2% 153,623,667 -0.2%
2012 466,848 1.7% 1,803,957 1.8% 154,973,833 0.9%
2013 467,850 0.2% 1,806,199 0.1% 155,397,500 0.3%
2014 464,745 -0.7% 1,793,398 -0.7% 155,916,167 0.3%
2015 475,854 2.4% 1,833,749 2.2% 157,133,750 0.8%
2016 475,681 -0.04% 1,828,486 -0.3% 159,191,083 1.3%
2017 476,252 0.1% 1,831,364 0.2% 160,310,167 0.7%
Sources: Oklahoma Employment Security Commission, OSU Center for Applied Economic Research.
0.0
0.2
0.4
0.6
0.8
1.0
1.2
U.S.OKTMSA
TULSA REGIONAL CHAMBER | 7
POPULATIONThe Tulsa MSA population grew 0.1 percent in 2017 to 988,248, up from 987,201 in 2016. Based on data collected in surveys by the Bureau of the Census, Tulsa experienced a net in-migration into the Tulsa MSA in 2016 (most recent year of reporting), of 2,197 persons, a 30 percent decline from 2015. Of the 2,197 who moved to Tulsa, 48 percent were foreign immigrants.
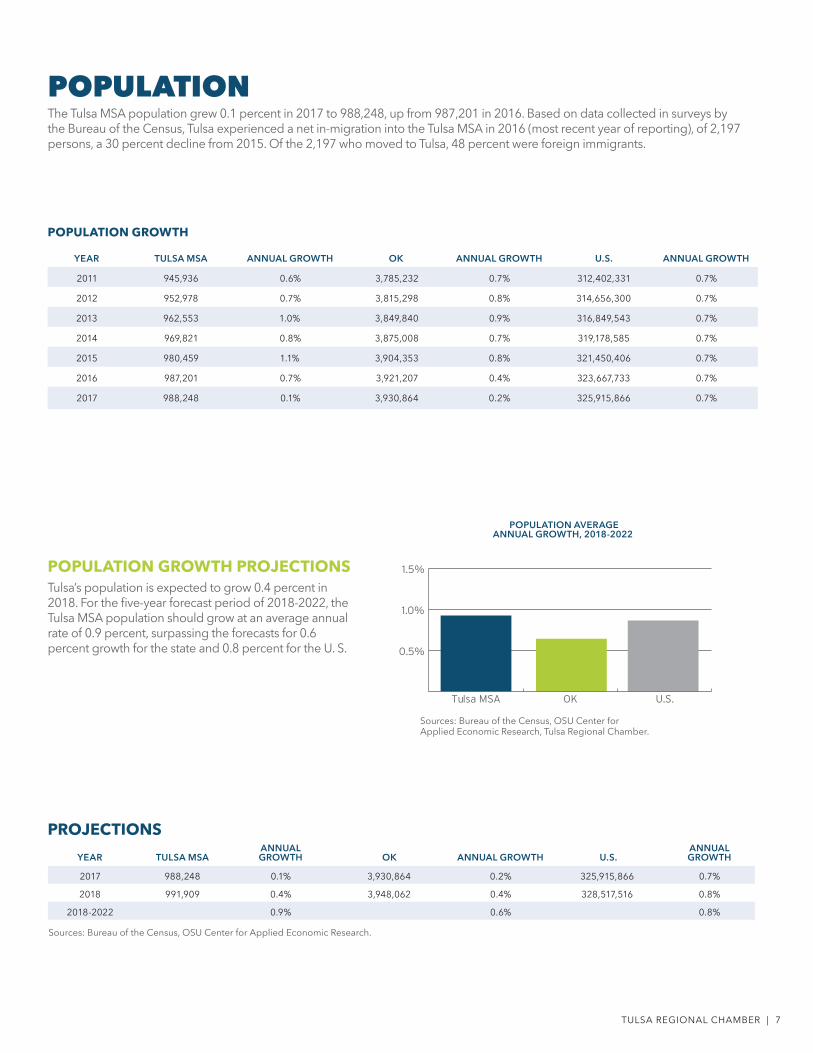
POPULATION GROWTH PROJECTIONSTulsa’s population is expected to grow 0.4 percent in 2018. For the five-year forecast period of 2018-2022, the Tulsa MSA population should grow at an average annual rate of 0.9 percent, surpassing the forecasts for 0.6 percent growth for the state and 0.8 percent for the U. S.
POPULATION AVERAGE ANNUAL GROWTH, 2018-2022
PROJECTIONSYEAR TULSA MSA
ANNUAL GROWTH OK ANNUAL GROWTH U.S.
ANNUAL GROWTH
2017 988,248 0.1% 3,930,864 0.2% 325,915,866 0.7%
2018 991,909 0.4% 3,948,062 0.4% 328,517,516 0.8%
2018-2022 0.9% 0.6% 0.8% Sources: Bureau of the Census, OSU Center for Applied Economic Research.
POPULATION GROWTH
YEAR TULSA MSA ANNUAL GROWTH OK ANNUAL GROWTH U.S. ANNUAL GROWTH
2011 945,936 0.6% 3,785,232 0.7% 312,402,331 0.7%
2012 952,978 0.7% 3,815,298 0.8% 314,656,300 0.7%
2013 962,553 1.0% 3,849,840 0.9% 316,849,543 0.7%
2014 969,821 0.8% 3,875,008 0.7% 319,178,585 0.7%
2015 980,459 1.1% 3,904,353 0.8% 321,450,406 0.7%
2016 987,201 0.7% 3,921,207 0.4% 323,667,733 0.7%
2017 988,248 0.1% 3,930,864 0.2% 325,915,866 0.7%
0.5%
1.0%
1.5%
U.S.OKTulsa MSA
Sources: Bureau of the Census, OSU Center for Applied Economic Research, Tulsa Regional Chamber.
8 | 2018 ECONOMIC PROFILE
PER CAPITA INCOMEPer capita income in the Tulsa MSA is estimated to have risen 2.3 percent in 2017, after a 7.0 percent decline in 2016. Per capita income in the state grew 1.7 percent and per capita income in the U.S. grew 2.4 percent in 2017. Stable oil prices at higher levels in 2017 over 2016 effected in the Tulsa MSA a slight gain in manufacturing employment and growing income although energy employment continued to slide lower.
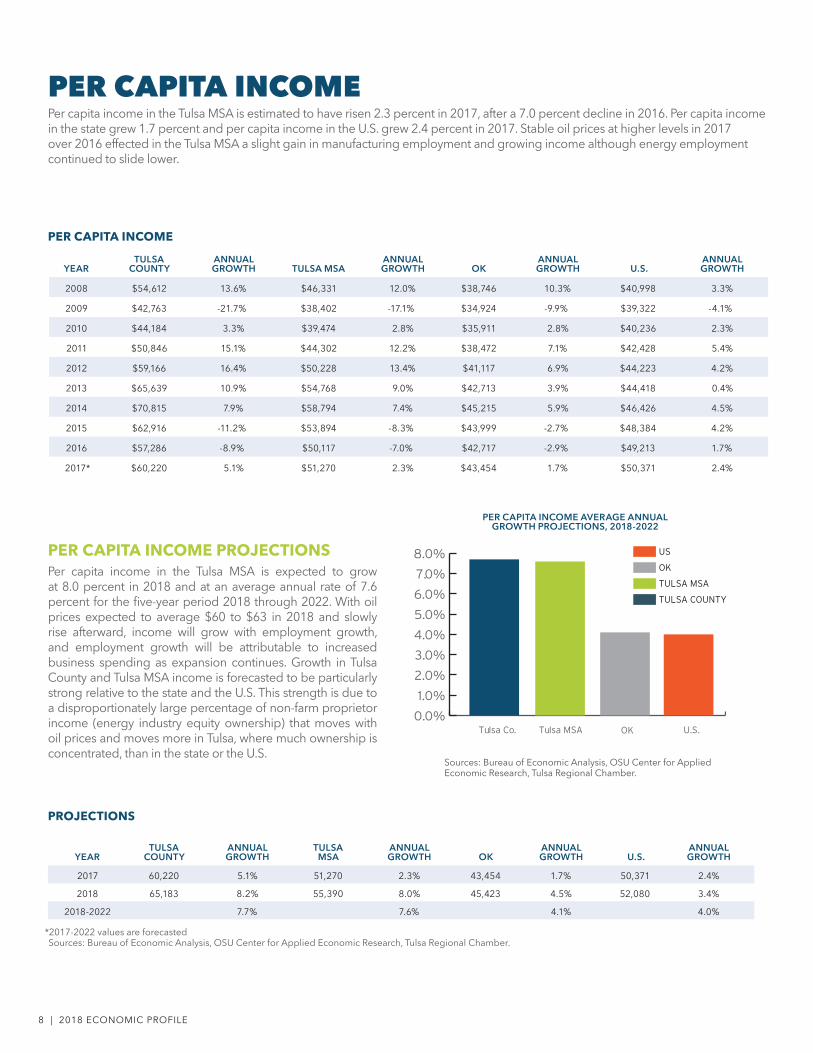
PER CAPITA INCOME PROJECTIONSPer capita income in the Tulsa MSA is expected to grow at 8.0 percent in 2018 and at an average annual rate of 7.6 percent for the five-year period 2018 through 2022. With oil prices expected to average $60 to $63 in 2018 and slowly rise afterward, income will grow with employment growth, and employment growth will be attributable to increased business spending as expansion continues. Growth in Tulsa County and Tulsa MSA income is forecasted to be particularly strong relative to the state and the U.S. This strength is due to a disproportionately large percentage of non-farm proprietor income (energy industry equity ownership) that moves with oil prices and moves more in Tulsa, where much ownership is concentrated, than in the state or the U.S.
PER CAPITA INCOME AVERAGE ANNUAL GROWTH PROJECTIONS, 2018-2022
PROJECTIONS
YEARTULSA
COUNTYANNUAL GROWTH
TULSA MSA
ANNUAL GROWTH OK
ANNUAL GROWTH U.S.
ANNUAL GROWTH
2017 60,220 5.1% 51,270 2.3% 43,454 1.7% 50,371 2.4%
2018 65,183 8.2% 55,390 8.0% 45,423 4.5% 52,080 3.4%
2018-2022 7.7% 7.6% 4.1% 4.0%
*2017-2022 values are forecastedSources: Bureau of Economic Analysis, OSU Center for Applied Economic Research, Tulsa Regional Chamber.
PER CAPITA INCOME
YEARTULSA
COUNTYANNUAL GROWTH TULSA MSA
ANNUAL GROWTH OK
ANNUAL GROWTH U.S.
ANNUAL GROWTH
2008 $54,612 13.6% $46,331 12.0% $38,746 10.3% $40,998 3.3%
2009 $42,763 -21.7% $38,402 -17.1% $34,924 -9.9% $39,322 -4.1%
2010 $44,184 3.3% $39,474 2.8% $35,911 2.8% $40,236 2.3%
2011 $50,846 15.1% $44,302 12.2% $38,472 7.1% $42,428 5.4%
2012 $59,166 16.4% $50,228 13.4% $41,117 6.9% $44,223 4.2%
2013 $65,639 10.9% $54,768 9.0% $42,713 3.9% $44,418 0.4%
2014 $70,815 7.9% $58,794 7.4% $45,215 5.9% $46,426 4.5%
2015 $62,916 -11.2% $53,894 -8.3% $43,999 -2.7% $48,384 4.2%
2016 $57,286 -8.9% $50,117 -7.0% $42,717 -2.9% $49,213 1.7%
2017* $60,220 5.1% $51,270 2.3% $43,454 1.7% $50,371 2.4%
U.S.OKTulsa MSATulsa Co.0.0%
1.0%
2.0%
3.0%
4.0%
5.0%
6.0%
7.0%
8.0%
Sources: Bureau of Economic Analysis, OSU Center for Applied Economic Research, Tulsa Regional Chamber.
US
OK
TULSA MSA
TULSA COUNTY

TULSA REGIONAL CHAMBER | 9
AVERAGE WEEKLY EARNINGS IN MANUFACTURINGAverage weekly earnings from manufacturing in Tulsa contracted by 0.3 percent in 2017 to $822.09, 5.5 percent above the state average but 6.1 percent below the U.S. average. The slight decline in average weekly wage for Tulsa-area manufacturing workers from 2017 is attributable to a work week that averaged five percent under 40 hours throughout the year. The vulnerability of our disproportionately large capital goods manufacturing sector to lower energy prices put the Tulsa wage growth lower than the growth state and the U.S. average weekly wage.
AVERAGE WEEKLY EARNINGS IN MANUFACTURING FORECASTAverage weekly earnings in manufacturing in the Tulsa MSA are forecasted to grow by 8.5 percent in 2018 as recovery continues in the oil and gas sector and the U.S. dollar weakens. Average annual growth through 2022 of 4.5 percent will surpass the state and U.S., which are expected to grow 3.3 percent and 3.6 percent, respectively.
AVERAGE WEEKLY EARNINGS, MANUFACTURING AVERAGE ANNUAL GROWTH PROJECTIONS, 2018 - 2022
AVERAGE WEEKLY EARNINGS IN MANUFACTURING
PROJECTIONS
YEAR TULSA MSAANNUAL GROWTH OK
ANNUAL GROWTH U.S.
ANNUAL GROWTH
2017 822.09 -0.3% 782.07 4.2% 875.57 2.3%
2018 891.89 8.5% 803.29 2.7% 880.55 0.6%
2018-2022 4.5% 3.3% 3.6%
Sources: Oklahoma Employment Security Commission, Tulsa Regional Chamber.
YEAR TULSA MSAANNUAL GROWTH OK
ANNUAL GROWTH U.S.
ANNUAL GROWTH
2008 725.54 -1.0% 608.76 5.1% 724.46 1.8%
2009 769.77 6.1% 597.78 -1.8% 726.12 0.2%
2010 768.88 -0.1% 604.73 1.2% 765.18 5.4%
2011 745.78 -3.0% 649.48 7.4% 784.29 2.5%
2012 759.48 1.8% 685.73 5.6% 794.63 1.3%
2013 854.58 12.5% 712.80 3.9% 807.37 1.6%
2014 926.11 8.4% 748.51 5.0% 822.03 1.8%
2015 905.07 -2.3% 748.04 -0.1% 832.08 1.2%
2016 824.20 -8.9% 750.39 0.3% 855.77 2.8%
2017 822.09 -0.3% 782.07 4.2% 875.57 2.3%
0
1
2
3
4
5
U.S.OKTMSA
Sources: Oklahoma Employment Security Commission, Oklahoma State University, Tulsa Regional Chamber.
10 | 2018 ECONOMIC PROFILE
RETAIL SALESSteady oil prices and positive employment growth in the Tulsa MSA over regional and statewide economies in 2017 are reflected in increases in retail sales in 2017 of 1.6 percent and 3.7 percent for Tulsa City and the Tulsa MSA, respectively, after contracting in 2016. Growth in retail sales at the state level matched the Tulsa MSA at 2.8 percent. U.S. retail sales grew 4.5 percent reflecting a national economy that behaves differently than the energy-based economies of Tulsa and Oklahoma.
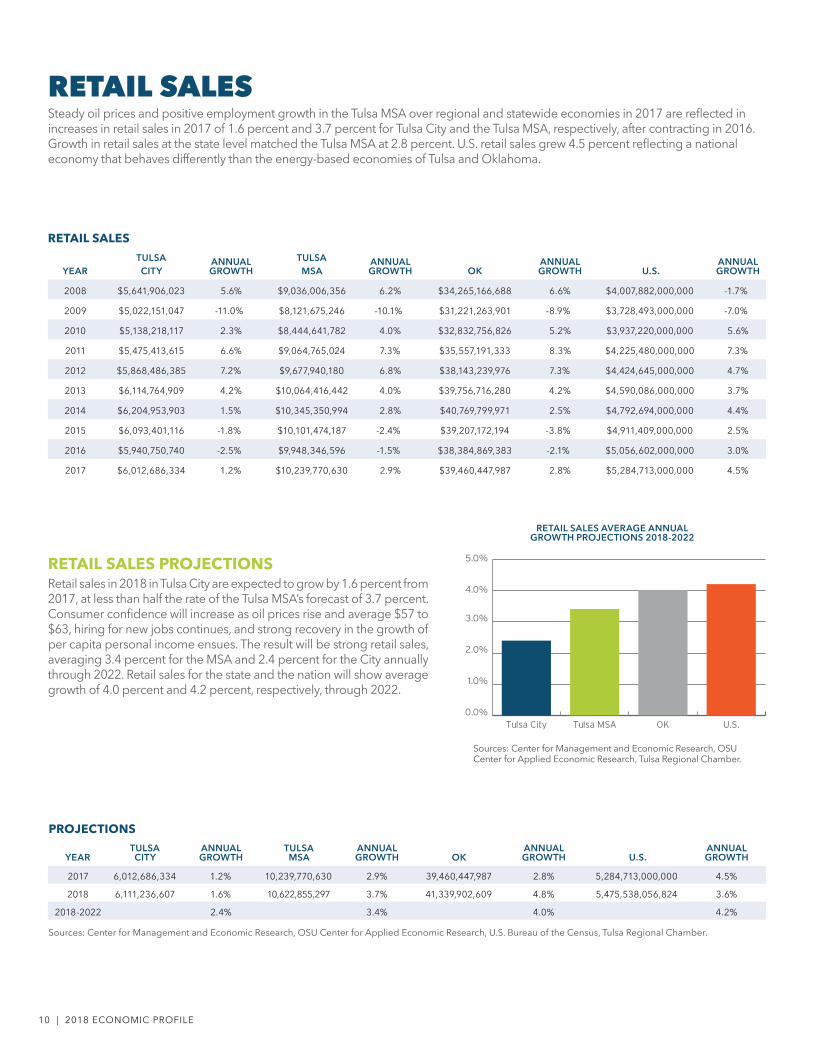
RETAIL SALES PROJECTIONSRetail sales in 2018 in Tulsa City are expected to grow by 1.6 percent from 2017, at less than half the rate of the Tulsa MSA’s forecast of 3.7 percent. Consumer confidence will increase as oil prices rise and average $57 to $63, hiring for new jobs continues, and strong recovery in the growth of per capita personal income ensues. The result will be strong retail sales, averaging 3.4 percent for the MSA and 2.4 percent for the City annually through 2022. Retail sales for the state and the nation will show average growth of 4.0 percent and 4.2 percent, respectively, through 2022.
RETAIL SALES AVERAGE ANNUAL GROWTH PROJECTIONS 2018-2022
RETAIL SALES
YEARTULSA CITY
ANNUAL GROWTH
TULSA MSA
ANNUAL GROWTH OK
ANNUAL GROWTH U.S.
ANNUAL GROWTH
2008 $5,641,906,023 5.6% $9,036,006,356 6.2% $34,265,166,688 6.6% $4,007,882,000,000 -1.7%
2009 $5,022,151,047 -11.0% $8,121,675,246 -10.1% $31,221,263,901 -8.9% $3,728,493,000,000 -7.0%
2010 $5,138,218,117 2.3% $8,444,641,782 4.0% $32,832,756,826 5.2% $3,937,220,000,000 5.6%
2011 $5,475,413,615 6.6% $9,064,765,024 7.3% $35,557,191,333 8.3% $4,225,480,000,000 7.3%
2012 $5,868,486,385 7.2% $9,677,940,180 6.8% $38,143,239,976 7.3% $4,424,645,000,000 4.7%
2013 $6,114,764,909 4.2% $10,064,416,442 4.0% $39,756,716,280 4.2% $4,590,086,000,000 3.7%
2014 $6,204,953,903 1.5% $10,345,350,994 2.8% $40,769,799,971 2.5% $4,792,694,000,000 4.4%
2015 $6,093,401,116 -1.8% $10,101,474,187 -2.4% $39,207,172,194 -3.8% $4,911,409,000,000 2.5%
2016 $5,940,750,740 -2.5% $9,948,346,596 -1.5% $38,384,869,383 -2.1% $5,056,602,000,000 3.0%
2017 $6,012,686,334 1.2% $10,239,770,630 2.9% $39,460,447,987 2.8% $5,284,713,000,000 4.5%
0.0%
1.0%
2.0%
3.0%
4.0%
5.0%
U.S.OKTulsa MSATulsa City
Sources: Center for Management and Economic Research, OSU Center for Applied Economic Research, Tulsa Regional Chamber.
PROJECTIONS
YEARTULSA CITY
ANNUAL GROWTH
TULSA MSA
ANNUAL GROWTH OK
ANNUAL GROWTH U.S.
ANNUAL GROWTH
2017 6,012,686,334 1.2% 10,239,770,630 2.9% 39,460,447,987 2.8% 5,284,713,000,000 4.5%
2018 6,111,236,607 1.6% 10,622,855,297 3.7% 41,339,902,609 4.8% 5,475,538,056,824 3.6%
2018-2022 2.4% 3.4% 4.0% 4.2%
Sources: Center for Management and Economic Research, OSU Center for Applied Economic Research, U.S. Bureau of the Census, Tulsa Regional Chamber.

TULSA REGIONAL CHAMBER | 11
RESIDENTIAL REAL ESTATEThe residential real estate market in the Tulsa MSA in 2017 increased in number of total permits issued by 4.0 percent; the total value of permits grew by 7.3 percent. Home sales increased by 1.4 percent and inventories grew by 10.8 percent in 2017. Both rising sales and rising inventories are reasonable with low long-term borrowing rates existing concurrently with hints of a higher-rate strategy to be effected by Federal Reserve Bank. The year-end median sale price for a single-family home sold in 2017 was $162,000, up 7.4 percent from $150,797 in 2016, reflecting a stronger economy amidst moderately stable oil prices.
VALUE OF SINGLE-FAMILY RESIDENTIAL PERMITS ($MILLION), TULSA MSA, 2017
AND 2018-2022 FORECASTS
NEW SINGLE-FAMILY RESIDENTIAL BUILDING PERMITS, TULSA MSA
PROJECTIONS
YEARNO. RESIDENTIAL
BUILDING PERMITS* ANNUAL GROWTHVALUE OF PERMITS
($MILLION) ANNUAL GROWTH
2017 3,158 4.0% 678.842 7.3%
2018 2,992 -5.3% 654.563 -3.6%
2018-2022 2.3% 4.2%
Sources: Bureau of the Census, OSU Center for Applied Economic Research, Moody's Economy.com, Tulsa Regional Chamber.
YEARNO. RESIDENTIAL
BUILDING PERMITS* ANNUAL GROWTH VALUE OF PERMITS ($MILLION) ANNUAL GROWTH
2008 2,868 -34.8% 493.834 -32.9%
2009 2,680 -6.6% 453.539 -8.2%
2010 2,269 -15.3% 393.148 -13.3%
2011 2,033 -10.4% 376.366 -4.3%
2012 2,699 32.8% 484.111 28.6%
2013 3,006 11.4% 599.883 23.9%
2014 3,022 0.5% 609.807 1.7%
2015 2,891 -4.3% 619.750 1.6%
2016 3,036 5.0% 632.655 2.1%
2017 3,158 4.0% 678.842 7.3%
0
200
400
600
800
1000
2017 2018 2019 202 1202212202
Sources: Bureau of the Census, OSU Center for Applied Economic Research, McGraw-Hill, Tulsa Regional Chamber.
RESIDENTIAL REAL ESTATE PROJECTIONSIn 2018 the year-end total number of residential permits is expected decline over year 2017 by 5.3 percent, as the existing-home inventory is sold down. Accompanying the decline in the number of permits in 2018 will be a decrease in value of permits of 3.6 percent, indicating that the average new home likely will be about 1.8 percent more expensive on average than in 2017. The average annual growth rates for number of permits and permit value through 2022 are expected to be 2.3 percent and 4.2 percent, respectively.
20

12 | 2018 ECONOMIC PROFILE
NON-RESIDENTIAL REAL ESTATEThe value of new non-residential contracts in the Tulsa MSA fell in 2017 by 30.1 percent, to $453.1 million, as the growth that occurred in 2016 as region-wide new construction and downtown Tulsa renovation subsided. Investors continued to develop long-term real assets as the energy market stabilized in 2017 albeit at a tempered rate. With construction employment growing less than two percent in 2017 but picking up from 0.3 percent in 2016, investments continued to be put in place for future income and revenue growth that reflect investors’ expectations that the Tulsa economy will grow in both the near- and long-term.
NON-RESIDENTIAL REAL ESTATE PROJECTIONSNew non-residential construction is expected to grow by 17.4 percent in 2018 and to grow at an average annual rate of 8.5 percent over the five-year forecast period 2018-2022, with continued stimulation by “Vision Tulsa,” the vote to support streets and transportation and develop the Arkansas River. Strong growth in manufacturing, professional & business services and health care will effect capital expansion through the five-year forecast period.
2016 AND 2017 VALUE OF NON-RESIDENTIAL CONTRACTS ($MILLION) WITH FORECASTS FOR 2018-2022 TULSA MSA
NON-RESIDENTIAL REAL ESTATE CONSTRUCTION CONTRACTS AWARDED, TULSA MSA
PROJECTIONS
YEARNON-RESIDENTIAL
CONTRACT VALUE ($MILLION) ANNUAL GROWTH
2017 453.1 -30.1%
2018 532.0 17.4%
2018-2022 8.5%
Sources: McGraw-Hill, OSU Center for Applied Economic Research, Tulsa Regional Chamber.
YEARNON-RESIDENTIAL
CONTRACT VALUE ($MILLION) ANNUAL GROWTH
2008 756.1 11.6%
2009 628.5 -16.9%
2010 713.9 13.6%
2011 705.5 -1.2%
2012 517.9 -26.6%
2013 675.1 30.3%
2014 664.6 -1.6%
2015 580.2 -12.7%
2016 647.9 11.7%
2017 453.1 -30.1%
Sources: McGraw-Hill, OSU Center for Applied Economic Research, Tulsa Regional Chamber.
0
100
200
300
400
500
600
700
800
2022202120202019201820172016

TULSA REGIONAL CHAMBER | 13
BUSINESS BANKRUPTCIESThe business-bankruptcy component of total bankruptcies constituted 0.5 percent of all bankruptcies in 2017 for northeastern Oklahoma. The number was down from 16 in 2016 to 13 in 2017, an 18.8 percent decline. A more stable energy sector with steady growth in oil prices should contain growth in business bankruptcies in northeastern Oklahoma in 2018. U.S. business bankruptcies accounted for 2.9 percent of all bankruptcies in 2017.
Changes in business bankruptcies act as a leading indicator of business trends. Business bankruptcies generally are filed by small businesses that are under-capitalized and under-managed. Their vulnerability to subtly adverse market conditions makes them the first to go out of business, portending growing adversity which may affect all businesses. Conversely, declines in business bankruptcies may signify better economic conditions ahead. The decrease in business bankruptcy filings in northeastern Oklahoma from 16 in 2016 to 13 in 2017 is encouraging, declining by 18.8 percent while the U.S. rated declined by 4.0 percent. Forecasted average annual growth for employment of 1.8 percent in 2018-2022 and a gross product forecast of 5.5 percent average annual growth through the same period should keep Tulsa-area business bankruptcies at a manageable level well under 16 annually through the forecast period.
BUSINESS BANKRUPTCY FILINGS
YEAR NE OK ANNUAL GROWTH U.S. ANNUAL GROWTH
2010 38 -11.6% 56,282 -7.5%
2011 31 -18.4% 47,806 -15.1%
2012 20 -35.5% 40,075 -16.2%
2013 16 -20.0% 33,212 -17.1%
2014 11 -31.3% 26,983 -18.8%
2015 13 18.2% 24,735 -8.3%
2016 16 23.1% 24,114 -2.5%
2017 13 -18.8% 23,157 -4.0%
Source: U.S. bankruptcy courts.
TOTAL BANKRUPTCIESTotal bankruptcy filings in northeastern Oklahoma increased in 2017 after having declined steadily from the recession peak of 4,406 in 2010 through 2016. The 9.2 percent increase is attributable to personal-bankruptcy declarations and should resume a decline with strong growth in personal income and wages of 8.6 percent and 5.6 percent, respectively, over the next five years.
TOTAL BANKRUPTCY FILINGS
YEAR NE OK ANNUAL GROWTH U.S. ANNUAL GROWTH
2011 3,711 -15.8% 1,410,653 -11.5%
2012 3,417 -7.9% 1,221,091 -13.4%
2013 3,016 -11.7% 1,071,932 -12.2%
2014 2,722 -9.7% 936,795 -12.6%
2015 2,440 -10.4% 844,495 -9.9%
2016 2,316 -5.1% 794,960 -5.9%
2017 2,529 9.2% 789,820 -0.6%
Source: U.S. bankruptcy courts.
14 | 2018 ECONOMIC PROFILE
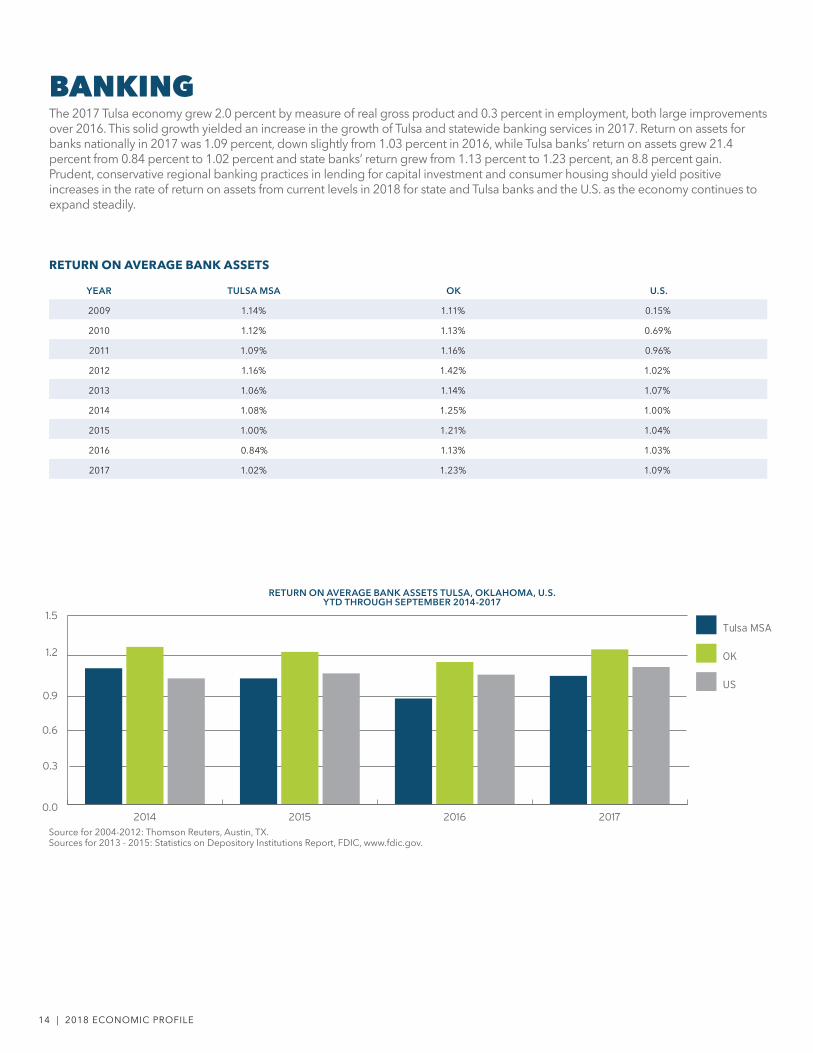
BANKINGThe 2017 Tulsa economy grew 2.0 percent by measure of real gross product and 0.3 percent in employment, both large improvements over 2016. This solid growth yielded an increase in the growth of Tulsa and statewide banking services in 2017. Return on assets for banks nationally in 2017 was 1.09 percent, down slightly from 1.03 percent in 2016, while Tulsa banks’ return on assets grew 21.4 percent from 0.84 percent to 1.02 percent and state banks’ return grew from 1.13 percent to 1.23 percent, an 8.8 percent gain. Prudent, conservative regional banking practices in lending for capital investment and consumer housing should yield positive increases in the rate of return on assets from current levels in 2018 for state and Tulsa banks and the U.S. as the economy continues to expand steadily.
RETURN ON AVERAGE BANK ASSETS
YEAR TULSA MSA OK U.S.
2009 1.14% 1.11% 0.15%
2010 1.12% 1.13% 0.69%
2011 1.09% 1.16% 0.96%
2012 1.16% 1.42% 1.02%
2013 1.06% 1.14% 1.07%
2014 1.08% 1.25% 1.00%
2015 1.00% 1.21% 1.04%
2016 0.84% 1.13% 1.03%
2017 1.02% 1.23% 1.09%
RETURN ON AVERAGE BANK ASSETS TULSA, OKLAHOMA, U.S.YTD THROUGH SEPTEMBER 2014-2017
Source for 2004-2012: Thomson Reuters, Austin, TX. Sources for 2013 - 2015: Statistics on Depository Institutions Report, FDIC, www.fdic.gov.
0.0
0.3
0.6
0.9
1.2
1.5Tulsa MSA
OK
US
2017201620152014

TULSA REGIONAL CHAMBER | 15
TRAVEL INDUSTRYHotel-room demand and hotel revenue expanded in 2017, up 2.0 percent and 3.7 percent, respectively from 2016. The hotel occupancy rate declined 3.2 percent in 2017 due to growth in room inventory that outpaced room demand in expectation of continued growth in tourism and business travel to Tulsa. The 2017 count of total air passengers rose 2.5 percent from 2016, the largest growth since 2014, before the decline in oil prices. As the Tulsa MSA economy experiences strong positive growth in gross product and employment, business-travel growth should grow in 2018. This prospect for growth is enhanced by the expected strength of oil prices which should be between $57 and $63 throughout 2018.
TRAVEL INDUSTRY
YEAR AIR PASSENGERS ROOM DEMAND ROOM REVENUE HOTEL OCCUPATION RATE
2008 3,180,765 2,829,837 $204,116,141 61.2
2009 2,812,295 2,564,527 $185,799,998 54.9
2010 2,763,562 2,632,043 $190,217,782 51.8
2011 2,707,386 2,711,185 $197,103,147 52.8
2012 2,654,189 2,816,246 $205,614,108 54.0
2013 2,647,889 2,991,987 $225,371,203 57.1
2014 2,760,705 3,113,111 $240,800,263 59.0
2015 2,739,429 3,131,986 $246,687,342 58.3
2016 2,727,718 3,129,792 $247,316,341 56.3
2017 2,794,901 3,192,613 $256,576,271 54.5
Sources: City of Tulsa, Smith Travel Research.
GROWTH RATES FOR KEY TRAVEL INDUSTRY INDICATORS TULSA MSA, 2014-2017
Sources: City of Tulsa, Smith Travel Research.
-4-3-2-1
0
1
2
3
4
5
6
7
82014
2015
2016
2017
*Hotel Occupation Rate*Room Revenue*Room Demand*Air Passengers

16 | 2018 ECONOMIC PROFILE
PORT OF CATOOSAThe Port of Catoosa is an inland port that includes terminal facilities spreading over 500 acres. The Port is a foreign trade zone created especially for industries that benefit from water transportation: producers of bulk, raw commodities such as grain, steel and fertilizer; or manufacturers of heavy equipment. The volume of shipments is subject not only to variations in business conditions, but to seasonality, weather, agricultural crop conditions and agricultural and foreign trade policy. In 2017, barge tonnage through the Port was 2,553,990 tons, up 13.0 percent from 2016. The gain was due to worldwide steady economic growth which stimulated demand for U.S. goods. The growth of the U.S. dollar slowed, improving demand for goods produced and services provided at the Port of Catoosa. Positive growth should continue with normal weather patterns, firm and transparent interest-rate policy by the Federal Reserve, and a stable, rising oil price.
ANNUAL BARGE TONNAGE PORT OF CATOOSA 2008-2017
BARGE TONNAGE, PORT OF CATOOSA
YEAR TONS CHANGE
2008 2,050,394 1.98%
2009 2,058,191 0.38%
2010 2,266,893 10.14%
2011 2,160,624 -4.69%
2012 2,702,464 25.08%
2013 2,700,990 -0.05%
2014 2,367,127 -12.36%
2015 1,551,808 -34.44%
2016 2,260,837 45.69%
2017 2,553,990 12.97%
0
500000
1000000
1500000
2000000
2500000
3000000
20152014 20172016201320122011201020092008
Source: Port of Catoosa.
TULSA REGIONAL CHAMBER | 17
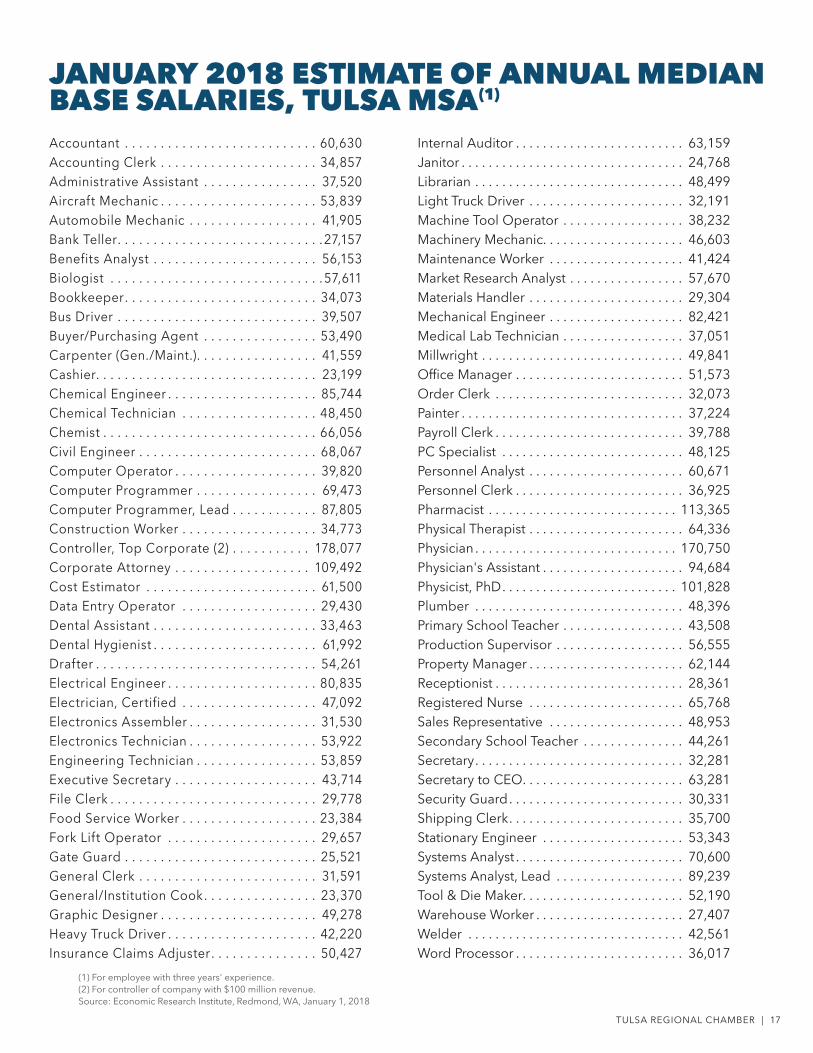
Accountant . . . . . . . . . . . . . . . . . . . . . . . . . . . 60,630Accounting Clerk . . . . . . . . . . . . . . . . . . . . . . 34,857Administrative Assistant . . . . . . . . . . . . . . . . 37,520Aircraft Mechanic . . . . . . . . . . . . . . . . . . . . . . 53,839Automobile Mechanic . . . . . . . . . . . . . . . . . . 41,905Bank Teller. . . . . . . . . . . . . . . . . . . . . . . . . . . . .27,157Benefits Analyst . . . . . . . . . . . . . . . . . . . . . . . 56,153Biologist . . . . . . . . . . . . . . . . . . . . . . . . . . . . . .57,611Bookkeeper. . . . . . . . . . . . . . . . . . . . . . . . . . . 34,073Bus Driver . . . . . . . . . . . . . . . . . . . . . . . . . . . . 39,507Buyer/Purchasing Agent . . . . . . . . . . . . . . . . 53,490Carpenter (Gen./Maint.). . . . . . . . . . . . . . . . . 41,559Cashier. . . . . . . . . . . . . . . . . . . . . . . . . . . . . . . 23,199Chemical Engineer . . . . . . . . . . . . . . . . . . . . . 85,744Chemical Technician . . . . . . . . . . . . . . . . . . . 48,450Chemist . . . . . . . . . . . . . . . . . . . . . . . . . . . . . . 66,056Civil Engineer . . . . . . . . . . . . . . . . . . . . . . . . . 68,067Computer Operator . . . . . . . . . . . . . . . . . . . . 39,820Computer Programmer . . . . . . . . . . . . . . . . . 69,473Computer Programmer, Lead . . . . . . . . . . . . 87,805Construction Worker . . . . . . . . . . . . . . . . . . . 34,773Controller, Top Corporate (2) . . . . . . . . . . . 178,077Corporate Attorney . . . . . . . . . . . . . . . . . . . 109,492Cost Estimator . . . . . . . . . . . . . . . . . . . . . . . . 61,500Data Entry Operator . . . . . . . . . . . . . . . . . . . 29,430Dental Assistant . . . . . . . . . . . . . . . . . . . . . . . 33,463Dental Hygienist . . . . . . . . . . . . . . . . . . . . . . . 61,992Drafter . . . . . . . . . . . . . . . . . . . . . . . . . . . . . . . 54,261Electrical Engineer . . . . . . . . . . . . . . . . . . . . . 80,835Electrician, Certified . . . . . . . . . . . . . . . . . . . 47,092Electronics Assembler . . . . . . . . . . . . . . . . . . 31,530Electronics Technician . . . . . . . . . . . . . . . . . . 53,922Engineering Technician . . . . . . . . . . . . . . . . . 53,859Executive Secretary . . . . . . . . . . . . . . . . . . . . 43,714File Clerk . . . . . . . . . . . . . . . . . . . . . . . . . . . . . 29,778Food Service Worker . . . . . . . . . . . . . . . . . . . 23,384Fork Lift Operator . . . . . . . . . . . . . . . . . . . . . 29,657Gate Guard . . . . . . . . . . . . . . . . . . . . . . . . . . . 25,521General Clerk . . . . . . . . . . . . . . . . . . . . . . . . . 31,591General/Institution Cook. . . . . . . . . . . . . . . . 23,370Graphic Designer . . . . . . . . . . . . . . . . . . . . . . 49,278Heavy Truck Driver . . . . . . . . . . . . . . . . . . . . . 42,220Insurance Claims Adjuster. . . . . . . . . . . . . . . 50,427
Internal Auditor . . . . . . . . . . . . . . . . . . . . . . . . . 63,159Janitor . . . . . . . . . . . . . . . . . . . . . . . . . . . . . . . . . 24,768Librarian . . . . . . . . . . . . . . . . . . . . . . . . . . . . . . . 48,499Light Truck Driver . . . . . . . . . . . . . . . . . . . . . . . 32,191Machine Tool Operator . . . . . . . . . . . . . . . . . . 38,232Machinery Mechanic. . . . . . . . . . . . . . . . . . . . . 46,603Maintenance Worker . . . . . . . . . . . . . . . . . . . . 41,424Market Research Analyst . . . . . . . . . . . . . . . . . 57,670Materials Handler . . . . . . . . . . . . . . . . . . . . . . . 29,304Mechanical Engineer . . . . . . . . . . . . . . . . . . . . 82,421Medical Lab Technician . . . . . . . . . . . . . . . . . . 37,051Millwright . . . . . . . . . . . . . . . . . . . . . . . . . . . . . . 49,841Office Manager . . . . . . . . . . . . . . . . . . . . . . . . . 51,573Order Clerk . . . . . . . . . . . . . . . . . . . . . . . . . . . . 32,073Painter . . . . . . . . . . . . . . . . . . . . . . . . . . . . . . . . . 37,224Payroll Clerk . . . . . . . . . . . . . . . . . . . . . . . . . . . . 39,788PC Specialist . . . . . . . . . . . . . . . . . . . . . . . . . . . 48,125Personnel Analyst . . . . . . . . . . . . . . . . . . . . . . . 60,671Personnel Clerk . . . . . . . . . . . . . . . . . . . . . . . . . 36,925Pharmacist . . . . . . . . . . . . . . . . . . . . . . . . . . . . 113,365Physical Therapist . . . . . . . . . . . . . . . . . . . . . . . 64,336Physician . . . . . . . . . . . . . . . . . . . . . . . . . . . . . . 170,750Physician's Assistant . . . . . . . . . . . . . . . . . . . . . 94,684Physicist, PhD. . . . . . . . . . . . . . . . . . . . . . . . . . 101,828Plumber . . . . . . . . . . . . . . . . . . . . . . . . . . . . . . . 48,396Primary School Teacher . . . . . . . . . . . . . . . . . . 43,508Production Supervisor . . . . . . . . . . . . . . . . . . . 56,555Property Manager . . . . . . . . . . . . . . . . . . . . . . . 62,144Receptionist . . . . . . . . . . . . . . . . . . . . . . . . . . . . 28,361Registered Nurse . . . . . . . . . . . . . . . . . . . . . . . 65,768Sales Representative . . . . . . . . . . . . . . . . . . . . 48,953Secondary School Teacher . . . . . . . . . . . . . . . 44,261Secretary. . . . . . . . . . . . . . . . . . . . . . . . . . . . . . . 32,281Secretary to CEO. . . . . . . . . . . . . . . . . . . . . . . . 63,281Security Guard. . . . . . . . . . . . . . . . . . . . . . . . . . 30,331Shipping Clerk. . . . . . . . . . . . . . . . . . . . . . . . . . 35,700Stationary Engineer . . . . . . . . . . . . . . . . . . . . . 53,343Systems Analyst . . . . . . . . . . . . . . . . . . . . . . . . . 70,600Systems Analyst, Lead . . . . . . . . . . . . . . . . . . . 89,239Tool & Die Maker. . . . . . . . . . . . . . . . . . . . . . . . 52,190Warehouse Worker . . . . . . . . . . . . . . . . . . . . . . 27,407Welder . . . . . . . . . . . . . . . . . . . . . . . . . . . . . . . . 42,561Word Processor . . . . . . . . . . . . . . . . . . . . . . . . . 36,017
(1) For employee with three years' experience.(2) For controller of company with $100 million revenue.Source: Economic Research Institute, Redmond, WA, January 1, 2018
JANUARY 2018 ESTIMATE OF ANNUAL MEDIAN BASE SALARIES, TULSA MSA(1)

For more information contact or visit:
Cary Phillips | +1 918 665 3830 | cbre.com/tulsa
CBRE knows Tulsa. Through our industry leading perspectives, scale and local connectivity, we deliver
outcomes that drive business and bottom-line performance for every client we serve in Tulsa. How can
we help transform your real estate into real advantage?
LOCALADVANTAGE.
Tulsa ranks No. 3 nationally for new and expanded facilities among Tier II cities (Site Selection 2016)
� No. 1 city among top 100 metros on growth and inclusion (Brookings Institute 2016)
� No. 1 city nationwide for young entrepreneurs (NerdWallet.com 2015)
� No. 2 best city for first-time homebuyers (SmartAsset.com 2016)
� No. 3 best north American city for energy (The World's Most Competitive Cities 2015)
� No. 5 Guthrie Green among top 14 coolest urban spaces in America (ThrilList.com 2015)
� No. 6 best state for lowest overall tax burden (WalletHub.com 2016)
Grow with us. Visit GrowMetroTulsa.com or call 800.624.6822
Brien Thorstenberg, CEcDSr. Vice President, Economic Development Tulsa Regional [email protected]

Over 37 Years HelpingIndividuals, Families and OrganizationsAchieve Financial Peace of Mind.
Protecting Your Assets | Growing Your Wealth | Advising You for LifeTrustOk.com | (918) 744-0553
Robert A. McCormick | Senior Executive Vice President & COOThomas W. Wilkins | President, Chairman & CEOJames F. Arens II | Executive Vice President & CIO

TulsaChamber.com