Embed Size (px)
Citation preview
2018 CO2 Emission Projections for the SESARM States
Prepared by:Byeong-Uk Kim, Jim Boylan, and Keith BentleyGA EPD – Air Protection BranchOctober 22, 2013
2
Background• The President’s climate action plan in June 2013
reiterated his 2009 goal of a 17% reduction in CO2 emissions by 2020 from a 2005 baseline.
• EGU emissions trending downward due to:– Lower natural gas prices– Closure of older inefficient units– Compliance with CAIR and MATS– Compliance with state rules– Increases in renewable energy and nuclear
• EPA seeking state input on how 111(d) requirements should be implemented
• Need reference point as starting point for discussions
3
Approach• Extracted 2018 heat input values by fuel type (coal, oil, gas)
from ERTAC EGU projection tool.– 2011 CAMD heat input data was used as the starting point for the
projections– Applied ERTAC growth factors by fuel type from the AEO 2013 Report– Applied emission controls submitted by the states
• Applied CO2 emission factors (TPY CO2/MMBTU) to projected 2018 heat inputs for each fuel type.– State specific CO2 emission factors (EFs) derived from 2005 CAMD
data for coal, oil, and gas– National CO2 emission factors for coal, oil, and gas
• Compared 2005 and 2011 CO2 emissions with 2018 projected CO2 emissions.
4
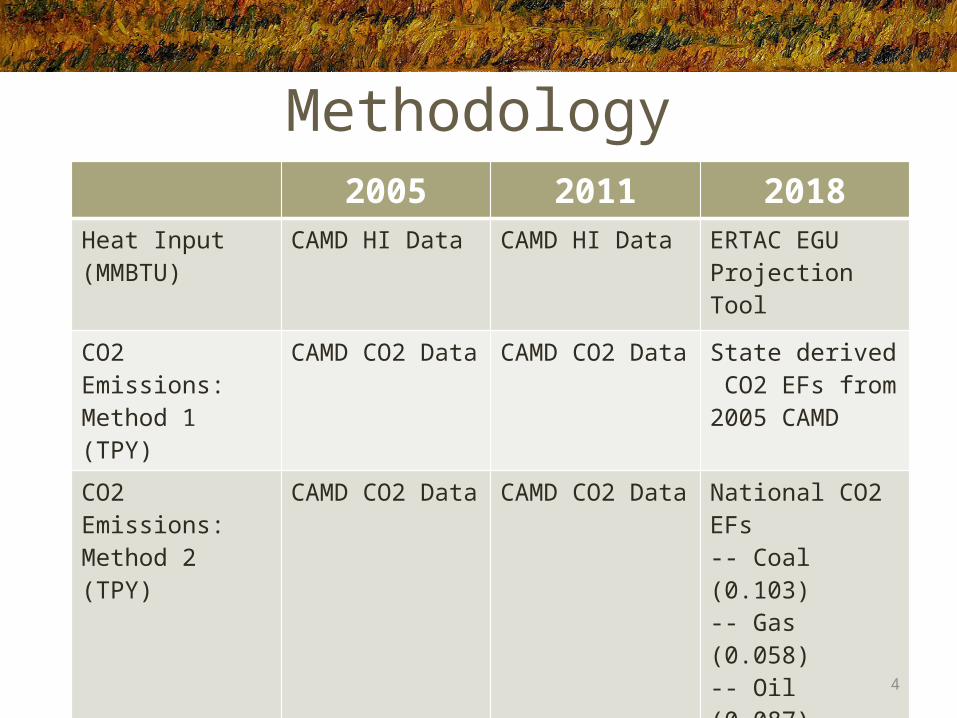
Methodology2005 2011 2018
Heat Input (MMBTU)
CAMD HI Data CAMD HI Data ERTAC EGU Projection Tool
CO2 Emissions: Method 1 (TPY)
CAMD CO2 Data CAMD CO2 Data State derived CO2 EFs from 2005 CAMD
CO2 Emissions: Method 2 (TPY)
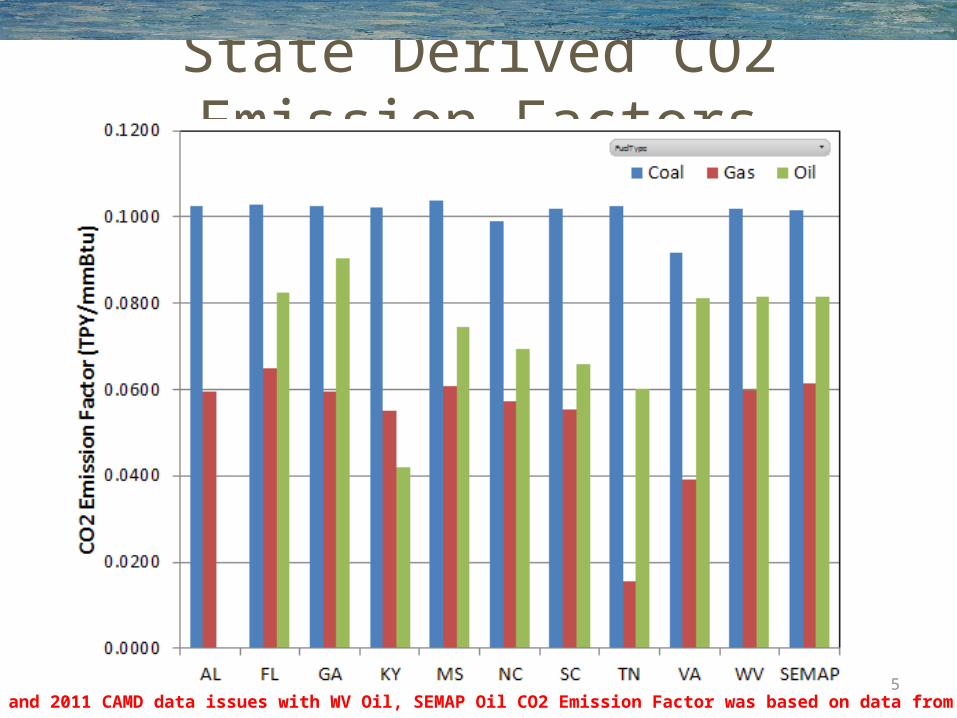
CAMD CO2 Data CAMD CO2 Data National CO2 EFs-- Coal (0.103)-- Gas (0.058)-- Oil (0.087)
CO2 Emissions: Method 3 (TPY)
National CO2 EFs-- Coal (0.103)-- Gas (0.058)-- Oil (0.087)
National CO2 EFs-- Coal (0.103)-- Gas (0.058)-- Oil (0.087)
National CO2 EFs-- Coal (0.103)-- Gas (0.058)-- Oil (0.087)
5
State Derived CO2 Emission Factors
*Due to 2005 and 2011 CAMD data issues with WV Oil, SEMAP Oil CO2 Emission Factor was based on data from nine states.
6
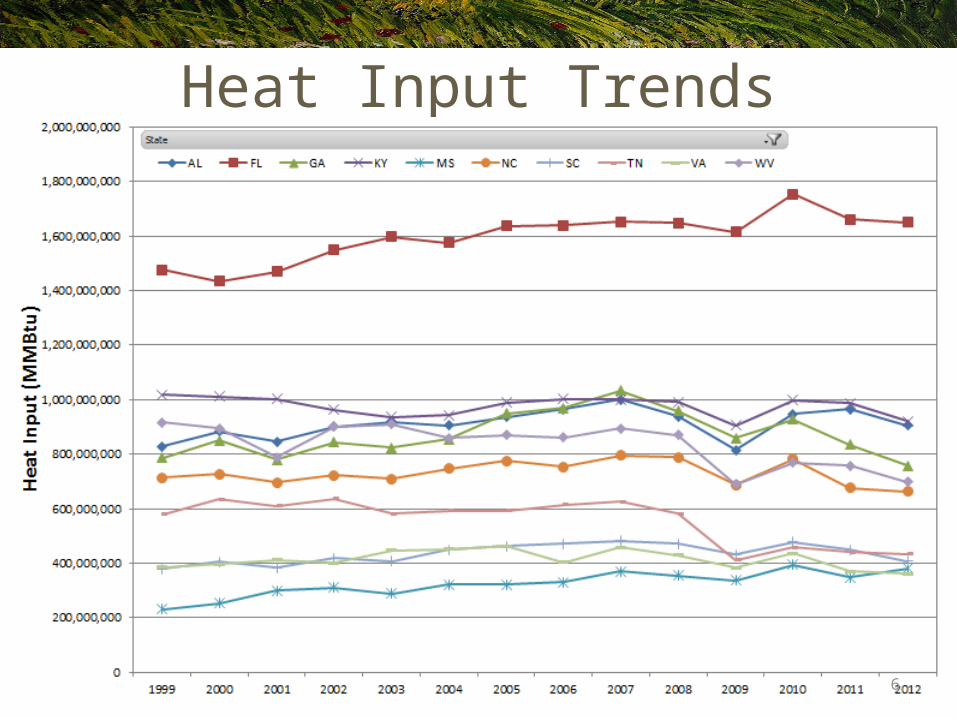
Heat Input Trends
7
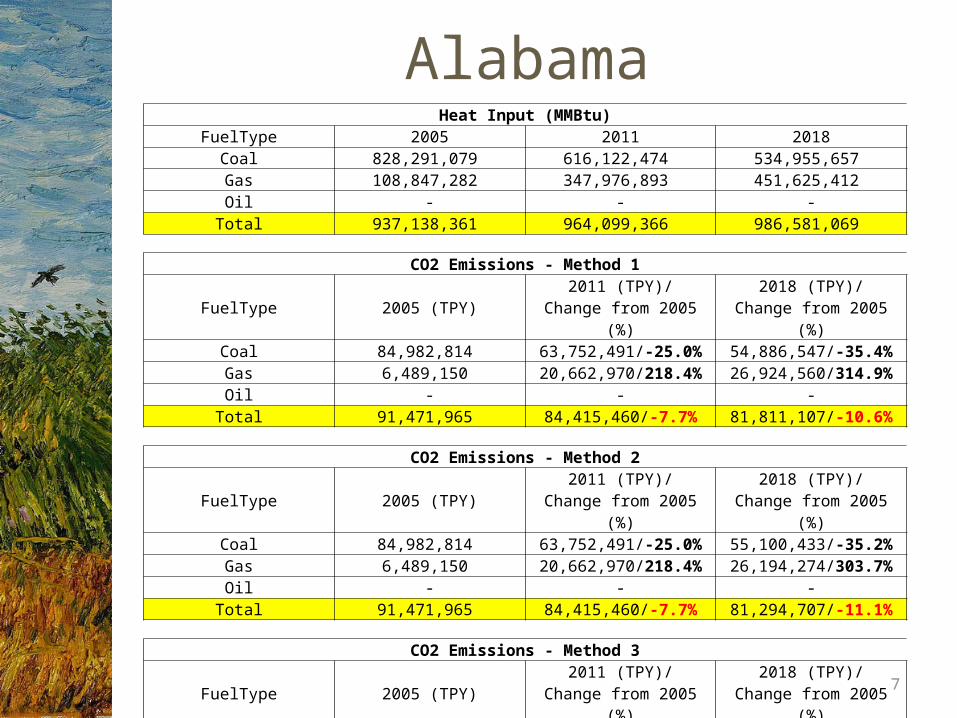
AlabamaHeat Input (MMBtu)
FuelType 2005 2011 2018Coal 828,291,079 616,122,474 534,955,657 Gas 108,847,282 347,976,893 451,625,412 Oil - - -
Total 937,138,361 964,099,366 986,581,069
CO2 Emissions - Method 1
FuelType 2005 (TPY) 2011 (TPY)/Change from 2005 (%)
2018 (TPY)/Change from 2005 (%)
Coal 84,982,814 63,752,491/-25.0% 54,886,547/-35.4%Gas 6,489,150 20,662,970/218.4% 26,924,560/314.9%Oil - - -
Total 91,471,965 84,415,460/-7.7% 81,811,107/-10.6%
CO2 Emissions - Method 2
FuelType 2005 (TPY) 2011 (TPY)/Change from 2005 (%)
2018 (TPY)/Change from 2005 (%)
Coal 84,982,814 63,752,491/-25.0% 55,100,433/-35.2%Gas 6,489,150 20,662,970/218.4% 26,194,274/303.7%Oil - - -
Total 91,471,965 84,415,460/-7.7% 81,294,707/-11.1%
CO2 Emissions - Method 3
FuelType 2005 (TPY) 2011 (TPY)/Change from 2005 (%)
2018 (TPY)/Change from 2005 (%)
Coal 85,313,981 63,460,615/-25.6% 55,100,433/-35.4%Gas 6,313,142 20,182,660/219.7% 26,194,274/314.9%Oil - - -
Total 91,627,123 83,643,275/-8.7% 81,294,707/-11.3%
8
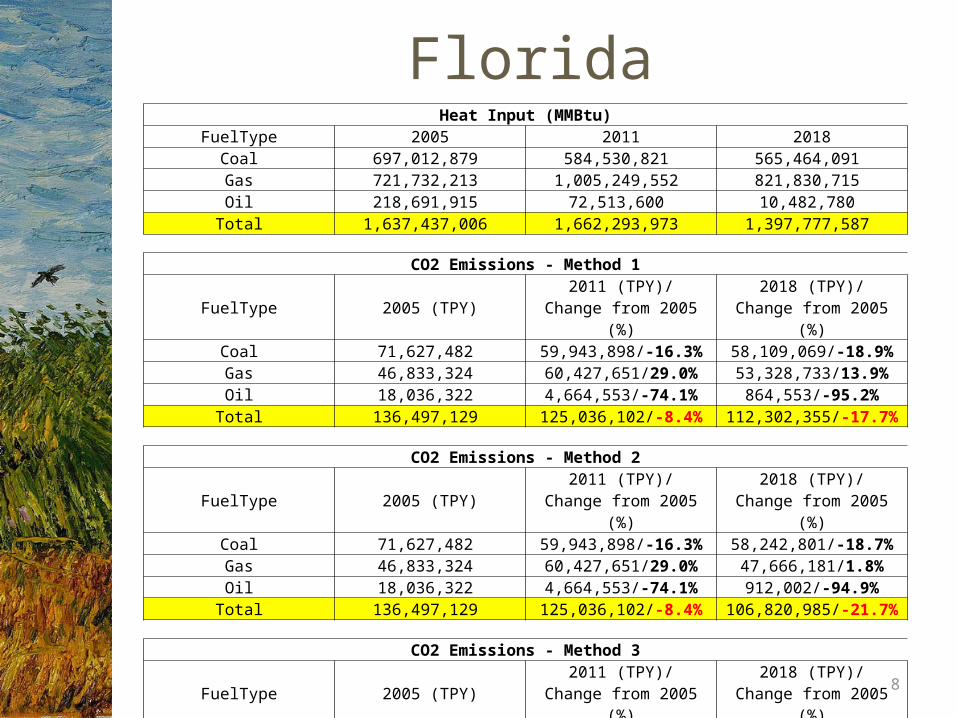
FloridaHeat Input (MMBtu)
FuelType 2005 2011 2018Coal 697,012,879 584,530,821 565,464,091 Gas 721,732,213 1,005,249,552 821,830,715 Oil 218,691,915 72,513,600 10,482,780
Total 1,637,437,006 1,662,293,973 1,397,777,587
CO2 Emissions - Method 1
FuelType 2005 (TPY) 2011 (TPY)/Change from 2005 (%)
2018 (TPY)/Change from 2005 (%)
Coal 71,627,482 59,943,898/-16.3% 58,109,069/-18.9%Gas 46,833,324 60,427,651/29.0% 53,328,733/13.9%Oil 18,036,322 4,664,553/-74.1% 864,553/-95.2%
Total 136,497,129 125,036,102/-8.4% 112,302,355/-17.7%
CO2 Emissions - Method 2
FuelType 2005 (TPY) 2011 (TPY)/Change from 2005 (%)
2018 (TPY)/Change from 2005 (%)
Coal 71,627,482 59,943,898/-16.3% 58,242,801/-18.7%Gas 46,833,324 60,427,651/29.0% 47,666,181/1.8%Oil 18,036,322 4,664,553/-74.1% 912,002/-94.9%
Total 136,497,129 125,036,102/-8.4% 106,820,985/-21.7%
CO2 Emissions - Method 3
FuelType 2005 (TPY) 2011 (TPY)/Change from 2005 (%)
2018 (TPY)/Change from 2005 (%)
Coal 71,792,327 60,206,675/-16.1% 58,242,801/-18.9%Gas 41,860,468 58,304,474/39.3% 47,666,181/13.9%Oil 19,026,197 6,308,683/-66.8% 912,002/-95.2%
Total 132,678,991 124,819,832/-5.9% 106,820,985/-19.5%
9
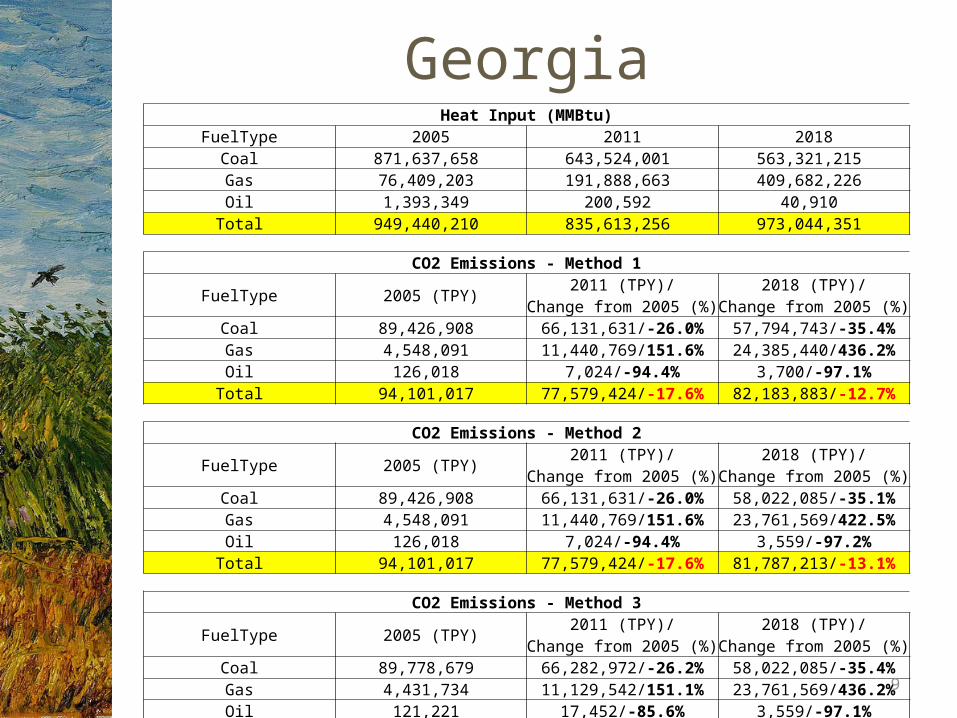
GeorgiaHeat Input (MMBtu)
FuelType 2005 2011 2018Coal 871,637,658 643,524,001 563,321,215 Gas 76,409,203 191,888,663 409,682,226 Oil 1,393,349 200,592 40,910
Total 949,440,210 835,613,256 973,044,351
CO2 Emissions - Method 1
FuelType 2005 (TPY) 2011 (TPY)/Change from 2005 (%)
2018 (TPY)/Change from 2005 (%)
Coal 89,426,908 66,131,631/-26.0% 57,794,743/-35.4%Gas 4,548,091 11,440,769/151.6% 24,385,440/436.2%Oil 126,018 7,024/-94.4% 3,700/-97.1%
Total 94,101,017 77,579,424/-17.6% 82,183,883/-12.7%
CO2 Emissions - Method 2
FuelType 2005 (TPY) 2011 (TPY)/Change from 2005 (%)
2018 (TPY)/Change from 2005 (%)
Coal 89,426,908 66,131,631/-26.0% 58,022,085/-35.1%Gas 4,548,091 11,440,769/151.6% 23,761,569/422.5%Oil 126,018 7,024/-94.4% 3,559/-97.2%
Total 94,101,017 77,579,424/-17.6% 81,787,213/-13.1%
CO2 Emissions - Method 3
FuelType 2005 (TPY) 2011 (TPY)/Change from 2005 (%)
2018 (TPY)/Change from 2005 (%)
Coal 89,778,679 66,282,972/-26.2% 58,022,085/-35.4%Gas 4,431,734 11,129,542/151.1% 23,761,569/436.2%Oil 121,221 17,452/-85.6% 3,559/-97.1%
Total 94,331,634 77,429,966/-17.9% 81,787,213/-13.3%
10
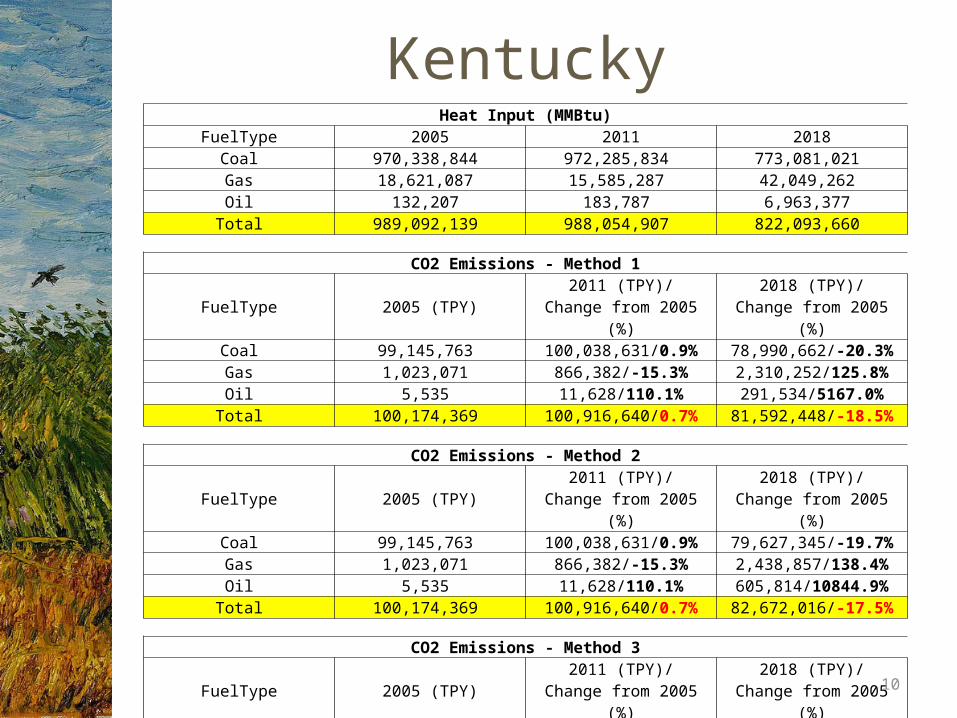
KentuckyHeat Input (MMBtu)
FuelType 2005 2011 2018Coal 970,338,844 972,285,834 773,081,021 Gas 18,621,087 15,585,287 42,049,262 Oil 132,207 183,787 6,963,377
Total 989,092,139 988,054,907 822,093,660
CO2 Emissions - Method 1
FuelType 2005 (TPY) 2011 (TPY)/Change from 2005 (%)
2018 (TPY)/Change from 2005 (%)
Coal 99,145,763 100,038,631/0.9% 78,990,662/-20.3%Gas 1,023,071 866,382/-15.3% 2,310,252/125.8%Oil 5,535 11,628/110.1% 291,534/5167.0%
Total 100,174,369 100,916,640/0.7% 81,592,448/-18.5%
CO2 Emissions - Method 2
FuelType 2005 (TPY) 2011 (TPY)/Change from 2005 (%)
2018 (TPY)/Change from 2005 (%)
Coal 99,145,763 100,038,631/0.9% 79,627,345/-19.7%Gas 1,023,071 866,382/-15.3% 2,438,857/138.4%Oil 5,535 11,628/110.1% 605,814/10844.9%
Total 100,174,369 100,916,640/0.7% 82,672,016/-17.5%
CO2 Emissions - Method 3
FuelType 2005 (TPY) 2011 (TPY)/Change from 2005 (%)
2018 (TPY)/Change from 2005 (%)
Coal 99,944,901 100,145,441/0.2% 79,627,345/-20.3%Gas 1,080,023 903,947/-16.3% 2,438,857/125.8%Oil 11,502 15,989/39.0% 605,814/5167.0%
Total 101,036,426 101,065,377/0.0% 82,672,016/-18.2%
11
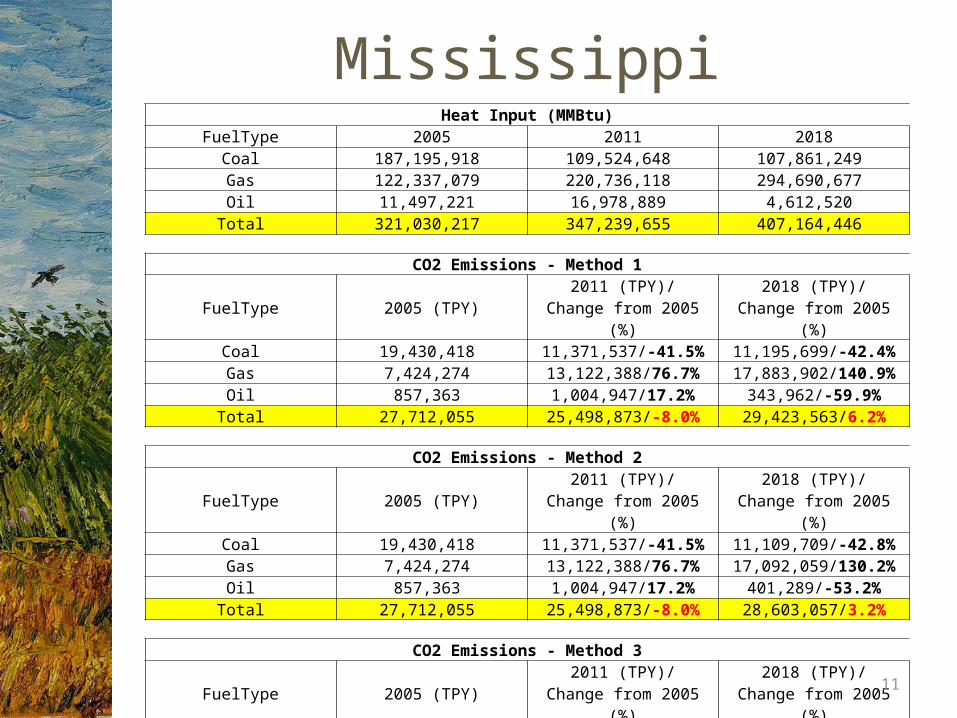
MississippiHeat Input (MMBtu)
FuelType 2005 2011 2018Coal 187,195,918 109,524,648 107,861,249 Gas 122,337,079 220,736,118 294,690,677 Oil 11,497,221 16,978,889 4,612,520
Total 321,030,217 347,239,655 407,164,446
CO2 Emissions - Method 1
FuelType 2005 (TPY) 2011 (TPY)/Change from 2005 (%)
2018 (TPY)/Change from 2005 (%)
Coal 19,430,418 11,371,537/-41.5% 11,195,699/-42.4%Gas 7,424,274 13,122,388/76.7% 17,883,902/140.9%Oil 857,363 1,004,947/17.2% 343,962/-59.9%
Total 27,712,055 25,498,873/-8.0% 29,423,563/6.2%
CO2 Emissions - Method 2
FuelType 2005 (TPY) 2011 (TPY)/Change from 2005 (%)
2018 (TPY)/Change from 2005 (%)
Coal 19,430,418 11,371,537/-41.5% 11,109,709/-42.8%Gas 7,424,274 13,122,388/76.7% 17,092,059/130.2%Oil 857,363 1,004,947/17.2% 401,289/-53.2%
Total 27,712,055 25,498,873/-8.0% 28,603,057/3.2%
CO2 Emissions - Method 3
FuelType 2005 (TPY) 2011 (TPY)/Change from 2005 (%)
2018 (TPY)/Change from 2005 (%)
Coal 19,281,180 11,281,039/-41.5% 11,109,709/-42.4%Gas 7,095,551 12,802,695/80.4% 17,092,059/140.9%Oil 1,000,258 1,477,163/47.7% 401,289/-59.9%
Total 27,376,988 25,560,897/-6.6% 28,603,057/4.5%
12
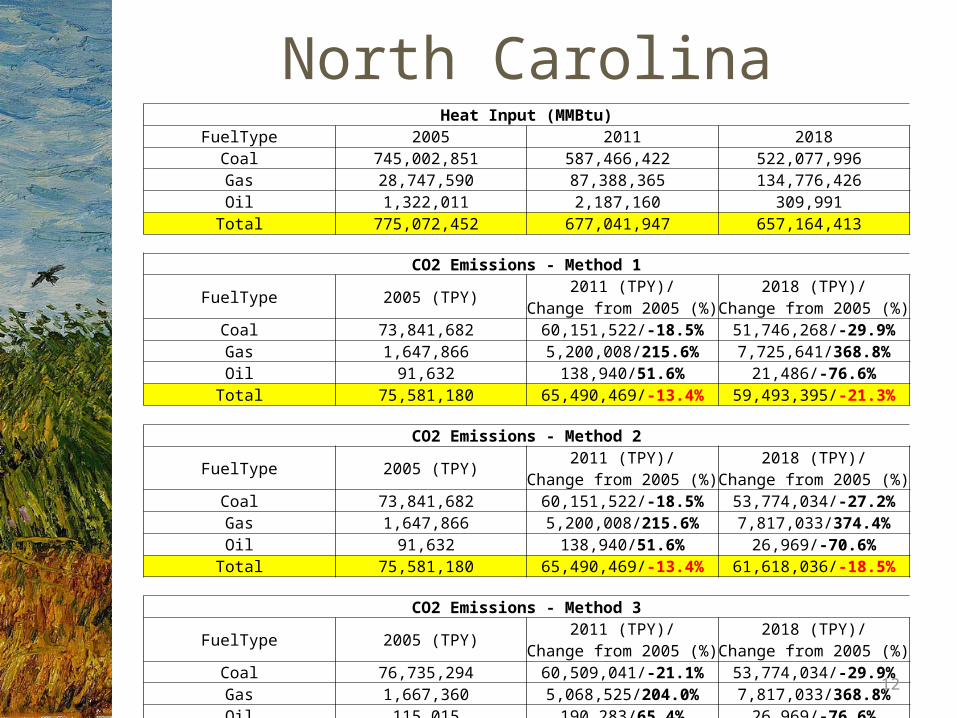
North CarolinaHeat Input (MMBtu)
FuelType 2005 2011 2018Coal 745,002,851 587,466,422 522,077,996 Gas 28,747,590 87,388,365 134,776,426 Oil 1,322,011 2,187,160 309,991
Total 775,072,452 677,041,947 657,164,413
CO2 Emissions - Method 1
FuelType 2005 (TPY) 2011 (TPY)/Change from 2005 (%)
2018 (TPY)/Change from 2005 (%)
Coal 73,841,682 60,151,522/-18.5% 51,746,268/-29.9%Gas 1,647,866 5,200,008/215.6% 7,725,641/368.8%Oil 91,632 138,940/51.6% 21,486/-76.6%
Total 75,581,180 65,490,469/-13.4% 59,493,395/-21.3%
CO2 Emissions - Method 2
FuelType 2005 (TPY) 2011 (TPY)/Change from 2005 (%)
2018 (TPY)/Change from 2005 (%)
Coal 73,841,682 60,151,522/-18.5% 53,774,034/-27.2%Gas 1,647,866 5,200,008/215.6% 7,817,033/374.4%Oil 91,632 138,940/51.6% 26,969/-70.6%
Total 75,581,180 65,490,469/-13.4% 61,618,036/-18.5%
CO2 Emissions - Method 3
FuelType 2005 (TPY) 2011 (TPY)/Change from 2005 (%)
2018 (TPY)/Change from 2005 (%)
Coal 76,735,294 60,509,041/-21.1% 53,774,034/-29.9%Gas 1,667,360 5,068,525/204.0% 7,817,033/368.8%Oil 115,015 190,283/65.4% 26,969/-76.6%
Total 78,517,669 65,767,850/-16.2% 61,618,036/-21.5%
13
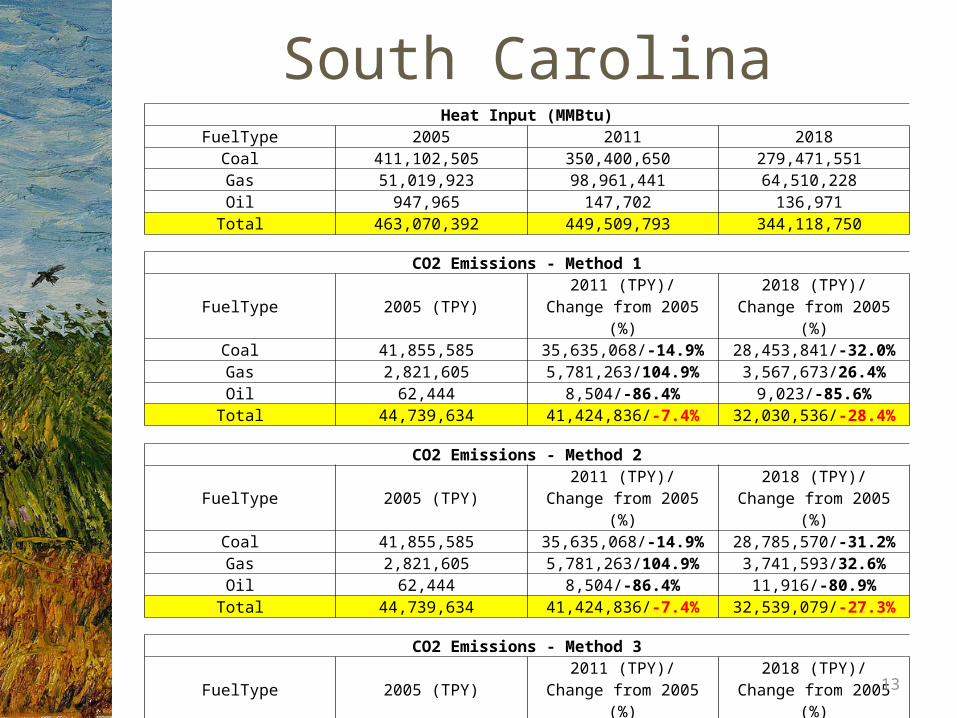
South CarolinaHeat Input (MMBtu)
FuelType 2005 2011 2018Coal 411,102,505 350,400,650 279,471,551 Gas 51,019,923 98,961,441 64,510,228 Oil 947,965 147,702 136,971
Total 463,070,392 449,509,793 344,118,750
CO2 Emissions - Method 1
FuelType 2005 (TPY) 2011 (TPY)/Change from 2005 (%)
2018 (TPY)/Change from 2005 (%)
Coal 41,855,585 35,635,068/-14.9% 28,453,841/-32.0%Gas 2,821,605 5,781,263/104.9% 3,567,673/26.4%Oil 62,444 8,504/-86.4% 9,023/-85.6%
Total 44,739,634 41,424,836/-7.4% 32,030,536/-28.4%
CO2 Emissions - Method 2
FuelType 2005 (TPY) 2011 (TPY)/Change from 2005 (%)
2018 (TPY)/Change from 2005 (%)
Coal 41,855,585 35,635,068/-14.9% 28,785,570/-31.2%Gas 2,821,605 5,781,263/104.9% 3,741,593/32.6%Oil 62,444 8,504/-86.4% 11,916/-80.9%
Total 44,739,634 41,424,836/-7.4% 32,539,079/-27.3%
CO2 Emissions - Method 3
FuelType 2005 (TPY) 2011 (TPY)/Change from 2005 (%)
2018 (TPY)/Change from 2005 (%)
Coal 42,343,558 36,091,267/-14.8% 28,785,570/-32.0%Gas 2,959,156 5,739,764/94.0% 3,741,593/26.4%Oil 82,473 12,850/-84.4% 11,916/-85.6%
Total 45,385,186 41,843,881/-7.8% 32,539,079/-28.3%
14
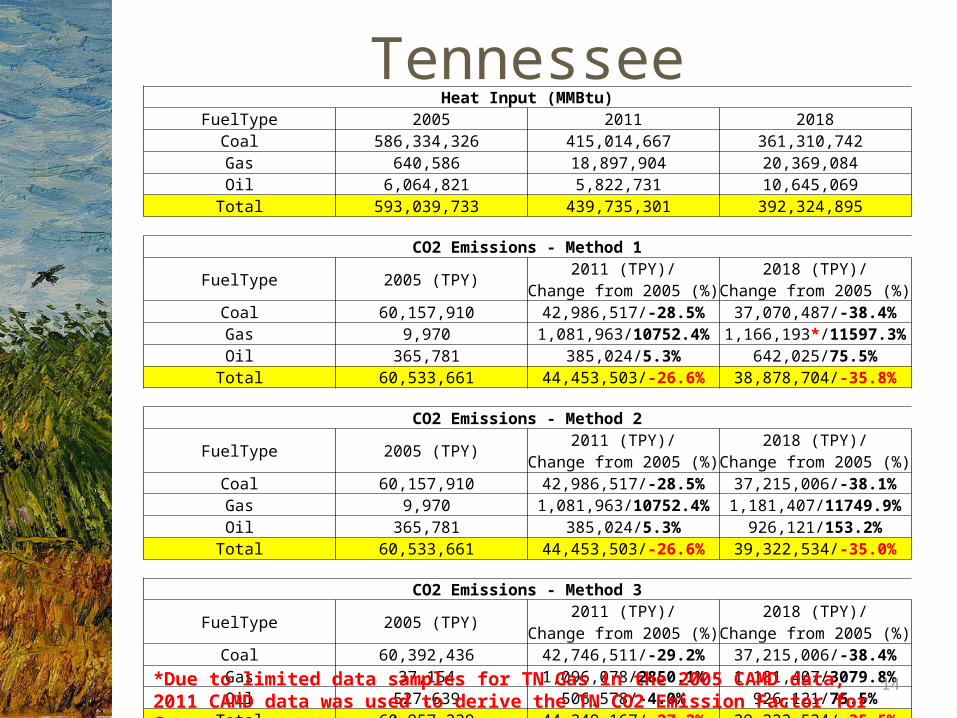
TennesseeHeat Input (MMBtu)
FuelType 2005 2011 2018Coal 586,334,326 415,014,667 361,310,742 Gas 640,586 18,897,904 20,369,084 Oil 6,064,821 5,822,731 10,645,069
Total 593,039,733 439,735,301 392,324,895
CO2 Emissions - Method 1
FuelType 2005 (TPY) 2011 (TPY)/Change from 2005 (%)
2018 (TPY)/Change from 2005 (%)
Coal 60,157,910 42,986,517/-28.5% 37,070,487/-38.4%Gas 9,970 1,081,963/10752.4% 1,166,193*/11597.3%Oil 365,781 385,024/5.3% 642,025/75.5%
Total 60,533,661 44,453,503/-26.6% 38,878,704/-35.8%
CO2 Emissions - Method 2
FuelType 2005 (TPY) 2011 (TPY)/Change from 2005 (%)
2018 (TPY)/Change from 2005 (%)
Coal 60,157,910 42,986,517/-28.5% 37,215,006/-38.1%Gas 9,970 1,081,963/10752.4% 1,181,407/11749.9%Oil 365,781 385,024/5.3% 926,121/153.2%
Total 60,533,661 44,453,503/-26.6% 39,322,534/-35.0%
CO2 Emissions - Method 3
FuelType 2005 (TPY) 2011 (TPY)/Change from 2005 (%)
2018 (TPY)/Change from 2005 (%)
Coal 60,392,436 42,746,511/-29.2% 37,215,006/-38.4%Gas 37,154 1,096,078/2850.1% 1,181,407/3079.8%Oil 527,639 506,578/-4.0% 926,121/75.5%
Total 60,957,229 44,349,167/-27.2% 39,322,534/-35.5%
*Due to limited data samples for TN Gas in the 2005 CAMD data, 2011 CAMD data was used to derive the TN CO2 Emission Factor for Gas.
15
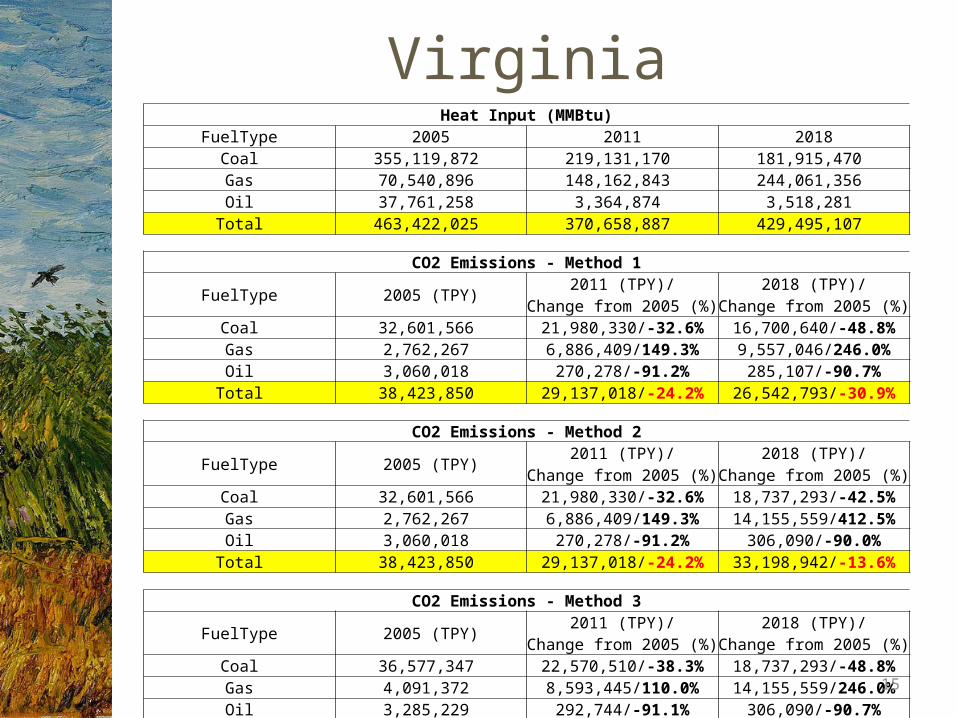
VirginiaHeat Input (MMBtu)
FuelType 2005 2011 2018Coal 355,119,872 219,131,170 181,915,470 Gas 70,540,896 148,162,843 244,061,356 Oil 37,761,258 3,364,874 3,518,281
Total 463,422,025 370,658,887 429,495,107
CO2 Emissions - Method 1
FuelType 2005 (TPY) 2011 (TPY)/Change from 2005 (%)
2018 (TPY)/Change from 2005 (%)
Coal 32,601,566 21,980,330/-32.6% 16,700,640/-48.8%Gas 2,762,267 6,886,409/149.3% 9,557,046/246.0%Oil 3,060,018 270,278/-91.2% 285,107/-90.7%
Total 38,423,850 29,137,018/-24.2% 26,542,793/-30.9%
CO2 Emissions - Method 2
FuelType 2005 (TPY) 2011 (TPY)/Change from 2005 (%)
2018 (TPY)/Change from 2005 (%)
Coal 32,601,566 21,980,330/-32.6% 18,737,293/-42.5%Gas 2,762,267 6,886,409/149.3% 14,155,559/412.5%Oil 3,060,018 270,278/-91.2% 306,090/-90.0%
Total 38,423,850 29,137,018/-24.2% 33,198,942/-13.6%
CO2 Emissions - Method 3
FuelType 2005 (TPY) 2011 (TPY)/Change from 2005 (%)
2018 (TPY)/Change from 2005 (%)
Coal 36,577,347 22,570,510/-38.3% 18,737,293/-48.8%Gas 4,091,372 8,593,445/110.0% 14,155,559/246.0%Oil 3,285,229 292,744/-91.1% 306,090/-90.7%
Total 43,953,948 31,456,699/-28.4% 33,198,942/-24.5%
16
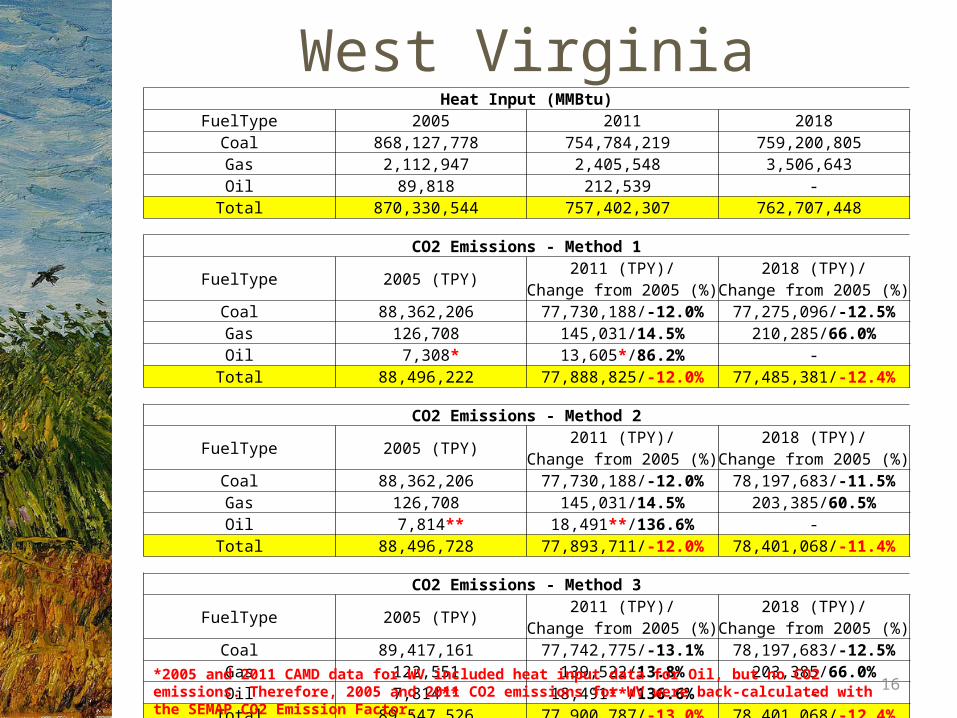
West VirginiaHeat Input (MMBtu)
FuelType 2005 2011 2018Coal 868,127,778 754,784,219 759,200,805 Gas 2,112,947 2,405,548 3,506,643 Oil 89,818 212,539 -
Total 870,330,544 757,402,307 762,707,448
CO2 Emissions - Method 1
FuelType 2005 (TPY) 2011 (TPY)/Change from 2005 (%)
2018 (TPY)/Change from 2005 (%)
Coal 88,362,206 77,730,188/-12.0% 77,275,096/-12.5%Gas 126,708 145,031/14.5% 210,285/66.0%Oil 7,308* 13,605*/86.2% -
Total 88,496,222 77,888,825/-12.0% 77,485,381/-12.4%
CO2 Emissions - Method 2
FuelType 2005 (TPY) 2011 (TPY)/Change from 2005 (%)
2018 (TPY)/Change from 2005 (%)
Coal 88,362,206 77,730,188/-12.0% 78,197,683/-11.5%Gas 126,708 145,031/14.5% 203,385/60.5%Oil 7,814** 18,491**/136.6% -
Total 88,496,728 77,893,711/-12.0% 78,401,068/-11.4%
CO2 Emissions - Method 3
FuelType 2005 (TPY) 2011 (TPY)/Change from 2005 (%)
2018 (TPY)/Change from 2005 (%)
Coal 89,417,161 77,742,775/-13.1% 78,197,683/-12.5%Gas 122,551 139,522/13.8% 203,385/66.0%Oil 7,814** 18,491**/136.6% -
Total 89,547,526 77,900,787/-13.0% 78,401,068/-12.4%
*2005 and 2011 CAMD data for WV included heat input data for Oil, but no CO2 emissions. Therefore, 2005 and 2011 CO2 emissions for WV were back-calculated with the SEMAP CO2 Emission Factor.**2005 and 2011 CO2 emissions for WV were back-calculated with the National CO2 Emission Factor.
17
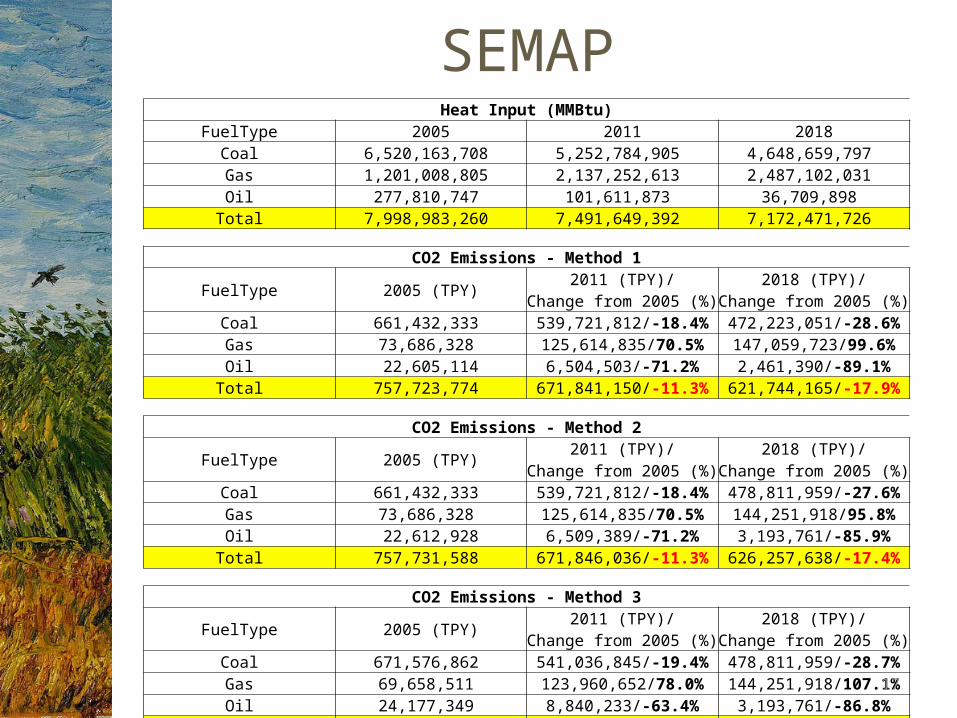
SEMAPHeat Input (MMBtu)
FuelType 2005 2011 2018Coal 6,520,163,708 5,252,784,905 4,648,659,797 Gas 1,201,008,805 2,137,252,613 2,487,102,031 Oil 277,810,747 101,611,873 36,709,898
Total 7,998,983,260 7,491,649,392 7,172,471,726
CO2 Emissions - Method 1
FuelType 2005 (TPY) 2011 (TPY)/Change from 2005 (%)
2018 (TPY)/Change from 2005 (%)
Coal 661,432,333 539,721,812/-18.4% 472,223,051/-28.6%Gas 73,686,328 125,614,835/70.5% 147,059,723/99.6%Oil 22,605,114 6,504,503/-71.2% 2,461,390/-89.1%
Total 757,723,774 671,841,150/-11.3% 621,744,165/-17.9%
CO2 Emissions - Method 2
FuelType 2005 (TPY) 2011 (TPY)/Change from 2005 (%)
2018 (TPY)/Change from 2005 (%)
Coal 661,432,333 539,721,812/-18.4% 478,811,959/-27.6%Gas 73,686,328 125,614,835/70.5% 144,251,918/95.8%Oil 22,612,928 6,509,389/-71.2% 3,193,761/-85.9%
Total 757,731,588 671,846,036/-11.3% 626,257,638/-17.4%
CO2 Emissions - Method 3
FuelType 2005 (TPY) 2011 (TPY)/Change from 2005 (%)
2018 (TPY)/Change from 2005 (%)
Coal 671,576,862 541,036,845/-19.4% 478,811,959/-28.7%Gas 69,658,511 123,960,652/78.0% 144,251,918/107.1%Oil 24,177,349 8,840,233/-63.4% 3,193,761/-86.8%
Total 765,412,722 673,837,730/-12.0% 626,257,638/-18.2%
18
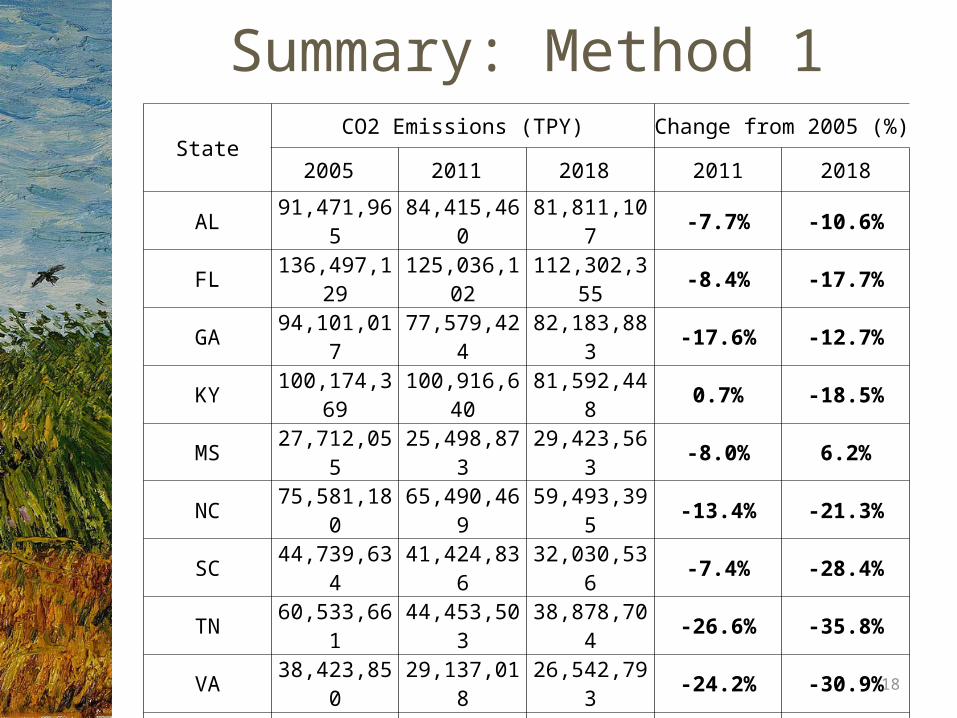
Summary: Method 1State
CO2 Emissions (TPY) Change from 2005 (%)
2005 2011 2018 2011 2018
AL 91,471,965 84,415,460 81,811,107 -7.7% -10.6%
FL 136,497,129 125,036,102 112,302,355 -8.4% -17.7%
GA 94,101,017 77,579,424 82,183,883 -17.6% -12.7%
KY 100,174,369 100,916,640 81,592,448 0.7% -18.5%
MS 27,712,055 25,498,873 29,423,563 -8.0% 6.2%
NC 75,581,180 65,490,469 59,493,395 -13.4% -21.3%
SC 44,739,634 41,424,836 32,030,536 -7.4% -28.4%
TN 60,533,661 44,453,503 38,878,704 -26.6% -35.8%
VA 38,423,850 29,137,018 26,542,793 -24.2% -30.9%
WV 88,496,222 77,888,825 77,485,381 -12.0% -12.4%
SEMAP 757,723,774 671,841,150 621,744,165 -11.3% -17.9%
19
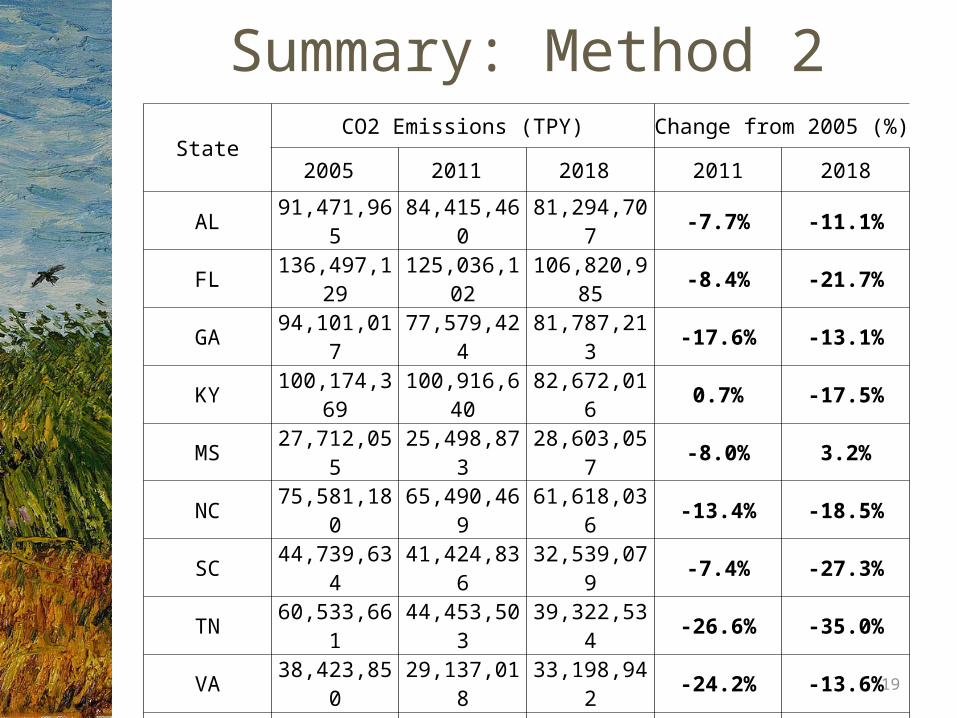
Summary: Method 2State
CO2 Emissions (TPY) Change from 2005 (%)
2005 2011 2018 2011 2018
AL 91,471,965 84,415,460 81,294,707 -7.7% -11.1%
FL 136,497,129 125,036,102 106,820,985 -8.4% -21.7%
GA 94,101,017 77,579,424 81,787,213 -17.6% -13.1%
KY 100,174,369 100,916,640 82,672,016 0.7% -17.5%
MS 27,712,055 25,498,873 28,603,057 -8.0% 3.2%
NC 75,581,180 65,490,469 61,618,036 -13.4% -18.5%
SC 44,739,634 41,424,836 32,539,079 -7.4% -27.3%
TN 60,533,661 44,453,503 39,322,534 -26.6% -35.0%
VA 38,423,850 29,137,018 33,198,942 -24.2% -13.6%
WV 88,496,728 77,893,711 78,401,068 -12.0% -11.4%
SEMAP 757,731,588 671,846,036 626,257,638 -11.3% -17.4%

20
Summary: Method 3State
CO2 Emissions (TPY) Change from 2005 (%)
2005 2011 2018 2011 2018
AL 91,627,123 83,643,275 81,294,707 -8.7% -11.3%
FL 132,678,991 124,819,832 106,820,985 -5.9% -19.5%
GA 94,331,634 77,429,966 81,787,213 -17.9% -13.3%
KY 101,036,426 101,065,377 82,672,016 0.0% -18.2%
MS 27,376,988 25,560,897 28,603,057 -6.6% 4.5%
NC 78,517,669 65,767,850 61,618,036 -16.2% -21.5%
SC 45,385,186 41,843,881 32,539,079 -7.8% -28.3%
TN 60,957,229 44,349,167 39,322,534 -27.2% -35.5%
VA 43,953,948 31,456,699 33,198,942 -28.4% -24.5%
WV 89,547,526 77,900,787 78,401,068 -13.0% -12.4%
SEMAP 765,412,722 673,837,730 626,257,638 -12.0% -18.2%
21
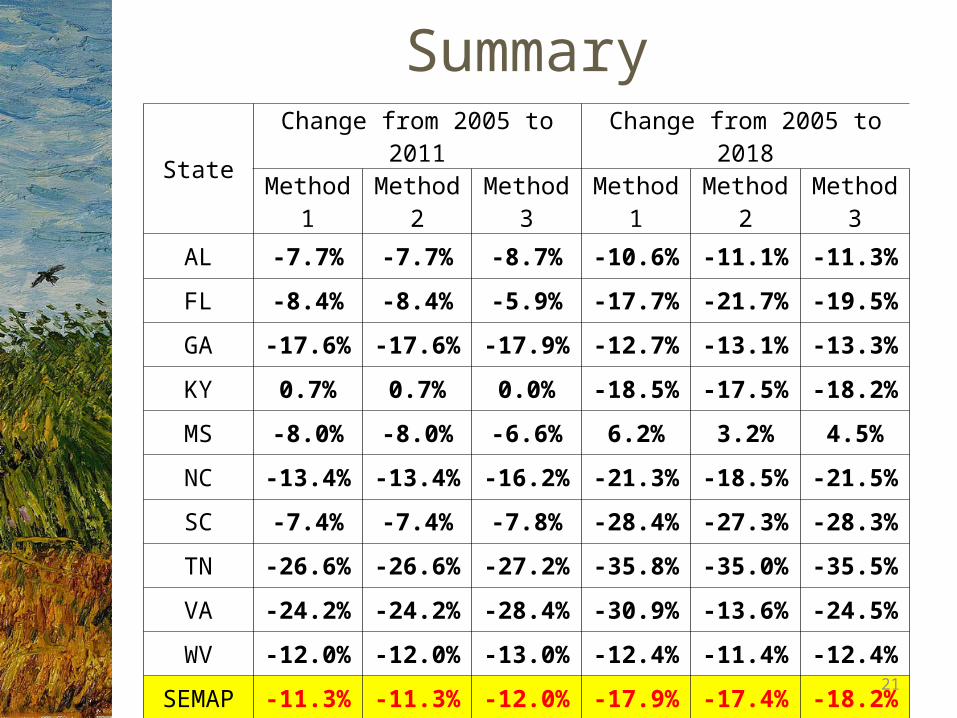
SummaryState
Change from 2005 to 2011 Change from 2005 to 2018
Method 1 Method 2 Method 3 Method 1 Method 2 Method 3
AL -7.7% -7.7% -8.7% -10.6% -11.1% -11.3%
FL -8.4% -8.4% -5.9% -17.7% -21.7% -19.5%
GA -17.6% -17.6% -17.9% -12.7% -13.1% -13.3%
KY 0.7% 0.7% 0.0% -18.5% -17.5% -18.2%
MS -8.0% -8.0% -6.6% 6.2% 3.2% 4.5%
NC -13.4% -13.4% -16.2% -21.3% -18.5% -21.5%
SC -7.4% -7.4% -7.8% -28.4% -27.3% -28.3%
TN -26.6% -26.6% -27.2% -35.8% -35.0% -35.5%
VA -24.2% -24.2% -28.4% -30.9% -13.6% -24.5%
WV -12.0% -12.0% -13.0% -12.4% -11.4% -12.4%
SEMAP -11.3% -11.3% -12.0% -17.9% -17.4% -18.2%
22
Conclusions• Different methods give
slightly different results• Percent reduction varies
between states• Need closer examination
of data and assumptions• SEMAP states overall
project 17-18% reduction from 2005-2018
• Some people are happier than others about the situation