Embed Size (px)
Citation preview
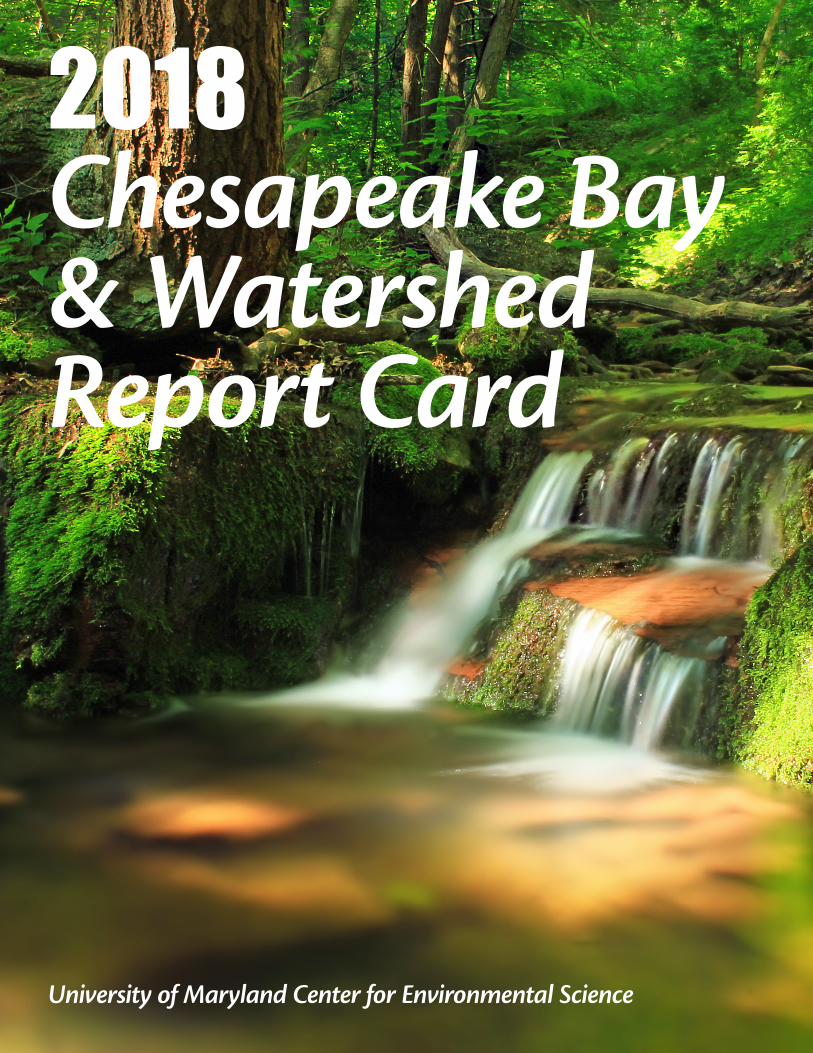
Chesapeake Bay & Watershed Report Card
2018
University of Maryland Center for Environmental Science
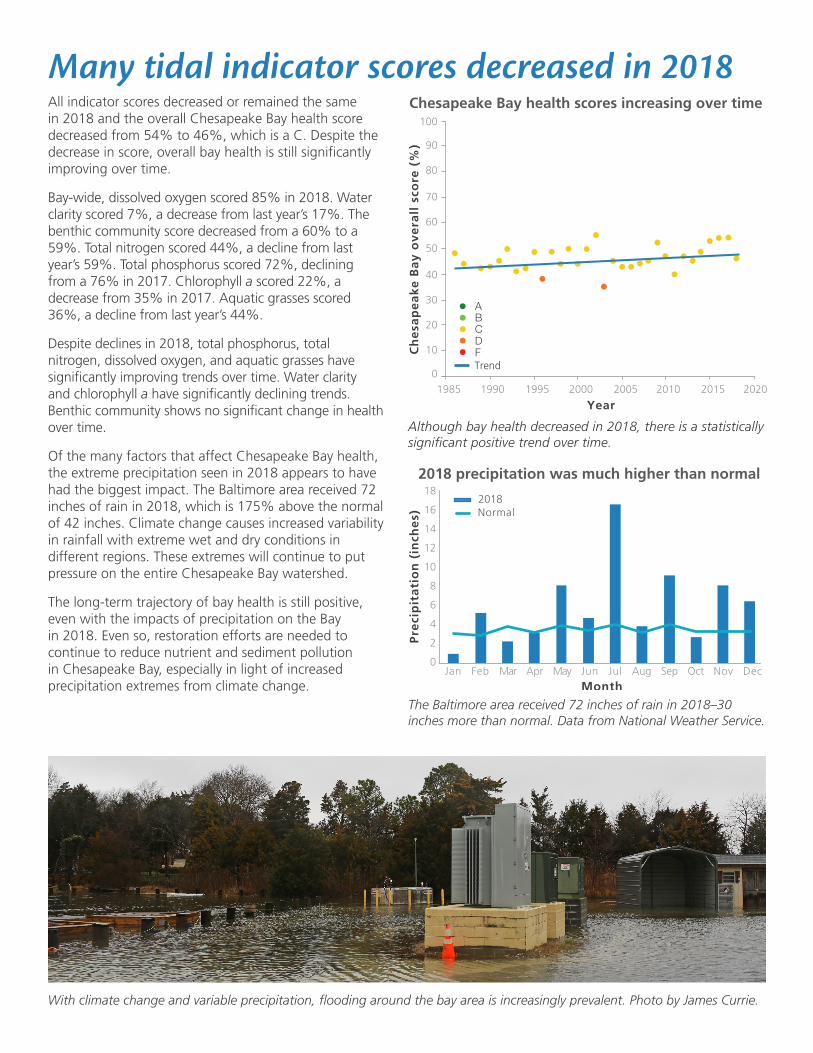
Many tidal indicator scores decreased in 2018All indicator scores decreased or remained the same in 2018 and the overall Chesapeake Bay health score decreased from 54% to 46%, which is a C. Despite the decrease in score, overall bay health is still significantly improving over time.
Bay-wide, dissolved oxygen scored 85% in 2018. Water clarity scored 7%, a decrease from last year’s 17%. The benthic community score decreased from a 60% to a 59%. Total nitrogen scored 44%, a decline from last year’s 59%. Total phosphorus scored 72%, declining from a 76% in 2017. Chlorophyll a scored 22%, a decrease from 35% in 2017. Aquatic grasses scored 36%, a decline from last year’s 44%.
Despite declines in 2018, total phosphorus, total nitrogen, dissolved oxygen, and aquatic grasses have significantly improving trends over time. Water clarity and chlorophyll a have significantly declining trends. Benthic community shows no significant change in health over time.
Of the many factors that affect Chesapeake Bay health, the extreme precipitation seen in 2018 appears to have had the biggest impact. The Baltimore area received 72 inches of rain in 2018, which is 175% above the normal of 42 inches. Climate change causes increased variability in rainfall with extreme wet and dry conditions in different regions. These extremes will continue to put pressure on the entire Chesapeake Bay watershed.
The long-term trajectory of bay health is still positive, even with the impacts of precipitation on the Bay in 2018. Even so, restoration efforts are needed to continue to reduce nutrient and sediment pollution in Chesapeake Bay, especially in light of increased precipitation extremes from climate change.
Although bay health decreased in 2018, there is a statistically significant positive trend over time.
The Baltimore area received 72 inches of rain in 2018–30 inches more than normal. Data from National Weather Service.
With climate change and variable precipitation, flooding around the bay area is increasingly prevalent. Photo by James Currie.
0
10
20
30
40
50
60
70
80
90
100
1985 1990 1995 2000 2005 2010 2015 2020
Trend
Ch
esa
pe
ak
e B
ay
ov
era
ll s
core
(%
)Year
ABCDF
Chesapeake Bay health scores increasing over time
0
2
4
6
8
10
12
14
16
18
Jan Feb Mar Apr May Jun Jul Aug Sep Oct Nov Dec
2018 precipitation was much higher than normal
2018Normal
Pre
cip
ita
tio
n (
inch
es)
Month
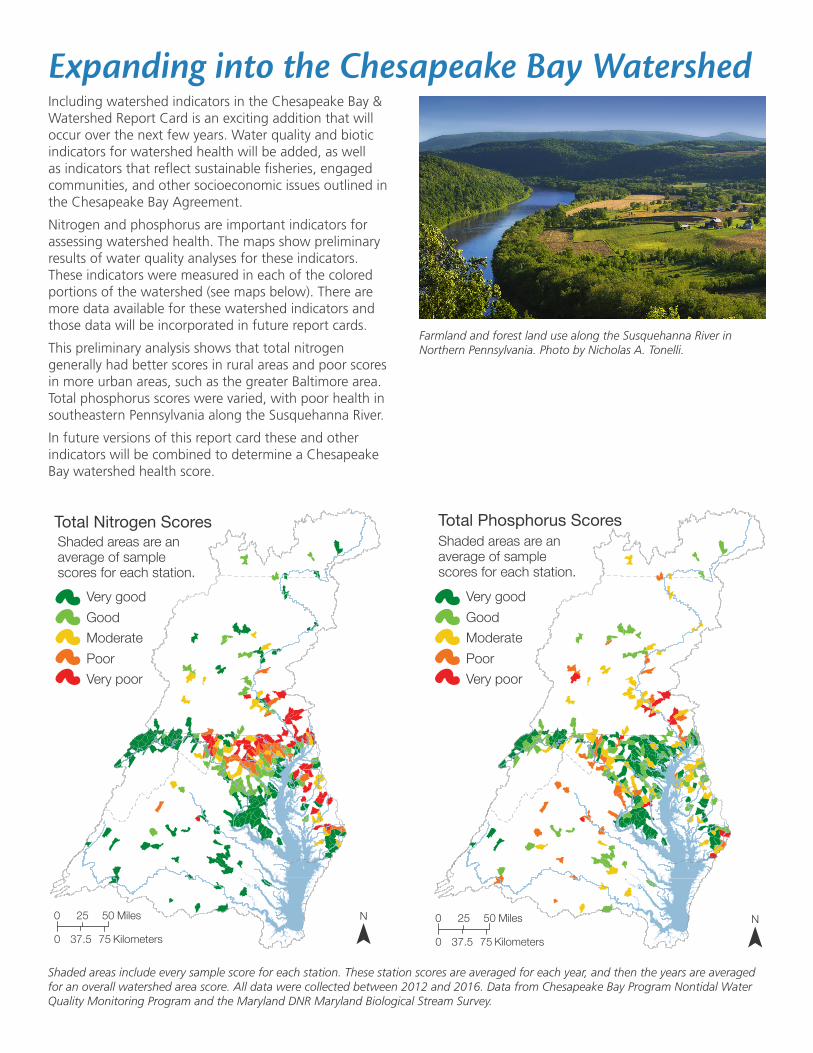
Including watershed indicators in the Chesapeake Bay & Watershed Report Card is an exciting addition that will occur over the next few years. Water quality and biotic indicators for watershed health will be added, as well as indicators that reflect sustainable fisheries, engaged communities, and other socioeconomic issues outlined in the Chesapeake Bay Agreement.
Nitrogen and phosphorus are important indicators for assessing watershed health. The maps show preliminary results of water quality analyses for these indicators. These indicators were measured in each of the colored portions of the watershed (see maps below). There are more data available for these watershed indicators and those data will be incorporated in future report cards.
This preliminary analysis shows that total nitrogen generally had better scores in rural areas and poor scores in more urban areas, such as the greater Baltimore area. Total phosphorus scores were varied, with poor health in southeastern Pennsylvania along the Susquehanna River.
In future versions of this report card these and other indicators will be combined to determine a Chesapeake Bay watershed health score.
Expanding into the Chesapeake Bay Watershed
Farmland and forest land use along the Susquehanna River in Northern Pennsylvania. Photo by Nicholas A. Tonelli.
0 5025 Miles
0 7537.5 Kilometers
Total Nitrogen ScoresShaded areas are an average of sample scores for each station.
Very goodGoodModeratePoorVery poor
N 0 5025 Miles
0 7537.5 Kilometers
Total Phosphorus ScoresShaded areas are an average of sample scores for each station.
N
Very goodGoodModeratePoorVery poor
Shaded areas include every sample score for each station. These station scores are averaged for each year, and then the years are averaged for an overall watershed area score. All data were collected between 2012 and 2016. Data from Chesapeake Bay Program Nontidal Water Quality Monitoring Program and the Maryland DNR Maryland Biological Stream Survey.
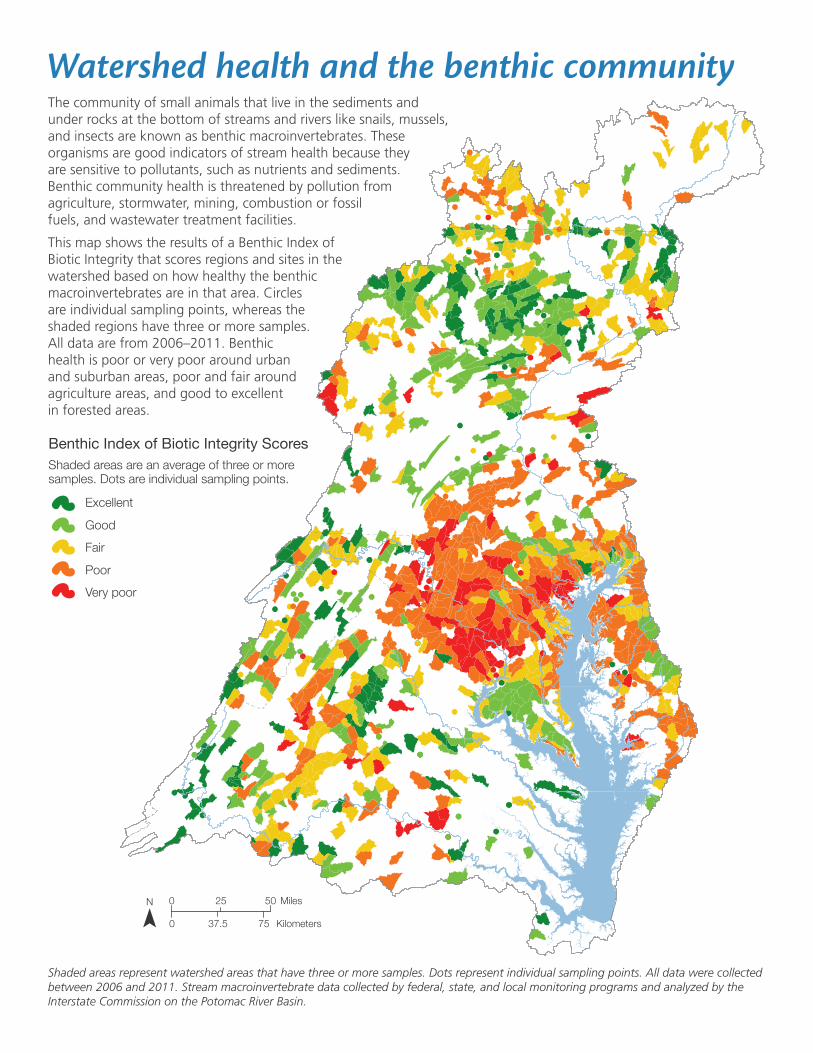
Watershed health and the benthic community
0 5025 Miles
0 7537.5 Kilometers
Benthic Index of Biotic Integrity Scores
Excellent
Good
Fair
Poor
Very poor
Shaded areas are an average of three or more samples. Dots are individual sampling points.
N
The community of small animals that live in the sediments and under rocks at the bottom of streams and rivers like snails, mussels, and insects are known as benthic macroinvertebrates. These organisms are good indicators of stream health because they are sensitive to pollutants, such as nutrients and sediments. Benthic community health is threatened by pollution from agriculture, stormwater, mining, combustion or fossil fuels, and wastewater treatment facilities.
This map shows the results of a Benthic Index of Biotic Integrity that scores regions and sites in the watershed based on how healthy the benthic macroinvertebrates are in that area. Circles are individual sampling points, whereas the shaded regions have three or more samples. All data are from 2006–2011. Benthic health is poor or very poor around urban and suburban areas, poor and fair around agriculture areas, and good to excellent in forested areas.
Shaded areas represent watershed areas that have three or more samples. Dots represent individual sampling points. All data were collected between 2006 and 2011. Stream macroinvertebrate data collected by federal, state, and local monitoring programs and analyzed by the Interstate Commission on the Potomac River Basin.
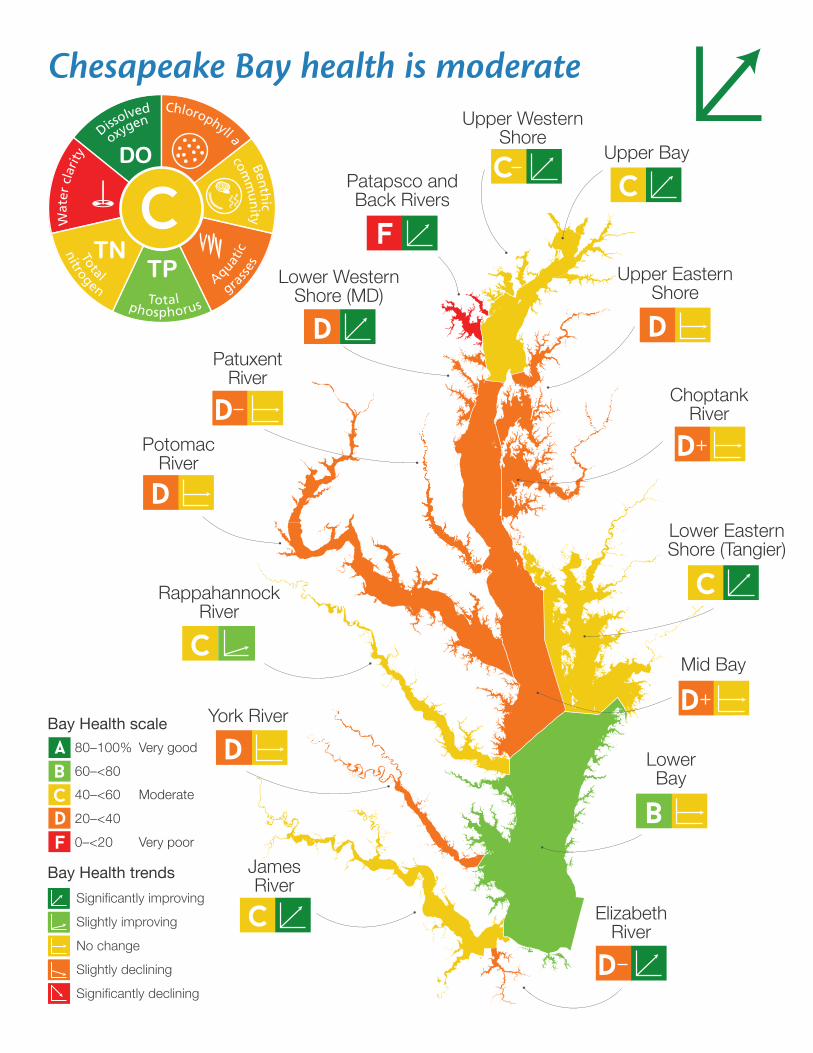
Chesapeake Bay health is moderate
Dissolved
Wat
er c
larit
y
Benthic
Chlorophyll a
Aquatic
Total
Total
oxygen
comm
unity
gra
sses
phosphorus
nitrogen
C
Significantly improving
No change
Significantly declining
Bay Health trends
Slightly improving
Slightly declining
Very good
Moderate60–<8040–<60
20–<400–<20
80–100%
Very poor
Bay Health scale
FDCBA
Elizabeth River
Upper Bay
Upper Western Shore
Upper EasternShore
Patapsco and Back Rivers
Lower Western Shore (MD)
Mid Bay
Choptank River
Patuxent River
Potomac River
Lower Eastern Shore (Tangier)
Rappahannock River
York River
JamesRiver
Lower Bay
CC
D
C
D
C
B
D
C
D
D
D
D
F
D
You can help the Chesapeake Bay
Report card produced and released in May 2019 by the Integration & Application Network, University of Maryland Center for Environmental Science. The data and methods underpinning this report card represent the collective effort of many individuals and organizations working within the Chesapeake Bay scientific and management community. The following organizations contributed significantly to the development of the report card: Chesapeake Bay Program, University of Maryland Center for Environmental Science, National Oceanic and Atmospheric Administration, Maryland Department of Natural Resources, Virginia Department of Environmental Quality, Virginia Institute of Marine Science, Versar Incorporated, U.S. Environmental Protection Agency, Maryland Department of the Environment, Interstate Commission on the Potomac River Basin, Old Dominion University, Morgan State University, and U.S. Geological Survey. Data for aquatic grasses includes data from 2018 and partial data from 2017, due to mapping issues during the 2018 monitoring season. Precipitation data from w2.weather.gov/climate/xmacis.php?wfo=lwx . Benthic macroinvertebrate watershed data from potomacriver.org/wp-content/uploads/2018/12/Stream-Health-2008-Baseline-Report-12-5-18.pdf . Cover photo of Bucktail State Park, PA by Nicholas A. Tonelli.
About the Chesapeake Bay & Watershed Report Card
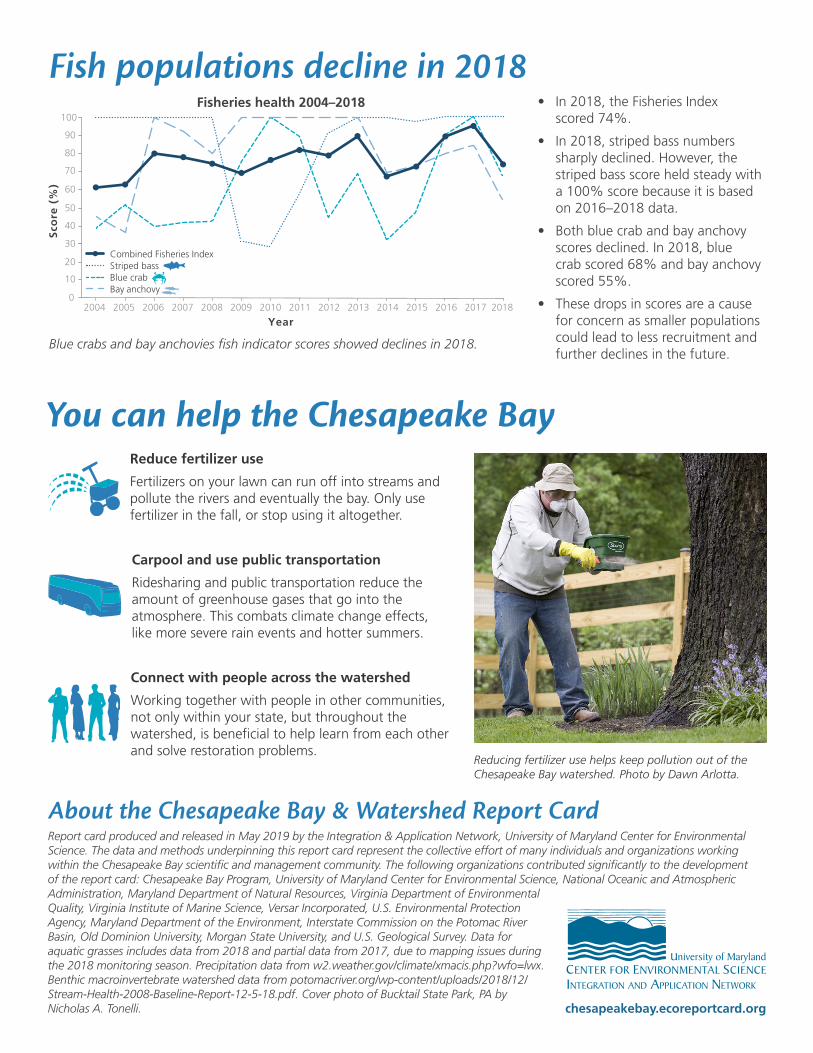
Fish populations decline in 2018
Blue crabs and bay anchovies fish indicator scores showed declines in 2018.
• In 2018, the Fisheries Index scored 74%.
• In 2018, striped bass numbers sharply declined. However, the striped bass score held steady with a 100% score because it is based on 2016–2018 data.
• Both blue crab and bay anchovy scores declined. In 2018, blue crab scored 68% and bay anchovy scored 55%.
• These drops in scores are a cause for concern as smaller populations could lead to less recruitment and further declines in the future.
Reduce fertilizer use
Fertilizers on your lawn can run off into streams and pollute the rivers and eventually the bay. Only use fertilizer in the fall, or stop using it altogether.
Connect with people across the watershed
Working together with people in other communities, not only within your state, but throughout the watershed, is beneficial to help learn from each other and solve restoration problems.
Reducing fertilizer use helps keep pollution out of the Chesapeake Bay watershed. Photo by Dawn Arlotta.
chesapeakebay.ecoreportcard.org
Carpool and use public transportation
Ridesharing and public transportation reduce the amount of greenhouse gases that go into the atmosphere. This combats climate change effects, like more severe rain events and hotter summers.
Year
Sco
re (
%)
Fisheries health 2004–2018
0
20
40
60
80
100
2004 2005 2006 2007 2008 2009 2010 2011 2012 2013 2014
Striped bassBlue crabBay anchovy
Combined Fisheries Index
2015 2016 2017
10
30
50
70
90
2018