Embed Size (px)
Citation preview

2018 ANNUAL REPORT
sustainability.mn.gov


September 20, 2019
Governor Tim Walz and Lt. Governor Peggy Flanagan have set a bold vision to reduce Minnesota’s carbon footprint and lead the nation in reducing greenhouse gas emissions. In April 2019, Governor Walz issued Executive Order 19-27 affirming the State of Minnesota’s goals to reduce greenhouse gas emissions, waste, energy and fuel consumption, water usage, and the sustainable procurement of goods and services in government operations. This report tracks our progress towards meeting those aggressive goals.
In order to achieve that bold vision, we will need to build on our leadership and success in the following areas:
• Established the Office of Enterprise Sustainability to assist the 24-cabinet level state agencies in achieving their sustainability goals.
• Created a web-based Sustainability Reporting Tool designed to track progress towards achieving sustainability goals and provide transparency in government operations at sustainability.mn.gov.
• Published the inaugural Enterprise Sustainability Annual Report.
• Increased the use of renewable energy in state agency operations, including several solar installations on the Capitol Complex.
• Significantly increased the overall fuel efficiency of the fleet by adding hybrids, electric vehicles (EV) and several EV charging stations at state buildings.
Moving forward, we will also focus our energies on increasing the tools and resources available to agencies to meet our most aggressive goals. We will create, innovate and when applicable, borrow best practices from the private sector.
Governor Walz’s direction for sustainable operations provides a real opportunity to position our state as a leader, not only here in Minnesota, but nationally and internationally. With the creation of the Office of Enterprise Sustainability and the Sustainability Reporting Tool, we have developed nation-leading collaboration and transparency tools to more effectively reduce state government’s carbon footprint.
By working together, we can advance a “One Minnesota” vision that addresses climate change, builds a more resilient Minnesota, and protects current families and future generations.
Sincerely,
Alice Roberts-Davis, Commissioner MN Department of Administration
3

2018 Enterprise Score Card
-5% PROGRESS
Goal: 30% reduction
of fossil fuel use by vehicles and equipment by
2027.
35% PROGRESS
Goal: 30% reduction in consumption of energy per square foot by
2027.
20% PROGRESS
Goal: 15% reduction in water use by
2025.
49% PROGRESS
Goal: 75% of solid
waste is recycled or
composted by 2030.
66% PROGRESS
Goal: 25% of total spending on
priority contracts is sustainably
purchased by 2025.
61% PROGRESS
Goal: 30% reduction of greenhouse gas emissions
by 2025.
$3I2n avo
,id2ed co
0sts (7,2005-2
70189)
0
m1etric t6
ons C6
O2e, a30voided an
2nually

Executive Summary Fleet State operations increased fuel consumption by 5% in 2018. Colder weather reduced miles per gallon and more snowfall required additional snow removal. The State increased the number of hybrids and electric vehicles by 38%. State agencies continue to purchase more fuel-efficient vehicles with an EPA emission score rating of 7 or better and explore ways to reduce vehicle miles traveled and idling. The Pollution Control Agency expanded the number of miles driven in hybrids by nearly 30% and the Metro-politan Council ordered 8 electric buses for the new C line.
EnergyEnergy consumption increased by 7% from 2017 to 2018 because 2018 had both a warmer summer and a colder winter. Despite the weather, some agencies saw progress. MnDOT owns and operates 1,075 build-ings with over 6.6 million square feet and achieved consistent energy savings through building automa-tion, equipment and lighting upgrades. Minnesota Housing’s new “green lease” for their offices included LED lighting, light harvesting and submetering of energy and water usage.
Water Water is a challenging area, as some agencies have water intensive operations. The State needs to better understand how water is being used. The Department of Natural Resources’ largest use of water is at their fish hatcheries. They are modernizing the system and anticipate improved water efficiency. MnDOT audited water use at 125 sites using a tool like the EPA’s WaterSense assessment. The Office of Higher Education’s (OHE) landlord reduced their water use in landscaping irrigation by 67% helping OHE meet their water goal.
Solid Waste The State’s ability to meet our solid waste goal is dependent on the availability of organics recycling. The Department of Corrections, working with hog farmers to repurpose food waste, has reached a 48% diver-sion rate. The Department of Labor and Industry worked with their landlord to implement a new recycling system, doubling their diversion rate. The Department of Administration and the Pollution Control Agency developed a waste hauling contract to expand recycling and organics collection across the enterprise.
Procurement In 2018, the State purchased $22 million in sustainable products as measured by third party certifications and other criteria. The Pollution Control Agency and the Office of State Procurement were recognized nationally by the Sustainable Purchasing Leadership Council for their new sustainable office furniture contract. 100% of cleaning chemicals, carpet and flooring, office furniture, computers and imaging equipment purchased are sustainable.
Greenhouse Gas Emissions Reductions in greenhouse gas emissions in state government operations is largely due to the decarbon-ization of the electricity grid and long-term reductions in energy use. The Metropolitan Council created a green partnership with Xcel Energy to produce and purchase clean, renewable energy and allow the Council to operate its wastewater and transit systems exclusively on energy from renewable sources by 2040. The Department of Administration created a one-of-a-kind on-site solar master contract. The contract has been used to procure over one megawatt of solar in its first year.
5

20
18
16
14
12
10
8
6
4
2
0
Fossil fuel gallons Goal
Mill
ions
of g
allo
ns
Baseline 2017 2018
Millions of gallons Baseline 18.3
2017 17.5 2018 18.6 Goal 12.8
FLEET Fossil Fuel Gallons Used
18.6 million fossil fuel gallons consumed in 2018
ACCOMPLISHMENTS: • Control Agency expanded the number of miles
driven in hybrids by nearly 30%. • The Metropolitan Council ordered 8 electric buses
for the new C line.
BARRIERS: • Lack of Level 2 electric vehicle chargers at agency
locations. • Lack of Direct Current Fast Chargers (DCFC) along
the most traveled highways. • Lack of regional availability of electric vehicles.
*The 2018 report includes corrections to 2017 data

Heavy Medium Light
Off Road
Light
Medium
Heavy
0% 5% 10% 15% 20% 25% 30% 35% 40% 45% 50%
Gasoline E85 Diesel B5 Diesel B0 AV Gas Diesel (road) Diesel B10 Diesel B20
Fleet Signifcant Indicators
757 Light vehicles with both a high miles per gallon and low emissions rating
2,468
2,888 6,449
Count of Vehicles by Segment
Light 6,449 Medium 2,888 Heavy 2,468
Breakdown of Total Gallons by Fleet Segment: 2018
7

116 kBTU per square foot consumed in 2018
Energy Used per Square Foot 140
kBtu
/SF
120
100
80
60
40
20
0 Baseline 2017 2018
kBtu/SF Goal
ENERGY
kBtu/SF Baseline 1302017 108 2018 116 Goal 91
ACCOMPLISHMENTS • MnDOT owns and operates 1,075 buildings with
over 6.6 million square feet and achieved consistent energy savings through building automation, equipment and lighting upgrades.
• Minnesota Housing’s new “Green Lease” for their ofces included LED lighting, light harvesting and submetering of energy and water usage.
BARRIERS • The State lacks funds to establish an energy
efciency revolving fund to spur quick-wins at State owned facilities.
• Building information systems (BIS) are needed to increase awareness to drive behavior change and preventative maitenance.
*The 2018 report includes corrections to 2017 data

Energy Signifcant Indicators
Breakdown of Total Energy Use
0% 10% 20% 30% 40% 50% 60% 70% 80% 90% 100%
2017
2018
Natural Gas Electricity District Energy Propane Renewable*Connect Government Fuel Oil Solar PV On-Site Thermal Renewable
Annual Avoided Costs due to Energy Conservation Measures
$0 $1 $2 $3 $4 $5 $6 $7 $8 $9 $10
2017
2018
Millions of Dollars (nominal)
9

WATER 2.68 billion gallonsconsumed in 2018
Water Consumed
Billi
ons o
f gal
lons
2.8
2.7
2.6
2.5
2.4
2.3
2.2
2.1 Baseline 2017 2018
Gallons Goal
Billions of gallons Baseline 2.772017 2.75 2018 2.68Goal 2.35
ACCOMPLISHMENTS • MnDOT audited water use at 125 sites using a tool
like the EPA’s WaterSense assessment. • The Ofce of Higher Education’s (OHE) landlord
reduced their water use in landscaping irrigation by 67% helping OHE meet their water goal.
BARRIERS • Water conservation is a new area of focus for our
agencies. • Many campuses are not metered at the building
level. • Landscape irrigation is a signifcant contributing
factor to increases in enterprise water consumption.
*The 2018 report includes corrections to 2017 data.
Water Signifcant Indicators
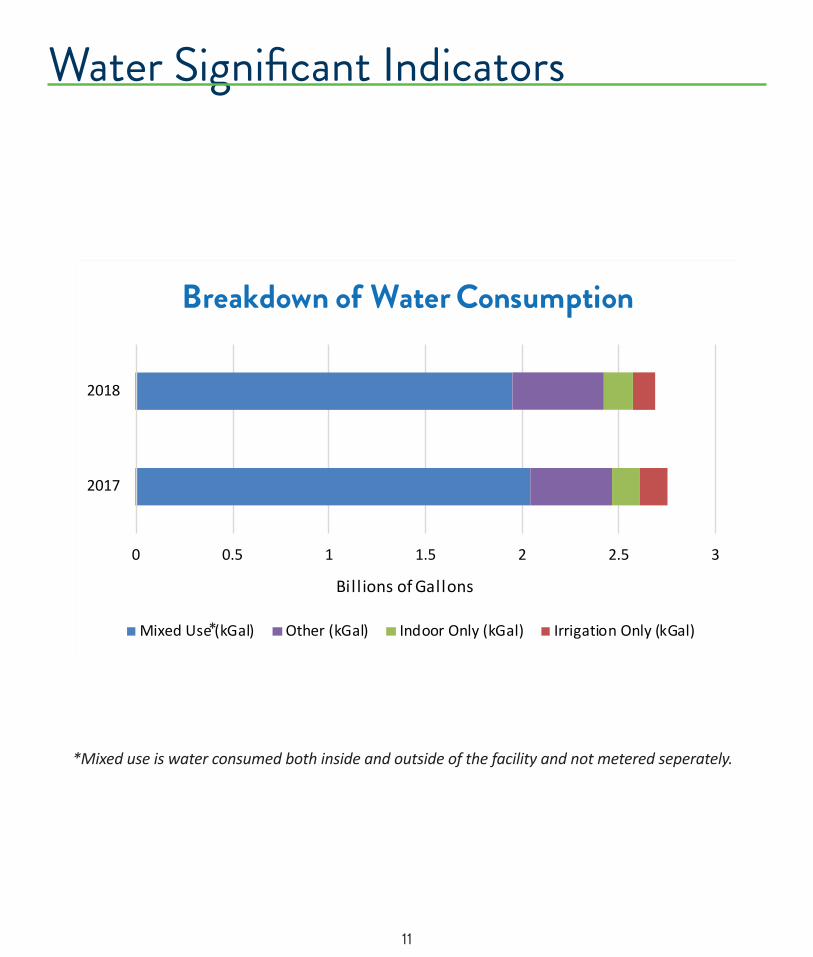
0 0.5 1 1.5 2 2.5 3
2017
2018
Bil l ions of Gallons
Mixed Use (kGal) Other (kGal) Indoor Only (kGal) Irrigation Only (kGal) *
*Mixed use is water consumed both inside and outside of the facility and not metered seperately.
Breakdown of Water Consumption
11

SOLID WASTE 31.2 million pounds ofmunicipal solid waste.
Solid Waste Diverted from Landflls
0%
10%
20%
30%
40%
50%
60%
70%
80%
Basel ine 2017 2018
Dive
rsio
n Ra
te
Diversion Rate Goal
Diversion RateBaseline 24%2017 24%2018 36%Goal 75%
ACCOMPLISHMENTS • The Department of Labor and Industry worked
with their landlord to implement a new recycling system, doubling their diversion rate.
• The Department of Administration and the Pollution Control Agency developed a waste hauling contract to expand recycling and organics collection across the enterprise.
BARRIERS • Lack of an adequate number of vendors who
accept organic waste in Greater Minnesota. • Lack of an accurate means of measuring solid
waste weight at several leased facilties.
*The 2018 report includes corrections to 2017 data.

2018
2017
0% 20% 40% 60% 80% 100%
Trash Recycling Organics
Solid Waste Signifcant Indicators
2017 2018 Pounds of Organics Recycling per FTE 90 107 Reams of 8.5x11 paper purchased 308,270 364,440 Percentage of EPEAT-registered units purchased out of all EPEAT-eligible units 86% 94%
Breakdown of Solid Waste Totals
13

$21.8 million in sustainable spend in 2018
Perc
ent S
usta
inab
le Sp
end
30%
25%
20%
15%
10%
5%
0% Baseline 2017 2018
Sustainable Spend Goal
PROCUREMENT Sustainable Spend
Sustainable SpendBaseline 16%2017 16%2018 17%Goal 25%
ACCOMPLISHMENTS • The Pollution Control Agency and the Ofce of
State Procurement were recognized nationally by the Sustainable Purchasing Leadership Council for their new sustainable ofce furniture contract.
• 100% of cleaning chemicals, carpet and fooring, ofce furniture, and computers and imaging equipment purchased are sustainable.
BARRIERS • Need to train buyers to select sustainable
products. • Reporting at the agency level cannot be
determined based on limitations in SWIFT, the state’s procurement software.

Procurement Signifcant Indicators SUSTAINABLE SPEND
Priority Contracts*Electronics
2017$14,940,586
2018$14,474,508
Furniture $526,644 $892,825Janitorial Products $1,864,567 $1,742,933Ofce Supplies $1,324,231 $1,823,410Carpet and Flooring $2,058,878 $2,910,684
$0 $3 $6 $9 $12 $15 $18 $21 $24
2017
2018
Millions of dollars (nominal)
Breakdown of Sustainable Spend
Electronics Carpet and Flooring Janitorial Products Office Supply Furniture
*Selected because they have environmental impact, high use, potential for improvement.
15

Met
ric to
ns C
O2e
900,000
800,000
700,000
600,000
500,000
400,000
300,000
200,000
100,000
0 Baseline 2017 2018
Mt CO2e Goal
GREENHOUSE GASES 679,578 metric tons CO2e of greenhouse gasemissions in 2018
Total Greenhouse Gas Emissions
Metric tons CO2eBaseline 831,8882017 657,0042018 679,578Goal 582,322
ACCOMPLISHMENTS • The Metropolitan Council created a green
partnership with Xcel Energy to produce and purchase clean, renewable energy and allow the Council to operate its wastewater and transit systems exclusively on energy from renewable sources by 2040.
• The Department of Administration created an innovative on-site solar master contract. The contract has been used to procure over one megawatt of solar in its frst year.
BARRIERS • Fleet emissions have increased due to more miles
driven. • More focus needs to be placed on the electrifcation
of the feet and the built environment.
*The 2018 report includes corrections to 2017 data.

Greenhouse Gas Signifcant Indicators
- 100,000 200,000 300,000 400,000 500,000
2017
2018
metric tons CO2 equivalent
Built Enviornment Emissions
Purchased energy Combusted fuel on-site
- 100,000 200,000 300,000 400,000 500,000 600,000 700,000 800,000 900,000
2005 2017 2018
Met
ric to
ns C
O2e
Enterprise Emissions
Purchased Electricity Mobile Combustion
Stationary Combustion Stationary Biomass Combustion
Process Emissions Purchased Heating and Cooling
2018
2017
-
Transportation Emisisons
50,000 100,000 150,000 200,000 250,000
metric tons CO2 equivalent
Fuel Electricity (EVs, Light Rail etc.) Reimbursed Miles
2018
2017
0%
Enterprise Electricity Fuel Mix
10% 20% 30% 40% 50% 60% 70% 80% 90% 100%
Coal Wind Nuclear Gas Solar Hydro Other
17

Agency Score Cards Percent Progress towards Goals
Admin 72 -41 -34 100 100
Agriculture -36 -67 26 78 17
Commerce -10 -93 -2 39 100
Corrections 4 10 -6 64 45 Economic Development -6 -24 29 10 100
Education -12 -100 18 22 100
Health -41 -36 9 90 46 Higher Education -33 100 -100 22 100 Minnesota Housing -7 100 14 54 100
Human Rights -28 57 100 100 Human Services -40 -100 14 100 100 Iron Range Resources -7 81 52 8 9 Labor and Industry 22 95 25 81 91
18

Fleet goal: 30% reduction of fossil fuel use by vehicles and equipment by 2027. Energy goal: 30% reduction in consumption of energy per square foot by 2027. Water goal: 15% reduction in water use by 2025. Solid waste goal: 75% of solid waste is recycled or composted by 2030. Procurement: 25% of total spending on priority contracts is sustainably purchased by 2025. Greenhouse gas: 30% reduction of greenhouse gas emissions by 2025.
Management & Budget -33 -16 98 100 Mediation Services 0 100 -9 0 100
Met Council 46 -30 6 61 47
Military Afairs 58 58 -100 27 100 Natural Resources 42 100 80 25 100 Pollution Control -15 -20 28 88 100
Public Safety -24 99 -8 56 -41
Revenue -40 -9 -15 100 100
Technology -22 -76 -5 95 58
Transportation 28 17 -73 21 1 Veterans Afairs 53 -100 0 12 -40
ENTERPRISE 35 20 -5 49 61
LESS THAN 49% = RED 50% - 99% = AMBER
100% = GREEN
19

204 Administration Building 50 Sherburne Avenue, Saint Paul, MN 55155
(651) 201-2603mn.gov/admin/government/sustainability