Embed Size (px)
Citation preview

2018 Annual Groundwater Monitoring and Corrective Action Report
Tennessee Valley Authority Allen Fossil Plant East Ash Disposal Area CCR Unit
Prepared for: Tennessee Valley Authority 1101 Market Street Chattanooga, TN 37402
Prepared by: Stantec Consulting Services Inc. 8770 Guion Road, Suite B Indianapolis, IN 46268
January 31, 2019
January 31, 2019 Reference: 2018 Annual Groundwater Monitoring and Corrective Action Report TVA Allen Fossil Plant East Ash Disposal Area CCR Unit In accordance with 40 CFR 257.90(e) of the Federal Coal Combustion Residuals (CCR) Rule (CCR Rule), this 2018 Annual Groundwater Monitoring and Corrective Action Report (2018 Annual Report) documents 2018 groundwater monitoring activities at the East Ash Disposal Area CCR Unit at the Tennessee Valley Authority (TVA) Allen Fossil Plant (ALF). In 2017, TVA established a groundwater monitoring network and program at the ALF East Ash Disposal Area CCR Unit in accordance with 40 CFR 257.90. The groundwater monitoring network was certified by a qualified Professional Engineer as required by 40 CFR 257.91(f). During 2018, TVA performed the following groundwater monitoring activities:
• Conducted a statistical analysis of the 2017 detection monitoring groundwater sampling data in accordance with 40 CFR 257.93(h), and it was concluded that there were statistically significant increases (SSIs) over background levels for certain Appendix III constituents. The results were included in Table 1 of the 2017 Annual Groundwater Monitoring and Corrective Action Report, which was placed on the CCR Compliance Data and Information website (https://www.tva.gov/Environment/Environmental-Stewardship/Coal-Combustion-Residuals).
• Performed an alternate source demonstration for the SSIs over background levels of Appendix III constituents in accordance with 40 CFR 257.94(e)(2).
• Performed error checking and investigated whether the SSIs over background resulted from error in sampling, analysis, statistical evaluation, or natural variation in groundwater quality as specified in 40 CFR 257.94(e)(2).
• Established an assessment monitoring program in accordance with 40 CFR 257.94(e)(1) because the Appendix III alternate source demonstration was unable to establish that the SSIs were the result of another source or the result of an error.
• Placed notification of the establishment of the assessment monitoring program in the facility operating record in accordance with 40 CFR 257.94(e)(3) and 257.105(h)(5); provided notification to the State of Tennessee in accordance with 40 CFR 257.106(h)(4); and placed notification on the CCR Compliance Data and Information website https://www.tva.gov/Environment/Environmental-Stewardship/Coal-Combustion-Residuals in accordance with 40 CFR 257.107(h)(4).
• Sampled and analyzed groundwater in the certified monitoring network for Appendix IV constituents in accordance with 40 CFR 257.95(b).
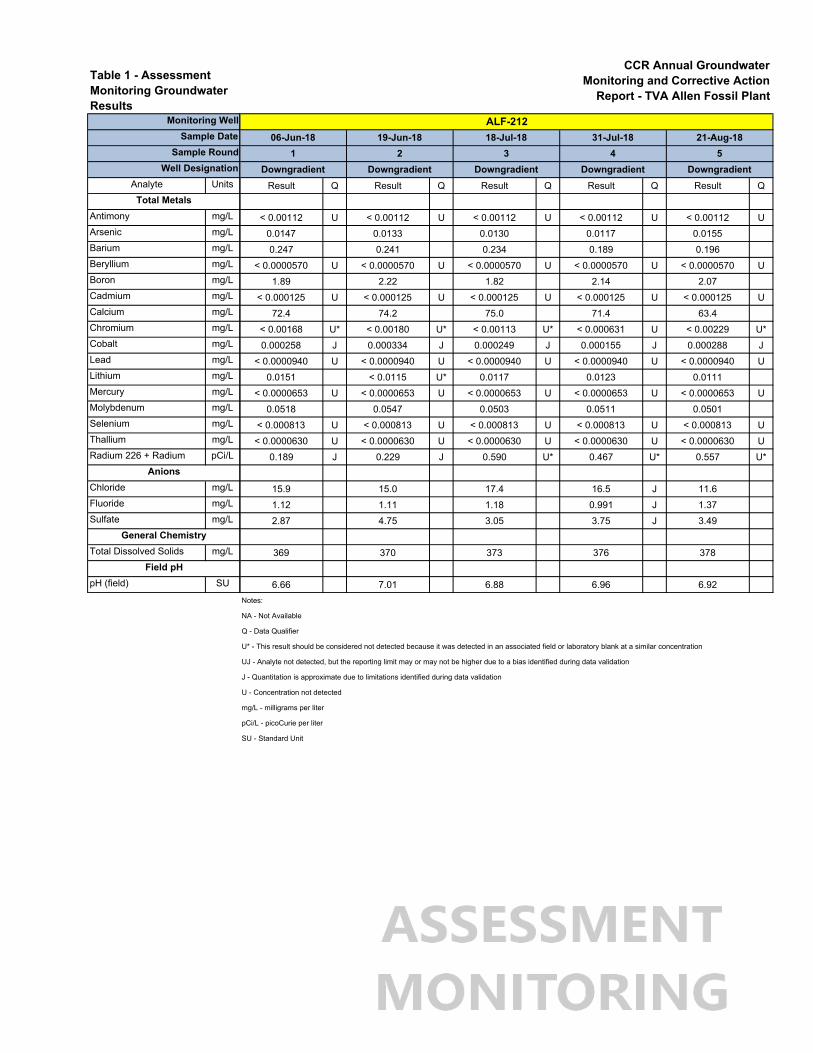
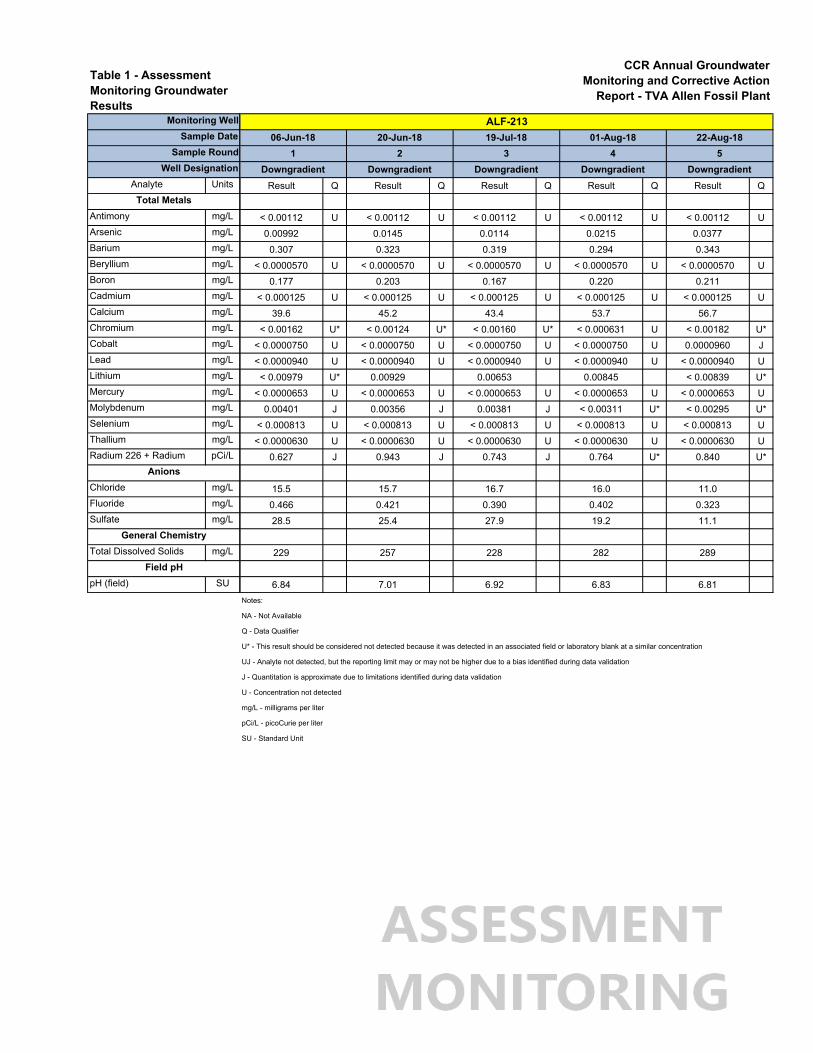
• Sampled wells in the certified monitoring network and analyzed samples for CCR constituents (Appendix III and Appendix IV constituents) in accordance with 40 CFR 257.95(d)(1). The sampling results were placed in the operating record as required by 40 CFR 257.95(d)(1) and 257.105(h)(6). Additionally, these results are included in Table 1 of this 2018 Annual Report in accordance with 257.95(d)(3).
• Established groundwater protection standards in accordance with 40 CFR 257.95(d)(2) and included the standards in this 2018 Annual Report in accordance with 257.95(d)(3).
2018 ANNUAL GROUNDWATER MONITORING AND CORRECTIVE ACTION REPORT TVA Allen Fossil Plant East Ash Disposal Area CCR Unit January 31, 2019
• Performed field and desktop site-characterization investigations to improve the ALF Conceptual Site Model (CSM).
• Continued TVA’s third-party Quality Assurance Program to evaluate and improve groundwater analytical data using best practices concerning field methods and validation techniques, as well as the application of the most appropriate statistical methods.
• Reviewed new data as it became available to maintain compliance with 40 CFR 257.90 through 257.98.
• Complied with recordkeeping requirements as specified in 40 CFR 257.105(h), notification requirements specified in 40 CFR 257.106(h) and internet requirements specified in 40 CFR 257.107(h).
No problems were encountered during the second year of the TVA Groundwater Quality Monitoring Program and therefore, no further action has been recommended, except for the planned key activities for 2019 that are outlined below.
The projected key activities for 2019 are:
• Complete an evaluation of whether one or more Appendix IV constituents are detected at statistically significant levels (SSLs) above the established groundwater protection standards in accordance with 40 CFR 257.95(g).
• Characterize the nature and extent of the release in accordance with 40 CFR 257.95(g)(1).
• Notification of the exceedances of established groundwater protection standards will be placed in the facility operating record in accordance with 40 CFR 257.95(g) and 257.105(h)(8); will be provided to the State of Tennessee in accordance with 40 CFR 257.106(h)(6); and will be placed on the CCR Compliance Data and Information website (https://www.tva.gov/Environment/Environmental-Stewardship/Coal-Combustion-Residuals) in accordance with 40 CFR 257.107(h)(6).
• All persons who own the land or reside on the land that directly overlies any part of the plume of contamination if contaminants have migrated off-site will be notified in accordance with 40 CFR 257.95(g)(2) if the Appendix IV alternate source demonstration performed under 40 CFR 257.95(g)(3)(ii) is not successful.
• Initiate Assessment of Corrective Measures in accordance with 40 CFR 257.95(g)(3)(i) and 40 CFR 257.96.
• Perform further field and desktop Site Characterization Investigations to improve the ALF CSM.
• Continue semi-annual assessment monitoring at the certified groundwater monitoring network consistent with 40 CFR 257.95.
• Continue TVA’s third-party Quality Assurance Program to evaluate groundwater analytical data using best practices concerning field methods and validation techniques, as well as the application of the most appropriate statistical methods.
• Review new data as it becomes available and implement changes to the groundwater monitoring program as necessary to maintain compliance with 40 CFR 257.90 through 257.98.
• Comply with recordkeeping requirements as specified in 40 CFR 257.105(h), notification requirements specified in 40 CFR 257.106(h) and internet requirements specified in 40 CFR 257.107(h).
2018 ANNUAL GROUNDWATER MONITORING AND CORRECTIVE ACTION REPORT TVA Allen Fossil Plant East Ash Disposal Area CCR Unit January 31, 2019 GROUNDWATER MONITORING WELL NETWORK The East Ash Disposal Area is located east of the power plant building and formerly received sluiced CCR materials from the fossil plant. The sluiced material entered the disposal area from the west side of the facility and ultimately discharged through an NPDES outfall in the northeast corner of the unit to allow particle settlement to occur. The plant ceased coal firing operations in 2018.
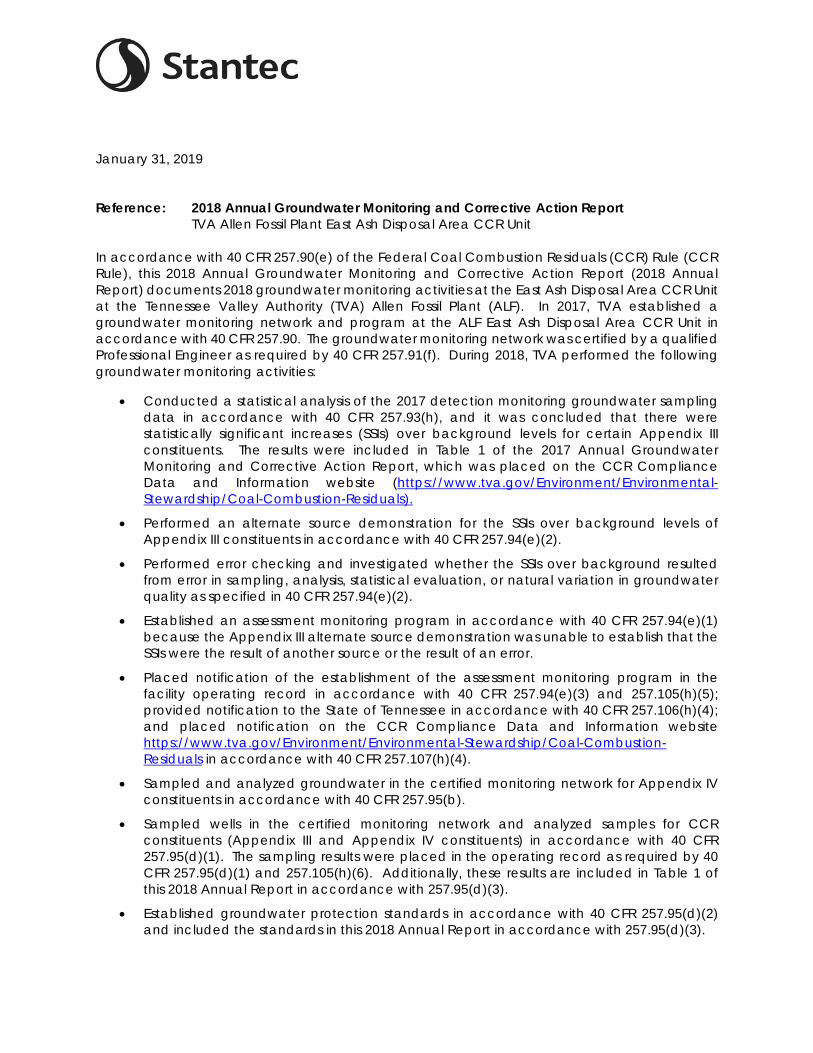
The monitoring well network for the ALF East Ash Disposal Area CCR Unit consists of one background well (ALF-210) and eight downgradient wells (ALF-201, ALF-202, ALF-203, ALF-204, ALF-205, ALF-206, ALF-212 and ALF-213). Figure 1 is an aerial photograph that shows the groundwater monitoring well locations. The downgradient wells are installed at the waste boundary. The monitoring well network was designed for a single CCR Unit (East Ash Disposal Area).
No monitoring wells in the CCR network were installed or decommissioned during the 2018 reporting period. The certification of the groundwater monitoring system required under 40 CFR 257.91(f) is included in the facility operating record and on the CCR Compliance Data and Information website (https://www.tva.gov/Environment/Environmental-Stewardship/Coal-Combustion-Residuals). GROUNDWATER SAMPLING AND LABORATORY ANALYTICAL TESTING A groundwater sampling and analysis program was developed in 2016-2017 and includes procedures and techniques for: sample collection; sample preservation and shipment; analytical procedures; chain-of-custody control; and, quality assurance and quality control (QA/QC) required by 40 CFR 257.93(a). The groundwater monitoring program includes sampling and analysis procedures designed to provide monitoring results that are an accurate representation of groundwater quality at background and downgradient wells.
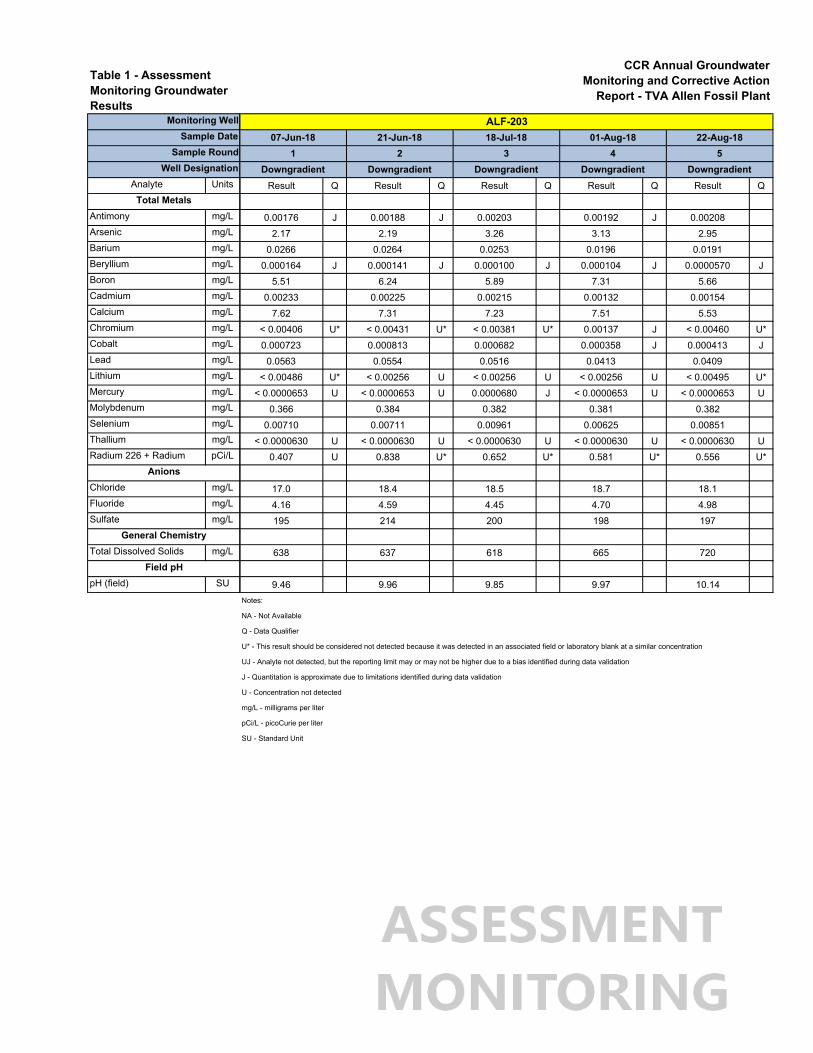
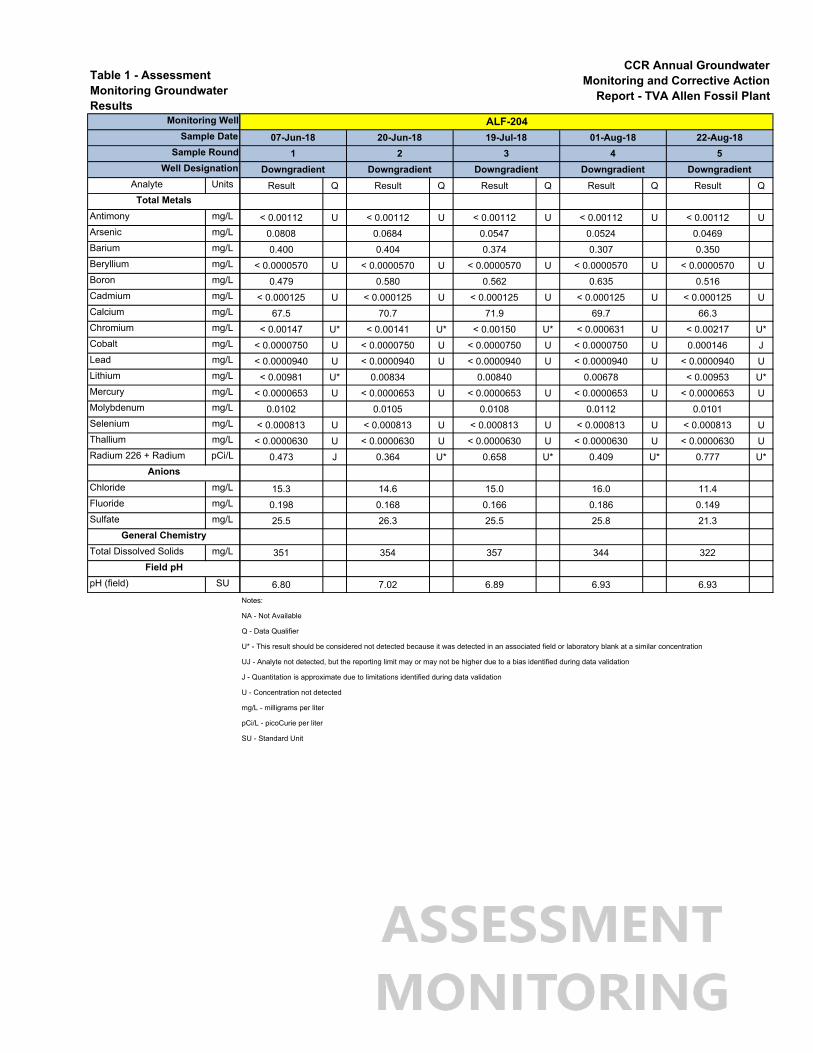
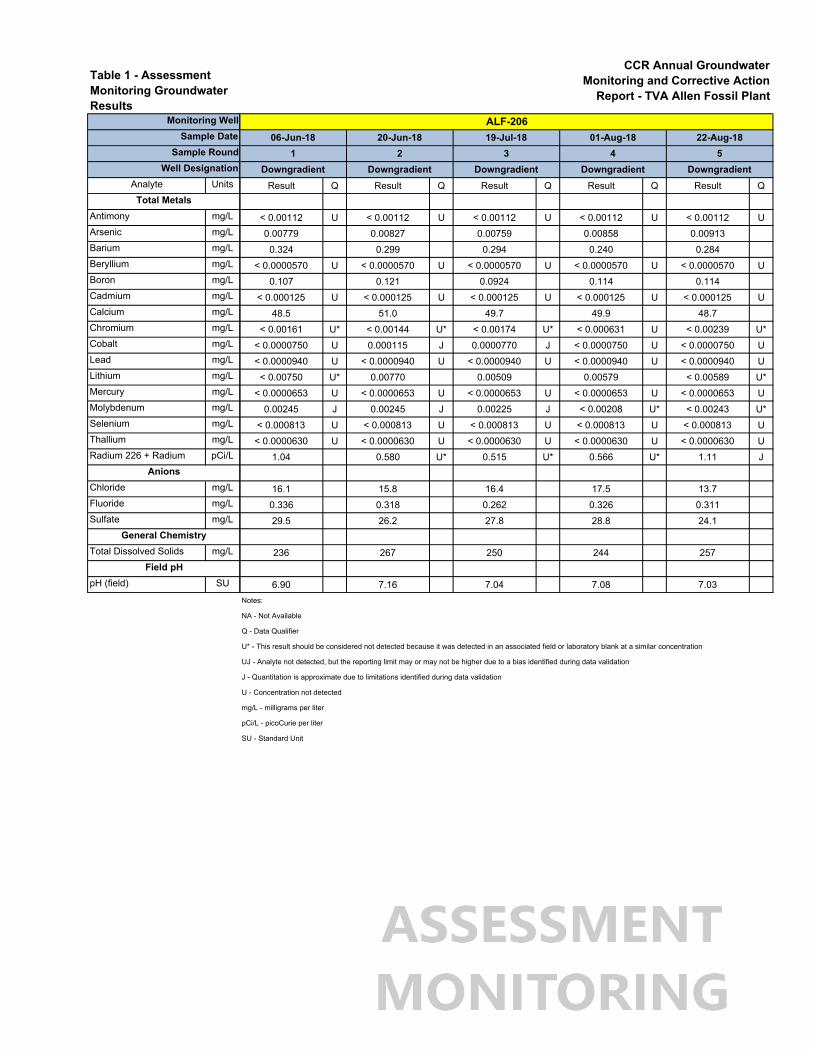
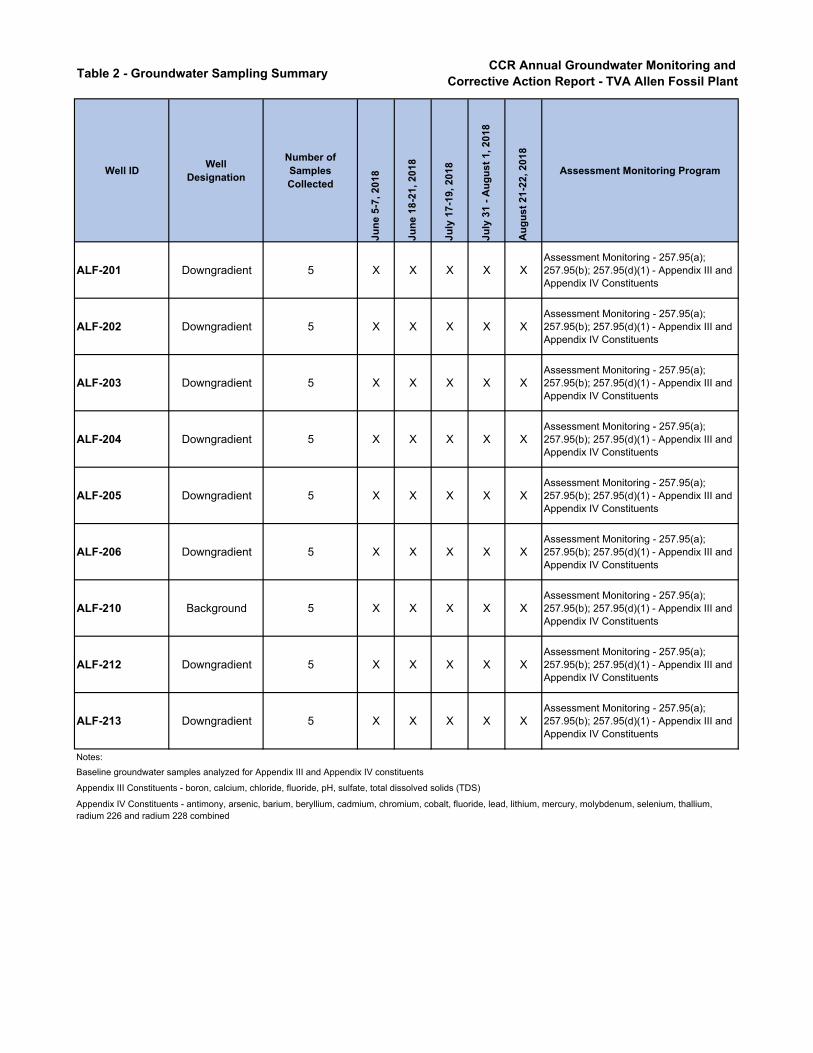
Assessment monitoring groundwater sampling was conducted between June and August 2018 and the results are summarized in Table 1. A summary of groundwater sample locations, well designations, analytes sampled, sampling dates and monitoring program status is provided in Table 2.
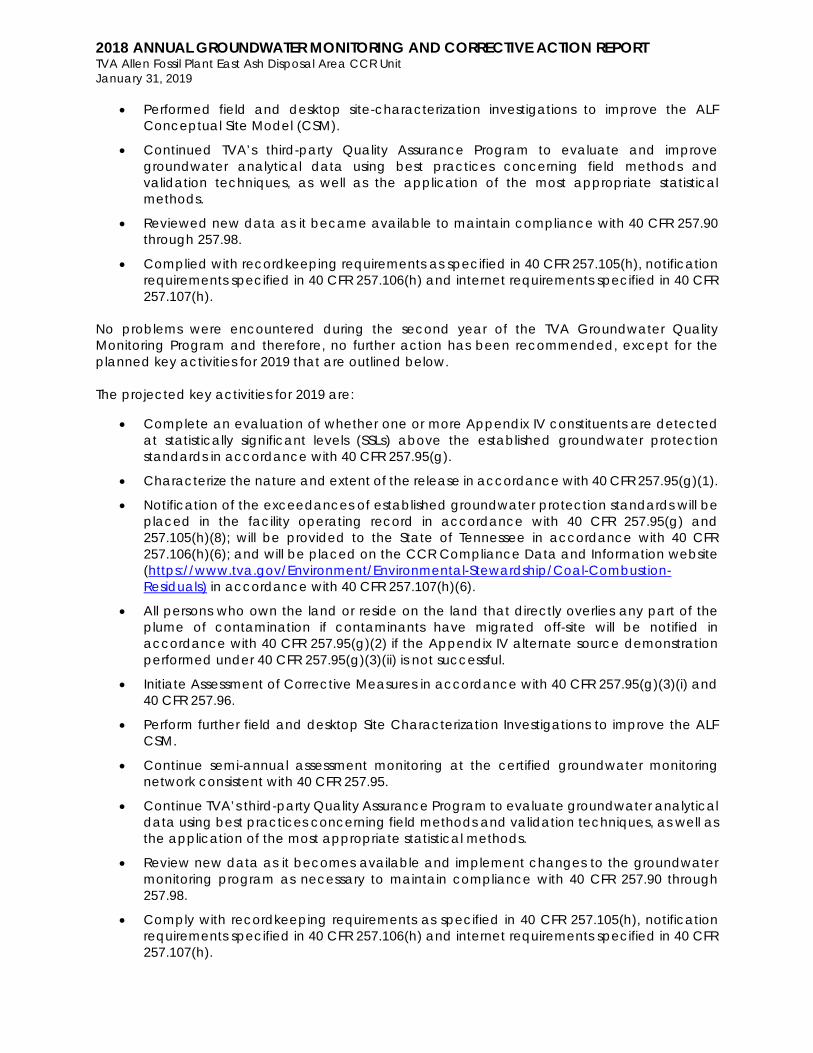
Groundwater elevations were measured in each monitoring well immediately prior to purging during each sampling event as required by 40 CFR 257.93(c). Groundwater elevations and McKellar Lake surface water elevations are summarized in Table 3. Groundwater flow directions were determined for each sampling event, and a generalized depiction of groundwater flow direction is illustrated on Figure 2. The groundwater directional flow at the ALF East Ash Disposal Area is influenced by McKellar Lake to the north of the site. The primary groundwater flow direction is to the north toward McKellar Lake.
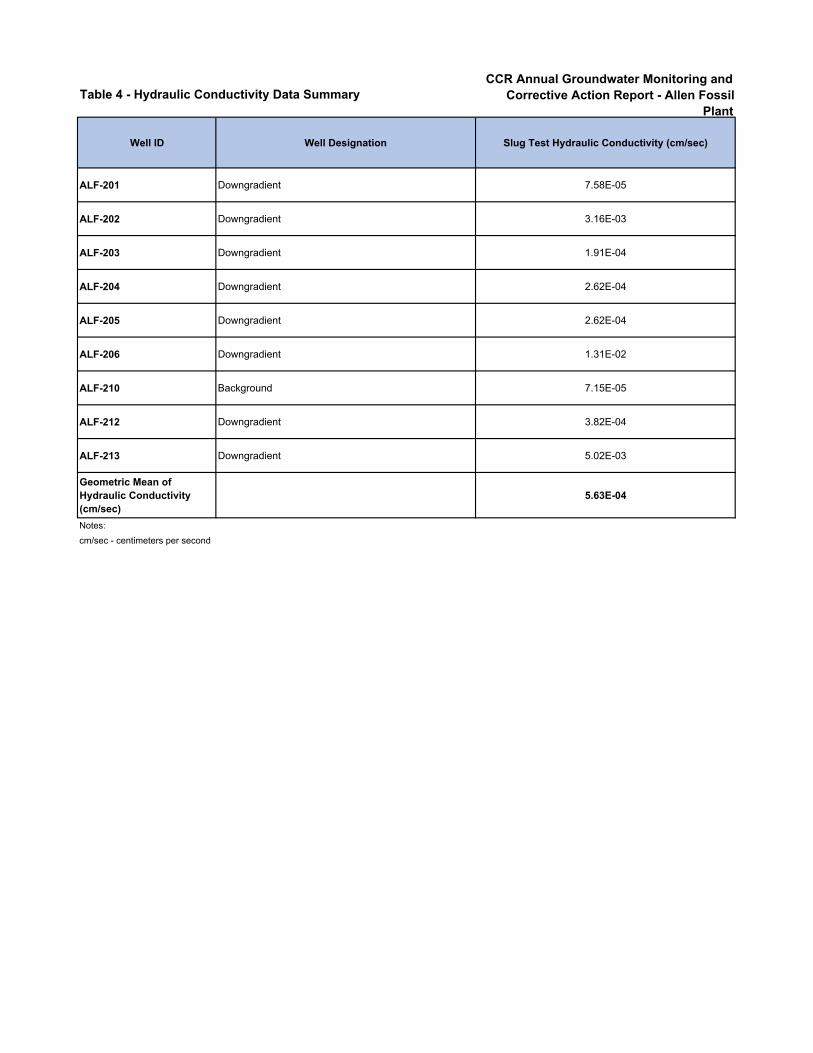
Testing for hydraulic conductivity at the background or downgradient groundwater monitoring wells, as summarized in Table 4, was determined by a 2018 hydrogeologic evaluation (Terracon, 2019). The uppermost aquifer at the ALF CCR Unit is the Alluvial aquifer. These alluvial deposits are composed of a fine to medium-grained silty sand with intervals of fine-grained silts and clays in the upper portion of the unit and fine- to coarse-grained sand with trace fine- to coarse-grained gravel in the lower portion. The alluvial deposits are underlain by the fine-grained Cook Mountain Formation (hydrogeologically referred to as the upper Claiborne confining unit in this location). The Cook Mountain Formation is underlain by the Memphis Sand, which is characterized by predominantly very fine to very coarse-grained sand with lenses of fine-grained material and is referred to as the Memphis aquifer. Based on deep exploratory drilling in the vicinity of ALF-202, the upper Claiborne confining unit is absent and the Alluvial aquifer directly overlies the Memphis

2018 ANNUAL GROUNDWATER MONITORING AND CORRECTIVE ACTION REPORT TVA Allen Fossil Plant East Ash Disposal Area CCR Unit January 31, 2019 Sand. Testing data indicates the Alluvial Aquifer has a geometric mean hydraulic conductivity of 5.63 x 10⁻⁴ centimeters per second (cm/sec). Linear groundwater flow velocity was calculated for the uppermost aquifer using:
• the geometric mean hydraulic conductivity calculated from hydraulic testing (5.63 x 10⁻⁴ cm/sec);
• horizontal hydraulic gradients measured during the implementation of the groundwater sampling and analysis program, ranging from 0.0002 to 0.008 feet per foot (ft/ft); and,
• an effective porosity of 22% in the native sand (Heath, 1983).
The average linear flow velocity in the uppermost aquifer ranges from approximately 0.5 to 23 feet per year.
STATISTICAL ANALYSIS OF GROUNDWATER DATA
The groundwater monitoring data for the assessment monitoring events were evaluated using statistical procedures as required by 40 CFR 257.93(f) through 257.93(h). The statistical method certification is included in the facility operating record and the CCR Compliance Data and Information website. Groundwater protection standards were established in accordance with 40 CFR 257.95(h), as the larger of published regulatory limits or screening criteria (e.g., maximum contaminant levels (MCLs)) and upper tolerance limits (UTLs) derived from background. Maximum contaminant levels may or may not be considered the appropriate groundwater protection standard depending on background well concentrations for each Appendix IV1 constituent2. The 2018 Statistical Analysis Report is included in Appendix A.
The sampling results used to identify potential groundwater protection standards exceedances were obtained during five distinct monitoring events that were performed between June and August of 20183. Comparisons were made against a fixed groundwater protection standard via a confidence interval or confidence interval band. No retesting was conducted and none of the individual compliance point measurements were directly compared against the groundwater protection standard. All of the Appendix IV monitoring data collected both in Year-One and Year-Two were used to construct the confidence interval bands. Cross-sections of each confidence interval band were then compared to the groundwater protection standard for the 1 Appendix IV CCR Constituents: antimony, arsenic, barium, beryllium, cadmium, chromium, cobalt,
fluoride, lead, lithium, mercury, molybdenum, selenium, thallium, radium 226 and radium 228 combined 2 USEPA has published Maximum Contaminant Limits (MCL) or alternate regulatory limits for each of the
Appendix IV constituents. Consequently, in most cases the groundwater protection standard is equal to the MCL. However, there may be cases where background levels of a constituent exceed the MCL. In these instances, an alternate groundwater protection standard must be derived from on-site background levels. On July 30, 2018, EPA provided alternate regulatory limits (i.e., that could be used as potential groundwater protection standards) for four of the Appendix IV chemical Constituents of Interest (COIs) for which the agency has not assigned MCLs to date. If site-specific background levels are lower, these may be used in place of background levels under 257.95(h)(2). Specifically, those alternate COIs include threshold values at the following health-based levels: 1.) Cobalt - 6 µg/L; 2.) Lithium - 40 µg/L; 3.) Molybdenum – 100 µg/L; and, 4.) Lead - 15 µg/L.
3 The CCR rule requires a minimum of two semi-annual sampling events per well once the required background data has been obtained. Groundwater aquifers can be quite complex, with significant changes and heterogeneity over both time and space. Two events per well per year is sometimes inadequate to reasonably characterize groundwater quality. Much greater flexibility in statistical approach, as well critical information about groundwater variability, can be gained from more frequent sampling.
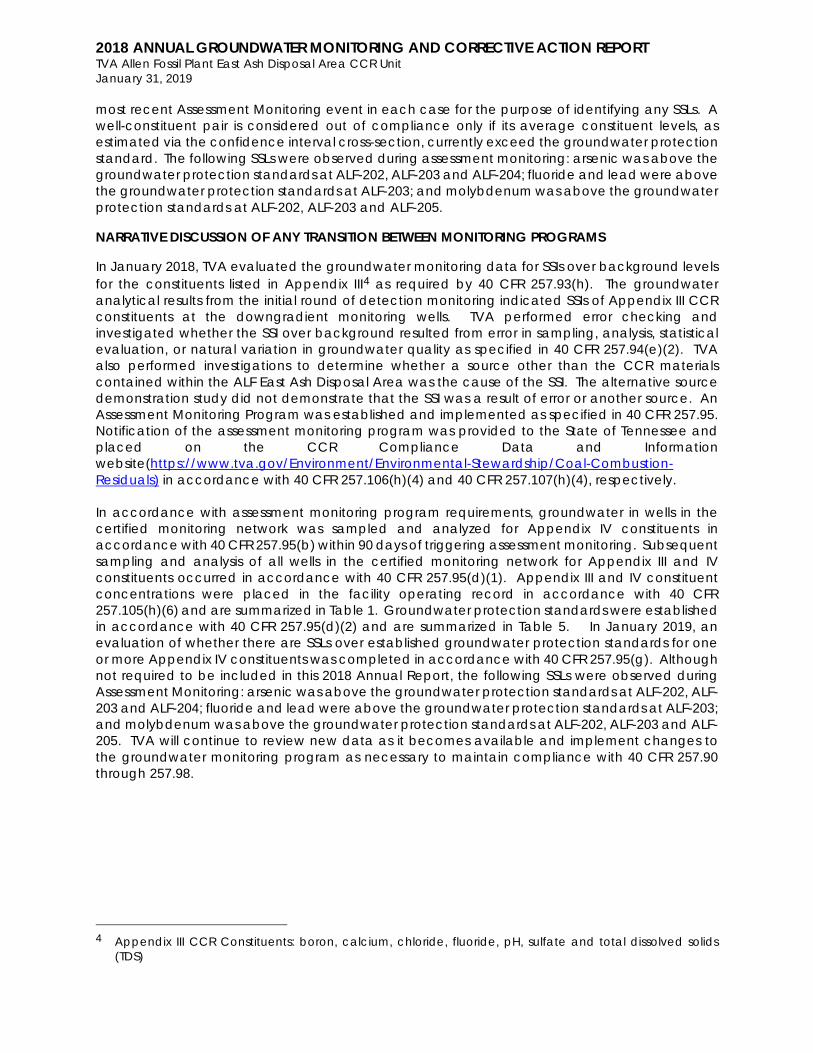
2018 ANNUAL GROUNDWATER MONITORING AND CORRECTIVE ACTION REPORT TVA Allen Fossil Plant East Ash Disposal Area CCR Unit January 31, 2019 most recent Assessment Monitoring event in each case for the purpose of identifying any SSLs. A well-constituent pair is considered out of compliance only if its average constituent levels, as estimated via the confidence interval cross-section, currently exceed the groundwater protection standard. The following SSLs were observed during assessment monitoring: arsenic was above the groundwater protection standards at ALF-202, ALF-203 and ALF-204; fluoride and lead were above the groundwater protection standards at ALF-203; and molybdenum was above the groundwater protection standards at ALF-202, ALF-203 and ALF-205.
NARRATIVE DISCUSSION OF ANY TRANSITION BETWEEN MONITORING PROGRAMS
In January 2018, TVA evaluated the groundwater monitoring data for SSIs over background levels for the constituents listed in Appendix III4 as required by 40 CFR 257.93(h). The groundwater analytical results from the initial round of detection monitoring indicated SSIs of Appendix III CCR constituents at the downgradient monitoring wells. TVA performed error checking and investigated whether the SSI over background resulted from error in sampling, analysis, statistical evaluation, or natural variation in groundwater quality as specified in 40 CFR 257.94(e)(2). TVA also performed investigations to determine whether a source other than the CCR materials contained within the ALF East Ash Disposal Area was the cause of the SSI. The alternative source demonstration study did not demonstrate that the SSI was a result of error or another source. An Assessment Monitoring Program was established and implemented as specified in 40 CFR 257.95. Notification of the assessment monitoring program was provided to the State of Tennessee and placed on the CCR Compliance Data and Information website(https://www.tva.gov/Environment/Environmental-Stewardship/Coal-Combustion-Residuals) in accordance with 40 CFR 257.106(h)(4) and 40 CFR 257.107(h)(4), respectively. In accordance with assessment monitoring program requirements, groundwater in wells in the certified monitoring network was sampled and analyzed for Appendix IV constituents in accordance with 40 CFR 257.95(b) within 90 days of triggering assessment monitoring. Subsequent sampling and analysis of all wells in the certified monitoring network for Appendix III and IV constituents occurred in accordance with 40 CFR 257.95(d)(1). Appendix III and IV constituent concentrations were placed in the facility operating record in accordance with 40 CFR 257.105(h)(6) and are summarized in Table 1. Groundwater protection standards were established in accordance with 40 CFR 257.95(d)(2) and are summarized in Table 5. In January 2019, an evaluation of whether there are SSLs over established groundwater protection standards for one or more Appendix IV constituents was completed in accordance with 40 CFR 257.95(g). Although not required to be included in this 2018 Annual Report, the following SSLs were observed during Assessment Monitoring: arsenic was above the groundwater protection standards at ALF-202, ALF-203 and ALF-204; fluoride and lead were above the groundwater protection standards at ALF-203; and molybdenum was above the groundwater protection standards at ALF-202, ALF-203 and ALF-205. TVA will continue to review new data as it becomes available and implement changes to the groundwater monitoring program as necessary to maintain compliance with 40 CFR 257.90 through 257.98.
4 Appendix III CCR Constituents: boron, calcium, chloride, fluoride, pH, sulfate and total dissolved solids
(TDS)
2018 ANNUAL GROUNDWATER MONITORING AND CORRECTIVE ACTION REPORT TVA Allen Fossil Plant East Ash Disposal Area CCR Unit January 31, 2019
LIMITATIONS
This document entitled 2018 Annual Groundwater Monitoring and Corrective Action Report was prepared by Stantec Consulting Services Inc. (“Stantec”) for the Tennessee Valley Authority (the “Client”). The material in it reflects Stantec’s professional judgment in light of the scope, schedule and other limitations stated in the document. The opinions in the document are based on conditions and information existing at the time the document was published and do not take into account any subsequent changes. In preparing the document, Stantec relied upon data and information supplied to it by the client.
Prepared by (signature)
Benjamin D. Schutt, PE Environmental Engineer
Reviewed by (signature)
Jeremiah H. Armitage, LPG Senior Geologist
Reviewed by (signature)
John E. Griggs, LPG Principal Geologist
2018 ANNUAL GROUNDWATER MONITORING AND CORRECTIVE ACTION REPORT TVA Allen Fossil Plant East Ash Disposal Area CCR Unit January 31, 2019 References: Heath, R.C., 1983. Basic Groundwater Hydrology, U.S. Geological Survey Water-Supply Paper 2220, 86p. Terracon, 2019. Aquifer Testing and Equipment Blank Results. TVA CCR Rule – Allen Fossil Plant (ALF). Terracon Consultants, Inc. January 15, 2019. Attachments: Figure 1 – Map with CCR Unit Background and Downgradient Wells Figure 2 – Generalized Groundwater Flow Direction Map Table 1 – Assessment Monitoring Groundwater Sampling Results Table 2 – Groundwater Sampling Summary Table 3 – Groundwater and Surface Water Elevation Summary Table 4 – Hydraulic Conductivity Data Summary Table 5 – Groundwater Protection Standards Appendix A – 2018 Statistical Analysis Report

FIGURES

!(
AL
AR
GA
IL IN
MS SC
WVKYMO
NC
OH
TNVA
"
!(!(
!( !(
!(!(
!(
!(
!(
Docks
Power House
Switch Yard
McKellar Lake
East Ash Disposal Area
ALF-201ALF-202
ALF-203 ALF-204
ALF-205ALF-206
ALF-210
ALF-212
ALF-213
Notes
0 1,000500Feet!( Background Well
!( Downgradient WellCCR Unit Subject to CCR RuleTVA Property Boundary
U:\18
2603
174\
gis\m
xds\
ALF\
ALF_
Fig1_
wCCR
Unit_
Back
grou
nd_a
ndDo
wngr
adien
tWell
s.mxd
R
evise
d: 20
18-01
-30 By
: swh
eatle
y
($$¯
1:12,000 (At original document size of 8.5x11)
Disc laimer: Stantec assumes no responsibility fo r data supplied in e lectronic format. The recipient accepts full responsibility fo r verifying the accuracy and completeness of the data. The recipient releases Stantec, it s of ficers, em ployees, consultants and agents, from any and all claim s arising in any way from the content o r prov ision of the data.
1. Coordinate System: NAD 1983 StatePlane Tennessee FIPS 4100 Feet2. Imagery Provided by Client (dated 2016)
1
Tennessee Valley AuthorityAllen Fossil PlantCCR Rule
City of MemphisShelby County,Tennessee
182603174Prepared by WSW on 2018-01-30
Technical Review by SB on 2018-01-30Independent Review by JK on 2018-01-30
Map with CCR Unit Backgroundand Downgradient Wells
Project Location
Client/Project
Figure No.
Title

!(
AL
AR
GA
IL IN
MSSC
WVKYMO
NC
OH
TNVA
"
""
"
!(!(
!( !(
!(!(
!(
!(
!(
#* Docks
Power House
Switch Yard
McKellar Lake
East Ash Disposal Area
ALF-201ALF-202
ALF-203 ALF-204
ALF-205ALF-206
ALF-210
ALF-212
ALF-213
Notes
0 1,000500Feet#* Staff Gauge
!( Background Well
!( Downgradient Well
" Groundwater Flow Direction
"Groundwater Flow Direction(Gradient Reverses)*CCR Unit Subject to CCR RuleTVA Property Boundary
\\us
1269
-f01\
shar
ed_p
rojec
ts\18
2603
174\
gis\m
xds\
ALF\
2018
\ALF
_Fig2
_Gro
undw
ater
FlowD
irect
ionMa
p.m
xd
Rev
ised:
2019
-01-14
By: c
hblac
k
($$¯
1:12,000 (At original document size of 8.5x11)
Disclaimer: Stantec assumes no responsibility for data supplied in electronic format. The recipient accepts full responsibility for verifying the accuracy and completeness of the data. The recipient releases Stantec, its officers, employees, consultants and agents, from any and all claims arising in any way from the content or provision of the data.
1. Coordinate System: NAD 1983 StatePlane Tennessee FIPS 4100 Feet2. Imagery Provided by Client (dated 2016)
2
Tennessee Valley AuthorityAllen Fossil PlantCCR Rule
City of MemphisShelby County,Tennessee
182603174Prepared by CMB on 2019-01-14
Technical Review by WSW on 2019-01-14Independent Review by MD on 2019-01-14
Generalized GroundwaterFlow Direction Map
Project Location
Client/Project
Figure No.
TitleGroundwater flow directions are based on McKellar Lake elevationsand groundwater elevations from CCR and Non-CCR monitoring wells.
*Gradient has been observed to reverse and flow to the south during periodsof high surface water levels in McKellar Lake(1/30/17, 3/28/17, 4/18/17, 5/8/17, 6/12/17, 7/12/17, 7/18/17, 8/22/17 and 9/25/17)
TABLES
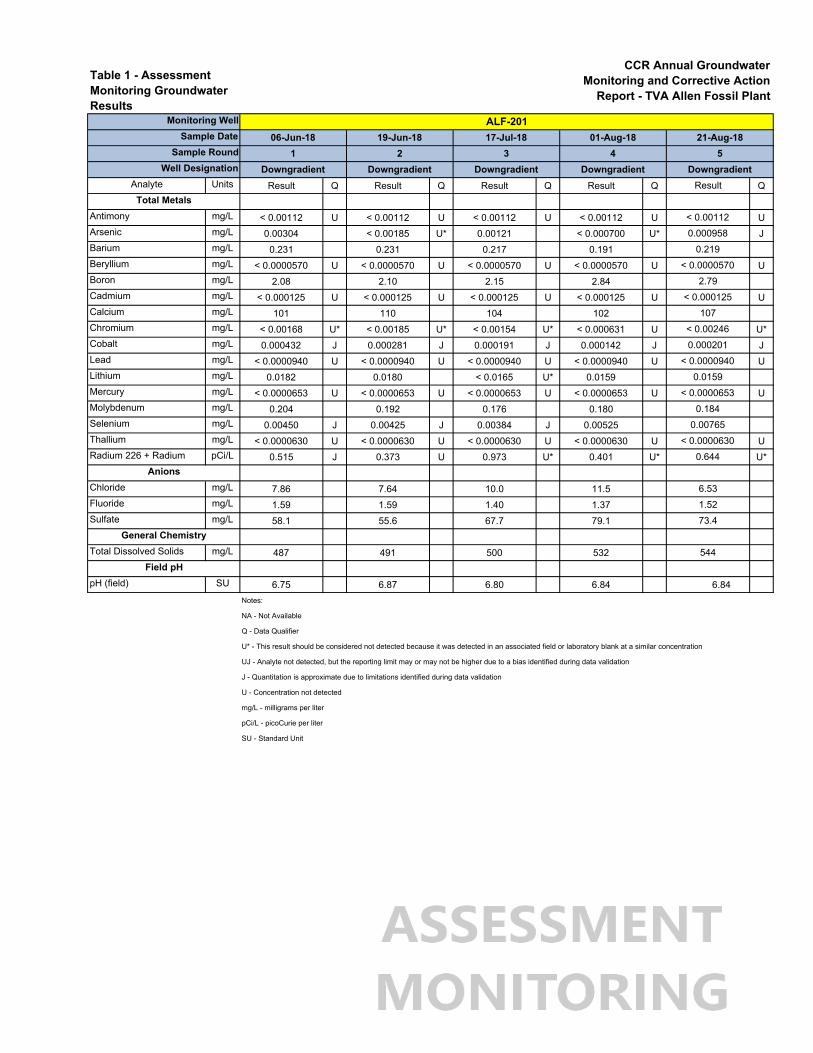
Analyte Units Result Q Result Q Result Q Result Q Q
Antimony mg/L < 0.00112 U < 0.00112 U < 0.00112 U < 0.00112 U UArsenic mg/L 0.00304 < 0.00185 U* 0.00121 < 0.000700 U* JBarium mg/L 0.231 0.231 0.217 0.191Beryllium mg/L < 0.0000570 U < 0.0000570 U < 0.0000570 U < 0.0000570 U UBoron mg/L 2.08 2.10 2.15 2.84Cadmium mg/L < 0.000125 U < 0.000125 U < 0.000125 U < 0.000125 U UCalcium mg/L 101 110 104 102Chromium mg/L < 0.00168 U* < 0.00185 U* < 0.00154 U* < 0.000631 U U*Cobalt mg/L 0.000432 J 0.000281 J 0.000191 J 0.000142 J JLead mg/L < 0.0000940 U < 0.0000940 U < 0.0000940 U < 0.0000940 U ULithium mg/L 0.0182 0.0180 < 0.0165 U* 0.0159Mercury mg/L < 0.0000653 U < 0.0000653 U < 0.0000653 U < 0.0000653 U UMolybdenum mg/L 0.204 0.192 0.176 0.180Selenium mg/L 0.00450 J 0.00425 J 0.00384 J 0.00525Thallium mg/L < 0.0000630 U < 0.0000630 U < 0.0000630 U < 0.0000630 U URadium 226 + Radium 228
pCi/L 0.515 J 0.373 U 0.973 U* 0.401 U* U*
Chloride mg/L 7.86 7.64 10.0 11.5Fluoride mg/L 1.59 1.59 1.40 1.37Sulfate mg/L 58.1 55.6 67.7 79.1
Total Dissolved Solids mg/L 487 491 500 532
pH (field) SU 6.75 6.87 6.80 6.84 6.84Notes:
NA - Not Available
Q - Data Qualifier
U* - This result should be considered not detected because it was detected in an associated field or laboratory blank at a similar concentration
UJ - Analyte not detected, but the reporting limit may or may not be higher due to a bias identified during data validation
J - Quantitation is approximate due to limitations identified during data validation
U - Concentration not detected
mg/L - milligrams per liter
pCi/L - picoCurie per liter
SU - Standard Unit
Field pH
6.531.5273.4
General Chemistry
544
0.1840.00765
< 0.00006300.644
Anions
107< 0.002460.000201
< 0.00009400.0159
< 0.0000653
< 0.001120.000958
0.219< 0.0000570
2.79< 0.000125
ResultTotal Metals
Well Designation Downgradient Downgradient Downgradient Downgradient Downgradient
Sample Round 1 2 3 4 5
Sample Date 06-Jun-18 19-Jun-18 17-Jul-18 01-Aug-18 21-Aug-18
Monitoring Well ALF-201
Table 1 - Assessment Monitoring Groundwater Results
CCR Annual Groundwater Monitoring and Corrective Action
Report - TVA Allen Fossil Plant

Analyte Units
Antimony mg/LArsenic mg/LBarium mg/LBeryllium mg/LBoron mg/LCadmium mg/LCalcium mg/LChromium mg/LCobalt mg/LLead mg/LLithium mg/LMercury mg/LMolybdenum mg/LSelenium mg/LThallium mg/LRadium 226 + Radium 228
pCi/L
Chloride mg/LFluoride mg/LSulfate mg/L
Total Dissolved Solids mg/L
pH (field) SUField pH
General Chemistry
Anions
Total Metals
Well DesignationSample Round
Sample DateMonitoring Well
Table 1 - Assessment Monitoring Groundwater Results
Result Q Result Q Result Q Result Q Result Q
< 0.00112 U < 0.00112 U < 0.00112 U < 0.00112 U < 0.00112 U0.399 0.363 0.426 0.329 0.321
0.0624 0.0759 0.0747 0.0685 0.0734< 0.0000570 U < 0.0000570 U < 0.0000570 U < 0.0000570 U < 0.0000570 U
6.44 5.96 5.55 6.77 6.18< 0.000125 U < 0.000125 U < 0.000125 U 0.000188 J < 0.000125 U
17.4 23.0 24.1 28.3 23.9< 0.00138 U* < 0.00181 U* < 0.00156 U* < 0.000631 U < 0.00162 U*0.000102 J 0.000162 J 0.0000940 J < 0.0000750 U 0.0000860 J
< 0.000533 U* 0.000374 J 0.000340 J 0.000293 J 0.000286 J< 0.00752 U* < 0.00614 U* < 0.00854 U* 0.00821 0.00720
< 0.0000653 U < 0.0000653 U < 0.0000653 U < 0.0000653 U < 0.0000653 U0.276 0.269 0.355 0.486 0.518
< 0.000813 U < 0.000813 U < 0.000813 U < 0.000813 U < 0.000813 U< 0.0000630 U < 0.0000630 U < 0.0000630 U < 0.0000630 U < 0.0000630 U
0.250 U 0.335 J 0.240 U* 0.404 U* 0.396 U*
14.4 15.0 16.4 16.6 15.43.09 3.12 3.16 3.14 3.39139 136 143 145 128
397 368 378 398 393
7.21 7.50 7.39 7.38 7.34Notes:
NA - Not Available
Q - Data Qualifier
U* - This result should be considered not detected because it was detected in an associated field or laboratory blank at a similar concentration
UJ - Analyte not detected, but the reporting limit may or may not be higher due to a bias identified during data validation
J - Quantitation is approximate due to limitations identified during data validation
U - Concentration not detected
mg/L - milligrams per liter
pCi/L - picoCurie per liter
SU - Standard Unit
Downgradient Downgradient Downgradient Downgradient Downgradient1 2 3 4 5
05-Jun-18 19-Jun-18 17-Jul-18 31-Jul-18 21-Aug-18ALF-202
CCR Annual Groundwater Monitoring and Corrective Action
Report - TVA Allen Fossil Plant
Analyte Units
Antimony mg/LArsenic mg/LBarium mg/LBeryllium mg/LBoron mg/LCadmium mg/LCalcium mg/LChromium mg/LCobalt mg/LLead mg/LLithium mg/LMercury mg/LMolybdenum mg/LSelenium mg/LThallium mg/LRadium 226 + Radium 228
pCi/L
Chloride mg/LFluoride mg/LSulfate mg/L
Total Dissolved Solids mg/L
pH (field) SUField pH
General Chemistry
Anions
Total Metals
Well DesignationSample Round
Sample DateMonitoring Well
Table 1 - Assessment Monitoring Groundwater Results
Result Q Result Q Result Q Result Q Result Q
0.00176 J 0.00188 J 0.00203 0.00192 J 0.002082.17 2.19 3.26 3.13 2.95
0.0266 0.0264 0.0253 0.0196 0.01910.000164 J 0.000141 J 0.000100 J 0.000104 J 0.0000570 J
5.51 6.24 5.89 7.31 5.660.00233 0.00225 0.00215 0.00132 0.00154
7.62 7.31 7.23 7.51 5.53< 0.00406 U* < 0.00431 U* < 0.00381 U* 0.00137 J < 0.00460 U*0.000723 0.000813 0.000682 0.000358 J 0.000413 J
0.0563 0.0554 0.0516 0.0413 0.0409< 0.00486 U* < 0.00256 U < 0.00256 U < 0.00256 U < 0.00495 U*
< 0.0000653 U < 0.0000653 U 0.0000680 J < 0.0000653 U < 0.0000653 U0.366 0.384 0.382 0.381 0.382
0.00710 0.00711 0.00961 0.00625 0.00851< 0.0000630 U < 0.0000630 U < 0.0000630 U < 0.0000630 U < 0.0000630 U
0.407 U 0.838 U* 0.652 U* 0.581 U* 0.556 U*
17.0 18.4 18.5 18.7 18.14.16 4.59 4.45 4.70 4.98195 214 200 198 197
638 637 618 665 720
9.46 9.96 9.85 9.97 10.14Notes:
NA - Not Available
Q - Data Qualifier
U* - This result should be considered not detected because it was detected in an associated field or laboratory blank at a similar concentration
UJ - Analyte not detected, but the reporting limit may or may not be higher due to a bias identified during data validation
J - Quantitation is approximate due to limitations identified during data validation
U - Concentration not detected
mg/L - milligrams per liter
pCi/L - picoCurie per liter
SU - Standard Unit
Downgradient Downgradient Downgradient DowngradientDowngradient2 3 4 51
22-Aug-1807-Jun-18 21-Jun-18 18-Jul-18 01-Aug-18ALF-203
CCR Annual Groundwater Monitoring and Corrective Action
Report - TVA Allen Fossil Plant
Analyte Units
Antimony mg/LArsenic mg/LBarium mg/LBeryllium mg/LBoron mg/LCadmium mg/LCalcium mg/LChromium mg/LCobalt mg/LLead mg/LLithium mg/LMercury mg/LMolybdenum mg/LSelenium mg/LThallium mg/LRadium 226 + Radium 228
pCi/L
Chloride mg/LFluoride mg/LSulfate mg/L
Total Dissolved Solids mg/L
pH (field) SUField pH
General Chemistry
Anions
Total Metals
Well DesignationSample Round
Sample DateMonitoring Well
Table 1 - Assessment Monitoring Groundwater Results
Result Q Result Q Result Q Result Q Result Q
< 0.00112 U < 0.00112 U < 0.00112 U < 0.00112 U < 0.00112 U0.0808 0.0684 0.0547 0.0524 0.04690.400 0.404 0.374 0.307 0.350
< 0.0000570 U < 0.0000570 U < 0.0000570 U < 0.0000570 U < 0.0000570 U0.479 0.580 0.562 0.635 0.516
< 0.000125 U < 0.000125 U < 0.000125 U < 0.000125 U < 0.000125 U67.5 70.7 71.9 69.7 66.3
< 0.00147 U* < 0.00141 U* < 0.00150 U* < 0.000631 U < 0.00217 U*< 0.0000750 U < 0.0000750 U < 0.0000750 U < 0.0000750 U 0.000146 J< 0.0000940 U < 0.0000940 U < 0.0000940 U < 0.0000940 U < 0.0000940 U
< 0.00981 U* 0.00834 0.00840 0.00678 < 0.00953 U*< 0.0000653 U < 0.0000653 U < 0.0000653 U < 0.0000653 U < 0.0000653 U
0.0102 0.0105 0.0108 0.0112 0.0101< 0.000813 U < 0.000813 U < 0.000813 U < 0.000813 U < 0.000813 U< 0.0000630 U < 0.0000630 U < 0.0000630 U < 0.0000630 U < 0.0000630 U
0.473 J 0.364 U* 0.658 U* 0.409 U* 0.777 U*
15.3 14.6 15.0 16.0 11.40.198 0.168 0.166 0.186 0.14925.5 26.3 25.5 25.8 21.3
351 354 357 344 322
6.80 7.02 6.89 6.93 6.93Notes:
NA - Not Available
Q - Data Qualifier
U* - This result should be considered not detected because it was detected in an associated field or laboratory blank at a similar concentration
UJ - Analyte not detected, but the reporting limit may or may not be higher due to a bias identified during data validation
J - Quantitation is approximate due to limitations identified during data validation
U - Concentration not detected
mg/L - milligrams per liter
pCi/L - picoCurie per liter
SU - Standard Unit
DowngradientDowngradient Downgradient Downgradient Downgradient3 4 51 2
19-Jul-18 01-Aug-18 22-Aug-1807-Jun-18 20-Jun-18ALF-204
CCR Annual Groundwater Monitoring and Corrective Action
Report - TVA Allen Fossil Plant

Analyte Units
Antimony mg/LArsenic mg/LBarium mg/LBeryllium mg/LBoron mg/LCadmium mg/LCalcium mg/LChromium mg/LCobalt mg/LLead mg/LLithium mg/LMercury mg/LMolybdenum mg/LSelenium mg/LThallium mg/LRadium 226 + Radium 228
pCi/L
Chloride mg/LFluoride mg/LSulfate mg/L
Total Dissolved Solids mg/L
pH (field) SUField pH
General Chemistry
Anions
Total Metals
Well DesignationSample Round
Sample DateMonitoring Well
Table 1 - Assessment Monitoring Groundwater Results
Result Q Result Q Result Q Result Q Result Q
< 0.00112 U < 0.00112 U < 0.00112 U < 0.00112 U < 0.00112 U0.00115 < 0.00152 U* 0.00171 < 0.000950 U* 0.0196
0.167 0.181 0.170 0.120 0.467< 0.0000570 U < 0.0000570 U < 0.0000570 U < 0.0000570 U 0.0000680 J
6.95 8.35 7.12 8.01 7.67< 0.000125 U 0.000133 J 0.000272 J 0.000144 J 0.000476 J
88.4 97.1 86.8 80.3 81.1< 0.00157 U* < 0.00141 U* < 0.00141 U* < 0.000631 U < 0.00296 U*0.000919 0.00103 0.000860 0.000647 0.00101
< 0.0000940 U < 0.0000940 U 0.000119 J < 0.0000940 U 0.000445 J0.0221 0.0203 0.0182 0.0158 < 0.0153 U*
< 0.0000653 U < 0.0000653 U < 0.0000653 U 0.0000714 J < 0.0000653 U0.197 0.215 0.220 0.231 0.217
< 0.000813 U < 0.000813 U < 0.000813 U < 0.000813 U < 0.000813 U< 0.0000630 U < 0.0000630 U < 0.0000630 U < 0.0000630 U < 0.0000630 U
0.277 J 0.713 U* 0.727 J 1.02 3.18 J
17.0 16.3 17.9 1.15 J 13.81.77 1.68 1.60 0.205 J 1.8277.4 81.0 93.2 13.8 J 98.0
645 648 578 532 541
6.98 7.07 7.03 7.08 7.10Notes:
NA - Not Available
Q - Data Qualifier
U* - This result should be considered not detected because it was detected in an associated field or laboratory blank at a similar concentration
UJ - Analyte not detected, but the reporting limit may or may not be higher due to a bias identified during data validation
J - Quantitation is approximate due to limitations identified during data validation
U - Concentration not detected
mg/L - milligrams per liter
pCi/L - picoCurie per liter
SU - Standard Unit
Downgradient Downgradient Downgradient Downgradient Downgradient4 51 2 3
31-Jul-18 22-Aug-1807-Jun-18 20-Jun-18 19-Jul-18ALF-205
CCR Annual Groundwater Monitoring and Corrective Action
Report - TVA Allen Fossil Plant
Analyte Units
Antimony mg/LArsenic mg/LBarium mg/LBeryllium mg/LBoron mg/LCadmium mg/LCalcium mg/LChromium mg/LCobalt mg/LLead mg/LLithium mg/LMercury mg/LMolybdenum mg/LSelenium mg/LThallium mg/LRadium 226 + Radium 228
pCi/L
Chloride mg/LFluoride mg/LSulfate mg/L
Total Dissolved Solids mg/L
pH (field) SUField pH
General Chemistry
Anions
Total Metals
Well DesignationSample Round
Sample DateMonitoring Well
Table 1 - Assessment Monitoring Groundwater Results
Result Q Result Q Result Q Result Q Result Q
< 0.00112 U < 0.00112 U < 0.00112 U < 0.00112 U < 0.00112 U0.00779 0.00827 0.00759 0.00858 0.00913
0.324 0.299 0.294 0.240 0.284< 0.0000570 U < 0.0000570 U < 0.0000570 U < 0.0000570 U < 0.0000570 U
0.107 0.121 0.0924 0.114 0.114< 0.000125 U < 0.000125 U < 0.000125 U < 0.000125 U < 0.000125 U
48.5 51.0 49.7 49.9 48.7< 0.00161 U* < 0.00144 U* < 0.00174 U* < 0.000631 U < 0.00239 U*
< 0.0000750 U 0.000115 J 0.0000770 J < 0.0000750 U < 0.0000750 U< 0.0000940 U < 0.0000940 U < 0.0000940 U < 0.0000940 U < 0.0000940 U
< 0.00750 U* 0.00770 0.00509 0.00579 < 0.00589 U*< 0.0000653 U < 0.0000653 U < 0.0000653 U < 0.0000653 U < 0.0000653 U
0.00245 J 0.00245 J 0.00225 J < 0.00208 U* < 0.00243 U*< 0.000813 U < 0.000813 U < 0.000813 U < 0.000813 U < 0.000813 U< 0.0000630 U < 0.0000630 U < 0.0000630 U < 0.0000630 U < 0.0000630 U
1.04 0.580 U* 0.515 U* 0.566 U* 1.11 J
16.1 15.8 16.4 17.5 13.70.336 0.318 0.262 0.326 0.31129.5 26.2 27.8 28.8 24.1
236 267 250 244 257
6.90 7.16 7.04 7.08 7.03Notes:
NA - Not Available
Q - Data Qualifier
U* - This result should be considered not detected because it was detected in an associated field or laboratory blank at a similar concentration
UJ - Analyte not detected, but the reporting limit may or may not be higher due to a bias identified during data validation
J - Quantitation is approximate due to limitations identified during data validation
U - Concentration not detected
mg/L - milligrams per liter
pCi/L - picoCurie per liter
SU - Standard Unit
Downgradient Downgradient Downgradient DowngradientDowngradient51 2 3 4
22-Aug-1806-Jun-18 20-Jun-18 19-Jul-18 01-Aug-18
CCR Annual Groundwater Monitoring and Corrective Action
Report - TVA Allen Fossil Plant
ALF-206

Analyte Units
Antimony mg/LArsenic mg/LBarium mg/LBeryllium mg/LBoron mg/LCadmium mg/LCalcium mg/LChromium mg/LCobalt mg/LLead mg/LLithium mg/LMercury mg/LMolybdenum mg/LSelenium mg/LThallium mg/LRadium 226 + Radium 228
pCi/L
Chloride mg/LFluoride mg/LSulfate mg/L
Total Dissolved Solids mg/L
pH (field) SUField pH
General Chemistry
Anions
Total Metals
Well DesignationSample Round
Sample DateMonitoring Well
Table 1 - Assessment Monitoring Groundwater Results
Result Q Result Q Result Q Result Q Result Q
< 0.00112 U < 0.00112 U < 0.00112 U < 0.00112 U < 0.00112 U0.00118 < 0.00114 U* 0.00170 < 0.00140 U* 0.00274
0.339 0.349 0.343 0.305 0.337< 0.0000570 U < 0.0000570 U < 0.0000570 U < 0.0000570 U < 0.0000570 U
0.0694 J 0.0741 J 0.0630 J 0.0726 J 0.0760 J< 0.000125 U < 0.000125 U < 0.000125 U < 0.000125 U < 0.000125 U
115 134 133 133 130< 0.00101 U* < 0.00179 U* < 0.00147 U* < 0.000631 U < 0.00179 U*0.00214 0.00274 0.00272 0.00229 0.00250
< 0.0000940 U < 0.0000940 U < 0.0000940 U < 0.0000940 U < 0.0000940 U0.0238 0.0259 0.0224 0.0231 0.0213
< 0.0000653 U < 0.0000653 U < 0.0000653 U < 0.0000653 U < 0.0000653 U0.00177 J 0.00173 J 0.00167 J < 0.00182 U* < 0.00171 U*0.00218 J 0.0138 < 0.000813 U 0.00185 J 0.000991 J
< 0.0000630 U < 0.0000630 U < 0.0000630 U < 0.0000630 U < 0.0000630 U0.262 J 0.455 U 0.709 J 0.867 J 0.998 J
0.980 J 1.13 1.17 19.1 J 0.955 J0.253 0.243 0.227 1.71 J 0.21711.6 14.1 13.7 102 J 10.3
508 490 495 491 491
6.60 6.62 6.66 6.58 6.63Notes:
NA - Not Available
Q - Data Qualifier
U* - This result should be considered not detected because it was detected in an associated field or laboratory blank at a similar concentration
UJ - Analyte not detected, but the reporting limit may or may not be higher due to a bias identified during data validation
J - Quantitation is approximate due to limitations identified during data validation
U - Concentration not detected
mg/L - milligrams per liter
pCi/L - picoCurie per liter
SU - Standard Unit
Background Background Background Background Background1 2 3 4 5
05-Jun-18 19-Jun-18 17-Jul-18 31-Jul-18 21-Aug-18
CCR Annual Groundwater Monitoring and Corrective Action
Report - TVA Allen Fossil Plant
ALF-210
Analyte Units
Antimony mg/LArsenic mg/LBarium mg/LBeryllium mg/LBoron mg/LCadmium mg/LCalcium mg/LChromium mg/LCobalt mg/LLead mg/LLithium mg/LMercury mg/LMolybdenum mg/LSelenium mg/LThallium mg/LRadium 226 + Radium 228
pCi/L
Chloride mg/LFluoride mg/LSulfate mg/L
Total Dissolved Solids mg/L
pH (field) SUField pH
General Chemistry
Anions
Total Metals
Well DesignationSample Round
Sample DateMonitoring Well
Table 1 - Assessment Monitoring Groundwater Results
Result Q Result Q Result Q Result Q Result Q
< 0.00112 U < 0.00112 U < 0.00112 U < 0.00112 U < 0.00112 U0.0147 0.0133 0.0130 0.0117 0.01550.247 0.241 0.234 0.189 0.196
< 0.0000570 U < 0.0000570 U < 0.0000570 U < 0.0000570 U < 0.0000570 U1.89 2.22 1.82 2.14 2.07
< 0.000125 U < 0.000125 U < 0.000125 U < 0.000125 U < 0.000125 U72.4 74.2 75.0 71.4 63.4
< 0.00168 U* < 0.00180 U* < 0.00113 U* < 0.000631 U < 0.00229 U*0.000258 J 0.000334 J 0.000249 J 0.000155 J 0.000288 J
< 0.0000940 U < 0.0000940 U < 0.0000940 U < 0.0000940 U < 0.0000940 U0.0151 < 0.0115 U* 0.0117 0.0123 0.0111
< 0.0000653 U < 0.0000653 U < 0.0000653 U < 0.0000653 U < 0.0000653 U0.0518 0.0547 0.0503 0.0511 0.0501
< 0.000813 U < 0.000813 U < 0.000813 U < 0.000813 U < 0.000813 U< 0.0000630 U < 0.0000630 U < 0.0000630 U < 0.0000630 U < 0.0000630 U
0.189 J 0.229 J 0.590 U* 0.467 U* 0.557 U*
15.9 15.0 17.4 16.5 J 11.61.12 1.11 1.18 0.991 J 1.372.87 4.75 3.05 3.75 J 3.49
369 370 373 376 378
6.66 7.01 6.88 6.96 6.92Notes:
NA - Not Available
Q - Data Qualifier
U* - This result should be considered not detected because it was detected in an associated field or laboratory blank at a similar concentration
UJ - Analyte not detected, but the reporting limit may or may not be higher due to a bias identified during data validation
J - Quantitation is approximate due to limitations identified during data validation
U - Concentration not detected
mg/L - milligrams per liter
pCi/L - picoCurie per liter
SU - Standard Unit
Downgradient Downgradient Downgradient Downgradient Downgradient1 2 3 4 5
06-Jun-18 19-Jun-18 18-Jul-18 31-Jul-18 21-Aug-18
CCR Annual Groundwater Monitoring and Corrective Action
Report - TVA Allen Fossil Plant
ALF-212
Analyte Units
Antimony mg/LArsenic mg/LBarium mg/LBeryllium mg/LBoron mg/LCadmium mg/LCalcium mg/LChromium mg/LCobalt mg/LLead mg/LLithium mg/LMercury mg/LMolybdenum mg/LSelenium mg/LThallium mg/LRadium 226 + Radium 228
pCi/L
Chloride mg/LFluoride mg/LSulfate mg/L
Total Dissolved Solids mg/L
pH (field) SUField pH
General Chemistry
Anions
Total Metals
Well DesignationSample Round
Sample DateMonitoring Well
Table 1 - Assessment Monitoring Groundwater Results
Result Q Result Q Result Q Result Q Result Q
< 0.00112 U < 0.00112 U < 0.00112 U < 0.00112 U < 0.00112 U0.00992 0.0145 0.0114 0.0215 0.0377
0.307 0.323 0.319 0.294 0.343< 0.0000570 U < 0.0000570 U < 0.0000570 U < 0.0000570 U < 0.0000570 U
0.177 0.203 0.167 0.220 0.211< 0.000125 U < 0.000125 U < 0.000125 U < 0.000125 U < 0.000125 U
39.6 45.2 43.4 53.7 56.7< 0.00162 U* < 0.00124 U* < 0.00160 U* < 0.000631 U < 0.00182 U*
< 0.0000750 U < 0.0000750 U < 0.0000750 U < 0.0000750 U 0.0000960 J< 0.0000940 U < 0.0000940 U < 0.0000940 U < 0.0000940 U < 0.0000940 U
< 0.00979 U* 0.00929 0.00653 0.00845 < 0.00839 U*< 0.0000653 U < 0.0000653 U < 0.0000653 U < 0.0000653 U < 0.0000653 U
0.00401 J 0.00356 J 0.00381 J < 0.00311 U* < 0.00295 U*< 0.000813 U < 0.000813 U < 0.000813 U < 0.000813 U < 0.000813 U< 0.0000630 U < 0.0000630 U < 0.0000630 U < 0.0000630 U < 0.0000630 U
0.627 J 0.943 J 0.743 J 0.764 U* 0.840 U*
15.5 15.7 16.7 16.0 11.00.466 0.421 0.390 0.402 0.32328.5 25.4 27.9 19.2 11.1
229 257 228 282 289
6.84 7.01 6.92 6.83 6.81Notes:
NA - Not Available
Q - Data Qualifier
U* - This result should be considered not detected because it was detected in an associated field or laboratory blank at a similar concentration
UJ - Analyte not detected, but the reporting limit may or may not be higher due to a bias identified during data validation
J - Quantitation is approximate due to limitations identified during data validation
U - Concentration not detected
mg/L - milligrams per liter
pCi/L - picoCurie per liter
SU - Standard Unit
Downgradient Downgradient Downgradient DowngradientDowngradient2 3 4 51
20-Jun-18 19-Jul-18 01-Aug-18 22-Aug-1806-Jun-18
CCR Annual Groundwater Monitoring and Corrective Action
Report - TVA Allen Fossil Plant
ALF-213
Well ID WellDesignation
Number of Samples Collected
June
5-7
, 201
8
June
18-
21, 2
018
July
17-
19, 2
018
July
31
- Aug
ust 1
, 201
8
Aug
ust 2
1-22
, 201
8
Assessment Monitoring Program
ALF-201 Downgradient 5 X X X X XAssessment Monitoring - 257.95(a); 257.95(b); 257.95(d)(1) - Appendix III and Appendix IV Constituents
ALF-202 Downgradient 5 X X X X XAssessment Monitoring - 257.95(a); 257.95(b); 257.95(d)(1) - Appendix III and Appendix IV Constituents
ALF-203 Downgradient 5 X X X X XAssessment Monitoring - 257.95(a); 257.95(b); 257.95(d)(1) - Appendix III and Appendix IV Constituents
ALF-204 Downgradient 5 X X X X XAssessment Monitoring - 257.95(a); 257.95(b); 257.95(d)(1) - Appendix III and Appendix IV Constituents
ALF-205 Downgradient 5 X X X X XAssessment Monitoring - 257.95(a); 257.95(b); 257.95(d)(1) - Appendix III and Appendix IV Constituents
ALF-206 Downgradient 5 X X X X XAssessment Monitoring - 257.95(a); 257.95(b); 257.95(d)(1) - Appendix III and Appendix IV Constituents
ALF-210 Background 5 X X X X XAssessment Monitoring - 257.95(a); 257.95(b); 257.95(d)(1) - Appendix III and Appendix IV Constituents
ALF-212 Downgradient 5 X X X X XAssessment Monitoring - 257.95(a); 257.95(b); 257.95(d)(1) - Appendix III and Appendix IV Constituents
ALF-213 Downgradient 5 X X X X XAssessment Monitoring - 257.95(a); 257.95(b); 257.95(d)(1) - Appendix III and Appendix IV Constituents
Notes:Baseline groundwater samples analyzed for Appendix III and Appendix IV constituents
Appendix III Constituents - boron, calcium, chloride, fluoride, pH, sulfate, total dissolved solids (TDS)
Appendix IV Constituents - antimony, arsenic, barium, beryllium, cadmium, chromium, cobalt, fluoride, lead, lithium, mercury, molybdenum, selenium, thallium, radium 226 and radium 228 combined
Table 2 - Groundwater Sampling Summary CCR Annual Groundwater Monitoring and Corrective Action Report - TVA Allen Fossil Plant

05-Jun-18 18-Jun-18 31-Jul-18 21-Aug-18Monitoring Well Units
ALF-201 ft-MSL 197.41 194.63 192.03 189.86ALF-202 ft-MSL 206.40 205.39 204.75 204.26ALF-203 ft-MSL 200.11 195.99 193.27 191.51ALF-204 ft-MSL 197.94 193.72 188.60 185.26ALF-205 ft-MSL 196.99 192.79 187.81 185.51ALF-206 ft-MSL 197.71 193.66 188.69 186.39ALF-210 ft-MSL 198.31 194.88 191.88 189.39ALF-212 ft-MSL 205.45 204.47 204.02 203.70ALF-213 ft-MSL 196.94 193.48 189.58 187.39
McKellar Lake ft-MSL 198.76 193.72 188.24 185.63
192.10194.44204.22192.34192.35
194.18205.08196.08192.11191.26
Groundwater Elevation Collection Date 17-Jul-18
Table 3Groundwater and Surface Water Elevation Summary
CCR Annual Groundwater Monitoring and Corrective Action Report - TVA Allen Fossil
Plant
CCR Annual Groundwater Monitoring and Corrective Action Report - Allen Fossil
Plant
Well ID Well Designation Slug Test Hydraulic Conductivity (cm/sec)
ALF-201 Downgradient 7.58E-05
ALF-202 Downgradient 3.16E-03
ALF-203 Downgradient 1.91E-04
ALF-204 Downgradient 2.62E-04
ALF-205 Downgradient 2.62E-04
ALF-206 Downgradient 1.31E-02
ALF-210 Background 7.15E-05
ALF-212 Downgradient 3.82E-04
ALF-213 Downgradient 5.02E-03
Geometric Mean of Hydraulic Conductivity (cm/sec)
5.63E-04
Notes:cm/sec - centimeters per second
Table 4 - Hydraulic Conductivity Data Summary
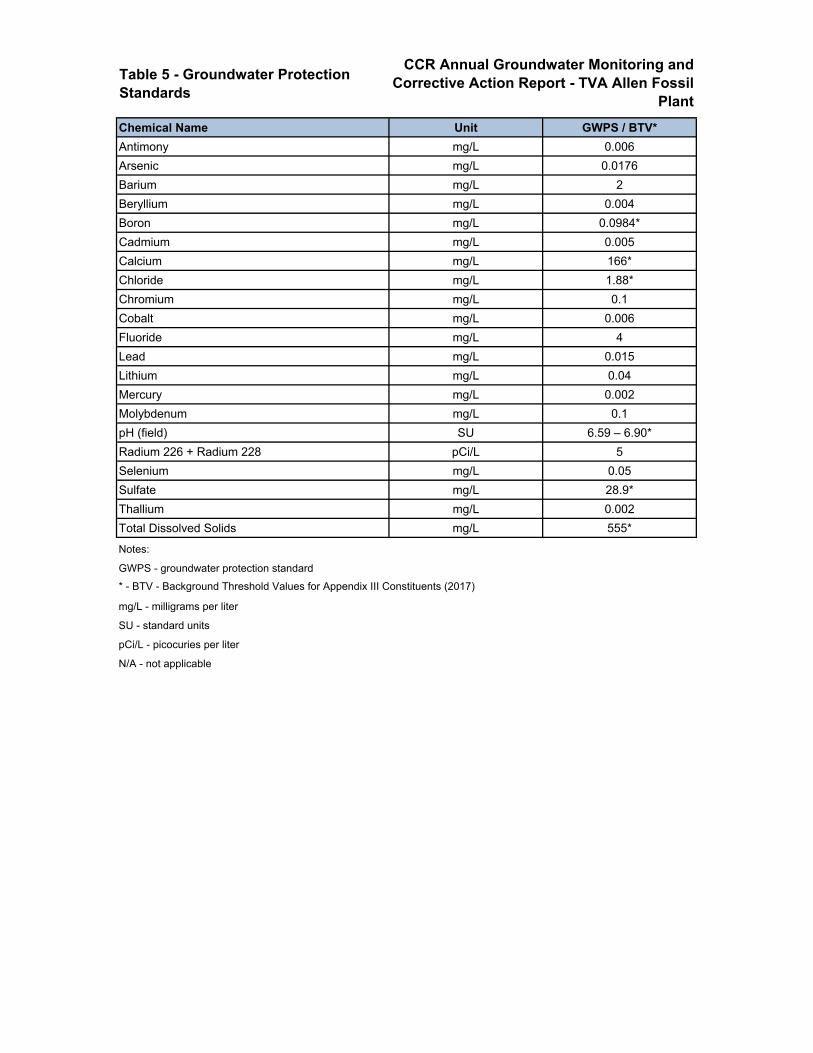
Table 5 - Groundwater Protection Standards
Chemical Name Unit GWPS / BTV*Antimony mg/L 0.006Arsenic mg/L 0.0176Barium mg/L 2Beryllium mg/L 0.004Boron mg/L 0.0984*Cadmium mg/L 0.005Calcium mg/L 166*Chloride mg/L 1.88*Chromium mg/L 0.1Cobalt mg/L 0.006Fluoride mg/L 4Lead mg/L 0.015Lithium mg/L 0.04Mercury mg/L 0.002Molybdenum mg/L 0.1pH (field) SU 6.59 – 6.90*Radium 226 + Radium 228 pCi/L 5Selenium mg/L 0.05Sulfate mg/L 28.9*Thallium mg/L 0.002Total Dissolved Solids mg/L 555*
Notes:
GWPS - groundwater protection standard* - BTV - Background Threshold Values for Appendix III Constituents (2017)
mg/L - milligrams per liter
SU - standard units
pCi/L - picocuries per liter
N/A - not applicable
CCR Annual Groundwater Monitoring and Corrective Action Report - TVA Allen Fossil
Plant

APPENDIX A STATISTICAL ANALYSIS REPORT

STATISTICAL ANALYSIS REPORT FOR
ALLEN FOSSIL PLANT
2018
1/14/2019
ALF Plant - CCR-Rule GWQM Program’s Year-Two Statistical Analysis Report Page i
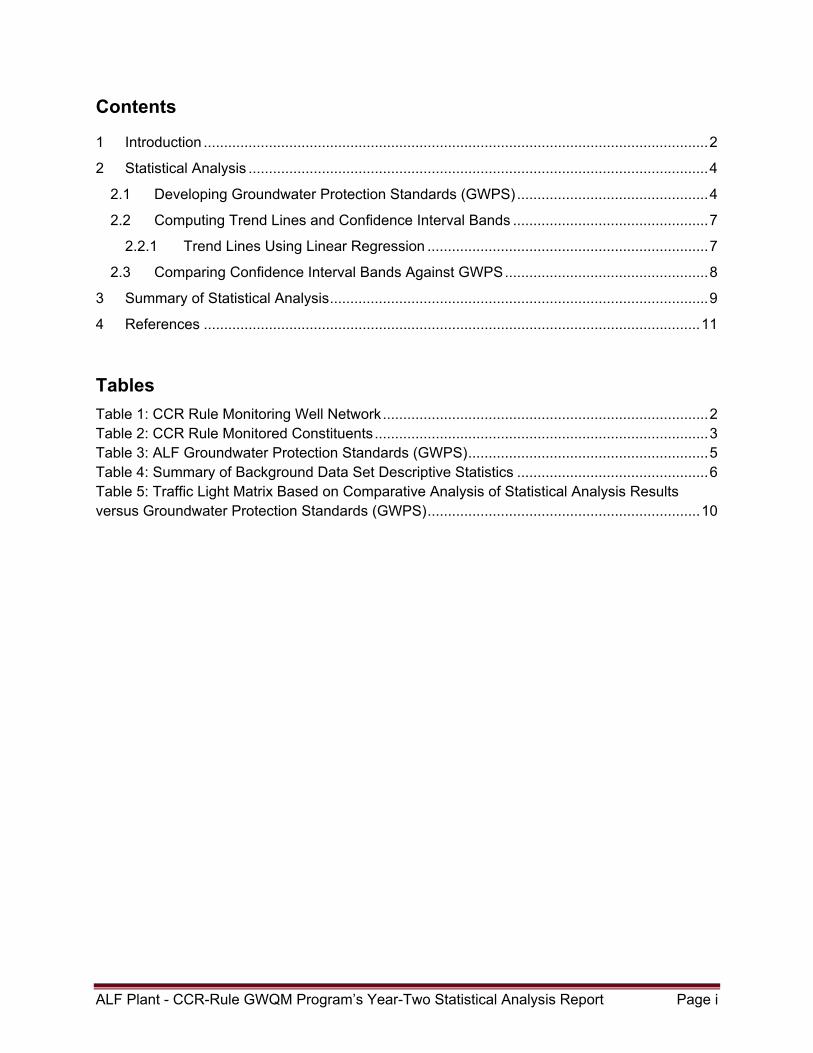
Contents
1 Introduction ............................................................................................................................ 2
2 Statistical Analysis ................................................................................................................. 4
2.1 Developing Groundwater Protection Standards (GWPS) ............................................... 4
2.2 Computing Trend Lines and Confidence Interval Bands ................................................ 7
2.2.1 Trend Lines Using Linear Regression ..................................................................... 7
2.3 Comparing Confidence Interval Bands Against GWPS .................................................. 8
3 Summary of Statistical Analysis ............................................................................................. 9
4 References .......................................................................................................................... 11
Tables Table 1: CCR Rule Monitoring Well Network ................................................................................ 2 Table 2: CCR Rule Monitored Constituents .................................................................................. 3 Table 3: ALF Groundwater Protection Standards (GWPS) ........................................................... 5 Table 4: Summary of Background Data Set Descriptive Statistics ............................................... 6 Table 5: Traffic Light Matrix Based on Comparative Analysis of Statistical Analysis Results versus Groundwater Protection Standards (GWPS) ................................................................... 10
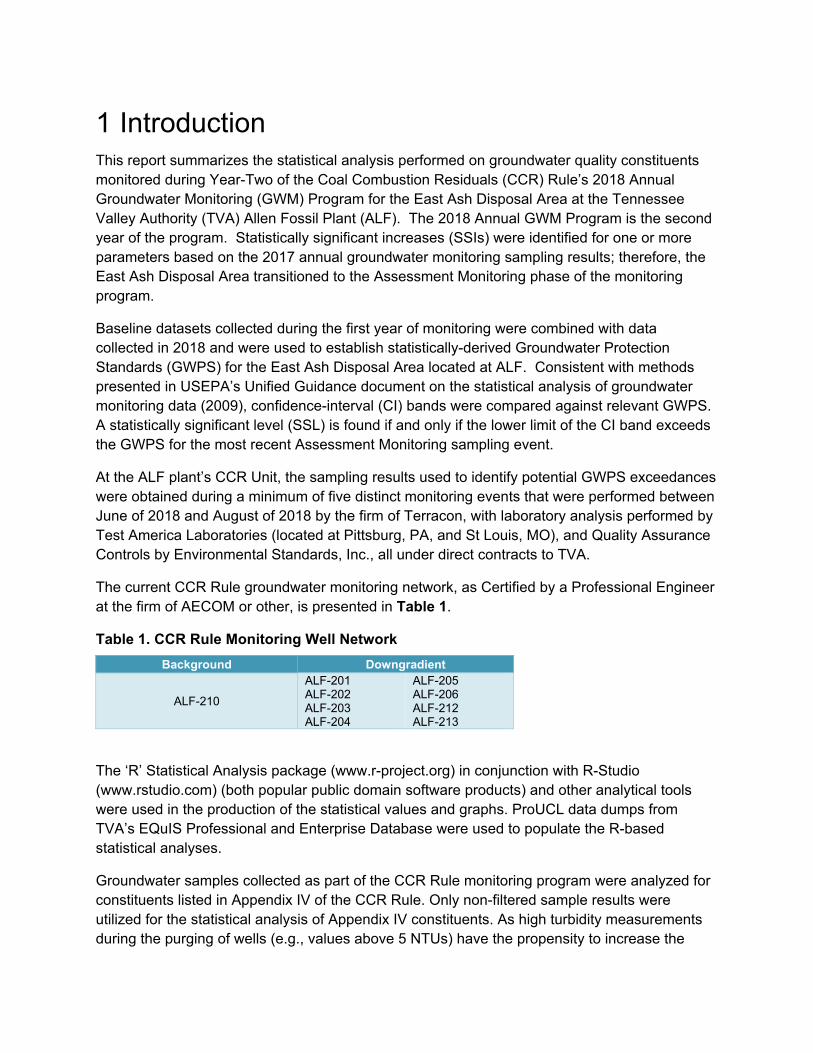
1 Introduction This report summarizes the statistical analysis performed on groundwater quality constituents monitored during Year-Two of the Coal Combustion Residuals (CCR) Rule’s 2018 Annual Groundwater Monitoring (GWM) Program for the East Ash Disposal Area at the Tennessee Valley Authority (TVA) Allen Fossil Plant (ALF). The 2018 Annual GWM Program is the second year of the program. Statistically significant increases (SSIs) were identified for one or more parameters based on the 2017 annual groundwater monitoring sampling results; therefore, the East Ash Disposal Area transitioned to the Assessment Monitoring phase of the monitoring program.
Baseline datasets collected during the first year of monitoring were combined with data collected in 2018 and were used to establish statistically-derived Groundwater Protection Standards (GWPS) for the East Ash Disposal Area located at ALF. Consistent with methods presented in USEPA’s Unified Guidance document on the statistical analysis of groundwater monitoring data (2009), confidence-interval (CI) bands were compared against relevant GWPS. A statistically significant level (SSL) is found if and only if the lower limit of the CI band exceeds the GWPS for the most recent Assessment Monitoring sampling event.
At the ALF plant’s CCR Unit, the sampling results used to identify potential GWPS exceedances were obtained during a minimum of five distinct monitoring events that were performed between June of 2018 and August of 2018 by the firm of Terracon, with laboratory analysis performed by Test America Laboratories (located at Pittsburg, PA, and St Louis, MO), and Quality Assurance Controls by Environmental Standards, Inc., all under direct contracts to TVA.
The current CCR Rule groundwater monitoring network, as Certified by a Professional Engineer at the firm of AECOM or other, is presented in Table 1.
Table 1. CCR Rule Monitoring Well Network Background Downgradient
ALF-210
ALF-201 ALF-202 ALF-203 ALF-204
ALF-205 ALF-206 ALF-212 ALF-213
The ‘R’ Statistical Analysis package (www.r-project.org) in conjunction with R-Studio (www.rstudio.com) (both popular public domain software products) and other analytical tools were used in the production of the statistical values and graphs. ProUCL data dumps from TVA’s EQuIS Professional and Enterprise Database were used to populate the R-based statistical analyses.
Groundwater samples collected as part of the CCR Rule monitoring program were analyzed for constituents listed in Appendix IV of the CCR Rule. Only non-filtered sample results were utilized for the statistical analysis of Appendix IV constituents. As high turbidity measurements during the purging of wells (e.g., values above 5 NTUs) have the propensity to increase the
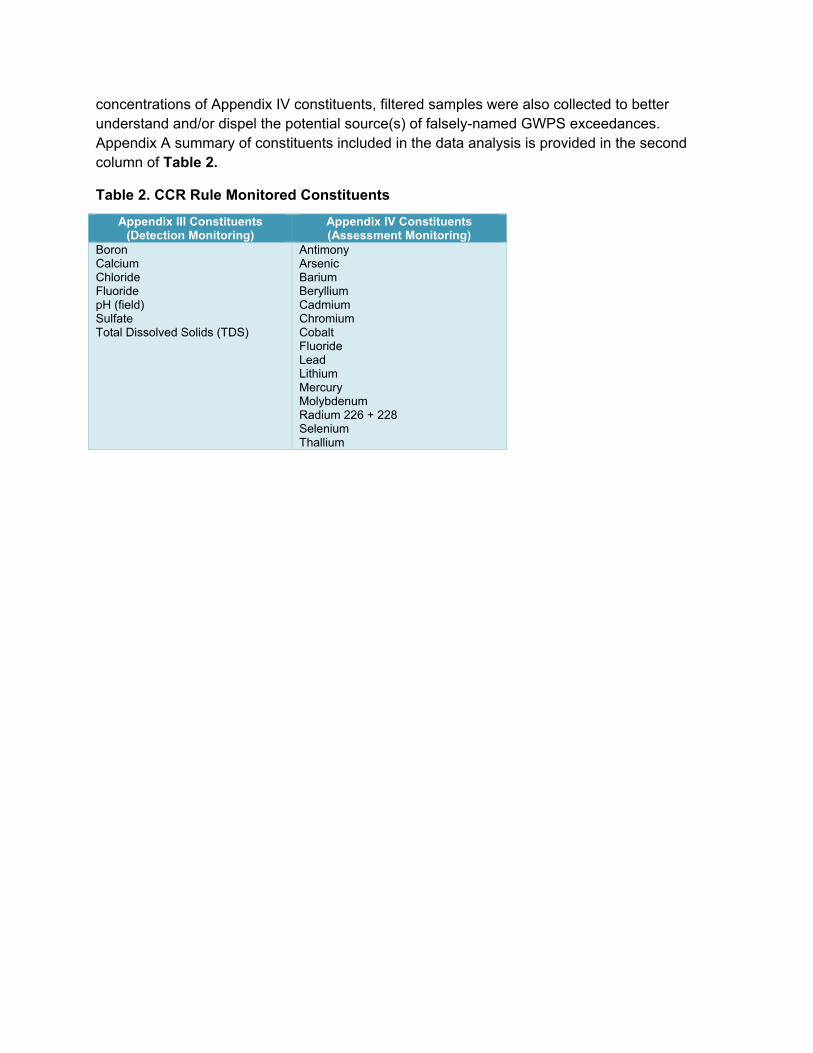
concentrations of Appendix IV constituents, filtered samples were also collected to better understand and/or dispel the potential source(s) of falsely-named GWPS exceedances. Appendix A summary of constituents included in the data analysis is provided in the second column of Table 2.
Table 2. CCR Rule Monitored Constituents
Appendix III Constituents (Detection Monitoring)
Appendix IV Constituents (Assessment Monitoring)
Boron Calcium Chloride Fluoride pH (field) Sulfate Total Dissolved Solids (TDS)
Antimony Arsenic Barium Beryllium Cadmium Chromium Cobalt Fluoride Lead Lithium Mercury Molybdenum Radium 226 + 228 Selenium Thallium

2 Statistical Analysis The Assessment Monitoring analysis includes the following steps:
1) Developing groundwater protection standards (GWPS) for each Appendix IV constituent. The GWPS is the published MCL/water quality limit or the background concentration (95% UTL with 95% coverage), whichever is larger;
2) Computing trends and associated confidence interval (CI) bands for each downgradient well location and Appendix IV constituent (i.e., each well-constituent pair); and
3) Comparing each CI band against its respective GWPS to assess whether an exceedance occurred.
2.1 Developing Groundwater Protection Standards (GWPS) According to the promulgated CCR Rule (80 Federal Register 21302, 21405, April 17, 2015): “For each appendix IV constituent that is detected, a groundwater protection standard must be set. The groundwater protection standards must be the MCL or the background concentration level for the detected constituent, whichever is higher. If there is no MCL promulgated for a detected constituent, then the groundwater protection standard must be set at background.”
On July 17, 2018, EPA unofficially promulgated alternate regulatory limits (i.e., potential GWPSs) for the four of the Appendix IV chemical Constituents of Interest (COIs) for which the agency has not assigned MCLs to date. In the absence of MCLs or site-specific GWPS, those may be used in place of background levels under 257.95(h)(2).
Specifically, those alternate COIs include threshold values at the following health-based levels:
1. Cobalt - 6 µg/L 2. Lithium - 40 µg/L 3. Molybdenum – 100 µg/L 4. Lead - 15 µg/L.
An Upper Tolerance Limit (UTL) with 95% confidence and 95% coverage was calculated using pooled site-specific background data for each Appendix IV parameter. Then these UTLs were compared against promulgated regulatory limits to determine the site-specific GWPS.
To handle any non-detects in these calculations, non-detect values were treated as statistically ‘left-censored,’ with the censoring limit equal to the reporting limit (RL). Then the Kaplan-Meier adjustment method (USEPA, 2009) was employed to derive estimated summary statistics that account for the presence of non-detects.
For the Allen Fossil Plant, Table 3, lists the calculated UTLs and final GWPS established for the East Ash Disposal Area CCR Unit.
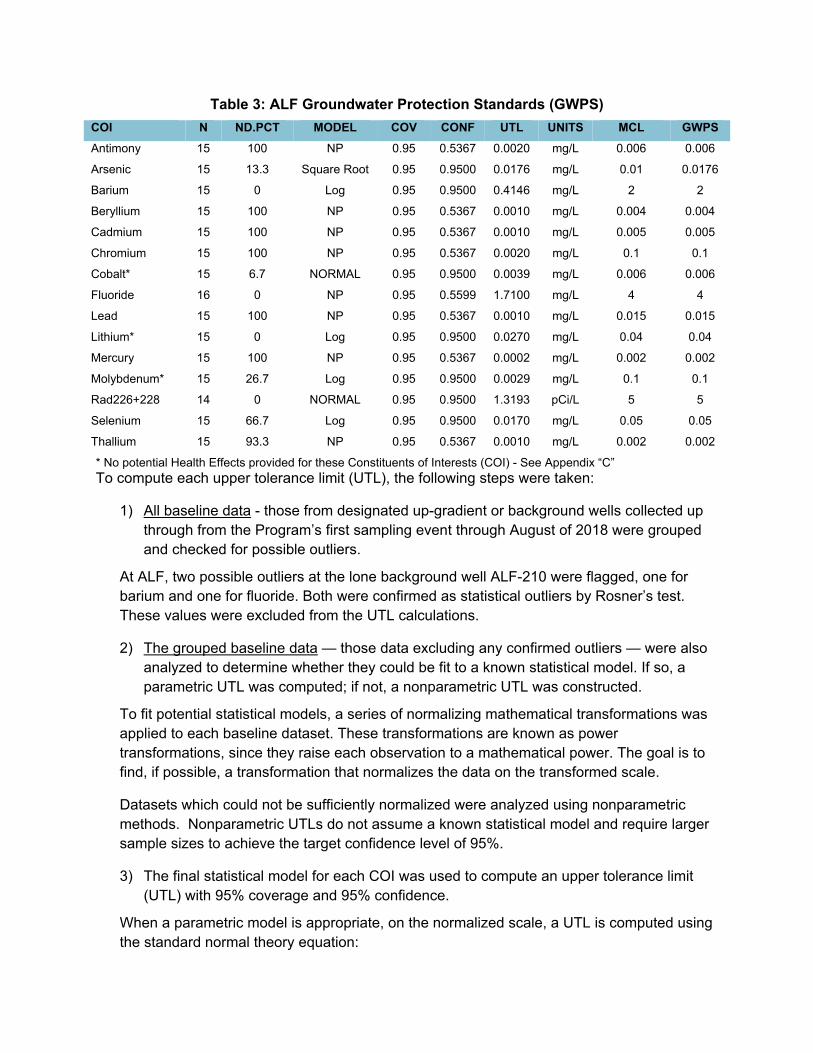
Table 3: ALF Groundwater Protection Standards (GWPS) COI N ND.PCT MODEL COV CONF UTL UNITS MCL GWPS Antimony 15 100 NP 0.95 0.5367 0.0020 mg/L 0.006 0.006
Arsenic 15 13.3 Square Root 0.95 0.9500 0.0176 mg/L 0.01 0.0176
Barium 15 0 Log 0.95 0.9500 0.4146 mg/L 2 2
Beryllium 15 100 NP 0.95 0.5367 0.0010 mg/L 0.004 0.004
Cadmium 15 100 NP 0.95 0.5367 0.0010 mg/L 0.005 0.005
Chromium 15 100 NP 0.95 0.5367 0.0020 mg/L 0.1 0.1
Cobalt* 15 6.7 NORMAL 0.95 0.9500 0.0039 mg/L 0.006 0.006
Fluoride 16 0 NP 0.95 0.5599 1.7100 mg/L 4 4
Lead 15 100 NP 0.95 0.5367 0.0010 mg/L 0.015 0.015
Lithium* 15 0 Log 0.95 0.9500 0.0270 mg/L 0.04 0.04
Mercury 15 100 NP 0.95 0.5367 0.0002 mg/L 0.002 0.002
Molybdenum* 15 26.7 Log 0.95 0.9500 0.0029 mg/L 0.1 0.1
Rad226+228 14 0 NORMAL 0.95 0.9500 1.3193 pCi/L 5 5
Selenium 15 66.7 Log 0.95 0.9500 0.0170 mg/L 0.05 0.05
Thallium 15 93.3 NP 0.95 0.5367 0.0010 mg/L 0.002 0.002
* No potential Health Effects provided for these Constituents of Interests (COI) - See Appendix “C” To compute each upper tolerance limit (UTL), the following steps were taken:
1) All baseline data - those from designated up-gradient or background wells collected up through from the Program’s first sampling event through August of 2018 were grouped and checked for possible outliers.
At ALF, two possible outliers at the lone background well ALF-210 were flagged, one for barium and one for fluoride. Both were confirmed as statistical outliers by Rosner’s test. These values were excluded from the UTL calculations.
2) The grouped baseline data — those data excluding any confirmed outliers — were also analyzed to determine whether they could be fit to a known statistical model. If so, a parametric UTL was computed; if not, a nonparametric UTL was constructed.
To fit potential statistical models, a series of normalizing mathematical transformations was applied to each baseline dataset. These transformations are known as power transformations, since they raise each observation to a mathematical power. The goal is to find, if possible, a transformation that normalizes the data on the transformed scale.
Datasets which could not be sufficiently normalized were analyzed using nonparametric methods. Nonparametric UTLs do not assume a known statistical model and require larger sample sizes to achieve the target confidence level of 95%.
3) The final statistical model for each COI was used to compute an upper tolerance limit (UTL) with 95% coverage and 95% confidence.
When a parametric model is appropriate, on the normalized scale, a UTL is computed using the standard normal theory equation:

where and s represent the mean and standard deviation of the (transformed) observations, and κ is a multiplier which depends on the number of baseline measurements, as well as the desired coverage and confidence levels. If the data have been transformed, the final UTL is derived by back-transforming the scaled UTL.
For nonparametric models, the normal theory equation does not apply. Instead, the UTL is selected as one of the largest of the sample values, typically the maximum. Because there is no multiplier as in the parametric case, the confidence level associated with a nonparametric UTL is computed ‘after the fact,’ based on the sample size and desired coverage level: the smaller the sample size, the lower the confidence; the bigger the sample size, the higher the confidence level.
Table 4. Summary of Background Data Set Descriptive Statistics
Constituent Unit Sample Size
No. of NDs
With NDs=MDLs Included Minimum Maximum Mean Median
Antimony mg/L 15 15 0.002 0.002 0.001 0.002
Arsenic mg/L 15 2 0.00114 0.0106 0.0048 0.00351
Barium mg/L 15 0 0.298 0.424 0.3353 0.335
Beryllium mg/L 15 15 0.001 0.001 5.00E-04 0.001
Cadmium mg/L 15 15 0.001 0.001 5.00E-04 0.001
Chromium mg/L 15 15 0.002 0.002 0.001 0.002
Cobalt mg/L 15 1 1.64E-04 0.00274 0.0015 0.00181
Lead mg/L 16 0 0.169 1.71 0.3187 0.2225
Lithium mg/L 15 15 0.001 0.001 5.00E-04 0.001
Mercury mg/L 15 0 0.0203 0.0259 0.0223 0.0224
Molybdenum mg/L 15 15 2.00E-04 2.00E-04 1.00E-04 2.00E-04
Radium 226 + 228
pCi/L 15 4 0.00122 0.005 0.0017 0.00161
Selenium mg/L 14 0 0.262 1.13 0.7159 0.7165
Thallium mg/L 15 10 6.87E-04 0.0138 0.0023 0.00185
Notes: 1. ND = not detected above the laboratory reporting limit. 2. MDL = method detection limit. 3. “--“indicates all results for the respective constituent were NDs, or with the case of radium 226/228, NDs were flagged but the
laboratory did not provide a value for the MDL. 4. Numbers are displayed using the same number of significant figures as reported by the laboratory. 5. If a constituent had 100% detections the descriptive statistics provided above are identical for the data including NDs and
excluding NDs.
UTL = x +κ sx
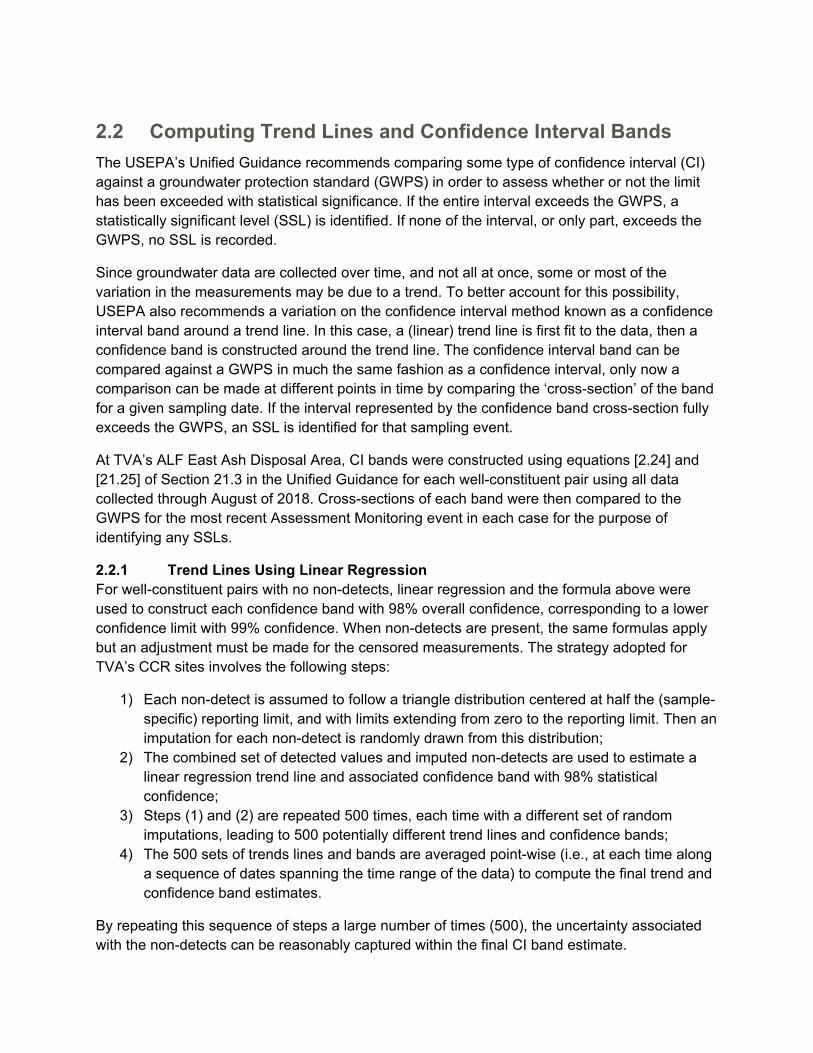
2.2 Computing Trend Lines and Confidence Interval Bands The USEPA’s Unified Guidance recommends comparing some type of confidence interval (CI) against a groundwater protection standard (GWPS) in order to assess whether or not the limit has been exceeded with statistical significance. If the entire interval exceeds the GWPS, a statistically significant level (SSL) is identified. If none of the interval, or only part, exceeds the GWPS, no SSL is recorded.
Since groundwater data are collected over time, and not all at once, some or most of the variation in the measurements may be due to a trend. To better account for this possibility, USEPA also recommends a variation on the confidence interval method known as a confidence interval band around a trend line. In this case, a (linear) trend line is first fit to the data, then a confidence band is constructed around the trend line. The confidence interval band can be compared against a GWPS in much the same fashion as a confidence interval, only now a comparison can be made at different points in time by comparing the ‘cross-section’ of the band for a given sampling date. If the interval represented by the confidence band cross-section fully exceeds the GWPS, an SSL is identified for that sampling event.
At TVA’s ALF East Ash Disposal Area, CI bands were constructed using equations [2.24] and [21.25] of Section 21.3 in the Unified Guidance for each well-constituent pair using all data collected through August of 2018. Cross-sections of each band were then compared to the GWPS for the most recent Assessment Monitoring event in each case for the purpose of identifying any SSLs.
2.2.1 Trend Lines Using Linear Regression For well-constituent pairs with no non-detects, linear regression and the formula above were used to construct each confidence band with 98% overall confidence, corresponding to a lower confidence limit with 99% confidence. When non-detects are present, the same formulas apply but an adjustment must be made for the censored measurements. The strategy adopted for TVA’s CCR sites involves the following steps:
1) Each non-detect is assumed to follow a triangle distribution centered at half the (sample-specific) reporting limit, and with limits extending from zero to the reporting limit. Then an imputation for each non-detect is randomly drawn from this distribution;
2) The combined set of detected values and imputed non-detects are used to estimate a linear regression trend line and associated confidence band with 98% statistical confidence;
3) Steps (1) and (2) are repeated 500 times, each time with a different set of random imputations, leading to 500 potentially different trend lines and confidence bands;
4) The 500 sets of trends lines and bands are averaged point-wise (i.e., at each time along a sequence of dates spanning the time range of the data) to compute the final trend and confidence band estimates.
By repeating this sequence of steps a large number of times (500), the uncertainty associated with the non-detects can be reasonably captured within the final CI band estimate.
2.3 Comparing Confidence Interval Bands Against GWPS To assess whether any SSLs occurred during the 2018 Assessment Monitoring at the ALF East Ash Disposal Area, the confidence interval (CI) bands were compared against the constituent-specific GWPS. An SSL was identified if and only if the CI band fully exceeded the GWPS at the most recent sampling event.
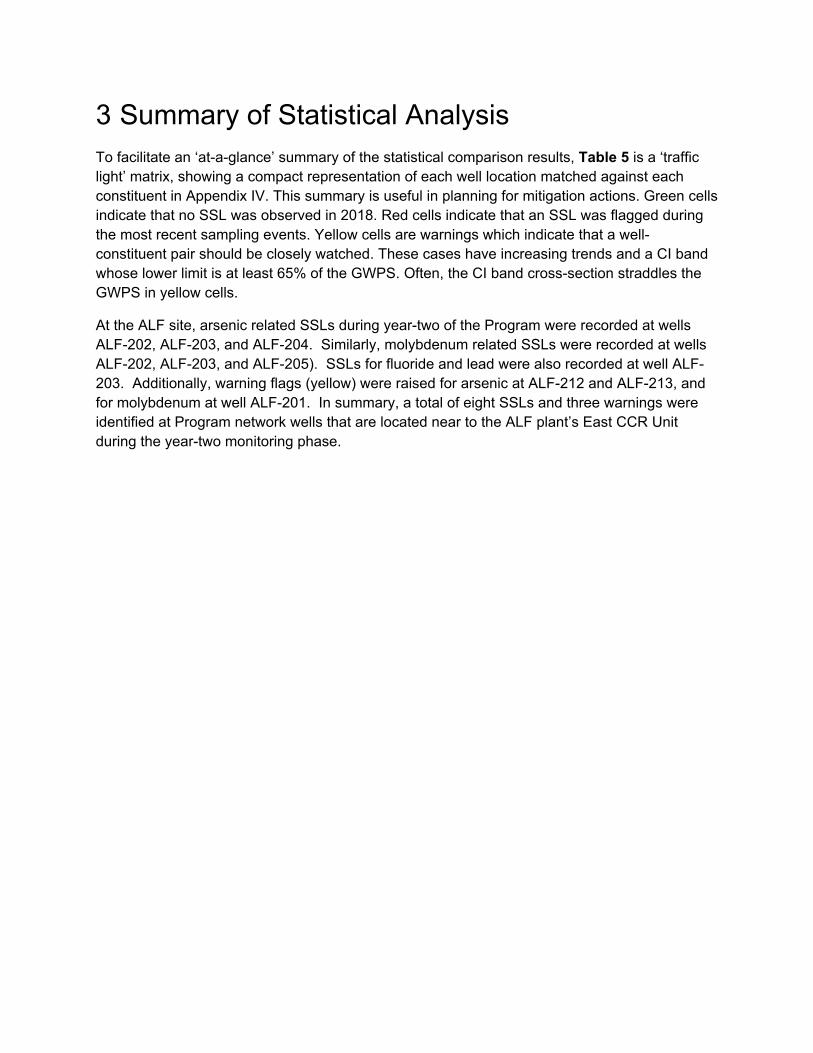
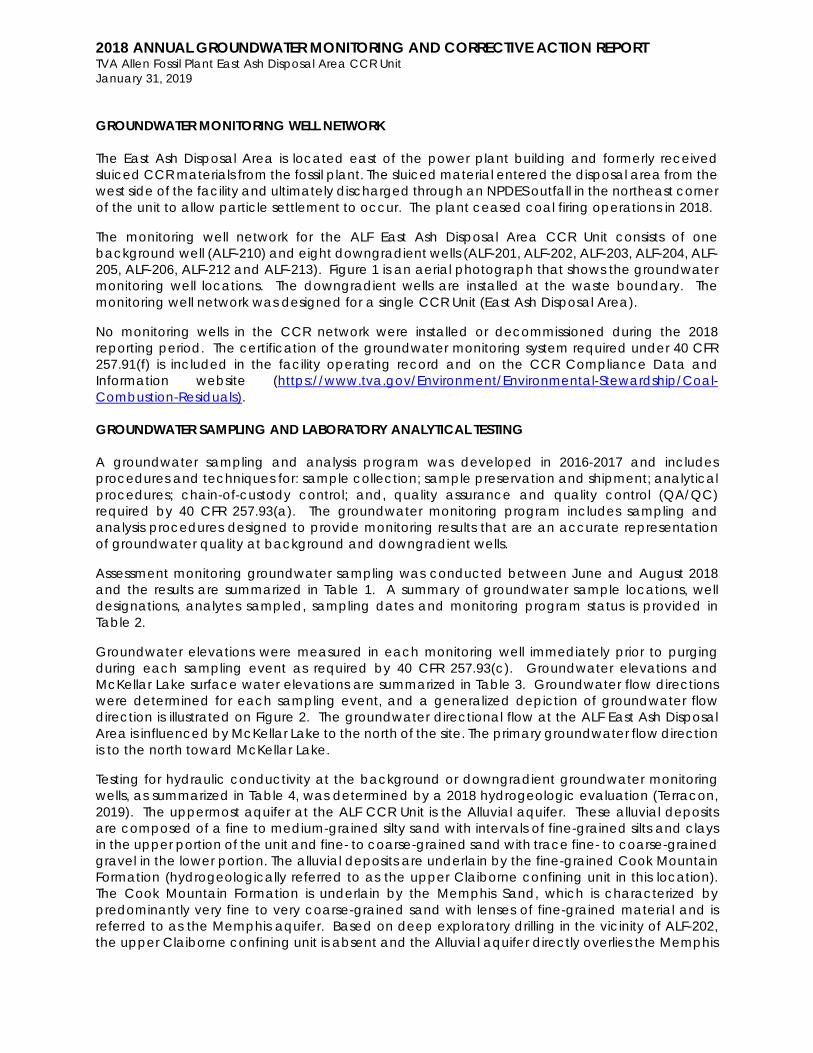
3 Summary of Statistical Analysis To facilitate an ‘at-a-glance’ summary of the statistical comparison results, Table 5 is a ‘traffic light’ matrix, showing a compact representation of each well location matched against each constituent in Appendix IV. This summary is useful in planning for mitigation actions. Green cells indicate that no SSL was observed in 2018. Red cells indicate that an SSL was flagged during the most recent sampling events. Yellow cells are warnings which indicate that a well-constituent pair should be closely watched. These cases have increasing trends and a CI band whose lower limit is at least 65% of the GWPS. Often, the CI band cross-section straddles the GWPS in yellow cells.
At the ALF site, arsenic related SSLs during year-two of the Program were recorded at wells ALF-202, ALF-203, and ALF-204. Similarly, molybdenum related SSLs were recorded at wells ALF-202, ALF-203, and ALF-205). SSLs for fluoride and lead were also recorded at well ALF-203. Additionally, warning flags (yellow) were raised for arsenic at ALF-212 and ALF-213, and for molybdenum at well ALF-201. In summary, a total of eight SSLs and three warnings were identified at Program network wells that are located near to the ALF plant’s East CCR Unit during the year-two monitoring phase.

Table 5: Traffic Light Matrix Based on Comparative Analysis of Statistical Analysis Results versus Groundwater Protection Standards (GWPS)
COLOR-CODING KEY: Monitored data for the specific COI are deemed to fall below GWPS Monitored data are deemed to fall below GWPS, but an internal warning is issued to TVA staff that CI band lower limit is at least 65% of the GWPS. Monitored data for the specific COI are deemed to exceed GWPS
ITEM No.
TRAFFIC LIGHT MATRIX Constituent of
Interest GROUNDWATER QUALITY MONITORING WELL LOCATIONS
ALF-210 ALF-201 ALF-202 ALF-212 ALF-213 ALF-206 ALF-205 ALF-204 ALF-203 1. Antimony GREEN GREEN GREEN GREEN GREEN GREEN GREEN GREEN GREEN 2. Arsenic GREEN GREEN RED YELLOW YELLOW GREEN GREEN RED RED 3. Barium GREEN GREEN GREEN GREEN GREEN GREEN GREEN GREEN GREEN 4. Beryllium GREEN GREEN GREEN GREEN GREEN GREEN GREEN GREEN GREEN 5. Cadmium GREEN GREEN GREEN GREEN GREEN GREEN GREEN GREEN GREEN 6. Chromium GREEN GREEN GREEN GREEN GREEN GREEN GREEN GREEN GREEN 7. Cobalt GREEN GREEN GREEN GREEN GREEN GREEN GREEN GREEN GREEN 8. Fluoride GREEN GREEN GREEN GREEN GREEN GREEN GREEN GREEN RED 9. Lead GREEN GREEN GREEN GREEN GREEN GREEN GREEN GREEN RED 10. Lithium GREEN GREEN GREEN GREEN GREEN GREEN GREEN GREEN GREEN 11. Mercury GREEN GREEN GREEN GREEN GREEN GREEN GREEN GREEN GREEN 12. Molybdenum GREEN YELLOW RED GREEN GREEN GREEN RED GREEN RED 13. Rad226+228 GREEN GREEN GREEN GREEN GREEN GREEN GREEN GREEN GREEN 14. Selenium GREEN GREEN GREEN GREEN GREEN GREEN GREEN GREEN GREEN 15. Thallium GREEN GREEN GREEN GREEN GREEN GREEN GREEN GREEN GREEN
4 References 1) US Environmental Protection Agency (2009) Statistical Analysis of Groundwater Monitoring Data at RCRA Facilities Unified Guidance - Office of Resource Conservation and Recovery EPA 530/R-09-007
2) US Environmental Protection Agency (2007) Framework for Metals Risk Assessment EPA 120/R-07/001 Office of the Science Advisor Risk Assessment Forum, Washington, DC 20460