Embed Size (px)
Citation preview
Atlas Arteria Limited ACN 141 075 201 Level 7, 50 Martin Place SYDNEY NSW 2000 GPO Box 4294 SYDNEY NSW 1164 AUSTRALIA
Telephone 612 8232 7455 Facsimile 612 8232 4713 Internet www.atlasarteria.com
Atlas Arteria International Limited
EC43828 The Belvedere Building, 69 Pitts Bay Road
Pembroke HM08 BERMUDA
15 March 2019
ASX RELEASE
Atlas Arteria
2018 Annual Report
Atlas Arteria (ALX) has today released its Annual Report for the year ended 31 December 2018 which can be viewed at ALX’s website www.atlasarteria.com.
For further information, please contact:
Investor Enquiries: Media Enquiries:
Phillipa Chen Laura Bramwell
Head of Investor Relations Public Affairs Manager
Tel: +61 2 8232 7455 Tel: +61 2 8232 3835
Email: [email protected] Email: [email protected]
For
per
sona
l use
onl
y

Atlas Arteria(formerly Macquarie Atlas Roads)
Annual Report 2018
For
per
sona
l use
onl
y
| 2018 Atlas Arteria Annual Report
Special notice Atlas Arteria (ALX) comprises Atlas Arteria Limited (ACN 141 075 201) (ATLAX) and Atlas Arteria International Limited (Registration No. 43828) (ATLIX). Macquarie Fund Advisers Pty Limited (ACN 127 735 960) (AFSL 318 123) (MFA) is the manager/adviser of ATLAX and ATLIX. MFA is a wholly owned subsidiary of Macquarie Group Limited (ACN 122 169 279) (MGL).
Stapling In accordance with its requirements in respect of stapled
ATLAX and ATLIX from the official list of ASX if, while the stapling arrangements apply, the securities in one of the entities ceases to be stapled to the securities in the other entity.
Takeover provisionsUnlike ATLAX, ATLIX is not subject to takeover provisions of Chapters 6, 6A, 6B and 6C of the Corporations Act. However, as the takeover provisions of the Corporations Act apply to ATLAX and its shareholders, by virtue of the stapling arrangements, the takeover provisions will apply to the holders of ALX stapled securities. This is notwithstanding that ATLIX and its shareholders are not subject to the takeover provisions of the Corporations Act.
DisclaimerNone of the entities noted in this document is an authorised deposit taking institution for the purposes of the Banking Act 1959 (Commonwealth of Australia). The obligations of these entities do not represent deposits or other liabilities of Macquarie Bank Limited ABN 46 008 583 542 (MBL). MBL does not guarantee or otherwise provide assurance in respect of the obligations of these entities. Investments in ALX are subject to investment risk, including possible delays in repayment and loss of income and capital invested.
Advice warningThe information in this annual report is given in good faith and derived from sources believed to be accurate at this date but no warranty of accuracy or reliability is given and no responsibility arising in any other way, including by reason of negligence for errors or omission herein, is accepted by ALX or its officers.
This annual report is not an offer or invitation for subscription or purchase of, or a recommendation of, securities. It does not take into account the investment objectives, financial situation and particular needs of the investor. Before making an investment in ALX, the investor or prospective investor should consider whether such an investment is appropriate to their particular investment needs, objectives and financial circumstances and consult an investment adviser if appropriate.
Manager feesMFA as manager of ATLAX and adviser to ATLIX is entitled to fees for so acting. MGL and its related corporations (including MFA), together with their officers and directors, may hold stapled securities in ALX from time to time.
ALX’s ongoing commitment to your privacyWe understand the importance you place on your privacy and are committed to protecting and maintaining the confidentiality of the personal information you provide to us. ALX’s privacy policy is available on the ALX website at www.atlasarteria.com or you can contact our investor relations team on 1800 621 694.
securities, ASX reserves the right to remove either or both of
For
per
sona
l use
onl
y

2018 Atlas Arteria Annual Report | 1
Contents 01 2018 at a glance 2
02 Chairpersons and CEO Message 4
03 A Review of ALX and its 6 Portfolio in 2018
04 Our Boards’ Directors 16
05 Governance 20
06 Sustainability 22
07 Financial Report 29
Directors’ Reports 31
Remuneration Report 39
Financial Statements 59
Directors’ Declaration 105
Independent Auditor’s Report 107
Securityholder Information 112
Corporate Directory 113
For
per
sona
l use
onl
y

ALX is a global infrastructure developer, operator and investor.
Committed to seeking to grow distributions and enhancing the value of our portfolio for securityholders.
Providing investors with exposure to a global portfolio of toll roads to generate stable cash flows and offer resilient long-term performance through economic cycles.
1. ALX has varying percentage ownership interest in each asset within its portfolio.
| 2018 Atlas Arteria Annual Report2
01 2018 AT A GLANCE 02 CHAIRPERSONS AND CEO MESSAGE 03 OUR PORTFOLIO AND PERFORMANCE
012018 at a glance
For
per
sona
l use
onl
y

24.9bn kilometres travelled on ALX roads in 2018, up 2%
23,000+securityholders
24.0c 2018 distribution per security, up 20%
4 portfolio toll road investments1
6 years of continued distribution growth to securityholders
2018 Atlas Arteria Annual Report | 3
04 OUR BOARDS’ DIRECTORS 05 GOVERNANCE 06 SUSTAINABILITY01 2018 AT A GLANCE 02 CHAIRPERSONS AND CEO MESSAGE 03 OUR PORTFOLIO AND PERFORMANCE
For
per
sona
l use
onl
y

| 2018 Atlas Arteria Annual Report4
01 2018 AT A GLANCE 02 CHAIRPERSONS AND CEO MESSAGE 03 OUR PORTFOLIO AND PERFORMANCE
02Chairpersons and CEO Message
Continued growth in 2018Atlas Arteria (ALX) experienced another year of positive performance in 2018, with our portfolio continuing to deliver growth in business value and distributions for securityholders:• Statutory net profit of A$59.9 million1, driven by the
consolidation of Dulles Greenway’s results for the full year and ALX’s share of net profits from its investment in APRR, partially offset by performance fees2 paid in accordance with and due to the renegotiation of the management agreements
• Weighted average portfolio traffic grew 1.5% compared to the prior corresponding period (pcp)
• Proportionate revenue and EBITDA3 increased 4.1% and 4.8% respectively across the portfolio, reflective of traffic performance, toll increases and ongoing cost management across the portfolio
• We delivered 20.0% growth in distributions to securityholders compared to 2017
• Continued portfolio simplification through the acquisition of an additional 30% interest in our German toll road, the Warnow Tunnel, consolidating our ownership to 100%
• We successfully refinanced and upsized the debt facility at MIBL Finance S.à r.l. (MIBL), with proceeds used to repay the higher interest cost debt facility at the Dulles Greenway4.
The past year also saw significant corporate change. In May 2018, following securityholders’ approval of management internalisation, we changed our company name to Atlas Arteria and commenced transition to internalised management.
Progress towards internalisation is advanced, with significant momentum to achieve a smooth and successful transition of the management of ALX from Macquarie to the new independent team by the transition date of 15 May 2019. The two management teams continue to work closely together on all aspects of the internalisation process.
Distribution growth and outlookIn 2018, ALX paid a total distribution of 24.0 cents per security (cps), representing 20.0% growth on pcp and comprising both dividend and return of capital components. This represents the fifth consecutive year that we have grown distributions since paying our first distribution in 2013.
1. Note the statutory result is not indicative of ALX’s cash flows or future distributions.2. In accordance with and due to the renegotiation of the management agreements, aggregate performance fee instalments of A$115.3 million for 2016, 2017 and 2018 were settled
(A$25.0 million in cash and A$90.3 million through a reinvestment in ALX securities). A$70.6 million of the performance fees were recognised in 2018 (A$44.7 million recognised in prior years).3. Current and prior year proportionate Revenue and EBITDA information involves the aggregation of the financial results of ALX’s relevant assets in the relevant proportions that ALX holds
beneficial interests.4. Calculated based on base interest rates at the time of announcement on 1 June 2018.5. Distribution guidance is subject to business performance, FX movements, French tax rates and other future events. No assumptions are made about any changes to or negotiations
regarding the current APRR/Eiffarie capital structure or the MAF advisory agreement, nor about future possible exit from lock up or cash sweep arrangements, or amount, if any, of cash that may be released from other assets.
6. Approximately 10% to be financed by local authorities.7. The bond was issued in November 2018 under APRR’s Euro Medium Term Note programme at 99.027% of par with a coupon of 1.50% and a maturity of January 2030.8. Calculated based on base interest rates at the time of swap expiry.
We were also pleased to confirm our distribution guidance of 30.0 cps for 20195, representing a 25% increase on 2018. Our first half 2019 distribution of 15.0 cps is expected to be declared to securityholders in April 2019.
Operational performanceAPRRAPRR delivered another year of positive traffic, revenue and EBITDA growth. Traffic increased 2.2% on pcp, despite the disruption caused by the French “Yellow Vests” protests. Revenue and EBITDA grew by 4.7% and 5.6% respectively compared to 2017, reflecting increased traffic volumes, 2018 toll increases and continued cost control.
In November 2018, APRR and AREA finalised an agreement with the French State for a €187 million capital investment plan6. The additional investments will be compensated via supplemental toll increases at APRR and AREA over 2019-2021.
During 2018, APRR Group continued to deliver interest cost savings with total group interest expense reduced by ~€123 million or 35% on pcp. At the APRR level, maturing facilities continued to be replaced with lower cost debt at extended maturities, with a €500 million 11-year bond issued during the year at an all-in cost of ~1.6%7. At Eiffarie, a €3.2 billion legacy swap with an average cost of 4.6% expired on 30 June 2018, providing pre-tax cost savings of ~€150 million per annum for the APRR Group8.
APRR cash flows continued to underpin all of ALX’s distributions in 2018 and is anticipated to underpin our 2019 distributions.
ADELAC and Warnow both recorded positive traffic, revenue and EBITDA growth in 2018.
Dulles GreenwayDulles Greenway traffic declined 4.5% on pcp, impacted by improvements to the surrounding network. Prior traffic guidance was met despite the additional impact of adverse weather conditions and partial federal government shutdowns in January and December of 2018 that continued through January 2019. Revenue and EBITDA declined by 1.4% and 1.5% respectively on pcp, driven by traffic performance, offset by toll growth and cost management during the year.
For
per
sona
l use
onl
y

2018 Atlas Arteria Annual Report | 5
01 2018 AT A GLANCE 02 CHAIRPERSONS AND CEO MESSAGE 03 OUR PORTFOLIO AND PERFORMANCE
During the year, Greenway commenced dialogue with stakeholders to establish a future toll path beyond 2020, but an agreement has not been reached. Greenway’s current toll path is set by legislation through to 1 January 2020. Thereafter, toll increases are set by application to the State Corporations Commission (SCC), as they were from the road’s inception until 1 January 2013. The Greenway anticipates lodging its 2020 toll application with the SCC during 2019.
ALX continues to monitor and actively address some peak congestion issues on the Dulles Greenway. During the year, lanes at the toll plaza were reconfigured during morning peak to provide congestion relief for users. In December, Greenway commenced phase 1 of the Dulles Toll Road (DTR) connector decongestion project at the eastern end of the road.
As at 31 December 2018, Dulles Greenway passed the Additional Coverage Ratio test (a 3-year distribution lock-up test) but, as expected, did not pass the Minimum Coverage Ratio test (a 1-year distribution lock-up test).
Portfolio updateIn September 2018, ALX further consolidated its portfolio through the acquisition of the remaining 30% equity interest and shareholder loan in the Warnow Tunnel. ALX has held a 70% equity interest in the Warnow Tunnel since our inception. The acquisition represents a continuation of ALX’s ongoing strategy of portfolio simplification, and 100% ownership also creates optionality for ALX to optimise the value of the business in the future.
As part of our disciplined approach to capital management, during 2018 we successfully refinanced and upsized the debt facility at MIBL Finance S.à r.l. (MIBL), the entity through which ALX holds its indirect interest in APRR, from €150 million to €350 million. Proceeds from the upsizing were predominantly used to repay the US$175 million Dulles Greenway acquisition finance facility. Overall the refinancing and repayment should result in net interest savings for ALX.
Corporate Governance and SustainabilityAt ALX, our approach to environmental, social and governance risk management is an important aspect of our daily operations. The Boards, management and portfolio company employees are committed to the identification, assessment and responsible management of ESG risks. We view this as a key part of our long-term success and integral to our responsibility to road users as well as our securityholders, employees, the community and the environment.
At ALX we also believe that operating our roads in a sustainable and responsible manner, including by reducing our impact on the environment, is an integral part of ensuring our long term success. During 2018, we continued to work with each of our portfolio companies to report the risks we face and measures we have taken to address these risks. We encourage you to read our Sustainability Report and Corporate Governance Statement on our website which provide further details on our approach to Sustainability and Corporate Governance.
Board and management updatesBoard changesALX continues to review the structure of the Boards of Atlas Arteria Limited (ATLAX) and Atlas Arteria International Limited (ATLIX) to renew and enhance the complementary skills and composition of the ALX Boards.
In October 2018, we were delighted to welcome David Bartholomew onto the Board of ATLAX. David brings extensive infrastructure experience, having most recently been CEO of DUET Group for six years as well as his prior experience as director
of Infrastructure at Hastings Funds Management. We were also pleased to appoint Jean-Georges Malcor to the Board of ATLAX in November 2018. Jean-Georges has led multinational companies in both France and Australia. He brings to the Board extensive business expertise, especially in the electronic systems, construction and engineering sectors.
2018 also saw the retirement of ATLAX non-executive directors, John Roberts and Richard England. John and Richard were directors of ALX for more than eight years and made a significant contribution to the development and growth of the ALX group.
CFO changeDuring the year, Bodie ter Kuile succeeded Mark Goodrick as Chief Financial Officer (CFO) of ALX. Mark joined ALX in 2012 and became CFO in 2015, overseeing the finance function of ALX during a period of significant growth and transformation.
On behalf of the Boards of ALX, we thank John, Richard and Mark for their respective contributions to ALX and wish them all the best.
Internalisation update Following securityholder approval in May 2018 to transition to an internalised management team, we have recruited a strong core team of highly experienced executives, led by Graeme Bevans, to assume management upon internalisation.
Graeme Bevans was appointed Chief Executive Officer (CEO) Elect in April 2018 and will succeed James Hooke as CEO once ALX is internalised. Graeme brings a deep understanding of the global infrastructure industry and has a strong track record in managing global infrastructure investments. He also has extensive experience in stakeholder management within complex joint venture arrangements in Australia and overseas, particularly in Europe and North America.
We are also pleased to have appointed Nadine Lennie as successor to Bodie ter Kuile as CFO. Nadine is an experienced CFO, having implemented and managed complex financial structures across Australia, Europe and North America. She brings a strong track record in disciplined development and investment in infrastructure globally.
The internalised management team is already actively engaged in our key objective of maximising long term securityholder value through:• Successfully completing transition and streamlining structures
where possible;• Continued disciplined capital management and driving
operational improvements; and• Accretive opportunities primarily focused within the portfolio.
We thank you for your ongoing support of ALX and welcome your feedback and questions. These can be provided to our Investor Relations team at 1800 621 694 or at Level 5, 141 Flinders Lane, Melbourne, VIC 3000.
Nora Scheinkestel Jeffery ConyersChairman, Chairman, Atlas ArteriaAtlas Arteria Limited International Limited
James Hooke Graeme BevansChief Executive Officer, Chief Executive Officer Elect, Atlas Arteria Atlas Arteria
04 OUR BOARDS’ DIRECTORS 05 GOVERNANCE 06 SUSTAINABILITY
For
per
sona
l use
onl
y
| 2018 Atlas Arteria Annual Report6
01 2018 AT A GLANCE 02 CHAIRPERSONS AND CEO MESSAGE 03 OUR PORTFOLIO AND PERFORMANCE
03A Review of ALX and its Portfolio in 2018
Our businessALX is a global infrastructure developer, operator and investor.
ALX offers securityholders exposure to an international portfolio of toll roads including:• Exposure to the European economy through ALX’s interest in
APRR and ADELAC in eastern France, and the Warnow Tunnel in Germany
• Exposure to the US economy through ALX’s interest in the Dulles Greenway in northern Virginia.
ALX offers securityholders a total return including distributions and capital appreciation:• Annual growth in distributions is currently wholly
underpinned by distributions received from ALX’s investment in APRR
• A proportion of asset level cash flow remains in the portfolio businesses, with progressive debt reduction and capital expenditure for future growth.
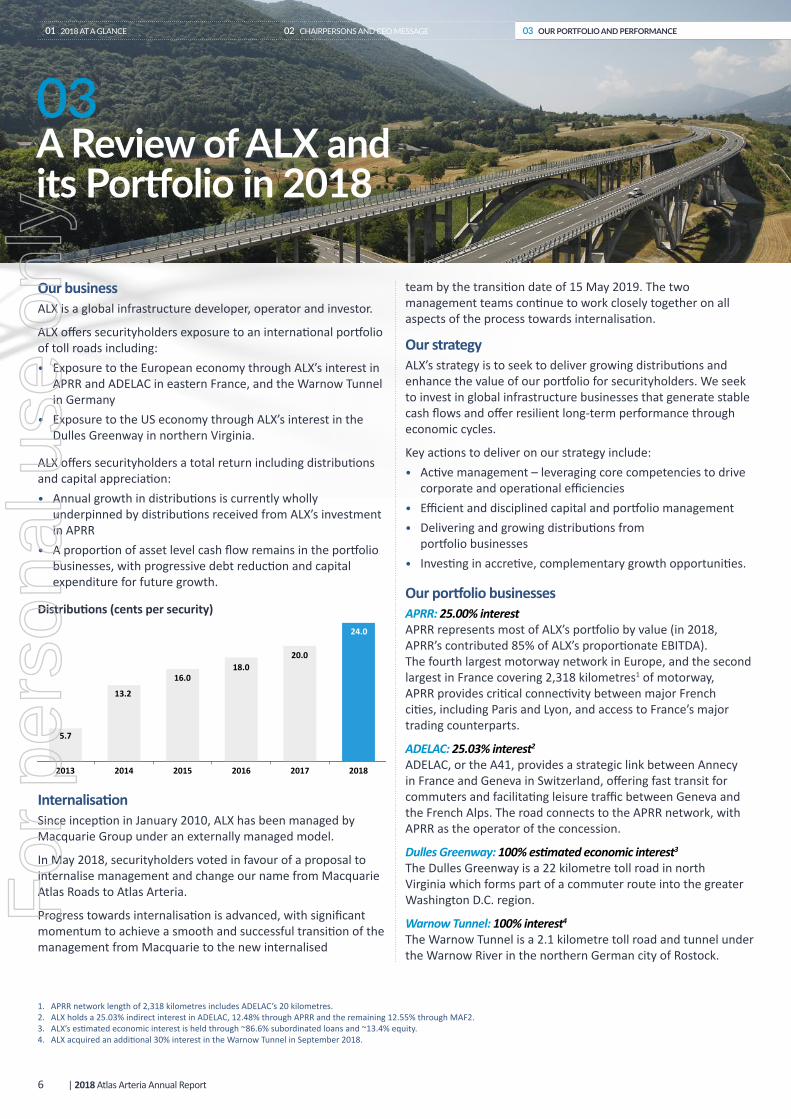
Distributions (cents per security)
201820172016201520142013
5.7
13.2
16.018.0
20.0
24.0
Internalisation Since inception in January 2010, ALX has been managed by Macquarie Group under an externally managed model.
In May 2018, securityholders voted in favour of a proposal to internalise management and change our name from Macquarie Atlas Roads to Atlas Arteria.
Progress towards internalisation is advanced, with significant momentum to achieve a smooth and successful transition of the management from Macquarie to the new internalised
1. APRR network length of 2,318 kilometres includes ADELAC’s 20 kilometres.2. ALX holds a 25.03% indirect interest in ADELAC, 12.48% through APRR and the remaining 12.55% through MAF2.3. ALX’s estimated economic interest is held through ~86.6% subordinated loans and ~13.4% equity.4. ALX acquired an additional 30% interest in the Warnow Tunnel in September 2018.
team by the transition date of 15 May 2019. The two management teams continue to work closely together on all aspects of the process towards internalisation.
Our strategyALX’s strategy is to seek to deliver growing distributions and enhance the value of our portfolio for securityholders. We seek to invest in global infrastructure businesses that generate stable cash flows and offer resilient long-term performance through economic cycles.
Key actions to deliver on our strategy include:• Active management – leveraging core competencies to drive
corporate and operational efficiencies• Efficient and disciplined capital and portfolio management• Delivering and growing distributions from
portfolio businesses• Investing in accretive, complementary growth opportunities.
Our portfolio businessesAPRR: 25.00% interestAPRR represents most of ALX’s portfolio by value (in 2018, APRR’s contributed 85% of ALX’s proportionate EBITDA). The fourth largest motorway network in Europe, and the second largest in France covering 2,318 kilometres1 of motorway, APRR provides critical connectivity between major French cities, including Paris and Lyon, and access to France’s major trading counterparts.
ADELAC: 25.03% interest2 ADELAC, or the A41, provides a strategic link between Annecy in France and Geneva in Switzerland, offering fast transit for commuters and facilitating leisure traffic between Geneva and the French Alps. The road connects to the APRR network, with APRR as the operator of the concession.
Dulles Greenway: 100% estimated economic interest3 The Dulles Greenway is a 22 kilometre toll road in north Virginia which forms part of a commuter route into the greater Washington D.C. region.
Warnow Tunnel: 100% interest4 The Warnow Tunnel is a 2.1 kilometre toll road and tunnel under the Warnow River in the northern German city of Rostock.
For
per
sona
l use
onl
y

2018 Atlas Arteria Annual Report | 7
01 2018 AT A GLANCE 02 CHAIRPERSONS AND CEO MESSAGE 03 OUR PORTFOLIO AND PERFORMANCE
Risk managementRisk is an inherent part of ALX’s business and management of risk is therefore critical to ALX’s continuing profitability and financial strength. Key risks are regularly reviewed by the Boards, the Audit and Risk Committees and the Manager.
ALX’s risk management framework creates a consistent approach to identifying, analysing, monitoring and mitigating risks. This framework will continue to be utilised by ALX post-internalisation, and includes various policies, charters and procedures, which can be found on ALX’s website www.atlasarteria.com.
Each of the ALX portfolio companies is responsible for adopting and maintaining its own risk management framework and supporting infrastructure to manage its own risk. It is ALX’s policy to confirm that each portfolio company has an appropriate risk management framework in place to assist the business in effectively managing its risks.
Financial performanceStatutoryALX equity accounts its investment in APRR and ADELAC, and now consolidates both the Dulles Greenway and Warnow Tunnel, following the acquisition of the remaining 30% equity interest of Warnow Tunnel in September 2018.
Accordingly, the results and balance sheet of the Dulles Greenway and Warnow Tunnel are consolidated into ALX’s results in full, with a purchase price allocation occurring at the time of initial consolidation. The portfolio equity accounted results are disclosed as ‘share of net profits/(losses) from investments accounted for using the equity method’ in ALX’s income statement. Combined with corporate level expenses, these make up ALX’s statutory result.
ALX’s statutory net profit was A$59.9 million5 driven by the consolidation of Dulles Greenway’s results for the full year and ALX’s share of net profits from its investment in APRR, partially offset by performance fees paid in accordance and due to the renegotiation of the management agreements.
5. Note the statutory result is not indicative of ALX’s cash flows or future distributions.6. Based on ALX’s average beneficial interest in its businesses over the year on a like-for-like portfolio basis. Portfolio revenue and EBITDA (Earnings Before Interest, Tax, Depreciation
and Amortisation) growth represent proportionate results as disclosed in ALX’s Management Information Report to 31 December 2018. Weighted average traffic based on portfolio revenue allocation.
7. Includes the refinancing and upsizing of MIBL facility from €150.0 million to €350.0 million and repayment of the Dulles Greenway acquisition facility from upsizing proceeds.8. 2018 relates to the €2.3m paid for the remaining 30% interest in Warnow Tunnel (an estimated €1.3m relating to transaction taxes is estimated to become payable in 2019). 2017 relates
US$445.0 million paid for acquisition of 50% economic interest of Greenway and €439.9 million paid for additional 4.86% interest in APRR.
Further information on the statutory results is provided in the Financial Report on pages 29 to 106.
Proportionate results from toll road businesses The proportionate results aggregate the financial results of ALX’s businesses in the respective proportions of ALX’s economic interests from ongoing operations in each business. The proportionate results are prepared on a different basis to the ALX Financial Report, which is prepared in accordance with Australian Accounting Standards.
In aggregate, ALX’s portfolio reported positive performance in traffic, revenue and EBITDA in 2018. The following chart shows the operating performance of ALX’s portfolio as a whole for 2018 compared to 2017.
Further information, including the basis of preparation of proportionate results and a reconciliation of these results to the statutory results, is provided in the Management Information Report which is available on ALX’s website www.atlasarteria.com.
Cash flow and cash position A summarised corporate level cash flow statement for the year to 31 December 2018 is set out below.
ALX declared an increased level of distributions to securityholders, with 1H18 and 2H18 distributions of 12.0 cents per security (cps) each, compared to 10.0 cps for each of 1H17 and 2H17. The 1H18 distribution comprised a foreign dividend, while the 2H18 distribution comprised of a return of capital and an Australian unfranked dividend.
ALX maintains a disciplined capital management strategy. After payment of each distribution, ALX retains prudent cash balance to fund working capital requirement and other purposes.
Proportionate performance 2018 vs 20176 ALX cash flow statement
EBITDARevenueTraffic
Up 4.8%Up 4.1%
Up 1.5%
Available cash
Year ended 31 Dec 18
A$m
Year ended 31 Dec 17
A$mOpening balance 1 January 39.8 223.4Total cash flow received from assets 249.6 153.0Other operating cash flows (81.5) (35.7)Net proceeds from borrowings and the issue of securities7 69.5 1,097.3Payment for purchase of additional asset interests8 (4.0) (1,275.2)Interest paid (16.1) (7.5)Other investing and financing cash flows (5.3) –Distributions paid (162.4) (115.5)Closing balance 31 December 89.6 39.8
04 OUR BOARDS’ DIRECTORS 05 GOVERNANCE 06 SUSTAINABILITY
For
per
sona
l use
onl
y

APRR and ADELACFranceAPRR is a 2,318 kilometre1 motorway network located in the east of France. It is the second largest motorway network in France and the fourth largest in Europe.
| 2018 Atlas Arteria Annual Report8
1. Note the APRR network length of 2,318 kilometres includes ADELAC’s 20 kilometres. APRR holds a 49.9% interest in ADELAC.2. APRR holds a 49.9% interest in ADELAC with APRR Group shareholders owning the residual 50.01%.3. ALX holds a 25.03% indirect interest in ADELAC, 12.48% through APRR and the remaining 12.55% through MAF2.
APRR comprises three concessions: the APRR Concession, the AREA Concession and a minority interest in the ADELAC Concession2. It acts as a vital transportation corridor for major Western European and intra-France trade and tourism, and provides essential connectivity between Paris and Lyon, France’s two largest metropolitan areas.
ALX interest:
25.0%3
Concession length:APRR: Nov 2035AREA: Sep 2036ADELAC: Dec 2060
APRRTraffic:up 2.2% on pcp
Revenue:up 4.7% on pcp
EBITDA:up 5.6% on pcp
ADELACTraffic:up 1.2% on pcp
Revenue:up 3.1% on pcp
EBITDA:up 3.5% on pcp
OVER 50+ YEARS OF ESTABLISHED OPERATING PERFORMANCE
01 2018 AT A GLANCE 02 CHAIRPERSONS AND CEO MESSAGE 03 OUR PORTFOLIO AND PERFORMANCE
For
per
sona
l use
onl
y

APRRAREAADELAC
APRR Switzerland
Germany
ItalyFrance
Lyon
Troyes
Cosne-Cours-sur-Loire
MelunToul
Mulhouse
Bourges
Vichy
Paris
Milan
Zurich
Stuttgart
Valence
Clermont-Ferrand
Dijon
Geneva
Grenoble
Chambéry
Traffic performanceAPRR
Total traffic on the APRR Group network increased 2.2% during the year. Light vehicles traffic increased 1.7%, while heavy vehicle traffic saw a 4.7% growth on 2017.
Traffic temporarily benefitted from industrial actions in competing travel alternatives (rail and air sectors) during the first half of the year, but was subsequently negatively impacted by disruptions caused by the Gilet Jaunes (‘Yellow Vests’) protests during the fourth quarter of 2018.
The opening of a newly added 5.5 kilometre section also had a positive impact on traffic.
EBITDA (€bn) vs traffic (bn VKT)
0.0
0.5
1.0
1.5
2.0
2.5
3.0
20182017201620152014201320122011201020092008
bn VKT*
20
2524232221
1918171615
�bn
EBITDA (LHS) Traffic (RHS)
ADELAC Traffic at ADELAC increased 1.2% on pcp, benefitting from continued growth in commuter traffic, partially offset by disruption caused by ‘Yellow Vests’ protests during the fourth quarter of 2018.
Operating performanceAPRR
Toll revenues increased 4.7% to €2,463 million in 2018, driven by traffic growth, toll increases and a more favourable traffic mix as a result of stronger heavy vehicle growth.
APRR EBITDA increased 5.6% to €1,874 million, with an improved EBITDA margin of 73.8% (2017: 73.2%), underpinned by revenue growth and continued cost management.
Automated transactions represented 99.4% of total transactions, with the number of APRR electronic toll collection devices increasing 8% to over 2.7 million in 2018.
ADELAC Revenue and EBITDA at ADELAC increased 3.1% and 3.5% respectively on pcp underpinned by traffic growth and toll increases.
* APRR VKT excludes ADELAC
2018 Atlas Arteria Annual Report | 9
01 2018 AT A GLANCE 02 CHAIRPERSONS AND CEO MESSAGE 03 OUR PORTFOLIO AND PERFORMANCE 04 OUR BOARDS’ DIRECTORS 05 GOVERNANCE 06 SUSTAINABILITY
For
per
sona
l use
onl
y

APRR and ADELAC France continued
| 2018 Atlas Arteria Annual Report10
4. Moody’s has historically covered APRR on an unsolicited basis. In December 2018, Moody’s upgraded APRR’s rating from Baa1 to A3. In January 2019, Moody’s announced it has decided to withdraw APRR’s ratings for its own business reasons and will no longer continue research coverage of APRR.
5. The bond was issued in November 2018 under APRR’s Euro Medium Term Note programme at 99.027% of par with a coupon of 1.50% and a maturity of January 2030.6. Calculated based on base interest rates at the time of swap expiry. 7. The 2018 State Capital Investment Plan was originally estimated to be €222 million (with ~10% to be financed by local authorities), but was subsequently scaled back as a result of
regulatory review.
Financing costs and future interest saving opportunities
APRR has a sustainable debt maturity profile and strong liquidity position. APRR debt has an investment grade credit rating of A- (Stable Outlook) by both S&P and Fitch. Both rating agencies re-affirmed the rating during 20184.
APRR Group net interest expense decreased by €123 million or 35% compared to FY17:
X At APRR, maturing debt continued to be replaced at lower cost during 2018
X €500 million bond issued in November 2018 at an all-in cost of ~1.6% and maturity of ~11 years5
X €150 million of floating European Investment Bank loans with an average margin of 0.9% were replaced with commercial paper
X At Eiffarie, a €3.2 billion legacy swap with an average cost of 4.6% expired on 30 June 2018, providing pre-tax cost savings of ~€150 million per annum6.
Formalisation of new investment plan with the French State
In November 2018, APRR finalised a capital investment plan with the French State. Total size of the investment is €187 million, with ~10% to be financed by local authorities7.
The plan consists of 12 projects and will provide upgrades and improvements to the motorway network. These include new or improved motorway exchanges, environmental protection developments and customer service improvements.
APRR network to be compensated via supplemental toll increases of 0.198% per annum at APRR and 0.389% per annum at AREA over 2019-2021.
01 2018 AT A GLANCE 02 CHAIRPERSONS AND CEO MESSAGE 03 OUR PORTFOLIO AND PERFORMANCE
For
per
sona
l use
onl
y

2018 Atlas Arteria Annual Report | 11
APRR provides essential connectivity for major Western European and intra-France trade and tourism.
2,318 KILOMETRE MOTORWAY NETWORK
01 2018 AT A GLANCE 02 CHAIRPERSONS AND CEO MESSAGE 03 OUR PORTFOLIO AND PERFORMANCE 04 OUR BOARDS’ DIRECTORS 05 GOVERNANCE 06 SUSTAINABILITY
For
per
sona
l use
onl
y

Dulles GreenwayVirginia, USA
The Dulles Greenway is a 22 kilometre toll road located in Loudoun County, one of the faster growing and more affluent counties in the United States.
1. Estimated economic interest.2. The December 2018 government shutdown, which commenced on 22 December 2018, continued through to 25 January 2019.3. 2018 Dulles VA Precipitation, National Weather Service.
Traffic and financial performance
Traffic decreased 4.5% in 2018, impacted by improvements to the surrounding network, adverse weather conditions and partial federal government shutdowns in January and December of 20182:
X Improvements to the surrounding network continued to have a negative impact on traffic during the year, although the impacts moderated during 2018, as prior period traffic has incorporated much of the impact
X Overall weather also had an adverse impact on traffic during 2018, with various one-off disruptive weather events in addition to the area experiencing the wettest year on record (the Dulles corridor recorded 66.7 inches of rainfall vs historical average of 41.5 inches3)
X Federal government shutdowns at the beginning and at the end of 2018 also negatively impacted traffic.
Revenue and EBITDA declined by 1.4% and 1.5% respectively on pcp, mainly driven by traffic performance, offset by toll growth and cost management during the year.
As at 31 December 2018, Dulles Greenway passed the Additional Coverage Ratio test (a 3-year distribution lock-up test) but, as expected, did not pass the Minimum Coverage Ratio test (a 1-year distribution lock-up test).
01 2018 AT A GLANCE 02 CHAIRPERSONS AND CEO MESSAGE 03 OUR PORTFOLIO AND PERFORMANCE
| 2018 Atlas Arteria Annual Report12
The Dulles Greenway is part of a key road corridor connecting suburban communities in northern Virginia with the greater Washington area in the United States.
ALX interest:
100%1
Concession expiry:2056
Traffic:down 4.5% on pcp
Revenue:down 1.4% on pcp
EBITDA:down 1.5% on pcp
For
per
sona
l use
onl
y

DullesGreenway
LoudounCounty
Leesburg
Rockville
Arlington
Falls Church
Bethesda
TysonsCorner
Silver Spring
Washington DC
Fairfax
DullesInternational
Airport
ReaganNational
Airport
Maryland
Virginia
Asset initiatives
Capital improvements to alleviate morning east-bound traffic congestion progressed in 2018:
X Lanes at the toll plaza were reconfigured during morning peak to provide congestion relief for users
X In December, Greenway commenced phase 1 of the decongestion work at the eastern end of the road connecting to the Dulles Toll Road
X At the western end of the road, Greenway and local authorities have also identified a potential short-term option to relieve congestion. Discussion and analysis on this continues.
During the year, Greenway commenced dialogue with stakeholders to establish a future legislated toll path beyond 2020, but an agreement has not been reached:
X Greenway’s current toll path is set by legislation through to 1 January 2020, whereby tolls are permitted to increase by the maximum of CPI+1%, real GDP or 2.8%
X From 2020 onwards, toll increases are set by application to the State Corporation Commission (SCC), as they were since the road’s inception until 1 January 2013
X The Greenway anticipates lodging its 2020 toll application with the SCC during 2019.
4. Source: the U.S. Census Bureau estimates: 2016 Small Area Income and Poverty Estimates, November 30, 2017.5. Source: US Bureau of Labor Statistics – released December 2018.6. Source: US Bureau of Labor Statistics. Loudoun County recorded highest pcp employment growth from 1 January to 30 June 2017. Released 5 December 2017, current as at
31 December 2018.7. Source: the U.S. Census Bureau.
Macroeconomic environment and corridor dynamics Loudoun County is one of the fastest growing and most affluent counties in the US, with the highest Median Household Income in the US at ~$136,0004 and the highest Virginian county investment levels and employment in 20175
Economic growth in the region is supported by a well-educated working class population, recording the highest employment growth rate6 and second-highest population growth rate7 in Virginia.
EBITDA (US$m) vs traffic (ADT)
0
20
40
60
80
100
120
20182017201620152014201320122011201020092008
EBITDA (LHS)Revenue (LHS) Traffic (RHS) ADTUS$m
25,000
30,000
35,000
40,000
45,000
50,000
55,000
01 2018 AT A GLANCE 02 CHAIRPERSONS AND CEO MESSAGE 03 OUR PORTFOLIO AND PERFORMANCE 04 OUR BOARDS’ DIRECTORS 05 GOVERNANCE 06 SUSTAINABILITY
2018 Atlas Arteria Annual Report | 13
For
per
sona
l use
onl
y
1. In September 2018, ALX completed the acquisition of the remaining 30% equity interest and shareholder loan in Warnow Tunnel for €3.7 million (prior to adjusting for applicable transaction taxes). The acquisition increases ALX’s total interest to 100% and was fully funded by ALX’s existing corporate cash.
2. Current and historical expenses have been updated to exclude provisions and any maintenance capex.3. Statistisches Bundesamt, January 2019.
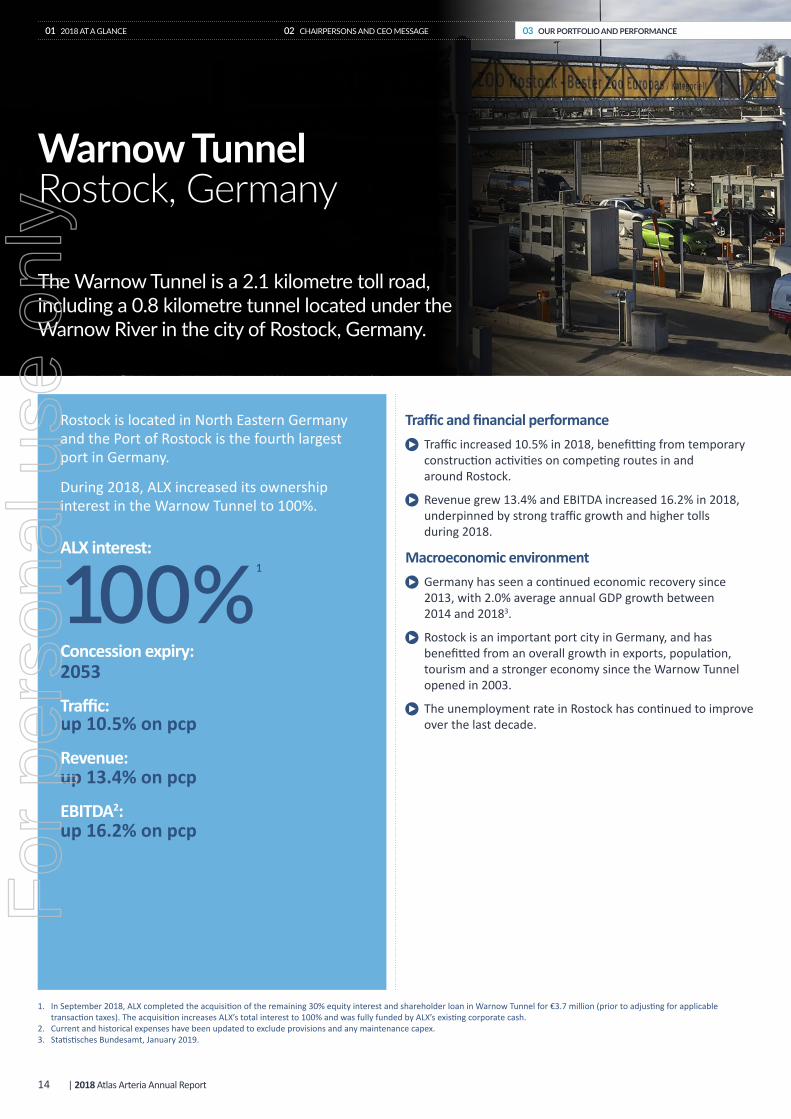
Traffic and financial performance Traffic increased 10.5% in 2018, benefitting from temporary construction activities on competing routes in and around Rostock.
Revenue grew 13.4% and EBITDA increased 16.2% in 2018, underpinned by strong traffic growth and higher tolls during 2018.
Macroeconomic environment Germany has seen a continued economic recovery since 2013, with 2.0% average annual GDP growth between 2014 and 20183.
Rostock is an important port city in Germany, and has benefitted from an overall growth in exports, population, tourism and a stronger economy since the Warnow Tunnel opened in 2003.
The unemployment rate in Rostock has continued to improve over the last decade.
01 2018 AT A GLANCE 02 CHAIRPERSONS AND CEO MESSAGE 03 OUR PORTFOLIO AND PERFORMANCE
| 2018 Atlas Arteria Annual Report14
Warnow Tunnel Rostock, Germany
The Warnow Tunnel is a 2.1 kilometre toll road, including a 0.8 kilometre tunnel located under the Warnow River in the city of Rostock, Germany.
Rostock is located in North Eastern Germany and the Port of Rostock is the fourth largest port in Germany.
During 2018, ALX increased its ownership interest in the Warnow Tunnel to 100%.
ALX interest:
100%1
Concession expiry:2053
Traffic:up 10.5% on pcp
Revenue:up 13.4% on pcp
EBITDA2:up 16.2% on pcp
For
per
sona
l use
onl
y

Elmenhorst/Lichtenhagen
Markgrafenheide
Hohe DüneWarnemünde
Evershagen
Warnow Tunnel
Route dynamics The Warnow Tunnel allows road users to cross under the Warnow River, which divides the city of Rostock.
Alternative options to cross the Warnow River include ferries, which take more than 15 minutes to complete the crossing, or a 19 kilometre journey via untolled roads through the Rostock central shopping precinct, which can be subject to delays during peak periods.
Since 2017, untolled roads through Rostock have been undergoing temporary maintenance and construction activities, which have further lengthened the travel time on alternative routes and benefitted traffic on the Warnow Tunnel. These positive impacts on traffic are temporary and are not expected to continue in the medium term.
Consolidating ownership to 100% In September 2018, ALX acquired a remaining 30% interest in the Warnow Tunnel, increasing ALX’s ownership to 100%.
The acquisition represents a continuation of ALX’s ongoing strategy of portfolio simplification, and enhances the ability for ALX to optimise the business.
EBITDA (€m) vs traffic (ADT)
0
2
4
6
8
10
12
20182017201620152014
Traffic (ADT)EBITDA (€m)
0
2,000
4,000
6,000
8,000
10,000
12,000
14,000
EBITDA (LHS) Traffic (RHS)
01 2018 AT A GLANCE 02 CHAIRPERSONS AND CEO MESSAGE 03 OUR PORTFOLIO AND PERFORMANCE 04 OUR BOARDS’ DIRECTORS 05 GOVERNANCE 06 SUSTAINABILITY
2018 Atlas Arteria Annual Report | 15
For
per
sona
l use
onl
y

| 2018 Atlas Arteria Annual Report16
04Our Boards’ Directors
NORA SCHEINKESTEL LLB (Hons) (Melb), PhD, FAICD, Centenary MedalATLAX Non-Executive, Independent ChairmanATLIX Non-Executive, Independent DirectorChairman of ATLAX from 17 April 2015 and Director from 28 August 2014Director of ATLIX since 17 April 2015Age: 59
Nora Scheinkestel is an experienced company director having served as chairman and director on public and private sector boards spanning a wide range of industry sectors. As well as being Chairman of the ATLAX Board, she also chairs the ATLAX Nomination and Governance Committee and is a director of the ATLIX Board. She is also currently a director and committee chairman of Telstra Corporation Limited, AusNet Services Limited and OceanaGold Corporation and a trustee of the Victorian Arts Centre Trust.
Dr Scheinkestel has a long track record in the infrastructure sector. Her background is as a senior banking executive in international and project financing, responsible for the development and financing of major mining and infrastructure projects in Australasia and South East Asia. She is a published author of Rethinking Project Finance – Allocating and Mitigating Risk in Australasian Projects. She has been chairman and director of companies in highly regulated sectors such as utilities and telecommunications and in industries facing significant disruption from technology and market changes.
Dr Scheinkestel is an Associate Professor in the Melbourne Business School at Melbourne University, a former member of the Takeovers Panel and was awarded a Centenary Medal for services to Australian society in business leadership.
ALX comprises Atlas Arteria Limited (ATLAX) and Atlas Arteria International Limited (ATLIX).
The ATLAX and ATLIX Boards are made up of four and five directors respectively, with a diverse range of backgrounds and experience.
The directors take an active role in the management of ALX, meeting on a regular basis to review ALX’s affairs and to carry out their statutory and fiduciary duties.
Where required, the Boards convene at short notice to consider matters as they arise.
01 2018 AT A GLANCE 02 CHAIRPERSONS AND CEO MESSAGE 03 OUR PORTFOLIO AND PERFORMANCE
For
per
sona
l use
onl
y

2018 Atlas Arteria Annual Report | 17
04 OUR BOARDS’ DIRECTORS 05 GOVERNANCE 06 SUSTAINABILITY
DEBRA GOODIN BEc (AU) FCA
ATLAX Non-Executive, Independent DirectorDirector from 1 September 2017Age: 52
Debra Goodin, who is also Chairman of the Audit and Risk Committee of ATLAX, is an experienced independent director currently serving on the boards of ASX-listed companies APA Group, Senex Energy Limited and Ooh!media Limited. She is currently also the chairperson of the Audit and Risk Committees for these boards.
Debra has more than 20 years’ senior management experience with professional services firms, government authorities and ASX-listed companies across finance, operations, corporate strategy, mergers and acquisitions. She is a fellow of Chartered Accountants Australia and New Zealand.
DAVID BARTHOLOMEW BEc (Hons), MBA
ATLAX Non-Executive, Independent DirectorDirector from 1 October 2018Age: 58
David Bartholomew, who is also Chairman of the People and Remuneration Committee of ATLAX, is an experienced director in the infrastructure and utilities sector. In addition to being a non-executive director of ATLAX, he currently serves on the boards of Endeavour Energy (the New South Wales electricity distributor), Power & Water Corporation (the multi-utility owned by the Northern Territory Government) and the Saudi Arabia Industrial Investment Company, Dussur. He is also a director of The Helmsman Project, a not-for-profit organisation that provides coaching and development programmes for year 9 students, predominantly in western Sydney.
In previous executive roles, David was appointed to the boards of investee companies in Australia and the USA with interests in electricity and gas distribution and transmission, electricity generation, and forestry. David also has toll road sector experience, having served on the boards of Interlink Roads (Sydney’s M5 Motorway) and Statewide Roads (Sydney’s M4 Motorway) representing investors managed by Hastings Funds Management.
David was Chief Executive Officer of DUET Group, a former ASX 100 listed utilities and energy company and was responsible for management of DUET’s successful transition from external management by AMP Capital and Macquarie Capital to a fully internalised management and governance structure. He oversaw the growth of DUET Group from a market capitalisation of around A$1.2 billion to over A$7.48 billion.
David previously served on the board of Vector Limited (NZX: VCT) and his previous executive experience includes Hastings Funds Management, Lend Lease, The Boston Consulting Group and BHP Minerals.
JEAN-GEORGES MALCOREcole Centrale de Paris (Eng), MSc (Stanford)
ATLAX Non-Executive, Independent DirectorDirector from 1 November 2018Age: 62
Jean-Georges Malcor completed eight years as Chief Executive Officer at CGG (EPA: CGG), a Euronext-listed French geoscience company providing services primarily to customers in the global oil and gas industry. Prior to CGG, he spent 25 years at Thales Group (EPA: HO) in France and Australia.
He has a long track record in large international projects and developments all around the world in sectors facing major technology and market disruptions. He has developed a high level of expertise in areas such as organisation, corporate governance, risks mitigation, strategy, technology, financing and restructuring.
Jean-Georges currently serves as a non-executive director on the board and audit and risk committee of STMicroelectronics (NYSE: STM), and as a non-executive director on the boards of ORTEC, a construction and engineering company and Fives, a global industrial engineering group. Jean-Georges is also a Chevalier (Knight) of the French Légion d’Honneur Order and National Order of Merit.
01 2018 AT A GLANCE 02 CHAIRPERSONS AND CEO MESSAGE 03 OUR PORTFOLIO AND PERFORMANCE
For
per
sona
l use
onl
y

Our Boards’ Directors continued
| 2018 Atlas Arteria Annual Report18
JEFFREY CONYERSBA (Toronto)
ATLIX Non-Executive, Independent ChairmanBermuda-based – director since establishment on 16 December 2009Age: 65Jeffrey Conyers is the Chairman of the ATLIX Board and ATLIX Nomination and Governance Committee, and is a director of numerous companies in Bermuda. He is the former Chief Executive Officer of First Bermuda Securities Limited which provided advisory and execution services on worldwide offshore mutual funds to individuals and local companies based in Bermuda.
Jeffrey began his professional career as a stockbroker in Toronto and returned to Bermuda in 1985 to join the Bank of Bermuda, where his focus was investments and trusts. He is a founding executive council member and deputy chairman of the Bermuda Stock Exchange. Jeffrey has previously served on the boards of MAp Airports International Limited and Intoll International Limited, parts of the previously Macquarie-managed and ASX-listed vehicles MAp Group and Intoll Group respectively.
DEREK STAPLEYBA (Glas Cal) CA
ATLIX Non-Executive, Independent DirectorBermuda-based – director from 1 June 2010Age: 58
Derek Stapley, Chairman of the Audit and Risk Committee of ATLIX, is a Chartered Accountant with over 30 years’ experience and is a former partner with Ernst & Young. Derek has extensive experience as an independent director of several public and private investment funds, insurance companies and private client structures, and he works directly with a diverse range of global retail and institutional investors.
Derek’s position on other boards, and in particular as Chair of several Audit and Risk Committees, provides ATLIX with a deep and current understanding of public company reporting and evolving trends in corporate governance and risk management.
JAMES KEYESMA (Oxon)
ATLIX Non-Executive, Independent DirectorBermuda-based – director from 21 February 2013Age: 55
James Keyes, who is also the Chairman of the Remuneration Committee of ATLIX, is a Bermudan solicitor and barrister. He is currently on the board of a number of private and listed companies. He began his career with Freshfields in London and New York then moved to the Funds and Investment Services team at Appleby, one of the largest offshore law firms in Bermuda.
James retired as a partner from Appleby in 2008, and held a part-time position as Managing Director of Renaissance Capital, an investment bank, until December 2012. James was a director of the Bermudan entity within Transurban Group for six years, as well as a director of a company in the Moto group which operated road service stations in the UK, from which he gained experience in the toll road sector.
01 2018 AT A GLANCE 02 CHAIRPERSONS AND CEO MESSAGE 03 OUR PORTFOLIO AND PERFORMANCE
For
per
sona
l use
onl
y

2018 Atlas Arteria Annual Report | 19
CHRISTOPHER LESLIE BCom (Hons) (Melb) CA
ATLIX Non-Executive DirectorUnited States-based – director from 1 September 2017Age: 54
Christopher Leslie is a senior managing director of Macquarie Infrastructure and Real Assets (MIRA) based in New York, with 25 years’ experience in the acquisition, development and management of infrastructure assets across Australia, Asia and North America.
Christopher has extensive experience in the infrastructure sector, having been integral to the expansion of MIRA’s infrastructure business in the US since 1999. He has also served as Chief Executive Officer of MIRA’s North American series of unlisted infrastructure funds from 2006 to 2016, which collectively raised and invested more than US$8 billion into infrastructure assets.
He is currently a board member of several companies including Puget Energy, Cleco Corporation and InSite Wireless. Christopher is also a member of Chartered Accountants Australia and New Zealand.
04 OUR BOARDS’ DIRECTORS 05 GOVERNANCE 06 SUSTAINABILITY01 2018 AT A GLANCE 02 CHAIRPERSONS AND CEO MESSAGE 03 OUR PORTFOLIO AND PERFORMANCE
For
per
sona
l use
onl
y

Atlas Arteria Structure
ATLAX
Macquarie
ALXManager
Investments Investments
ATLIX
Atlas Arteria(ALX)1,2
Stapled
ALX Management andAdvisory Agreements
Resources(staff,
premises,IT, etc.)
100%
1. From May 2018 ALX commenced hiring its own sta�.2. ALX’s Management Arrangements will terminate no later than 15 May 2019, as approved by ALX securityholders on 15 May 2018.
Entity Type of entityAssets (various % holdings) Source of income
ATLAX Australian public company
Dulles Greenway, Cash
ATLAX derives its income primarily from returns from its asset portfolio
ATLIX Bermudan exempted mutual fund company
APRR, ADELAC, Dulles Greenway, Warnow Tunnel, Cash
ATLIX derives its income primarily from returns from its asset portfolio
| 2018 Atlas Arteria Annual Report20
05Governance
Legal framework and management arrangementsALX is a dual stapled vehicle externally managed by Macquarie. It was established in early February 2010 as a result of a securityholder approved restructure of Macquarie Infrastructure Group (MIG).
ALX comprises Atlas Arteria Limited (ACN 141 075 201) (ATLAX), an Australian public company, and Atlas Arteria International Limited (Registration No. 43828) (ATLIX), an exempted mutual fund company incorporated in Bermuda. ALX is listed as a stapled structure on the Australian Securities Exchange (ASX). The securities of ATLAX and ATLIX are stapled and must trade and otherwise be dealt with together.
ATLAX and ATLIX have entered into a cooperation deed which provides for sharing of information, adoption of consistent accounting policies and coordination of reporting to securityholders (ALX Cooperation Deed).
Management Arrangements On 15 May 2018, ALX securityholders approved an internalisation proposal at the ALX Annual General Meeting whereby ALX will cease to be externally managed by the ALX Manager no later than 15 May 2019 (Internalisation).
The external management arrangements are in accordance with management and advisory agreements (ALX Management Agreements) with Macquarie Fund Advisers Pty Limited (ABN 84 127 735 960) (AFS Licence Number 318123) (the ALX Manager) which were entered into by ATLAX and ATLIX respectively at the time of ALX’s establishment and were updated effective 15 May 2018.
As at the date of this statement, ALX remains Macquarie managed. ALX’s corporate governance arrangements conform to the Corporate Governance Principles and Recommendations (3rd edition) issued by the ASX Corporate Governance Council (ASX Principles), taking into account ALX being an externally managed vehicle. Any relevant implications or exceptions are noted in the reporting against these principles below.
The ALX Management Agreements are non-discretionary and substantially similar in their terms. They require the ALX Manager to make investment and divestment recommendations, provide active management of the ALX assets and to assist with the general administration of the companies.
The ALX Manager makes staff available as part of its management services, to perform the roles of ALX Chief Executive Officer (CEO), Chief Financial Officer (CFO) and other senior management roles.
In preparation for the Internalisation, ALX has commenced employing its own staff including the CEO Elect and CFO Elect (ALX Employees).
Key decision making is reserved for the ATLAX Board and the ATLIX Board (together the ALX Boards). The ALX Boards have no obligation to act on the recommendations of the ALX Manager and can appoint other advisers if they wish.
The ALX Manager has sub-advisory agreements with appropriately licensed or registered Macquarie Group companies in various non-Australian jurisdictions to assist with its management and advisory functions at no additional cost
01 2018 AT A GLANCE 02 CHAIRPERSONS AND CEO MESSAGE 03 OUR PORTFOLIO AND PERFORMANCE
For
per
sona
l use
onl
y

2018 Atlas Arteria Annual Report | 21
04 OUR BOARDS’ DIRECTORS 05 GOVERNANCE 06 SUSTAINABILITY
to ALX. All staff are supplied to these Macquarie management and advisory entities via resourcing arrangements with the Macquarie employing entity in the relevant jurisdiction.
A high level summary of the ALX Management Agreements, addressing the disclosure recommended in ASX Guidance Note 26, can be found on the ALX website.
Governance disclosuresMore detail about ALX’s operational and governance arrangements can also be found in the ASIC 231 Regulatory Guide disclosure on the ALX website. This disclosure includes details of any change of control provisions in ALX asset debt documents or shareholder arrangements triggered on removal of the ALX Manager as the manager/adviser of ALX.
We recommend that you also read the following constituent documents on the ALX website:• ATLIX Advisory Agreement (as amended)• ATLIX Transition Services Agreement• ATLIX Bye-Laws • ATLAX Management Agreement (as amended)• ATLAX Transition Services Agreement• ATLAX Constitution • ALX Cooperation Deed.
Corporate Governance StatementThe ALX Boards determine the corporate governance arrangements for ALX with regard to what they consider to be in the long term interests of ALX and its investors, and consistent with its responsibilities to other stakeholders.
ALX’s corporate governance arrangements conform to the Corporate Governance Principles and Recommendations (3rd edition) issued by the ASX Corporate Governance Council, taking into account ALX being an externally managed vehicle.
ALX’s Corporate Governance Statement has been approved by the ALX Boards and outlines ALX’s main corporate governance practices for the year ended 31 December 2018 and up to the date of issue of this 2018 Annual Report. Included in the statement are details relating to:• Board composition, skills matrix and performance• Director independence• Director attendance at 2018 ALX Board and
Committee meetings• Diversity• Securities trading policy• Market disclosures • Risk management framework• Auditor independence.
ALX’s Corporate Governance Statement, as well as other governance documents referred to within the statement, can be viewed on ALX’s website at www.atlasarteria.com/about. These governance documents are regularly reviewed and updated to ensure that they remain consistent with the objectives of the ALX Boards.
01 2018 AT A GLANCE 02 CHAIRPERSONS AND CEO MESSAGE 03 OUR PORTFOLIO AND PERFORMANCE
For
per
sona
l use
onl
y
06Sustainability
Our approachAt ALX, we believe that many environmental, social and economic benefits arise from the responsible and sustainable development and operation of infrastructure. We are also aware that with these benefits, there are risks that may have commercial, reputational and regulatory impact on our business and affect the communities in which our portfolio companies operate.
Accordingly, the identification, assessment and responsible management of (and ongoing reduction in) environmental and social risks is fundamental to our day-to-day business activities and is an essential part of ensuring our long-term success. We are dedicated not only to our securityholders, but also to the community and we remain committed to our approach to environmental, social and economic responsibility.
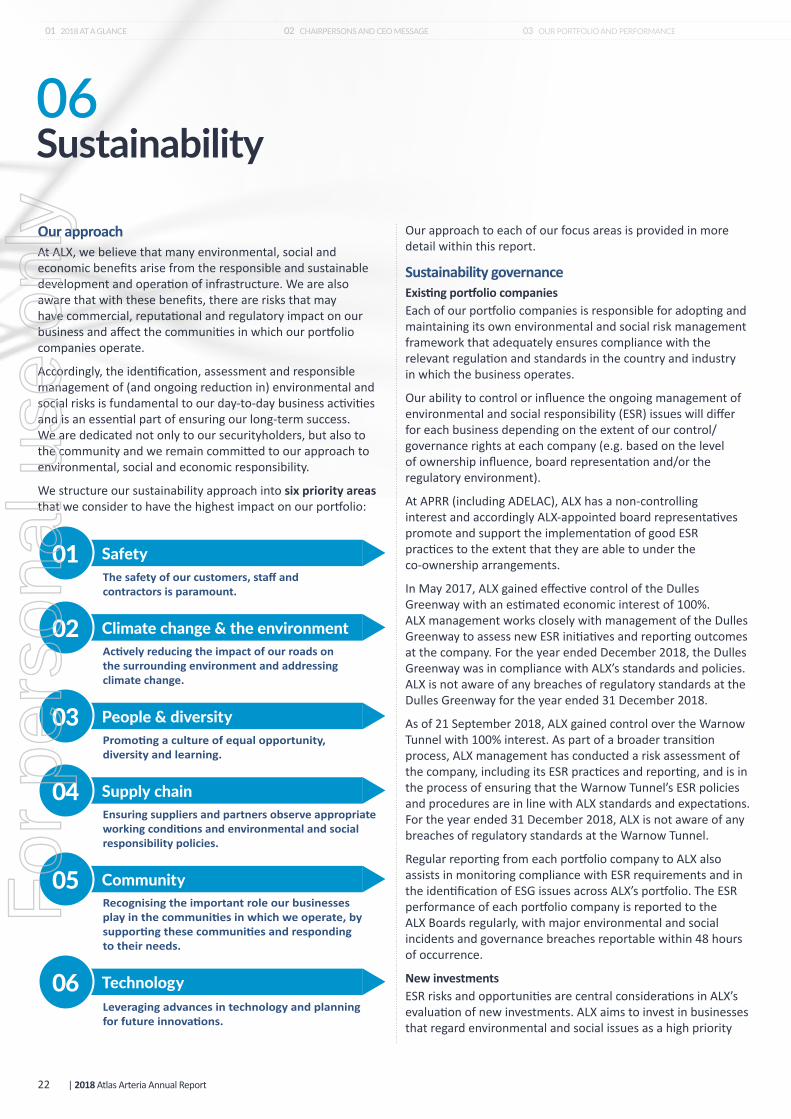
We structure our sustainability approach into six priority areas that we consider to have the highest impact on our portfolio:
Safety01The safety of our customers, staff and contractors is paramount.
Climate change & the environment02Actively reducing the impact of our roads on the surrounding environment and addressing climate change.
People & diversity03Promoting a culture of equal opportunity, diversity and learning.
Supply chain04Ensuring suppliers and partners observe appropriate working conditions and environmental and social responsibility policies.
Community05Recognising the important role our businesses play in the communities in which we operate, by supporting these communities and responding to their needs.
Technology06Leveraging advances in technology and planning for future innovations.
Our approach to each of our focus areas is provided in more detail within this report.
Sustainability governanceExisting portfolio companiesEach of our portfolio companies is responsible for adopting and maintaining its own environmental and social risk management framework that adequately ensures compliance with the relevant regulation and standards in the country and industry in which the business operates.
Our ability to control or influence the ongoing management of environmental and social responsibility (ESR) issues will differ for each business depending on the extent of our control/governance rights at each company (e.g. based on the level of ownership influence, board representation and/or the regulatory environment).
At APRR (including ADELAC), ALX has a non-controlling interest and accordingly ALX-appointed board representatives promote and support the implementation of good ESR practices to the extent that they are able to under the co-ownership arrangements.
In May 2017, ALX gained effective control of the Dulles Greenway with an estimated economic interest of 100%. ALX management works closely with management of the Dulles Greenway to assess new ESR initiatives and reporting outcomes at the company. For the year ended December 2018, the Dulles Greenway was in compliance with ALX’s standards and policies. ALX is not aware of any breaches of regulatory standards at the Dulles Greenway for the year ended 31 December 2018.
As of 21 September 2018, ALX gained control over the Warnow Tunnel with 100% interest. As part of a broader transition process, ALX management has conducted a risk assessment of the company, including its ESR practices and reporting, and is in the process of ensuring that the Warnow Tunnel’s ESR policies and procedures are in line with ALX standards and expectations. For the year ended 31 December 2018, ALX is not aware of any breaches of regulatory standards at the Warnow Tunnel.
Regular reporting from each portfolio company to ALX also assists in monitoring compliance with ESR requirements and in the identification of ESG issues across ALX’s portfolio. The ESR performance of each portfolio company is reported to the ALX Boards regularly, with major environmental and social incidents and governance breaches reportable within 48 hours of occurrence.
New investmentsESR risks and opportunities are central considerations in ALX’s evaluation of new investments. ALX aims to invest in businesses that regard environmental and social issues as a high priority
| 2018 Atlas Arteria Annual Report22
01 2018 AT A GLANCE 02 CHAIRPERSONS AND CEO MESSAGE 03 OUR PORTFOLIO AND PERFORMANCE
For
per
sona
l use
onl
y

and we are committed to complying with all regulations and engaging responsibly with the community.
Accordingly, all potential investments in new businesses will be screened as part of a comprehensive due diligence process, in relation to ESR risks, including workplace health and safety and climate change. To date, all investments made by ALX have been in businesses where ALX has already held an equity investment and has had a detailed understanding of the ESR risks and performance. ESR risks are also included as part of the independent due diligence performed and included in any investment proposal presented to the ALX Boards for consideration.
In addition to our own processes and policies, new infrastructure projects are often subject to extensive social and environmental impact reviews by governments, prior to being given approval to proceed.
Sustainability policiesESR-related risks are dealt with under several of ALX’s policies:• Environmental and Social Responsibility Policy: sets out the
requirements for identifying and managing environmental and social risks that arise in the day-to-day activities of ALX.
• Risk Management Policy: sets out the risk thresholds, framework and policies in place to manage investment, credit, liquidity, operational and legal risks associated with ALX’s operations and investments.
• Workplace Health and Safety Risk Policy: sets out the requirements for identifying and managing workplace health and safety risks that arise in the day-to-day activities of ALX.
• Diversity Policy: outlines ALX’s commitment and approach to ensuring diversity of experiences, skills, views and backgrounds for its directors and management.
• Code of Conduct: sets out the expectations for ALX employees in conducting business and outlines the values by which employees are expected to act.
These policies are available on the ALX website and form part of ALX’s overarching risk management framework in accordance with Principle 7 of its Corporate Governance Statement.
ALX’s governance responsibilities and policies are covered in its Corporate Governance Statement. For more information, visit our website at www.atlasarteria.com
2018 Atlas Arteria Annual Report | 23
04 OUR BOARDS’ DIRECTORS 05 GOVERNANCE 06 SUSTAINABILITY01 2018 AT A GLANCE 02 CHAIRPERSONS AND CEO MESSAGE 03 OUR PORTFOLIO AND PERFORMANCE
For
per
sona
l use
onl
y

Stakeholder engagement ALX regularly engages with a broad range of stakeholders who are involved in, or impacted by, our business. ALX’s key stakeholders include our co-investors, portfolio company employees, governments and regulators, suppliers, securityholders and the wider communities in which our portfolio businesses operate. Clear dialogue with these stakeholders is important to building strong relationships, maintaining trust and enhancing our business performance for the long term.
The Manager’s approach to SustainabilityFor the full year ended 31 December 2018, the day-to-day management and administration of ALX was delegated to the Manager under the management and advisory agreements. The Manager, as part of Macquarie Asset Management, a division within the Macquarie Group, is committed to strong corporate governance and environmental and social responsibility.
It adopts a rigorous risk management framework that incorporates active management and monitoring of a broad range of risks, including environmental and social risks. This approach is governed by Macquarie’s ESG framework and related policies.
The Manager is also guided by the International Finance Corporation’s (IFC) Environmental and Social Performance Standards and Environmental, Health and Safety Guidelines.
Refer to the Macquarie Group website: www.macquarie.com/esg
The Manager’s approach to Modern Slavery Macquarie Group’s Modern Slavery Act Transparency Statement 2018 is the third report published by Macquarie Group, outlining the actions undertaken by the Group and the Macquarie Group entities to identify and mitigate the risk of Modern Slavery and human trafficking occurring in its supply chains or businesses. Macquarie has an established set of policies and procedures that govern the way it operates. These are relevant to how Macquarie manages potential human rights related issues with regard to its employees, supply chain and business operations and include:• Code of conduct• Equal Employment Opportunity Policies• Procurement Policy and Principles for Suppliers• Financial Crime Compliance framework• Environmental and Social Risk Policy• Whistleblower Program.
In relation to ALX, a review was undertaken of the businesses in which ALX holds a 100% interest (i.e. Dulles Greenway and Warnow Tunnel) to identify potential areas of risk in relation to Modern Slavery. No material risks were identified.
ALX regards Modern Slavery as an important risk area and will continue to review and monitor relevant risks and develop appropriate responses. This includes ensuring our compliance in relation to potential legislative developments.
ALX respects human rights. This is fundamental to our value of treating each other with dignity and respect. Over the 2019 year we will be rolling out a number of initiatives aimed at protecting the human rights of people who come into contact with our business, including employees, contractors and the employees of our suppliers. This programme will include our response to new Modern Slavery laws in Australia and elsewhere.
ESR-related regulatory requirementsALX and Macquarie Group policies outline the framework in which breaches of policies or regulatory standards are identified and addressed. ALX is not aware of any material breaches of relevant ESR-related regulatory standards by its businesses during the year ended 31 December 2018.
Achieving our goals and establishing best practice Over the last 24 months as ALX has moved to 100% ownership at two of our businesses, Dulles Greenway and Warnow Tunnel, we are better able to implement sustainability goals at these portfolio companies. ALX management actively engages with the management and employees of these companies to establish strategies and measures, and benchmarks and monitors progress against these measures in order to better achieve these sustainability goals.
We will continue to assess our sustainability strategy with reference to key industry guidelines and reporting standards. ALX’s sustainability approach and six priority areas are drawn from certain objectives and goals outlined in the United Nations’ Sustainable Development Goals. Our largest business, APRR, has been an asset assessment participant of GRESB Infrastructure since 2017, allowing us to better assess our ESG performance against our peers.
At the Dulles Greenway, the local management team has been working with other toll road operators in Virginia and Pennsylvania to establish a peer working group, tasked with addressing climate change initiatives and establishing best practice standards on energy efficiency and safety across the toll road sector.
| 2018 Atlas Arteria Annual Report24
Sustainability continued
01 2018 AT A GLANCE 02 CHAIRPERSONS AND CEO MESSAGE 03 OUR PORTFOLIO AND PERFORMANCE
For
per
sona
l use
onl
y

In 2018, road users travelled 24.9 billion kilometres across ALX’s portfolio companies. The safety of our road users, staff and contractors is paramount.
It is therefore with great sadness that we recorded a fatality during 2018 at APRR, an ALX portfolio company. The incident involved a sub-contractor to APRR’s engineering, procurement and construction (EPC) contractor. The French Work Inspection Agency mobilised on the day of the incident to conduct an independent investigation of the incident, with all work at the site suspended during the investigation. The Manager continues to monitor the APRR and French Work Inspection Agency’s investigation of this incident and reports to the ALX Boards. Details of the incident, as far as they are currently known, were shared with other ALX businesses in safety briefings.
We reinforce “health and safety first” at all our businesses and are committed to promoting a “zero harm” culture across the employment of staff, use of contractors, interaction with the public, control of premises and provision of services to ensure we remain in compliance with all relevant regulatory and legal obligations.
The workplace health and safety performance for each of ALX’s portfolio companies is reported to the Audit and Risk Committees on a quarterly basis and presented to the ALX Boards annually. Our policies require any major incidents to be reported to the ALX Boards within 48 hours of notification being received of such an occurrence.
Safety01
2018 Atlas Arteria Annual Report | 25
Case study
Safety at work, and achieving a “zero-accident” target are among the top priorities of APRR and ADELAC. The Group operates an all-round safety strategy which includes rigorous operating procedures. The APRR and ADELAC network is under constant safety monitoring to ensure rapid response to help keep customers safe at all times:
In 2018, APRR trialled and deployed new technologies including thermal cameras and counting loops to detect and minimise accidents caused by drivers travelling in the wrong direction on the motorway network.
550 video cameras and 380 traffic counting stations, with emergency phones located every two kilometres along the network.
Approximately one third of employees have safety-related roles with a fleet of 1,500 monitoring and response vehicles.
As at 31 December, APRR reported a LTIFR of 5.2 (5.9 as at 31 December 2017). Note that the calculation of LTIFR does not take into account the aforementioned fatality.1
Employees at the Dulles Greenway are actively involved in regular safety initiatives and training programmes which are provided throughout the year.
In 2018, all employees and contractors completed the ‘National Traffic Incident Management Responder Course’, a new safety and incident response course led by Virginia State Police.
In 2018, no serious accident was reported at the Greenway, leading to a zero LTIFR as at 31 December 2018. However, an employee has received treatment in May 2018 for a previous back injury, which occurred at work in December 20172. This has led to a restatement of the 2017 LTIFR from zero to 11.3. In 2018, the Dulles Greenway also strengthened regular reporting for “near misses” for any safety incidents.
Warnow Tunnel has been named one of the safest tunnels in Europe by ADAC (the General German Automobile Club). Since opening to traffic, it has continued to implement modernisation works to maintain its high safety and environmental standards. In 2018, Warnow Tunnel experienced no serious accidents (LTIFR of 0) and upon ALX acquiring a remaining 30% interest in Warnow Tunnel, there has been a strengthening of regular reporting for safety incidents.
During 2019, ALX intends to focus on further enhancing regular reporting of safety incidents at both the Dulles Greenway and Warnow Tunnel.
1. Customary practice in the LTIFR calculation. Any fatalities or serious injuries are reported as separate events in addition to LTIFR measures.2. The incident occurred in December 2017, where an employee suffered a back injury at work but did not suffer serious injury at the time. This resulted in zero LTIFR prior
to restatement for 2017.
Our Sustainability focus areas:
04 OUR BOARDS’ DIRECTORS 05 GOVERNANCE 06 SUSTAINABILITY01 2018 AT A GLANCE 02 CHAIRPERSONS AND CEO MESSAGE 03 OUR PORTFOLIO AND PERFORMANCE
For
per
sona
l use
onl
y
Case study
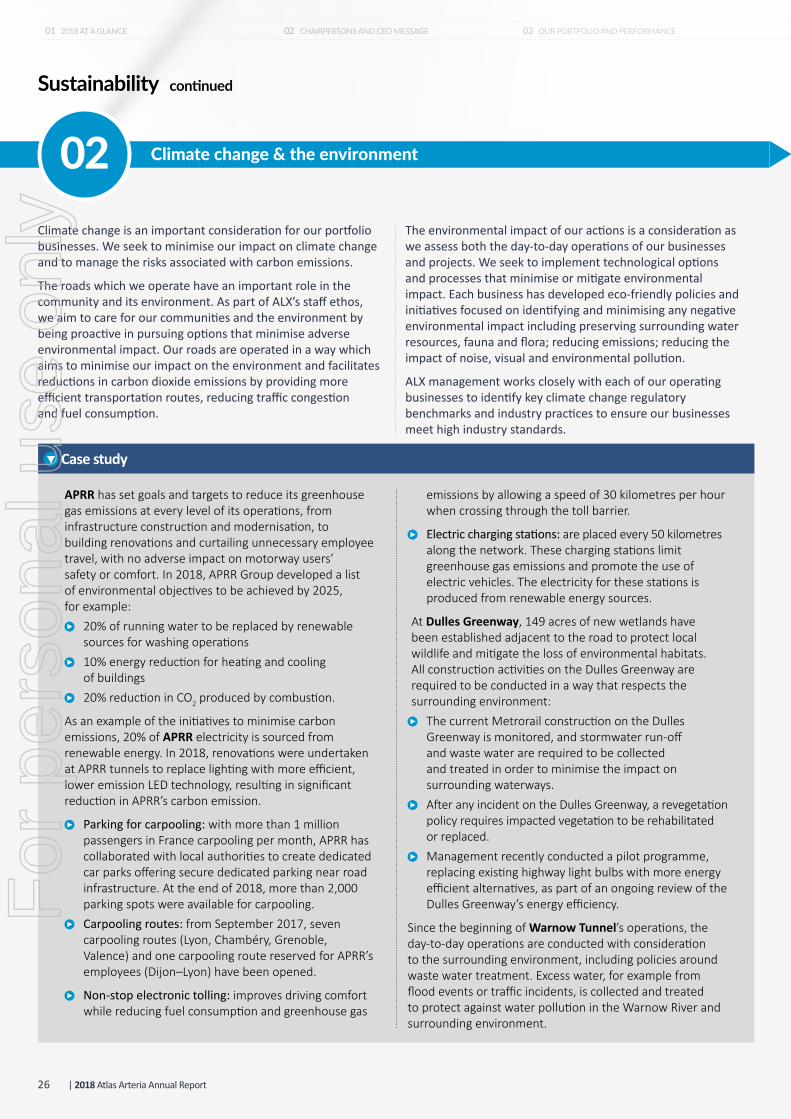
APRR has set goals and targets to reduce its greenhouse gas emissions at every level of its operations, from infrastructure construction and modernisation, to building renovations and curtailing unnecessary employee travel, with no adverse impact on motorway users’ safety or comfort. In 2018, APRR Group developed a list of environmental objectives to be achieved by 2025, for example:
20% of running water to be replaced by renewable sources for washing operations
10% energy reduction for heating and cooling of buildings
20% reduction in CO2 produced by combustion.
As an example of the initiatives to minimise carbon emissions, 20% of APRR electricity is sourced from renewable energy. In 2018, renovations were undertaken at APRR tunnels to replace lighting with more efficient, lower emission LED technology, resulting in significant reduction in APRR’s carbon emission.
Parking for carpooling: with more than 1 million passengers in France carpooling per month, APRR has collaborated with local authorities to create dedicated car parks offering secure dedicated parking near road infrastructure. At the end of 2018, more than 2,000 parking spots were available for carpooling.
Carpooling routes: from September 2017, seven carpooling routes (Lyon, Chambéry, Grenoble, Valence) and one carpooling route reserved for APRR’s employees (Dijon–Lyon) have been opened.
Non-stop electronic tolling: improves driving comfort while reducing fuel consumption and greenhouse gas
emissions by allowing a speed of 30 kilometres per hour when crossing through the toll barrier.
Electric charging stations: are placed every 50 kilometres along the network. These charging stations limit greenhouse gas emissions and promote the use of electric vehicles. The electricity for these stations is produced from renewable energy sources.
At Dulles Greenway, 149 acres of new wetlands have been established adjacent to the road to protect local wildlife and mitigate the loss of environmental habitats. All construction activities on the Dulles Greenway are required to be conducted in a way that respects the surrounding environment:
The current Metrorail construction on the Dulles Greenway is monitored, and stormwater run-off and waste water are required to be collected and treated in order to minimise the impact on surrounding waterways.
After any incident on the Dulles Greenway, a revegetation policy requires impacted vegetation to be rehabilitated or replaced.
Management recently conducted a pilot programme, replacing existing highway light bulbs with more energy efficient alternatives, as part of an ongoing review of the Dulles Greenway’s energy efficiency.
Since the beginning of Warnow Tunnel’s operations, the day-to-day operations are conducted with consideration to the surrounding environment, including policies around waste water treatment. Excess water, for example from flood events or traffic incidents, is collected and treated to protect against water pollution in the Warnow River and surrounding environment.
Climate change is an important consideration for our portfolio businesses. We seek to minimise our impact on climate change and to manage the risks associated with carbon emissions.
The roads which we operate have an important role in the community and its environment. As part of ALX’s staff ethos, we aim to care for our communities and the environment by being proactive in pursuing options that minimise adverse environmental impact. Our roads are operated in a way which aims to minimise our impact on the environment and facilitates reductions in carbon dioxide emissions by providing more efficient transportation routes, reducing traffic congestion and fuel consumption.
The environmental impact of our actions is a consideration as we assess both the day-to-day operations of our businesses and projects. We seek to implement technological options and processes that minimise or mitigate environmental impact. Each business has developed eco-friendly policies and initiatives focused on identifying and minimising any negative environmental impact including preserving surrounding water resources, fauna and flora; reducing emissions; reducing the impact of noise, visual and environmental pollution.
ALX management works closely with each of our operating businesses to identify key climate change regulatory benchmarks and industry practices to ensure our businesses meet high industry standards.
Climate change & the environment02
| 2018 Atlas Arteria Annual Report26
Sustainability continued
01 2018 AT A GLANCE 02 CHAIRPERSONS AND CEO MESSAGE 03 OUR PORTFOLIO AND PERFORMANCE
For
per
sona
l use
onl
y

Case study Case study
APRR and AREA have been granted the “Diversity Label” from Association Française de Normalisation (AFNOR), France’s national organisation for standardisation. More than 80 employees are now “diversity” ambassadors. APRR has adopted a series of diversity and equality benchmarks, including a company-wide employee target of 50% female representation.
The Dulles Greenway dedicates significant time and resources to providing training and development opportunities for employees. In 2018, a new online training programme was introduced covering topics such as safety, customer service, basic first aid, chemicals, weather and safety. Since inception of the online programme, 100% of employees have participated in the 17 online courses that have been offered.
Providing an engaging and inclusive work environment is a key priority for the Warnow Tunnel. Warnow Tunnel’s Code of Ethics outlines the key principles of mutual respect and trust within the workplace, stipulating that there is no tolerance for discrimination. During 2018, employees from various function roles undertook a range of training courses which included English language courses, a first aid refresher course, stress relief and management, data privacy and self-defence.
APRR promotes a diverse and inclusive environment not only for its own employees, but also for the employees of its suppliers and partners who are required to adopt the best practices to which APRR adheres. In addition to this, APRR has policies in place to ensure suppliers are tested against environmental, sustainability and safety criteria in a competitive tendering process.
Supply chain risk management is a key aspect of ensuring safe and uninterrupted operations at the Dulles Greenway. As part of the Dulles Greenway’s procurement policy, for each operations and maintenance service, management will maintain relationships with more than one vendor to minimise disruption risk.
The commitment to the wellbeing of our corporate employees and the employees of our portfolio companies is important for the effective performance of ALX and our portfolio companies. We endeavour to create a strong learning environment where our focus is on continually developing our own and others’ skills.
At our portfolio companies, ALX-appointed board representatives support the implementation of appropriate diversity, equality and employee engagement policies, including the employment and representation of women across all levels of the company.
ALX also adopts a Diversity Policy at the ALX Board and management levels through consultation with the Manager. Details of our progress are provided in ALX’s Corporate Governance Statement, as well as ALX’s website: https://www.atlasarteria.com/sustainability.
Our businesses are service providers in a competitive market with a multitude of stakeholders. We engage with and listen to our stakeholders to understand their needs and develop our business in a mutually beneficial manner. This extends to our engagement with our supply chain operations.
Our portfolio companies engage with thousands of suppliers through day-to-day operations, and construction projects drive significant economic development in the communities in which our businesses operate. ALX recognises that global emerging issues, such as Modern Slavery, have the potential to impact our businesses and their supply chains.
Control measures at each portfolio business include a supplier code that sets community, environmental management, social responsibility, governance and supply chain criteria for all suppliers. Tender and contract management processes also include environmental, sustainability and safety requirements specific to each contract.
People & diversity Supply chain03 04
2018 Atlas Arteria Annual Report | 27
04 OUR BOARDS’ DIRECTORS 05 GOVERNANCE 06 SUSTAINABILITY01 2018 AT A GLANCE 02 CHAIRPERSONS AND CEO MESSAGE 03 OUR PORTFOLIO AND PERFORMANCE
For
per
sona
l use
onl
y

Case study Case study
APRR regularly adapts its commercial offering to support more environmentally friendly and user-friendly means of transport, including non-stop electronic tolling, parking for carpooling, electric vehicle charging stations, carpooling lanes, discounted ETC tags for electric vehicles and carpooling users, dynamic speed control systems, as well as other safety measures, including APRR’s mobile safety app.
In 2018, Dulles Greenway held its 14th Annual “Drive for Charity” during which 100% of toll proceeds for the day were distributed to charitable and not-for-profit organisations in the local community. In 2018 a total of US$316K was raised. Since its inception, the Drive for Charity has raised and distributed over US$3.4 million.
Warnow Tunnel continues to be an active participant in the local community through various sponsorships and donations across a diversified range of initiatives. In 2018, Warnow Tunnel provided sponsorship to a diverse number of regional sports clubs, as well as a local school for refugees, and an academy for young musicians. Warnow Tunnel is also a long-time sponsor of the Marlow Bird Park and Rostock Zoo.
APRR’s Horizon 2020 programme, Start.Lab, encourages all employees to think about and design tomorrow’s motorways and services. Over a 16-month period, 110 employees have tackled challenges posed by a series of Start.Lab workshops. Each workshop provides the opportunity for participants to reflect on technological and social changes in areas such as smart vehicles, urban tolls, eco-mobility and multimodal transport, and determine ways to address these paradigm shifts.
During 2018, the Dulles Greenway collaborated with Virginia Tech University and Virginia Department of Transport to provide a safe testing environment for driverless vehicles.
Warnow Tunnel maintains a policy for cyber risk management and continues to participate in the Federal Research Institute’s Cyber Safe project. Penetration tests are executed regularly at every network level in order to mitigate the risk of attacks.
We recognise the important role and long-term impact of infrastructure businesses on local communities in the regions in which they operate.
In addition to compliance with the relevant laws and regulations, we seek to ensure our portfolio businesses constantly pay attention and respond to community needs, to support and build strong relationships with these communities.
We promote this first through ensuring our customers continue to benefit from the high level of service, user-friendly initiatives, operational safety, and time efficiencies provided by our roads, as well as by supporting our local communities through donations, sponsorships and partnerships.
The employees at our portfolio companies are an inherent part of the communities in which they operate, and are the face of ALX to the community.
ALX is keenly aware of the benefits of leveraging technology across its corporate business and portfolio operations, to provide a better customer experience and to improve productivity and reduce costs.
However, ALX is also aware that with these benefits lies the potential for cybersecurity, privacy and data protection risks, which can have reputational, regulatory and economic impacts on our business and our customers. ALX is working together with its portfolio companies to prepare for the opportunities presented by technological advancements and to mitigate the potential threat of cyber and security risks.
A combination of technological transformation and social change is also prompting a profound shift in our societies’ attitude to travel. In response, our businesses are working towards supporting the development of new means of transport (such as electric and autonomous vehicles) and new practices such as carpooling and the use of social media.
Through both the Manager and ALX’s appointed Board representatives, ALX is committed to ensuring its portfolio companies adequately understand the technology-related risks and opportunities facing their operations and have in place appropriate protocols and innovation planning to prepare for changes in technology.
Community Technology05 06
| 2018 Atlas Arteria Annual Report28
Sustainability continued
01 2018 AT A GLANCE 02 CHAIRPERSONS AND CEO MESSAGE 03 OUR PORTFOLIO AND PERFORMANCE
For
per
sona
l use
onl
y

This report comprises:Atlas Arteria International Limited (formerly Macquarie Atlas Roads International Limited) and its controlled entities.
Atlas Arteria Limited(formerly Macquarie Atlas Roads Limited) and its controlled entities.
29 2018 Atlas Arteria Annual Report |
07Financial Reportfor the year ended 31 December 2018
For
per
sona
l use
onl
y

30 | 2018 Atlas Arteria Annual Report
Important Notice
Atlas Arteria (“ALX”) (formerly Macquarie Atlas Roads) comprises Atlas Arteria International Limited (Registration No. 43828) (“ATLIX”) (formerly Macquarie Atlas Roads International Limited) and Atlas Arteria Limited (ACN 141 075 201) (“ATLAX”) (formerly Macquarie Atlas Road Limited). ATLIX is an exempted mutual fund company incorporated and domiciled in Bermuda with limited liability and the registered office is Belvedere Building, 69 Pitts Bay Road, Pembroke HM08, Bermuda. ATLAX is a company limited by shares incorporated and domiciled in Australia and the registered office is Level 7, 50 Martin Place, Sydney, NSW 2000, Australia. Macquarie Fund Advisers Pty Limited (ACN 127 735 960) (AFS License No.318123) (“MFA”) is the adviser/manager of ATLIX and ATLAX. MFA is a wholly owned subsidiary of Macquarie Group Limited (ACN 122 169 279) (“MGL”).
None of the entities noted in these reports is an authorised deposit-taking institution for the purposes of the Banking Act 1959 (Commonwealth of Australia). The obligations of these entities do not represent deposits or other liabilities of Macquarie Bank Limited (ABN 46 008 583 542) (“MBL”). MBL does not guarantee or otherwise provide assurance in respect of the obligations of these entities.
These reports are not an offer or invitation for subscription or purchase of or a recommendation of securities. It does not take into account the investment objectives, financial situation and particular needs of the investor. Before making an investment in ALX, the investor or prospective investor should consider whether such an investment is appropriate to their particular investment needs, objectives and financial circumstances and consult an investment adviser if necessary.
MFA as adviser/manager of ATLIX and ATLAX is entitled to fees for so acting. MGL and its related corporations (including MFA), ATLAX and ATLIX together with their officers and directors may hold stapled securities in ALX from time to time.
For
per
sona
l use
onl
y

31 2018 Atlas Arteria Annual Report |
Directors’ Reportsfor the year ended 31 December 2018
The directors of Atlas Arteria International Limited (“ATLIX”) (formerly Macquarie Atlas Roads International Limited) submit the following report together with the Financial Report of Atlas Arteria (“ALX” or the “Group”) (formerly Macquarie Atlas Roads) for the year ended 31 December 2018.
An ALX stapled security comprises one ATLIX share ‘stapled’ to one Atlas Arteria Limited (“ATLAX”) (formerly Macquarie Atlas Roads Limited) share to create a single listed security traded on the Australian Securities Exchange (“ASX”). The stapled securities cannot be traded or dealt with separately.
AASB 3 Business Combinations and AASB 10 Consolidated Financial Statements require one of the stapled entities of a stapled structure to be identified as the parent entity for the purpose of preparing a consolidated Financial Report. In accordance with this requirement, ATLIX has been identified as the parent entity of the consolidated group comprising ATLIX and its controlled entities and ATLAX and its controlled entities (“ATLAX Group”), together comprising ALX.
The directors of ATLAX submit the following report together with the Financial Report of the ATLAX Group for the year ended 31 December 2018.
Macquarie Fund Advisers Pty Limited (the “Adviser/Manager” or “MFA”) acts as the adviser for ATLIX and the manager of ATLAX.
Directors The following persons were directors of ATLIX during the whole of the year and up to the date of this report:• Jeffrey Conyers (Chairman)• James Keyes• Christopher Leslie • Nora Scheinkestel• Derek Stapley
The following persons were directors of ATLAX during the whole of the year and up to the date of this report (unless otherwise stated):• Nora Scheinkestel (Chairman)• David Bartholomew (Appointed on 1 October 2018)• Richard England (Resigned on 30 November 2018) • Debra Goodin• Jean-Georges Malcor (Appointed on 1 November 2018)• John Roberts (Resigned on 28 September 2018)
For
per
sona
l use
onl
y

Directors’ Reports continuedfor the year ended 31 December 2018
32 | 2018 Atlas Arteria Annual Report
Operating and financial reviewPrincipal activitiesThe principal activity of the Group and the ATLAX Group (together, the “Groups”) is to invest in infrastructure assets in Organisation for Economic Co-operation and Development (“OECD”) and OECD equivalent countries; and non-infrastructure assets where ancillary to a major infrastructure investment but with the current focus on toll road investments, both greenfield and mature. Other than as disclosed elsewhere in these reports, there were no significant changes in the nature of the Groups’ activities during the year.
DistributionsDistributions paid to security holders were as follows:
Year ended31 Dec 2018
$’000
Year ended31 Dec 2017
$’000
Distribution of 12.0 cents per stapled security (“cps”) paid on 5 October 20181 81,992 –
Dividend of 12.0 cps paid on 13 April 20182 80,375 –
Dividend of 10.0 cps paid on 29 September 20173 – 58,188
Distribution of 10.0 cps paid on 7 April 20174 – 57,294
162,367 115,482
1. Comprised a capital return of 11.3 cps and an unfranked Australian ordinary dividend of 0.7 cps. The distribution was paid in full by ATLAX.2. Comprised an ordinary dividend of 12.0 cps. The dividend was paid in full by ATLIX.3. Comprised an ordinary dividend of 10.0 cps. The dividend was paid in full by ATLIX.4. Comprised a capital return of 9.8 cps and an ordinary dividend of 0.2 cps. The distribution was paid in full by ATLIX.
Review and results of operations1, 2, 3
The performance of ALX and the ATLAX Group for the year, as represented by the results of their operations, was as follows:
ALX ATLAX GroupYear ended
31 Dec 2018$’000
Year ended31 Dec 2017
$’000
Year ended31 Dec 2018
$’000
Year ended31 Dec 2017
$’000
Revenue and other income from operations 145,987 473,001 5,764 68,166
Operating expenses (222,458) (104,343) (17,795) (8,493)
Finance costs (108,920) (53,795) – –
Share of net profits/(losses) of investments accounted for using the equity method
246,141 187,971 (4,801) (626)
Income tax (expense)/benefit (898) 16,749 1 (1,664)
Profit/(loss) from operations after income tax 59,852 519,583 (16,831) 57,383
Profit/(loss) attributable to:
Equity holders of the parent – ATLIX 76,683 462,200 – –
Equity holders of other stapled entity – ATLAX (as non-controlling interest/parent entity)
(16,831) 57,383 (16,831) 57,383
Profit/(loss) attributable to stapled security holders 59,852 519,583 (16,831) 57,383
Cents Cents Cents Cents
Basic profit/(loss) per ALX stapled security 8.84 87.66 (2.49) 9.68
Diluted profit/(loss) per ALX stapled security 8.84 87.66 (2.49) 9.68
1. On 20 September 2018 (“WQG Acquisition Date”), ALX completed the acquisition of the remaining 30% equity interest and shareholder loan in Warnowquerung GmbH & Co KG, the concessionaire of Warnow Tunnel and its general partner Warnowquerung Verwaltungsgesellschaft mbH (collectively “WQG”). WQG’s results are consolidated from the WQG Acquisition Date in the current year.
2. On 16 May 2017 (“TRIP II Acquisition Date”), ALX completed the acquisition of the remaining 50% estimated economic interest in Toll Road Investors Partnership II (“TRIP II”), the concessionaire for Dulles Greenway. TRIP II’s results were consolidated from the TRIP II Acquisition Date in the prior year and for the entire period in the current year.
3. On 24 October 2017, ALX acquired an additional 4.86% indirect interest in APRR via Macquarie Autoroutes de France 2 SA (“MAF2”) bringing its indirect economic interest to 25.00%. ALX’s share of the results of its non-controlled toll road assets are disclosed as share of net profit of investments accounted for using the equity method.
For
per
sona
l use
onl
y

33 2018 Atlas Arteria Annual Report |
ALX’s profit after income tax for the year ended 31 December 2018 was $59.9 million (2017: $519.6 million). The movement in results for the year reflects the following significant items:• Revenue and other income from operations of $146.0 million (2017: $473.0 million) has decreased due to:
– The non-recurrence of the one-off gain on revaluation of the original investment in Dulles Greenway in the prior year of $375.6 million; which is partly offset by
– The consolidation of a full year of TRIP II’s toll revenue of $121.2 million (2017: $75.7 million); – The consolidation of WQG’s toll revenue of $5.7 million from WQG Acquisition Date; and – Gain on revaluation of the original investment in WQG of $13.5 million (2017: Nil).
• Operating expenses of $222.5 million (2017: $104.3 million) have increased due to: – An increase in performance fee expense to $70.6 million (2017: $8.0 million). The current year expense was calculated in
accordance with, and due to the renegotiation of, the management agreements and reflects the full 2018 performance fee of $54.7 million and the second and third instalments of the 2017 performance fee totalling $15.9 million. In the prior year, only the first instalment of the 2017 fee was required to be recognised due to the level of outperformance against the benchmark. A total performance fee liability of $115.3 million was payable at 30 June 2018, of which $25.0 million was settled in cash and $90.3 million was settled through a subscription of new ALX securities in July 2018.
– Management internalisation expenses of $10.3 million (2017: $0.5 million). – The consolidation of a full year of TRIP II’s expenses of $90.8 million (2017: $53.2 million). – The consolidation of WQG’s expenses of $3.8 million from the WQG Acquisition Date.
• Finance costs of $108.9 million (2017: $53.8 million) include: – Consolidation of a full year TRIP II’s bond interest expenses of $71.8 million (2017: $42.4 million). – Consolidation of WQG’s interest expenses of $4.0 million from the WQG Acquisition Date. – Interest, amortisation expense and early repayment fees of $15.7 million (2017: $10.1 million) up to the date of repayment
of the loan facility used to acquire a portion of the remaining estimated 50% economic interest in TRIP II. – Interest and amortisation expense of $6.2 million (2017: $1.3 million) up to the date of repayment of the loan facility used
to acquire a portion of an additional stake in APRR. – Interest and amortisation expense of $9.2 million (2017: Nil) on the new loan facility after refinancing of the APRR asset
finance facility and repayment of Dulles Greenway asset finance facility.
• Share of net profit of investments accounted for using the equity method of $246.1 million (2017: $188.0 million), primarily comprising:
– APRR profit of $246.1 million is up on the prior year (2017: $192.0 million) primarily reflecting ALX’s increased share of profits resulting from the acquisition of the additional 4.86% indirect interest on 24 October 2017. Additional growth is due to foreign exchange, as well as improved performance and the reduction in finance costs following the termination of the Eiffarie swap.
– Dulles Greenway loss of $3.9 million included in the prior year up to the TRIP II Acquisition Date.
• Income tax expense of $0.9 million (2017: benefit of $16.7 million) includes: – WQG’s trade tax of $2.1 million from the WQG Acquisition Date; offset by – Amortisation of deferred tax liability recognised on acquisition of TRIP II and WQG of $1.2 million (2017: $1.0 million).
In 2017, a reduction in deferred tax liability of $17.5 million was recognised on acquisition of remaining interest in TRIP II due to decrease in United States Federal Income tax rate.
– Prior year expense includes final tax expense of $1.7 million on the distribution proceeds relating to the sale of Skyway Concession Company LLC.F
or p
erso
nal u
se o
nly

Directors’ Reports continuedfor the year ended 31 December 2018
34 | 2018 Atlas Arteria Annual Report
Significant changes in state of affairsChange in management arrangementsFollowing the announcement of the Boards’ intention to internalise the management of ALX in November 2017, ALX reached an agreement with MFA on the terms of the internalisation of management. This agreement was approved by the shareholders at the 2018 Annual General Meeting.
The key terms of the agreement were as follows:• Macquarie Atlas Roads to change its name to Atlas Arteria and its ticker code from MQA to ALX.• No consideration to be payable to MFA for terminating the management agreements.• MFA to remain as the adviser/manager of ALX under the current management arrangements until 15 May 2019
(unless terminated earlier although fees will continue to be paid until that date).• MFA to provide specific transition services from the date of termination of the management arrangements to 31 December 2019
for a fee of $750,000 per month from 15 May 2019.• A final performance fee to be calculated for the year ending 30 June 2018 and, if earned, to be paid in full. The second instalment
of 2017 fees and third instalment of 2016 fee to be subject to their respective performance hurdles and tested on 30 June 2018. The third instalment of the 2017 fee to become payable without further testing.
• At the point of the termination of the ALX management agreements, Macquarie Group will start to receive fees for the ongoing management of ALX’s interest in APRR.
The Boards have since appointed Graeme Bevans as Chief Executive Officer (CEO) Elect and Nadine Lennie as Chief Financial Officer (CFO) Elect. Graeme and Nadine are working together to establish the necessary infrastructure, systems and processes in order for ALX to manage its own operations independently and separately from Macquarie.
Acquisition of remaining 30% interest in Warnow TunnelOn 15 August 2018, ALX announced that it had entered into an agreement to acquire the remaining 30% equity interest and shareholder loan in WQG for €3.7 million ($6.0 million) as gross consideration prior to adjusting for applicable transaction taxes. Financial close for the acquisition was reached on 20 September 2018. This acquisition was funded by existing cash.
Refinancing of loansOn 31 May 2018, ALX refinanced and increased the APRR asset finance facility from €150.0 million to €350.0 million with revised terms. The APRR asset finance facility was put in place in October 2017 to partially fund the acquisition of an additional stake in APRR.
On 4 June 2018, part of the additional proceeds from the refinanced APRR asset finance facility were used to fully repay the US$175.0 million Dulles Greenway asset finance facility along with accrued interest up to the date of repayment. Remaining proceeds from the new asset finance facility will be used for general corporate expenses.
In June 2018, ATLIX entered into €350.0 million of interest rate caps expiring June 2023 to hedge the EURIBOR floating rate interest expense on the new APRR asset finance facility.
In the opinion of the directors, there were no other significant changes in the state of affairs during the year.
Likely developments and expected results of operationsNo change is contemplated to the principal activities stated on page 32. Comments on the expected outlook for ALX are included in the annual report within the letters from the Chairpersons and Chief Executive Officer.
Events occurring after balance sheet dateSince the balance date, the directors of ATLIX and ATLAX are not aware of any other matter or circumstance not otherwise dealt with in the Directors’ Reports that has significantly affected or may significantly affect the operations of the Groups, the results of those operations or the state of affairs of the Groups in years subsequent to the year ended 31 December 2018.
Indemnification and insurance of officers and auditors During the year, ATLAX paid premiums of $230,446 and ATLIX paid premiums of $196,844 to insure the directors and officers of ATLAX and ATLIX. The liabilities insured are legal and defence costs that may be incurred in defending civil or criminal proceedings that may be brought against the directors and officers in their capacity as directors and officers of ATLAX and ATLIX, and any other payments arising from liabilities incurred by the directors and officers in connection with such proceedings. This does not include such liabilities that arise from conduct involving a wilful breach of duty by the directors and officers or the improper use by the directors and officers of their position or of information to gain advantage for themselves or someone else or to cause detriment to ATLAX or ATLIX. It is not possible to apportion the premium between amounts relating to the insurance against legal costs and those relating to other liabilities. So long as the directors and officers of ATLAX and ATLIX act in accordance with the constitutions and the
For
per
sona
l use
onl
y

35 2018 Atlas Arteria Annual Report |
law, the directors and officers remain indemnified out of the assets of the Groups against any losses incurred while acting on behalf of the Groups.
The auditors of the Groups are in no way indemnified out of the assets of the Groups.
Environmental regulationThe operations of the underlying assets in which the Groups invest are subject to environmental regulations particular to the countries in which they are located.
Each of our portfolio companies is responsible for adopting and maintaining its own environmental and social risk management framework that seeks to adequately ensure compliance with the relevant regulation and standards for environmental and social responsibility (ESR) matters in the country and industry in which the asset operates.
Our ability to control or influence the ongoing management of ESR issues will differ for each asset based on the extent of our control/governance rights at each asset through the level of ownership influence, board representation and regulatory environment.
Regular reporting from each portfolio company to ALX also assists in monitoring compliance with ESR requirements and in the identification of environmental, social and governance issues across ALX’s portfolio. The ESR performance of each portfolio company is reported to the ALX Boards regularly, with major environmental and social incidents and governance breaches reportable within 48 hours of occurrence.
Rounding of amounts in the Directors’ Reports and the Financial ReportsThe Groups are of a kind referred to in ASIC Corporations (Rounding in Financial/Directors’ Reports) Instrument 2016/191 issued by the Australian Securities and Investments Commission relating to the “rounding off” of amounts in the Directors’ Reports. Amounts in the Directors’ Reports have been rounded to the nearest thousand dollars in accordance with that Instrument, unless otherwise indicated.
Application of class orderThe Directors’ Reports and Financial Reports for ALX and the ATLAX Group have been presented in the one report, as permitted by ASIC Class Order 13/1050 and ASIC Corporations (Stapled Group Reports) Instrument 2015/838.
Information on ATLIX directors
Particulars of director’s interests
in ALX stapled securities as at
Name Experience and DirectorshipsSpecial Responsibilities
31 Dec 2018
31 Dec 2017
Jeffrey ConyersBA (Toronto)Non-Executive Independent Chairman
Experience: Jeffrey Conyers is a director of numerous companies in Bermuda and is the former Chief Executive Officer of First Bermuda Securities Limited, which provided advisory and execution services on worldwide offshore mutual funds to individuals and local companies based in Bermuda. He is a founding executive council member and deputy chairman of the Bermuda Stock Exchange. Jeffrey has previously served on the boards of MAp Airports International Limited and Intoll International Limited, parts of the previously Macquarie-managed and ASX-listed vehicles MAp Group and Intoll Group respectively.Other current listed company directorships: None.Former listed company directorships in last 3 years: None.
Chairman of Board and Nomination and Governance Committee
40,000 40,000
James KeyesMA (Oxon)Non-Executive Independent Director
Experience: James Keyes is a Bermudan solicitor and barrister with over 25 years’ experience. James was a partner in Appleby, one of the largest offshore law firms in Bermuda, and held a part-time position as Managing Director of Renaissance Capital, an investment bank, until December 2012. James was a director of the Bermudan entity within Transurban Group for six years, as well as a director of a company in the Moto group which operated road service stations in the UK, from which he gained experience in the toll road sector.Other current listed company directorships: Oakley Capital Investments Ltd (LSE: OCI), Catco Reinsurance Opportunities Fund Ltd (LSE: CAT).Former listed company directorships in last 3 years: None.
Chairman of Remuneration Committee
5,000 5,000For
per
sona
l use
onl
y

Directors’ Reports continuedfor the year ended 31 December 2018
36 | 2018 Atlas Arteria Annual Report
Particulars of director’s interests
in ALX stapled securities as at
Name Experience and DirectorshipsSpecial Responsibilities
31 Dec 2018
31 Dec 2017
Christopher LeslieBCom (Hons) (Melb), CA Non-Executive Director
Experience: Christopher Leslie is a senior managing director of Macquarie Infrastructure and Real Assets (“MIRA”) based in New York, with 25 years’ experience in the acquisition, development and management of infrastructure assets across Australia, Asia and North America. Christopher has extensive experience in the infrastructure sector, having been integral to the expansion of MIRA’s infrastructure business in the US since 1999. He has also served as Chief Executive Officer of MIRA’s North American series of unlisted infrastructure funds from 2006 to 2016, which collectively raised and invested more than US$8 billion into infrastructure assets.He is currently a board member of several companies including Puget Energy, Cleco Corporation and InSite Wireless. Christopher is also a member of Chartered Accountants Australia and New Zealand.Other current listed company directorships: None.Former listed company directorships in last 3 years: None.
– – –
Nora ScheinkestelLLB (Hons) (Melb), PhD, FAICD, Centenary MedalNon-Executive Independent Director
Experience: Nora Scheinkestel is an experienced company director having served as chairman and director on public and private sector boards in a wide range of industries and with a long track record in the infrastructure sector. Her background is as a senior banking executive in international and project financing, responsible for the development and financing of major mining and infrastructure projects in Australasia and South East Asia.Other current listed company directorships: Telstra Corporation Limited, AusNet Services Limited and OceanaGold Corporation. Former listed company directorships in last 3 years: Stockland Corporation Limited (retired March 2018) and Orica Limited (retired December 2015).
– 78,431 78,431
Derek StapleyBA (Glas Cal), CANon-Executive Independent Director
Experience: Derek Stapley, Chairman of the Audit and Risk Committee of ATLIX, is a Chartered Accountant with over 30 years’ experience and is a former partner with Ernst & Young. Derek has extensive experience as an independent director of several public and private investment funds, insurance companies and private client structures, and he works directly with a diverse range of global retail and institutional investors.Derek’s position on other boards, and in particular as Chair of several Audit and Risk Committees, provides ATLIX with a deep and current understanding of public company reporting and evolving trends in corporate governance and risk management.Other current listed company directorships: None.Former listed company directorships in last 3 years: None.
Chairman of Audit and Risk Committee
5,000 –
Information on ATLIX directors continued
For
per
sona
l use
onl
y

37 2018 Atlas Arteria Annual Report |
Particulars of director’s interests
in ALX stapled securities as at
Name Experience and DirectorshipsSpecial Responsibilities
31 Dec 2018
31 Dec 2017
Nora ScheinkestelLLB (Hons) (Melb), PhD, FAICD, Centenary MedalNon-Executive Independent Chairman
Experience: Nora Scheinkestel is an experienced company director having served as chairman and director on public and private sector boards in a wide range of industries and with a long track record in the infrastructure sector. Her background is as a senior banking executive in international and project financing, responsible for the development and financing of major mining and infrastructure projects in Australasia and South East Asia.Other current listed company directorships: Telstra Corporation Limited, AusNet Services Limited and OceanaGold Corporation. Former listed company directorships in last 3 years: Stockland Corporation Limited (retired March 2018) and Orica Limited (retired December 2015).
Chairman of Board and Nomination and Governance Committee
78,431 78,431
David BartholomewBEc (Hons), MBANon-Executive Independent DirectorAppointed on 1 October 2018
Experience: David Bartholomew is an experienced director in the infrastructure and utilities sector. In addition to being a non-executive director of ATLAX, he currently serves on the boards of Endeavour Energy (the New South Wales electricity distributor), Power & Water Corporation (the multi-utility owned by the Northern Territory Government) and the Saudi Arabia Industrial Investment Company, Dussur. He is also a director of The Helmsman Project, a not-for-profit organisation that provides coaching and development programmes for year 9 students, predominantly in western Sydney.Other current listed company directorships: None.Former listed company directorships in last 3 years: Vector Limited (retired November 2018).
Chairman of People and Remuneration Committee
– –
Jean-Georges MalcorEcole Centrale de Paris (Eng), Msc (Stanford)Non-Executive Independent DirectorAppointed on 1 November 2018
Experience: Jean-Georges Malcor completed eight years as Chief Executive Officer at CGG (EPA: CGG), a Euronext listed French geoscience company providing services primarily to customers in the global oil and gas industry. Prior to CGG, he spent 25 years at Thales Group (EPA:HO) in France and Australia. Jean-Georges currently serves as a non-executive director on the board and audit and risk committee of STMicroelectronics (NYSE: STM), and as a non-executive director on the boards of ORTEC, a construction and engineering company and Fives, a global industrial engineering group. Jean-Georges is also a Chevalier (Knight) of the French Légion d’honneur Order and National Order of Merit.Other current listed company directorships: STMicroelectronics.Former listed company directorships in last 3 years: CGG (retired April 2018).
– – –
Debra GoodinBEc (AU), FCANon-Executive Independent Director
Experience: Debra Goodin, who is also Chairman of the Audit and Risk Committee of ATLAX, is an experienced independent director currently serving on the boards of ASX-listed companies APA Group, Senex Energy Limited and Ooh!Media Limited. She is currently also the chairperson of the Audit and Risk Committees for these boards.Debra has more than 20 years’ senior management experience with professional services firms, government authorities and ASX listed companies across finance, operations, corporate strategy, mergers and acquisitions. She is a fellow of Chartered Accountants Australia and New Zealand. Other current listed company directorships: APA Group, Senex Energy Limited and oOh!media Limited. Former listed company directorships in last 3 years: Ten Network Holdings Limited (de-listed November 2017).
Chairman of Audit and Risk Committee
5,671 5,671
Information on ATLAX directors continued
For
per
sona
l use
onl
y
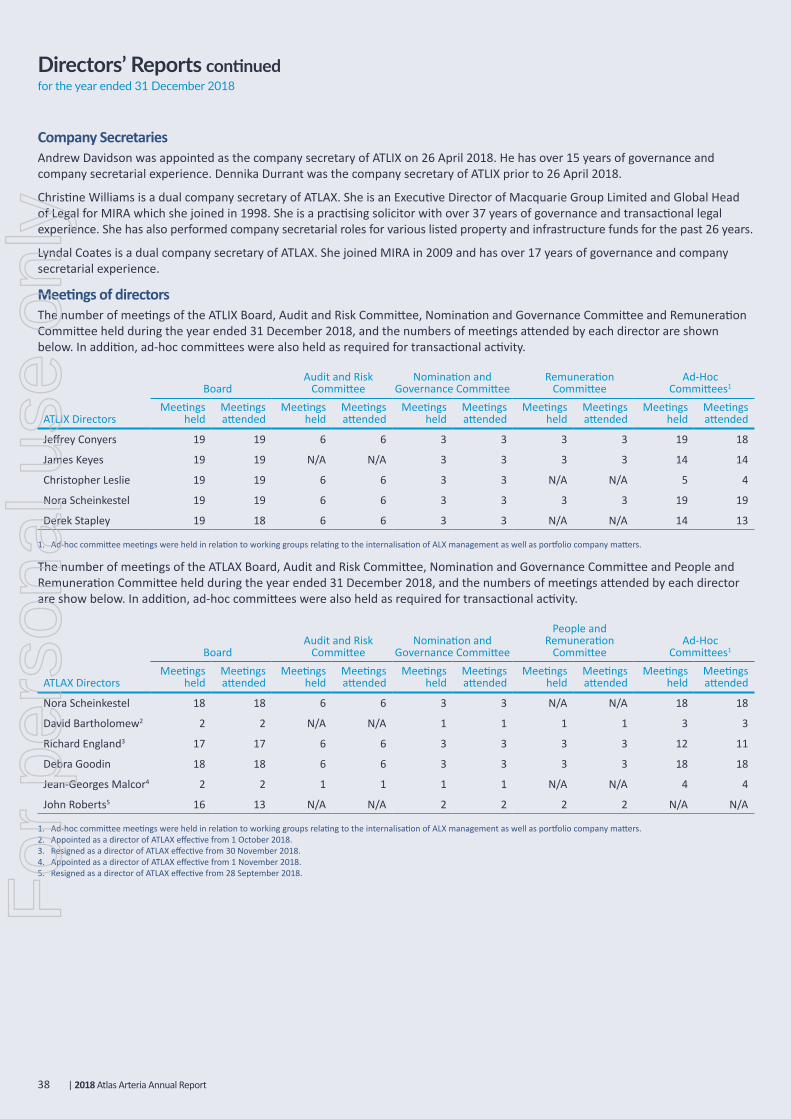
Directors’ Reports continuedfor the year ended 31 December 2018
38 | 2018 Atlas Arteria Annual Report
Company SecretariesAndrew Davidson was appointed as the company secretary of ATLIX on 26 April 2018. He has over 15 years of governance and company secretarial experience. Dennika Durrant was the company secretary of ATLIX prior to 26 April 2018.
Christine Williams is a dual company secretary of ATLAX. She is an Executive Director of Macquarie Group Limited and Global Head of Legal for MIRA which she joined in 1998. She is a practising solicitor with over 37 years of governance and transactional legal experience. She has also performed company secretarial roles for various listed property and infrastructure funds for the past 26 years.
Lyndal Coates is a dual company secretary of ATLAX. She joined MIRA in 2009 and has over 17 years of governance and company secretarial experience.
Meetings of directorsThe number of meetings of the ATLIX Board, Audit and Risk Committee, Nomination and Governance Committee and Remuneration Committee held during the year ended 31 December 2018, and the numbers of meetings attended by each director are shown below. In addition, ad-hoc committees were also held as required for transactional activity.
BoardAudit and Risk
CommitteeNomination and
Governance CommitteeRemuneration
CommitteeAd-Hoc
Committees1
ATLIX DirectorsMeetings
heldMeetings attended
Meetings held
Meetings attended
Meetings held
Meetings attended
Meetings held
Meetings attended
Meetings held
Meetings attended
Jeffrey Conyers 19 19 6 6 3 3 3 3 19 18
James Keyes 19 19 N/A N/A 3 3 3 3 14 14
Christopher Leslie 19 19 6 6 3 3 N/A N/A 5 4
Nora Scheinkestel 19 19 6 6 3 3 3 3 19 19
Derek Stapley 19 18 6 6 3 3 N/A N/A 14 13
1. Ad-hoc committee meetings were held in relation to working groups relating to the internalisation of ALX management as well as portfolio company matters.
The number of meetings of the ATLAX Board, Audit and Risk Committee, Nomination and Governance Committee and People and Remuneration Committee held during the year ended 31 December 2018, and the numbers of meetings attended by each director are show below. In addition, ad-hoc committees were also held as required for transactional activity.
BoardAudit and Risk
CommitteeNomination and
Governance Committee
People and Remuneration
CommitteeAd-Hoc
Committees1
ATLAX DirectorsMeetings
heldMeetings attended
Meetings held
Meetings attended
Meetings held
Meetings attended
Meetings held
Meetings attended
Meetings held
Meetings attended
Nora Scheinkestel 18 18 6 6 3 3 N/A N/A 18 18
David Bartholomew2 2 2 N/A N/A 1 1 1 1 3 3
Richard England3 17 17 6 6 3 3 3 3 12 11
Debra Goodin 18 18 6 6 3 3 3 3 18 18
Jean-Georges Malcor4 2 2 1 1 1 1 N/A N/A 4 4
John Roberts5 16 13 N/A N/A 2 2 2 2 N/A N/A
1. Ad-hoc committee meetings were held in relation to working groups relating to the internalisation of ALX management as well as portfolio company matters.2. Appointed as a director of ATLAX effective from 1 October 2018.3. Resigned as a director of ATLAX effective from 30 November 2018.4. Appointed as a director of ATLAX effective from 1 November 2018.5. Resigned as a director of ATLAX effective from 28 September 2018.
For
per
sona
l use
onl
y

39 2018 Atlas Arteria Annual Report |
Remuneration Report (audited)
IntroductionOn behalf of the ATLAX and ATLIX Remuneration Committees, we are pleased to present the Remuneration Report for the 2018 financial year.
Under the Corporations Act it is only Australian listed companies that are required to prepare a remuneration report. Whilst the obligation to provide a Remuneration Report only applies to ATLAX as an Australian listed company, given the stapled security holding structure, the Boards and Remuneration Committees of both ATLAX and ATLIX have worked together on the Remuneration Report with the disclosures extended to cover ATLIX key management personnel.
Only ATLAX securityholders participate in a non-binding vote on this report, however, detail on ATLIX and ALX as a whole have been included for good corporate governance, as well as details of the: • Management fee paid to Macquarie under the management agreements; • Remuneration arrangements of the Macquarie-appointed CEO; and• Remuneration arrangements for the CEO Elect and CFO Elect as though they were already Key Management Personnel.
Atlas Arteria experienced another year of positive performance in 2018, with our portfolio continuing to deliver growth in business value and distributions for securityholders.
The past year also saw significant corporate structural change. At the 2018 Annual General Meeting, you as our securityholders voted in favour of the agreement to internalise management. Since this time, the Boards have recruited an executive team that will take over from the management of Macquarie Fund Advisers Pty Limited (“Macquarie”).
In the months following the agreement to internalise management, the Remuneration Committees have worked to build an effective remuneration and governance structure to prepare the business for internalisation. We have:• Designed and implemented an executive remuneration framework for our incoming management team;• Finalised employment terms and contracts for our incoming management team; and• Undertaken a market review of Non-Executive Director fees.
We take investor feedback seriously and have engaged with investors over the past year in relation to developing the remuneration structure for the new internal management team and reviewing non-executive director fees.
In the current financial year, we look forward to updating you on our progress as we implement our internalisation plan and establish our internal management team and remuneration governance structure. We invite you all to review the full report and thank you for your interest.
David Bartholomew James KeyesAtlas Arteria Limited Committee Chair Atlas Arteria International Limited Committee Chair
This Remuneration Report contains the following sections: 1. Who is covered by this report 2. Key questions3. FY18 performance highlights4. Macquarie: Management fees and CEO remuneration 5. Remuneration framework for management post internalisation6. Non-Executive Director fees7. Remuneration Governance8. Statutory disclosures
For
per
sona
l use
onl
y

Directors’ Reports continuedfor the year ended 31 December 2018
40 | 2018 Atlas Arteria Annual Report
Remuneration Report (audited) continued
1 Who is covered by this reportThis Remuneration Report outlines the remuneration framework and outcomes for ATLAX and ATLIX Key Management Personnel (“KMP”) and the management arrangements in place with Macquarie for FY18.
For the purposes of this report, KMP are those persons having authority and responsibility for planning, directing and controlling the major activities of Atlas Arteria, directly or indirectly. For the FY18 year, KMP are limited to ATLAX and ATLIX Non-Executive Directors. In addition to the required disclosures, and for the purposes of good governance, this report also contains information on:• the management fee paid to Macquarie under the Management Agreements;• the Macquarie appointed CEO; and• the CEO Elect and the CFO Elect.
Details regarding the individuals covered by this report (outside the Management Agreements) are outlined below:
Name Role Date of appointment
Management
James Hooke1 Chief Executive Officer 1 February 2018
Graeme Bevans Chief Executive Officer Elect 1 May 2018
Nadine Lennie Chief Financial Officer Elect 16 July 2018
Non-Executive Directors
Nora Scheinkestel Independent Chairman (ATLAX) and Independent Non-Executive Director (ATLIX)
17 April 2015(Director of ATLAX from 28 August 2014)
David Bartholomew Independent Non-Executive Director (ATLAX) 1 October 2018
Richard England Independent Non-Executive Director (ATLAX) 1 June 2010 (retired on 30 November 2018)
Debbie Goodin Independent Non-Executive Director (ATLAX) 1 September 2017
Jean-Georges Malcor Independent Non-Executive Director (ATLAX) 1 November 2018
John Roberts Non-Executive Director (ATLAX) 2 February 2010 (retired on 28 September 2018)
Jeffrey Conyers Independent Chairman (ATLIX) 16 December 2009
James Keyes Independent Non-Executive Director (ATLIX) 21 February 2013
Christopher Leslie Non-Executive Director (ATLIX) 1 September 2017
Derek Stapley Independent Non-Executive Director (ATLIX) 1 June 2010
1. James Hooke will cease as CEO upon internalisation.
2 Key questionsIn May 2018, securityholders approved the proposal to internalise management and to terminate the management arrangements with Macquarie. Our securityholders have asked us about our management arrangements and the remuneration arrangements for FY18 and following internalisation in FY19.
We have set out below a number of questions that we have received from securityholders and have provided a brief response to each of them. Further detail regarding our remuneration arrangements is outlined in the remainder of this Remuneration Report.
For
per
sona
l use
onl
y

41 2018 Atlas Arteria Annual Report |
At the AGM, shareholders agreed to internalise management. What has this meant for the existing management arrangements?Following the announcement of the Boards’ intention to internalise the management of ALX in November 2017, ALX reached an agreement with Macquarie on the terms of the internalisation of management. This agreement was approved by the shareholders at the 2018 Annual General Meeting.
The key terms of the agreement were as follows:• Macquarie Atlas Roads to change its name to Atlas Arteria and its ticker code from MQA to ALX. • No consideration to be payable to Macquarie for terminating the management agreements.• Macquarie to remain as the adviser/manager of ALX under the current management arrangements until 15 May 2019
(unless terminated earlier although fees will continue to be paid until that date).• Macquarie to provide specific transition services from the date of termination of the management arrangements to
31 December 2019 for a fee of $750,000 per month from 15 May 2019.• A final performance fee to be calculated for the year ending 30 June 2018 and, if earned, to be paid in full. The second instalment
of 2017 fees and third instalment of 2016 fee to be subject to their respective performance hurdles and tested on 30 June 2018. The third instalment of the 2017 fee to become payable without further testing.
• At the point of the termination of the ALX management agreements, Macquarie Group will start to receive fees for the ongoing management of ALX’s interest in APRR.
On 2 July 2018, Macquarie and ALX’s independent directors agreed that total performance fees for the 2016, 2017 and 2018 years, due as at 30 June 2018, of $115.3 million (excluding GST) be settled by a combination of equity and cash. Accordingly, 13,476,174 ALX securities were issued to Macquarie’s assignee at a price of $6.700906 per security on 2 July 2018. The remaining performance fee payable of $25.0 million was settled in cash on 3 July 2018. For further information, see section 4.1
What was the management and performance fee for FY18?Based on the terms of the ALX management agreement, Macquarie received fees of $152.1 million (excluding GST), comprising a contractual base fee and performance-based fee as follows:• Base Management fee: $36.8 million• Performance fees (recognised at 30 June 2018): $115.3 million
– FY18: $54.7 million – FY17 (instalments 2 and 3): $16 million, being $8.0 million each – FY16 (instalment 3): $44.7 million
The base fee is paid in cash and equates to 0.85% of ALX’s market value over the last 10 ASX trading days in the relevant calendar quarter. The performance fee is reflective of the total shareholder returns received by ALX investors compared with a target benchmark return. For further information regarding the performance fee, see section 3.2.
Has the internalisation management team commenced? If so, on what basis?To allow for effective transition to internalised management by May 2019, we commenced recruitment for key roles following shareholder approval to internalise management at the 2018 AGM, with all senior executives having commenced in their roles by the end of 2018. The senior executive team following internalisation comprises:• Chief Executive Officer – Graeme Bevans• Chief Financial Officer – Nadine Lennie• Chief Operating Officer – Vincent Portal• General Counsel & Company Secretary – Clayton McCormack
The remuneration arrangements of our executive team have been structured to attract high calibre executives and to align management incentives with the successful transition to internalised management and with the short term and long term interests of security holders. For further details of these arrangements for the CEO Elect and CFO Elect, see section 5.F
or p
erso
nal u
se o
nly

Directors’ Reports continuedfor the year ended 31 December 2018
42 | 2018 Atlas Arteria Annual Report
Remuneration Report (audited) continued
What remuneration principles guided the design of the remuneration framework post internalisation?We developed the following six principles to underpin the management remuneration framework post internalisation. The remuneration principles will help guide how remuneration decisions will be made and remuneration outcomes will be determined.
The executive remuneration framework should be: Description
1. Simple Be simple to understand, implement and communicate
2. Balance short and long-term needs Be able to adapt to meet short-term imperatives during the current period of significant change, but also reflect the long-term needs of the business
3. Reflect role complexity Reflect the experience of the executive, complexity/nature of the role and the business compared to the market
4. Reflect our values and behaviours Encourage appropriate behaviours and actions which are aligned to ALX’s business strategy, performance and securityholders
5. Specific and differentiated performance outcomes
Reflect specific performance measures which executives have the ability to influence, and allow for differentiation of executive incentive outcomes
6. Securityholder alignment Encourage executive equity ownership so that executives have “skin in the game”, aligning executives to securityholder returns
How will executives be remunerated following internalisation and how is this aligned with ALX performance?The Boards recognise that to build sustainable long-term growth in securityholder wealth, ALX must attract and retain talented people, and align their interests and behaviours with securityholders’ interests.
To do so, we have developed a remuneration framework that aligns executive remuneration and ALX performance. The framework aims to achieve a balance between fixed and performance-based remuneration and between short- and long-term performance incentives. To ensure our remuneration quantum and structure is market competitive, consideration has been given to the market median remuneration of companies of a similar size and complexity to ALX.
CEO Elect Other senior executives elect
Fixedremuneration
33%Variableremuneration67%
Fixedremuneration
43%Variable remuneration57%
Performance based remuneration comprises both short and long-term performance components: • For the FY18 short term incentive component, the CEO Elect and CFO Elect will be paid based on the success of achieving key
milestones for a successful internalisation on or ahead of plan. Following internalisation, their STI will be paid based on an assessment against a balanced scorecard of financial measures (weighted 70%) and non-financial measures (weighted 30%) linked to business imperatives. For further information regarding the performance measures and STI structure for the CEO Elect and CFO Elect, see section 5.2.
• For the long-term incentive component, ALX’s Total Securityholder Return (“TSR”) performance is assessed relative to a group of local and international companies with similar characteristics to ensure there is alignment between the financial interests of executives and securityholders. The Boards will continue to consider whether the introduction of a second LTI performance measure is appropriate for the future. For further information regarding the LTI structure, performance measure, relative TSR comparator group constituents and vesting schedule, see section 5.3.
Information on governance provisions such as malus, treatment of awards on cessation of employment and change of control are provided in section 7.3.
For
per
sona
l use
onl
y

43 2018 Atlas Arteria Annual Report |
What happens to variable remuneration awards in the event there is a change of control?In the event of a change of control, the Boards have absolute discretion to determine the treatment of STI and LTI awards. However, if the Boards do not exercise their discretion, the following default treatments will apply:• STI: Cash based STI will be assessed on a pro-rata basis and paid at that time based on performance; deferred STI will vest in full
on the basis that it relates to performance targets which have already been achieved.• LTI: Vesting based on performance to the end of the most recent period and pro-rated for time.
What did the CEO Elect and CFO Elect receive during FY18?The CEO Elect and CFO Elect received fixed remuneration only during FY18.
The CEO Elect and CFO Elect are eligible to participate in the STI which, for FY18, is linked to successful internalisation. The outcome of the FY18 STI award will be determined in FY19, once the internalisation is complete and its success can be determined.
An LTI will apply with respect to FY18. This LTI grant will be tested against the LTI performance targets and, if the targets are met, will vest following the conclusion of the performance period ending 31 December 2020. For further information regarding the LTI performance targets, see section 5.3.
Why have NED fees increased for FY19?During the 2018 financial year, we undertook a comprehensive market review to determine the level of our fees relative to companies of a similar size and those which operate in similar industries. The review indicated that both our Board and Committee fee levels were low relative to market. As a result, we have made adjustments to our fees for 2019 to make them market competitive. Although the increase in fees is proposed to be effective 1 January 2019, NEDs will not have their fees adjusted until securityholder approval is received for the NED fee pool increases. For further information, see section 6.3.
Why does Atlas Arteria have two Boards?Although ALX is listed using a stapled structure on the Australian Securities Exchange (“ASX”), meaning that the securities of ATLAX and ATLIX are stapled and must trade and otherwise be dealt with together from a securityholder perspective, the stapling does not detract from the fact that ATLAX and ATLIX remain separate and distinct legal entities. ATLAX and ATLIX accordingly each have their own board of directors, with the ATLAX board being governed by the ATLAX constitution and the ATLIX board being governed by the ATLIX bye-laws. Each company has also adopted its own formal board charter, which sets out the roles and responsibilities of their respective boards as well as each board’s composition and membership criteria.
Whilst there are arrangements in place for sharing of information, the adoption of consistent accounting policies and the coordination of reporting to securityholders (details are provided on the ALX website), key decision making is still reserved to the ATLAX board and the ATLIX board respectively, with each board being independently bound by their respective fiduciary duties and each independently retaining ultimate accountability and responsibility to their respective securityholders. Each board is also independently responsible for the overall corporate governance of ATLAX and ATLIX respectively. As a result of ALX’s stapled structure, the corporate governance and regulatory requirements of both Australia and Bermuda must be considered, with the boards having to collectively meet the ‘highest common standard’. This is in addition to ALX’s corporate governance arrangements conforming to the Corporate Governance Principles and Recommendations (3rd edition) issued by the ASX Corporate Governance Council (“ASX Principles”).
As part of discharging their respective duties, ATLAX and ATLIX each hold full board meetings at least every two months, with other ad-hoc meetings being called as required. The ATLAX and ATLIX boards have also each constituted a number of separate board committees, including remuneration committees. The ATLAX People and Remuneration Committee and ATLIX Remuneration Committee (together the “Remuneration Committees”) each operate under a similar formal charter and each comply with the requirements of the ASX Principles. The Remuneration Committees have overall responsibility for reviewing and recommending the compensation for ALX’s key management personnel as well as reviewing and recommending the Remuneration Report.
For
per
sona
l use
onl
y

Directors’ Reports continuedfor the year ended 31 December 2018
44 | 2018 Atlas Arteria Annual Report
Remuneration Report (audited) continued
3 FY18 performance highlightsDuring 2018, ALX continued to deliver solid operational performance resulting in growth of distributions for security holders and strong growth in the share price.
3.1 Atlas Arteria’s performanceThe following table outlines the distributions for ALX over the past five financial years up to and including FY18. Market capitalisation at 31 December 2018 was over A$4.2 billion, an increase of over 700% since listing.
Financial performance FY14 FY15 FY16 FY17 FY18
Distributions (cps) 13.20 16.00 18.00 20.00 24.00
ALX security price1
$0.00
$2.00
$4.00
$6.00
$8.00
FY18FY17FY16FY15FY14FY13FY12FY11FY10
1. Source: ASX
3.2 Atlas Arteria’s financial performance as it relates to the Macquarie Management feeMacquarie Management feeFor 2018, the fees paid or payable are as follows:• Base fee: $36.8m, being 0.85% of ALX’s market value (excluding any securities issued post 30 June 2018) over the 10 ASX trading
days in the relevant calendar quarter• Performance fees: $115.3m comprising instalments due for the 2016, 2017 and 2018 years
The performance fees reflect our performance against the S&P/ASX300 Industrials Accumulation Index (the “Index”). For the one year period 1 July 2017 to 30 June 2018, ALX outperformed the Index with a TSR of 18.3% compared to 7.5% for the Index. For the three year period 1 July 2015 to 30 June 2018, ALX continued to outperform the Index with a TSR of 133% compared to 23%.
Growth in Atlas Arteria’s TSR relative to the S&P/ASX300 Industrials Accumulation Index: July 2015 – June 2018
-20%
0%
20%
40%
60%
80%
100%
120%
140%
160%
Jul 18Jan 18Jul 17Jan 17Jul 16Jan 16Jul 15
ALX S&P ASX300 Industrials Accumulation Index
For
per
sona
l use
onl
y
45 2018 Atlas Arteria Annual Report |
3.3 Atlas Arteria’s financial performance as it relates to remuneration for the KMP ElectShort term incentiveDuring FY18, no STI was awarded to the KMP Elect. The performance of each KMP Elect will be assessed following the transition to internalised management in 2019. For further details regarding the STI plan, refer to section 5.2.
Long term incentiveALX’s long-term performance is measured against a single measure of TSR relative to a group of local and international companies with similar characteristics. For the FY18 LTI award, performance is measured from 1 May 2018 to 31 December 2020. There was no LTI award vesting during the 2018 financial year. For further details regarding the LTI plan, see section 5.3.
4 Macquarie: Management fees and CEO remunerationDuring 2018, agreement was reached to internalise ALX’s management with effect no later than 15 May 2019. In reaching agreement, transitional arrangements were approved for the management fee structure with Macquarie, as outlined below. For the purposes of good governance, the remuneration arrangements of the ALX CEO are also outlined below. As the CEO is employed by Macquarie Group, not Atlas Arteria, his remuneration is disclosed in this Report on a voluntary basis. The remuneration of the CEO is under the Macquarie Group remuneration structure. Macquarie Group’s approach to executive remuneration is detailed in the Macquarie Group Annual Report.
4.1 Macquarie Management fees
Element Description
Management fee structure
ATLAX and ATLIX entered into advisory and management agreements (collectively, the “ALX Management Agreements”) with Macquarie, a wholly owned subsidiary of Macquarie Group Limited (“MGL” or “Macquarie Group”). Under the ALX Management Agreements, ALX is required to pay a management fee comprising a base and performance-based fee, calculated in accordance with defined formulae (outlined below). The management fee structure is linked to ALX’s market performance and, in the case of performance fees, ongoing ALX outperformance against a market benchmark. In exchange for the management fee, Macquarie makes employees available (including senior executives) to discharge its obligations to the relevant ALX entity. These staff are employed by Macquarie Group entities and made available through formalised resourcing arrangements. The fee arrangements with Macquarie were adjusted as part of the negotiations with Macquarie to amend the advisory and management agreements in the lead up to internalisation. Details of these changes were outlined in the Explanatory Memorandum to the 2018 Notice of Meeting.
Base fees A base fee is paid to Macquarie at a rate of 0.85% per annum of ALX’s market value.Market value means the market capitalisation of ALX calculated on the basis of the average number of ALX securities on issue during the last 10 ASX trading days in the relevant calendar quarter (excluding any ALX securities issued post 30 June 2018) multiplied by the volume weighted average price (“VWAP”) of all ALX securities traded on the ASX during those 10 trading days. The quantum of the base management fee can increase or decrease as a result of any movement in both the number of ALX securities on issue (excluding any ALX securities issued post 30 June 2018) and the security price. Whilst the base management fee remains in place, no additional management fees are levied by Macquarie at the asset level for any of ALX’s investments. The base fee will be payable until 15 May 2019. From 16 May 2019 to 31 December 2019, a fee of $750,000 per month will be payable for specific transition services.
For
per
sona
l use
onl
y

Directors’ Reports continuedfor the year ended 31 December 2018
46 | 2018 Atlas Arteria Annual Report
Remuneration Report (audited) continued
Element Description
Performance fees A performance fee was payable to Macquarie if the ALX accumulation index outperformed its benchmark, the S&P/ALX300 Industrials Accumulation Index, in the year having made up for any previous underperformance. Historically, performance fees were payable in three equal annual instalments. The first instalment was payable immediately, with subsequent instalments subject to further performance conditions. The second and third instalments were payable on the first and second anniversaries of the calculation date respectively, only if ALX’s performance equalled or exceeded that of the benchmark over the period to that date. At 30 June 2018, the following performance fees became payable in accordance with, and due to the renegotiation of, the management agreements. Fees are apportioned between ATLAX and ATLIX based on each entity’s share of the value of ALX’s net assets.• 2018 performance fee: $54.7 million (excluding GST). In accordance with, and due to the renegotiation of, the
management agreements, the 2018 performance fee was payable in full.• 2017 performance fee: the second instalment of $8.0 million (excluding GST) was tested at 30 June 2018 and became
payable at this time due to outperformance against the benchmark. In accordance with, and due to the renegotiation of, the management agreements, the third instalment of $8.0 million (excluding GST), was payable in full.
• 2016 performance fee: $44.7million (excluding GST) for the third instalment fee was tested at 30 June 2018 and became payable at this time due to outperformance against the benchmark.
On 2 July 2018, Macquarie and ALX’s independent directors agreed that the total performance fees of $115.3 million (excluding GST) be settled by a combination of equity and cash. Accordingly, 13,476,174 ALX securities were issued to Macquarie’s assignee at a price of $6.700906 per security on 2 July 2018. The remaining performance fee payable of $25.0 million was settled in cash on 3 July 2018.Following the above settlement, Macquarie is no longer eligible to earn performance fees under its management agreement with ALX.
Reinvestmentof fees
Per ALX’s constituent documents and ALX Management Agreements, Macquarie can request the application of base or performance fees payable be used to subscribe for new ALX securities. This subscription is subject to the approval of ALX’s independent directors.Where this occurs, the issue price for the new ALX stapled securities is the VWAP of all ALX stapled securities traded on the ASX during the last 10 trading days of the relevant instalment period.
Expense reimbursement
Macquarie is reimbursed, out of the assets of ALX, for any out of pocket expenses incurred in relation to the proper performance of its duties as set out in the ALX Management Agreements. Macquarie is not reimbursed for staff costs, or costs associated with their employment and premises.Fees paid or payable to ALX group entities for services provided by other Macquarie entities are disclosed in the ALX financial statements and are subject to strict protocols.
4.2 ALX CEO remunerationMr James Hooke was appointed CEO of ALX effective 1 February 2018 and is employed by the Macquarie Group. Mr Hooke’s remuneration is determined and paid by the Macquarie Group and not recharged to ALX. As such, his remuneration is not required to be disclosed, however, Macquarie has agreed to provide details of Mr Hooke’s remuneration in his capacity as ALX CEO.
Macquarie’s remuneration approach is detailed in the MGL Annual Report available at www.macquarie.com. An overview of this approach, as applicable to Mr Hooke, is provided below.
Macquarie Group’s remuneration framework works as an integrated whole and comprises fixed remuneration and profit share with an emphasis on performance-based remuneration.
Fixed remuneration is reviewed annually and reflects technical and functional expertise, role scope, market practice and regulatory requirements.
Profit share allocations for individuals are primarily based on business profits and individual contribution to profits. Profit share allocations may be adjusted downwards based on an assessment of risk or conduct issues that have arisen during the year. For Mr Hooke, his profit share allocation is determined with reference to his individual contribution to the performance of ALX, and includes consideration of:• ALX’s overall performance as a listed entity;• Management and leadership of ALX including the management of ALX’s investments;• Effective risk management and capital management; and• Maintenance of ALX’s reputation.
For
per
sona
l use
onl
y

47 2018 Atlas Arteria Annual Report |
Macquarie Group retains a percentage of certain individual’s annual profit share allocation (retained profit share) which is invested in a combination of MGL equity under the Macquarie Group Employee Retained Equity Plan (“MEREP”) and via notional investment in Macquarie Group managed funds. One third of Mr Hooke’s retained profit share vests and is released in each of years 3 to 5 from the date of award.
Mr Hooke’s fixed remuneration and profit share allocation are determined with reference to MGL’s financial year ended 31 March, which is a different cycle to ALX’s financial year ended 31 December. Consequently, Mr Hooke’s profit share, for the period ending 31 March 2019, attributable to his contribution to ALX has not yet been determined.
Inclusive of superannuation, Mr Hooke’s fixed remuneration for the period 1 February 2018 to 31 December 2018 was $426,251.
5 Remuneration framework for management post internalisationThe remuneration framework for the executive team post internalisation, including executive KMP, aims to achieve balance – between fixed and performance based remuneration, between short- and long-term performance incentives, and between financial, non-financial and strategic outcomes – as well as providing a balance of remuneration received in cash and in securities.
Our objectives for the executive remuneration framework for internalised management are to ensure that it:• Is simple to understand, implement and communicate• Meets short-term imperatives during the current period of significant change, whilst also reflecting the long-term needs of
the business• Reflects the experience of the executive and complexity of the role and business compared to the market• Encourages behaviours that are aligned to our business strategy, performance and securityholders• Reflects performance measures which our executives have the ability to influence, and• Encourages executive equity ownership.
5.1 Positioning and mix of executive remunerationTo ensure our remuneration quantum and structure is market competitive, we reference the median of a group of comparator companies of similar size and complexity to ALX. For FY18, the primary reference point was a group of 72 companies with a 12-month average market capitalisation between 50% to 200% of ALX. The remuneration arrangements of selected industry comparators were also considered for each role.
The target and maximum remuneration framework for the CEO Elect and CFO Elect comprises fixed remuneration, STI and LTI as in the graphs below.
Remuneration mix based on achieving ‘target’ performance
CEO Elect CFO Elect
Fixedremuneration
33%
Target STI –cash17%
Maximum LTI33%
Target STI – deferred17%
Fixedremuneration
44%
Target STI –cash13%
Maximum LTI30%
Target STI – deferred13%
For
per
sona
l use
onl
y

Directors’ Reports continuedfor the year ended 31 December 2018
48 | 2018 Atlas Arteria Annual Report
Remuneration Report (audited) continued
Remuneration mix based on achieving ‘maximum’ performance
CEO Elect CFO Elect
Fixedremuneration
29%
Target STI –cash21%
Maximum LTI29%
Target STI – deferred21%
Fixedremuneration
39%
Target STI –cash17%
Maximum LTI27%
Target STI – deferred17%
Outlined below is further detail regarding the STI and LTI plans for the 2018 financial year. Any changes to the remuneration framework that will apply following the transition to internalised management have also been highlighted.
5.2 Short-term incentive Executives, middle management and additional participants as determined by the Boards are eligible to participate in the annual STI plan. Details regarding the STI arrangements of the CEO Elect and CFO Elect are set out below. The size of each STI award is capped at an agreed percentage of fixed remuneration for each executive. The value of the STI payment made at the end of the performance period is a function of performance against a balance of financial and non-financial performance measures aligned with ALX’s short term interests.
Element Description
Opportunity The STI is subject to achievement of defined performance targets, which is delivered 50% in cash and 50% in restricted securities.The target STI represents an opportunity to earn 100% of fixed remuneration for the CEO Elect and 60% of fixed remuneration for the CFO Elect. The CEO Elect and CFO Elect have the opportunity to earn up to a maximum of 150% of these target STIs. For FY18, the STI opportunity is pro-rated for the portion of the performance period for which the KMP was employed.
Performance measures pre-internalisation
Performance is assessed against the following measures:CEO Elect CFO Elect
Performance area Weighting Performance area Weighting
Strategic 30% Transition budget 25%
Transition activities 30% Stakeholder engagement 20%
Transition budget 25% Financial transition activities 20%
Stakeholder engagement 15% Transition activities 15%
Risk related transition activities 15%
Strategic 5%
Performance period Performance is measured over a one-year performance period, from 1 January to 31 December. However, as a result of KMP Elect commencing employment during FY18, the performance period is the date each KMP commenced employment (being 1 May 2018 for the CEO Elect and 16 July 2018 for the CFO Elect) to the date of internalisation.F
or p
erso
nal u
se o
nly

49 2018 Atlas Arteria Annual Report |
Element Description
STI deferral To assist in creating alignment with securityholders and in achieving the minimum shareholding requirement, 50% of the STI outcome is deferred into restricted securities for a one-year period following the conclusion of the performance period, subject to ongoing service and the discretion of the Boards.
Performance measures post internalisation
Following transition to internalised management, executives, middle management and additional participants as determined by the Boards will be eligible to participate in the STI, with performance assessed from the date of internalisation to 31 December 2019 against financial measures and individual measures. Performance measures for the CEO Elect and CFO Elect in FY19 are as follows:
CEO Elect CFO Elect
Performance area Weighting Performance area Weighting
Comprises of a combination of the following:• Proportional adjusted EBITDA
(reflecting proportional performance of each business adjusted for items determined by the Boards)
• Distributions per security• Cashflow available for distribution• Corporate operational
expenditure
70% Comprises of a combination of the following:• Proportional adjusted EBITDA
(reflecting proportional performance of each business adjusted for items determined by the Boards)
• Distributions per security• Cashflow available for distribution• Corporate operational
expenditure
70%
KPIs relating to culture, behaviours and specific strategic outcomes
30% KPIs relating to culture, behaviours and specific strategic outcomes
30%
For FY19, STI awards will be pro-rated to reflect the period from the date of internalisation to 31 December 2019.
5.3 Long-term incentiveTo align with the interests of shareholders, executives and other participants as determined by the Boards are eligible to participate in an LTI plan. Details of the LTI arrangements of the CEO Elect and CFO Elect are set out below. The size of each year’s grant is capped at an agreed percentage of fixed remuneration for each executive. The value of the LTI payment made at the end of the vesting period is a function of:• ALX TSR performance relative to a group of Australian and international peer companies (which determines the number of
securities granted that vest)• The change in the price per ALX stapled security (which determines the value of each stapled security that vests), and• The value of distributions that would have been made during the vesting period in relation to the number of securities that vest
(Distribution Equivalents).
As a result, management incentives are aligned with the long-term interests of securityholders to achieve strong performance relative to peers and to generate an appropriate balance of security price performance and distributions.
Element Description
Opportunity The maximum grant value of LTI opportunities represents 100% of fixed remuneration for the CEO Elect and 70% of fixed remuneration for the CFO Elect. For FY18 only, the number of instruments granted will be determined based on the 10 day VWAP immediately following the 2018 Annual General Meeting (which was held on 15 May 2018). For FY19, the number of instruments granted will be determined based on the 10 day VWAP immediately following the announcement by ALX its FY18 results.For the CEO Elect, the 2018 grant will be made in 2019 following approval from securityholders at the 2019 AGM. If securityholder approval is not obtained, the CEO Elect will be eligible to receive a cash award of equivalent value subject to the same performance measures and performance period.
Vehicle Awards are delivered in the form of performance rights. A performance right is a right to acquire one fully paid Atlas Arteria security, subject to meeting predetermined performance measures, for nominal consideration.
For
per
sona
l use
onl
y

Directors’ Reports continuedfor the year ended 31 December 2018
50 | 2018 Atlas Arteria Annual Report
Remuneration Report (audited) continued
Element Description
Performance measure For the FY18 grant, LTI performance is assessed against relative TSR. Relative TSR was selected as the sole performance measure as it measures securityholding value creation objectively, can be used for comparing performance across different jurisdictions and is widely understood and accepted by stakeholders. Atlas Arteria’s TSR performance is assessed against a local and global industry comparator group, comprising Abacus Property Group, APA Group, Aurizon Holdings Limited, AusNet Services, Charter Hall Group, Growthpoint Properties Australia, Qube Holdings Limited, Spark Infrastructure Group, Sydney Airport, Transurban Group, 3i Infrastructure, Cogent Communications Holdings Limited, Eiffage SA, Genesee & Wyoming Inc., Getlink, Macquarie Infrastructure Corporation and Zayo Group Holdings, Inc. These companies were selected as they operate in comparable industries, with asset size, market capitalisation, jurisdiction of assets and operational control, in relevant ranges.The comparator group may, at the discretion of the Boards, be adjusted to take into account events during the Performance Period including, but not limited to takeovers, mergers, demergers or delistings.
Vesting schedule Relative TSR performance is assessed on a sliding scale, with vesting determined as follows:
Atlas Arteria’s TSR performance % vesting
Below the 51st percentile 0%
At the 51st percentile 50%
Between the 51st percentile and 75th percentile Pro-rata between 50% and 100%
At the 75th percentile 100%
The Boards retain discretion to adjust the relative TSR measure in exceptional circumstances to ensure that participants are neither advantaged nor disadvantaged by matters outside management’s control.
Performance period Performance is measured over a three-year performance period, from 1 January to 31 December. However, as Atlas Arteria is working towards internalisation of management, the performance for FY18 will be measured from 1 May 2018 to 31 December 2020 to align with the period commencing when the internalisation was approved.
Vesting and allocation of securities
If and when the Boards determine that the relative TSR performance measure has been achieved, the performance rights will automatically be exercised and the relevant number of securities will be allocated.
Distribution equivalents Distribution equivalents will be payable (via a grant of securities or a cash payment, at the Boards’ discretion) on performance rights that have vested, to the value of any distributions paid during the performance period in respect of an equivalent number of ALX securities.
For
per
sona
l use
onl
y

51 2018 Atlas Arteria Annual Report |
6 Non-Executive Director fees6.1 Determination of Non-Executive Director feesIn order to attract and retain high calibre non-executive directors, fees are reviewed periodically by the Remuneration Committees and set with reference to the market. The Board fee structure (inclusive of superannuation) for FY18 is as follows.
ATLAX ATLIX
FeesChair
(AUD)Member
(AUD)Chair (USD)
Member(USD)
Member (AUD)2
Board $200,0001 $120,000 $110,0001 $70,000 $70,000
Audit and Risk Committee $25,000 $12,500 $15,000 $7,500 $7,500
Remuneration Committee $10,000 $5,000 $7,500 $3,750 $3,750
Nominations and Governance Committee Nil $5,000 Nil $2,500 $2,500
1. Committee fees are not payable to the Chair of the ATLAX or ATLIX Board.2. For Australia-based director.
In addition to base fees and additional fees for service on a committee of the Board as outlined above, non-executive directors are also entitled to the following:
ATLAX ATLIX
Additional feesChair
(AUD)Member
(AUD)Chair(USD)
Member(USD)
Member (AUD)1
Travel fee (per annum) $10,000 $10,000 $5,000 N/A
Additional ad hoc committee fee (per day) $2,500 $1,750 $1,750
Internalisation committee (per annum) $5,000 $2,500 $2,500
Additional working group fee US$5,000 and A$20,0002
1. For Australian based director.2. An additional working group was set up for the internalisation. Fees vary depending on level of involvement.
ATLAX and ATLIX directors are not entitled to ALX options or securities or to retirement benefits as part of their remuneration package.
6.2 Aggregate fee poolAs approved by securityholders, the aggregate ATLAX Non-Executive Director fee pool is capped at A$1,000,000 and the ATLIX Non-Executive Director fee pool is capped at US$500,000.
6.3 FY19 aggregate fee pool and non-executive director fees A review of market non-executive director fees was undertaken in FY18, which included a review of market benchmarking information for companies of a similar size and complexity to ALX (being companies with a 12-month average market capitalisation between 50% to 200% of ALX). The review highlighted that remuneration for ATLAX’s and ATLIX’s non-executive directors is materially below the median level for companies of similar size and complexity.
We propose to increase the level of remuneration for ATLAX’s and ATLIX’s non-executive directors to a level that is at or close to the median for the benchmark group of companies as follows:
ATLAX ATLIX
FeesChair
(AUD)Member
(AUD)Chair(USD)
Member(USD)
Member (AUD)2
Board $280,0001 $140,000 $160,0001 $80,000 $80,000
Audit and Risk Committee $30,000 $15,000 $18,000 $9,000 $9,000
Remuneration Committee $30,000 $15,000 $18,000 $9,000 $9,000
Nominations and Governance Committee Nil Nil Nil Nil Nil
1. Committee fees are not payable to the Chair of the ATLAX Board or ATLIX Board.2. For Australia-based director.
For
per
sona
l use
onl
y

Directors’ Reports continuedfor the year ended 31 December 2018
52 | 2018 Atlas Arteria Annual Report
Remuneration Report (audited) continued
Non-Executive Directors will also be entitled to receive a travel fee of A$10,000 where for each occasion where they are required to travel over 8 hours to attend a Board meeting or strategy session.
To allow for these proposed increases in Non-Executive Director remuneration, an increase in the ATLAX and ATLIX Non-Executive Director fee pools to A$1,100,000 (from A$1,000,000) and US$700,000 (from US$500,000) respectively will be proposed for approval at the Annual General Meeting in April 2019.
The combined ATLAX and ATLIX NED fee pool (converted to Australian dollars) is positioned at the 75th percentile of the market. This higher positioning is consistent with the need to have separate boards in place for each of the two legal entities which comprise ALX’s stapled structure.
7 Remuneration Governance7.1 Roles and responsibilities The table below outlines the roles and responsibilities of the Boards, Remuneration Committees, Management and external advisers in relation to the remuneration arrangements of Directors, CEO Elect and other KMP Elect.
The Boards Remuneration Committees Management External advisers
Approves remuneration strategy and approves recommendations from the Remuneration Committees
Makes recommendations to the Boards regarding the remuneration framework, policies and practices for ALX as well as remuneration for KMP
Makes recommendations to the Remuneration Committees on the ALX’s remuneration framework, policies and practices
Provides independent advice to the Remuneration Committees and/or Management on remuneration market data, market practice and other remuneration related matters
The requirement for external remuneration advisor services is assessed in the context of matters the Remuneration Committees need to address. External advice is used as a guide but does not serve as a substitute for directors’ consideration of the relevant matters. Therefore, no remuneration recommendations, as defined by the Corporations Act 2001 (Cth), were made by external remuneration advisers.
7.2 Executive Contracts The remuneration and other terms of employment for the CEO Elect and CFO Elect are formalised in executive contracts. Key contractual terms in place for FY18 are outlined below.
Contract typeTermination notice by either party Termination notice with cause
Termination notice by KMP Elect for fundamental change in role
CEO Elect Ongoing 12 months Immediate without notice period 30 days within 21 days of fundamental change
CFO Elect Ongoing 6 months Immediate without notice period 30 days within 21 days of fundamental change
For
per
sona
l use
onl
y

53 2018 Atlas Arteria Annual Report |
7.3 Additional provisions as related to STI and LTI arrangements – KMP ElectThe table below summarises additional arrangements as they relate to the CEO Elect and CFO Elect.
Provision STI LTI
Malus In the event of:• Material non-compliance with any financial reporting requirement or other company policies and
operating procedures• Fraudulent or dishonest behaviour, or
• Misconduct.
The Boards have discretion to determine that some or all deferred STI and unvested LTI awards are forfeited.
Cessation of employment If a participant resigns or is terminated for cause (including gross misconduct), any deferred securities are forfeited and the participant is not entitled to any further payment of cash STI. If a participant leaves for any other reason, subject to Board discretion, the participant will be entitled to a pro-rata payment of cash STI subject to performance and deferred securities will stay “on foot” until the end of the deferred period.
If a participant resigns or is terminated for cause (including gross misconduct), unvested performance rights will automatically lapse. If a participant leaves for any other reason, subject to Board discretion, a pro-rata number of unvested performance rights (reflecting the portion of performance period served) will stay “on-foot” to be tested against the performance condition at the end of the original performance period.
Change of control Upon a change of control:• The Boards will determine in their absolute
discretion the treatment for STI opportunity• Subject to the Boards determining otherwise,
cash based STI will be assessed on a pro-rata basis and paid at that time based on performance, and deferred STI will vest in full.
Where a change of control occurs or is likely to occur, the Boards have discretion to determine the treatment of unvested equity awards and the timing of such treatment. In the event the Boards do not exercise their discretion, the LTI will vest pro-rata for time and performance.
7.4 Minimum securityholding requirements – Non-Executive Directors and KMP ElectMinimum securityholding requirements help ensure there is alignment between the interests of ALX’s Directors, KMP and securityholders.
Role Minimum shareholding Timing to meet requirement
Non-Executive Directors 100% of annual director base fees 3 years from the later of July 2017(when the policy was implemented) or from the date of their appointment
CEO Elect 100% of fixed remuneration 5 years from appointment
CFO Elect 50% of fixed remuneration 5 years from appointment
For
per
sona
l use
onl
y

Directors’ Reports continuedfor the year ended 31 December 2018
54 | 2018 Atlas Arteria Annual Report
Remuneration Report (audited) continued
8 Statutory disclosures 8.1 Executive statutory remuneration disclosures for FY18The following table shows the total remuneration for the CEO Elect and CFO Elect for FY18.
NameFinancial year
Cashsalary
$
CashSTI
$
Non-cash benefits
$
Super-annuation
$
Value of share-based
payments$
Longservice
leave$
Termination benefit
$Total
$
Performance based equity
%
Graeme Bevans 2018 696,356 – – 33,554 109,857 – – 839,767 13.1%
Nadine Lennie 2018 256,619 – – 9,501 28,384 – – 294,504 9.6%
For the CEO Elect, the 2018 grant will be made in 2019 following approval from security holders at the 2019 AGM. If securityholder approval is not obtained, the CEO Elect will be eligible to receive a cash award of equivalent value and subject to the same performance measures and performance period. The performance rights have been valued and included in the financial statements for each member of the elect executive team on this basis.
8.2 Non-Executive Director statutory remuneration disclosures for FY18 and FY17The following table shows the actual fees paid to Non-Executive Directors of ATLAX and ATLIX for FY18 and FY17.
ATLAX fees1 (AUD) ATLIX fees1
NameFinancial year
Cash salaryand fees Superannuation Total
Cash salaryand fees Superannuation Total
Nora Scheinkestel 2018 189,710 20,290 210,000 AUD 83,750 – AUD 83,750
2017 208,606 19,832 228,438 AUD 86,250 – AUD 86,250
Richard England2 2018 136,826 14,424 151,250
2017 180,060 15,681 195,741
Debra Goodin3 2018 162,864 15,261 178,125
2017 75,914 4,837 80,751
John Roberts4 2018 105,000 – 105,000
2017 142,083 – 142,083
David Bartholomew5 2018 32,380 3,037 35,417
Jean-Georges Malcor6 2018 24,583 – 24,583
Marc de Cure7 2017 71,918 6,832 78,750
Jeffrey Conyers 2018 USD 120,000 – USD 120,000
2017 USD 122,500 – USD 122,500
Derek Stapley 2018 USD 92,500 – USD 92,500
2017 USD 102,437 – USD 102,437
James Keyes 2018 USD 85,000 – USD 85,000
2017 USD 92,500 – USD 92,500
Christopher Leslie8 2018 USD 85,000 – USD 85,000
2017 USD 28,300 – USD 28,300
1. In 2017, Committees set up specifically for the ALX internalisation were remunerated at a rate of A$5,000 per annum for ATLAX and US$2,500 per annum for ATLIX (A$2,500 per annum for the Australian based director). In addition, a working group was set up with fees ranging between US$5,000 and A$20,000 depending on the level of involvement. In 2018, Debra Goodin was paid a one-off fee of A$20,000 for additional duties performed in relation to internalisation.
2. Resigned as a Non-Executive Director, effective 30 November 2018.3. Commenced as a Non-Executive Director, effective 1 September 2017.4. Resigned as a Non-Executive Director, effective 28 September 2018.5. Commenced as a Non-Executive Director, effective 1 October 2018.6. Commenced as a Non-Executive Director, effective 1 November 2018.7. Resigned as a Non-Executive Director, effective 30 June 2017.8. Commenced as a Non-Executive Director, effective 1 September 2017.
For
per
sona
l use
onl
y

55 2018 Atlas Arteria Annual Report |
8.3 Equity instrument disclosures relating to KMP and KMP ElectSecurityholdingsThe table below outlines the number of ordinary securities held by each KMP and KMP Elect, including their personally related parties, as at 31 December 2018, and the minimum securityholding requirements. Non-Executive Directors have acquired their security holdings on market and in accordance with the ALX’s Securities Trading Policy.
Non-Executive Directors
Name
Balance at1 Jan 2018
No. of securities
ChangesNo. of
securities
Balance at31 Dec 2018
No. ofsecurities
Value at31 Dec 20181
A$
Minimum securityholding
requirement2
A$
Date securityholding
to be attained
Nora Scheinkestel 78,431 – 78,431 490,978 190,000 July 2020
Debra Goodin 5,671 – 5,671 35,500 120,000 September 2020
David Bartholomew – – – – 120,000 October 2021
Jean-Georges Malcor – – – – 120,000 November 2021
Jeffrey Conyers 40,000 – 40,000 250,400 99,385 July 2020
James Keyes 5,000 – 5,000 31,300 99,385 July 2020
Christopher Leslie – – – – 99,385 September 2020
Derek Stapley – 5,000 5,000 31,300 99,385 July 2020
1. Based on the closing share price of ALX securities on 31 December 2018 of A$6.26. 2. Minimum securityholding requirement for ATLIX Board members has been converted to AUD at the 31 December 2018 exchange rate of A$1 = US$0.7043.
KMP Elect
Graeme Bevans – – – – 1,100,000 May 2023
Nadine Lennie – – – – 287,500 July 2023
OptionsNo options over unissued ordinary securities of ALX existed or were granted to KMP during FY18.
Performance rights held during the yearPerformance rights held by KMP Elect have been disclosed in this report.
Equity grants on foot during FY18No equity grants were on foot for KMP Elect during FY18.
8.4 Loans to directors or related partiesThere were no loans to directors or related parties during FY18.
8.5 Other transactions with KMPThere were no other transactions with KMP.
For
per
sona
l use
onl
y

Directors’ Reports continuedfor the year ended 31 December 2018
56 | 2018 Atlas Arteria Annual Report
Auditor services (audited) The Group has an auditor independence policy which precludes the auditors from performing certain services. This ensures that the audit firm does not review or audit their own work, act in a management or a decision-making capacity for the Group, act as advocate for the Group or jointly share economic risks and rewards. When permissible by this policy, the Group may decide to employ the auditor on assignments additional to their statutory audit duties where the auditor’s expertise and experience with the Groups are important. Details of the amounts paid or payable to the Group auditor (PricewaterhouseCoopers) as well as the non PricewaterhouseCoopers audit firms for services provided during the year are set out below.
The Boards have considered the position and, in accordance with the advice received from the Audit and Risk Committee, are satisfied that the provision of the non-audit services is compatible with the general standard of independence for auditors imposed by the Corporations Act 2001. The directors are satisfied that the provision of non-audit services by the auditor, as set out below, did not compromise the auditor independence requirements of the Corporations Act 2001 for the following reasons:• All non-audit services have been reviewed by the Audit and Risk Committees to ensure they do not impact the impartiality and
objectivity of the auditor; and• None of the services undermine the general principles relating to auditor independence as set out in APES 110: Code of Ethics
for Professional Accountants, including reviewing or auditing the auditor’s own work, acting in a management or a decision-making capacity for the company, acting as advocate for the company or jointly sharing economic risk and rewards.
ALX ATLAX GroupYear ended
31 Dec 2018$
Year ended31 Dec 2017
$
Year ended31 Dec 2018
$
Year ended31 Dec 2017
$
Amounts paid or payable to PricewaterhouseCoopers Australia for:
Audit services 479,130 364,743 239,565 186,110
Taxation services – 14,240 – –
Other assurance services1 60,680 261,918 30,340 25,904
539,810 640,901 269,905 212,014
Amounts paid or payable to network firms of PricewaterhouseCoopers for:
Audit services 314,211 239,416 32,745 41,927
Taxation services2 155,974 29,757 – –
Other services – 4,830 – –
470,185 274,003 32,745 41,927
Amounts paid or payable to non-PricewaterhouseCoopers audit firms for:
Audit services 64,866 – – –
64,866 – – –
1. Other assurance services provided in 2018 related to management internalisation. Other assurance services provided in 2017 related to the capital raising services associated with the acquisition of the 50% estimated economic interest in TRIP II and 4.86% indirect interest in APRR via MAF2.
2. Taxation services provided by network firms of the auditor relates to the filing of corporate income tax returns for the Group’s entities domiciled outside of Australia.
For
per
sona
l use
onl
y

57 2018 Atlas Arteria Annual Report |
A copy of the auditor’s independence declaration, as required under section 307C of the Corporations Act 2001 for ATLAX is set out on page 58.
Signed in accordance with a resolution of the directors of Atlas Arteria International Limited:
Jeffrey Conyers Derek StapleyChairman DirectorAtlas Arteria International Limited Atlas Arteria International LimitedPembroke, Bermuda Pembroke, Bermuda27 February 2019 27 February 2019
Signed in accordance with a resolution of the directors of Atlas Arteria Limited:
Nora Scheinkestel Debra GoodinChairman DirectorAtlas Arteria Limited Atlas Arteria LimitedSydney, Australia Sydney, Australia28 February 2019 28 February 2019
Auditor’s Independence Declaration
For
per
sona
l use
onl
y

58 | 2018 Atlas Arteria Annual Report
Auditor’s Independence Declaration Financial Reports for the year ended 31 December 2018 Page 30 of 84 Atlas Arteria International Limited Atlas Arteria Limited
Auditor’s Independence Declaration As lead auditor for the audits of Atlas Arteria International Limited and Atlas Arteria Limited for the year ended 31 December 2018, I declare that to the best of my knowledge and belief there have been:
1 no contraventions of the auditor independence requirements of the Corporations Act 2001 (as applicable) in relation to the audits; and
2 no contraventions of any applicable code of professional conduct in relation to the audits.
This declaration is in respect of Atlas Arteria International Limited and Atlas Arteria Limited and the entities they controlled during the year.
SJ Smith Partner Sydney PricewaterhouseCoopers 28 February 2019
PricewaterhouseCoopers, ABN 52 780 433 757
One International Towers Sydney, Watermans Quay, Barangaroo, GPO BOX 2650, SYDNEY NSW 1171.
T: +61 2 8266 0000, F: +61 2 8266 9999, www.pwc.com.au
Level 11, 1PSQ, 169 Macquarie Street, Parramatta NSW 2150, PO Box 1155 Parramatta NSW 2124
T: +61 2 9659 2476, F: +61 2 8266 9999, www.pwc.com.au
Liability limited by a scheme approved under Professional Standards Legislation
For
per
sona
l use
onl
y

59 2018 Atlas Arteria Annual Report | 59
Consolidated Statements of Comprehensive Incomefor the year ended 31 December 2018
ALX ATLAX Group
Note
Year ended31 Dec 2018
$’000
Year ended31 Dec 2017
$’000
Year ended31 Dec 2018
$’000
Year ended31 Dec 2017
$’000
Revenue and other income from operations
Revenue from operations 132,378 78,732 5,540 3,024
Other income from operations 13,609 394,269 224 65,142
Total revenue and other income from operations 2.1(a) 145,987 473,001 5,764 68,166
Operating expenses 2.1(b) (222,458) (104,343) (17,795) (8,493)
Finance costs 2.1(c) (108,920) (53,795) – –
Share of net profits/(losses) of investments accounted for using the equity method
3.2(b) 246,141 187,971 (4,801) (626)
Profit/(loss) from operations before income tax 60,750 502,834 (16,832) 59,047
Income tax (expense)/benefit 2.4 (898) 16,749 1 (1,664)
Profit/(loss) for the year 59,852 519,583 (16,831) 57,383
Profit/(loss) attributable to:
Equity holders of the parent entity – ATLIX 76,683 462,200 – –
Equity holders of other stapled entity – ATLAX(as non-controlling interest/parent entity)
(16,831) 57,383 (16,831) 57,383
Stapled securityholders 59,852 519,583 (16,831) 57,383
Other comprehensive income/(loss)
Items that may be reclassified to profit or loss:
Exchange differences on translation of foreign operations 178,502 (14,940) 16,547 (14,518)
Other comprehensive income/(loss) for the year, net of tax 178,502 (14,940) 16,547 (14,518)
Total comprehensive income/(loss) for the year 238,354 504,643 (284) 42,865
Total comprehensive income/(loss) attributable to:
Equity holders of the parent entity – ATLIX 238,638 461,778 – –
Equity holders of other stapled entity – ATLAX
(as non-controlling interest/parent entity) (284) 42,865 (284) 42,865
Stapled securityholders 238,354 504,643 (284) 42,865
Cents Cents Cents Cents
Profit/(loss) per share attributable to ATLIX/ATLAX shareholders
Basic profit/(loss) per share attributable to:
ATLIX (as parent entity) 2.3 11.33 77.98 – –
ATLAX (as non-controlling interest) 2.3 – – (2.49) 9.68
Basic profit/(loss) per ALX stapled security 8.84 87.66 (2.49) 9.68
Diluted profit/(loss) per share attributable to:
ATLIX (as parent entity) 2.3 11.33 77.98 – –
ATLAX (as non-controlling interest) 2.3 – – (2.49) 9.68
Diluted profit/(loss) per ALX stapled security 8.84 87.66 (2.49) 9.68
The above Consolidated Statements of Comprehensive Income should be read in conjunction with the accompanying notes.
For
per
sona
l use
onl
y

60 | 2018 Atlas Arteria Annual Report
Consolidated Statements of Financial Positionas at 31 December 2018
ALX ATLAX Group
Note
As at31 Dec 2018
$’000
As at31 Dec 2017
$’000
As at31 Dec 2018
$’000
As at31 Dec 2017
$’000
Current assets
Cash and cash equivalents 3.1 186,468 122,690 12,461 34,304Other assets 4.3 2,495 1,342 47,337 2,196
Total current assets 188,963 124,032 59,798 36,500
Non-current assetsIntangible assets – Tolling concessions 4.1 2,578,434 2,189,724 – –Investments accounted for using the equity method 3.2 1,569,970 1,483,337 164,644 153,110Restricted cash 3.1 203,961 153,440 – –Goodwill 4.2 79,390 58,726 – –Property, plant and equipment 4,595 728 561 –Derivative financial instruments 2,900 – – –Other assets 4.3 319 140 8,274 122,882
Total non-current assets 4,439,569 3,886,095 173,479 275,992
Total assets 4,628,532 4,010,127 233,277 312,492
Current liabilitiesDebt at amortised cost 5.1 (77,322) (66,286) – –Other liabilities 4.4 (34,859) (63,327) (3,398) (6,376)Derivative financial instruments (3,108) – – –
Total current liabilities (115,289) (129,613) (3,398) (6,376)
Non-current liabilitiesDebt at amortised cost 5.1 (2,101,962) (1,668,352) – –Deferred tax liabilities 2.4 (57,709) (40,333) – –Other liabilities 4.4 (11,571) (9,754) – –Derivative financial instruments (13,495) – – –
Total non-current liabilities (2,184,737) (1,718,439) – –
Total liabilities (2,300,026) (1,848,052) (3,398) (6,376)
Net assets 2,328,506 2,162,075 229,879 306,116
EquityEquity attributable to equity holders of the parent – ATLIXContributed equity 5.2 1,995,994 1,911,877 – –Reserves 5.3 190,155 28,122 – –Accumulated losses (87,522) (84,040) – –
ATLIX securityholders’ interest 2,098,627 1,855,959 – –
Equity attributable to other stapled securityholders – ATLAXContributed equity 5.2 197,311 268,334 197,311 268,334Reserves 5.3 (7,528) (24,216) (7,528) (24,216)Accumulated income 40,096 61,998 40,096 61,998
Other stapled securityholders’ interest 229,879 306,116 229,879 306,116
Total equity 2,328,506 2,162,075 229,879 306,116
The above Consolidated Statements of Financial Position should be read in conjunction with the accompanying notes.
As required by Bermuda regulations, the ALX financial information was approved by the directors of the Atlas Arteria International Limited (“ATLIX”) Board on 27 February 2019 and was signed on ATLIX’s behalf by:
Jeffrey Conyers, Atlas Arteria International Limited,Pembroke, Bermuda
Derek Stapley, Atlas Arteria International Limited, Pembroke, Bermuda
For
per
sona
l use
onl
y

61 2018 Atlas Arteria Annual Report |
Consolidated Statements of Changes in Equityfor the year ended 31 December 2018
Attributable to ATLIX securityholders
ALX
Contributed equity$’000
Reserves$’000
AccumulatedLosses$’000
Total$’000
Attributable to ATLAX
securityholders$’000
Total ALX equity$’000
Total equity at 1 January 2018 1,911,877 28,122 (84,040) 1,855,959 306,116 2,162,075
Opening adjustment on adoption of AASB 91 – – 288 288 (288) –
Total equity at 1 January 2018 (restated) 1,911,877 28,122 (83,752) 1,856,247 305,828 2,162,075
Profit/(loss) for the year – – 76,683 76,683 (16,831) 59,852
Exchange differences on translation of foreign operations
– 161,955 – 161,955 16,547 178,502
Transfer from foreign currency translation reserve to accumulated losses2
– 78 (78) – – –
Total comprehensive income/(expense) – 162,033 76,605 238,638 (284) 238,354
Transactions with equity holders in their capacity as equity holders:
Application of performance fees to subscription for new securities
84,117 – – 84,117 6,186 90,303
Employee performance rights3 – – – – 141 141
Capital return4 – – – – (77,209) (77,209)
Dividends paid4 – – (80,375) (80,375) (4,783) (85,158)
84,117 – (80,375) 3,742 (75,665) (71,923)
Total equity at 31 December 2018 1,995,994 190,155 (87,522) 2,098,627 229,879 2,328,506
1. Refer note 7.5(e) for details.2. Foreign exchange translation gain of $0.1 million transferred to accumulated losses on derecognition of joint venture (refer note 6.2 for details).3. Refer note 7.4 for details.4. On 5 October 2018, ATLAX paid a distribution of 12.0 cents per stapled security (“cps”), comprising a capital return of 11.3 cps and an unfranked Australian ordinary dividend of 0.7 cps.
On 13 April 2018, ATLIX paid an ordinary dividend of 12.0 cps.
Attributable to ATLIX securityholders
ALX
Contributed equity$’000
Reserves$’000
AccumulatedLosses$’000
Total$’000
Attributable to ATLAX
securityholders$’000
Total ALX equity$’000
Total equity at 1 January 2017 1,323,651 58,378 (517,041) 864,988 208,010 1,072,998
Profit for the year – – 462,200 462,200 57,383 519,583
Exchange differences on translation of foreign operations
– (422) – (422) (14,518) (14,940)
Transfer from foreign currency translation reserve to accumulated losses1
– (30,135) 30,135 – – –
Total comprehensive income/(expense) – (30,557) 492,335 461,778 42,865 504,643
Transactions with equity holders in their capacity as equity holders:
Issue of securities during the year 595,789 – – 595,789 51,035 646,824
Application of performance fees to subscription for new securities
48,585 – – 48,585 4,054 52,639
Other equity transactions – 301 – 301 152 453
Capital return2 (56,148) – – (56,148) – (56,148)
Dividends paid2 – – (59,334) (59,334) – (59,334)
588,226 301 (59,334) 529,193 55,241 584,434
Total equity at 31 December 2017 1,911,877 28,122 (84,040) 1,855,959 306,116 2,162,075
1. Foreign exchange translation gain of $30.1 million transferred to accumulated losses on derecognition of associate.2. On 29 September 2017, ALX paid an ordinary dividend of 10.0 cps. On 7 April 2017, ALX paid a distribution of 10.0 cps, comprising a capital return of 9.8 cps and an ordinary dividend of 0.2 cps.
The above Consolidated Statements of Changes in Equity should be read in conjunction with the accompanying notes.
For
per
sona
l use
onl
y

62 | 2018 Atlas Arteria Annual Report
Consolidated Statements of Changes in Equityfor the year ended 31 December 2018
Attributable to ATLAX securityholders
ATLAX Group
Contributed equity$’000
Reserves$’000
Accumulatedincome
$’000
Total ATLAX Group equity
$’000
Total equity at 1 January 2018 268,334 (24,216) 61,998 306,116
Opening adjustment on adoption of AASB 91 – – (288) (288)
Total equity at 1 January 2018 (restated) 268,334 (24,216) 61,710 305,828
Loss for the year – – (16,831) (16,831)
Exchange differences on translation of foreign operations – 16,547 – 16,547
Total comprehensive expense – 16,547 (16,831) (284)
Transactions with equity holders in their capacity as equity holders:
Application of performance fees to subscription for new securities 6,186 – – 6,186
Employee performance rights2 – 141 – 141
Capital return3 (77,209) – – (77,209)
Dividend paid3 – – (4,783) (4,783)
(71,023) 141 (4,783) (75,665)
Total equity at 31 December 2018 197,311 (7,528) 40,096 229,879
1. Refer note 7.5(e) for details.2. Refer note 7.4 for details.3. On 5 October 2018, ATLAX paid a distribution of 12.0 cps, comprising a capital return of 11.3 cps and an unfranked Australian ordinary dividend of 0.7 cps.
Attributable to ATLAX securityholders
ATLAX Group
Contributed equity$’000
Reserves$’000
Accumulatedincome
$’000
Total ATLAX Group equity
$’000
Total equity at 1 January 2017 213,245 (7,131) 1,896 208,010
Profit for the year – – 57,383 57,383
Exchange differences on translation of foreign operations – (14,518) – (14,518)
Transfer from foreign currency translation reserve to accumulated losses1 – (2,719) 2,719 –
Total comprehensive income – (17,237) 60,102 42,865
Transactions with equity holders in their capacity as equity holders:
Issue of securities during the year 51,035 – – 51,035
Application of performance fees to subscription for new securities 4,054 – – 4,054
Other equity transactions – 152 – 152
55,089 152 – 55,241
Total equity at 31 December 2017 268,334 (24,216) 61,998 306,116
1. Foreign exchange translation gain of $2.7 million transferred to accumulated income on derecognition of associate.
The above Consolidated Statements of Changes in Equity should be read in conjunction with the accompanying notes.
For
per
sona
l use
onl
y

63 2018 Atlas Arteria Annual Report |
Consolidated Statements of Cash Flowsfor the year ended 31 December 2018
ALX ATLAX Group
Note
Year ended31 Dec 2018
$’000
Year ended31 Dec 2017
$’000
Year ended31 Dec 2018
$’000
Year ended31 Dec 2017
$’000
Cash flows from operating activities
Toll revenue received (net of transaction fees) 123,174 73,560 – –
Interest received 2,001 1,907 4,977 1,131
Other income received 634 371 – –
Net indirect taxes received 430 268 430 265
Property taxes paid (5,889) (5,713) – –
Manager’s and adviser’s base fees paid (36,874) (30,578) (2,711) (2,818)
Manager’s and adviser’s performance fees paid (25,000) – (1,713) –
Payments to suppliers and employees (inclusive of GST/VAT) (35,328) (19,538) (9,673) (5,119)
M6 Toll management fees received – 5,155 – –
Net income taxes paid (8) (7,312) – (7,307)
Net cash flows from operating activities 7.1 23,140 18,120 (8,690) (13,848)
Cash flows from investing activities
Return on preferred equity certificates issued by Macquarie Autoroutes de France 2 SA (“MAF2”)
249,417 147,779 – –
Proceeds from/(payments for) purchase of investments, net of cash acquired
1,890 (1,215,113) – (79,162)
Purchase of fixed assets (1,102) (277) (548) –
Sale of fixed assets 4 138 – –
Net cash flows from investing activities 250,209 (1,067,473) (548) (79,162)
Cash flows from financing activities
Proceeds from debt (net of transaction costs) 534,699 450,530 – –
Repayment of debt and interest (including transaction costs) (555,834) (9,117) – –
Proceeds from issue of securities (net of transaction costs) – 646,824 – 51,035
Transfers to restricted cash (25,702) (27,855) – –
Capital return (77,209) (56,148) (77,209) –
Dividends paid (85,158) (59,334) (4,783) –
Repayment of loan by related parties – – 77,411 –
Loans advanced to related parties – – (8,232) (122,812)
Payments to related parties – – – (841)
Purchase of derivative financial instrument (4,818) – – –
Net cash flows from financing activities (214,022) 944,900 (12,813) (72,618)
Net increase/(decrease) in cash and cash equivalents 59,327 (104,453) (22,051) (165,628)
Cash and cash equivalents at the beginning of the year 122,690 223,367 34,304 204,129
Effects of exchange rate movements on cash and cash equivalents 4,451 3,776 208 (4,197)
Cash and cash equivalents at the end of the year 3.1 186,468 122,690 12,461 34,304
The above Consolidated Statements of Cash Flows should be read in conjunction with the accompanying notes.
For
per
sona
l use
onl
y

| 2018 Atlas Arteria Annual Report
1 IntroductionAtlas Arteria – Stapled securityAn Atlas Arteria (“ALX”) stapled security comprises one Atlas Arteria International Limited (“ATLIX”) share ‘stapled’ to one Atlas Arteria Limited (“ATLAX”) share to create a single listed security traded on the Australian Securities Exchange (“ASX”). The stapled securities cannot be traded or dealt with separately.
AASB 3 Business Combinations and AASB 10 Consolidated Financial Statements require one of the stapled entities of a stapled structure to be identified as the parent entity for the purpose of preparing a consolidated Financial Report. In accordance with this requirement, ATLIX has been identified as the parent entity of the consolidated group comprising ATLIX and its controlled entities and ATLAX and its controlled entities (“ATLAX Group”), together comprising ALX.
As permitted by ASIC Class Order 13/1050 and ASIC Corporations (Stapled Group Reports) Instrument 2015/838, these reports consist of the Financial Report of ATLIX and its controlled entities at the end of and during the year (collectively, “ALX” or the “Group”) and the Financial Report of ATLAX and its controlled entities at the end of and during the year (collectively, “ATLAX Group”). The Group and the ATLAX Group are collectively referred to as the “Groups”.
The Financial Report of the Group should be read in conjunction with the separate Financial Report of the ATLAX Group presented in these reports for the year ended 31 December 2018.
Basis of preparationBoth ATLIX and ATLAX are for-profit entities for the purpose of preparing the Financial Reports.
The Financial Reports were authorised for issue by the directors of the ATLIX Board and the ATLAX Board (together, the “Boards”) on 27 February 2019 and 28 February 2019 respectively. The Boards have the power to amend and reissue the Financial Reports.
The Financial Reports are general purpose financial reports that:• have been prepared in accordance with Australian Accounting Standards and Interpretations issued by the Australian Accounting
Standards Board (“AASB”) and the Corporations Act 2001 (where applicable)• have also been prepared in accordance with and comply International Financial Reporting Standards (“IFRS”) as issued by the
International Accounting Standards Board (“IASB”)• include the assets and liabilities of all subsidiaries as at 31 December 2018 and the results of the subsidiaries for the year then
ended. Inter-entity transactions with, or between, subsidiaries are eliminated in full on consolidation• have been prepared under the historical cost conventions except for certain assets and liabilities which have been measured at
fair value• are presented in Australian dollars with all values rounded to the nearest thousand dollars unless otherwise stated, in accordance
with ASIC Corporations (Rounding in Financial/Directors’ Reports) Instrument 2016/191.
Significant accounting policies and key judgements and estimates are contained in shaded text and included in the relevant note. These policies have been consistently applied to all years presented, unless otherwise stated. Refer note 7.5 for other accounting policies which have not been presented along with their respective notes.
Certain prior year amounts in the Financial Reports and accompanying notes have been reclassified to conform to the current year presentation. The reclassifications had no effect on previously reported consolidated total assets, total liabilities, comprehensive income or shareholders’ equity.
Critical accounting estimates and judgementsThe preparation of the Financial Reports in accordance with Australian Accounting Standards requires the use of certain critical accounting estimates. It also requires the directors to exercise judgement in the process of applying the accounting policies. Estimates and judgements are continually evaluated and are based on historic experience and other factors, including reasonable expectations of future events. The directors believe the estimates used in the preparation of the Financial Reports are reasonable. Actual results in the future may differ from those reported.
Significant judgements made in applying accounting policies, estimates and assumptions that have a risk of causing a material adjustment to the carrying amounts of assets and liabilities within the next year are discussed in the following notes:• Income tax (note 2.4)• Control assessment (note 3.2 and 6.2)• Impairment of assets and reversal of impairment (note 3.2)• Intangible assets – Tolling concessions (note 4.1)
64
Notes to the Financial Reportsfor the year ended 31 December 2018
For
per
sona
l use
onl
y

2018 Atlas Arteria Annual Report |
2 Financial performance2.1 Profit/(loss) for the year
Revenue recognitionRevenue and other income is recognised as follows:Toll revenue Toll revenue from customers is earned as performance obligations are satisfied. A singular performance
obligation has been assessed as the use of the road, and the transaction price which is calculated based on passing through toll points, is fully allocated to this performance obligation. Toll revenue is recognised at the time the customers use the road.
Other revenue Other revenue from customers consists of revenue earned in respect to rental income from cell towers and income from advertising hoardings on the toll road. Other revenue is recognised over the period of the contract in accordance with the contracts governing these services as performance obligations are satisfied.
Interest income Interest income is brought to account on an accruals basis.
Change in accounting policyAASB 15 Revenue from Contracts with Customers replaces all the current guidance on revenue recognition from contracts with customers. It requires identification of discrete performance obligations within a transaction and an associated transaction price allocation to these obligations. Revenue is recognised upon satisfaction of these performance obligations, which occur when control of the goods or services are transferred to the customer.
The Groups have adopted AASB 15 from 1 January 2018 which resulted in changes in accounting policies and the analysis of possible adjustments to the amounts recognised in the financial reports. In accordance with the transition provisions in AASB 15, the Groups have elected to adopt the new rules retrospectively, however this has not resulted in any adjustments to the prior year comparatives.
The profit/(loss) from operations before income tax includes the following specific items of income and expense:
a) Revenue and other income
ALX ATLAX GroupYear ended
31 Dec 2018$’000
Year ended31 Dec 2017
$’000
Year ended31 Dec 2018
$’000
Year ended31 Dec 2017
$’000
Revenue from operations:
Toll revenue 126,811 75,697 – –
Other revenue 769 343 1,678 –
Interest income:
Related parties 877 1,564 3,862 3,024
Other persons and corporations 3,921 1,128 – –
Total interest income 4,798 2,692 3,862 3,024
Total revenue from operations 132,378 78,732 5,540 3,024
Other income from operations:
Gain on revaluation1 13,470 375,615 – 61,710
Other income 139 42 – –
Reversal of impairment on financial assets2 – – 161 –
Net foreign exchange gain – 14,119 63 2,247
M6 Toll management fee income – 4,493 – –
Guarantee fee income – – – 1,185
Total other income from operations 13,609 394,269 224 65,142
Total revenue and other income from operations 145,987 473,001 5,764 68,166
1. The current year includes a gain on revaluation of ALX’s existing investment in Warnowquerung GmbH & Co KG, the concessionaire of Warnow Tunnel and its general partner Warnowquerung Verwaltungsgesellschaft mbH (collectively “WQG”). Refer note 6.2 for details. In 2017, there was a gain on revaluation on the Groups’ existing investment in Dulles Greenway.
2. Refer note 4.3 for details.
65
For
per
sona
l use
onl
y

| 2018 Atlas Arteria Annual Report
Notes to the Financial Reports continuedfor the year ended 31 December 2018
2 Financial performance continued
2.1 Profit/(loss) for the year continuedb) Operating expenses
ALX ATLAX GroupYear ended
31 Dec 2018$’000
Year ended31 Dec 2017
$’000
Year ended31 Dec 2018
$’000
Year ended31 Dec 2017
$’000
Operating expenses
Amortisation of tolling concession 61,768 36,520 – –
Cost of operations:
Toll road maintenance expenses 10,597 5,524 – –
Other operating expenses 12,042 5,234 172 –
Employment costs 9,487 4,489 3,236 730
Total cost of operations 32,126 15,247 3,408 730
Manager’s and adviser’s performance fees1 70,625 7,979 4,984 639
Manager’s and adviser’s base fees 36,759 32,813 2,236 2,625
Consulting and administration fees 11,920 7,613 6,104 3,454
Other expenses 5,427 4,019 1,024 1,045
Net foreign exchange loss 3,483 – – –
Depreciation and amortisation 350 152 39 –
Total operating expenses2 222,458 104,343 17,795 8,493
1. Refer note 4.4 for details.2. Includes ALX’s management internalisation expenses of $10.3 million (2017: 0.5 million).
c) Finance costs
ALX ATLAX GroupYear ended
31 Dec 2018$’000
Year ended31 Dec 2017
$’000
Year ended31 Dec 2018
$’000
Year ended31 Dec 2017
$’000
Interest on debt 89,975 51,511 – –
Mark to market loss on derivatives 2,055 – – –
Issue costs written off on loans repaid during the year1 6,688 – – –
Fee on early repayment of borrowings from financial institutions 4,576 – – –
Amortisation of issue cost on borrowings from financial institutions 5,626 2,284 – –
Total finance costs 108,920 53,795 – –
1. Refer note 5.1(c) for details.
66
For
per
sona
l use
onl
y

2018 Atlas Arteria Annual Report |
2.2 Distributions
DistributionsA distribution payable is recognised for the amount of any distribution declared, or publicly recommended by the directors on or before the end of the year but not distributed at balance date.
ALX ATLAX GroupYear ended
31 Dec 2018$’000
Year ended31 Dec 2017
$’000
Year ended31 Dec 2018
$’000
Year ended31 Dec 2017
$’000
Distributions paid
Distribution paid on 5 October 20181 81,992 – 81,992 –
Dividend paid on 13 April 20182 80,375 – – –
Dividend paid on 29 September 20173 – 58,188 – –
Distribution paid on 7 April 20174 – 57,294 – –
Total distributions paid 162,367 115,482 81,992 –
Cents per stapled
security
Cents per stapled
security
Cents per stapled
security
Cents per stapled
security
Distributions paid
Distribution per security paid on 5 October 20181 12.0 – 12.0 –
Dividend per security paid on 13 April 20182 12.0 – – –
Dividend per security paid on 29 September 20173 – 10.0 – –
Distribution per security paid on 7 April 20174 – 10.0 – –
Total distributions paid 24.0 20.0 12.0 –
1. Comprised a capital return of 11.3 cps and an unfranked Australian ordinary dividend of 0.7 cps. The distribution was paid in full by ATLAX.2. Comprised an ordinary dividend of 12.0 cps. The dividend was paid in full by ATLIX. 3. Comprised an ordinary dividend of 10.0 cps. The dividend was paid in full by ATLIX.4. Comprised a capital return of 9.8 cps and an ordinary dividend of 0.2 cps. The distribution was paid in full by ATLIX.
67
For
per
sona
l use
onl
y

| 2018 Atlas Arteria Annual Report
Notes to the Financial Reports continuedfor the year ended 31 December 2018
2 Financial performance continued
2.3 Earnings per stapled security
Earnings per stapled security
Basic earnings per stapled securityBasic earnings per stapled security is determined by dividing the profit attributable to securityholders by the weighted average number of securities on issue during the year.
Diluted earnings per stapled securityDiluted earnings per stapled security is calculated by adjusting basic earnings per stapled security for the effects of all dilutive potential ordinary stapled securities.
ALX ATLAX GroupYear ended
31 Dec 2018$’000
Year ended31 Dec 2017
$’000
Year ended31 Dec 2018
$’000
Year ended31 Dec 2017
$’000
Basic earnings/(loss) per ATLIX/ATLAX share 11.33 77.98 (2.49) 9.68
Diluted earnings/(loss) per ATLIX/ATLAX share 11.33 77.98 (2.49) 9.68
$’000 $’000 $’000 $’000
Earnings/(loss) used in the calculation of basic and diluted profit/(loss) per ATLIX/ATLAX share1
76,683 462,200 (16,831) 57,383
Number Number Number Number
Weighted average number of shares used in calculation of basic earnings/(loss) per ATLIX/ATLAX share
676,545,113 592,724,448 676,545,113 592,724,448
Adjustment for employee performance rights1 101,974 – 101,974 –
Weighted average number of shares and potential shares usedin calculation of diluted earnings/(loss) per ATLIX/ATLAX share
676,647,087 592,724,448 676,647,087 592,724,448
1. Refer note 7.4 for details.
The basic and diluted profit per ALX stapled security for the year ended 31 December 2018 was 8.84 cps (2017: 87.66 cps) using ALX profit attributable to ALX stapled securityholders of $59.9 million (2017: $519.6 million).
68
For
per
sona
l use
onl
y

2018 Atlas Arteria Annual Report |
2.4 Income tax
Income taxThe income tax expense or benefit for the year is the tax payable on the current year’s taxable income based on the national income tax rate for each jurisdiction adjusted by changes in deferred tax assets and liabilities attributable to temporary differences between the tax bases of assets and liabilities and their carrying amounts in the Financial Reports, and to unused tax losses.
Deferred income tax is determined using the balance sheet method, being the temporary differences arising between the tax bases of assets and liabilities and their carrying amounts in the Financial Reports. Deferred tax assets are recognised for deductible temporary differences and unused tax losses only if it is probable that future taxable amounts will be available to utilise those temporary differences and losses. However, the deferred income tax is not accounted for if it arises from initial recognition of an asset or liability in a transaction other than a business combination that at the time of transaction affects neither accounting nor taxable profit nor loss. Deferred income tax is determined using tax rates (and laws) that have been enacted or substantially enacted by the balance sheet date and are expected to apply when the related deferred income tax asset is realised or the deferred income tax liability is settled. Deferred tax assets and liabilities are offset when there is a legally enforceable right to offset current tax assets and liabilities and when the deferred tax balances relate to the same taxation authority.
Under current Bermudan law, ATLIX will not be subject to any income, withholding or capital gains taxes in Bermuda. Controlled entities of ATLIX that are subject to taxes in their jurisdictions recognise income tax using the balance sheet approach of tax effect accounting.
Income tax expense/(benefit) This note provides an analysis of the Groups’ income tax expense, shows what amounts are recognised directly in equity and how the tax expense is affected by non-assessable and non-deductible items. It also explains significant estimates made in relation to the Groups’ tax position.
ALX ATLAX Group
(a) Income tax expense/(benefit)
Year ended31 Dec 2018
$’000
Year ended31 Dec 2017
$’000
Year ended31 Dec 2018
$’000
Year ended31 Dec 2017
$’000
Income tax expense/(benefit) comprises:
Current tax 2,118 1,699 (1) 1,664
Deferred tax (1,220) (18,448) – –
Total income tax expense/(benefit) 898 (16,749) (1) 1,664
(b) Reconciliation of income tax expense/(benefit) to prima facie tax payable
Profit/(loss) from operations before income tax 60,750 502,834 (16,832) 59,047
Prima facie income tax on profit at the Australian tax rate of 30% 18,225 150,850 (5,050) 17,714
Impact of different tax rates of operations in jurisdictions other than Australia 141,010 (93,988) 50 (2,098)
Tax effect of amounts that are not deductible/(taxable) in calculating taxable income:
Non-assessable income (4,088) (18,513) (47) (18,513)
Non-deductible expenditure 1,405 670 1,354 670
Share of net profits/(losses) of investments accounted for using the equity method
(73,842) (56,391) 1,440 188
Temporary differences not brought to account 7,152 1,147 (990) (1,278)
Impact of change in tax rates on deferred tax liabilities1 – (17,484) – –
Deferred tax asset on taxable losses not brought to account (88,964) 16,960 3,242 4,981
Aggregate income tax expense/(benefit)2 898 (16,749) (1) 1,664
1. The reduction in deferred tax liability recognised on acquisition of additional interest in TRIP II by $17.5 million due to decrease in United States Federal Income Tax rate.2. Neither ALX nor the ATLAX Group recognised any current or deferred tax that was debited or credited directly to equity.
69
For
per
sona
l use
onl
y

| 2018 Atlas Arteria Annual Report
Notes to the Financial Reports continuedfor the year ended 31 December 2018
2 Financial performance continued
2.4 Income tax continued
ALX ATLAX Group
(c) Tax losses
Year ended31 Dec 2018
$’000
Year ended31 Dec 2017
$’000
Year ended31 Dec 2018
$’000
Year ended31 Dec 2017
$’000
Unused tax losses for which no deferred tax asset has been recognised 274,589 230,002 274,056 229,477
Potential tax benefit of unused tax losses 72,140 60,174 72,039 60,074
Deferred tax assets and liabilitiesThe Groups have no deferred tax assets. The movement in the balance of deferred tax liability is as follows:
ALX ATLAX GroupYear ended
31 Dec 2018$’000
Year ended31 Dec 2017
$’000
Year ended31 Dec 2018
$’000
Year ended31 Dec 2017
$’000
Deferred tax liabilities
Opening balance at 1 January (40,333) – – –
Acquisition of subsidiary1 (14,193) (61,712) – –
Amortisation of Deferred Tax Liabilities (“DTL”) 1,220 964 – –
Revaluation due to changes in income tax rates – 17,484 – –
Foreign exchange movement (4,403) 2,931 – –
Closing balance at 31 December (57,709) (40,333) – –
1. In the current year, a DTL of $14.2 million was recognised following the fair value pick up of intangible assets resulting from acquisition of the remaining 30% equity interest in WQG. In the prior year, a DTL of $61.7 million was recognised following the fair value pick up of intangible assets resulting from acquisition of the remaining 50% estimated economic interest in TRIP II.
2.5 Segment information
Segment reportingOperating segments are reported in a manner consistent with the internal reporting provided to the chief operating decision makers. The chief operating decision makers, who are responsible for allocating resources and assessing performance of the operating segments, have been identified as the directors of the companies.
a) Description of segmentsManagement has determined the operating segments based on the reports reviewed by the Boards in their capacity as chief operating decision makers. However, the Boards do not manage the day-to-day activities of the business. The directors have appointed Macquarie Fund Advisers Pty Limited (“MFA”) to run and manage the ongoing operations of the business and pay a quarterly management fee in return for these services.
The Boards consider the business from the aspect of each of the portfolio assets and have identified four and one operating segments for ALX and the ATLAX Group respectively. The segments of ALX are the investments in APRR, ADELAC, Dulles Greenway and Warnow Tunnel. The only segment of the ATLAX Group is the investment in Dulles Greenway.
The operating segment note discloses the segment revenue and segment EBITDA for the year ended 31 December 2018 by individual portfolio asset. The ALX Boards are provided with performance information on each asset to monitor the operating performance of each asset.
70
For
per
sona
l use
onl
y

2018 Atlas Arteria Annual Report |
b) Segment information provided to the BoardsThe proportionally consolidated segment information provided to the Boards for the reportable segments for the year ended 31 December 2018, based on ALX’s economic ownership interest is as follows:
ALX Year endedAPRR$’000
ADELAC$’000
Dulles Greenway
$’000
WarnowTunnel$’000
TotalALX
$’000
Total ATLAX$’000
Segment revenue 31 December 2018 1,002,663 22,184 121,800 15,618 1,162,265 16,361
31 December 2017 751,765 16,787 98,105 11,574 878,231 13,178
Segment expenses 31 December 2018 (262,489) (3,874) (22,772) (3,697) (292,832) (3,059)
31 December 2017 (200,805) (3,002) (18,200) (3,378) (225,385) (2,445)
Segment EBITDA 31 December 2018 740,174 18,310 99,028 11,921 869,433 13,302
31 December 2017 550,960 13,785 79,905 8,196 652,846 10,733
EBITDA margin 31 December 2018 74% 83% 81% 76% 75% 81%
31 December 2017 73% 82% 81% 71% 74% 81%
The segment revenue disclosed in the table above primarily relates to toll revenue generated by the assets from external customers and the proportionally consolidated segment information provided to the Boards for the reportable segments for the year ended 31 December 2018 and year ended 31 December 2017.
ATLAX Group information includes its economic ownership in Dulles Greenway only.
A reconciliation of the Groups’ segment revenue and EBITDA to its total revenue and profit from operations before income tax is provided as follows:
ALX ATLAX GroupYear ended
31 Dec 2018$’000
Year ended31 Dec 2017
$’000
Year ended31 Dec 2018
$’000
Year ended31 Dec 2017
$’000
Reconciliation of segment revenue to revenue
Segment revenue 1,162,265 878,231 16,361 13,178
Revenue attributable to non-consolidated investments (1,036,064) (878,231) (16,361) (13,178)
Unallocated revenue and other income 19,786 473,001 5,764 68,166
Total revenue and other income from operations 145,987 473,001 5,764 68,166
Reconciliation of segment EBITDA to profit/(loss) before income tax
Segment EBITDA 869,433 652,846 13,302 10,733
EBITDA attributable to non-consolidated investments (766,738) (652,846) (13,302) (10,733)
Unallocated revenue 19,786 473,001 5,764 68,166
Unallocated expenses (198,952) (104,343) (17,795) (8,493)
Finance costs (108,920) (53,795) – –
Share of net profits/(losses) of investments accounted for using the equity method
246,141 187,971 (4,801) (626)
Profit/(loss) from operations before income tax 60,750 502,834 (16,832) 59,047
71
For
per
sona
l use
onl
y

| 2018 Atlas Arteria Annual Report
Notes to the Financial Reports continuedfor the year ended 31 December 2018
3 Cash and investments
3.1 Cash, cash equivalents and restricted cash
Cash, cash equivalents and restricted cashCash and cash equivalents includes cash on hand, deposits held at call with financial institutions and other short-term, highly liquid investments that are readily convertible to known amounts of cash and which are subject to an insignificant risk of changes in value. Restricted cash includes funds held in escrow, funds backing guarantees or amounts otherwise not available to meet short-term commitments of the Groups and is classified as a non-current asset.
ALX ATLAX GroupYear ended
31 Dec 2018$’000
Year ended31 Dec 2017
$’000
Year ended31 Dec 2018
$’000
Year ended31 Dec 2017
$’000
Current
Cash and cash equivalents (a) 186,468 122,690 12,461 34,304
186,468 122,690 12,461 34,304
Non-current
Restricted cash (b) 203,961 153,440 – –
203,961 153,440 – –
a) Cash and cash equivalentsDuring the year cash on hand was held in bank accounts earning money market rates of interest between nil to 2.52% (2017: nil to 1.71%) per annum.
Cash equivalents include TRIP II’s money market deposits outstanding which matured within 30 days and paid interest between 2.32% to 2.56% (2017: 1.04% to 1.23%) per annum.
b) Restricted cashThis comprises funds held in escrow pursuant to the TRIP II bond indenture agreements, WQG loan agreements and cash-backed guarantees provided in relation to Warnowquerung GmbH & Co. KG. Discussion of the Groups’ policies concerning the management of credit risk can be found in note 5.4.
72
For
per
sona
l use
onl
y
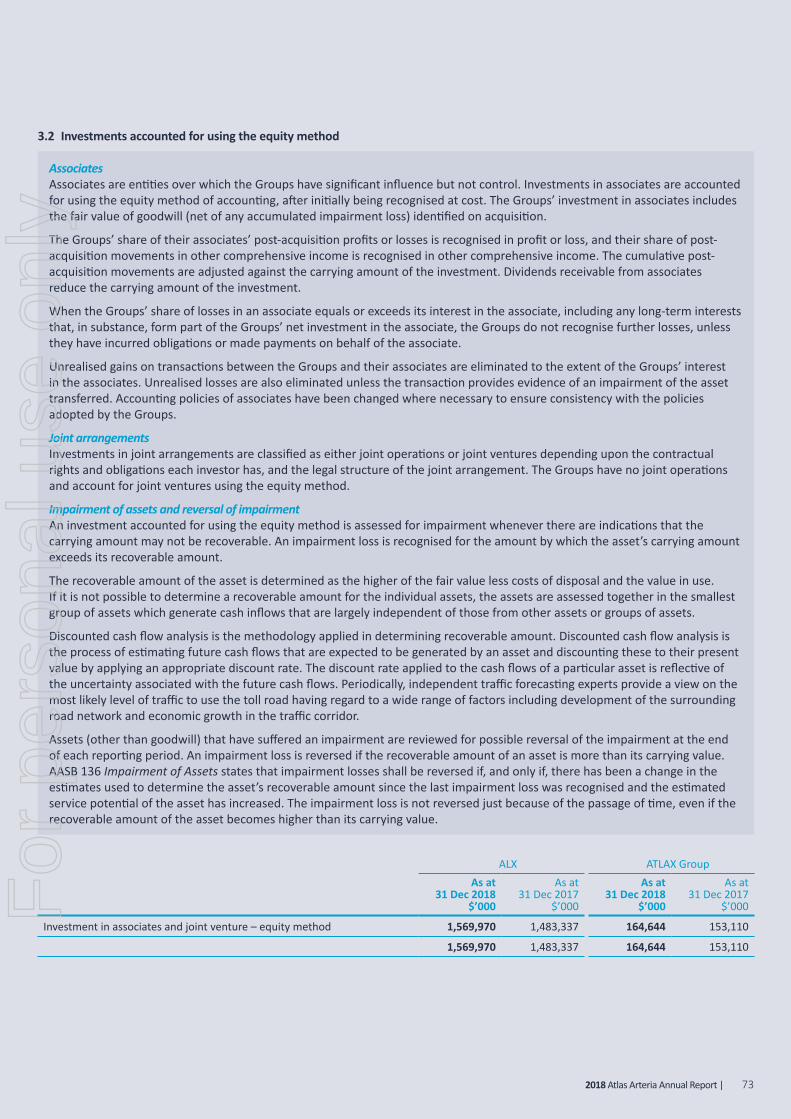
2018 Atlas Arteria Annual Report |
3.2 Investments accounted for using the equity method
AssociatesAssociates are entities over which the Groups have significant influence but not control. Investments in associates are accounted for using the equity method of accounting, after initially being recognised at cost. The Groups’ investment in associates includes the fair value of goodwill (net of any accumulated impairment loss) identified on acquisition.
The Groups’ share of their associates’ post-acquisition profits or losses is recognised in profit or loss, and their share of post-acquisition movements in other comprehensive income is recognised in other comprehensive income. The cumulative post-acquisition movements are adjusted against the carrying amount of the investment. Dividends receivable from associates reduce the carrying amount of the investment.
When the Groups’ share of losses in an associate equals or exceeds its interest in the associate, including any long-term interests that, in substance, form part of the Groups’ net investment in the associate, the Groups do not recognise further losses, unless they have incurred obligations or made payments on behalf of the associate.
Unrealised gains on transactions between the Groups and their associates are eliminated to the extent of the Groups’ interest in the associates. Unrealised losses are also eliminated unless the transaction provides evidence of an impairment of the asset transferred. Accounting policies of associates have been changed where necessary to ensure consistency with the policies adopted by the Groups.
Joint arrangementsInvestments in joint arrangements are classified as either joint operations or joint ventures depending upon the contractual rights and obligations each investor has, and the legal structure of the joint arrangement. The Groups have no joint operations and account for joint ventures using the equity method.
Impairment of assets and reversal of impairmentAn investment accounted for using the equity method is assessed for impairment whenever there are indications that the carrying amount may not be recoverable. An impairment loss is recognised for the amount by which the asset’s carrying amount exceeds its recoverable amount.
The recoverable amount of the asset is determined as the higher of the fair value less costs of disposal and the value in use. If it is not possible to determine a recoverable amount for the individual assets, the assets are assessed together in the smallest group of assets which generate cash inflows that are largely independent of those from other assets or groups of assets.
Discounted cash flow analysis is the methodology applied in determining recoverable amount. Discounted cash flow analysis is the process of estimating future cash flows that are expected to be generated by an asset and discounting these to their present value by applying an appropriate discount rate. The discount rate applied to the cash flows of a particular asset is reflective of the uncertainty associated with the future cash flows. Periodically, independent traffic forecasting experts provide a view on the most likely level of traffic to use the toll road having regard to a wide range of factors including development of the surrounding road network and economic growth in the traffic corridor.
Assets (other than goodwill) that have suffered an impairment are reviewed for possible reversal of the impairment at the end of each reporting period. An impairment loss is reversed if the recoverable amount of an asset is more than its carrying value. AASB 136 Impairment of Assets states that impairment losses shall be reversed if, and only if, there has been a change in the estimates used to determine the asset’s recoverable amount since the last impairment loss was recognised and the estimated service potential of the asset has increased. The impairment loss is not reversed just because of the passage of time, even if the recoverable amount of the asset becomes higher than its carrying value.
ALX ATLAX GroupAs at
31 Dec 2018$’000
As at31 Dec 2017
$’000
As at31 Dec 2018
$’000
As at31 Dec 2017
$’000
Investment in associates and joint venture – equity method 1,569,970 1,483,337 164,644 153,110
1,569,970 1,483,337 164,644 153,110
73
For
per
sona
l use
onl
y

| 2018 Atlas Arteria Annual Report
Notes to the Financial Reports continuedfor the year ended 31 December 2018
3 Cash and investments continued
3.2 Investments accounted for using the equity method continuedInformation relating to associates and joint arrangements is set out below:
a) Carrying amounts
ALX Economic
Interest ALX
ATLAX Economic Interest ATLAX Group
Name of Entity1,2
Country of Incorporation/ Principal Place of Business Principal Activity
As at 31 Dec 2018
and31 Dec 2017
%
As at31 Dec 2018
$’000
As at31 Dec 2017
$’000
As at 31 Dec 2018
and31 Dec 2017
%
As at31 Dec 2018
$’000
As at31 Dec 2017
$’000
MAF23 Luxembourg Investment in toll road network located in the east of France (APRR)
50.0/50.0 1,569,953 1,483,327 –/– – –
TRIP II4 USA Investment in toll road located in northern Virginia, USA
–/– – – 13.4/13.4 164,627 153,100
WQG5 Germany Investment in toll road located in Rostock, north-eastern Germany
–/70.0 – – –/– – –
Chicago Skyway Partnership (“CSP”)6
USA Former owner of an investment in toll road located south of Chicago, USA
50.0/50.0 14 10 50.0/50.0 14 10
Indiana Toll Road Partnership (“ITRP”)7
USA Former owner of an investment in toll road located in northern Indiana, USA
49.0/49.0 3 – 49.0/49.0 3 –
1,569,970 1,483,337 164,644 153,110
1. TRIP II and WQG are in “lockup” under their debt documents, meaning that they are currently unable to make distributions to ALX and the ATLAX Group. ALX and ATLAX Group’s investment in TRIP II cannot come out of lockup before December 2019.
2. All associates and joint arrangements have 31 December year end reporting requirements except for MAF2 which has 31 March.3. ALX’s investment in MAF2 is classified as an associate as any decision made with regard to the relevant activities requires 85% of the voting members to proceed, meaning at least 85%
of shareholders must agree before any decision can be reached.4. The ATLAX Group has a 13.4% interest in TRIP II, the concessionaire for Dulles Greenway, and is accounted for as an equity accounted associate. ALX has a 100% estimated economic
interest in TRIP II after combining ATLAX Group’s 13.4% equity interest with ATLIX Group’s 86.6% economic interest. Accordingly, TRIP II is accounted for as subsidiary of ALX.5. On 15 August 2018, ALX announced that it had entered into an agreement to acquire the remaining 30% equity interest and shareholder loan in WQG for €3.7 million as gross
consideration prior to adjusting for applicable transaction taxes. Financial close for the acquisition was reached on 20 September 2018 (“WQG Acquisition Date”). Following the acquisition, WQG is accounted for as a subsidiary and its results consolidated from the WQG Acquisition Date. As such it is no longer accounted for as a joint venture. Refer note 6.2 for details.
6. At 31 December 2018, ALX legally owned a 50% equity interest in CSP, the former owner of the Chicago Skyway toll road, but was no longer exposed to any variable returns from the ongoing operation of the toll road. The small residual investment balance represents cash left in CSP for payment of expenses.
7. At 31 December 2018, ALX legally owned a 49% equity interest in ITRP, the former owner of the Indiana Toll Road, but was no longer exposed to any variable returns from the ongoing operations of the toll road. The small residual investment balance represents cash left in ITRP for payment of expenses.
74
For
per
sona
l use
onl
y

2018 Atlas Arteria Annual Report |
b) Movement in carrying amounts
ALX ATLAX GroupYear ended
31 Dec 2018$’000
Year ended31 Dec 2017
$’000
Year ended31 Dec 2018
$’000
Year ended31 Dec 2017
$’000
Carrying amount at the beginning of the year 1,483,337 950,912 153,110 19,972
Investment in associates (including transaction costs)1 – 673,121 – 160,963
Share of profits/(losses) after income tax 246,141 187,971 (4,801) (626)
Distributions received (249,417) (147,779) – –
Gain on revaluation of joint venture/associate 13,470 375,615 – 61,710
Derecognition of joint venture/associate (13,470) (598,891) – (80,552)
Foreign exchange movement 89,909 42,388 16,335 (8,357)
Carrying amount at the end of the year2 1,569,970 1,483,337 164,644 153,110
1. On 24 October 2017, ALX acquired an additional 9.72% interest in MAF2 with a final purchase price of €439.9 million. On 16 May 2017, ALX acquired the remaining 50% estimated economic interest in TRIP II for US$445.0 million. Refer footnote 4 of note 3.2(a) for details of ATLAX’s investment in TRIP II.
2. The gain on revaluation of joint venture in 2018 of $13.5 million relates to revaluation of ALX’s investment in WQG on acquisition of the additional stake. Refer note 6.2 for detail. The gain on revaluation of associate in 2017 of $375.6 million and $61.7 million for ALX and ATLAX Group respectively relates to the revaluation of the Groups’ investment in Dulles Greenway on acquisition of their additional stakes in the prior year.
c) Summarised financial information for material associatesThe following tables provide summarised financial information for those associates that are material to the Groups. The information disclosed reflects the amounts presented in the Financial Reports of the relevant entities and not the Groups’ share of those amounts. They have been amended to reflect adjustments made by the Groups when using the equity method, including fair value adjustments and modifications for differences in accounting policy.
MAF21 TRIP II
Summarised Statement of Financial Position
As at31 Dec 2018
$’000
As at31 Dec 2017
$’000
As at31 Dec 2018
$’000
As at31 Dec 2017
$’000
Total current assets 1,098,238 1,691,692 117,034 83,816
Total non-current assets 9,721,036 9,411,522 2,603,485 2,400,788
Total current liabilities (1,870,916) (2,001,664) (83,568) (81,563)
Total non-current liabilities (7,064,727) (7,323,317) (1,411,403) (1,263,312)
Net assets 1,883,631 1,778,233 1,225,548 1,139,729
Reconciliation to carrying amounts:
Opening net assets 1,778,233 1,604,518 1,139,729 1,197,640
Profit/(loss) for the year 492,192 454,177 (35,774) (48)
Distributions paid (498,753) (366,826) – –
Foreign exchange and other equity movements 111,959 86,364 121,593 (57,863)
Closing net assets 1,883,631 1,778,233 1,225,548 1,139,729
ALX’s share in % 50.0% 50.0% – –
ALX’s share of net assets in $ 941,967 889,260 – –
ATLAX Group’s share in % – – 13.4% 13.4%
ATLAX Group’s share of net assets in $ – – 164,627 153,100
ALX’s carrying amount 1,569,953 1,483,327 – –
ATLAX Group’s carrying amount – – 164,627 –
1. MAF2 proportionately consolidates the results of APRR. APRR has performed an assessment of the impact of IFRS 9 Financial Instruments and IFRS 15 Revenue from Contracts with Customers and has determined that the adoption of these standards at 1 January 2018 has not had a material impact on the results of APRR.
75
For
per
sona
l use
onl
y
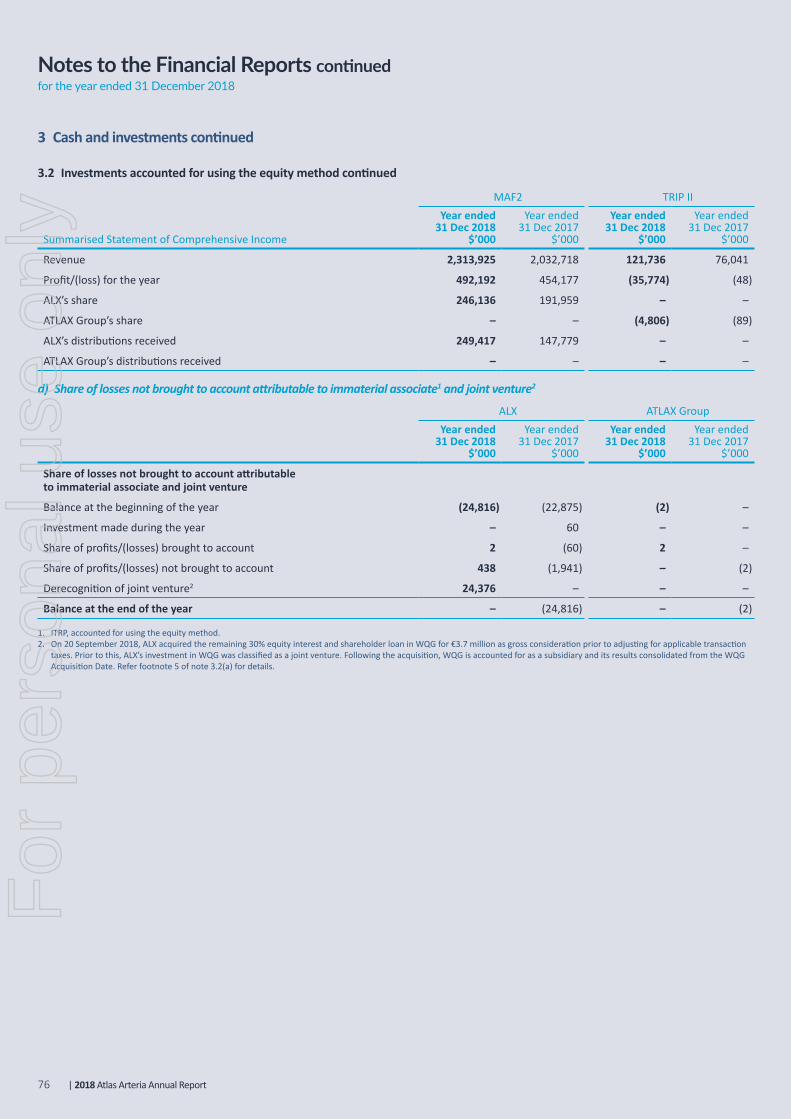
| 2018 Atlas Arteria Annual Report
Notes to the Financial Reports continuedfor the year ended 31 December 2018
3 Cash and investments continued
3.2 Investments accounted for using the equity method continued
MAF2 TRIP II
Summarised Statement of Comprehensive Income
Year ended31 Dec 2018
$’000
Year ended31 Dec 2017
$’000
Year ended31 Dec 2018
$’000
Year ended31 Dec 2017
$’000
Revenue 2,313,925 2,032,718 121,736 76,041
Profit/(loss) for the year 492,192 454,177 (35,774) (48)
ALX’s share 246,136 191,959 – –
ATLAX Group’s share – – (4,806) (89)
ALX’s distributions received 249,417 147,779 – –
ATLAX Group’s distributions received – – – –
d) Share of losses not brought to account attributable to immaterial associate1 and joint venture2
ALX ATLAX GroupYear ended
31 Dec 2018$’000
Year ended31 Dec 2017
$’000
Year ended31 Dec 2018
$’000
Year ended31 Dec 2017
$’000
Share of losses not brought to account attributable to immaterial associate and joint venture
Balance at the beginning of the year (24,816) (22,875) (2) –
Investment made during the year – 60 – –
Share of profits/(losses) brought to account 2 (60) 2 –
Share of profits/(losses) not brought to account 438 (1,941) – (2)
Derecognition of joint venture2 24,376 – – –
Balance at the end of the year – (24,816) – (2)
1. ITRP, accounted for using the equity method.2. On 20 September 2018, ALX acquired the remaining 30% equity interest and shareholder loan in WQG for €3.7 million as gross consideration prior to adjusting for applicable transaction
taxes. Prior to this, ALX’s investment in WQG was classified as a joint venture. Following the acquisition, WQG is accounted for as a subsidiary and its results consolidated from the WQG Acquisition Date. Refer footnote 5 of note 3.2(a) for details.
76
For
per
sona
l use
onl
y

2018 Atlas Arteria Annual Report |
4 Other balance sheet assets and liabilities4.1 Intangible assets – Tolling concessions
Intangible assets – Tolling concessionsTolling concessions are intangible assets and represent the right to levy tolls in respect of controlled motorways. Tolling concessions relating to the non-controlled investments are recognised as a component of the investments accounted for using the equity method.
Tolling concessions have a finite useful life by the terms of the concession arrangement and are carried at cost which represents the fair value of the consideration paid on acquisition less accumulated amortisation. Amortisation is calculated using the straight-line method to allocate the cost of tolling concessions over their estimated useful lives which are as follows:
Asset description Estimated useful life1 Amortisation basis
Dulles Greenway Period to February 2056 Straight-line basis
Warnow Tunnel Period to September 2053 Straight-line basis
APRR2 Period to November 2035 Straight-line basis
ADELAC2 Period to December 2060 Straight-line basis
1. There has been no change to the estimated useful life during the year.2. The tolling concessions in relation to the non-controlled investments are not recognised on the statement of financial position but instead form part of investments accounted for
using the equity method. The amortisation of tolling concessions in relation to the non-controlled investments is included in the share of net profit of investments accounted for using the equity method.
ImpairmentTolling concessions with a finite useful life are assessed for impairment whenever there are indications that the carrying amount may not be recoverable. An impairment loss is recognised for the amount by which the asset’s carrying amount exceeds its recoverable amount. Refer note 3.2 for additional detail on the accounting policy for impairment of assets and reversal of impairment.
ALX ATLAX GroupYear ended
31 Dec 2018$’000
Year ended31 Dec 2017
$’000
Year ended31 Dec 2018
$’000
Year ended31 Dec 2017
$’000
Balance at the beginning of the year 2,189,724 – – –
Acquisition cost1 214,772 2,339,025 – –
Amortisation of tolling concession (61,768) (36,520) – –
Foreign exchange movement 235,706 (112,781) – –
Balance at the end of the year 2,578,434 2,189,724 – –
1. In the current year, a tolling concession of $214.8 million was recognised following the acquisition of the remaining 30% equity interest in WQG. In the prior year, a tolling concession of $2,339.0 million was recognised following the acquisition of the remaining 50% estimated economic interest in TRIP II.
77
For
per
sona
l use
onl
y

| 2018 Atlas Arteria Annual Report
Notes to the Financial Reports continuedfor the year ended 31 December 2018
4 Other balance sheet assets and liabilities continued
4.2 Goodwill
GoodwillGoodwill represents the excess of the consideration paid over the fair value of the identifiable net assets of the acquired entity at the date of acquisition. Goodwill arising from business combinations is included on the face of the statement of financial position. Goodwill arising from acquisitions of associates is included in the carrying amount of investments in associates.
ImpairmentGoodwill is not subject to amortisation but is tested annually for impairment, or more frequently if events or changes in circumstances indicate that the carrying amount may not be recoverable. The recoverable amount of a cash generating unit (“CGU”) is determined based on fair value less costs of disposal calculations which requires the use of assumptions. The calculations use detailed cash flow projections covering the remaining concession life of the CGU.
Refer note 3.2 for additional detail on the accounting policy for impairment.
ALX ATLAX GroupYear ended
31 Dec 2018$’000
Year ended31 Dec 2017
$’000
Year ended31 Dec 2018
$’000
Year ended31 Dec 2017
$’000
Balance at the beginning of the year 58,726 – – –
Acquisition cost1 14,193 61,712 – –
Foreign exchange movement 6,471 (2,986) – –
Balance at the end of the year 79,390 58,726 – –
1. In the current year, goodwill of $14.2 million was recognised as a result of the deferred tax liability calculated on concession rights value following the acquisition of the remaining 30% equity interest in WQG. Refer note 6.2 for details. In prior year, goodwill of $61.7 million was recognised as a result of the deferred tax liability calculated on concession rights value following the acquisition of the remaining 50% estimated economic interest in TRIP II.
Key assumptions used for fair value less costs of disposal calculations – Dulles Greenway
Assumption Approach used to determine values
Traffic volume Based on the Groups’ internal long-term traffic forecasts (which were informed by independent third party analysis conducted as part of the acquisition of the additional 50% estimated economic interest in TRIP II). Traffic forecasts for TRIP II are based on assumptions of traffic growth broadly in line with economic development and population growth within its catchment area.
Long-term CPI (% annual growth)
Based on the Group’s long-term internal forecasts and independent third-party projections, long-term CPI rates are forecast to grow by between 2.2% and 2.3%.
Average toll (% annual growth)
Based on current regulation and the Group’s long-term internal forecasts. Toll rates for TRIP II were determined by decisions of the State Corporations Commission (SCC) from the road’s inception until 31 December 2012. The legislation governing the SCC’s decisions stipulates that toll rates must be set at a level that:• Will provide the operator with no more than a reasonable rate of return as determined by the SCC;• Is reasonable to the user in relation to the benefit obtained; and• Will not materially discourage use of the roadway by the public.
From 1 January 2013 to 1 January 2020, toll rates for TRIP II were determined by a legislated formula that specified that rates would increase annually at the highest of CPI+1%, real GDP or 2.8%. From 2020, the SCC will again determine the rates under the legislative framework that was used pre-2013. The Groups’ long-term assumption forecasts toll rates to escalate in a range in line within the historical experience from inception to 1 January 2020. However, historical results provide no guarantee as new legislation or regulatory decisions could impact future outcomes.
Post-tax discount rate
Detailed cash flows were discounted using an equity discount rate of 9%. The discount rate is based on a number of factors including, but not limited to, the asset’s nature of operations, regulatory environment, macroeconomic conditions, risk profile and observed market prices for similar transactions.
78
For
per
sona
l use
onl
y

2018 Atlas Arteria Annual Report |
Impact of possible changes in key assumptionsThe assets and liabilities associated with the CGU were initially recognised in ALX’s balance sheet at their fair values on the dates on which ALX achieved control of the CGU. Since the step-up acquisition of TRIP II in 2017, actual traffic experience has been lower than initially forecast, however the estimated fair value of that investment, as at the current reporting date, remains in line with its carrying value. As such, an adverse change in any of the key assumptions could result in the recoverable amount of the CGU falling below its carrying amount. For example, an increase in the discount rate applied to the TRIP II valuation of 0.5% would lead to a reduction in the asset’s carrying value by $96m.
The assumptions used in the fair value less costs of disposal calculation are measured at Level 3 in the fair value hierarchy (refer Note 5.4 for additional detail on the fair value hierarchy).
4.3 Other assets
ReceivablesReceivables are initially recognised at fair value and subsequently measured at amortised cost because their cash flows represent solely payments of principal and interest. Interest income from loans and receivables is recognised on an accruals basis.
Receivables are generally received within 30 days of becoming due and receivable. A provision is raised for any doubtful debts based on a review of all outstanding amounts at year end. Bad debts are written off in the year in which they are identified.
ImpairmentThe Groups were required to revise their impairment methodology under AASB 9 for loan assets carried at amortised cost. The impact of the change in impairment methodology resulted in a loss allowance through the Groups’ retained earnings at 1 January 2018 was $0.3 million (refer note 7.5(e)). The Groups assess, on a forward looking basis, the expected credit losses associated with their loan assets carried at amortised cost. The impairment methodology applied depends on whether there has been a significant increase in credit risk.
The loss allowances for financial assets are based on assumptions about risk of default and expected loss rates. The Groups use judgement in making these assumptions and selecting the inputs to the impairment calculation, based on the Groups’ past history, existing market conditions as well as forward looking estimates at the end of each reporting period.
ALX ATLAX GroupYear ended
31 Dec 2018$’000
Year ended31 Dec 2017
$’000
Year ended31 Dec 2018
$’000
Year ended31 Dec 2017
$’000
Current
Receivables from related parties – – 46,510 1,892
Less: Loss allowance – – (108) –
Prepayments 723 724 125 116
Tax receivable 279 188 279 188
Trade receivables and other assets 1,493 430 531 –
Total current other assets 2,495 1,342 47,337 2,196
Non-current
Receivables from related parties – – 8,232 122,812
Less: Loss allowance – – (18) –
Prepayments 120 140 60 70
Other assets 199 – – –
Total non-current other assets 319 140 8,274 122,882
The Groups’ maximum credit exposure for receivables is the carrying value. Discussion of the Groups’ policies concerning the management of credit risk can be found in Note 5.4. The fair values of receivables approximate their carrying values.
79
For
per
sona
l use
onl
y

| 2018 Atlas Arteria Annual Report
Notes to the Financial Reports continuedfor the year ended 31 December 2018
4 Other balance sheet assets and liabilities continued
4.4 Other liabilities
Payables and other liabilitiesLiabilities are recognised when an obligation exists to make future payments as a result of a purchase of assets or services, whether or not billed. Trade creditors are generally settled within 30 days.
ProvisionsProvisions are recognised when: the Groups have a present legal or constructive obligation as a result of past events; it is probable that an outflow of resources will be required to settle the obligations; and the amount can be reliably estimated. Provisions are not recognised for future operating losses.
Provisions are measured at the present value of management’s best estimate of the expenditure required to settle the present obligation at the end of the reporting period. The discount rate used to determine the present value is a pre-tax rate that reflects current market assessments of the time value of money and the risks specific to the liability.
Employee benefits(i) Short-term obligationLiabilities for salaries, including non-monetary benefits and leaves that are expected to be settled wholly within 12 months after the end of the period in which the employees render the related service are recognised in respect of employees’ services up to the end of the reporting period and are measured at the amounts expected to be paid when the liabilities are settled.
(ii) Share-based paymentsShare-based compensation benefits are provided to employees via the Long-Term Incentive Plan (LTI Plan). Information relating to this plan is set out in note 7.4.
The fair value of performance rights granted under the LTI Plan is recognised as an employee benefits expense with a corresponding increase in equity. The total amount to be expensed is determined by reference to the fair value of the performance rights granted including the market performance conditions and the number of equity instruments expected to vest.
The total expense is recognised over the vesting period, which is the period over which all of the specified vesting conditions are to be satisfied. At the end of each period, the Group revises its estimates of the number of performance rights that are expected to vest based on the non-market vesting and service conditions. It recognises the impact of the revision to original estimates, if any, in profit or loss, with a corresponding adjustment to equity.
Performance feesHistorically, performance fees have been payable at 30 June each year in the event that the ALX security price outperforms its benchmark in that year after making up any carried forward underperformance. The performance fee is calculated with reference to the performance of the ALX accumulated index compared with the performance of the S&P/ASX 300 Industrials Accumulation Index. As a result of the agreement to internalise management, the performance fee that has become payable at 30 June 2018 will be the last performance fee to be paid.
The performance fee at 30 June 2018 was determined in accordance with, and due to, the renegotiated management agreements as follows:• The third instalment of the 2016 performance fee and second instalment of the 2017 performance fee were subject to
performance testing and became payable after outperforming their respective performance hurdles at 30 June 2018;• The third instalment of the 2017 performance fee became payable without further testing as on renegotiation of the
management agreements, instalments of performance fees that would be subject to testing in future years became payable immediately at 30 June 2018, regardless of whether respective performance criteria has been met; and
• The 2018 performance fee was calculated at 30 June 2018 based on outperformance of the benchmark and became payable in full at that time.
Performance fees payable are accounted for as a liability in accordance with AASB 9. The liability is recognised at its fair value upon initial and subsequent recognition.
80
For
per
sona
l use
onl
y

2018 Atlas Arteria Annual Report |
ALX ATLAX GroupAs at
31 Dec 2018$’000
As at 31 Dec 2017
$’000
As at31 Dec 2018
$’000
As at31 Dec 2017
$’000
Current
Manager and adviser performance fees payable1 – 44,689 – 4,337
Manager and adviser fees payable 9,063 8,939 471 707
Provision for toll maintenance 14,987 5,509 – –
Sundry creditors and accruals 8,288 4,183 2,905 1,332
Tax payable 2,521 7 22 –
Total current other liabilities 34,859 63,327 3,398 6,376
Non-current
Easement accruals2 11,571 9,754 – –
Total non-current other liabilities 11,571 9,754 – –
1. For the year ended 30 June 2018, a total performance fee of $54.7 million (excluding GST) was calculated for ALX (30 June 2017: $23.9 million). In accordance with, and due to the renegotiation of, the management agreements, the full 2018 performance fee became payable at 30 June 2018. Accordingly, the full 2018 performance fee was recognised as at 30 June 2018.
The second instalment of the 2017 performance fee of $8.0 million (excluding GST) and third instalment of the 2016 performance fee of $44.7 million (excluding GST) became payable at 30 June 2018 due to outperformance of the benchmark. The third instalment of the 2017 performance fee of $8.0 million (excluding GST) became payable at 30 June 2018 in accordance with, and due to the renegotiation of, the management agreements.
On 2 July 2018, MFA and ALX’s independent directors agreed that the total performance fee of $115.3 million (excluding GST) be settled by a combination of equity and cash. Accordingly, $90.3 million was applied to a subscription for new ALX securities and the remaining $25.0 million was settled in cash in July 2018.
2. TRIP II has an agreement with the Metropolitan Washington Airports Authority (“MWAA”) for easements over Washington Dulles International Airport property necessary to construct, operate and maintain the toll road. The minimum annual payments are accrued using the straight-line method based upon the total minimum payments to be made over the term of the agreement. Additional payments may be due under the agreement should the toll road exceed certain specified traffic volumes.
5 Capital and risk management5.1 Debt at amortised cost
Financial liabilitiesFinancial liabilities are initially recorded at fair value plus directly attributable transaction costs and thereafter at amortised cost using the effective interest method.
ALX ATLAX GroupAs at
31 Dec 2018$’000
As at 31 Dec 2017
$’000
As at 31 Dec 2018
$’000
As at 31 Dec 2017
$’000
Current
Non-recourse TRIP II bonds and accrued interest thereon (a) 73,595 64,585 – –
Non-recourse WQG borrowings and accrued interest thereon (b) 3,696 – – –
Accrued interest on borrowings from financial institutions (c) 31 1,701 – –
Total current debt at amortised cost 77,322 66,286 – –
Non-current
Non-recourse TRIP II bonds and accrued interest thereon (a) 1,356,286 1,222,979 – –
Non-recourse WQG borrowings and accrued interest thereon (b) 180,730 – – –
Borrowings from financial institutions (c) 564,946 445,373 – –
Total non-current debt at amortised cost 2,101,962 1,668,352 – –
81
For
per
sona
l use
onl
y

| 2018 Atlas Arteria Annual Report
Notes to the Financial Reports continuedfor the year ended 31 December 2018
5 Capital and risk management continued
5.1 Debt at amortised cost continued(a) Non-recourse TRIP II bondsThe ALX consolidated financial statements incorporate bonds raised by TRIP II to finance the construction of infrastructure assets. These bonds are non-recourse beyond the TRIP II assets and ALX has no commitments to provide further debt or equity funding to TRIP II in order to meet these liabilities.
All of these bonds are in the form of fixed interest rate senior bonds, with US$35.0 million of current interest bonds and US$971.2 million of zero coupon bonds with maturities extending to 2056.
(b) Non-recourse WQG borrowingsThe ALX consolidated financial statements incorporate borrowings raised by WQG to finance the construction of infrastructure assets. These borrowings are non-recourse beyond the WQG assets and ALX has no commitments to provide further debt or equity funding to WQG in order to meet these liabilities. The borrowings are payable in three tranches with maturities extending to 2040.
(c) Borrowings from financial institutions(i) New APRR asset finance facility On 31 May 2018, ALX repaid the previous APRR asset finance facility of €150.0 million using a new APRR facility of €350.0 million negotiated with revised terms. On 4 June 2018, a portion of the additional proceeds was used to repay the US$175.0 million Dulles Greenway asset finance facility along with accrued interest up to this date. Residual proceeds from the new APRR asset finance facility will be used for general corporate expenses.
ALX incurred upfront issue costs of €4.0 million ($6.2 million), of which, €1.8 million ($2.8 million) has been amortised to 31 December 2018. Unamortised debt raising costs of €1.7 million ($2.6 million) on the previous APRR asset finance facility and US$3.1 million ($4.1 million) on the Dulles Greenway asset finance facility have been expensed to finance costs in the income statement (refer note 2.1(c) for details).
The maturity date of the new facility remains the same as the previous APRR asset finance facility, i.e. 24 October 2024. Interest accrues on the borrowing at the aggregate of the margin and EURIBOR. Key changes to the margin rates are set out below:
Periods Margin (Previous APRR facility) Margin (New APRR facility)
From 24 Oct 2017 to 23 Oct 2019 2.25% per annum 2.25% per annum
From 24 Oct 2019 to 23 Oct 2021 2.50% per annum 2.25% per annum
From 24 Oct 2021 to 23 Oct 2022 2.75% per annum 2.25% per annum
From 24 Oct 2022 to 23 Oct 2023 3.25% per annum 2.75% per annum
From 24 Oct 2023 to 23 Oct 2024 3.75% per annum 3.25% per annum
(ii) Previous APRR asset finance facilityIn October 2017, ALX drew down €150.0 million of a seven-year, senior secured facility to facilitate the acquisition of a 9.72% stake in MAF2 and incurred interest and amortisation expense of €4.0 million ($6.2 million) up to the date of refinancing during the current year.
(iii) Dulles Greenway asset finance facilityIn May 2017, ALX drew down US$175.0 million of an eight-year bullet financing facility to facilitate the acquisition of the remaining 50% stake in TRIP II and incurred interest, amortisation expense and early repayment fee of US$12.1 million ($15.7 million) up to the date of repayment during the current year.
82
For
per
sona
l use
onl
y

2018 Atlas Arteria Annual Report |
5.2 Contributed equity
Attributable to ATLIX equity holders
Attributable to ATLAX equity holders
As at31 Dec 2018
$’000
As at31 Dec 2017
$’000
As at31 Dec 2018
$’000
As at31 Dec 2017
$’000
Ordinary shares 1,995,994 1,911,877 197,311 268,334
Contributed equity 1,995,994 1,911,877 197,311 268,334
On issue at the beginning of the year 1,911,877 1,323,651 268,334 213,245
Issue of Placement securities1 – 168,054 – 14,021
Issue of Security Purchase Plan securities1 – 20,165 – 1,682
Application of performance fees to subscription for new securities2 84,117 48,585 6,186 4,054
Issue of Institutional entitlement securities1 – 329,257 – 28,541
Issue of Retail entitlement securities1 – 78,313 – 6,791
Capital return – (56,148) (77,209) –
On issue at the end of the year 1,995,994 1,911,877 197,311 268,334
1. Net of transaction costs.2. During the year ended 31 December 2018, $90.3 million of the full 2018 performance fee, the second and third instalments of the 2017 performance fee and the third instalment
of June 2016 performance fee (31 December 2017: first instalment of the June 2017 performance fee and second instalment of the June 2016 performance fee) was applied to a subscription for new ATLAX and ATLIX securities, the remaining $25.0 million of performance fees was settled in cash.
Attributable to ATLIX equity holders
Attributable to ATLAX equity holders
Year ended31 Dec 2018
Year ended31 Dec 2017
Year ended31 Dec 2018
Year ended31 Dec 2017
Number of shares
’000
Number of shares
’000
Number of shares
’000
Number of shares
’000
On issue at the beginning of the year 669,789 530,130 669,789 530,130
Issue of Placement securities – 38,144 – 38,144
Issue of Security Purchase Plan securities – 4,664 – 4,664
Application of performance fees to subscription for new securities1 13,476 8,942 13,476 8,942
Issue of Institutional entitlement securities – 70,994 – 70,994
Issue of Retail entitlement securities – 16,915 – 16,915
On issue at the end of the year 683,265 669,789 683,265 669,789
1. During the year ended 31 December 2018, full 2018 performance fee, the second and third instalments of the 2017 performance fee and the third instalment of June 2016 performance fee (31 December 2017: first instalment of the June 2017 performance fee and second instalment of the June 2016 performance fee) were applied to a subscription for new ATLAX and ATLIX securities.
Ordinary shares in ATLIX and in ATLAXEach fully paid stapled security confers the right to vote at meetings of securityholders, subject to any voting restrictions imposed on a securityholder under the Corporations Act 2001 in Australia, Companies Act in Bermuda and the ASX Listing Rules. On a show of hands, every securityholder present in person or by proxy has one vote.
On a poll, every securityholder who is present in person or by proxy has one vote for each fully paid share in respect of ATLIX and one vote for each fully paid share in respect of ATLAX.
The directors of ATLIX and ATLAX may declare distributions which are appropriate given the financial position of ATLIX and ATLAX.
If ATLIX and ATLAX are wound up, the liquidator may, with the sanction of an extraordinary resolution and any other requirement of law, divide among the securityholders in specie or in kind the whole or any part of the assets of ATLIX and ATLAX.
83
For
per
sona
l use
onl
y

| 2018 Atlas Arteria Annual Report
Notes to the Financial Reports continuedfor the year ended 31 December 2018
5 Capital and risk management continued
5.3 Reserves
Attributable to ATLIX equity holders
Attributable to ATLAX equity holders
As at31 Dec 2018
$’000
As at31 Dec 2017
$’000
As at31 Dec 2018
$’000
As at31 Dec 2017
$’000
Balance of reserve
Foreign currency translation reserve 190,155 28,122 (7,669) (24,216)
Other reserve1 – – 141 –
Balance at the end of the year 190,155 28,122 (7,528) (24,216)
1. Refer note 7.4 for details.
Attributable to ATLIX equity holders
Attributable to ATLAX equity holders
Year ended31 Dec 2018
$’000
Year ended31 Dec 2017
$’000
Year ended31 Dec 2018
$’000
Year ended31 Dec 2017
$’000
Movements of reserves
Foreign currency translation reserve
Balance at the beginning of the year 28,122 58,679 (24,216) (6,979)
Net exchange differences on translation of foreign controlled entities 161,955 (422) 16,547 (14,518)
Transfer to accumulated losses1 78 (30,135) – (2,719)
Balance at the end of the year 190,155 28,122 (7,669) (24,216)
Other reserve
Balance at the beginning of the year – (301) – (152)
Other equity transactions – 301 – 152
Employee performance rights2 – – 141 –
Balance at the end of the year – – 141 –
1. During the year ended 31 December 2018, foreign exchange translation gains in ATLIX Group of $0.1 million were transferred to accumulated losses from foreign currency translation reserves following the acquisition of the remaining 30% interest of WQG. These transfers arose as the increase in investment is treated as a disposal of the existing interest in joint venture. Refer note 6.2. for details.
During the year ended 31 December 2017, foreign exchange translation gains in ATLIX Group and ATLAX Group of $30.1 million and $2.7 million respectively were transferred to accumulated losses from foreign currency translation reserves following the acquisition of the remaining 50% estimated economic interest of TRIP II. These transfers arose as the increase in investment was treated as a disposal of the existing interest in associate.
2. Refer note 7.4 for details.
5.4 Financial risk and capital managementFinancial risk managementThe Groups’ activities expose them to a variety of financial risks: market risk (including foreign exchange risk and fair value interest rate risk), credit risk, liquidity risk and cash flow interest rate risk. The Groups’ overall risk management programme focuses on the unpredictability of financial markets and seeks to minimise potential adverse effects on financial performance of the Groups. The Groups use derivative financial instruments such as foreign exchange contracts to hedge certain risk exposures.
The Risk Management Policy and Framework is implemented by management under policies approved by the Boards. MFA identifies, quantifies and qualifies financial risks and provides written principles for overall risk management, as well as written policies covering specific areas, such as mitigating foreign exchange, interest rate and credit risks, use of derivative financial instruments and investing excess liquidity.
84
For
per
sona
l use
onl
y

2018 Atlas Arteria Annual Report |
Derivativesa) Classification of derivativesDerivatives are only used for economic hedging purposes and not as speculative investments. However, where derivatives do not meet the hedge accounting criteria, they are accounted for at fair value through profit or loss. They are presented as current assets or liabilities to the extent they are expected to be settled within 12 months after the end of the reporting period.
b) Fair value measurementFrom time to time, the Group enters into forward exchange contracts.
Derivatives are initially recognised at fair value at the date a derivative contract is entered into and are subsequently remeasured to their fair value at each reporting date.
The accounting for subsequent changes in fair value depends on whether or not derivatives are designated as in hedge accounting relationships. If hedge accounting is not designated, any changes in their fair value are recognised immediately in the Consolidated Statement of Comprehensive Income.
Market riska) Foreign exchange riskForeign exchange risk arises when recognised assets and liabilities and future commercial transactions are denominated in a currency that is not the entity’s functional currency. The risk is measured using sensitivity analysis and cash flow forecasting.
The Groups operate internationally and are exposed to foreign exchange risk mainly arising from currency exposures to the Euro (“EUR”) and United States Dollar (“USD”).
The Groups do not hedge the foreign exchange exposure on overseas investments.
Financial instruments are converted to Australian Dollars (“AUD”) at the rate of exchange ruling at the financial reporting date. Derivative instruments are valued with reference to forward exchange rates from the year end to settlement date, as provided by independent financial institutions.
In assessing foreign exchange risk, management has assumed the following possible movements in the AUD:• AUD/EUR exchange rate increased/decreased by 6 Euro cents (2017: 8 Euro cents)• AUD/USD exchange rate increased/decreased by 8 US cents (2017: 10 US cents)• AUD/GBP exchange rate increased/decreased by 6 UK pence (2017: 8 UK pence)
The below tables display the amounts for financial instruments that would be recognised in profit or loss or directly in equity if the movements in foreign exchange rates as outlined above occur. The Groups’ management have determined the above movements in the AUD to be a reasonably possible shift following analysis of foreign exchange volatility for relevant currencies over the last five years.
Foreign exchange riskAppreciation in Australian Dollar Depreciation in Australian Dollar
ALX
P&L 2018
$’000
P&L 2017
$’000
Equity 2018
$’000
Equity2017
$’000
P&L 2018
$’000
P&L 2017
$’000
Equity 2018
$’000
Equity2017
$’000
Total financial assets1 (1,185) (600) – – 1,448 779 – –
Total financial liabilities2 89 20 – – (112) (25) – –
Total (1,096) (580) – – 1,336 754 – –
Foreign exchange riskAppreciation in Australian Dollar Depreciation in Australian Dollar
ATLAX Group
P&L 2018
$’000
P&L 2017
$’000
Equity 2018
$’000
Equity2017
$’000
P&L 2018
$’000
P&L 2017
$’000
Equity 2018
$’000
Equity2017
$’000
Total financial assets1 (21) (82) – – 27 106 – –
Total financial liabilities2 32 3 – – (40) (3) – –
Total 11 (79) – – (13) 103 – –
1. Financial assets include cash, cash equivalents, restricted cash, receivables and derivative financial instruments.2. Financial liabilities include payables, debt at amortised cost and derivative financial instruments.
85
For
per
sona
l use
onl
y
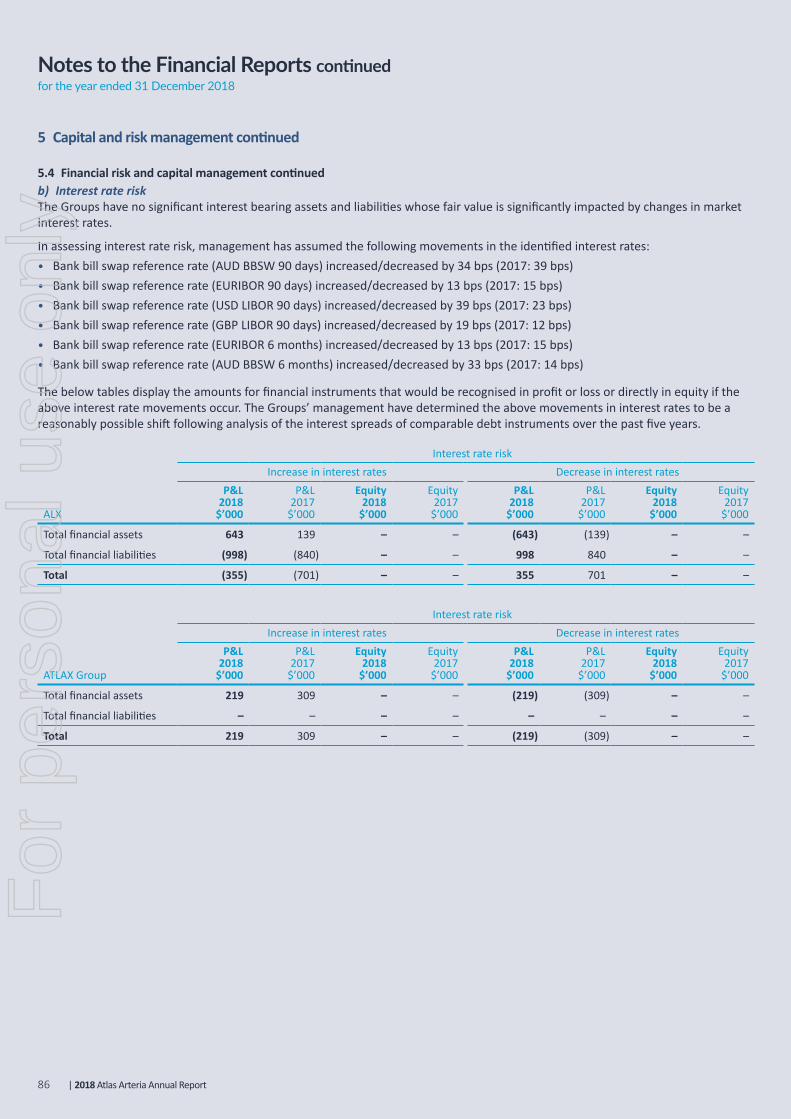
| 2018 Atlas Arteria Annual Report
Notes to the Financial Reports continuedfor the year ended 31 December 2018
5 Capital and risk management continued
5.4 Financial risk and capital management continuedb) Interest rate riskThe Groups have no significant interest bearing assets and liabilities whose fair value is significantly impacted by changes in market interest rates.
In assessing interest rate risk, management has assumed the following movements in the identified interest rates:• Bank bill swap reference rate (AUD BBSW 90 days) increased/decreased by 34 bps (2017: 39 bps)• Bank bill swap reference rate (EURIBOR 90 days) increased/decreased by 13 bps (2017: 15 bps)• Bank bill swap reference rate (USD LIBOR 90 days) increased/decreased by 39 bps (2017: 23 bps)• Bank bill swap reference rate (GBP LIBOR 90 days) increased/decreased by 19 bps (2017: 12 bps)• Bank bill swap reference rate (EURIBOR 6 months) increased/decreased by 13 bps (2017: 15 bps)• Bank bill swap reference rate (AUD BBSW 6 months) increased/decreased by 33 bps (2017: 14 bps)
The below tables display the amounts for financial instruments that would be recognised in profit or loss or directly in equity if the above interest rate movements occur. The Groups’ management have determined the above movements in interest rates to be a reasonably possible shift following analysis of the interest spreads of comparable debt instruments over the past five years.
Interest rate riskIncrease in interest rates Decrease in interest rates
ALX
P&L 2018
$’000
P&L 2017
$’000
Equity 2018
$’000
Equity2017
$’000
P&L 2018
$’000
P&L 2017
$’000
Equity 2018
$’000
Equity2017
$’000
Total financial assets 643 139 – – (643) (139) – –
Total financial liabilities (998) (840) – – 998 840 – –
Total (355) (701) – – 355 701 – –
Interest rate riskIncrease in interest rates Decrease in interest rates
ATLAX Group
P&L 2018
$’000
P&L 2017
$’000
Equity 2018
$’000
Equity2017
$’000
P&L 2018
$’000
P&L 2017
$’000
Equity 2018
$’000
Equity2017
$’000
Total financial assets 219 309 – – (219) (309) – –
Total financial liabilities – – – – – – – –
Total 219 309 – – (219) (309) – –
86
For
per
sona
l use
onl
y

2018 Atlas Arteria Annual Report |
Credit riskPotential areas of credit risk consist of deposits with banks and financial institutions as well as receivables from associates and governments. The Groups limit their exposure in relation to cash balances by only dealing with well-established financial institutions of high-quality credit standing. With the exception of the transactions between ATLIX and ATLAX, the Groups transact with independently rated parties with appropriate minimum short-term credit ratings. The Boards set exposure limits to financial institutions and these are monitored on an ongoing basis.
Sound credit risk management involves prudently managing the risk and reward relationship and controlling and minimising credit risks across a variety of dimensions, such as quality, concentration, maturity and security.
The below table sets out the counterparties with which the Groups transact and therefore provides an indication of the credit risk exposures.
ALX ATLAX GroupFinancial
institutions$’000
Corporates and others
$’000Total
$’000
Financial institutions
$’000
Corporates and others
$’000Total
$’000
2018
Cash and cash equivalents 186,468 – 186,468 12,461 – 12,461
Restricted cash 203,961 – 203,961 – – –
Receivables – current – 1,493 1,493 – 47,041 47,041
Receivables – non-current – – – – 8,232 8,232
Tax receivables – 279 279 – 279 279
Derivative financial instruments 2,900 – 2,900 – – –
Total 393,329 1,772 395,101 12,461 55,552 68,013
ALX ATLAX GroupFinancial
institutions$’000
Corporates and others
$’000Total
$’000
Financial institutions
$’000
Corporates and others
$’000Total
$’000
2017
Cash and cash equivalents 122,690 – 122,690 34,304 – 34,304
Restricted cash 153,440 – 153,440 – – –
Receivables – current – 430 430 – 1,892 1,892
Receivables – non-current – – – – 122,812 122,812
Tax receivables – 188 188 – 188 188
Total 276,130 618 276,748 34,304 124,892 159,196
Financial institutionsThe credit risk to financial institutions relates to cash held by and term deposits due from Australian and OECD banks. In line with the credit risk policies of the Groups these counterparties must meet a minimum Standard and Poor’s short-term credit rating of A-1 unless an exception is approved by the Boards.
Corporates and othersThe ALX and ATLAX Group credit risk relates primarily to receivables from related parties and governments. These counterparties have a range of credit ratings.
87
For
per
sona
l use
onl
y

| 2018 Atlas Arteria Annual Report
Notes to the Financial Reports continuedfor the year ended 31 December 2018
5 Capital and risk management continued
5.4 Financial risk and capital management continuedLiquidity riskPrudent liquidity risk management implies maintaining sufficient cash, the availability of funding through an adequate amount of committed credit facilities and the ability to close out market positions. The Groups have a liquidity management policy which manages liquidity risk by monitoring the stability of funding, surplus cash or highly liquid cash assets, anticipated cash in and outflows and exposure to connected parties.
The below table displays the forecast contractual undiscounted future cash outflows of the liabilities at balance date of ALX and the ATLAX Group.
ALX ATLAX Group
Financial Liabilities
Less than1 year$’000
1-2 years$’000
2-3 years$’000
3-5 years$’000
Greater than 5 years
$’000Total
$’000
Less than 1 year$’000
Total$’000
2018
Debt at amortised cost1 77,322 44,687 57,049 202,472 1,714,065 2,095,595 – –
Payables 34,859 – – – 11,571 46,430 3,398 3,398
Derivatives 3,108 2,942 2,744 4,802 3,007 16,603 – –
Total 115,289 47,629 59,793 207,274 1,728,643 2,158,628 3,398 3,398
2017
Debt at amortised cost1 66,286 65,180 35,855 130,878 1,436,439 1,734,638 – –
Payables 18,638 – – – 9,754 28,392 2,039 2,039
Total 84,924 65,180 35,855 130,878 1,446,193 1,763,030 2,039 2,039
1. Includes consolidated debt held by TRIP II and WQG that is non-recourse to ALX.
Fair value measurement of financial instrumentsThe fair value measurements of financial assets and liabilities are assessed in accordance with the following hierarchy.
(i) Level 1: Quoted prices (unadjusted) in active markets for identical assets and liabilities(ii) Level 2: Inputs other than quoted prices included within Level 1 that are observable for the asset or liability, either directly
(as prices) or indirectly (derived from prices), and(iii) Level 3: Inputs for the asset or liability that are not based on observable market data (unobservable valuation input).
ALX has derivative financial instruments that are measured at fair value on a recurring basis. These instruments are entered to minimise potential variations in cash flows resulting from fluctuations in interest rates and their impact on its variable-rate debt. The Company does not enter into derivative instruments for any purpose other than economic interest rate hedging. That is, the Company does not speculate using derivative instruments. They are presented as current assets or liabilities to the extent they are expected to be settled within 12 months after the end of the reporting period. These instruments are measured at Level 2 hierarchy and are revalued using externally provided dealer quotes.
The Groups’ policy is to recognise transfers into and transfers out of fair value hierarchy levels as at the end of the reporting period. There were no transfers in the current year.
The Groups do not measure any financial assets or financial liabilities at fair value on a non-recurring basis.
Fair values of other financial instruments (unrecognised)The Groups also have a number of financial instruments that are not measured at fair value in the balance sheet. With the exception of those listed below, the fair values are not materially different to their carrying amounts as: the interest receivable/payable is either close to current market rates; the instruments are short term in nature; or the instruments have recently been brought onto the balance sheet and therefore the carrying amount approximated the fair value. The fair value of these financial instruments is determined using discounted cash flow analysis. The fair value of all financial assets (excluding Investments accounted for using the equity method) and financial liabilities approximated their carrying amounts at 31 December 2017. There is no debt at amortised cost in the ATLAX Group.
88
For
per
sona
l use
onl
y

2018 Atlas Arteria Annual Report |
Debt at amortised costCarrying amount
$’000Fair value
$’000
Non-recourse TRIP II bonds and accrued interest thereon 1,429,881 1,346,192
Capital managementThe Groups’ capital management objectives are to: • Ensure sufficient capital resources to support the Groups’ business and operational requirements• Safeguard the Groups’ ability to continue as a going concern.
Annual reviews of the Groups’ capital requirements are performed to ensure the Groups are meeting their objectives.
Capital is defined as contributed equity plus reserves. The Groups do not have any externally imposed capital requirements at 31 December 2018 or 31 December 2017.
6 Group disclosures6.1 Parent entity financial information
Parent entity financial informationThe financial information for ATLIX and ATLAX for this disclosure has been prepared on the same basis as the Financial Reports, except as set out below:
Investments in subsidiaries, associates and joint venture entities Investments in subsidiaries, associates and joint venture entities are accounted for at cost in the separate financial information of ATLIX and ATLAX.
Tax consolidation legislationATLAX and its wholly owned Australian controlled entities have implemented the tax consolidation legislation as of 2 February 2010.
The head entity, ATLAX, and the controlled entities in the tax consolidated group account for their own current and deferred tax amounts. These tax amounts are measured as if each entity in the tax consolidated group continues to be a standalone taxpayer in its own right. In addition to its own current and deferred tax amounts, ATLAX also recognises the current tax liabilities (or assets) and the deferred tax assets arising from unused tax losses and unused tax credits assumed from controlled entities in the tax consolidated group.
The entities have also entered into a tax funding agreement under which the wholly owned entities fully compensate ATLAX for any current tax payable assumed and are compensated by ATLAX for any current tax receivable and deferred tax assets relating to unused tax losses or unused tax credits that are transferred to ATLAX under the tax consolidation legislation. The funding amounts are determined by reference to the amounts recognised in the wholly owned entities’ Financial Reports.
The amounts receivable/payable under the tax funding agreement are due upon receipt of the funding advice from the head entity, which is issued as soon as practicable after the end of each financial year.
The head entity may also require payment of interim funding amounts to assist with its obligations to pay tax instalments.
Assets or liabilities arising under tax funding agreements with the tax consolidated entities are recognised as current amounts receivable from or payable to other entities in the ATLAX Group. Any difference between the amounts assumed and amounts receivable or payable under the tax funding agreement are recognised as a contribution to (or distribution from) wholly owned tax consolidated entities.
Financial guarantees Where the parent entities have provided financial guarantees in relation to loans and payables of subsidiaries for no consideration, the fair values of these guarantees are accounted for as contributions and recognised as part of the cost of the investment.
89
For
per
sona
l use
onl
y

| 2018 Atlas Arteria Annual Report
Notes to the Financial Reports continuedfor the year ended 31 December 2018
6 Group disclosures continued
a) Summary financial informationIn accordance with the Corporations Act 2001, the individual Financial Reports for ATLIX and ATLAX are shown in aggregate amounts below:
ALX ATLAX GroupAs at
31 Dec 2018$’000
As at 31 Dec 2017
$’000
As at 31 Dec 2018
$’000
As at 31 Dec 2017
$’000
Statement of Financial Position
Current assets 74,319 4,694 59,717 35,697
Non-current assets 1,332,757 1,429,837 83,862 197,877
Total assets 1,407,076 1,434,531 143,579 233,574
Current liabilities (56,184) (52,886) (2,894) (6,241)
Non-current liabilities (8,232) (122,812) – –
Total liabilities (64,416) (175,698) (2,894) (6,241)
Shareholders’ equity
Issued capital 1,995,994 1,911,877 197,311 268,334
Reserves – – 141 –
Retained earnings (653,334) (653,044) (56,767) (41,001)
Total equity 1,342,660 1,258,833 140,685 227,333
Profit/(loss) for the year 80,085 (40,894) (10,983) 79,625
Total comprehensive income/(loss) 80,085 (40,894) (10,983) 79,625
b) Guarantees entered into by the parent entitiesATLIX and ATLAX have not directly provided any financial guarantees in respect to bank overdrafts and loans of subsidiaries as at 31 December 2018 and 31 December 2017. ATLIX and ATLAX have not given any unsecured guarantees at 31 December 2018 and 31 December 2017.
However, financial guarantees are held by ETI UK, a subsidiary of ATLIX, in respect of external borrowings held by WQG.
c) Contingent liabilities of the parent entitiesRefer note 7.2 for ATLIX and ATLAX’s contingent liabilities as at 31 December 2018 and 31 December 2017.
90
For
per
sona
l use
onl
y

2018 Atlas Arteria Annual Report |
6.2 Acquisition of subsidiaries
Business combinationsThe acquisition method of accounting is used to account for all business combinations other than those under common control, regardless of whether equity instruments or other assets are acquired. The consideration transferred for the acquisition of a subsidiary comprises the fair values of the assets transferred, the liabilities incurred and the equity interests issued by the Groups. The consideration transferred also includes the fair value of any contingent consideration arrangement and the fair value of any pre-existing equity interest in the subsidiary. Acquisition-related costs are expensed as incurred. Identifiable assets acquired and liabilities and contingent liabilities assumed in a business combination are, with limited exceptions, measured initially at their fair values at the acquisition date. Contingent consideration is subsequently remeasured to its fair value with changes recognised in the profit or loss.
The excess of the consideration transferred, the amount of any non-controlling interest in the acquiree and the acquisition-date fair value of any previous equity interest in the acquiree over the fair value of the Groups’ share of the net identifiable assets acquired is recorded as goodwill.
Acquisition of Warnow Tunnel/WQGOn WQG Acquisition Date, ALX acquired the remaining 30% equity interest and shareholder loan in WQG for €3.7 million as gross consideration prior to adjusting for applicable transaction taxes. The acquisition was funded by existing cash.
Pre-acquisition, ALX held 70% interest in WQG and the balance of 30% was held by Bouygues Travaux Publics SA. Per the agreement, any decision made with regard to the relevant activities required 75% of the voting members to proceed. As a result, ALX’s investment in WQG was treated as a joint venture. Post-acquisition, ALX has a 100% equity interest in WQG. Accordingly, WQG is accounted for as a subsidiary of ALX which is wholly consolidated in the ALX Financial Report.
As per AASB 3 Business Combinations, this acquisition is treated as a sale of the existing interest in WQG and subsequent purchase of a 100% interest, giving rise to revaluation of ALX’s existing investment in WQG.
The table below reconciles the 1 January 2018 carrying value of Warnow Tunnel with the value of the existing investments at WQG Acquisition Date based on ALX’s existing ownership interest.
ALX ATLAX Group$’000 $’000
Opening investments in Warnow Tunnel as at 1 January 2018 – equity method – –
Share of losses accounted for using equity method up to the WQG Acquisition Date – –
Foreign exchange movement up to WQG Acquisition Date – –
Revaluation of existing investment as a result of the acquisition 13,470 –
Value of existing investment held at WQG Acquisition Date 13,470 –
Details of the purchase consideration, the net assets acquired and goodwill are as follows:
ALX ATLAX Group$’000 $’000
Total purchase consideration 5,975 –
91
For
per
sona
l use
onl
y

| 2018 Atlas Arteria Annual Report
Notes to the Financial Reports continuedfor the year ended 31 December 2018
6 Group disclosures continued
6.2 Acquisition of subsidiaries continuedThe fair value of WQG’s and its General Partner’s identifiable assets acquired and liabilities assumed by the Group on WQG Acquisition Date are as follows:
ALX ALX€’000 $’000
Cash and cash equivalents 3,616 5,840
Restricted cash 3,111 5,024
Other assets 1,640 2,648
Intangible assets – Tolling concessions 133,003 214,772
Property, plant and equipment 215 347
Capital work in progress 1,770 2,858
Debt at amortised cost (115,117) (185,889)
Deferred tax liabilities (8,790) (14,193)
Derivative financial instruments (10,474) (16,913)
Other liabilities (5,847) (9,443)
Fair value of identifiable assets acquired and liabilities assumed for WQG 3,127 5,051
Goodwill1 8,790 14,193
Net assets acquired 11,917 19,244
1. Goodwill arises as a result of the deferred tax liability calculated on concession rights value.
Revenue and profit contributionWQG contributed revenues of $5.8 million and a net loss after tax of $4.0 million to the Group for the period from WQG Acquisition Date to 31 December 2018.
If the acquisition had have of occurred on 1 January 2018, consolidated pro-forma revenue and net loss after tax for the year would have been $20.2 million and $5.4 million respectively. These amounts have been calculated using the subsidiary’s results and adjusting them for:• Differences in accounting policies between the Group and the subsidiary; and • The additional depreciation and amortisation that would have been charged assuming the fair value to property, plant and
equipment and concession rights had applied from 1 January 2018, together with the consequential tax effects.
Purchase consideration – cash inflowALX
$’000
Inflow of cash to acquire subsidiary, net of cash acquired
Cash consideration paid during the year (3,950)
Cash and cash equivalents acquired 5,840
Net inflow of cash – investing activities 1,890
92
For
per
sona
l use
onl
y

2018 Atlas Arteria Annual Report |
6.3 Subsidiaries
SubsidiariesSubsidiaries, other than those that ATLIX has been deemed to have directly acquired through stapling arrangements, are those entities over which the Groups are exposed to, or have the right to, variable returns from their involvement with the entity and have the ability to affect those returns through their power over the entity. Subsidiaries are fully consolidated from the date on which control is transferred to the Groups. The acquisition method of accounting is used to account for the acquisition of subsidiaries by the Groups. Where control of an entity is obtained during a financial year, its results are included in the Statement of Comprehensive Income from the date on which control commences. Where control of an entity ceases during a financial year, its results are included for that part of the year during which control existed and the subsidiary is deconsolidated from the date that control ceases.
a) ALX
Name of controlled entity Country of establishment2018 voting
%2017 voting
%
Atlas Arteria Limited Australia 100.0 100.0ALX Infrastructure US Pty Limited Australia 100.0 100.0ALX Infrastructure Australia Pty Limited Australia 100.0 100.0ALX Investments (Australia) Pty Limited Australia 100.0 100.0Green Bermudian Holdings Limited Bermuda 100.0 100.0ALX Investments Limited Bermuda 100.0 100.0MIBL Finance (Luxembourg) Sarl Luxembourg 100.0 100.0Tollway Holdings Limited UK 100.0 100.0European Transport Investments (UK) Limited (“ETI UK”) UK 100.0 100.0Tipperhurst Limited UK 100.0 100.0Greenfinch Motorways Limited UK 100.0 100.0MQA 125 Holdings, Inc.1 USA 100.0 100.0ALX Indiana Holdings LLC USA 100.0 100.0ALX Holdings (US) LLC USA 100.0 100.0Dulles Greenway Partnership USA 100.0 100.0Dulles Greenway Investments 3 (US) LLC USA 100.0 100.0Shenandoah Greenway Corporation USA 100.0 100.0Toll Road Investors Partnership II, L.P. USA 100.0 100.0Warnowquerung GmbH & Co. KG2 Germany 100.0 –Warnowquerung Verwaltungsgesellschaft mbH2 Germany 100.0 –
1. Filed for dissolution on 7 December 2018.2. On 20 September 2018, ALX acquired the remaining 30% equity interest in WQG. Prior to this, ALX’s investment in WQG was classified as a joint venture.
b) ATLAX Group
Name of controlled entity Country of establishment2018 voting
%2017 voting
%
ALX Infrastructure Australia Pty Limited Australia 100.0 100.0ALX Investments Australia Pty Limited Australia 100.0 100.0ALX Indiana Holdings LLC USA 100.0 100.0ALX Holdings (US) LLC USA 100.0 100.0Dulles Greenway Partnership USA 100.0 100.0Dulles Greenway Investments 3 (US) LLC USA 100.0 100.0Shenandoah Greenway Corporation USA 100.0 100.0
93
For
per
sona
l use
onl
y

| 2018 Atlas Arteria Annual Report
Notes to the Financial Reports continuedfor the year ended 31 December 2018
6 Group disclosures continued
6.4 Related party disclosuresAdviser and ManagerThe Adviser of ATLIX and the Manager of ATLAX is MFA, a wholly owned subsidiary of Macquarie Group Limited (“MGL”).
DirectorsThe following persons were directors of ATLIX during the whole of the year and up to the date of this report:• Jeffrey Conyers (Chairman)• James Keyes• Christopher Leslie • Nora Scheinkestel• Derek Stapley
The following persons were directors of ATLAX during the whole of the year and up to the date of this report (unless otherwise stated):
• Nora Scheinkestel (Chairman)• David Bartholomew (Appointed on 1 October 2018) • Richard England (Resigned on 30 November 2018) • Debra Goodin• Jean-Georges Malcor (Appointed on 1 November 2018)• John Roberts (Resigned on 28 September 2018)
Key Management PersonnelKey Management Personnel (“KMP”) are defined in AASB 124 Related Party Disclosures as those having authority and responsibility for planning, directing and controlling the activities of the entity. The directors of ATLIX and ATLAX meet the definition of KMP as they have this authority in relation to the activities of ALX and the ATLAX Group respectively, however they do not manage day-to-day activities of the business.
The compensation paid to directors of ATLIX and ATLAX is determined by reference to directorships of similar entities. The level of compensation is not related to the performance of ALX.
94
For
per
sona
l use
onl
y

2018 Atlas Arteria Annual Report |
Compensation in the form of directors’ fees that were paid to directors is as follows:
Year ended 31 Dec 2018 Year ended 31 Dec 2017Cash salary
and fees$
Superannuation$
Total directors’ fees
$
Cash salary and fees
$Superannuation
$
Total directors’ fees
$
ATLIXJeffrey Conyers 161,478 – 161,478 159,234 – 159,234James Keyes 114,380 – 114,380 120,258 – 120,258Christopher Leslie 114,380 – 114,380 36,720 – 36,720Nora Scheinkestel 83,750 – 83,750 86,250 – 86,250Derek Stapley 124,473 – 124,473 133,256 – 133,256
598,461 – 598,461 535,718 – 535,718
ATLAX
Nora Scheinkestel 189,710 20,290 210,000 208,606 19,832 228,438
David Bartholomew 32,380 3,037 35,417 – – –
Richard England 136,826 14,424 151,250 180,060 15,681 195,741
Debra Goodin 162,864 15,261 178,125 75,914 4,837 80,751
Jean-Georges Malcor 24,583 – 24,583 – – –
John Roberts 105,000 – 105,000 142,083 – 142,083
Marc de Cure – – – 71,918 6,832 78,750651,363 53,012 704,375 678,581 47,182 725,763
The number of ALX stapled securities held directly, indirectly or beneficially by the KMP at 31 December is set out below:
Directors’ interests in ALX stapled securities
At 31 Dec 2018
Directors’ interests in ALX stapled securities
At 31 Dec 2017
Jeffrey Conyers 40,000 40,000
David Bartholomew1 – –
Richard England2 – 49,670
Debra Goodin 5,671 5,671
James Keyes 5,000 5,000
Christopher Leslie – –
Jean-Georges Malcor3 – –
John Roberts4 – 53,073
Nora Scheinkestel 78,431 78,431
Derek Stapley 5,000 –
Total 134,102 231,845
1. Appointed 1 October 2018.2. Resigned 30 November 2018.3. Appointed 1 November 2018.4. Resigned 28 September 2018.
95
For
per
sona
l use
onl
y

| 2018 Atlas Arteria Annual Report
Notes to the Financial Reports continuedfor the year ended 31 December 2018
6 Group disclosures continued
6.4 Related party disclosures continued Adviser and Manager feesUnder the terms of the governing documents of the individual entities within the Groups, fees incurred (inclusive of non-recoverable GST) to the Adviser/Manager of ALX and the ATLAX Group were:
ALX ATLAX GroupYear ended
31 Dec 2018$
Year ended31 Dec 2017
$
Year ended31 Dec 2018
$
Year ended31 Dec 2017
$
Base fee (a) 36,758,504 32,812,601 2,235,911 2,625,042
Performance fee (b) 70,625,097 7,978,730 4,983,932 639,491
Total 107,383,601 40,791,331 7,219,843 3,264,533
a) Base feeAs a part of the terms of internalised management agreements, MFA will remain as the adviser/manager of ALX under the current management arrangements until 15 May 2019 (unless terminated earlier although fees will continue to be paid until that date). During this period, base management fees will be paid to MFA at the current rate of 0.85% per annum on ALX’s market capitalisation (excluding any shares issued after 30 June 2018).
b) Performance feeThe performance fee is calculated with reference to the performance of the ALX accumulated index compared with the performance of the S&P/ASX 300 Industrials Accumulation Index. For the 12 months ended 30 June 2018, a total performance fee of $54.7 million (excluding GST) was calculated for ALX. In accordance with, and due to the renegotiation of, the management agreements, the full 2018 performance fee became payable at 30 June 2018. Accordingly, the full 2018 performance fee has been recognised as at 30 June 2018. For the period ended 30 June 2017, a performance fee for $8.0 million (excluding GST) was expensed.
The full 2018 performance fee of $54.7 million (excluding GST), the second and third instalment of the 2017 performance fee totalling $15.9 million (excluding GST) and the third instalment of the 2016 performance fee of $44.7 million (excluding GST) became payable at 30 June 2018 out of which $90.3 million was applied to a subscription for new ALX securities in July 2018 and $25.0 million was settled in cash.
Fees are apportioned between ATLIX and ATLAX based on each entity’s share of the net assets of ALX.
Other balances and transactionsMGL and companies within the MGL Group undertake various transactions with and perform various services for ALX. Fees paid to the MGL Group are approved solely by the independent directors on the Boards and, where appropriate, external advice is sought by the directors to ensure that the fees and terms of engagement are representative of arm’s length transactions.
In July 2018, MGL sold all of the 13,476,174 stapled securities held in ALX which were acquired by MGL on settlement of performance fee.
ALX utilises services provided by Macquarie Bank Limited (“MBL”), a wholly owned subsidiary of MGL. MBL’s foreign exchange and treasury departments provide services from time to time on arm’s length terms.
96
For
per
sona
l use
onl
y

2018 Atlas Arteria Annual Report |
At 31 December 2018, entities within the Groups had the following balances with related parties:
ALX ATLAX GroupAs at
31 Dec 2018$
As at31 Dec 2017
$
As at31 Dec 2018
$
As at31 Dec 2017
$
Cash held with MBL1 85,815,683 37,990,680 12,317,726 34,172,171
Interest bearing loan receivable from ATLIX2
Current3 – – 46,179,915 1,893,879
Non-current – – 8,232,108 122,812,094
Other intercompany receivables from/(payables to) ATLIX – – 329,842 (1,604)
1. Macquarie Bank Limited (“MBL”), a wholly owned subsidiary of MGL.2. Tranches of the loan owing from ATLIX to ATLAX bear interest at 6-month BBSW plus a margin of 0.9% – 1.1%. 3. Includes accrued interest of $778,623 (2017: $1,893,879).
During the year, entities within the Groups had the following transactions with related parties:
ALX ATLAX GroupYear ended
31 Dec 2018$
Year ended31 Dec 2017
$
Year ended31 Dec 2018
$
Year ended31 Dec 2017
$
Interest earned on deposits with MBL 876,577 1,564,302 396,181 1,130,495
Interest between ATLAX and ATLIX on loan amount – – 3,465,711 1,893,879
Reimbursement of expenses paid by companies within the MGL Group on behalf of ALX
1,215,254 919,572 795,626 685,012
Reimbursement of ATLIX’s portion of expenses paid by ATLAX on behalf of ALX
– – 1,677,700 –
Guarantee fee income from ATLIX Group – – – 1,185,466
Fees paid to Macquarie Capital (Australia) Limited1 – 9,468,959 – 762,976
1. Fees paid to Macquarie Capital (Australia) Limited in 2017 relate to capital raisings undertaken as part the acquisition of additional interests in APRR and TRIP II.
During the year, entities within the Groups received the following from associates:
ALX ATLAX GroupYear ended
31 Dec 2018$
Year ended31 Dec 2017
$
Year ended31 Dec 2018
$
Year ended31 Dec 2017
$
Principal and interest received frompreferred equity certificates issued by MAF2
249,416,735 147,779,372 – –
M6 Toll management fee – 5,154,626 – –
Adviser's fee from WQG 135,420 28,224 – –
All of the amounts represent payments on normal commercial terms made in relation to the provision of goods and services.
97
For
per
sona
l use
onl
y

| 2018 Atlas Arteria Annual Report
Notes to the Financial Reports continuedfor the year ended 31 December 2018
7 Other disclosures
7.1 Cash flow information
ALX ATLAX GroupYear ended
31 Dec 2018$’000
Year ended31 Dec 2017
$’000
Year ended31 Dec 2018
$’000
Year ended31 Dec 2017
$’000
Reconciliation of profit after income tax to the net cash flows from operating activities
Profit/(loss) from activities after income tax 59,852 519,583 (16,831) 57,383
(Gain)/loss on equity accounted assets (246,141) (187,971) 4,801 626
Net foreign exchange differences 3,483 (14,119) (63) (2,247)
Finance costs 108,920 53,795 – –
Depreciation and amortisation 350 152 39 –
Amortisation of tolling concession 61,768 36,520 – –
Amortisation of deferred tax liabilities (1,220) (18,448) – –
Gain on revaluation of investment (13,470) (375,615) – (61,710)
Bad debt written off 6 – – –
Current tax expense/(benefit) 2,118 1,699 (1) 1,664
Guarantee fee classified as investing cash flows – – – (1,185)
Issue of securities against performance fees payable 90,303 52,640 6,186 4,950
Changes in operating assets and liabilities
(Increase)/decrease in receivables (4,855) 15 (457) (1,675)
(Decrease) in payables and provisions (37,974) (50,131) (2,364) (11,654)
Net cash flows from operating activities 23,140 18,120 (8,690) (13,848)
Non-cash financing and investing activitiesRefer note 5.2 for further details on application of performance fees to subscription of new securities.
Net debt reconciliationThis section sets out an analysis of net debt and the movements in net debt for each of the periods presented.
ALX ATLAX GroupYear ended
31 Dec 2018$’000
Year ended31 Dec 2017
$’000
Year ended31 Dec 2018
$’000
Year ended31 Dec 2017
$’000
Net debt
Cash and cash equivalents 186,468 122,690 12,461 34,304
Borrowings – current (77,322) (66,286) – –
Borrowings – non-current (2,101,962) (1,668,352) – –
Net debt (1,992,816) (1,611,948) 12,461 34,304
Cash and cash equivalents 186,468 122,690 12,461 34,304
Gross debt – fixed interest rates (1,429,881) (1,287,564) – –
Gross debt – variable interest rates (749,403) (447,074) – –
Net debt (1,992,816) (1,611,948) 12,461 34,304
98
For
per
sona
l use
onl
y

2018 Atlas Arteria Annual Report |
Assets Liabilities from financing activities
ALX
Cash and cash equivalent
$’000
Borrowings current
$’000
Borrowings non-current
$’000Total
$’000
Net debt at 1 January 2017 223,367 – – 223,367
Cash flows (104,453) 9,117 (450,530) (545,866)
Loan facilities – (67,449) (1,243,113) (1,310,562)
Other non-cash adjustments1 – (10,675) (43,120) (53,795)
Foreign exchange adjustments 3,776 2,721 68,411 74,908
Net debt at 31 December 2017 122,690 (66,286) (1,668,352) (1,611,948)
Cash flows 59,327 21,081 54 80,462
Loan facilities – (9,068) (176,821) (185,889)
Other non-cash adjustments1 – (19,136) (89,784) (108,920)
Foreign exchange adjustments 4,451 (3,913) (167,059) (166,521)
Net debt at 31 December 2018 186,468 (77,322) (2,101,962) (1,992,816)
1. Relates to unpaid interest that has accrued during the period.
ATLAX Group
Cash and cash equivalent
$’000Total
$’000
Net debt at 1 January 2017 204,129 204,129
Cash flows (165,628) (165,628)
Foreign exchange adjustments (4,197) (4,197)
Net debt at 31 December 2017 34,304 34,304
Cash flows (22,051) (22,051)
Foreign exchange adjustments 208 208
Net debt at 31 December 2018 12,461 12,461
7.2 Contingent liabilitiesALX had the following contingent liabilities at 31 December 2018. No provision has been raised against these items unless stated below.
Warnow TunnelETIUK, a subsidiary of ATLIX, has made guarantees, totalling €2.0 million ($3.2 million) (31 December 2017: €1.2 million ($1.8 million)), in the event of a senior debt payment event of default by Warnowquerung GmbH & Co KG.
This contingent commitment is backed by an on-demand guarantee, provided through a pledged cash account into which €2.0 million ($3.2 million) (31 December 2017: €1.2 million ($1.8 million)) has been deposited. These funds are restricted and are classified as restricted cash on the Consolidated Statements of Financial Position.
99
For
per
sona
l use
onl
y

| 2018 Atlas Arteria Annual Report
Notes to the Financial Reports continuedfor the year ended 31 December 2018
7 Other disclosures continued
7.3 Remuneration of auditors
ALX ATLAX GroupYear ended
31 Dec 2018$
Year ended31 Dec 2017
$
Year ended31 Dec 2018
$
Year ended31 Dec 2017
$
Amounts paid or payable to PricewaterhouseCoopers Australia for:
Audit services 479,130 364,743 239,565 186,110
Taxation services – 14,240 – –
Other assurance services 60,680 261,918 30,340 25,904
539,810 640,901 269,905 212,014
Amounts paid or payable to network firms of PricewaterhouseCoopers for:
Audit services 314,211 239,416 32,745 41,927
Taxation services 155,974 29,757 – –
Other services – 4,830 – –
470,185 274,003 32,745 41,927
Amounts paid or payable to non PricewaterhouseCoopers audit firms for:
Audit services 64,866 – – –
64,866 – – –
7.4 Share based paymentsLTI PlanThe LTI Plan is designed to provide long-term incentives to key employees to deliver long-term securityholder returns. Under the plan, participants are granted performance rights which only vest if certain performance standards are met. Participation in the plan is at the Board’s discretion and no individual has a contractual right to receive any guaranteed benefits.
The amount of performance rights that will vest depends on Groups’ relative Total Shareholder return (TSR) against the TSR performance of a peer group of companies approved by the Board. Performance rights are granted under the plan for no consideration and carry equal voting rights with other Securityholders. These performance rights are exercisable at no consideration.
Set out below are summaries of performance rights granted under the plan:
ALX ATLAX GroupYear ended
31 Dec 2018Year ended
31 Dec 2017Year ended
31 Dec 2018Year ended
31 Dec 2017Number of
performance rights
Number of performance
rights
Number of performance
rights
Number of performance
rights
As at 1 January – – – –
Granted during the year 237,765 – 237,765 –
Exercised during the year – – – –
Forfeited during the year – – – –
As at 31 December 237,765 – 237,765 –
All performance rights outstanding at the end of the year will vest on 28 February 2021 only if performance conditions are met.
100
For
per
sona
l use
onl
y
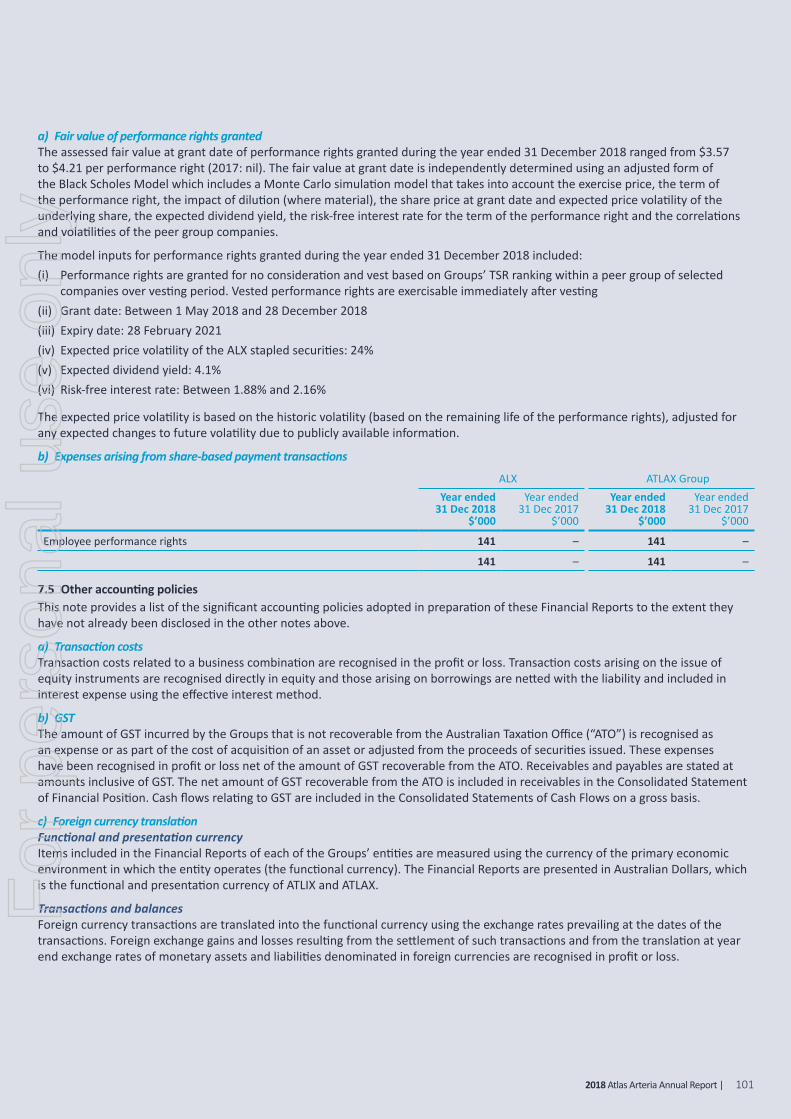
2018 Atlas Arteria Annual Report |
a) Fair value of performance rights grantedThe assessed fair value at grant date of performance rights granted during the year ended 31 December 2018 ranged from $3.57 to $4.21 per performance right (2017: nil). The fair value at grant date is independently determined using an adjusted form of the Black Scholes Model which includes a Monte Carlo simulation model that takes into account the exercise price, the term of the performance right, the impact of dilution (where material), the share price at grant date and expected price volatility of the underlying share, the expected dividend yield, the risk-free interest rate for the term of the performance right and the correlations and volatilities of the peer group companies.
The model inputs for performance rights granted during the year ended 31 December 2018 included: (i) Performance rights are granted for no consideration and vest based on Groups’ TSR ranking within a peer group of selected
companies over vesting period. Vested performance rights are exercisable immediately after vesting(ii) Grant date: Between 1 May 2018 and 28 December 2018(iii) Expiry date: 28 February 2021 (iv) Expected price volatility of the ALX stapled securities: 24%(v) Expected dividend yield: 4.1% (vi) Risk-free interest rate: Between 1.88% and 2.16%
The expected price volatility is based on the historic volatility (based on the remaining life of the performance rights), adjusted for any expected changes to future volatility due to publicly available information.
b) Expenses arising from share-based payment transactions
ALX ATLAX GroupYear ended
31 Dec 2018$’000
Year ended31 Dec 2017
$’000
Year ended31 Dec 2018
$’000
Year ended31 Dec 2017
$’000
Employee performance rights 141 – 141 –
141 – 141 –
7.5 Other accounting policiesThis note provides a list of the significant accounting policies adopted in preparation of these Financial Reports to the extent they have not already been disclosed in the other notes above.
a) Transaction costsTransaction costs related to a business combination are recognised in the profit or loss. Transaction costs arising on the issue of equity instruments are recognised directly in equity and those arising on borrowings are netted with the liability and included in interest expense using the effective interest method.
b) GSTThe amount of GST incurred by the Groups that is not recoverable from the Australian Taxation Office (“ATO”) is recognised as an expense or as part of the cost of acquisition of an asset or adjusted from the proceeds of securities issued. These expenses have been recognised in profit or loss net of the amount of GST recoverable from the ATO. Receivables and payables are stated at amounts inclusive of GST. The net amount of GST recoverable from the ATO is included in receivables in the Consolidated Statement of Financial Position. Cash flows relating to GST are included in the Consolidated Statements of Cash Flows on a gross basis.
c) Foreign currency translationFunctional and presentation currencyItems included in the Financial Reports of each of the Groups’ entities are measured using the currency of the primary economic environment in which the entity operates (the functional currency). The Financial Reports are presented in Australian Dollars, which is the functional and presentation currency of ATLIX and ATLAX.
Transactions and balancesForeign currency transactions are translated into the functional currency using the exchange rates prevailing at the dates of the transactions. Foreign exchange gains and losses resulting from the settlement of such transactions and from the translation at year end exchange rates of monetary assets and liabilities denominated in foreign currencies are recognised in profit or loss.
101
For
per
sona
l use
onl
y

| 2018 Atlas Arteria Annual Report
Notes to the Financial Reports continuedfor the year ended 31 December 2018
7 Other disclosures continued
7.5 Other accounting policies continuedGroup companiesThe results and financial position of the Groups’ entities that have a functional currency different from the presentation currency are translated into the presentation currency as follows:• Assets and liabilities for each Statement of Financial Position presented are translated at the closing rate at the date of that
Statement of Financial Position• Income and expenses for each Statement of Comprehensive Income are translated at exchange rates at the dates of transactions
or at an average rate as appropriate• All resulting exchange differences are recognised as a separate component of equity
On consolidation, exchange differences arising from the translation of any net investment in foreign entities are taken to securityholders’ equity. When a foreign operation is disposed of or borrowings that form part of the net investment are repaid, a proportionate share of such exchange differences is recognised in profit or loss as part of the gain or loss on disposal. Goodwill and fair value adjustments arising on the acquisition of a foreign entity are treated as assets and liabilities of the foreign entity and translated at the closing rate.
d) Offsetting financial instrumentsFinancials assets and financial liabilities may be offset and the net amount reported on the Statement of Financial Position when there is a legally enforceable right to offset the amounts and either there is an intention to settle on a net basis, or realise the financial asset and settle the financial liability simultaneously.
e) Change in accounting policy – AASB 9 Financial InstrumentsImpact of ChangesThe Groups have adopted AASB 9 from 1 January 2018 which has resulted in changes to accounting policies and the analysis for possible adjustments to amounts recognised in the Financial Reports. In accordance with the transitional provisions in AASB 9, the reclassifications and adjustments are not reflected in the balance sheet as at 31 December 2017 but recognised in the opening balance sheet as at 1 January 2018. As per the new impairment model introduced by AASB 9, ATLAX Group has recognised a loss allowance of $0.3 million on the intercompany loan receivable owing to ATLAX from ATLIX as at 1 January 2018.
(i) Classification and MeasurementOn 1 January 2018, the Groups have assessed which business models apply to the financial instruments held by the Groups and have classified them into the appropriate AASB 9 categories. The main effects resulting from this reclassification are shown in the table below.
On adoption of AASB 9, the Groups classified financial assets and liabilities as subsequently measured at either amortised cost or fair value through profit or loss, depending on the business model for those assets and on the asset’s contractual cash flow characteristics. There were no changes in the measurement of the Groups’ financial instruments.
There was no impact on the statement of comprehensive income or the statement of changes in equity on adoption of AASB 9 in relation to classification and measurement of financial assets and financial liabilities.
The following table summarises the impact on the classification and measurement of the Groups’ financial instruments at 1 January 2018:
Presented in statement of financial position Financial asset AASB 139 AASB 9Reported
$’000Restated
$’000
Cash and cash equivalents Bank deposits Loans and receivables Amortised cost No change No change
Restricted cash Bank deposits Loans and receivables Amortised cost No change No change
Receivables from related parties Loans and receivables Loans and receivables Amortised cost No change No change
Trade and other receivables/payables Loans and receivables Loans and receivables Amortised cost No change No change
(ii) Changes to Hedge AccountingALX does not currently enter into any hedge accounting and therefore there is no impact to the Groups’ Financial Reports.
(iii) ImpairmentAASB 9 introduces a new expected credit loss (“ECL”) impairment model that requires the Groups to adopt an ECL position across the Groups’ financial assets at 1 January 2018. The Groups have performed a detailed assessment of its receivable balances which materially consist only of an intercompany loan owing to ATLAX from ATLIX. While cash and cash equivalents are also subject to the impairment requirements of AASB 9, the identified impairment loss was immaterial.
102
For
per
sona
l use
onl
y

2018 Atlas Arteria Annual Report |
The loss allowances for financial assets are based on assumptions about risk of default and expected loss rates. The Groups use judgement in making these assumptions and selecting the inputs to the impairment calculation, based on the Groups’ past history, existing market conditions as well as forward looking estimates at the end of each reporting period.
Applying the expected credit risk model on the intercompany loan receivable in the ATLAX Group at 1 January 2018 resulted in the recognition of a loss allowance of $0.3 million through opening retained earnings. This provision was reassessed at 31 December 2018 and will be reassessed at each reporting date.
f) Accounting standards and interpretations issuedCertain new accounting standards and interpretations have been published that are not mandatory for the current reporting year. The Groups’ assessment of the impact of the relevant new standards and interpretations which have not been early adopted in preparing the Financial Reports is set out below.
AASB 16 Leases (effective for annual reporting periods beginning on or after 1 January 2019)AASB 16 Leases will replace AASB 117 Leases. It requires the recognition of a right-of-use asset along with an associated lease liability, where the entity is a lessee. Interest expense will be recognised in profit or loss using the effective interest rate method, and the right of use asset will be depreciated. The standard is effective for annual reporting periods beginning on or after 1 January 2019.
The Groups have assessed the new standard’s impact on the Groups’ Financial Reports and anticipate that the most significant impact will arise on the TRIP II easement and the ALX head office lease. The Groups are still finalising their assessment which is subject to change, however a summary of the anticipated impact on the Financial Reports for the year ended 31 December 2019 is shown below:
ALX ATLAX GroupAASB 16
$’000AASB 117
$’000AASB 16
$’000AASB 117
$’000
Balance sheet at 1 January 2019
Non-current assets
Right of use asset – TRIP II easement 4,380 – – –
Right of use asset – ALX head office lease 2,026 – 2,026 –
Non-current liabilities
Deferred liability – TRIP II easement – (15,130) – –
Lease liability – TRIP II easement (18,129) – – –
Lease liability – ALX head office lease (2,067) – (2,067) –
Equity
Retained earnings – TRIP II easement 13,750 (15,130) – –
Retained earnings – ALX head office lease 41 – 41 –
Income statement
Operating expenses – TRIP II easement – (600) – –
Depreciation – TRIP II easement (81) – – –
Finance costs – TRIP II easement (904) – – –
Operating expenses – ALX head office lease – (172) – (172)
Depreciation – ALX head office lease (186) – (186) –
Finance costs – ALX head office lease (37) – (37) –
Cash flow Statement
Operating cash flows – TRIP II easement – (600) – –
Financing cash flows – TRIP II easement (600) – – –
Operating cash flows – ALX head office lease – (172) – (172)
Financing cash flows – ALX head office lease (172) – (172) –
There are additionally a number of small operating leases where an asset (the right to use the leased item) and a financial liability to pay rentals will be recognised. For these leases, the application of AASB 16 is not expected to have a material impact on the Groups’ Financial Reports.
103
For
per
sona
l use
onl
y

| 2018 Atlas Arteria Annual Report
Notes to the Financial Reports continuedfor the year ended 31 December 2018
7 Other disclosures continued
7.5 Other accounting policies continuedUpon adoption of AASB 16, assets and liabilities arising from a lease will be initially measured at their net present value. The lease payments are discounted using the interest rate implicit in the lease, if that rate can be determined, or the estimated incremental borrowing rates specific to the entity that has entered into the lease.
The Groups’ leases are materially all denominated in foreign currencies, and as such the numbers forecast are subject to change based on FX rates applicable when AASB 16 comes into effect.
The Groups will apply the standard from its mandatory adoption date of 1 January 2019, right-of-use assets for leases will be measured on transition as if the new rules had always been applied. The Group intends to apply the simplified transition approach and will not restate comparative amounts for the year prior to first adoption.
Revised IFRS Conceptual FrameworkThe IASB has issued the revised IFRS Conceptual Framework (“Framework”) for financial reporting. The main purpose of the Framework is to assist the IASB in developing accounting standards and assist financial report preparers to develop accounting policies when there is no specific or similar standard that addresses a particular issue.
Amendments made include the definition and recognition criteria for assets, liabilities, income and expenses, and other relevant financial reporting concepts. The Framework is effective for annual periods beginning on or after 1 January 2020. The Groups are currently assessing the impact of the Framework and timing of adoption. The Australian equivalent Conceptual Framework has not yet been amended.
There are no other standards or interpretations that are not yet effective and that would be expected to have a material impact on the entity in the current or future reporting periods and on foreseeable future transactions.
7.6 Events occurring after balance sheet dateSince the balance sheet date, there have been no other matters or circumstances not otherwise dealt with in the Financial Reports that have significantly affected or may significantly affect the operations of the Groups, the result of those operations or the state of affairs of the Groups in the period subsequent to the year ended 31 December 2018.
104
For
per
sona
l use
onl
y

2018 Atlas Arteria Annual Report |
The directors of Atlas Arteria International Limited (“ATLIX”) declare that: a) the Financial Report of ATLIX and its controlled entities (“ALX”) and notes set out on pages 59 to 104:
i) comply with Australian Accounting Standards and other mandatory professional reporting requirements; and ii) give a true and fair view of the financial position of the ALX as at 31 December 2018 and of its performance for the year ended
on that date; andb) there are reasonable grounds to believe that ATLIX will be able to pay its debts as and when they become due and payable.
The directors confirm that the Financial Report also complies with International Financial Reporting Standards as issued by the International Accounting Standards Board.
This declaration is made in accordance with a resolution of the directors.
Jeffrey Conyers Derek StapleyChairman DirectorAtlas Arteria International Limited Atlas Arteria International LimitedPembroke, Bermuda Pembroke, Bermuda27 February 2019 27 February 2019
105
Directors’ Declaration – Atlas Arteria International Limitedfor the year ended 31 December 2018
For
per
sona
l use
onl
y

| 2018 Atlas Arteria Annual Report
The directors of Atlas Arteria Limited (“ATLAX”) declare that: a) the Financial Report of ATLAX and its controlled entities (“ATLAX Group”) and notes set out on pages 59 to 104 are in accordance
with the constitution of ATLAX and the Corporations Act 2001, including:i) complying with Australian Accounting Standards, the Corporations Regulations 2001 and other mandatory professional
reporting requirements, and ii) giving a true and fair view of the financial position of the ATLAX Group as at 31 December 2018 and of its performance for the
year ended as on that date; andb) there are reasonable grounds to believe that ATLAX will be able to pay its debts as and when they become due and payable.
The directors confirm that the Financial Report also complies with International Financial Reporting Standards as issued by the International Accounting Standards Board.
The directors have been given the declaration by the Chief Executive Officer and Chief Financial Officer required by section 295A of the Corporations Act 2001.
This declaration is made in accordance with a resolution of the directors.
Nora Scheinkestel Debra GoodinChairman DirectorAtlas Arteria Limited Atlas Arteria LimitedSydney, Australia Sydney, Australia28 February 2019 28 February 2019
106
Directors’ Declaration – Atlas Arteria Limitedfor the year ended 31 December 2018
For
per
sona
l use
onl
y

2018 Atlas Arteria Annual Report | 107
Independent Auditor’s Reportfor the year ended 31 December 2018Financial Reports for the year ended 31 December 2018 Page 80 of 84
Atlas Arteria International Limited Atlas Arteria Limited
PricewaterhouseCoopers, ABN 52 780 433 757 One International Towers Sydney, Watermans Quay, Barangaroo, GPO BOX 2650, SYDNEY NSW 2001 T: +61 2 8266 0000, F: +61 2 8266 9999, www.pwc.com.au Level 11, 1PSQ, 169 Macquarie Street, Parramatta NSW 2150, PO Box 1155 Parramatta NSW 2124 T: +61 2 9659 2476, F: +61 2 8266 9999, www.pwc.com.au Liability limited by a scheme approved under Professional Standards Legislation.
Independent auditor’s report To the stapled security holders of Atlas Arteria International Limited (formerly Macquarie Atlas Roads International Limited) and Atlas Arteria Limited (formerly Macquarie Atlas Roads Limited)
Report on the audits of the financial reports
Our opinion In our opinion:
The accompanying financial reports of Atlas Arteria (“ALX or “Group”) (formerly Macquarie Atlas Roads), being the consolidated stapled group which comprises Atlas Arteria International Limited (“ATLIX”) and its controlled entities and Atlas Arteria Limited (“ATLAX”) and its controlled entities, and the Atlas Arteria Limited Group (“ATLAX Group”) which comprises ATLAX and its controlled entities, are in accordance with the Corporations Act 2001 (as applicable), including:
(a) giving a true and fair view of the financial positions of ALX and ATLAX Group as at 31 December 2018 and of their financial performance for the year then ended
(b) complying with Australian Accounting Standards and the Corporations Regulations 2001 (as applicable).
What we have audited The financial reports of ALX and ATLAX Group (the “financial reports”) comprise:
• the consolidated statements of financial position as at 31 December 2018 • the consolidated statements of comprehensive income for the year then ended • the consolidated statements of changes in equity for the year then ended • the consolidated statements of cash flows for the year then ended • the notes to the financial reports, which include a summary of significant accounting policies • the directors’ declarations.
Basis for opinion We conducted our audits in accordance with Australian Auditing Standards. Our responsibilities under those standards are further described in the Auditor’s responsibilities for the audits of the financial reports section of our report.
We believe that the audit evidence we have obtained is sufficient and appropriate to provide a basis for our opinion.
Independence
We are independent of ALX and ATLAX Group in accordance with the auditor independence requirements of the Corporations Act 2001 and the ethical requirements of the Accounting Professional and Ethical Standards Board’s APES 110 Code of Ethics for Professional Accountants (the Code) that are relevant to our audits of the financial reports in Australia. We have also fulfilled our other ethical responsibilities in accordance with the Code.
For
per
sona
l use
onl
y

| 2018 Atlas Arteria Annual Report
Independent Auditor’s Report continuedfor the year ended 31 December 2018
108
Financial Reports for the year ended 31 December 2018 Page 81 of 84 Atlas Arteria International Limited Atlas Arteria Limited
Our audit approach An audit is designed to provide reasonable assurance about whether the financial report is free from material misstatement. Misstatements may arise due to fraud or error. They are considered material if individually or in aggregate, they could reasonably be expected to influence the economic decisions of users taken on the basis of the financial report.
We tailored the scope of our audits to ensure that we performed enough work to be able to give an opinion on the financial reports as a whole, taking into account the geographic and management structure of ALX and ATLAX Group (together, “Groups”), their accounting processes and controls and the industry in which they operate.
ALX invests in an international portfolio of toll road assets, the most significant of which are Autoroutes Paris-Rhin-Rhone (“APRR”) in France and Dulles Greenway (“DG”) in the United States of America. We engaged with the auditors of APRR and Toll Road Investors Partnership II, L.P. (“TRIP II”), the concessionaire for DG, to report to us in respect of their audit procedures performed on these entities.
Materiality Audit scope Key audit matters
• ALX materiality was $18.2 million, which represents approximately 2.5% of its segment EBITDA. ATLAX Group materiality was $2.3 million, which represents approximately 1% of its total assets.
• We applied these thresholds, together with qualitative considerations, to determine the scope of our audits and the nature, timing and extent of our audit procedures and to evaluate the effect of misstatements on the financial reports as a whole.
• As the operating activities of both DG and Warnowquerung GmbH & Co., KG, the concessionaire of Warnow Tunnel (“Warnow Tunnel”) are reflected in ALX's financial report, using segment EBITDA as a benchmark reflects the operating activities of ALX.
• We continued to use total assets for ATLAX Group because, in our view, it remains the primary metric against which its performance is most commonly measured. It presents its holding as an investment, which is net of associated debt held at the level of the underlying asset.
• We utilised a 2.5% threshold for ALX and a 1% threshold for ATLAX Group based on our professional judgement, noting that both are within the range of commonly acceptable thresholds.
• Our audits focused on where the Groups made subjective judgements; for example, significant accounting estimates involving assumptions and inherently uncertain future events.
• We decided the nature, timing and extent of work that needed to be performed by other auditors operating under our instruction ("component auditors").
• For APRR, DG and Warnow Tunnel, we determined the level of involvement we needed to have in the audit work performed by the component auditors to enable us to conclude whether sufficient appropriate audit evidence had been obtained. Our involvement included discussions, written instructions and reviewing a selection of their workpapers.
• Amongst other relevant topics, we communicated the following key audit matters to the Audit and Risk Committees: - Value of the DG concession and
goodwill for ALX and value of the equity accounted investment in DG for ATLAX Group
- Consolidation of subsidiaries and equity accounting of associates.
• They are further described in the Key audit matters section of our report.
For
per
sona
l use
onl
y

2018 Atlas Arteria Annual Report | 109
Financial Reports for the year ended 31 December 2018 Page 82 of 84 Atlas Arteria International Limited Atlas Arteria Limited
Key audit matters Key audit matters are those matters that, in our professional judgement, were of most significance in our audits of the financial reports for the current period. The key audit matters were addressed in the context of our audits of the financial reports as a whole, and in forming our opinion thereon, and we do not provide a separate opinion on these matters. Further, any commentary on the outcomes of a particular audit procedure is made in that context. We communicated the key audit matters to the Audit and Risk Committees.
Key audit matter of ALX and ATLAX Group How our audits addressed the key audit matter
Value of the DG Concession and goodwill for ALX and value of the equity accounted investment in DG for ATLAX Group (Refer to note 4.1, note 4.2 and note 3.2)
The value of the DG Concession for ALX is $2.4 billion of the total tolling concession balance disclosed in note 4.1 ($2.6 billion). ALX Goodwill relating to DG amounts to $65 million of the $79 million balance disclosed in note 4.2. The value of the equity accounted investment in DG for ATLAX Group is $165 million as disclosed in note 3.2.
The carrying value of ALX goodwill has to be tested annually for impairment by the Directors. At each reporting period, the DG Concession and goodwill for ALX, and the value of the equity accounted investment in DG for ATLAX Group, need to be assessed for indicators of impairment. If indicators of impairment exist, the recoverable amount for each asset needs to be estimated. These assessments involve significant judgements in estimating future cash flows and the rate at which they are discounted.
For ALX, the test for impairment focuses on the DG Concession and goodwill. For ATLAX Group, it is the equity accounted investment in DG that is assessed for impairment.
The assessment of the carrying value of the DG Concession and goodwill for ALX and the equity accounted investment in DG for ATLAX Group was a key audit matter due to the judgement involved in developing the discounted cashflow model used in determining the recoverable amounts.
We evaluated the Groups’ assessments by comparing their analysis to our knowledge of DG and the environment in which it operates. Our understanding was informed by enquiries of DG’s auditors and review of publicly available information regarding the road network and the macroeconomic environment of the region.
We evaluated the Groups’ discounted cashflow model used to estimate the recoverable amount of the DG Concession and goodwill for ALX and the equity accounted investment in DG for ATLAX Group, and the process by which it was developed. Our procedures included:
• evaluating the discount rate applied to cashflow forecasts by using our valuation experts to develop an independent range. This range was determined with reference to externally derived data where possible, including market expectations of investment return, projected economic growth, interest rates, valuations of comparable assets and asset specific characteristics
• comparing previous cashflow forecasts to actual results to assess the ability of the Groups to forecast accurately and to incorporate actual results into future cashflow forecasts
• applying sensitivity analysis to key assumptions, in particular the discount rate, toll escalation rates and traffic forecasts
• sample testing the mathematical accuracy of the Groups’ discounted cashflow model which was used to determine the recoverable amount of the DG Concession and goodwill for ALX and the equity accounted investment in DG for ATLAX Group.
The impairment assessment remains highly sensitive to a number of assumptions, in particular to changes in the discount rate and achievement of traffic forecasts and toll escalation rates. Accordingly, we assessed the relevant disclosures which have been made in note 4.2.
For
per
sona
l use
onl
y

| 2018 Atlas Arteria Annual Report
Independent Auditor’s Report continuedfor the year ended 31 December 2018
110
Financial Reports for the year ended 31 December 2018 Page 83 of 84 Atlas Arteria International Limited Atlas Arteria Limited
Key audit matter of ALX and ATLAX Group How our audits addressed the key audit matter
Consolidation of subsidiaries and equity accounting for associates (Refer to note 3.2)
ALX applies equity accounting to its investment in APRR and consolidates its investments in DG and Warnow Tunnel. ATLAX Group applies equity accounting to its investment in DG. In doing so, they are required to make a number of adjustments to the underlying financial information to ensure alignment to Australian Accounting Standards and to the Groups’ accounting policies.
This was a key audit matter because certain adjustments are material and technical in nature such as adjusting the results of international subsidiaries and investments in associates prepared using local accounting policies to reflect Australian Accounting Standards.
Through interaction with the Groups and the APRR, DG and Warnow Tunnel audit teams, we developed an understanding of operational developments and local accounting policies of the subsidiaries and associates and the nature and extent of any accounting standard or accounting policy adjustments required to align with those of the Groups. We sample tested that the adjustments made by the Groups were consistent with this understanding.
Upon receipt of the audited balance sheet and income statement for DG, we re-performed management’s calculation of adjustments impacting ALX’s consolidated statement of comprehensive income and consolidated statement of financial position and re-performed management’s calculation of adjustments impacting ATLAX Group’s share of net profits or losses and carrying value of DG and compared to those calculated by the Groups.
Upon receipt of the audited balance sheet and income statement for APRR, we re-performed management’s calculation of adjustments impacting ALX’s share of net profits or losses and carrying value of APRR and compared to those calculated by the Groups.
Other information The directors are responsible for the other information. The other information comprises the information included in the annual report for the year ended 31 December 2018, but does not include the financial reports and our auditor’s report thereon. Prior to the date of this auditor's report, the other information we obtained included the Directors' Reports. We expect the remaining other information to be made available to us after the date of this auditor's report.
Our opinion on the financial reports does not cover the other information and we do not and will not express an opinion or any form of assurance conclusion thereon.
In connection with our audits of the financial reports, our responsibility is to read the other information and, in doing so, consider whether the other information is materially inconsistent with the financial reports or our knowledge obtained in the audits, or otherwise appears to be materially misstated.
If, based on the work we have performed on the other information that we obtained prior to the date of this auditor’s report, we conclude that there is a material misstatement of this other information, we are required to report that fact. We have nothing to report in this regard.
When we read the other information not yet received, if we conclude that there is a material misstatement therein, we are required to communicate the matter to the directors and use our professional judgement to determine the appropriate action to take.
Responsibilities of the directors for the financial reports The directors of ATLIX and ATLAX are responsible for the preparation of the financial reports that give a true and fair view in accordance with Australian Accounting Standards and the Corporations Act 2001 (as applicable) and for such internal control as the directors determine is necessary to enable the preparation of the financial reports that give a true and fair view and are free from material misstatement, whether due to fraud or error.
In preparing the financial reports, the directors are responsible for assessing the ability of the Groups to continue as going concerns, disclosing, as applicable, matters related to going concern and using the going concern basis of accounting unless the directors either intend to liquidate the Groups or to cease operations, or have no realistic alternative but to do so.
For
per
sona
l use
onl
y

2018 Atlas Arteria Annual Report | 111
Financial Reports for the year ended 31 December 2018 Page 84 of 84 Atlas Arteria International Limited Atlas Arteria Limited
Auditor’s responsibilities for the audits of the financial reports Our objectives are to obtain reasonable assurance about whether the financial reports as a whole are free from material misstatement, whether due to fraud or error, and to issue an auditor’s report that includes our opinion. Reasonable assurance is a high level of assurance, but is not a guarantee that an audit conducted in accordance with the Australian Auditing Standards will always detect a material misstatement when it exists. Misstatements can arise from fraud or error and are considered material if, individually or in the aggregate, they could reasonably be expected to influence the economic decisions of users taken on the basis of the financial reports.
A further description of our responsibilities for the audits of the financial reports is located at the Auditing and Assurance Standards Board website at: http://www.auasb.gov.au/auditors_responsibilities/ar1.pdf. This description forms part of our auditor's report.
Report on the remuneration report
Our opinion on the remuneration report We have audited ATLIX and ATLAX’s remuneration report included in pages 39 to 55 of the directors’ reports for the year ended 31 December 2018.
In our opinion, the remuneration report of ATLIX and ATLAX for the year ended 31 December 2018 comply with section 300A of the Corporations Act 2001 (as applicable).
Responsibilities The directors of ATLIX and ATLAX are responsible for the preparation and presentation of the remuneration report in accordance with section 300A of the Corporations Act 2001 (as applicable). Our responsibility is to express an opinion on the remuneration report, based on our audits conducted in accordance with Australian Auditing Standards.
PricewaterhouseCoopers
SJ Smith Sydney Partner 28 February 2019
For
per
sona
l use
onl
y

| 2018 Atlas Arteria Annual Report112
Securityholder Informationas at 31 January 2019
Distribution of securities Investor Ranges Holders Total securities % of issued securities
1 – 1,000 11,056 4,169,998 0.61
1,001 – 5,000 9,187 23,347,968 3.42
5,001 – 10,000 2,555 18,386,042 2.69
10,001 – 100,000 1,858 43,039,644 6.30
100,001 and over 94 594,321,087 86.98
Total 24,750 683,264,739 100.00
Investors with less than the minimum marketable parcel1 2,465 59,124 0.01
Twenty largest investorsInvestor Number of securities % of issued securities
1. HSBC CUSTODY NOMINEES (AUSTRALIA) LIMITED 271,667,427 39.76
2. J P MORGAN NOMINEES AUSTRALIA PTY LIMITED 124,228,195 18.18
3. CITICORP NOMINEES PTY LIMITED 60,814,148 8.90
4. NATIONAL NOMINEES LIMITED 53,300,009 7.80
5. BNP PARIBAS NOMINEES PTY LTD 24,112,666 3.53
6. BNP PARIBAS NOMS PTY LTD 8,410,727 1.23
7. HSBC CUSTODY NOMINEES (AUSTRALIA) LIMITED 6,478,986 0.95
8. CITICORP NOMINEES PTY LIMITED 4,131,415 0.60
9. BNP PARIBAS NOMS (NZ) LTD 4,095,203 0.60
10. DIVERSIFIED UNITED INVESTMENT LIMITED 3,000,000 0.44
11. AUSTRALIAN UNITED INVESTMENT COMPANY LIMITED 2,526,835 0.37
12. SANDHURST TRUSTEES LTD 2,310,324 0.34
13. DJERRIWARRH INVESTMENTS LIMITED 1,865,000 0.27
14. UBS NOMINEES PTY LTD 1,738,470 0.25
15. AMP LIFE LIMITED 1,683,197 0.25
16. INVIA CUSTODIAN PTY LIMITED 1,242,000 0.18
17. BNP PARIBAS NOMS PTY LTD 1,225,342 0.18
18. CUSTODIAL SERVICES LIMITED 1,152,760 0.17
19. BNP PARIBAS NOMINEES PTY LTD HUB24 CUSTODIAL SERV LTD DRP 1,119,230 0.16
20. MIRRABOOKA INVESTMENTS LIMITED 950,000 0.14
Total 576,051,934 84.31
Details of substantial stapled securityholdersHolder Date of most recent substantial holder notice Number of securities % of issued securities
Lazard Asset Management 2 July 2018 74,314,975 11.10%
Yarra Funds Management 4 December 2017 44,715,685 5.81%
FIL Limited 21 September 2018 40,713,558 5.96%
Deutsche Bank AG 16 September 2018 38,929,779 5.70%
Macquarie Group Limited 31 October 2018 36,534,903 5.34%
Magellan Financial Group Limited 3 October 2018 34,214,121 5.01%
The Vanguard Group, Inc. 12 December 2018 34,163,388 5.00%
1. Minimummarketableparcelis$500.00equatingto76sharesat$6.65persecurity.
For
per
sona
l use
onl
y

2018 Atlas Arteria Annual Report | 113RM #ALX-19001
Corporate Directory
Atlas ArteriaLevel 7, 50 Martin PlaceSydney NSW 2000AustraliaTelephone (Australia): 1800 621 694Telephone (International): +61 2 8232 7455Facsimile: +61 2 8232 4713Email: [email protected]: www.atlasarteria.com
Manager of Atlas Arteria Limited and Adviser toAtlas Arteria International LimitedMacquarie Fund Advisers Pty LimitedABN 84 127 735 960AFS Licence No. 318 123
Atlas Arteria LimitedLevel 7, 50 Martin PlaceSydney NSW 2000Australia
Directors Nora Scheinkestel (Chairman)Debra GoodinDavid BartholomewJean-Georges Malcor
SecretariesLyndal CoatesChristine Williams
Atlas Arteria International LimitedThe Belvedere Building69 Pitts Bay Road Pembroke HM08Bermuda
Directors Jeffrey Conyers (Chairman)James KeyesDerek StapleyChristopher LeslieNora Scheinkestel
SecretaryAndrew Davidson
RegistryComputershare Investor Services Pty LtdGPO Box 2975Melbourne VIC 3001
Telephone: 1800 267 108 or +61 3 9415 4053Facsimile: +61 3 9473 2500Email: [email protected]: www.computershare.com
For
per
sona
l use
onl
y

For
per
sona
l use
onl
y