Embed Size (px)
Citation preview
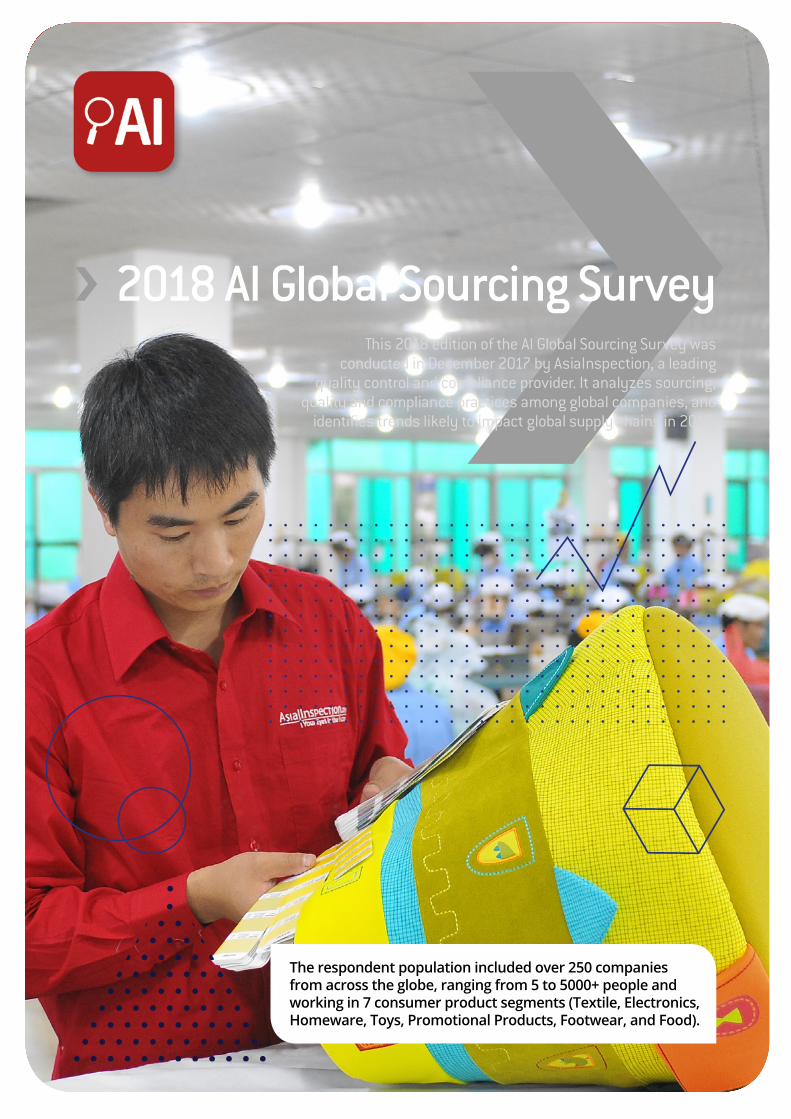
The respondent population included over 250 companies from across the globe, ranging from 5 to 5000+ people and working in 7 consumer product segments (Textile, Electronics, Homeware, Toys, Promotional Products, Footwear, and Food).
› 2018 AI Global Sourcing SurveyThis 2018 edition of the AI Global Sourcing Survey was
conducted in December 2017 by AsiaInspection, a leading quality control and compliance provider. It analyzes sourcing,
quality and compliance practices among global companies, and identifies trends likely to impact global supply chains in 2018.
› Executive Summary› Top sourcing challenges in 2017 and the near future: cost of manufacturing and raw materials
comes first, a trend expected to continue into 2018. Politics then are expected to have a more immediate impact than technology: most of the surveyed businesses anticipate to be affected by tariffs, quotas, protectionism and embargos, rather than automation and 3D printing.
› Sourcing geographies: China remains in the lead, being a regular sourcing destination for nearly 88% of respondents, while half of the businesses expect to buy even more from there in 2018. The Toys and E&E sectors favor China particularly strongly, albeit Vietnam has some standing as its competitor in the Footwear industry. Meanwhile, buying patterns in the Food sector were the most varied, with sourcing geographies ranging from Turkey to Latin America, and understandably high importance of home regions.
› Sourcing practices: up to half of respondents prefer to combine direct outsourcing with cooperation through intermediary vendors. The average rate of supplier turnover is around 27%, but the largest companies shop around much more, replacing up to 42% of their suppliers in a typical year.
› Supply chain visibility remains a strong challenge, with an average respondent knowing only around 55% of the suppliers involved in the making of their products. Complete visibility into their supply chain was only achieved by 11% of respondents, while 89% of surveyed businesses have blind spots in their supply chains.
› Ethical compliance: two-thirds of respondents are optimistic about the progress of supplier compliance and most expect it to be even less of a concern in 2018. However, the survey data has revealed obvious gaps in auditing practices: 19% of respondents have no clear policy on the frequency of supplier audits, and 18.5% rely on their in-house audit protocol as their sole compliance framework.
› Product quality, safety, and regulatory compliance: 70% of companies estimated that their product quality has improved in 2017, but only 54% would say the same about their product’s safety and regulatory compliance. Nevertheless, in the coming year businesses expect to worry more about managing product quality than they did in 2017, while regulatory compliance is expected to be less of a challenge.
2018 Global Sourcing Survey2018 Global Sourcing Survey
› Table of contents1 AI Sourcing Survey: Global Quality and Compliance
2 Executive Summary
4 1. Sourcing Geographies
4 1.1. Sourcing destinations by prevalence
5 1.2. Top sourcing destinations by industry
6 1.3. Sourcing destinations by volume
7 2. Supply Chain Practices
7 2.1. Outsourcing models
7 2.1.1. Outsourcing models and company size
8 2.1.2. Outsourcing model preferences by industry
9 2.2. Supplier management and supply chain visibility
9 2.2.1. Supplier portfolio renewal rate
10 2.2.2. Supply chain visibility
11 3. Quality Control and Compliance
11 3.1. Overall trends and impact
12 3.2. Impact by industry
12 3.2.1. Product quality trends by industry
13 3.2.2. Supplier compliance trends by industry
14 3.2.3. Product safety and compliance trends by industry
15 3.3. Tools and Methodologies
15 3.3.1. Product inspections
15 Product inspection KPIs
15 Financial responsibility
16 3.3.2 . Supplier audits
16 Auditing cycle and frequency
16 Supplier Audit KPIs
17 Auditing frameworks and protocols
19 3.3.3. Lab Tests
19 Primary purpose of testing
20 Testing cycle
21 Product testing KPIs
22 4. Sourcing Challenges, Expectations, and Prospects
22 4.1. Evolution of sourcing geographies in 2018
25 4.2. Top sourcing challenges: 2017 vs. 2018
27 4.3. Expected impact of trade and manufacturing trends in 2018-20
2018 Global Sourcing Survey2018 Global Sourcing Survey
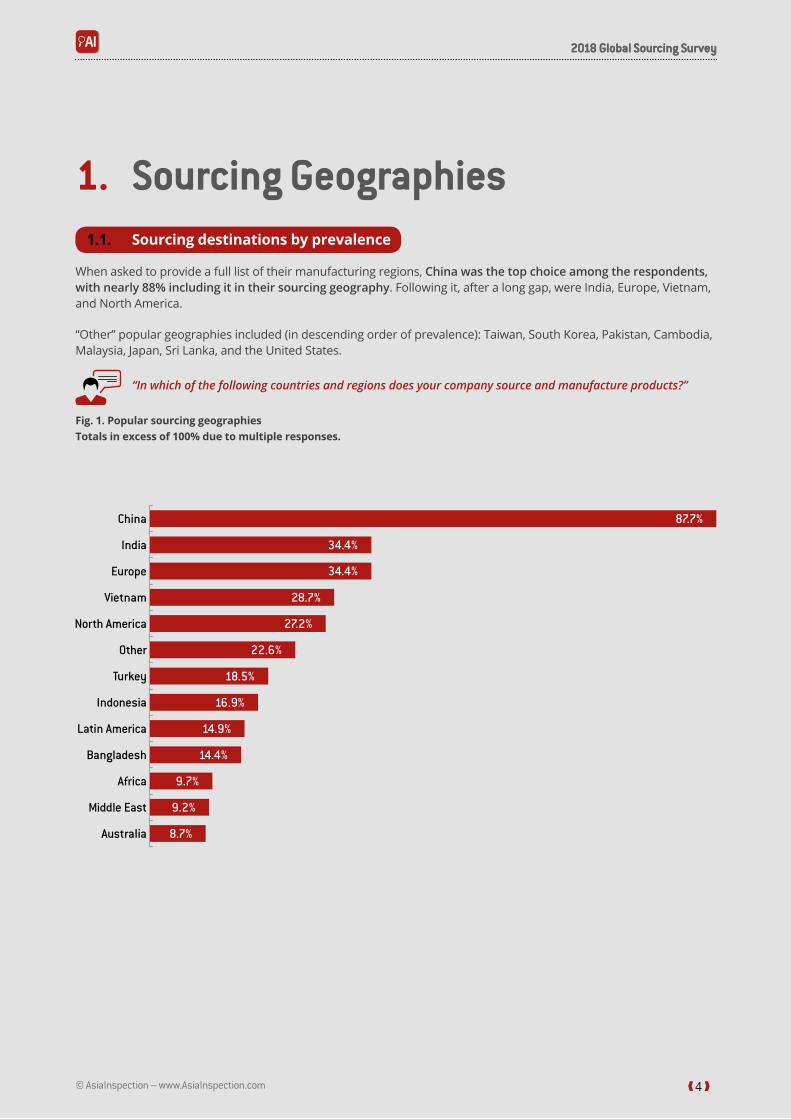
1. Sourcing Geographies 1.1. Sourcing destinations by prevalence
When asked to provide a full list of their manufacturing regions, China was the top choice among the respondents, with nearly 88% including it in their sourcing geography. Following it, after a long gap, were India, Europe, Vietnam, and North America.
“Other” popular geographies included (in descending order of prevalence): Taiwan, South Korea, Pakistan, Cambodia, Malaysia, Japan, Sri Lanka, and the United States.
“In which of the following countries and regions does your company source and manufacture products?”
Fig. 1. Popular sourcing geographies Totals in excess of 100% due to multiple responses.
China
India
Europe
Vietnam
North America
Other
Turkey
Indonesia
Latin America
Bangladesh
Africa
Middle East
Australia
87.7%
34.4%
34.4%
28.7%
27.2%
22.6%
18.5%
16.9%
14.9%
14.4%
9.7%
9.2%
8.7%
Fig. 1. Popular sourcing geographiesTotals in excess of 100% due to multiple responses.
❰ 4 ❱
2018 Global Sourcing Survey2018 Global Sourcing Survey
© AsiaInspection – www.AsiaInspection.com
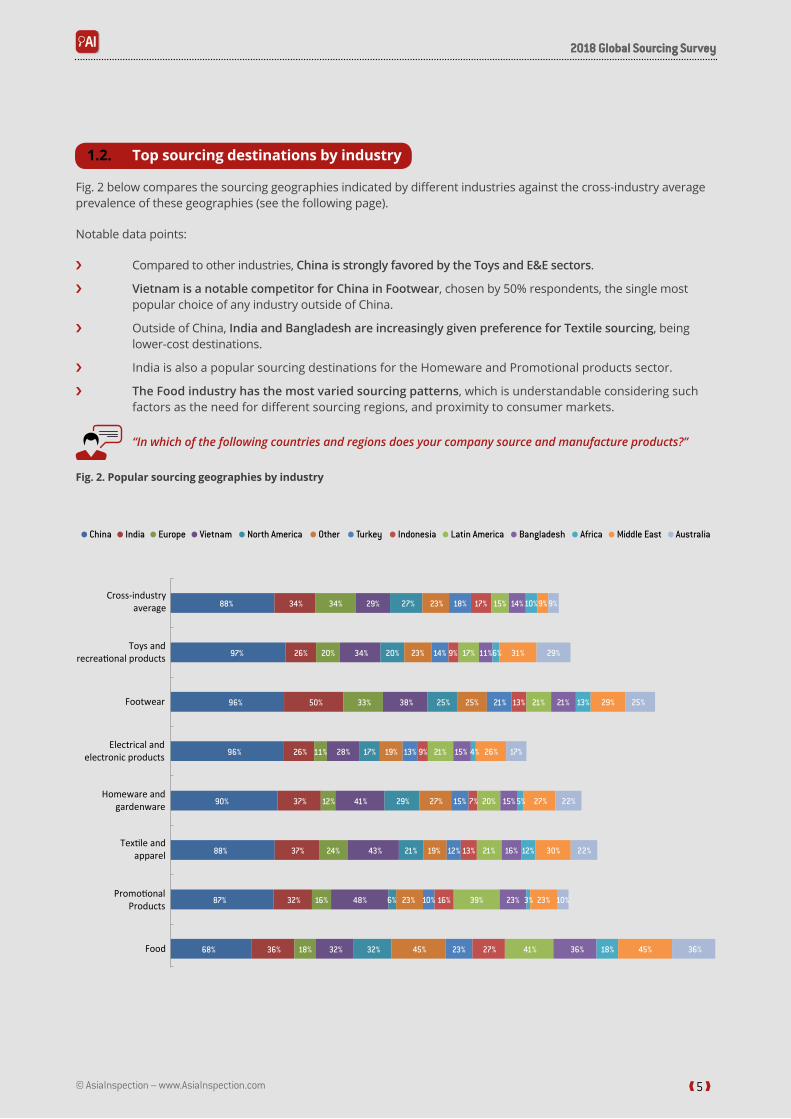
1.2. Top sourcing destinations by industry
Fig. 2 below compares the sourcing geographies indicated by different industries against the cross-industry average prevalence of these geographies (see the following page).
Notable data points:
› Compared to other industries, China is strongly favored by the Toys and E&E sectors.
› Vietnam is a notable competitor for China in Footwear, chosen by 50% respondents, the single most popular choice of any industry outside of China.
› Outside of China, India and Bangladesh are increasingly given preference for Textile sourcing, being lower-cost destinations.
› India is also a popular sourcing destinations for the Homeware and Promotional products sector.
› The Food industry has the most varied sourcing patterns, which is understandable considering such factors as the need for different sourcing regions, and proximity to consumer markets.
“In which of the following countries and regions does your company source and manufacture products?”
Fig. 2. Popular sourcing geographies by industry
88%
97%
96%
96%
90%
88%
87%
68%
34%
26%
50%
26% 11%
37% 12%
37%
32%
36%
34%
20%
33%
24%
16%
18%
29%
34%
38%
28%
41%
43%
48%
32%
27%
20%
25%
17% 13% 9%
29%
21%
32%
23%
23%
25%
19%
27%
19% 12%
23%
45%
18%
14% 9% 6%
21%
15% 7% 5%
23%
17%
13%
13%
16%
27%
15%
17%
21%
21%
20%
21%
39%
41%
14%
11%
21%
15% 4%
15%
16%
23%
36%
13%
12%
18%
31%
29%
26%
27%
30%
23%
45%
9%9%10%
29%
25%
17%
22%
22%
10%3%10%6%
36%
Cross-industryaverage
Toys andrecreational products
Footwear
Electrical andelectronic products
Homeware andgardenware
Textile andapparel
PromotionalProducts
Food
China India Europe Vietnam North America Other Turkey Indonesia Latin America Bangladesh Africa Middle East Australia
❰ 5 ❱
2018 Global Sourcing Survey2018 Global Sourcing Survey
© AsiaInspection – www.AsiaInspection.com
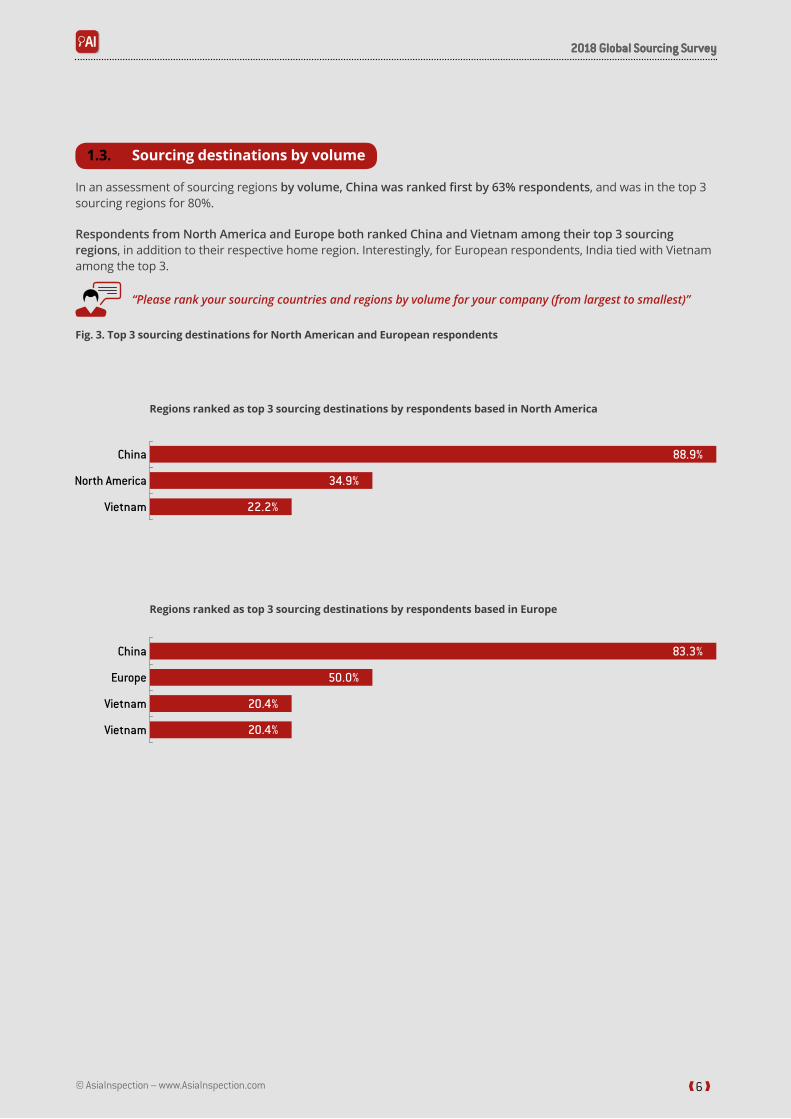
1.3. Sourcing destinations by volume
In an assessment of sourcing regions by volume, China was ranked first by 63% respondents, and was in the top 3 sourcing regions for 80%.
Respondents from North America and Europe both ranked China and Vietnam among their top 3 sourcing regions, in addition to their respective home region. Interestingly, for European respondents, India tied with Vietnam among the top 3.
“Please rank your sourcing countries and regions by volume for your company (from largest to smallest)”
Fig. 3. Top 3 sourcing destinations for North American and European respondents
Regions ranked as top 3 sourcing destinations by respondents based in North America
Regions ranked as top 3 sourcing destinations by respondents based in Europe
❰ 6 ❱
North America
Vietnam
China 88.9%
34.9%
22.2%
Europe
Vietnam
China 83.3%
50.0%
20.4%
Vietnam
20.4%
20.4%
© AsiaInspection – www.AsiaInspection.com
2018 Global Sourcing Survey2018 Global Sourcing Survey
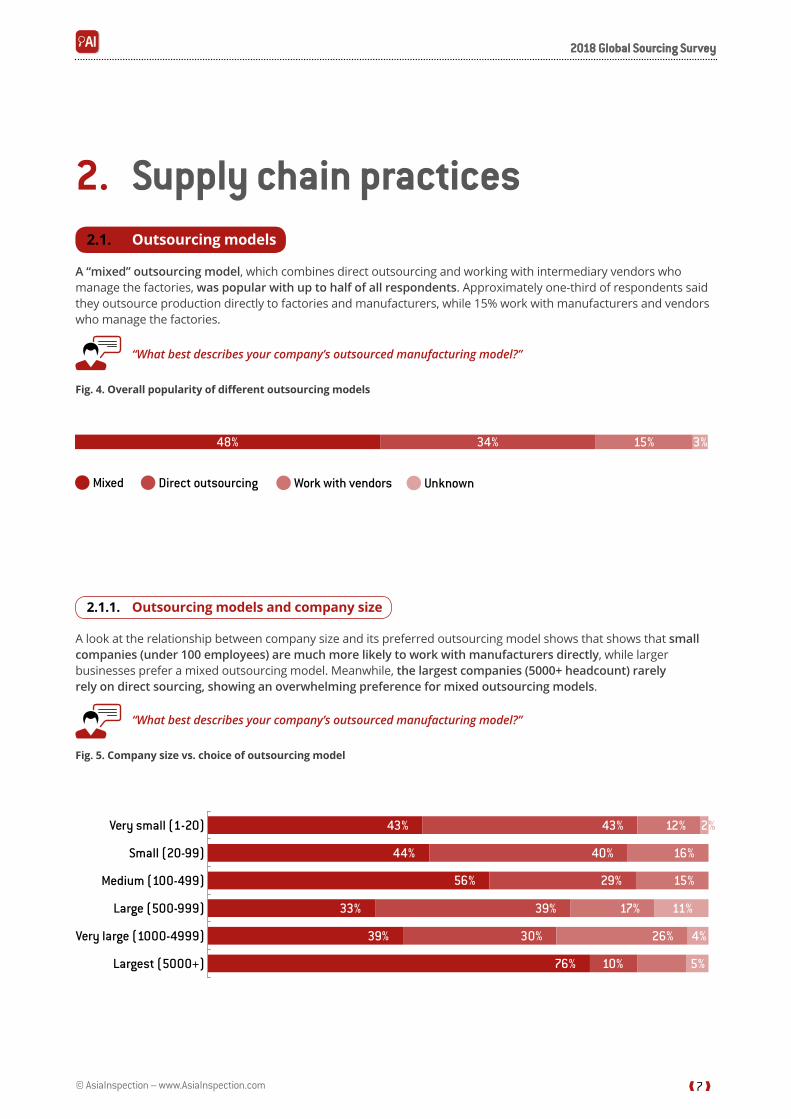
2. Supply chain practices 2.1. Outsourcing models
A “mixed” outsourcing model, which combines direct outsourcing and working with intermediary vendors who manage the factories, was popular with up to half of all respondents. Approximately one-third of respondents said they outsource production directly to factories and manufacturers, while 15% work with manufacturers and vendors who manage the factories.
“What best describes your company’s outsourced manufacturing model?”
Fig. 4. Overall popularity of different outsourcing models
2.1.1. Outsourcing models and company size
A look at the relationship between company size and its preferred outsourcing model shows that shows that small companies (under 100 employees) are much more likely to work with manufacturers directly, while larger businesses prefer a mixed outsourcing model. Meanwhile, the largest companies (5000+ headcount) rarely rely on direct sourcing, showing an overwhelming preference for mixed outsourcing models.
“What best describes your company’s outsourced manufacturing model?”
Fig. 5. Company size vs. choice of outsourcing model
❰ 7 ❱
Fig. 4. Overall popularity of di�erent outsourcing models
48% 34% 15% 3%
Mixed Direct outsourcing Work with vendors Unknown
Fig. 5. Company size vs. choice of outsourcing model
Very small (1-20)
Small (20-99)
Medium (100-499)
Large (500-999)
Very large (1000-4999)
Largest (5000+)
44%
43%
56%
33%
39%
76%
40%
43%
29%
39%
30%
10%
16%
12%
15%
17%
26%
10%
2%
11%
4%
5%
© AsiaInspection – www.AsiaInspection.com
2018 Global Sourcing Survey2018 Global Sourcing Survey
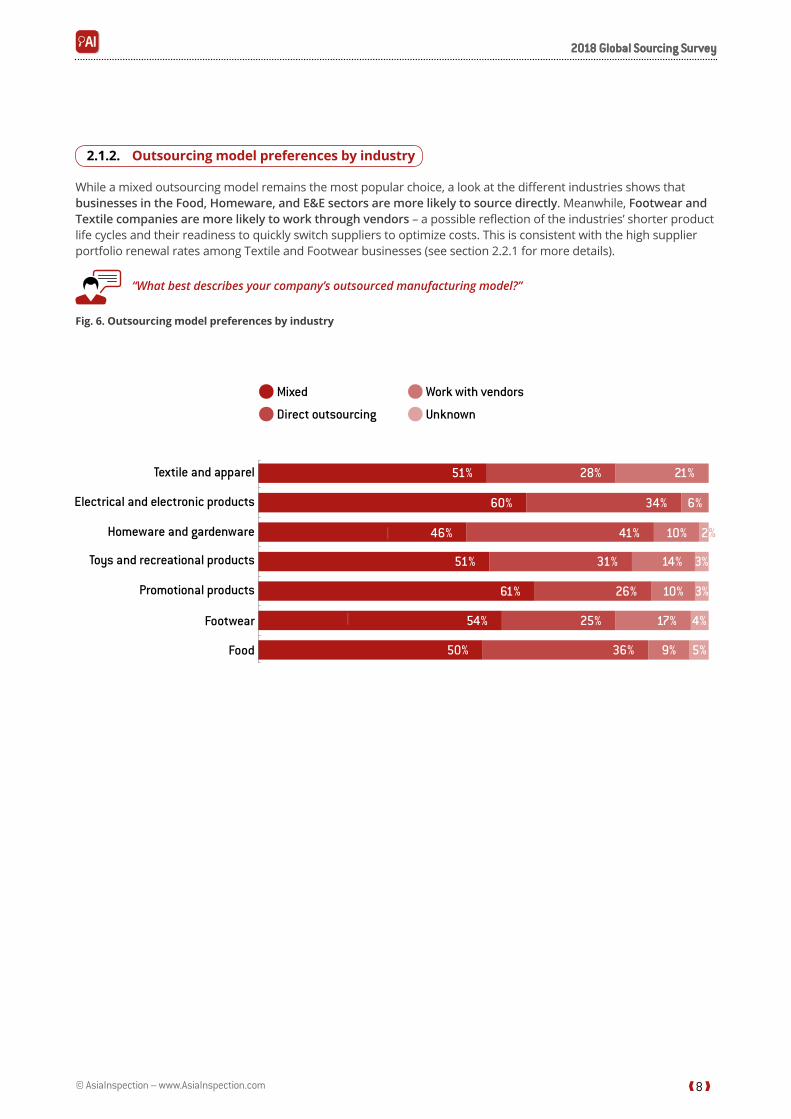
2.1.2. Outsourcing model preferences by industry
While a mixed outsourcing model remains the most popular choice, a look at the different industries shows that businesses in the Food, Homeware, and E&E sectors are more likely to source directly. Meanwhile, Footwear and Textile companies are more likely to work through vendors – a possible reflection of the industries’ shorter product life cycles and their readiness to quickly switch suppliers to optimize costs. This is consistent with the high supplier portfolio renewal rates among Textile and Footwear businesses (see section 2.2.1 for more details).
“What best describes your company’s outsourced manufacturing model?”
Fig. 6. Outsourcing model preferences by industry
❰ 8 ❱
Fig. 6. Outsourcing model preferences by industry
Mixed
Direct outsourcing
Work with vendors
Unknown
21%28%51%
6%
10%
14%
54%
50% 36% 9%
41%
31%
26%
25%
46%
51%
61% 10%
17%
2%
3%
5%
3%
4%
34%60%
© AsiaInspection – www.AsiaInspection.com
2018 Global Sourcing Survey2018 Global Sourcing Survey
2.2. Supplier management and supply chain visibility
2.2.1. Supplier portfolio renewal rate
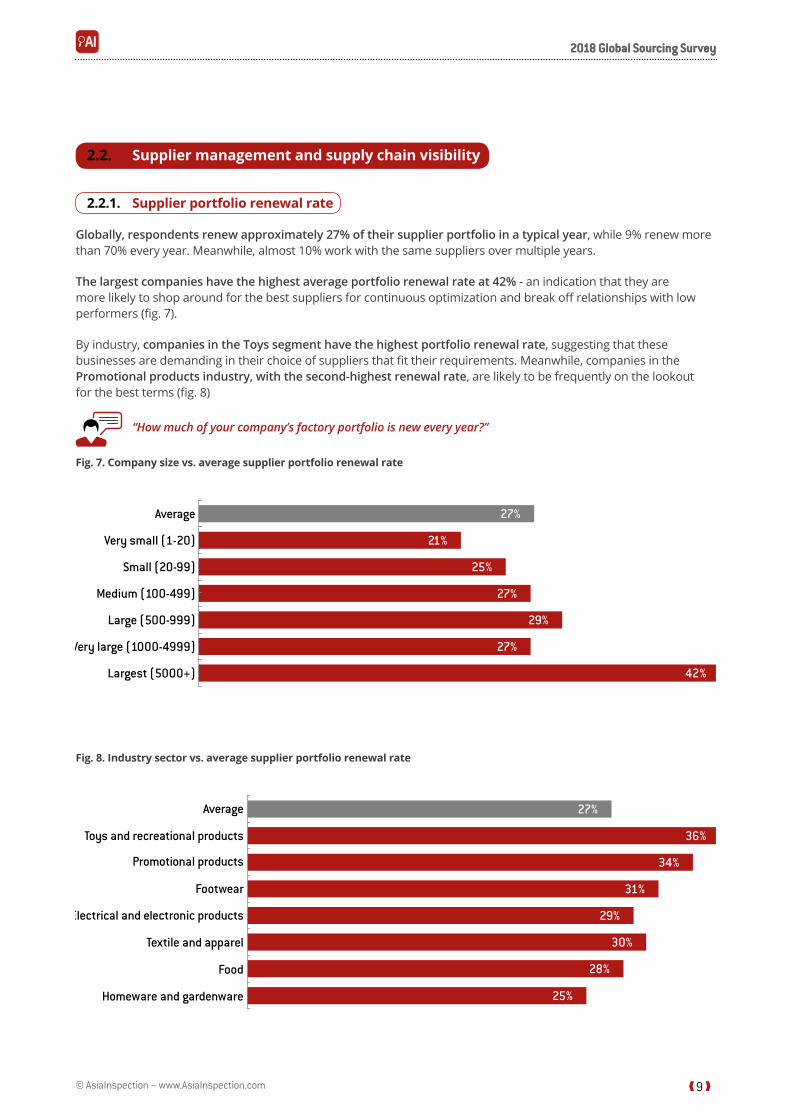
Globally, respondents renew approximately 27% of their supplier portfolio in a typical year, while 9% renew more than 70% every year. Meanwhile, almost 10% work with the same suppliers over multiple years.
The largest companies have the highest average portfolio renewal rate at 42% - an indication that they are more likely to shop around for the best suppliers for continuous optimization and break off relationships with low performers (fig. 7).
By industry, companies in the Toys segment have the highest portfolio renewal rate, suggesting that these businesses are demanding in their choice of suppliers that fit their requirements. Meanwhile, companies in the Promotional products industry, with the second-highest renewal rate, are likely to be frequently on the lookout for the best terms (fig. 8)
“How much of your company’s factory portfolio is new every year?”
Fig. 7. Company size vs. average supplier portfolio renewal rate
Fig. 8. Industry sector vs. average supplier portfolio renewal rate
❰ 9 ❱
Fig. 7. Company size vs. average supplier portfolio renewal rate
Very small (1-20)
Small (20-99)
Medium (100-499)
Large (500-999)
Very large (1000-4999)
Largest (5000+)
Average
21%
25%
27%
29%
27%
42%
27%
36%
34%
31%
29%
30%
28%
25%
27%
Fig. 8. Industry sector vs. average supplier portfolio renewal rate
© AsiaInspection – www.AsiaInspection.com
2018 Global Sourcing Survey2018 Global Sourcing Survey
2.2.2. Supply chain visibility
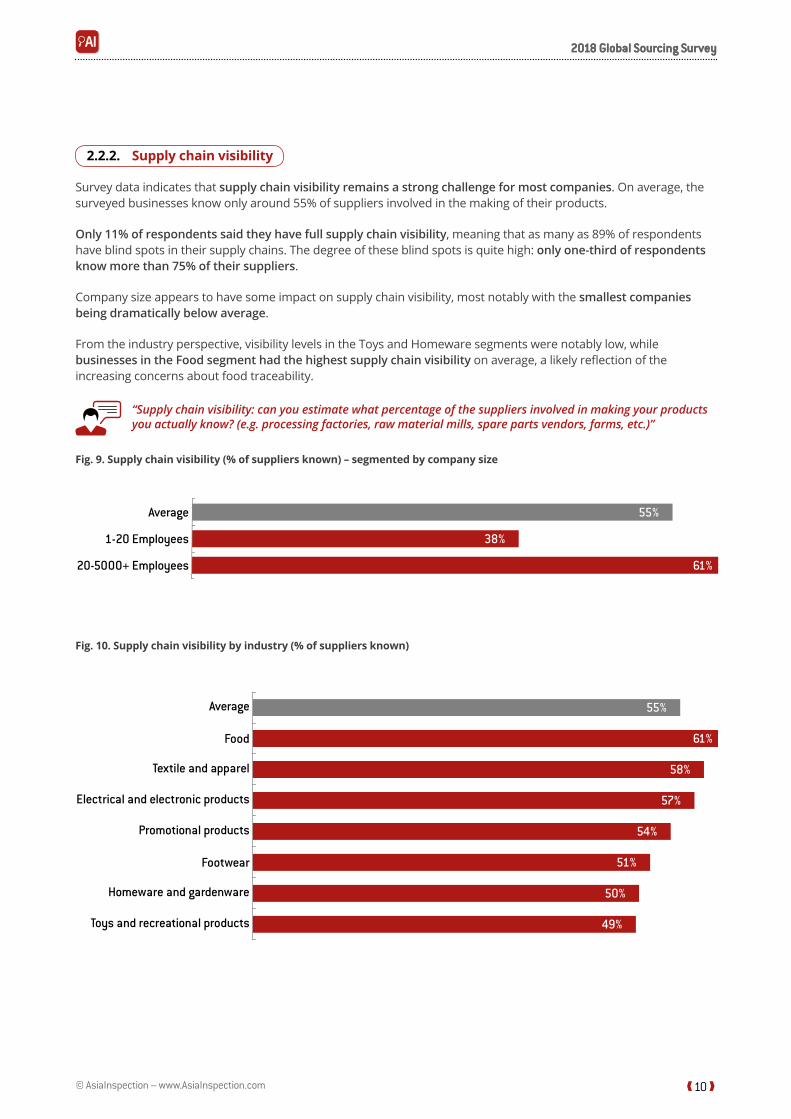
Survey data indicates that supply chain visibility remains a strong challenge for most companies. On average, the surveyed businesses know only around 55% of suppliers involved in the making of their products.
Only 11% of respondents said they have full supply chain visibility, meaning that as many as 89% of respondents have blind spots in their supply chains. The degree of these blind spots is quite high: only one-third of respondents know more than 75% of their suppliers.
Company size appears to have some impact on supply chain visibility, most notably with the smallest companies being dramatically below average.
From the industry perspective, visibility levels in the Toys and Homeware segments were notably low, while businesses in the Food segment had the highest supply chain visibility on average, a likely reflection of the increasing concerns about food traceability.
“Supplychainvisibility:canyouestimatewhatpercentageofthesuppliersinvolvedinmaking yourproductsyou actually know? (e.g. processing factories, raw material mills, spare parts vendors, farms, etc.)”
Fig. 9. Supply chain visibility (% of suppliers known) – segmented by company size
Fig. 10. Supply chain visibility by industry (% of suppliers known)
❰ 10 ❱
Fig. 9. Supply chain visibility (% of suppliers known) – segmented by company size
1-20 Employees
20-5000+ Employees
Average
38%
61%
55%
55%
61%
58%
57%
54%
51%
50%
49%
Fig. 10. Supply chain visibility by industry (% of suppliers known)
© AsiaInspection – www.AsiaInspection.com
2018 Global Sourcing Survey2018 Global Sourcing Survey
❰ 11 ❱
3. Quality Control and Compliance 3.1. Overall trends and impact
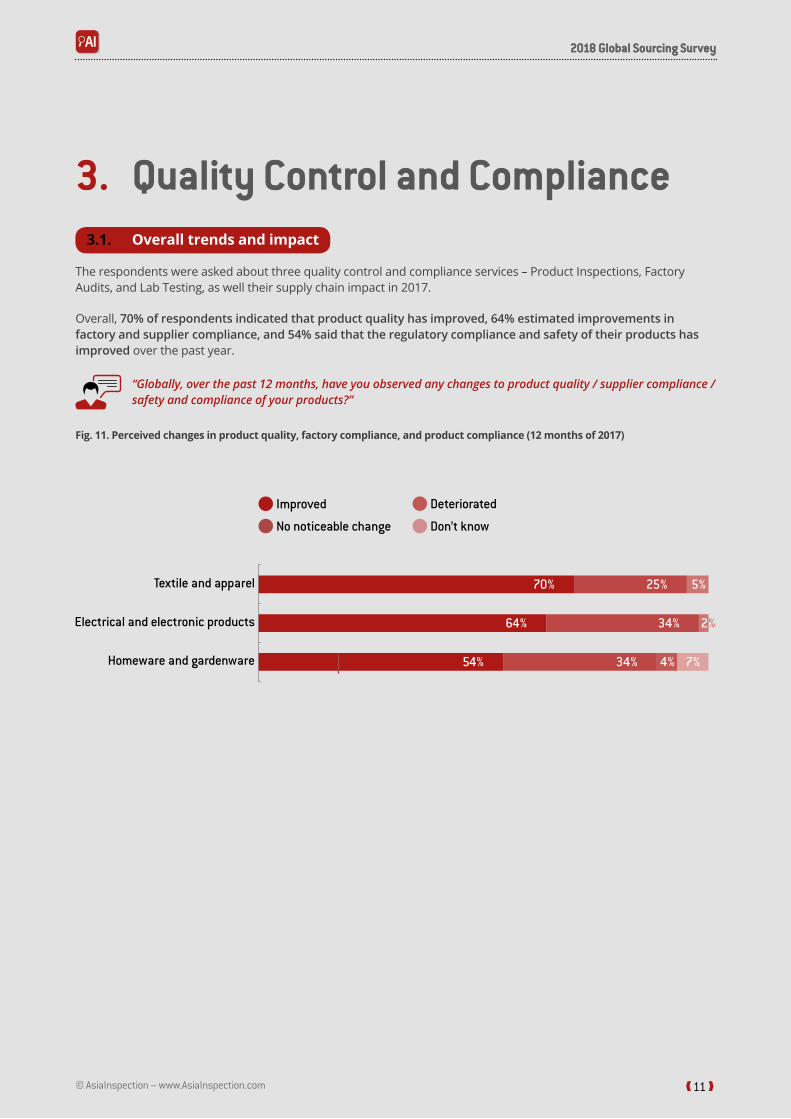
The respondents were asked about three quality control and compliance services – Product Inspections, Factory Audits, and Lab Testing, as well their supply chain impact in 2017.
Overall, 70% of respondents indicated that product quality has improved, 64% estimated improvements in factory and supplier compliance, and 54% said that the regulatory compliance and safety of their products has improved over the past year.
“Globally,overthepast12months,haveyouobservedanychangesto productquality/suppliercompliance/safety and compliance of your products?”
Fig. 11. Perceived changes in product quality, factory compliance, and product compliance (12 months of 2017)
No noticeable change
Deteriorated
Don’t know
Improved
Fig. 11. Perceived changes in product quality, factory compliance, and product compliance (12months of 2017)
70% 25%
64%
54% 34% 4% 7%
34%
5%
2%
© AsiaInspection – www.AsiaInspection.com
2018 Global Sourcing Survey2018 Global Sourcing Survey
3.2. Impact by industry
3.2.1. Product quality trends by industry
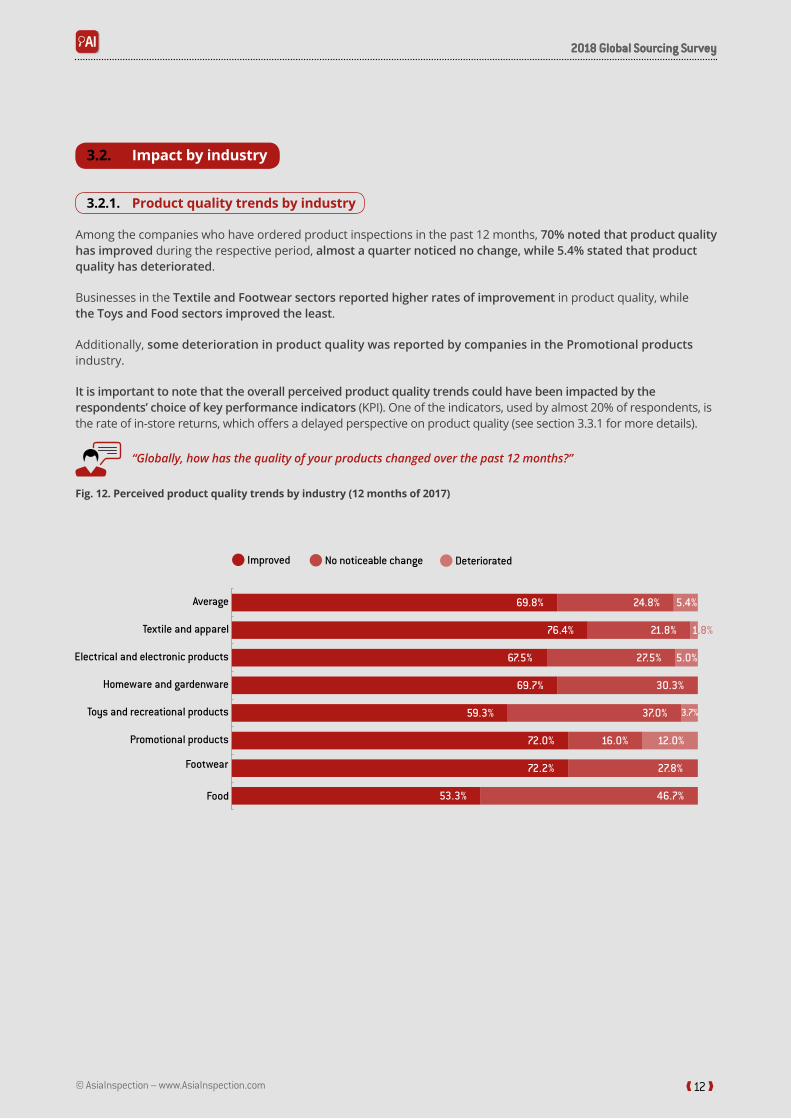
Among the companies who have ordered product inspections in the past 12 months, 70% noted that product quality has improved during the respective period, almost a quarter noticed no change, while 5.4% stated that product quality has deteriorated.
Businesses in the Textile and Footwear sectors reported higher rates of improvement in product quality, while the Toys and Food sectors improved the least.
Additionally, some deterioration in product quality was reported by companies in the Promotional products industry.
It is important to note that the overall perceived product quality trends could have been impacted by the respondents’ choice of key performance indicators (KPI). One of the indicators, used by almost 20% of respondents, is the rate of in-store returns, which offers a delayed perspective on product quality (see section 3.3.1 for more details).
“Globally,howhasthequalityofyourproductschangedoverthepast12months?”
Fig. 12. Perceived product quality trends by industry (12 months of 2017)
❰ 12 ❱
No noticeable change DeterioratedImproved
69.8%
76.4%
67.5%
69.7%
59.3%
72.0%
72.2%
53.3% 46.7%
24.8%
21.8%
27.5%
30.3%
37.0%
16.0%
5.4%
5.0%
1.8%
3.7%
12.0%
27.8%
Fig. 12. Perceived product quality trends by industry (12 months of 2017)
© AsiaInspection – www.AsiaInspection.com
2018 Global Sourcing Survey2018 Global Sourcing Survey
3.2.2. Supplier compliance trends by industry
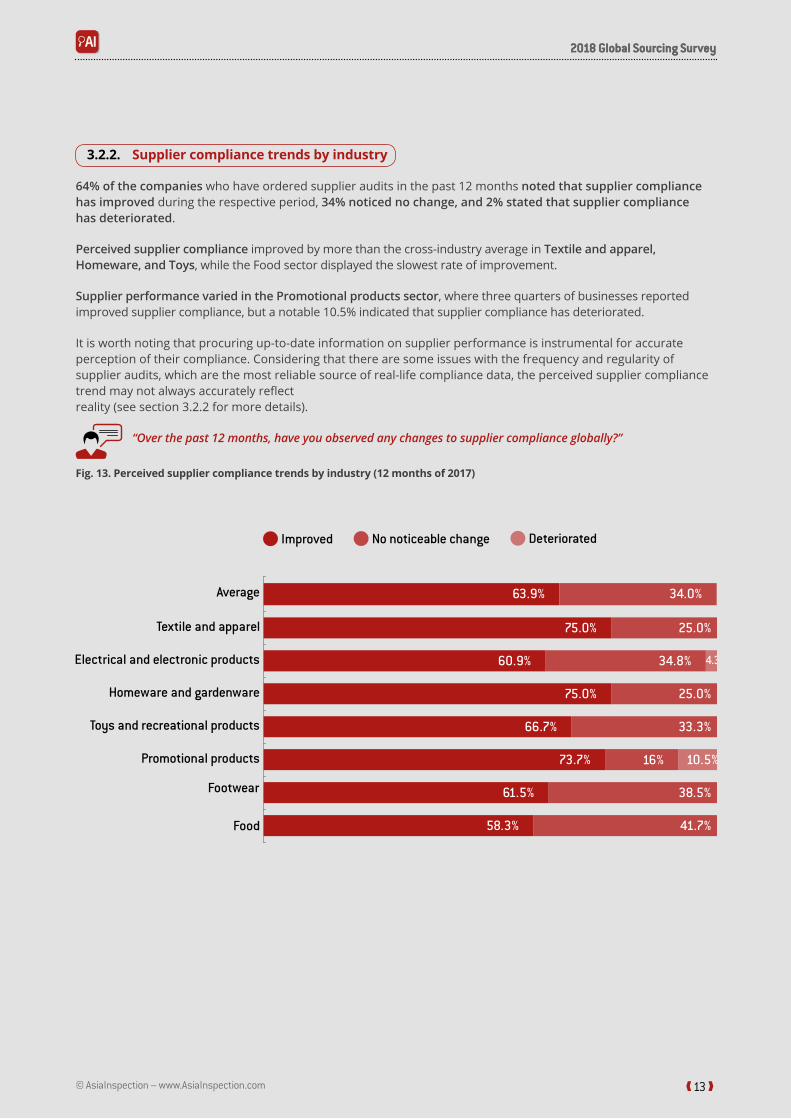
64% of the companies who have ordered supplier audits in the past 12 months noted that supplier compliance has improved during the respective period, 34% noticed no change, and 2% stated that supplier compliance has deteriorated.
Perceived supplier compliance improved by more than the cross-industry average in Textile and apparel, Homeware, and Toys, while the Food sector displayed the slowest rate of improvement.
Supplier performance varied in the Promotional products sector, where three quarters of businesses reported improved supplier compliance, but a notable 10.5% indicated that supplier compliance has deteriorated.
It is worth noting that procuring up-to-date information on supplier performance is instrumental for accurate perception of their compliance. Considering that there are some issues with the frequency and regularity of supplier audits, which are the most reliable source of real-life compliance data, the perceived supplier compliance trend may not always accurately reflect reality (see section 3.2.2 for more details).
“Overthepast12months,haveyouobservedanychangesto suppliercomplianceglobally?”
Fig. 13. Perceived supplier compliance trends by industry (12 months of 2017)
❰ 13 ❱
No noticeable change DeterioratedImproved
4.3%
10.5%
63.9%
75.0%
60.9%
75.0%
73.7%
61.5%
66.7%
58.3%
34.0%
25.0%
34.8%
25.0%
16%
38.5%
33.3%
41.7%
2.1%
© AsiaInspection – www.AsiaInspection.com
2018 Global Sourcing Survey2018 Global Sourcing Survey
3.2.3. Product safety and compliance trends by industry
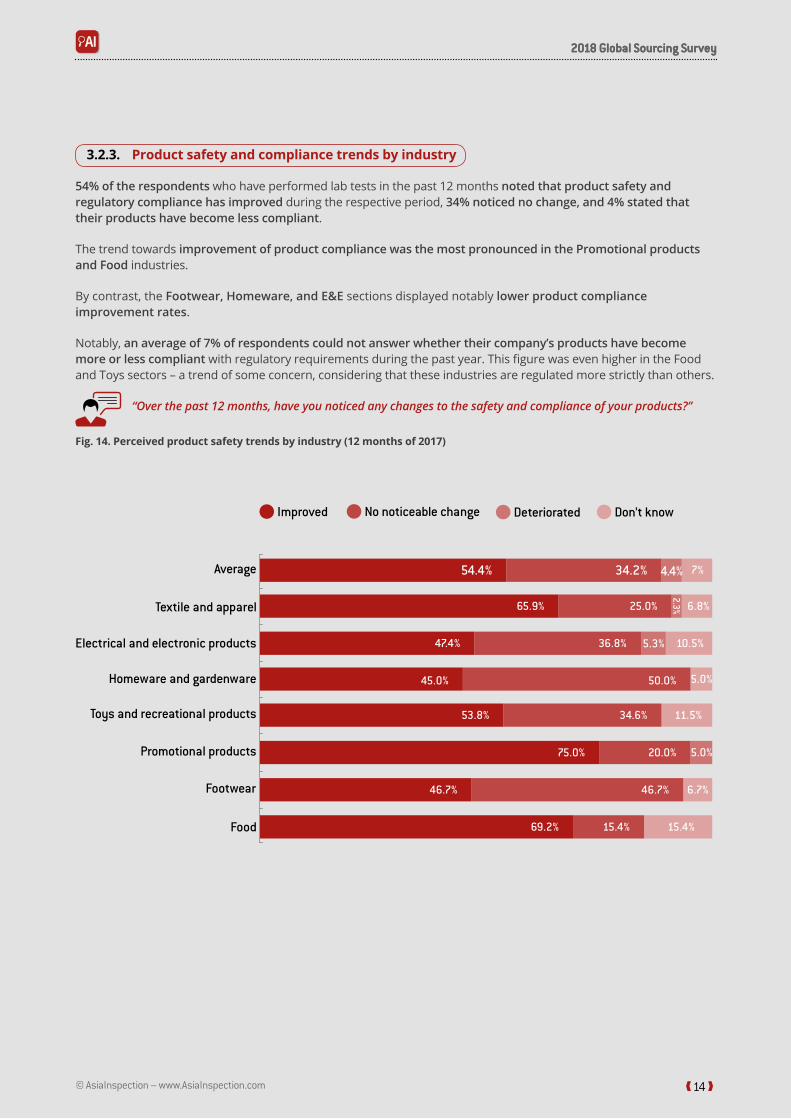
54% of the respondents who have performed lab tests in the past 12 months noted that product safety and regulatory compliance has improved during the respective period, 34% noticed no change, and 4% stated that their products have become less compliant.
The trend towards improvement of product compliance was the most pronounced in the Promotional products and Food industries.
By contrast, the Footwear, Homeware, and E&E sections displayed notably lower product compliance improvement rates.
Notably, an average of 7% of respondents could not answer whether their company’s products have become more or less compliant with regulatory requirements during the past year. This figure was even higher in the Food and Toys sectors – a trend of some concern, considering that these industries are regulated more strictly than others.
“Overthepast12months, haveyounoticedanychangestothesafetyandcomplianceofyourproducts?”
Fig. 14. Perceived product safety trends by industry (12 months of 2017)
❰ 14 ❱
Fig. 14. Perceived product safety trends by industry (12 months of 2017)
54.4%
65.9%
47.4%
45.0%
25.0%
36.8%
50.0%
53.8% 34.6%
75.0% 20.0%
46.7%
69.2%
46.7%
7%
6.8%
10.5%
5.0%
5.0%
11.5%
6.7%
15.4%15.4%
34.2%
5.3%
4.4%
Don’t knowNo noticeable change DeterioratedImproved
2.3%
© AsiaInspection – www.AsiaInspection.com
2018 Global Sourcing Survey2018 Global Sourcing Survey
3.3. Tools and methodologies
3.3.1. Production inspections
Product inspection KPIs
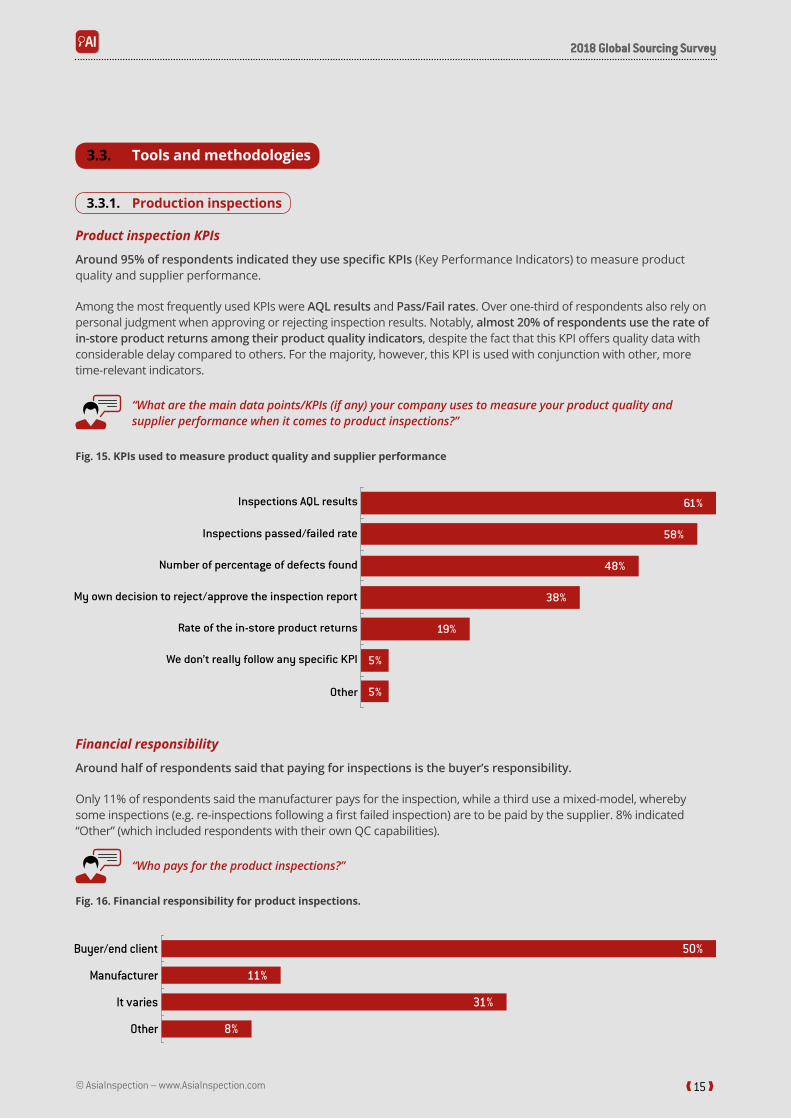
Around 95% of respondents indicated they use specific KPIs (Key Performance Indicators) to measure product quality and supplier performance.
Among the most frequently used KPIs were AQL results and Pass/Fail rates. Over one-third of respondents also rely on personal judgment when approving or rejecting inspection results. Notably, almost 20% of respondents use the rate of in-store product returns among their product quality indicators, despite the fact that this KPI offers quality data with considerable delay compared to others. For the majority, however, this KPI is used with conjunction with other, more time-relevant indicators.
“Whatarethemaindatapoints/KPIs(ifany)yourcompanyusestomeasureyour productqualityandsupplier performance when it comes to product inspections?”
Fig. 15. KPIs used to measure product quality and supplier performance
Financial responsibility
Around half of respondents said that paying for inspections is the buyer’s responsibility.
Only 11% of respondents said the manufacturer pays for the inspection, while a third use a mixed-model, whereby some inspections (e.g. re-inspections following a first failed inspection) are to be paid by the supplier. 8% indicated “Other” (which included respondents with their own QC capabilities).
“Who pays for the product inspections?”
Fig. 16. Financial responsibility for product inspections.
❰ 15 ❱
61%
58%
48%
38%
19%
5%
5%
Fig. 16. Financial responsibility for product inspections
Manufacturer
It varies
Other
Buyer/end client
11%
31%
8%
50%
© AsiaInspection – www.AsiaInspection.com
2018 Global Sourcing Survey2018 Global Sourcing Survey
❰ 16 ❱
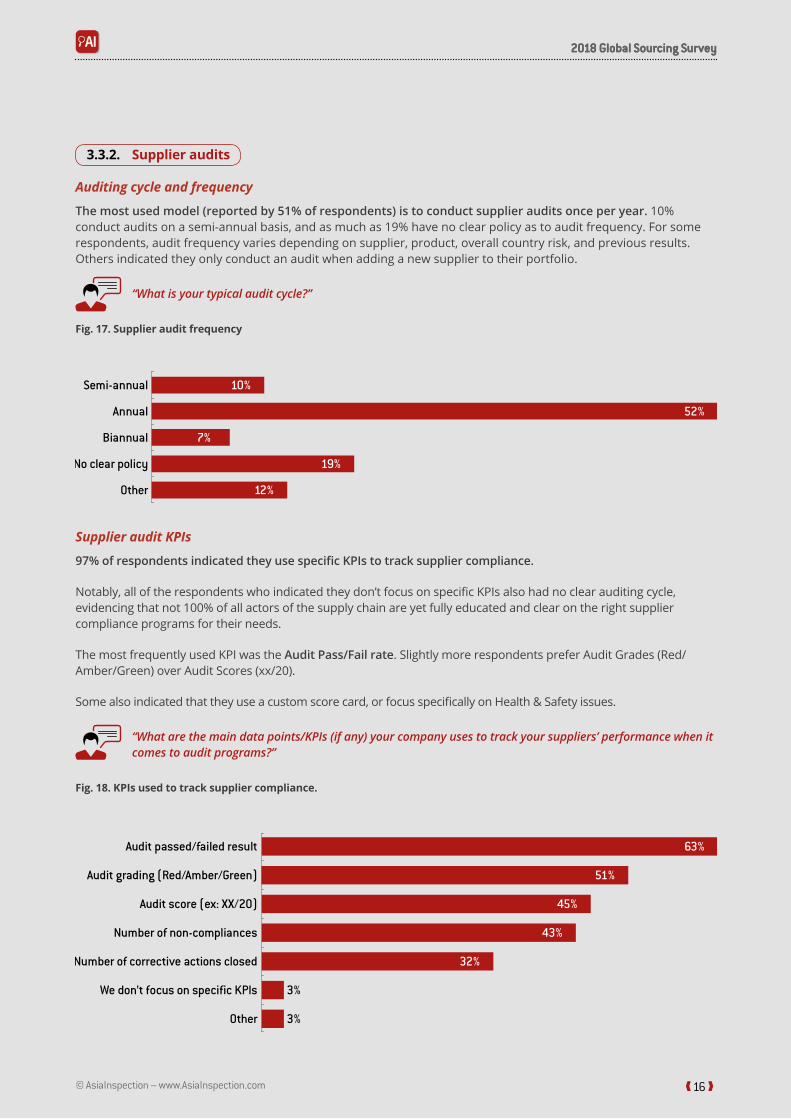
3.3.2. Supplier audits
Auditing cycle and frequency
The most used model (reported by 51% of respondents) is to conduct supplier audits once per year. 10% conduct audits on a semi-annual basis, and as much as 19% have no clear policy as to audit frequency. For some respondents, audit frequency varies depending on supplier, product, overall country risk, and previous results. Others indicated they only conduct an audit when adding a new supplier to their portfolio.
“What is your typical audit cycle?”
Fig. 17. Supplier audit frequency
Supplier audit KPIs
97% of respondents indicated they use specific KPIs to track supplier compliance.
Notably, all of the respondents who indicated they don’t focus on specific KPIs also had no clear auditing cycle, evidencing that not 100% of all actors of the supply chain are yet fully educated and clear on the right supplier compliance programs for their needs.
The most frequently used KPI was the Audit Pass/Fail rate. Slightly more respondents prefer Audit Grades (Red/Amber/Green) over Audit Scores (xx/20).
Some also indicated that they use a custom score card, or focus specifically on Health & Safety issues.
“Whatarethemaindatapoints/KPIs(ifany)yourcompanyusestotrackyoursuppliers’performancewhenitcomes to audit programs?”
Fig. 18. KPIs used to track supplier compliance.
Annual
Biannual
No clear policy
Other
Semi-annual
52%
7%
19%
12%
10%
Fig. 18. KPIs used to track supplier compliance
Audit passed/failed result
Audit grading (Red/Amber/Green)
Audit score (ex: XX/20)
Number of non-compliances
Number of corrective actions closed
We don’t focus on specific KPIs
Other
63%
51%
45%
43%
32%
3%
3%
© AsiaInspection – www.AsiaInspection.com
2018 Global Sourcing Survey2018 Global Sourcing Survey
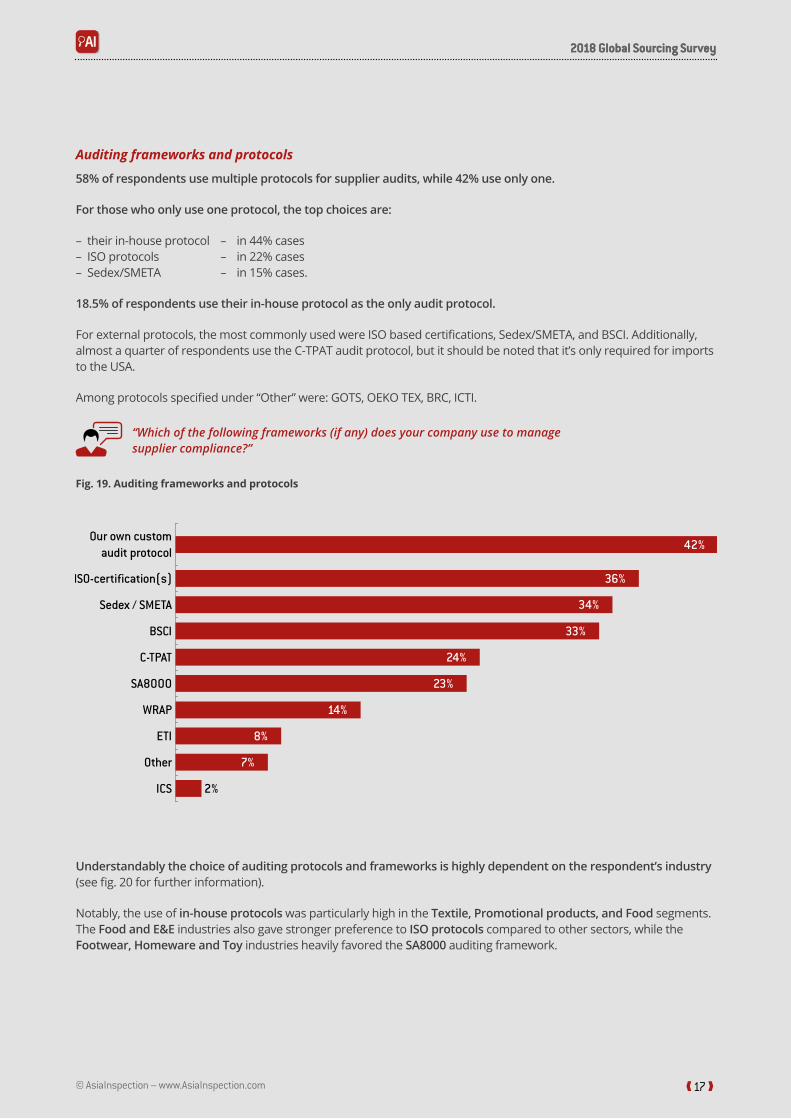
Auditing frameworks and protocols
58% of respondents use multiple protocols for supplier audits, while 42% use only one.
For those who only use one protocol, the top choices are:
– their in-house protocol – in 44% cases– ISO protocols – in 22% cases– Sedex/SMETA – in 15% cases.
18.5% of respondents use their in-house protocol as the only audit protocol.
For external protocols, the most commonly used were ISO based certifications, Sedex/SMETA, and BSCI. Additionally, almost a quarter of respondents use the C-TPAT audit protocol, but it should be noted that it’s only required for imports to the USA.
Among protocols specified under “Other” were: GOTS, OEKO TEX, BRC, ICTI.
“Which of the following frameworks (if any) does your company use to manage supplier compliance?”
Fig. 19. Auditing frameworks and protocols
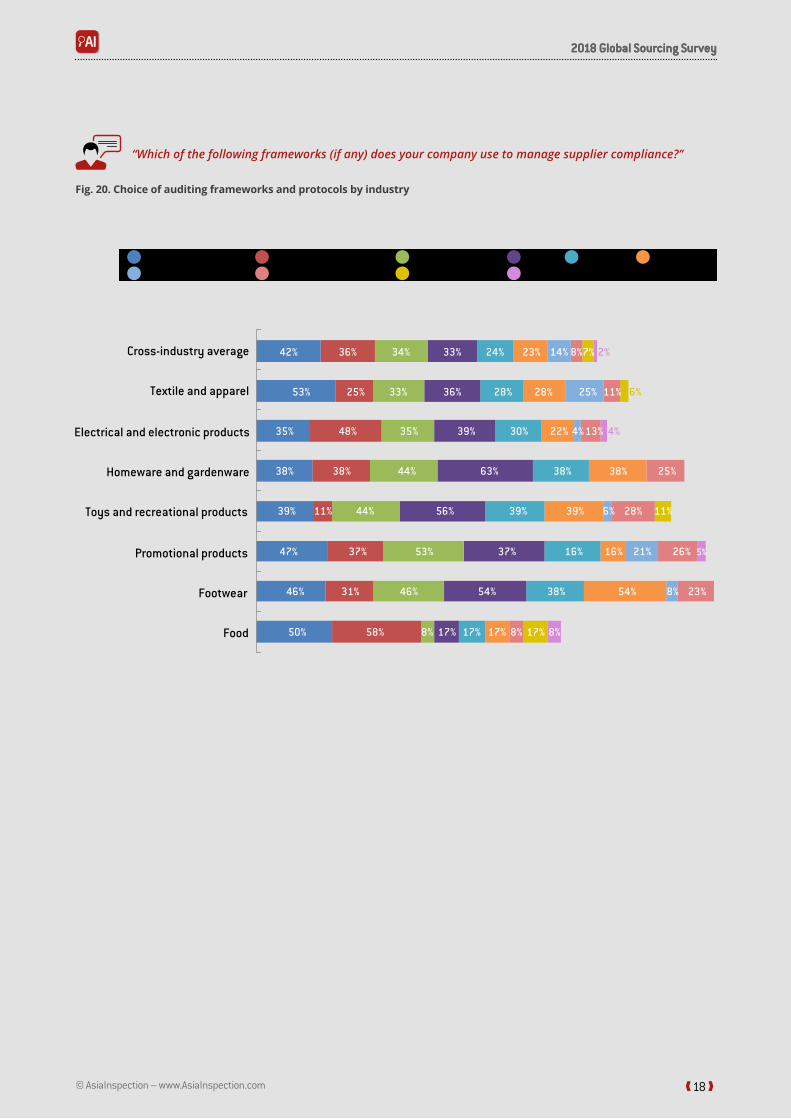
Understandably the choice of auditing protocols and frameworks is highly dependent on the respondent’s industry (see fig. 20 for further information).
Notably, the use of in-house protocols was particularly high in the Textile, Promotional products, and Food segments. The Food and E&E industries also gave stronger preference to ISO protocols compared to other sectors, while the Footwear, Homeware and Toy industries heavily favored the SA8000 auditing framework.
❰ 17 ❱
42%
36%
34%
33%
24%
23%
14%
8%
7%
2%
Our own custom audit protocol
ISO-certification(s)
Sedex / SMETA
BSCI
C-TPAT
SA8000
WRAP
ETI
Other
ICS
© AsiaInspection – www.AsiaInspection.com
2018 Global Sourcing Survey2018 Global Sourcing Survey
❰ 18 ❱
“Which of the following frameworks (if any) does your company use to manage supplier compliance?”
Fig. 20. Choice of auditing frameworks and protocols by industry
Cross-industry average
Textile and apparel
Electrical and electronic products
Homeware and gardenware
Toys and recreational products
Promotional products
In-house protocol ISO- certification(s) Sedex / SMETA BSCI C-TPAT SA8000WRAP ETI Other ICS
Footwear
Food
56%
63%
39%
36%
44%
44%
35%
33%
11%
38%
48%
25%
39%
38%
35%
53%
33% 24% 23% 14% 8%7% 2%34%36%42%
36% 28% 28% 11%25%33%25%53%
39% 30% 22% 4% 13% 4%35%48%35%
63% 38% 38% 25%44%38%38%
28% 11%6%39% 39%56%44%11%39%
37% 16% 26%21%16% 5%53%37%47%
54% 38% 54% 8% 23%46%31%46%
8% 17% 17% 17% 8% 17% 8%58%50%
6%
© AsiaInspection – www.AsiaInspection.com
2018 Global Sourcing Survey2018 Global Sourcing Survey
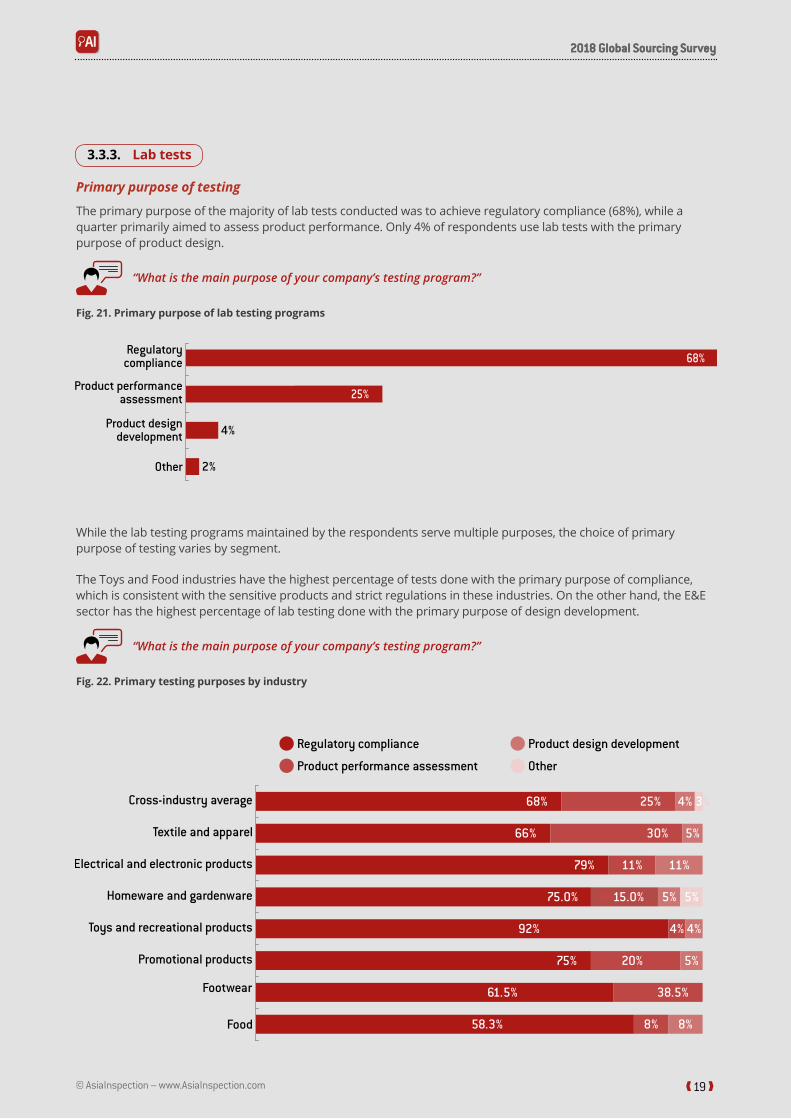
3.3.3. Lab tests
Primary purpose of testing
The primary purpose of the majority of lab tests conducted was to achieve regulatory compliance (68%), while a quarter primarily aimed to assess product performance. Only 4% of respondents use lab tests with the primary purpose of product design.
“What is the main purpose of your company’s testing program?”
Fig. 21. Primary purpose of lab testing programs
While the lab testing programs maintained by the respondents serve multiple purposes, the choice of primary purpose of testing varies by segment.
The Toys and Food industries have the highest percentage of tests done with the primary purpose of compliance, which is consistent with the sensitive products and strict regulations in these industries. On the other hand, the E&E sector has the highest percentage of lab testing done with the primary purpose of design development.
“What is the main purpose of your company’s testing program?”
Fig. 22. Primary testing purposes by industry
❰ 19 ❱
68%
25%
Regulatory compliance
Product performance assessment
Product design development
Other 2%
4%
Regulatory compliance
Product performance assessment
Product design development
Other
3%
5%
11%
68%
66%
79%
75.0%
61.5%
92%
58.3%
25% 4%
5%
5%
5%
30%
11%
15.0%
20%75%
38.5%
4% 4%
8% 8%
Cross-industry average
© AsiaInspection – www.AsiaInspection.com
2018 Global Sourcing Survey2018 Global Sourcing Survey
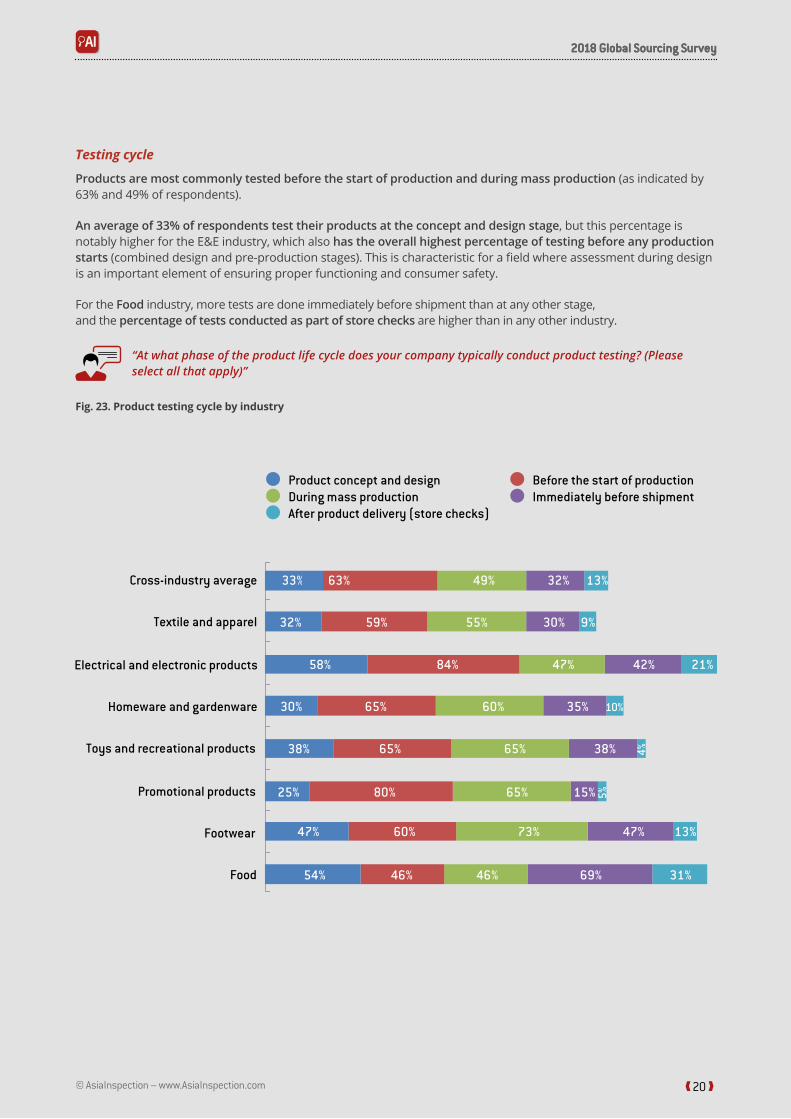
❰ 20 ❱
Testing cycle
Products are most commonly tested before the start of production and during mass production (as indicated by 63% and 49% of respondents).
An average of 33% of respondents test their products at the concept and design stage, but this percentage is notably higher for the E&E industry, which also has the overall highest percentage of testing before any production starts (combined design and pre-production stages). This is characteristic for a field where assessment during design is an important element of ensuring proper functioning and consumer safety.
For the Food industry, more tests are done immediately before shipment than at any other stage, and the percentage of tests conducted as part of store checks are higher than in any other industry.
“At what phase of the product life cycle does your company typically conduct product testing? (Please select all that apply)”
Fig. 23. Product testing cycle by industry
Cross-industry average
Textile and apparel
Electrical and electronic products
Homeware and gardenware
Toys and recreational products
Promotional products
Footwear
Food
31%
21%
69%
15%
32%
46%
55%
46%
63%
54%
25%
30%
33%
Product concept and design Before the start of productionDuring mass production Immediately before shipmentAfter product delivery (store checks)
4%
10%
9%
13%
47%73%60%47% 13%
5%65%80%
38%65%65%38%
58%
32%
42%47%84%
30%59%
49% 32%
35%60%65%
© AsiaInspection – www.AsiaInspection.com
2018 Global Sourcing Survey2018 Global Sourcing Survey
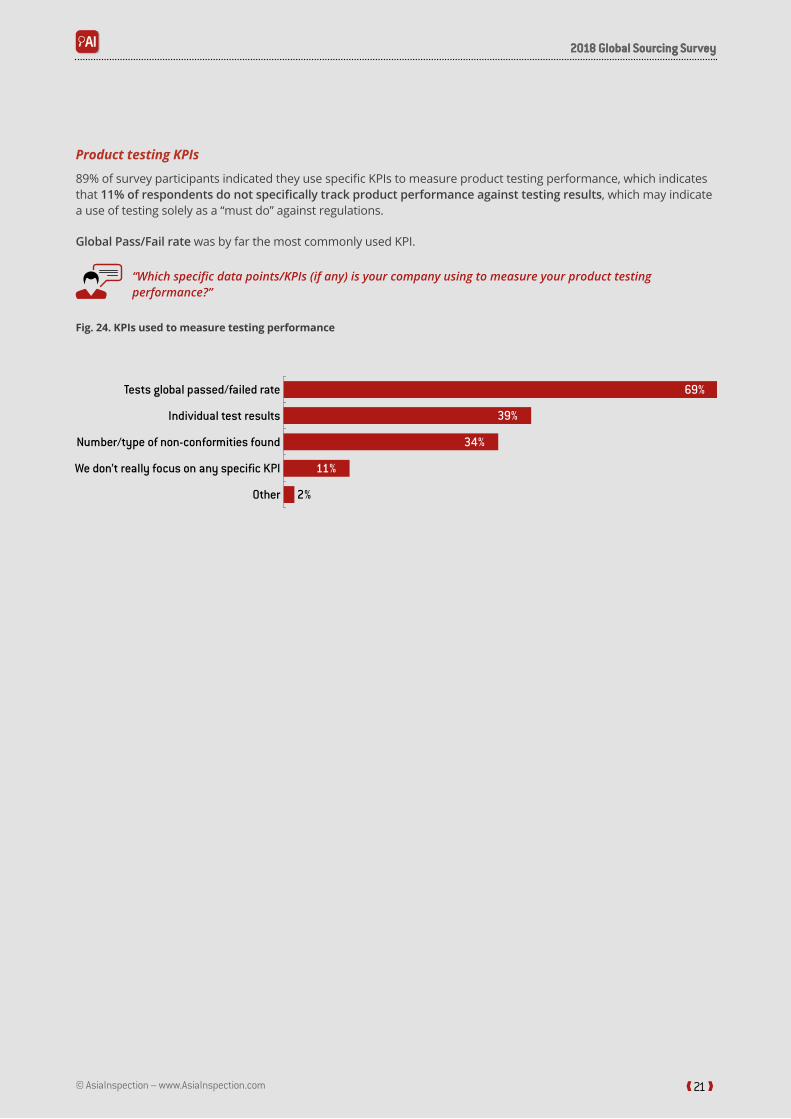
Product testing KPIs
89% of survey participants indicated they use specific KPIs to measure product testing performance, which indicates that 11% of respondents do not specifically track product performance against testing results, which may indicate a use of testing solely as a “must do” against regulations.
Global Pass/Fail rate was by far the most commonly used KPI.
“Whichspecificdatapoints/KPIs(ifany) isyourcompany usingtomeasureyourproducttestingperformance?”
Fig. 24. KPIs used to measure testing performance
❰ 21 ❱
Individual test results
Number/type of non-conformities found
We don’t really focus on any specific KPI
Other
Tests global passed/failed rate
7%
2%
69%
11%
34%
39%
© AsiaInspection – www.AsiaInspection.com
2018 Global Sourcing Survey2018 Global Sourcing Survey
❰ 22 ❱
4. Sourcing Challenges, Expectations, and Prospects
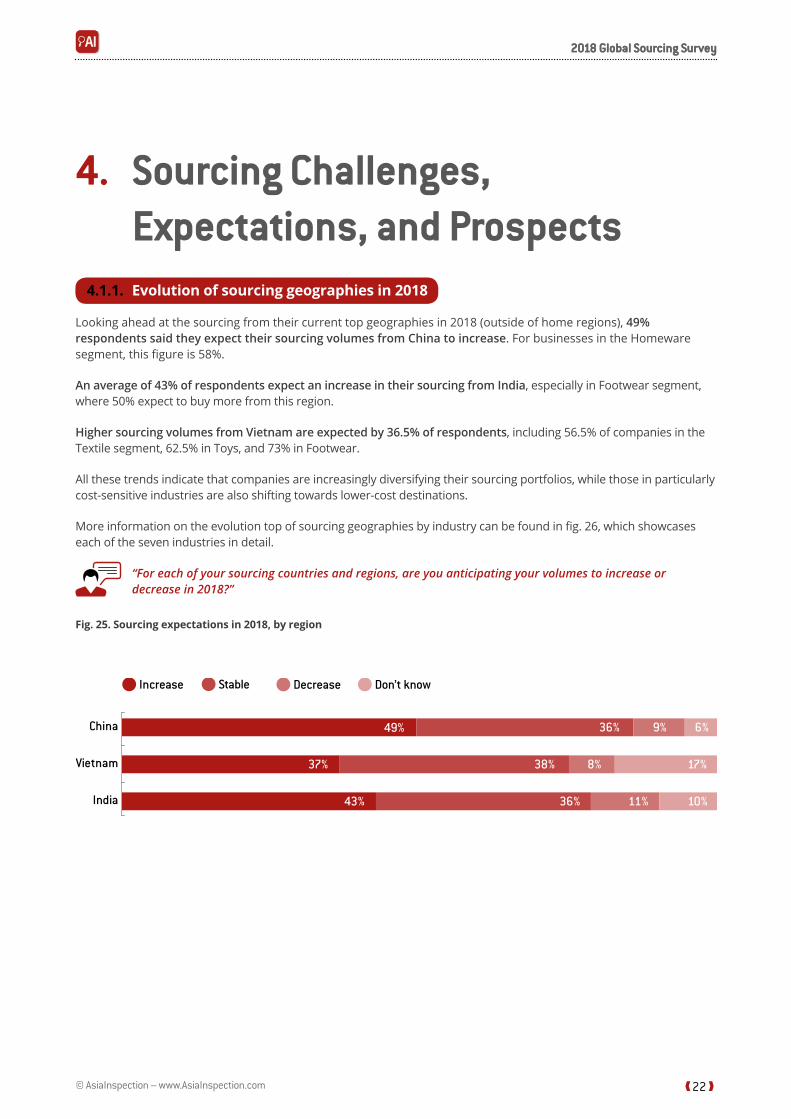
4.1.1. Evolution of sourcing geographies in 2018
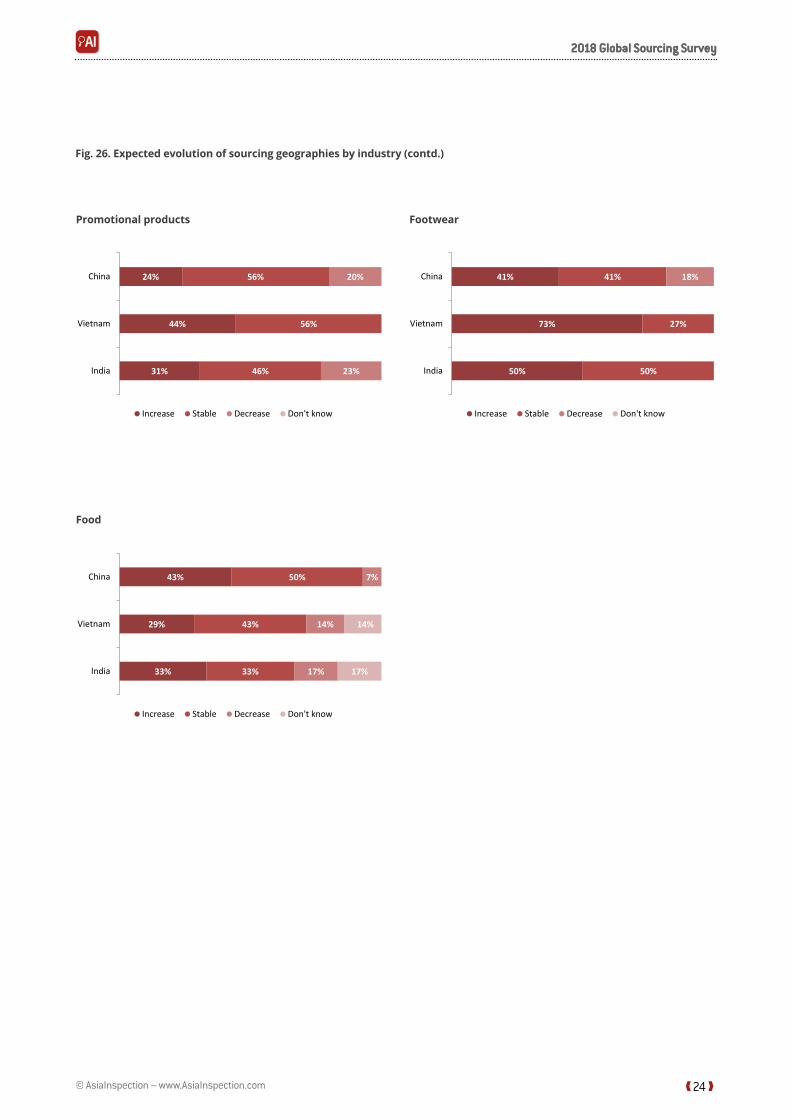
Looking ahead at the sourcing from their current top geographies in 2018 (outside of home regions), 49% respondents said they expect their sourcing volumes from China to increase. For businesses in the Homeware segment, this figure is 58%.
An average of 43% of respondents expect an increase in their sourcing from India, especially in Footwear segment, where 50% expect to buy more from this region.
Higher sourcing volumes from Vietnam are expected by 36.5% of respondents, including 56.5% of companies in the Textile segment, 62.5% in Toys, and 73% in Footwear.
All these trends indicate that companies are increasingly diversifying their sourcing portfolios, while those in particularly cost-sensitive industries are also shifting towards lower-cost destinations.
More information on the evolution top of sourcing geographies by industry can be found in fig. 26, which showcases each of the seven industries in detail.
“Foreachofyoursourcingcountriesandregions,areyouanticipating yourvolumestoincreaseordecrease in 2018?”
Fig. 25. Sourcing expectations in 2018, by region
Don’t knowStable DecreaseIncrease
China
Vietnam
India
49% 36% 9% 6%
37%
43% 36% 11% 10%
38% 8% 17%
© AsiaInspection – www.AsiaInspection.com
2018 Global Sourcing Survey2018 Global Sourcing Survey
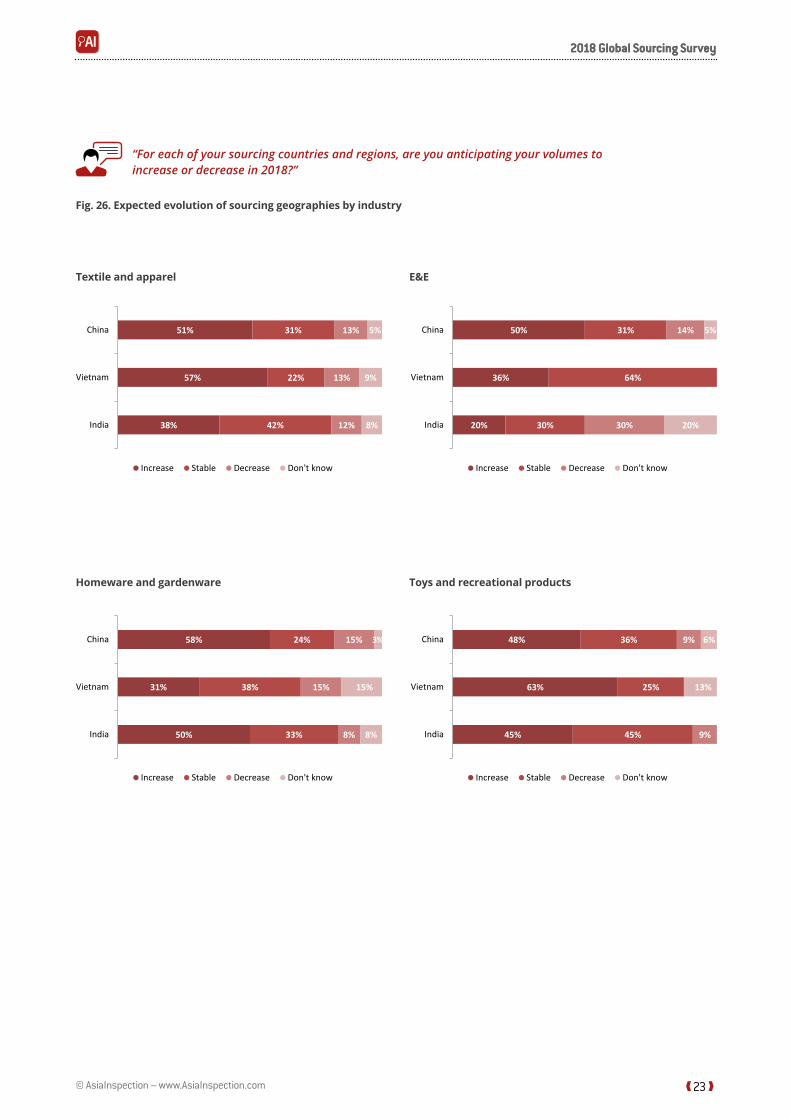
“Foreachofyoursourcingcountriesandregions,areyouanticipating yourvolumestoincrease or decrease in 2018?”
Fig. 26. Expected evolution of sourcing geographies by industry
Textile and apparel E&E
Homeware and gardenware Toys and recreational products
❰ 23 ❱
Homeware and gardenware Toys and recreational products
[23]
Textile and apparel
E&E
Homeware and gardenware
Toys and recreational products
51%
57%
38%
31%
22%
42%
13% 5%
13%
12%
9%
8%
China
Vietnam
India
Increase Stable Decrease Don't know
50%
36%
20%
31%
64%
30%
14%
30% 20%
China
Vietnam
India
Increase Stable Decrease Don't know
58%
31%
50%
24%
38%
33%
15%
15%
8%
15%
8%
China
Vietnam
India
Increase Stable Decrease Don't know
48%
63%
45%
36%
25%
45%
9%
9%
13%
China
Vietnam
India
Increase Stable Decrease Don't know
[survey title]
[23]
“For each of your sourcing countries and regions, are you anticipating your volumes to increase or decrease in 2018?”
Fig. 26. Expected evolution of sourcing geographies by industry
Textile and apparel
E&E
Homeware and gardenware
Toys and recreational products
51%
57%
38%
31%
22%
42%
13%
13%
12%
9%
8%
China
Vietnam
India
Increase Stable Decrease Don't know
50%
36%
20%
31%
64%
30%
14%
30% 20%
China
Vietnam
India
Increase Stable Decrease Don't know
58%
31%
50%
24%
38%
33%
15% 3%
15%
8%
15%
8%
China
Vietnam
India
Increase Stable Decrease Don't know
48%
63%
45%
36%
25%
45%
9%
9%
13%
China
Vietnam
India
Increase Stable Decrease Don't know
5%
6%
© AsiaInspection – www.AsiaInspection.com
2018 Global Sourcing Survey2018 Global Sourcing Survey
❰ 24 ❱
Fig. 26. Expected evolution of sourcing geographies by industry (contd.)
Promotional products Footwear
Food
Promotional products
Footwear
Food
24%
44%
31%
56%
56%
46%
20%
23%
China
Vietnam
India
Increase Stable Decrease Don't know
41%
73%
50%
41%
27%
50%
18%China
Vietnam
India
Increase Stable Decrease Don't know
43%
29%
33%
50%
43%
33%
7%
14%
17%
14%
17%
China
Vietnam
India
Increase Stable Decrease Don't know
[surv
[24]
Fig. 26. Expected evolution of sourcing geographies by industry (contd.)
Promotional products
Footwear
Food
24%
44%
31%
56%
56%
46%
20%
23%
China
Vietnam
India
Increase Stable Decrease Don't know
41%
73%
50%
41%
27%
50%
18%China
Vietnam
India
Increase Stable Decrease Don't know
43%
29%
33%
50%
43%
33%
7%
14%
17%
14%
17%
China
Vietnam
India
Increase Stable Decrease Don't know
Fig. 29.
[survey title]
Promotional products
Footwear
Food
24%
44%
31%
56%
56%
46%
20%
23%
China
Vietnam
India
Increase Stable Decrease Don't know
41%
73%
50%
41%
27%
50%
18%China
Vietnam
India
Increase Stable Decrease Don't know
43%
29%
33%
50%
43%
33%
7%
14%
17%
14%
17%
China
Vietnam
India
Increase Stable Decrease Don't know
[surv
[24]
Fig. 26. Expected evolution of sourcing geographies by industry (contd.)
Promotional products
Footwear
Food
24%
44%
31%
56%
56%
46%
20%
23%
China
Vietnam
India
Increase Stable Decrease Don't know
41%
73%
50%
41%
27%
50%
18%China
Vietnam
India
Increase Stable Decrease Don't know
43%
29%
33%
50%
43%
33%
7%
14%
17%
14%
17%
China
Vietnam
India
Increase Stable Decrease Don't know
Fig. 29.
[survey title]
© AsiaInspection – www.AsiaInspection.com
2018 Global Sourcing Survey2018 Global Sourcing Survey
4.2. Top sourcing challenges: 2017 vs. 2018
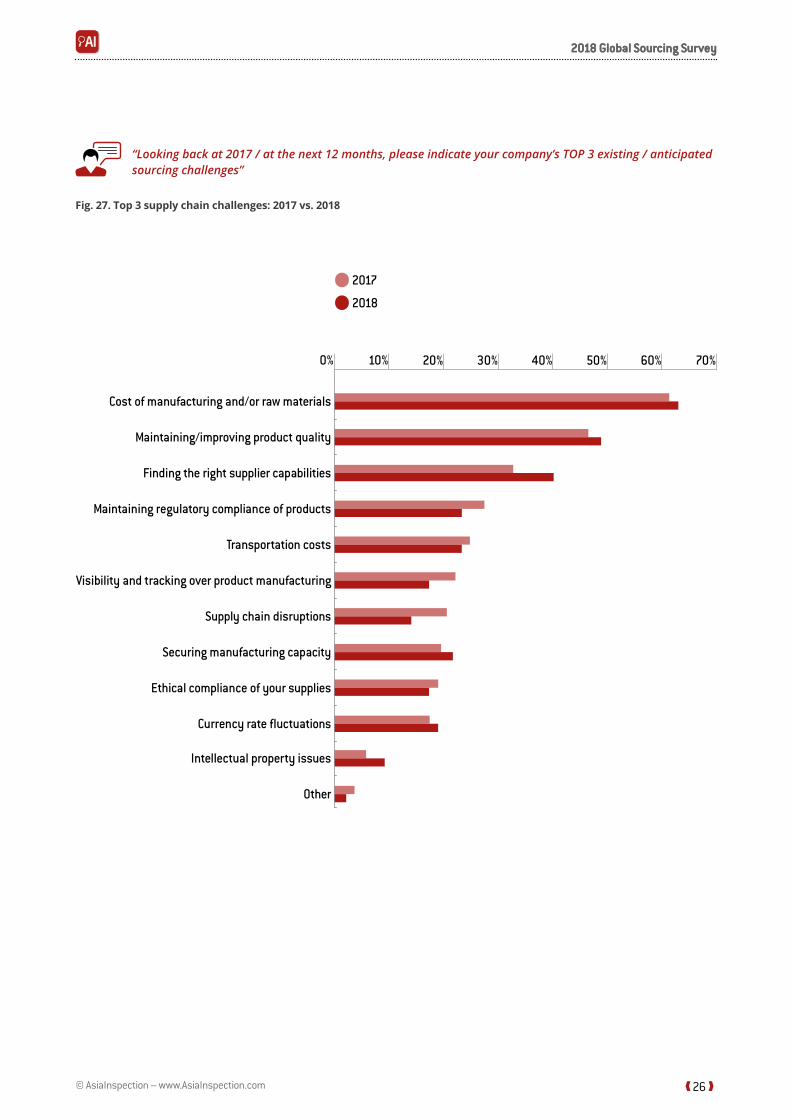
Looking back on their sourcing challenges of 2017, respondents named their top 3 as: 1) cost of manufacturing and raw materials; 2) maintaining / improving product quality, and 3) finding the right supplier capabilities.
Compared to other industries, the Promotional products sector appears to be slightly less affected by the challenge of production costs, likely due to the flexibility that comes with their rapidly changing product assortment.
For the Food industry, product quality has been a notable challenge, echoing the recent string of food quality issues worldwide.
While ethical compliance of suppliers was further down the list of challenges, the industry most concerned with it was Toys, with 26% of companies listing ethical compliance among their top 3 sourcing challenges of 2017.
Assessing their supply chain expectations for the coming year, respondents kept the cost of manufacturing at the top of their 2018 sourcing challenges. Managing product quality is viewed as the second biggest challenge, and its importance is expected to increase.
Among the challenges that respondents expected to affect them in 2018 more than in 2017 are: finding the right supplier capabilities (know-how, technology), and, to a lesser extent, the required manufacturing capacity. More companies are expected to be affected by currency rate fluctuations and intellectual property issues.
On the other hand, respondents expect to worry less about supply chain disruptions, regulatory compliance, and ethical compliance of suppliers in 2018 compared to 2017.
Notably, visibility and traceability are also expected to be less of a concern, indicating that respondents expect to have better supply chain visibility in 2018. Respondents also named the ongoing environmental crackdown in China among the important challenges of 2018.
❰ 25 ❱© AsiaInspection – www.AsiaInspection.com
2018 Global Sourcing Survey2018 Global Sourcing Survey
❰ 26 ❱
“Lookingbackat2017/atthenext12months,pleaseindicateyourcompany’sTOP3existing/anticipatedsourcing challenges”
Fig. 27. Top 3 supply chain challenges: 2017 vs. 2018
2017
2018
Cost of manufacturing and/or raw materials
Maintaining/improving product quality
Finding the right supplier capabilities
Maintaining regulatory compliance of products
Transportation costs
Visibility and tracking over product manufacturing
Supply chain disruptions
Securing manufacturing capacity
Ethical compliance of your supplies
Currency rate fluctuations
Intellectual property issues
Other
10%0% 20% 30% 40% 50% 60% 70%
© AsiaInspection – www.AsiaInspection.com
2018 Global Sourcing Survey2018 Global Sourcing Survey
4.3. Top sourcing challenges: 2017 vs. 2018
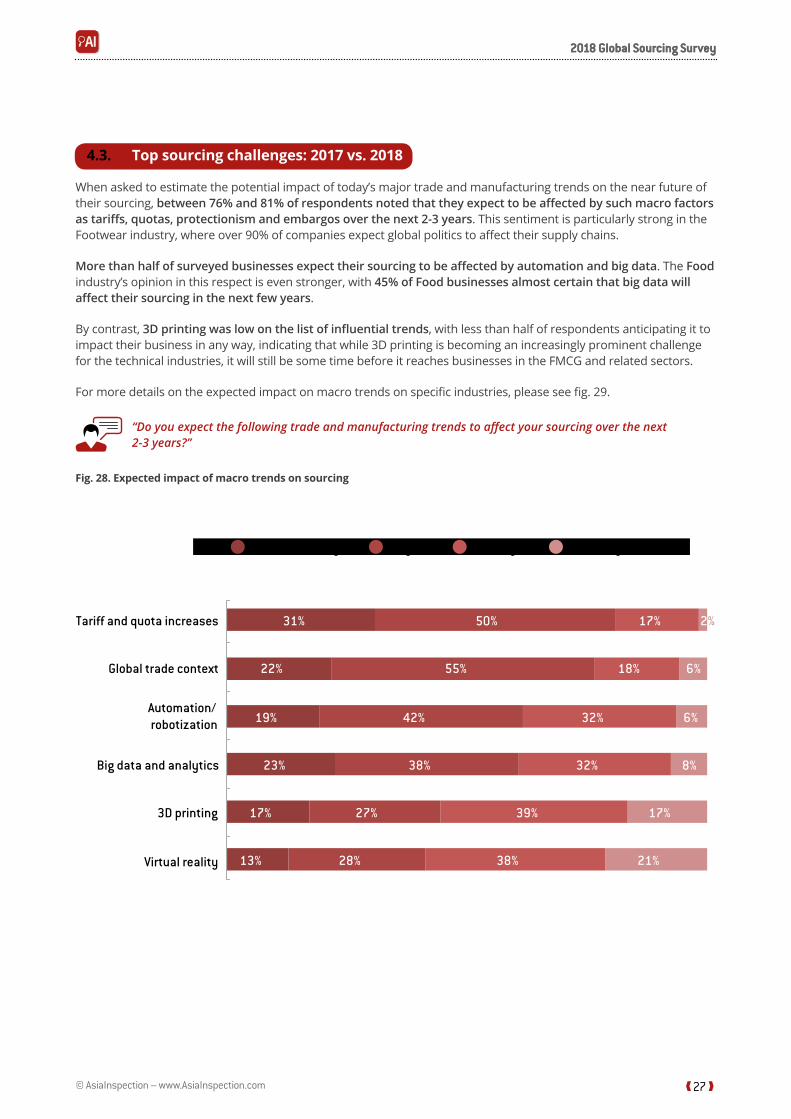
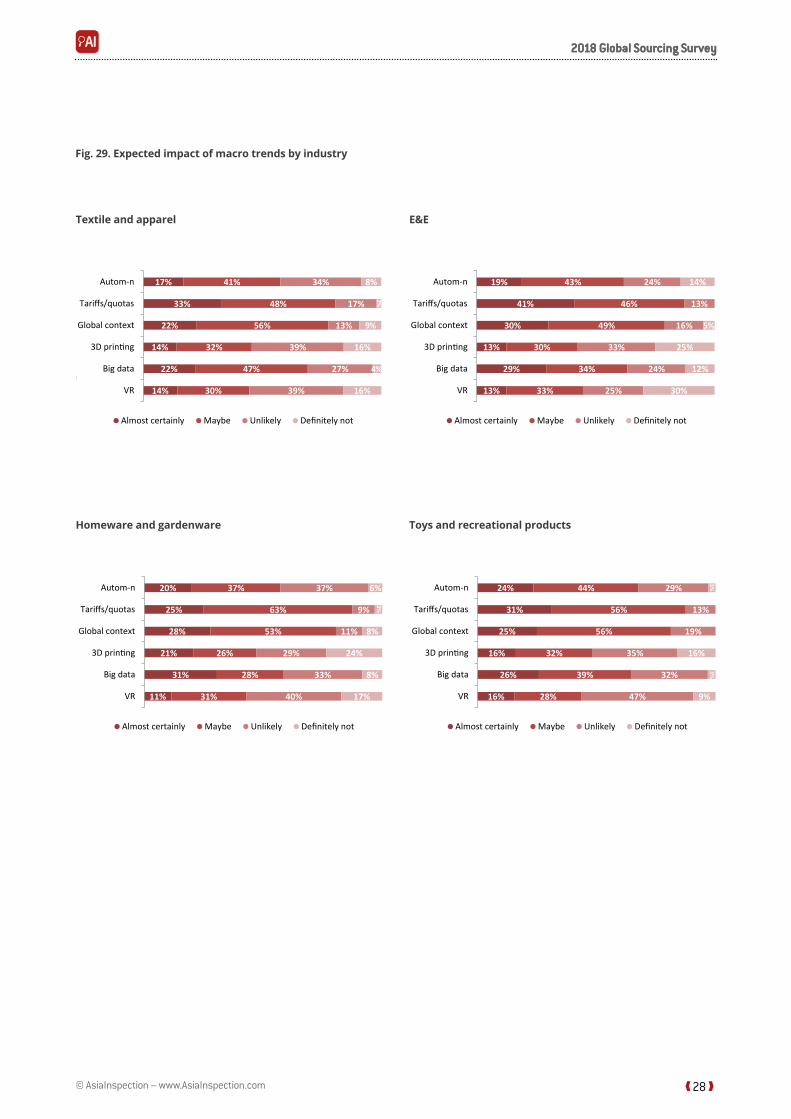
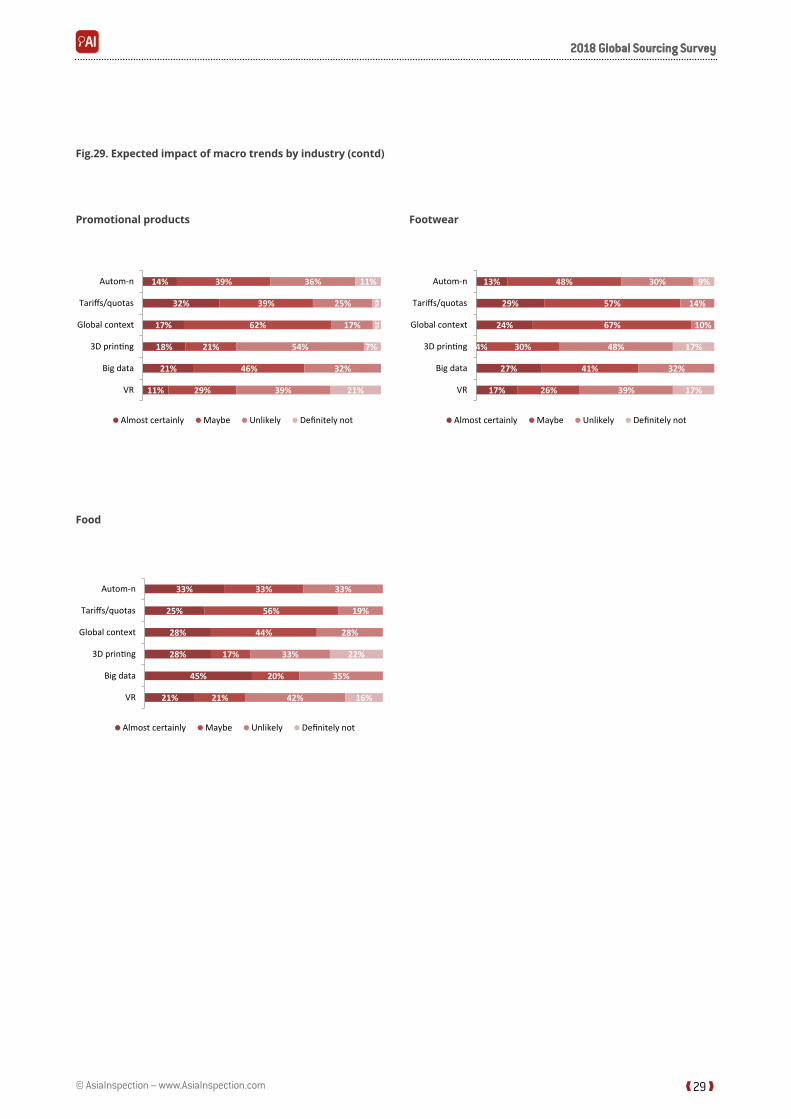
When asked to estimate the potential impact of today’s major trade and manufacturing trends on the near future of their sourcing, between 76% and 81% of respondents noted that they expect to be affected by such macro factors as tariffs, quotas, protectionism and embargos over the next 2-3 years. This sentiment is particularly strong in the Footwear industry, where over 90% of companies expect global politics to affect their supply chains.
More than half of surveyed businesses expect their sourcing to be affected by automation and big data. The Food industry’s opinion in this respect is even stronger, with 45% of Food businesses almost certain that big data will affect their sourcing in the next few years.
By contrast, 3D printing was low on the list of influential trends, with less than half of respondents anticipating it to impact their business in any way, indicating that while 3D printing is becoming an increasingly prominent challenge for the technical industries, it will still be some time before it reaches businesses in the FMCG and related sectors.
For more details on the expected impact on macro trends on specific industries, please see fig. 29.
“Doyouexpectthefollowingtradeandmanufacturingtrendstoaffectyoursourcingoverthenext 2-3years?”
Fig. 28. Expected impact of macro trends on sourcing
❰ 27 ❱
Tariff and quota increases
Global trade context
Automation/ robotization
Big data and analytics
3D printing
Virtual reality
Almost certainly Maybe Unlikely Definitely not
21%
17%
8%
6%
6%
2%
38%
39%
32%
32%
18%
17%
28%
27%
38%
42%
55%
50%
13%
17%
23%
19%
22%
31%
© AsiaInspection – www.AsiaInspection.com
2018 Global Sourcing Survey2018 Global Sourcing Survey
❰ 28 ❱
Fig. 29. Expected impact of macro trends by industry
Textile and apparel E&E
Homeware and gardenware Toys and recreational products
t
itle]
[survey title]
[28]
cted impact of macro trends by industry
Textile and apparel
E&E
Homeware and gardenware
Toys and recreational products
17%
33%
22%
14%
22%
14%
41%
48%
56%
32%
47%
30%
34%
17%
2%
9%
4%
13%
39%
27%
39%
8%
16%
16%
Autom-n
Tariffs/quotas
Global context
3D prin ng
Big data
VR
Almost certainly Maybe Unlikely Definitely not
19%
41%
30%
13%
29%
13%
43%
46%
49%
30%
34%
33%
24%
13%
16% 5%
33%
24%
25%
14%
25%
12%
30%
Autom-n
Tariffs/quotas
Global context
3D prin ng
Big data
VR
Almost certainly Maybe Unlikely Definitely not
20%
25%
28%
21%
31%
11%
37%
63%
53%
26%
28%
31%
37%
9%
11%
29%
33%
40%
6%
8%
24%
8%
17%
Autom-n
Tariffs/quotas
Global context
3D prin ng
Big data
VR
Almost certainly Maybe Unlikely Definitely not
24%
31%
25%
16%
26%
16%
44%
56%
56%
32%
39%
28%
29%
13%
19%
35%
32%
47%
16%
9%
Autom-n
Tariffs/quotas
Global context
3D prin ng
Big data
VR
Almost certainly Maybe Unlikely Definitely not
[su
itle]
[28]
Fig. 29. Expected impact of macro trends by industry
Textile and apparel
E&E
Homeware and gardenware
Toys and recreational products
17%
33%
22%
14%
22%
14%
41%
48%
56%
32%
47%
30%
34%
17%
13%
39%
27%
39%
8%
16%
16%
Autom-n
Tariffs/quotas
Global context
3D prin ng
Big data
VR
Almost certainly Maybe Unlikely Definitely not
19%
41%
30%
13%
29%
13%
43%
46%
49%
30%
34%
33%
24%
13%
16%
33%
24%
25%
14%
25%
12%
30%
Autom-n
Tariffs/quotas
Global context
3D prin ng
Big data
VR
Almost certainly Maybe Unlikely Definitely not
20%
25%
28%
21%
31%
11%
37%
63%
53%
26%
28%
31%
37%
9%
3%
11%
29%
33%
40%
6%
8%
24%
8%
17%
Autom-n
Tariffs/quotas
Global context
3D prin ng
Big data
VR
Almost certainly Maybe Unlikely Definitely not
24%
31%
25%
16%
26%
16%
44%
56%
56%
32%
39%
28%
29%
13%
19%
35%
32%
47%
16%
9%
Autom-n
Tariffs/quotas
Global context
3D prin ng
Big data
VR
Almost certainly Maybe Unlikely Definitely not
3%3%
© AsiaInspection – www.AsiaInspection.com
2018 Global Sourcing Survey2018 Global Sourcing Survey
❰ 29 ❱
Fig.29. Expected impact of macro trends by industry (contd)
Promotional products
Footwear
Food
14%
32%
17%
18%
21%
11%
39%
39%
62%
21%
46%
29%
36%
25%
17%
54%
32%
39%
11%
21%
Autom-n
Tariffs/quotas
Global context
3D prin ng
Big data
VR
Almost certainly Maybe Unlikely Definitely not
13%
29%
24%
4%
27%
17%
48%
57%
67%
30%
41%
26%
30%
14%
10%
48%
32%
39%
9%
17%
17%
Autom-n
Tariffs/quotas
Global context
3D prin ng
Big data
VR
Almost certainly Maybe Unlikely Definitely not
33%
25%
28%
28%
45%
21%
33%
56%
44%
17%
20%
21%
33%
19%
28%
33%
35%
42%
22%
16%
Autom-n
Tariffs/quotas
Global context
3D prin ng
Big data
VR
Almost certainly Maybe Unlikely De ely not
[su
[29]
Fig.29. Expected impact of macro trends by industry (contd)
Promotional products
Footwear
Food
14%
32%
17%
18%
21%11%
39%
39%
62%
21%
46%29%
36%
25%
17%
54%
32%39%
11%
21%
Autom-n
Tariffs/quotas
Global context
3D prin ng
Big dataVR
Almost certainly Maybe Unlikely Definitely not
13%
29%
24%
4%
27%17%
48%
57%
67%
30%
41%26%
30%
14%
10%
48%
32%39%
9%
17%
17%
Autom-n
Tariffs/quotas
Global context
3D prin ng
Big dataVR
Almost certainly Maybe Unlikely Definitely not
33%
25%
28%
28%
45%
21%
33%
56%
44%
17%
20%
21%
33%
19%
28%
33%
35%
42%
22%
16%
Autom-n
Tariffs/quotas
Global context
3D prin ng
Big data
VR
Almost certainly Maybe Unlikely De ely not
y t
7%
4%3%
Promotional products
Footwear
Food
14%
32%
17%
18%
21%
11%
39%
39%
62%
21%
46%
29%
36%
25%
17%
54%
32%
39%
11%
21%
Autom-n
Tariffs/quotas
Global context
3D prin ng
Big data
VR
Almost certainly Maybe Unlikely Definitely not
13%
29%
24%
4%
27%
17%
48%
57%
67%
30%
41%
26%
30%
14%
10%
48%
32%
39%
9%
17%
17%
Autom-n
Tariffs/quotas
Global context
3D prin ng
Big data
VR
Almost certainly Maybe Unlikely Definitely not
33%
25%
28%
28%
45%
21%
33%
56%
44%
17%
20%
21%
33%
19%
28%
33%
35%
42%
22%
16%
Autom-n
Tariffs/quotas
Global context
3D prin ng
Big data
VR
Almost certainly Maybe Unlikely De ely not
[su
[29]
Fig.29. Expected impact of macro trends by industry (contd)
Promotional products
Footwear
Food
14%
32%
17%
18%
21%11%
39%
39%
62%
21%
46%29%
36%
25%
17%
54%
32%39%
11%
21%
Autom-n
Tariffs/quotas
Global context
3D prin ng
Big dataVR
Almost certainly Maybe Unlikely Definitely not
13%
29%
24%
4%
27%17%
48%
57%
67%
30%
41%26%
30%
14%
10%
48%
32%39%
9%
17%
17%
Autom-n
Tariffs/quotas
Global context
3D prin ng
Big dataVR
Almost certainly Maybe Unlikely Definitely not
33%
25%
28%
28%
45%
21%
33%
56%
44%
17%
20%
21%
33%
19%
28%
33%
35%
42%
22%
16%
Autom-n
Tariffs/quotas
Global context
3D prin ng
Big data
VR
Almost certainly Maybe Unlikely De ely not
y t
7%
4%3%
Promotional products Footwear
Food
© AsiaInspection – www.AsiaInspection.com
2018 Global Sourcing Survey2018 Global Sourcing Survey
› List of Figures4 Fig. 1. Popular sourcing geographies
5 Fig. 2. Popular sourcing geographies by industry
6 Fig. 3. Top 3 sourcing destinations for North American and European respondents
7 Fig. 4. Overall popularity of different outsourcing models
7 Fig. 5. Company size vs. choice of outsourcing model
8 Fig. 6. Outsourcing model preferences by industry
9 Fig. 7. Company size vs. average supplier portfolio renewal rate
9 Fig. 8. Industry sector vs. average supplier portfolio renewal rate
10 Fig. 9. Supply chain visibility (% of suppliers known) – segmented by company size
10 Fig. 10. Supply chain visibility by industry (% of suppliers known)
11 Fig. 11. Perceived changes in product quality, factory compliance, and product compliance
12 Fig. 12. Perceived product quality trends by industry (12 months of 2017)
13 Fig. 13. Perceived supplier compliance trends by industry (12 months of 2017)
14 Fig. 14. Perceived product safety trends by industry (12 months of 2017)
15 Fig. 15. KPIs used to measure product quality and supplier performance.
15 Fig. 16. Financial responsibility for product inspections
16 Fig. 17. Supplier audit frequency.
16 Fig. 18. KPIs used to track supplier compliance
17 Fig. 19. Auditing frameworks and protocols
18 Fig. 20. Choice of auditing frameworks and protocols by industry
19 Fig. 21. Primary purpose of lab testing programs
19 Fig. 22. Primary testing purposes by industry
20 Fig. 23. Product testing cycle by industry
21 Fig. 24. KPIs used to measure testing performance
22 Fig. 25. Sourcing expectations in 2018, by region
23 Fig. 26. Expected evolution of sourcing geographies by industry
26 Fig. 27. Top 3 supply chain challenges: 2017 vs. 2018
27 Fig. 28. Expected impact of macro trends on sourcing
28 Fig. 29. Expected impact of macro trends by industry
❰ 29 ❱
© AsiaInspection – www.AsiaInspection.com
2018 Global Sourcing Survey2018 Global Sourcing Survey
facebook.com/asiainspection
twitter.com/asiainspection
linkedin.com/company/asiainspection