· 2018-08-09 · Give the amplitude and period of each function. Then sketch the graph of the...
4
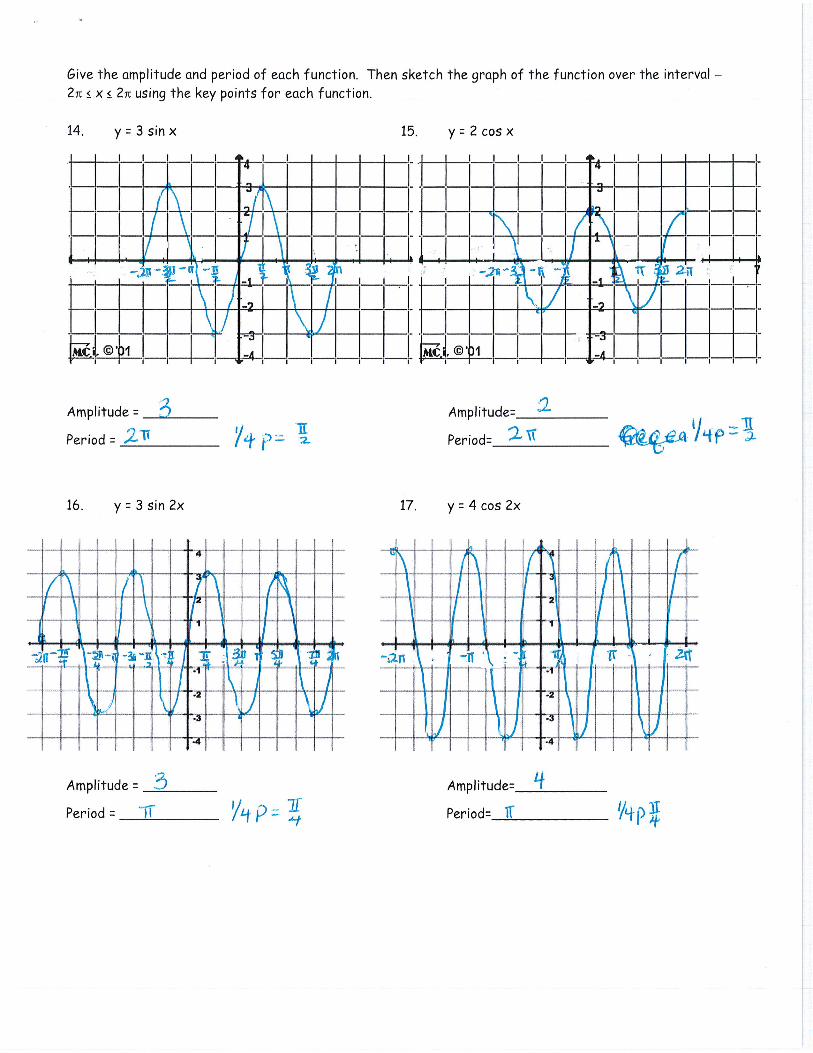
· 2018-08-09 · Give the amplitude and period of each function. Then sketch the graph of the function over the interval 211 x 2TC using the key points for each function. 14. y: