Embed Size (px)
Citation preview

0
Corporation Presentation2017 Nov.

1
TSMT in Brief•Founded : in 1990•HQ : No.437, Taoying Rd., Taoyuan City, Taiwan•Capital : $USD 100M•Revenue:$USD 0.93B(2016); $USD 0.65B(2017Q3)• Listed:6278.TW•Employees : (2016)9,805;(2017Q3)8,139•Capacity : 180 SMT lines, 8 Factories (Taiwan ,China &
India)•Web‐Site: http://www.tsmt.com.tw
Basic Profile

2
台表科 (6278.TW)
TSMT Group Structure
TSMT(BVI)TSMT(HK)
峻泓(香港)
峻泓(蘇州)
峻泓光電
RM(BVI)
RML(HK)
RMIHTSMT(USA)
85.24%
峻凌電子(蘇州)
100%
峻凌電子(東莞)
100%
台表科技(蘇州)
100%
峻凌電子(寧波)
100%
峻凌電子(廈門)
100%
峻凌電子(合肥)
100%
寧波永富貿易公司
100%
峻凌電子(重慶)
100%
峻凌電子(成都)
100%
TSMT(SG)
100% 100%99.99%
TSMT(INDIA)
3
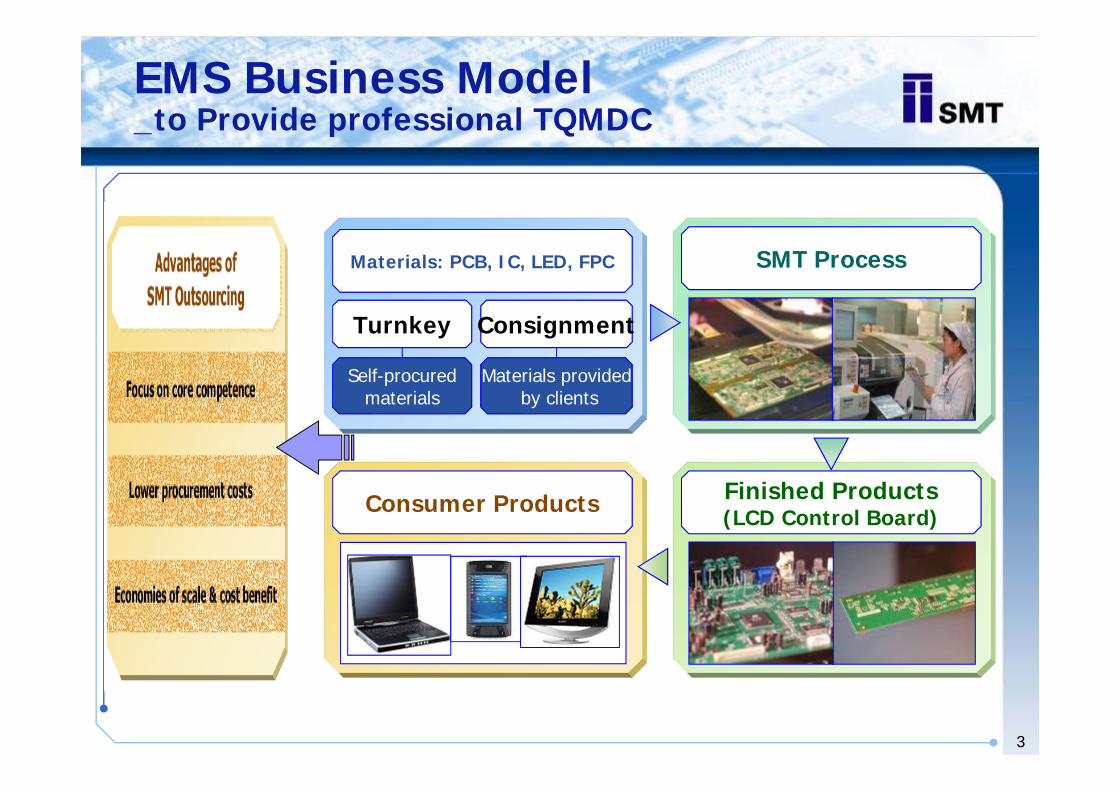
EMS Business Model_to Provide professional TQMDC
SMT Process
Consumer Products Finished Products(LCD Control Board)
Materials: PCB, IC, LED, FPC
Turnkey
Self-procuredmaterials
ConsignmentConsignment
Materials providedMaterials providedby clients

4
• All plants are inter-connected through central ERP system • Advantages of co-location include timely delivery and cost efficiency• All plants are inter-connected through central ERP system • Advantages of co-location include timely delivery and cost efficiency
Results in stronger relationships with customers, operatingefficiency & capture more business opportunities
Manufacturing Platform-in AsiaStrategic Co-location with Main Customers
Taiwan
Su Zhou
Set up on 1999 Aug.
員工人數:4,167人
Dong Guan
Set up on 1997
員工人數:885人
Xia Men
Set up on 2006 May
員工人數:719人
重慶
合肥
Ning Bo
Set up on 2006 Feb.
員工人數:401人
成都
東莞
廈門 台灣
寧波
蘇州
He Fei
Set up on 2010 Jan.
員工人數:440人
Set up on 1990 Mar.
員工人數:706人
Chong Qing
Set up on 2010 Aug
員工人數:721人

5
2010Q3
Manufacturing Platform-in India
新德里New Delhi
Mumbai孟買
清奈Chennai
MWCMahindra World City
金奈國際機場(MAA)
6
2010Q3
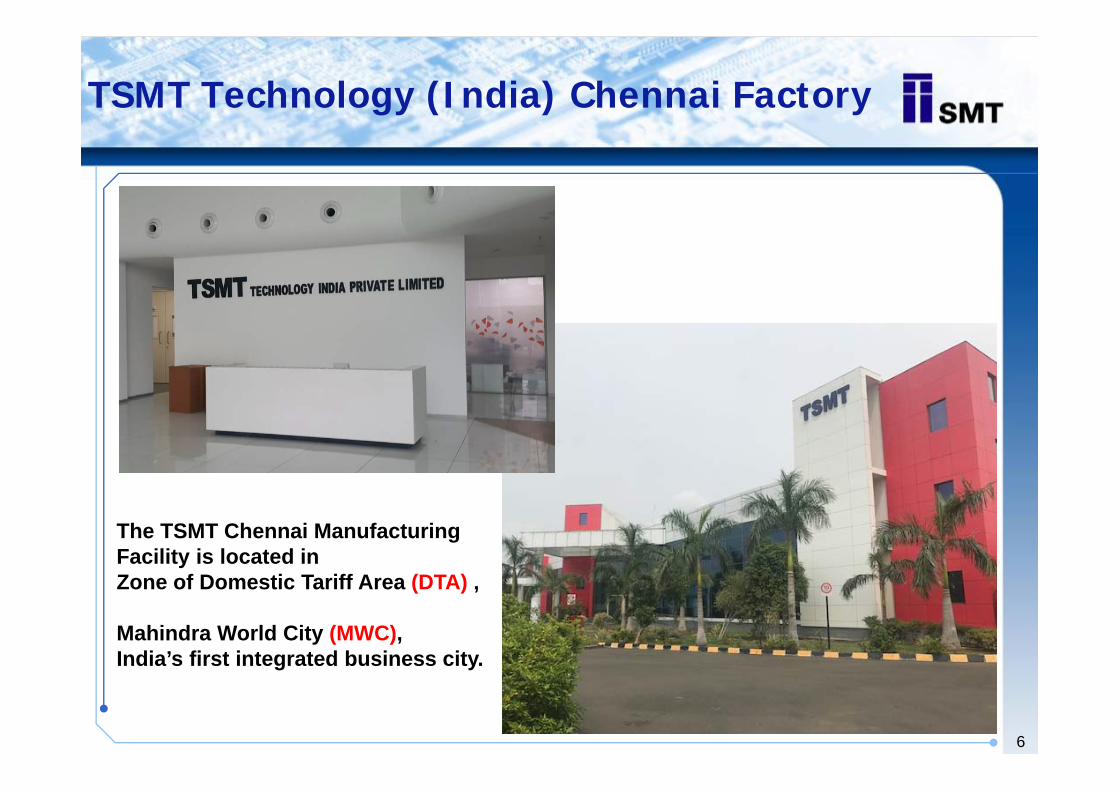
TSMT Technology (India) Chennai Factory
The TSMT Chennai Manufacturing Facility is located in Zone of Domestic Tariff Area (DTA) ,
Mahindra World City (MWC), India’s first integrated business city.

7
Production Capacity& Capability
Economies of scale further strengthen competitiveness of TSMT
capacity (SMT Lines)
生產基地 2012 2013 2014 2015 2016 2017Q3東莞DG 30 26 22 20 20 18
蘇州SZ 80 83 73 65 65 66
寧波NB 29 22 22 20 19 12
廈門XM 22 28 28 30 25 20
台灣TW 16 16 16 17 17 16
合肥HF 13 13 5 4 4 8
重慶CQ 5 7 14 14 15 15
India - - - - - 5
總數 195 195 180 170 165 160

8
Financial Highlights-2016 Annual Results
(USD’000) 2016 2015 Change
Revenue 931,379 949,753 -1.93%
Gross profit 83,429 85,059 -1.92%
Operating profit 35,271 35,245 0.07%
Net profit 17,998 28,303 -36.41%
Gross profit margin 8.96% 8.96% 0.00pp
Operating profit margin 3.79% 3.71% 0.08pp
Net profit margin 1.90% 2.98% -1.08pp
Basic EPS (NTD) 1.95 3.05 -36.07%

9
Financial Highlights-2017 Q3 Results
(USD’000) 2017 Q3 2016 Q3 Change
Revenue 654,201 665,241 -1.66%
Gross profit 52,881 60,019 -11.89%
Operating profit 12,427 23,444 -46.99%
Net profit 18,865 13,366 41.14%
Gross profit margin 8.08% 9.02% -0.94pp
Operating profit margin 1.90% 3.52% -1.62pp
Net profit margin 2.88% 2.01% 0.87pp
Basic EPS (NTD) 1.97 1.48 33.11%

10
Turnover & Margin Analysis
253
288 299 280
226 226 249 249
212 200
257 263
224 214 216
9.34%
9.98%
8.80%
10.33%
7.56%
8.94%
10.02%
9.17%9.59%
8.11%
9.26%8.79%
7.80%
8.38%8.09%
0.00%
2.00%
4.00%
6.00%
8.00%
10.00%
12.00%
‐
50
100
150
200
250
300
350
1Q2014 2Q2014 3Q2014 4Q2014 1Q2015 2Q2015 3Q2015 4Q2015 1Q2016 2Q2016 3Q2016 4Q2016 1Q2017 2Q2017 3Q2017
Turnover USDm GMP %

11
Financial Position
*Gearing Ration=Total Borrowings(other than payables in ordinary course of business) over total equity
(USD’000)As at 31 Dec 2016As at 31 Dec 2015
Change(audited) (audited)
Total assets 920,962 892,535 3.18%
Net assets 359,460 369,439 -2.70%
Total borrowings 141,588 122,188 15.88%
Cash and bank balances 210,243 187,041 12.40%
Total equity 359,460 369,439 -2.70%
Gearing Ration* 39.39% 33.07% -
Inventory turnover days 33 days 30 days +3 days
A/R turnover days 145 days 145 days -
A/P turnover days 132 days 129 days +3 days

12
Financial Position
*Gearing Ration=Total Borrowings(other than payables in ordinary course of business) over total equity
(USD’000)As at 30 Sep 2017 As at 30 Sep 2016
Change(reviewed) (reviewed)
Total assets 859,258 916,054 -6.20%
Net assets 364,914 369,879 -1.34%
Total borrowings 140,535 150,694 -6.74%
Cash and bank balances 229,869 205,863 11.66%
Total equity 364,914 369,879 -1.34%
Gearing Ration* 38.51% 40.74% -
Inventory turnover days 32 days 30 days +2 days
A/R turnover days 150 days 143 days +7 days
A/P turnover days 135 days 127 days +8 days

13
Finished products - applications
Control Board 控制板(Panel driver面板)
Control Board 控制板(Panel driver面板)
Touch ControllerIC Board
Touch ControllerIC Board
LED Light Bar 光棒(back light driver 背光)
LED Light Bar 光棒(back light driver 背光)
Since JULY 2012Since 2007
11%33%41%
About 20m pcs About 17m pcs About 10m pcs
Since 2000Year of launch:
Monthly output:
Proportion to revenue:(2017Q3)
Consumer products:
60%
14%
24%
2%
6%
54%
9%
0%
Small-sized
Product
Monitor
Notebook/Tablet
TV
34%
2%
64%31% (since 2015)
14
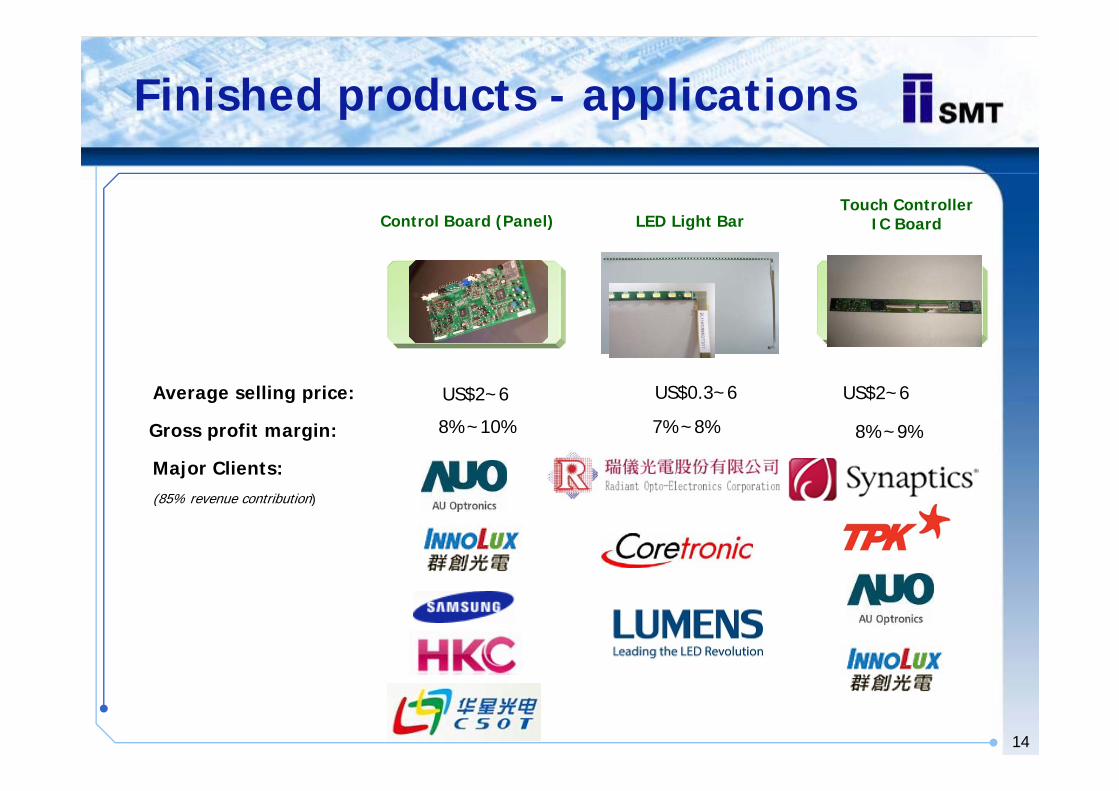
Finished products - applications
Control Board (Panel)Control Board (Panel)Touch Controller
IC BoardTouch Controller
IC BoardLED Light BarLED Light Bar
US$2~6US$0.3~6
8%~9%7%~8%8%~10%
US$2~6
Gross profit margin:
Major Clients:(85% revenue contribution)
Average selling price:

15
Thanks
![West Point City Splash Pad (Rendering 2) | 29344-01 ... · aquatic inc. 2017.11.16 water park ft-in [cm] ... permission in writing from nirbo aquatic inc. ... finish to increase slip](https://img.pdfslide.us/doc/110x75/5b5db87b7f8b9ad21d8ed2af/west-point-city-splash-pad-rendering-2-29344-01-aquatic-inc-20171116.jpg)


![Multi-Layer Power Inductors (IP Series) - Darfon Inductors Catalog-IP_for... · Multi-Layer Power Inductors (IP Series) ... Land Pattern SMD Inductor. 3 REV.2017Q3 ... Packing [uH]](https://img.pdfslide.us/doc/110x75/5ad81e8c7f8b9af9068d19b8/multi-layer-power-inductors-ip-series-inductors-catalog-ipformulti-layer.jpg)