Embed Size (px)
Citation preview

P.O. Box 1749 Halifax, Nova Scotia B3J 3A5 Canada
Item No. 1 Halifax Regional Council
January 16, 2018 TO: Mayor Savage and Members of Halifax Regional Council
Original Signed
SUBMITTED BY:
Councillor Tim Outhit, Chair, Transportation Standing Committee DATE: December 8, 2017 SUBJECT: 2017/18 Second Quarter Halifax Transit Key Performance Indicator (KPI) Report
INFORMATION REPORT ORIGIN December 7, 2017 meeting of the Transportation Standing Committee, Item No. 12.1.2. LEGISLATIVE AUTHORITY Administrative Order 1, Respecting the Procedures of the Council, Schedule 7, Transportation Standing Committee Terms of Reference, section 6 (c) which states: “The Transportation Standing Committee shall promote and enable positive communication between communities, ridership, and the Council and Transit services to enable and support the Regional Transit service to the communities of the municipality”. BACKGROUND A staff information report dated October 18, 2017 pertaining to the 2017/18 Second Quarter Halifax Transit Key Performance Indicator (KPI) was before the Transportation Standing Committee for consideration at its meeting held on December 7, 2017. For further information, please refer to the attached information report dated October 18, 2017.

2017/18 Second Quarter Halifax Transit Key Performance Indicator (KPI) Report Community Council Report - 2 - January 16, 2018 DISCUSSION The Transportation Standing Committee received a presentation from staff on the staff information report dated October 18, 2017 at its meeting held on December 7, 2017 and passed a motion to forward it to Halifax Regional Council as an information item. FINANCIAL IMPLICATIONS As outlined in the attached information report dated October 18, 2017. COMMUNITY ENGAGEMENT The Transportation Standing Committee meetings are open to public attendance, a live webcast is provided of the meeting, and members of the public are invited to address the Committee for up to five minutes at the end of each meeting during the Public Participation portion of the meeting. The agenda, reports, video, and minutes of the Transportation Standing Committee are posted on Halifax.ca. ATTACHMENTS 1. Staff information report dated October 18, 2017 2. Staff presentation dated December 7, 2017 A copy of this report can be obtained online at halifax.ca or by contacting the Office of the Municipal Clerk at 902.490.4210. Report Prepared by: Liam MacSween, Legislative Assistant, 902.490.6521

P.O. Box 1749 Halifax, Nova Scotia B3J 3A5 Canada
Attachment 1 Transportation Standing Committee
December 7, 2017
TO: Chair and Members of Transportation Standing Committee
SUBMITTED BY: ORIGINAL SIGNED
Dave Reage, Director, Halifax Transit
DATE: October 18, 2017
SUBJECT: 2017/18 Q2 Halifax Transit KPI Report
INFORMATION REPORT
ORIGIN
This report originates from the following motion passed at the July 3, 2013 Transportation Standing Committee meeting:
“That the Transportation Standing Committee receive a quarterly report and presentation regarding Metro Transit strategic planning and operations.”
LEGISLATIVE AUTHORITY
Section 4(a) of the Terms of Reference for the Transportation Standing Committee provides that the Transportation Standing Committee is responsible for “overseeing HRM’s Regional Transportation Objectives and Transportation outcome areas”.
BACKGROUND
This report provides a summary of activities in the second quarter of the year, and includes reporting on key performance measures. These include measures of revenue, ridership, boardings, on-time performance, customer service, service levels, and Access-A-Bus service details.

2017/18 Q2 Halifax Transit KPI Report Community Council Report - 2 - December 7, 2017 DISCUSSION Halifax Transit is committed to advancing Regional Council’s transportation priority outcomes of:
• A Safe and Accessible Transportation Network • Interconnected and Strategic Growth • A Well-maintained Transportation Network
To assist in achieving these priority outcomes, multi year initiatives were identified in the 2017/18 Halifax Transit Business Plan. These are described below, along with updates on relevant projects and programs that support the goals. Attachment B includes a detailed description of the deliverables identified in the business plan to support these priority outcomes. A Safe and Accessible Transportation Network Multi Year Initiative – “Transit Accessibility - Halifax Transit is committed to improving the accessibility of transit services in HRM. This includes improvements to the conventional service to make it an inclusive, viable option for more persons with reduced mobility, as well as improvements to the Access-A-Bus system to ensure it is meeting the needs of people who rely on that service. This includes physical infrastructure, policy and process improvements, engagement with the community, staff training and vehicle improvements.” Q2 Highlights – Federal Funding, through the Public Transit Infrastructure Fund (PTIF) has increased the number of bus stop improvements/upgrades planned for 2017/18 to over 200 bus stops. Upgrades include new/replacement bus stop landing pads in many locations, replacement and/or new shelters in other locations, and paving road shoulders at many ‘inaccessible stops’ to upgrade them to ‘non-standard bus stops’ where the ramp can be deployed. Approximately 90% of bus stops can now accommodate the wheelchair ramp. It is anticipated that all planned bus stop upgrades for 2017 will be completed within the third quarter, prior to the end of the construction season. The first annual Low Income Transit Pass Pilot Program began July 1, 2017, and all 1,000 places were full by mid-July. At time of writing, there are approximately 140 Halifax residents on the program wait list. Multi-Year Initiative – “Transit Technology - Through the implementation of improved transit technology including Computer Aided Dispatch/Automated Vehicle Location (CAD/AVL), Electronic Fare Management Systems, and Bus Stop Announcement, Halifax Transit is transforming the way customers interact with the transit system. In addition to providing improved service reliability and enhanced customer experience, new technology will provide data and management opportunities to inform increased efficiency of the transit system.” Q2 Highlights – In the second quarter of 2017/18, Halifax Transit awarded two contracts with Trapeze, for the Fare Management Solution and for Fixed Route Planning, Scheduling, and Operations software. Since finalizing these contracts, the project teams have been able to collaborate with Trapeze to initiate these projects. The Paratransit project initiated PASS upgrade activities this quarter, which includes an upgrade to the latest software version, data migration to a Microsoft SQL Server database (HRM’s standard), and optimized business configuration. This phase will provide a stable platform to enable additional solution capabilities in the future. In addition, a preliminary analysis of Automated Vehicle Monitoring (AVM) was conducted, researching vendor solutions and multiple jurisdictions using AVM. The AVM project plans to reengage with Bus Maintenance in 2018/19.
A Safe and Accessible Network Business Plan Deliverable Status Access-A-Bus Review Implementation In Progress Accessible transit Vehicle Procurement Plan In Progress Bus Surveillance System Upgrade In Progress Bus Stop Accessibility & Improvement In Progress

2017/18 Q2 Halifax Transit KPI Report Community Council Report - 3 - December 7, 2017
AVL+ Implementation Complete Fare Management Solution (Begin Implementation) In Progress Fixed Route Planning, Scheduling, and Operations Software (Begin Implementation) In Progress Halifax Transit Technology Program Transition Complete
Interconnected and Strategic Growth
Multi Year Initiative – “Transit Service Plan - Halifax Transit intends to offer its residents a significantly improved transit service. Guided by principles of integrated mobility, high ridership opportunity, and future sustainability, Halifax Transit is undertaking a multi-year initiative that includes a holistic and comprehensive review of the transit system and implementation of approved recommendations.”
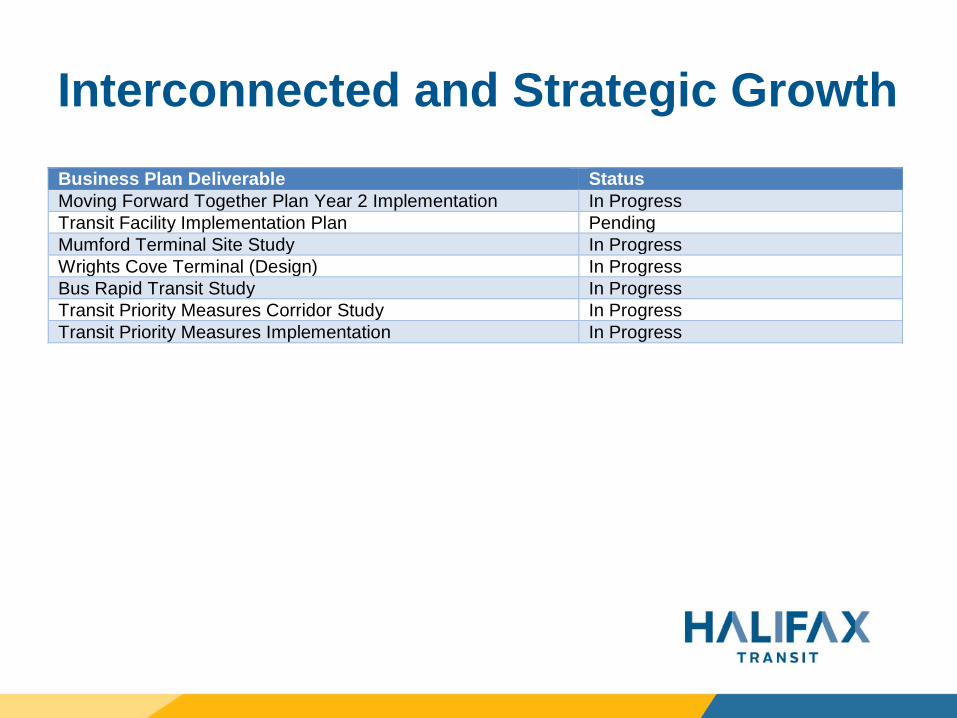
Q2 Highlights – Service changes were introduced as part of the Moving Forward Together Plan in August 2017, including the introduction of the new route 194 West Bedford Express. Work on the Mumford Terminal Opportunities Assessment and the Transit Priority Measures Corridor Studies is on track for completion, and have both recently had public engagement sessions. Work on the Bus Rapid Transit Study is well underway, and it is anticipated that public engagement will take place in late fall 2017. Halifax Transit continues to work alongside Planning & Development and Transportation Public Works to further the development of the Integrated Mobility Plan. Work is also underway on the implementation of two new queue jump lanes on Windmill Road, continuing the transit priority along the length of the Windmill Road corridor.
Interconnected and Strategic Growth Business Plan Deliverable Status Moving Forward Together Plan Year 2 Implementation In Progress Transit Facility Implementation Plan Pending Mumford Terminal Site Study In Progress Wrights Cove Terminal (Design) In Progress Bus Rapid Transit Study In Progress Transit Priority Measures Corridor Study In Progress Transit Priority Measures Implementation In Progress
A Well-maintained Transportation Network
Multi Year Initiative – “Transit Asset & Infrastructure Renewal - Halifax Transit will continue to promote transit as a key component of an integrated transportation system – as a competitor to the single occupant vehicle. To create an enhanced and more accessible experience for its customers, Halifax Transit will continue investment in the renewal of on-street infrastructure including construction of stop locations as well as replacement of Conventional, MetroX and Access-A-Bus vehicles and ferries.”
Q2 Highlights – Design work on the second phase of work at Halifax Ferry Terminal was completed, and the work tendered. Progress continued on the manufacture of the latest replacement ferry vessel, “Vincent Coleman,” and work was initiated on the second replacement vessel “Rita Joe”. Feasibility studies work is underway to establish the condition of the Alderney Ferry pontoon, and the feasibility studies were completed for the generators at all ferry terminals.
A Well Maintained Transportation Network Business Plan Deliverable Status Replace Alderney Ferry Terminal Pontoon In Progress Ferry Replacement In Progress Halifax Ferry Terminal Renovation Phase 2 in Progress, Phase 1 Complete Woodside Ferry Terminal Renovation Pending Ferry Terminal Generators In Progress

2017/18 Q2 Halifax Transit KPI Report Community Council Report - 4 - December 7, 2017
Alternative Fuel Recommendation Report In Progress Q2 Service Adjustments Effective August 21, 2017, several changes to the transit network were introduced. These include:
• The introduction of the new route 194 West Bedford Express; • Discontinuation of Route 402 Sambro; • Introduction of a new trip on Route 330 Tantallon; • Discontinuation of several School Special routes.
Additional schedule changes are planned for November 27, 2017. These include:
• Replacement of Route 19 Greystone & Route 20 Herring Cove with the new Route 9 Herring Cove; • Replacement of Route 9 Barrington by the new Route 29 Barrington; • Discontinuation of service to Halifax Exhibition Centre on Route 22 Armdale; • Discontinuation of Route 6 Quinpool; and • Completion of the Route 370 Porters Lake Pilot Project (service removed from Mic Mac Mall).
Performance Measures Please see Attachment B, Halifax Transit 2017/18 Q2 Performance Report for performance measures and detailed route level statistics. Q2 Highlights:
• System wide On-Time Performance in Q2 was 73%. • Boardings by route are reported for weekdays, Saturdays, and Sundays. The average daily
weekday passenger count in Q2 was 90,785. • Departure Line call volumes reported over 7500 passengers call the departure line on a typical
weekday in the second quarter. • Overall ridership increased 1.7% compared to second quarter last year, while revenue decreased
0.04%. • Trips provided by Access-A-Bus increased 3.7% while the number of waitlisted clients increased
8%. Approximately 40 new applicants are accepted every month. • 98% of customer feedback in Q2 was resolved within service standards. • Fuel cost was 63 cents/litre in Q2, 2 cents/litre lower than the budgeted amount. • The Mean distance between vehicle failures was 3,402 km in Q2. • Maintenance cost per kilometre in Q2 was in line with the budget price of $1.18/km.
Several performance measures and statistics were included beginning in Q1, 2017, including on-time performance, representing the percentage of observed time-point arrivals that are between one minute early and three minutes late. Further investigation is underway reviewing the potential to report the degree of lateness across the network or routes. Comparisons to previous years will begin once comparable historical data becomes available, to show relative increase/decrease. There may be a gap in some cases for several quarters. FINANCIAL IMPLICATIONS There are no financial implications associated with this report.

2017/18 Q2 Halifax Transit KPI Report Community Council Report - 5 - December 7, 2017 COMMUNITY ENGAGEMENT No community engagement took place as part of this report. ATTACHMENTS Halifax Transit 2017/18 Q2 KPI Report_Attachment A Halifax Transit 2017/18 Q2 KPI Report_Attachment B A copy of this report can be obtained online at halifax.ca or by contacting the Office of the Municipal Clerk at 902.490.4210. Report Prepared by: Anthony Grace, Transit Planning Technician, 902.490.2006 Colin Redding, Transit Planning Technician, 902.490.6632

Halifax Transit 2017/18 Business Plan Deliverables Deliverable Description Status
Access-A-Bus Review Implementation
Demand for the Halifax Transit Access-A-Bus service has increased significantly in recent years. In an effort to leverage the potential of existing resources and processes before increasing fleet size or staff, Halifax Transit will implement the findings of the 2016/17 comprehensive review of all facets of the service, including, redesign of internal processes, scheduling software, eligibility criteria and associated application administration, service coverage, customer interfaces, staff and client training, and other available sources of support.
The comprehensive review of AAB operations is complete and the scheduling software upgrade is underway. Staff training and streamlining of the internal business processes to follow in the last quarter of 2017/18. Additional reports regarding coverage and eligibility requirements will be available in 2018.
Accessible-transit Vehicle Procurement Plan
To improve reliability, reduce maintenance costs and provide expanded service, Halifax Transit will develop a new specification and tender document for procurement of accessible transit vehicles. The procurement of vehicles will be based on a revised AAB Service Plan to be brought to Regional Council in 17/18; procurement will follow in 18/19.
Jurisdictional plan complete; specification in progress. Tender anticipated for early November.
Bus Surveillance System Upgrade
The general objective of the Bus Surveillance System Upgrade Project is to procure, implement and establish support of a hybrid CCTV surveillance system that will improve the surveillance capabilities for each bus in the Halifax Transit fleet with high definition digital cameras while leveraging the capabilities of the currently fitted analog camera suite. The project will also introduce WiFi uploading for greater efficiency and improve analysis capabilities.
The RFP was issued and the award report is tentatively scheduled for Regional Council on November 28th. Fleet makeup and documentation for install has been prepared and installation will begin following approval by Council. This project is under budget and anticipated to be complete before the deadline of March 31st, 2017.
Bus Stop Accessibility & Improvement
To improve accessibility, as well as the customer experience, Halifax Transit will be installing accessible landing pads at a number of bus stops, replacing older bus shelters, installing benches at bus stops, and conducting a pilot project to evaluate the success of a heated shelter.
Concrete work for bus stop landing pads and shelter pads continues. Shelters are purchased and all are scheduled to be completed within Q3, including two heated shelters for Highfield Terminal. TPW continues to install the new bus stop benches.
AVL+ Finalize the implementation of the Computer Aided Dispatch/Automated Vehicle Location system to provide improved service reliability and real time information to the travelling public. Additional functionality will be applied to the base CAD/AVL system to add value. Customers will be able to confirm the location of a bus using real-time data supplied to various 3rd-party web and
All project activities have been completed

mobile application providers. Automated stop announcements and destination sign integration will improve the quality of the service provided.
Fare Management To increase revenues, increase operator safety, and provide timely data for management decisions, Halifax Transit will begin implementation of a fare management solution. Validating fareboxes and back office software will be installed; future features may include easy, electronic fare payment, automated transfers, smart fare technology, electronic web purchasing, fare vending machines and re-loadable smart cards.
A contract for the supply of validating fareboxes was approved in August 2017. Planning activities with the vendor have begun.
Fixed Route Planning, Scheduling and Operations
The primary objective of the Fixed Route Planning, Scheduling, and Operations project is to implement a Planning, Scheduling, and Operations software solution that enables Halifax Transit to operate more efficiently. The existing solution is not capable of supporting the streamlined existing or new business processes required by Halifax Transit.
The purchase of new the new solution was approved by Council in August 2017. Planning activities with the vendor have begun.
Halifax Transit Technology Program - Implementation, Transition, & Support
The Halifax Transit Technical Services team will assist in the planning and implementation of the various projects associated with the Halifax Transit Technology Program. As the project deliverables associated with the Halifax Transit Technology Program are completed, ongoing support and maintenance will be transitioned from the project team to the Halifax Transit Technical Services team.
All activities associated with the ongoing support and maintenance of the AVL+ solution have been transitioned from the program/project team to Halifax Transit Technical Services. Halifax Transit Technical Services staff are closely involved in the ongoing projects, decreasing the need for transition going forward.
Moving Forward Together Plan Year 2 Implementation
To improve the efficiency and effectiveness of the transit network, Halifax Transit will proceed with network design changes, including removal of service, introduction of new service, and changes to existing routes, as part of the implementation of the Moving Forward Together Plan.
May and August 2017 changes were successfully implemented. Preparation is nearing completion for November service changes described in the 2017/18 Annual Service Plan.
Transit Facility Implementation Plan
To provide predictability and transparency, a master planning exercise will take place to provide guidance as to where future investment in transit facilities, including terminals and Park & Rides, is required.
This project is not yet initiated.
Mumford Terminal Site Study
The existing Mumford Terminal is overcapacity and in need of replacement to improve the operation of the facility, the customer experience, and to allow for future service expansion. A study will be undertaken to determine the best location for a new terminal.
Initial site visits were completed in April 2017, and stakeholder meetings/public intercept surveys took place in June 2017. Two public meetings took place in September 2017. It is anticipated that preferred options will be selected by late fall 2017.

Wrights Cove Terminal To enable implementation of the Moving Forward Together Plan and improve the connectivity of the Halifax Transit network, Halifax Transit will continue preparations for the Wright's Cove Terminal in cooperation with Operations Support.
Functional design was completed in summer 2017. Work is underway to tender design.
Bus Rapid Transit Study To build upon the outcomes of the Integrated Mobility Plan, and improve the reliability and attractiveness of transit service, a study will be conducted to analyze the opportunities and feasibility of implementing bus rapid transit in Halifax.
This project has been initiated, and the assessment of potential bus rapid transit corridors is underway. It is anticipated that public engagement will take place in late fall 2017.
Transit Priority Measures Corridor Study
The Moving Forward Together Plan identified the need for transit priority measures on both Gottingen Street and Bayers Road to have an immediate and positive impact on the reliability of the transit network. A study will be conducted to analyze and design appropriate measures for these two corridors.
A contract has been awarded to prepare functional designs of Transit Priority Measures on Gottingen Street, Bayers Road, Young Street, and Robie Street. Public engagement on initial functional designs for Bayers Road and Gottingen Street took place in September/October 2017. A preferred functional design will be recommended to Council before work proceeds on detailed design.
Transit Priority Measures Implementation
To improve the reliability of the transit network, and reduce the impact of traffic congestion on transit service, Halifax Transit will implement approximately eight to ten transit priority measures, in conjunction with Road Operations & Construction and Traffic Management.
Work on two major transit priority measures are underway on Windmill Road. Work is in progress on several other smaller modifications.
Replace Alderney Ferry Terminal Pontoon
The Alderney Ferry Terminal Pontoon is nearing the end of its useful life. The steel hull pontoon is costly to maintain and deckhouses on these pontoons are restricted in the space available to accommodate overhead doors suitable for an industrial setting in sometimes harsh environmental conditions. Using Public Transit Infrastructure Fund funding, the Alderney pontoon will be replaced with a unit that incorporates materials and a deckhouse structure that is more suitable for the operating environment and will result in a significant reduction in operating costs.
The procurement process closed in summer 2017, and bids received were above budget. At this time, work is underway to undertake a condition report of the Alderney Pontoon in order to inform next steps.
Ferry Replacement To support sustainable ferry operations into the future by implementing the Ferry Replacement project with the construction, fit out and certification of two replacement ferries, with a funding contribution from the federal government's Public Transit Infrastructure Fund.
Both the Vincent Coleman and Rita Joe are under construction, with one vessel planned for delivery in early 2018, and the next for fall 2018.

Halifax Ferry Terminal Renovation
To improve the customer experience at the Halifax Ferry Terminal, the recapitalization work will continue, and will include elements such as the security kiosk and washroom renovations.
Phase 1 renovations are complete. Phase 2 renovations are scheduled to begin in November 2017.
Woodside Ferry Terminal Renovation
The Woodside Ferry Terminal requires significant rehabilitation to all aspects of the building, including envelope, mechanical and electrical systems, and customer waiting areas. In addition, with the expansion of the Halifax Transit ferry fleet, additional berthing space is required. In 17/18, with assistance from Operations Support, will complete the detailed design work required to move forward with these improvements.
Work is underway to address immediate structural repairs. Detailed design work for the building as a whole has not yet commenced.
Ferry Terminal Generators
To ensure the reliability and consistency of service provision, generators will be installed at all three existing ferry terminals as a source of back-up power.
Feasibility study for all three ferry terminals were completed in September 2017. Work will be initiated shortly to undertake the detailed design for generators at one to two locations.
Alternative Fuel Recommendation Report
To reduce operating cost and carbon footprint; Halifax Transit will produce a report recommending the most appropriate mix of fuels to be used in Halifax Transit's fleet. This recommendation will guide Halifax Transit's procurement and replacement strategy for the next twenty-five years.
The final Battery Electric Bus Feasibility Study report was submitted to Bus Maintenance and is currently under review. The Battery Electric Bus Feasibility Study is anticipated to close by the third quarter.
2017/2018 – Q2 Performance Measures Report
Attachment B: 2017/18 Q2 Halifax Transit Performance Measures Report

Contents Ridership & Revenue ..................................................................................................................................... 1
Historical Revenue & Ridership................................................................................................................. 1
Revenue – Actual vs. Planned ................................................................................................................... 3
Mean Distance Between Failures ................................................................................................................. 5
Maintenance Cost – Quarter Average vs Budget .......................................................................................... 6
Fuel Cost – Quarter Average vs Budget ........................................................................................................ 6
Access-A-Bus Trip Details .............................................................................................................................. 7
Customer Service – All Services .................................................................................................................... 7
Boardings ...................................................................................................................................................... 9
Standard Deviation ................................................................................................................................... 9
Boardings by Route by Service Day ........................................................................................................... 9
Express Service Boardings by Route by Service Day ............................................................................... 11
Boardings by District ............................................................................................................................... 12
Weekday Boardings by District – All Day ............................................................................................ 12
Weekday Boardings by District – AM Peak Period ............................................................................. 13
Passengers per Hour ................................................................................................................................... 14
Passengers per Hour by Route ................................................................................................................ 15
Express Service Passengers per Trip ....................................................................................................... 16
Regional Express Passengers per Trip ..................................................................................................... 17
Ferry Passengers per Hour ...................................................................................................................... 17
On-Time Performance ................................................................................................................................. 18
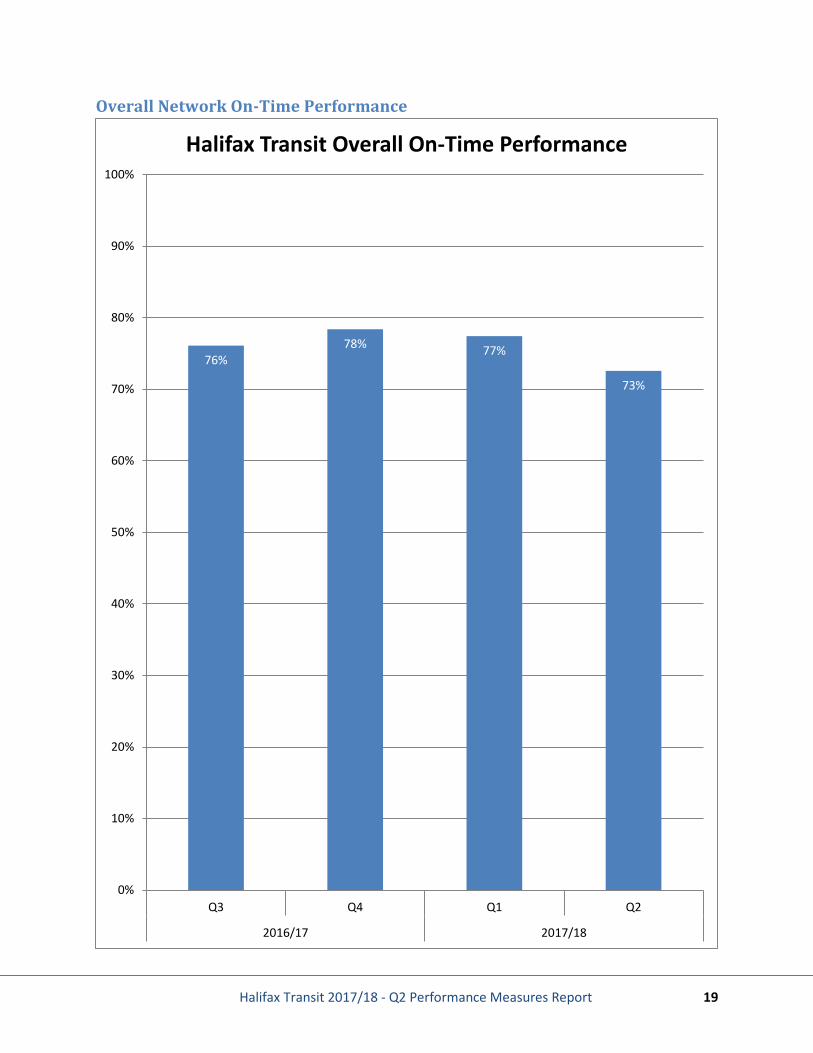
Overall Network On-Time Performance ................................................................................................. 19
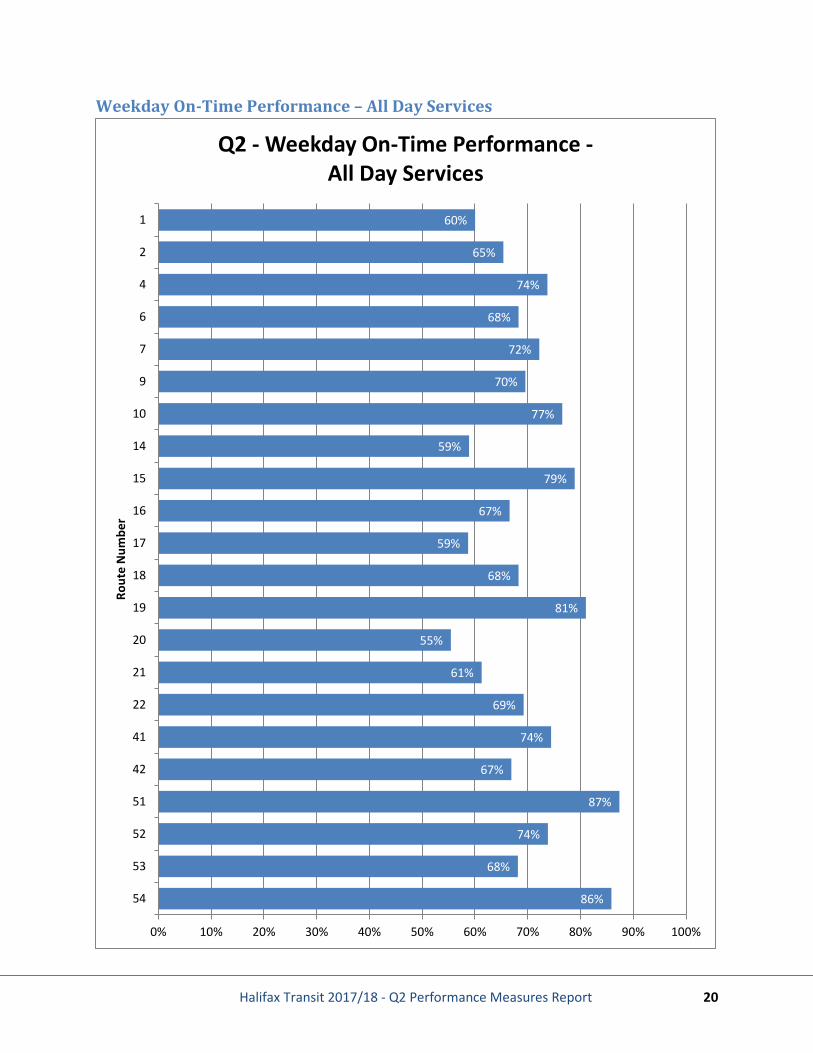
Weekday On-Time Performance – All Day Services................................................................................ 20
Weekday Peak Period On-Time Performance – All Day Services ........................................................... 22
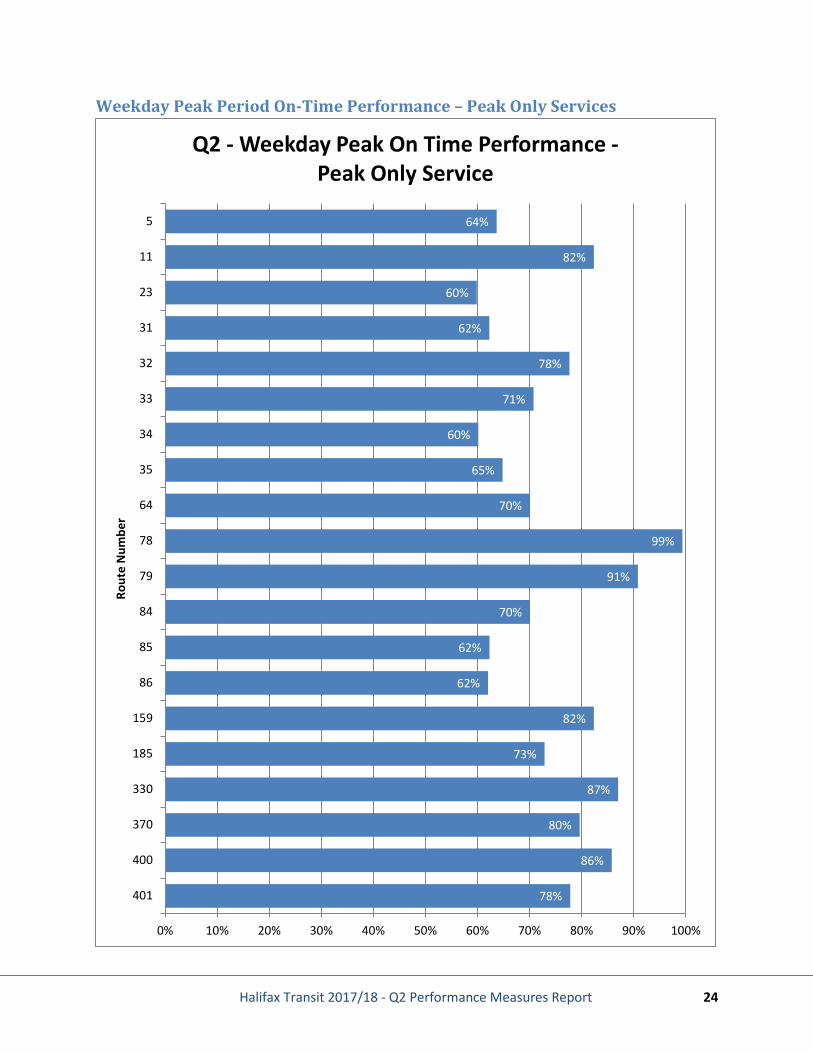
Weekday Peak Period On-Time Performance – Peak Only Services ...................................................... 24

Halifax Transit 2017/18 - Q2 Performance Measures Report 1
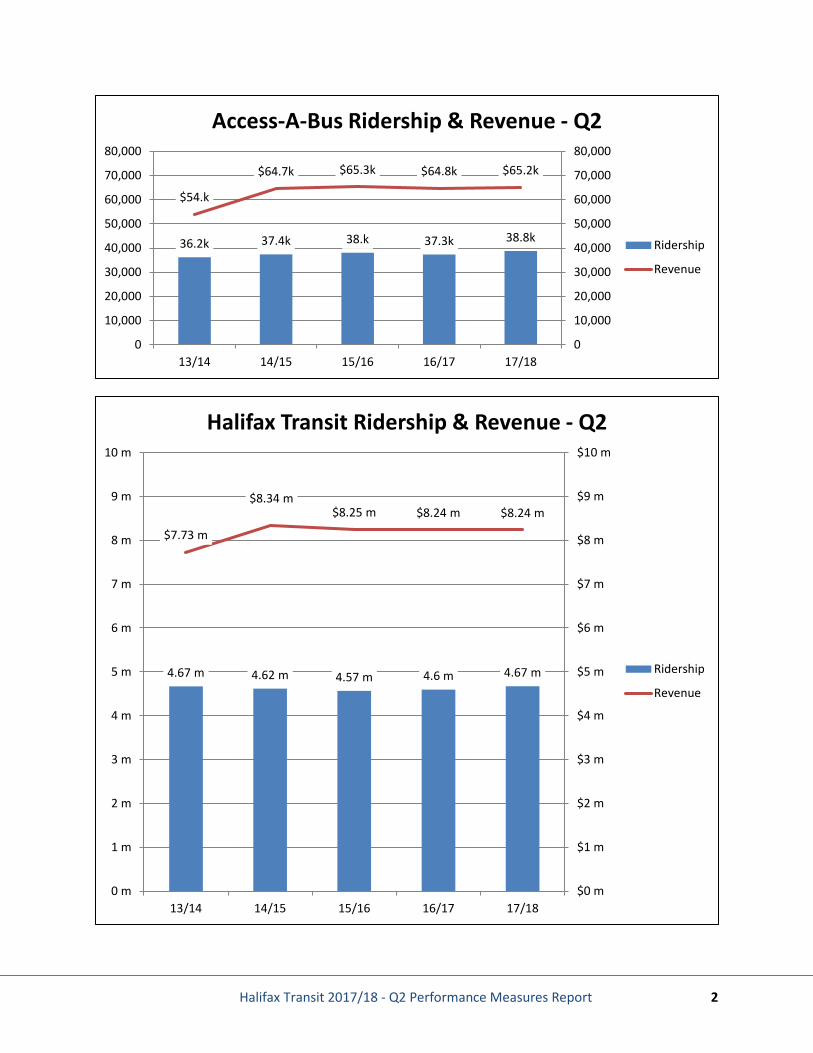
Ridership & Revenue Revenue and ridership measures demonstrate how well transit services were used during the past quarter in comparison to the same period of the previous year. Ridership figures are calculated based on revenue generated by fare type.
In the second quarter, Conventional ridership increased 1.8%, Ferry ridership increased 0.6% and Access-A-Bus ridership increased 3.9%. Overall, system wide ridership increased in the second quarter by 1.7% compared to last year. Revenue this quarter decreased by 0.04%. This slight decrease in revenue can be attributed to a lower average fare resulting from increased transit pass sales in the second quarter.
Historical Revenue & Ridership
4.2 m 4.12 m 3.99 m 3.92 m 3.99 m
$6.95 m$7.44 m $7.2 m $7.02 m $7.02 m
$0 m$1 m$2 m$3 m$4 m$5 m$6 m$7 m$8 m$9 m$10 m
0 m1 m2 m3 m4 m5 m6 m7 m8 m9 m
10 m
13/14 14/15 15/16 16/17 17/18
Conventional Ridership & Revenue - Q2
Ridership
Revenue
434.1k 459.5k541.2k
641.1k 644.6k$730.k
$839.8k
$987.4k
$1.16 m $1.15 m
$0
$200,000
$400,000
$600,000
$800,000
$1,000,000
$1,200,000
0
200,000
400,000
600,000
800,000
1,000,000
1,200,000
13/14 14/15 15/16 16/17 17/18
Ferry Ridership & Revenue - Q2
Ridership
Revenue
Halifax Transit 2017/18 - Q2 Performance Measures Report 2
36.2k 37.4k 38.k 37.3k 38.8k
$54.k
$64.7k $65.3k $64.8k $65.2k
0
10,000
20,000
30,000
40,000
50,000
60,000
70,000
80,000
0
10,000
20,000
30,000
40,000
50,000
60,000
70,000
80,000
13/14 14/15 15/16 16/17 17/18
Access-A-Bus Ridership & Revenue - Q2
Ridership
Revenue
4.67 m 4.62 m 4.57 m 4.6 m 4.67 m
$7.73 m
$8.34 m$8.25 m $8.24 m $8.24 m
$0 m
$1 m
$2 m
$3 m
$4 m
$5 m
$6 m
$7 m
$8 m
$9 m
$10 m
0 m
1 m
2 m
3 m
4 m
5 m
6 m
7 m
8 m
9 m
10 m
13/14 14/15 15/16 16/17 17/18
Halifax Transit Ridership & Revenue - Q2
Ridership
Revenue

Halifax Transit 2017/18 - Q2 Performance Measures Report 3
Revenue – Actual vs. Planned The following charts provide an indication of how much revenue has been generated by each service type, and by Halifax Transit in comparison to the planned budget revenue. Year to date revenue continues to reflect a shift from bus service to ferry service and has increased from last year, however is trending overall below the planned amount. Access-A-Bus revenue to date has increased 3.2%. Overall revenue to date has decreased 1.6% from this time last year, and stands at 6.4% lower than the planned amount.
$13,901,713 $15,300,000
$0
$5,000,000
$10,000,000
$15,000,000
$20,000,000
Actual Planned
2017/18 YTD Actual vs Planned Conventional Revenue
$1,866,845
$1,550,000
$0
$500,000
$1,000,000
$1,500,000
$2,000,000
Actual Planned
2017/18 YTD Actual vs Planned Ferry Revenue
$138,658 $148,000
$0
$50,000
$100,000
$150,000
$200,000
Actual Planned
2017/18 YTD Actual vs Planned Access-A-Bus Revenue

Halifax Transit 2017/18 - Q2 Performance Measures Report 4
$15,907,216
$16,998,000
$0
$2,000,000
$4,000,000
$6,000,000
$8,000,000
$10,000,000
$12,000,000
$14,000,000
$16,000,000
$18,000,000
Actual Planned
2017/18 YTD Actual vs Planned Halifax Transit Revenue

Halifax Transit 2017/18 - Q2 Performance Measures Report 5
Mean Distance Between Failures The Mean Distance Between Failures is tracked monthly to demonstrate the reliability of buses as it relates to maintenance. In relation to prior quarters, the mean distance between failures was 3,402 kilometres in the second quarter and has improved conservatively. This equates to an average of 17 daily breakdowns. Such improvements can be attributed to the release of both an enhanced Preventative Maintenance Program and reduction in average fleet age. Bus Maintenance is currently researching the industry standard for this metric as part of the Bus Maintenance KPI project. The definition of what contributes to Mean Distance Between Failures is key in determining a reasonable benchmark. More information will be provided once research is complete.
2,950
3,361
2,7673,108
3,402
0
500
1,000
1,500
2,000
2,500
3,000
3,500
4,000
Q2 Q3 Q4 Q1 Q2
2016/17 2017/18
Kms
Quarterly Mean Distance Between Failures
2,815 2,972 3,070
4,174
3,472
2,856 2,875 2,775 2,653
3,2492,987 3,106
3,327 3,433 3,447
0
500
1,000
1,500
2,000
2,500
3,000
3,500
4,000
4,500
Jul 1
6
Aug
16
Sep
16
Oct
16
Nov
16
Dec
16
Jan
17
Feb
17
Mar
17
Apr 1
7
May
17
Jun
17
Jul 1
7
Aug
17
Sep
17
KMs
Monthly Mean Distance Between Failures

Halifax Transit 2017/18 - Q2 Performance Measures Report 6
Maintenance Cost – Quarter Average vs Budget Maintenance costs may fluctuate from budgeted costs due to environmental factors and unpredictability of the business. In the second quarter Bus Maintenance cost was $1.18/km, in line with the budget cost/km of $1.18.
Fuel Cost – Quarter Average vs Budget The Budgeted fuel cost for 2017/18 was set at 65 cents/litre. Fuel cost this quarter is 63 cents/litre, two cents per litre lower than the budgeted cost.
$1.18 $1.18
$0.00
$0.20
$0.40
$0.60
$0.80
$1.00
$1.20
$1.40
Average Price Budget Price
Maintenance Cost per Kilometre -Q2 Average vs Budget
$0.634 $0.650
$0.00
$0.20
$0.40
$0.60
$0.80
Average Price Budget Price
Fuel Cost per Litre - Q2 Average Price vs Budget
Halifax Transit 2017/18 - Q2 Performance Measures Report 7
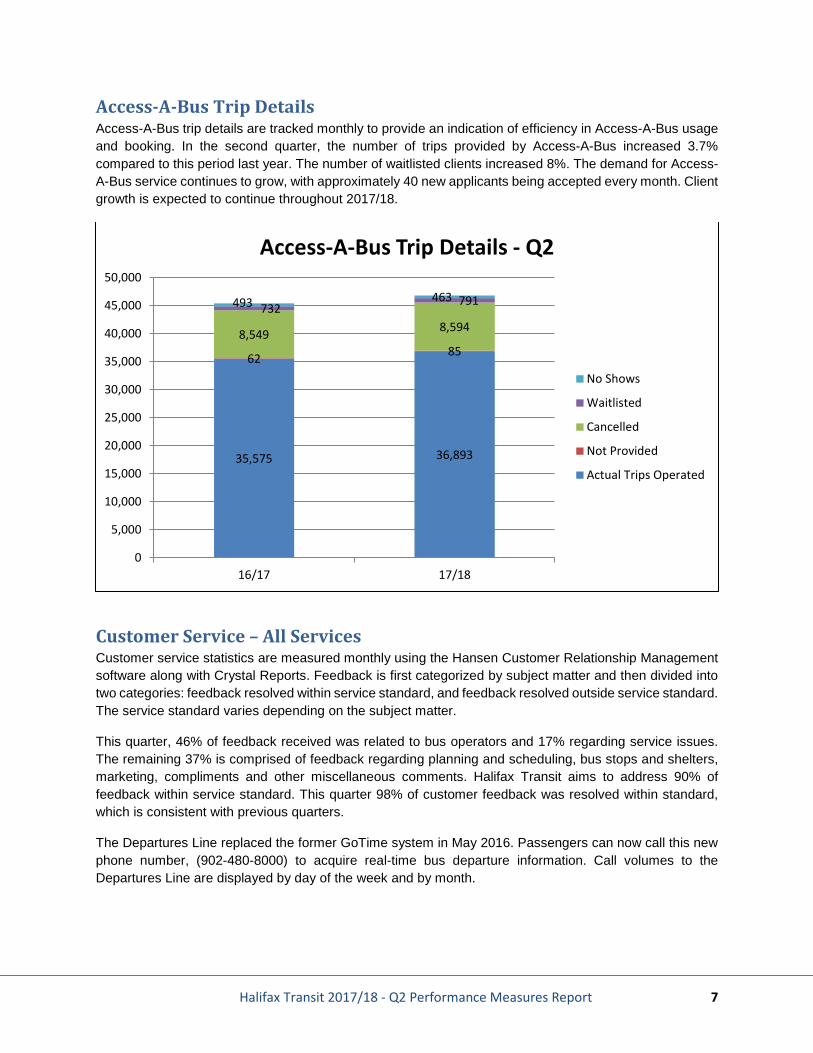
Access-A-Bus Trip Details Access-A-Bus trip details are tracked monthly to provide an indication of efficiency in Access-A-Bus usage and booking. In the second quarter, the number of trips provided by Access-A-Bus increased 3.7% compared to this period last year. The number of waitlisted clients increased 8%. The demand for Access-A-Bus service continues to grow, with approximately 40 new applicants being accepted every month. Client growth is expected to continue throughout 2017/18.
Customer Service – All Services Customer service statistics are measured monthly using the Hansen Customer Relationship Management software along with Crystal Reports. Feedback is first categorized by subject matter and then divided into two categories: feedback resolved within service standard, and feedback resolved outside service standard. The service standard varies depending on the subject matter.
This quarter, 46% of feedback received was related to bus operators and 17% regarding service issues. The remaining 37% is comprised of feedback regarding planning and scheduling, bus stops and shelters, marketing, compliments and other miscellaneous comments. Halifax Transit aims to address 90% of feedback within service standard. This quarter 98% of customer feedback was resolved within standard, which is consistent with previous quarters.
The Departures Line replaced the former GoTime system in May 2016. Passengers can now call this new phone number, (902-480-8000) to acquire real-time bus departure information. Call volumes to the Departures Line are displayed by day of the week and by month.
35,575 36,893
62 858,549 8,594
732 791493 463
0
5,000
10,000
15,000
20,000
25,000
30,000
35,000
40,000
45,000
50,000
16/17 17/18
Access-A-Bus Trip Details - Q2
No Shows
Waitlisted
Cancelled
Not Provided
Actual Trips Operated

Halifax Transit 2017/18 - Q2 Performance Measures Report 8
Resolved Within Service Standard,
1,638
Resolved Outside Service Standard, 34
Halifax Transit Customer Service Standards - Q2
Percentage of Complaints resolved within standard: 98%
1%5%
9%
46%
17%
8%4% 10%
Summary of Customer Feedback - Q2 Transit Technology
Planning & Scheduling
Bus Stops & Shelters
Bus Operator Issues
Service Issues
Marketing
Compliments
Other Feedback
0
1000
2000
3000
4000
5000
6000
7000
8000
9000
Weekday Saturday Sunday
Pass
enge
rs
Average Departures Line Call Volumes - Q2
Jul
Aug
Sep

Halifax Transit 2017/18 - Q2 Performance Measures Report 9
Boardings Automatic Passenger Counter (APC) data is now being been used to report bus ridership statistics. The APCs provide data within a 90% degree of accuracy. Boardings by Route demonstrate passenger usage during the past quarter. APC data has been collected since September 2016. Comparisons of annual ridership data may be made once comparable historical APC data becomes available, anticipated as early as the third or fourth quarter of 2017.
Standard Deviation The standard deviation in boardings is the degree of variance in data from the daily average passenger count.
Average weekday boardings in second quarter were 90,785 ± 6063 (6.7% variance). Average Saturday boardings this quarter were Saturday 53,412 ± 7,069 (13.2% variance). Average Sunday boardings this quarter were 36,129 ± 6,318 (17.5% variance).
Boardings by Route by Service Day Q2 2017/18 Average Daily Boardings by Route
Route Weekday Saturday Sunday
Boardings Pass/Hr Boardings Pass/Hr Boardings Pass/Hr 1 8,741 60 6,327 49 4,316 51 2 2,748 44 2,027 36 1,189 39 4 2,497 40 2,092 35 1,228 40 5 105 26 6 599 19 277 14 61 4 7 4,684 41 3,476 35 2,089 39 9 2,242 47 1,068 41 781 30
10 4,331 40 2,619 32 1,648 35 11 105 42 14 2,498 39 1,278 37 1,015 35 15 237 16 121 14 131 17 16 1,066 23 705 16 17 1,142 29 18 1,707 29 1,399 27 720 39 19 1,041 34 20 3,551 42 3,239 38 2,381 41 21 1,263 29 765 19 348 14 22 442 12 420 11 335 9 23 342 18 41 1,098 38 42 1,142 31 51 1,028 43 517 30 317 38 52 5,800 48 3,974 38 3,581 38 53 1,313 49 738 46 444 54 54 826 39 538 32 254 26
* Blanks in this table indicate the route runs weekdays only.

Halifax Transit 2017/18 - Q2 Performance Measures Report 10
Q2 2017/18 Average Daily Boardings by Route
Route Weekday Saturday Sunday
Boardings Pass/Hr Boardings Pass/Hr Boardings Pass/Hr 55 436 20 290 17 208 13 56 825 23 872 23 539 17 57 556 14 283 9 165 9 58 702 25 572 28 412 24 59 2,027 26 754 29 545 23 60 2,738 36 1,857 43 1,272 44 61 2,218 29 1,076 23 909 24 62 788 25 588 24 273 17 63 719 43 64 320 30 65 244 15 82 6 57 9 66 1,483 24 497 28 353 22 68 1,352 27 781 25 508 18 72 1,344 29 947 19 522 21 80 4,120 33 3,595 31 2,698 28 81 1,271 24 82 893 19 237 10 99 9 83 156 12 93 9 41 9 87 1,315 29 1,058 20 556 18 88 86 16 64 12 23 10 89 459 20 90 1,223 26 834 17 505 20
400 204 16 58 8 56 8 401 168 13
Alderney 5,827 194 6,811 389 5,117 292 Woodside 2,654 126
* Blanks in this table indicate the route runs weekdays only.

Halifax Transit 2017/18 - Q2 Performance Measures Report 11
Express Service Boardings by Route by Service DayQ2 2017/18 Average Daily Boardings by Route
Express Route
Weekday Saturday Sunday
Boardings Pass/Trip Boardings Pass/Trip Boardings Pass/Trip 31 259 28 32 459 25 33 173 38 34 659 38 35 258 28 78 85 6 79 97 8 84 824 30 85 115 28 86 111 27
159 714 17 185 1,053 21 194 95 12 320 671 16 477 428 330 368 15 370 131 9
* Blanks in this table indicate the route runs weekdays only.
Halifax Transit 2017/18 - Q2 Performance Measures Report 12
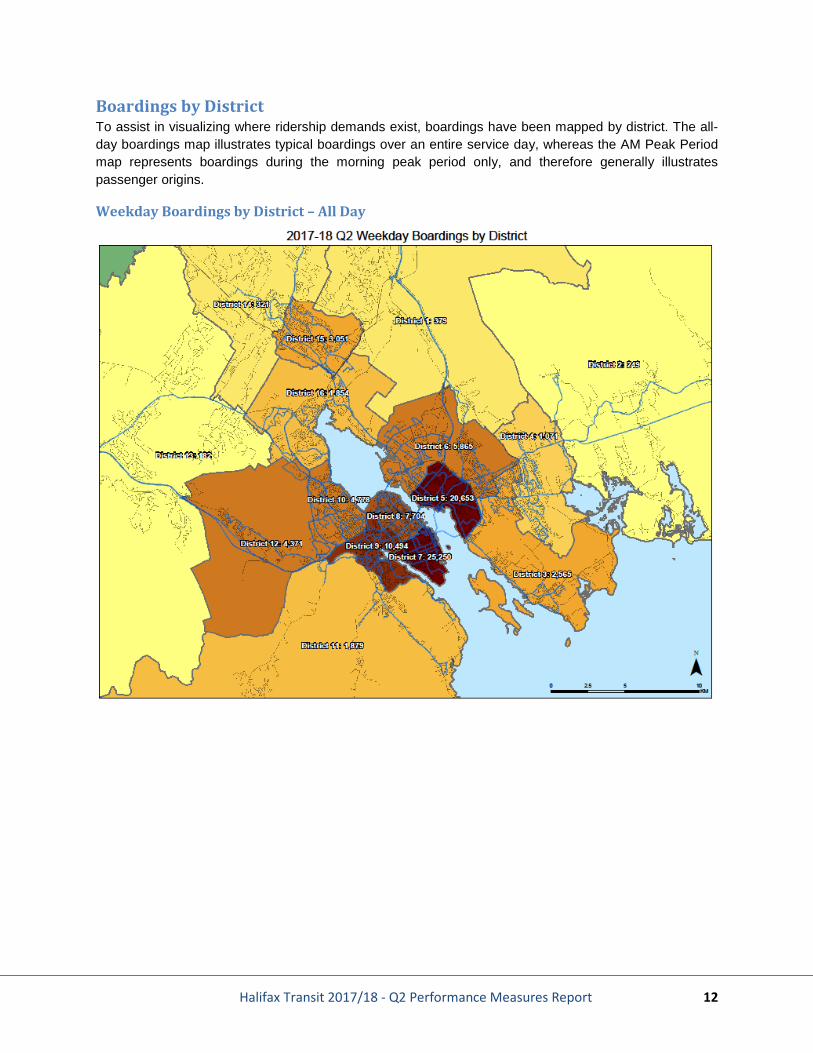
Boardings by District To assist in visualizing where ridership demands exist, boardings have been mapped by district. The all- day boardings map illustrates typical boardings over an entire service day, whereas the AM Peak Period map represents boardings during the morning peak period only, and therefore generally illustrates passenger origins.
Weekday Boardings by District – All Day

Halifax Transit 2017/18 - Q2 Performance Measures Report 13
Weekday Boardings by District – AM Peak Period

Halifax Transit 2017/18 - Q2 Performance Measures Report 14
Passengers per Hour Passengers per hour measures the volume of passengers carried per service hour by route. Due to differences in service model/design, Express Routes are measured instead by passengers per trip. Ridership fluctuates significantly by season, and therefore figures will be compared to the same quarter in the previous year once data becomes available. Conventional route targets vary by time of day and are not illustrated at this time as data is being presented over the entire service day only. Express routes have a ridership target of 20 passengers per trip, while Regional Express Routes have a target of 15 passengers per trip.
Due to the importance of the ferry to the regional transportation network, and its historic and cultural heritage value, ferry routes are not held to a minimum ridership standard. In much the same way, due to the regional significance of the Route 320 Airport from a tourism and economic development perspective, service to the Halifax International Airport is also exempt from minimum ridership guidelines.

Halifax Transit 2017/18 - Q2 Performance Measures Report 15
Passengers per Hour by Route
6044
4026
1941
4740
4239
1623
2929
3442
2912
1838
3143
4849
3920
2314
2526
3629
2543
3015
2427
2933
2419
1229
1620
2616
13
0 10 20 30 40 50 60 70
1245679
10111415161718192021222341425152535455565758596061626364656668728081828387888990
400401
Passengers per Hour
Rout
e
Passengers per Hour - Q2 (excluding Express Routes)

Halifax Transit 2017/18 - Q2 Performance Measures Report 16
Express Service Passengers per Trip
28
25
38
38
28
6
8
30
28
27
17
21
12
0 5 10 15 20 25 30 35 40
31
32
33
34
35
78
79
84
85
86
159
185
194
Passengers per Trip
Rout
e
Express Service Peak Passengers per Trip - Q2

Halifax Transit 2017/18 - Q2 Performance Measures Report 17
Regional Express Passengers per Trip
Ferry Passengers per Hour
16
15
9
0 2 4 6 8 10 12 14 16 18
320
330
370
Passengers per Trip
Rout
e
Regional Express Service Peak Passengers per Trip - Q2
194
126
0
50
100
150
200
250
Alderney Woodside
Pass
enge
rs p
er H
our
Ferry Passengers per Hour - Q2

Halifax Transit 2017/18 - Q2 Performance Measures Report 18
On-Time Performance Reporting of On-Time Performance was introduced in the first quarter. Comparisons to previous years will begin once comparable historical data becomes available, anticipated as early as the third or fourth quarter this year. Halifax Transit will analyze On-Time Performance across the network in order to establish a benchmark and target for the minimum percentage of trips to depart on time.
On-Time Performance is a measure of route reliability and is tracked monthly to demonstrate schedule adherence across the network of routes. Terminals and select bus stops along each route are classified as time-points and have assigned and publicized scheduled arrival times. On-Time Performance demonstrates the percentage of observed time-point arrivals that are between one minute early and three minutes late. Transit Industry standard targets for On-Time Performance tend to range between 85% and 90%, although service types are not always comparably grouped, nor are schedule adherence definitions consistent between agencies.
With construction season in full swing, On-Time Performance was significantly impacted in the second quarter. Traffic volumes using the Highway 102/Bayers Road Corridor have increased significantly in response to an all-day closure of St. Margarets Bay Road requiring detours on several routes. Additional detours have been required on Route 14 Leiblin Park while Leiblin Drive undergoes a Wastewater Upgrade Project. Details for these projects are outlined below:
• The St. Margarets Bay Road Construction Project o Originally an 11 week project, now extended until late fall 2017; o St. Margarets Bay Road closed, between Walter Havill Drive and the Armdale
Roundabout; o Route 1 Spring Garden is often detoured outbound at PM Peak away from Bayers Road,
turning instead onto Roslyn Road to Connaught Avenue, back to Bayers Road; o Route 194 West Bedford Express is often detoured away from Highway 102 inbound,
travelling instead to Highway 102 outbound, to Lacewood Drive to Main Avenue; o Routes from Ragged Lake Transit Centre often detoured to mitigate delays; o Delays are anticipated to continue into the third quarter.
• The Leiblin Drive Wastewater Upgrade Project
o Originally planned for completion in October; o Project continues into the third quarter; o Leiblin Drive closed between Carnation Crescent and Guildwood Crescent; o Route 14 will service Leiblin Drive as far as the first turn onto Birchfield Crescent and
return.
Some moderate delays are anticipated to continue while construction projects on the Macdonald bridge, Gottingen Street and Lower Water Street continue into the third quarter.
Halifax Transit 2017/18 - Q2 Performance Measures Report 19
Overall Network On-Time Performance
76%78% 77%
73%
0%
10%
20%
30%
40%
50%
60%
70%
80%
90%
100%
Q3 Q4 Q1 Q2
2016/17 2017/18
Halifax Transit Overall On-Time Performance
Halifax Transit 2017/18 - Q2 Performance Measures Report 20
Weekday On-Time Performance – All Day Services
60%
65%
74%
68%
72%
70%
77%
59%
79%
67%
59%
68%
81%
55%
61%
69%
74%
67%
87%
74%
68%
86%
0% 10% 20% 30% 40% 50% 60% 70% 80% 90% 100%
1
2
4
6
7
9
10
14
15
16
17
18
19
20
21
22
41
42
51
52
53
54
Rout
e N
umbe
r
Q2 - Weekday On-Time Performance -All Day Services

Halifax Transit 2017/18 - Q2 Performance Measures Report 21
78%
95%
93%
94%
81%
80%
68%
76%
89%
83%
71%
75%
83%
61%
65%
81%
96%
64%
93%
90%
62%
84%
0% 10% 20% 30% 40% 50% 60% 70% 80% 90% 100%
55
56
57
58
59
60
61
62
63
65
66
68
72
80
81
82
83
87
88
89
90
320
Rout
e N
umbe
rQ2 - Weekday On-Time Performance -
All Day Services (continued)

Halifax Transit 2017/18 - Q2 Performance Measures Report 22
Weekday Peak Period On-Time Performance – All Day Services
47%
52%
63%
53%
70%
64%
76%
49%
74%
61%
53%
52%
71%
49%
58%
61%
67%
62%
82%
70%
67%
82%
0% 10% 20% 30% 40% 50% 60% 70% 80% 90% 100%
1
2
4
6
7
9
10
14
15
16
17
18
19
20
21
22
41
42
51
52
53
54
Rout
e N
umbe
r
Q2 - Weekday Peak On Time Performance -All Day Services

Halifax Transit 2017/18 - Q2 Performance Measures Report 23
80%
96%
93%
92%
71%
78%
62%
73%
88%
77%
54%
67%
77%
59%
60%
73%
96%
56%
92%
89%
54%
79%
0% 10% 20% 30% 40% 50% 60% 70% 80% 90% 100%
55
56
57
58
59
60
61
62
63
65
66
68
72
80
81
82
83
87
88
89
90
320
Rout
e N
umbe
rQ2 - Weekday Peak On Time Performance -
All Day Services (continued)
Halifax Transit 2017/18 - Q2 Performance Measures Report 24
Weekday Peak Period On-Time Performance – Peak Only Services
64%
82%
60%
62%
78%
71%
60%
65%
70%
99%
91%
70%
62%
62%
82%
73%
87%
80%
86%
78%
0% 10% 20% 30% 40% 50% 60% 70% 80% 90% 100%
5
11
23
31
32
33
34
35
64
78
79
84
85
86
159
185
330
370
400
401
Rout
e N
umbe
r
Q2 - Weekday Peak On Time Performance -Peak Only Service

TSC Q2 2017/18 Report
December 7, 2017
Attachment 2

Transportation Priority Outcomes
A Safe and Accessible Transportation Network
– Transit Accessibility
– Transit Technology
Interconnected and Strategic Growth
– Transit Service Plan
A Well Maintained Transportation Network
– Transit Asset and Infrastructure Renewal

A Safe and Accessible Transportation NetworkBusiness Plan Deliverable Status Access-A-Bus Review Implementation In Progress Accessible transit Vehicle Procurement Plan In Progress Bus Surveillance System Upgrade In Progress Bus Stop Accessibility & Improvement In Progress AVL+ Implementation Complete Fare Management Solution (Begin Implementation) In Progress Fixed Route Planning, Scheduling, and Operations Software (Begin Implementation) In Progress Halifax Transit Technology Program Transition Complete
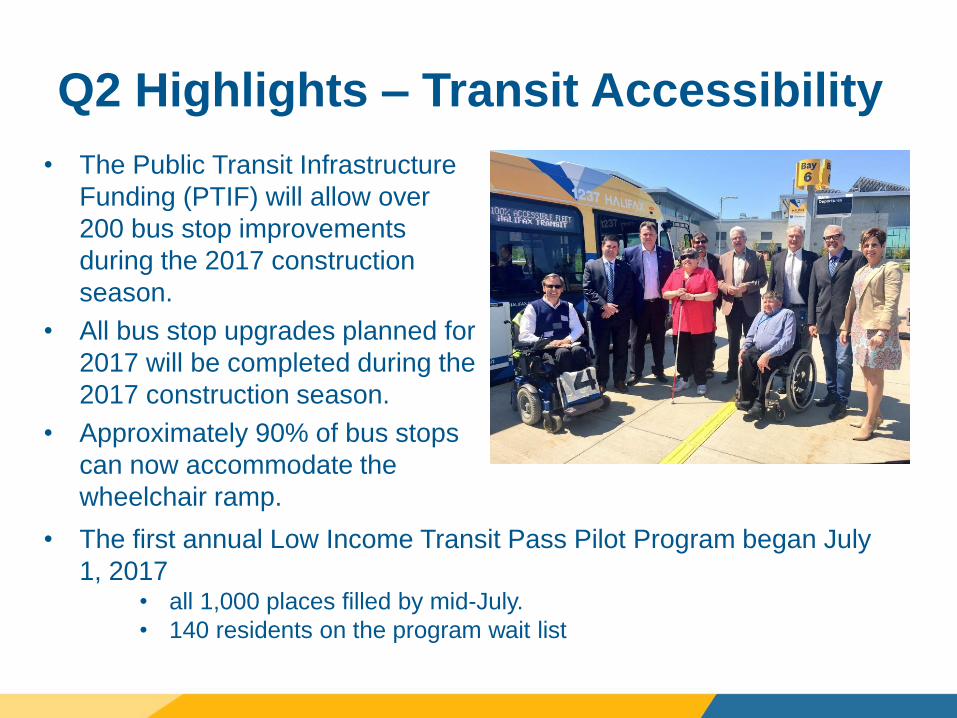
Q2 Highlights – Transit Accessibility
• The Public Transit Infrastructure Funding (PTIF) will allow over 200 bus stop improvements during the 2017 construction season.
• All bus stop upgrades planned for 2017 will be completed during the 2017 construction season.
• Approximately 90% of bus stops can now accommodate the wheelchair ramp.
• The first annual Low Income Transit Pass Pilot Program began July 1, 2017
• all 1,000 places filled by mid-July. • 140 residents on the program wait list

Q2 Highlights – Transit TechnologyAwarded and fully executed two contracts with Trapeze. Projects have been initiated;
1. Fare Management Solution; and 2. Fixed Routes Planning, Scheduling, and Operations software;
The Paratransit project initiated PASS upgrade activities, includes the following:
• An upgrade to the latest software version; and • Data migration to a Microsoft SQL Server database (HRM’s standard), and
optimized business configuration.
A preliminary analysis of Automated Vehicle Monitoring (AVM) was conducted, researching vendor solutions and multiple jurisdictions using AVM. The AVM project plans to reengage with Bus Maintenance in 2018/19.
Interconnected and Strategic Growth
Business Plan Deliverable Status Moving Forward Together Plan Year 2 Implementation In Progress Transit Facility Implementation Plan Pending Mumford Terminal Site Study In Progress Wrights Cove Terminal (Design) In Progress Bus Rapid Transit Study In Progress Transit Priority Measures Corridor Study In Progress Transit Priority Measures Implementation In Progress

Q2 Highlights• Service changes introduced as part of the Moving Forward Together Plan in
August 2017, including the introduction of the new route 194 West Bedford Express.
• An on site intercept survey and stakeholder meeting took place in June 2017 for the Mumford Terminal Opportunities Assessment. Public meetings on potential sites were hosted September 2017.
• Transit Priority Measures Corridor Study is on track for completion. Public engagement sessions regarding options for Bayers Rd. and Gottingen St were held September/October 2017. Detailed design on the preferred option will be will take place in fall/winter 2017.
• The Bus Rapid Transit Study is well underway. Public engagement on potential BRT corridors is scheduled for late fall 2017.
• Halifax Transit, Planning & Development and Transportation Public Works continue work on the Integrated Mobility Plan.
• Work is underway on the implementation of two new queue jump lanes on Windmill Road
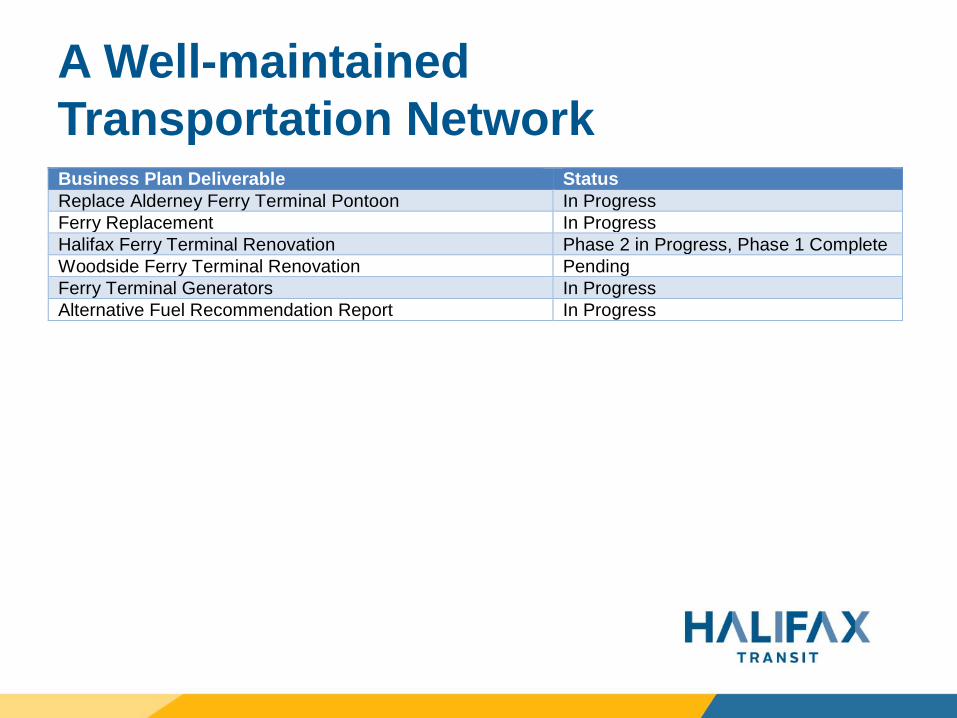
A Well-maintained Transportation NetworkBusiness Plan Deliverable Status Replace Alderney Ferry Terminal Pontoon In Progress Ferry Replacement In Progress Halifax Ferry Terminal Renovation Phase 2 in Progress, Phase 1 Complete Woodside Ferry Terminal Renovation Pending Ferry Terminal Generators In Progress Alternative Fuel Recommendation Report In Progress

Q2 Highlights• Design work on the second phase of
work at Halifax Ferry Terminal was completed, and the work tendered.
– Planned work November 2017 to March 2018
– Tender closes October 17, 2017
• Construction on two ferry vessels underway
– “Vincent Coleman,” planned for
delivery early 2018,
– “Rita Joe”, planned for delivery in fall
2018
• Feasibility studies work is underway to establish the condition of the Alderney Ferry pontoon, and the feasibility studies were completed for the generators at all ferry terminals.
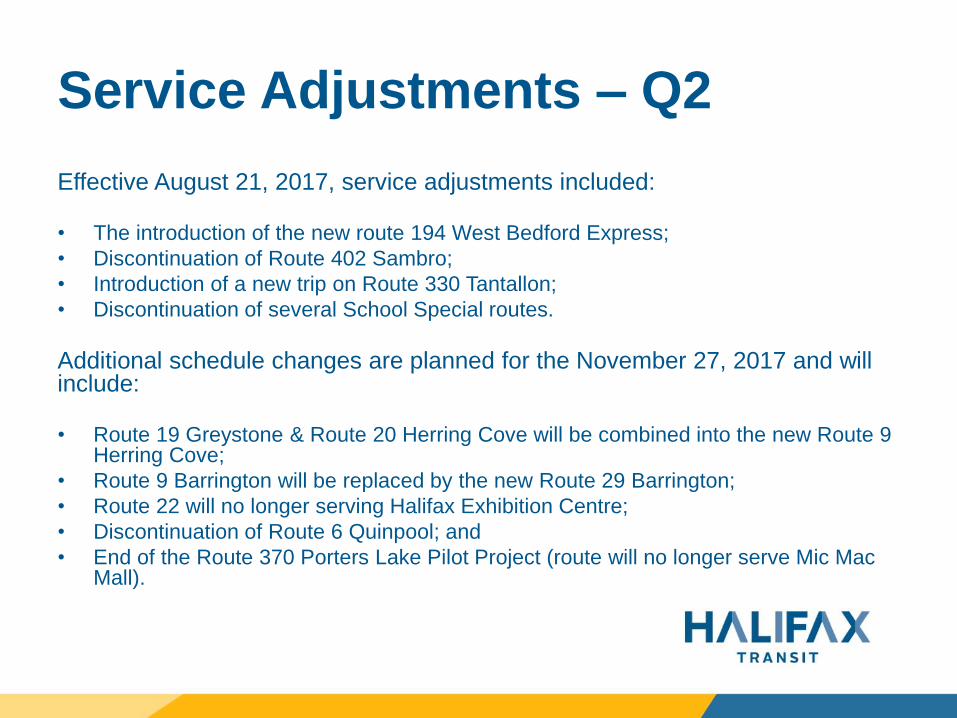
Service Adjustments – Q2
Effective August 21, 2017, service adjustments included:
• The introduction of the new route 194 West Bedford Express; • Discontinuation of Route 402 Sambro;• Introduction of a new trip on Route 330 Tantallon;• Discontinuation of several School Special routes.
Additional schedule changes are planned for the November 27, 2017 and will include:
• Route 19 Greystone & Route 20 Herring Cove will be combined into the new Route 9 Herring Cove;
• Route 9 Barrington will be replaced by the new Route 29 Barrington;• Route 22 will no longer serving Halifax Exhibition Centre;• Discontinuation of Route 6 Quinpool; and• End of the Route 370 Porters Lake Pilot Project (route will no longer serve Mic Mac
Mall).

Performance Measures
Several performance measures and statistics were included beginning in Q1, 2017; where data is not yet available to show relative increase/decrease, there may be a gap in some cases for several quarters.
Please see Attachment B, Halifax Transit 2017/18 Q2
Performance Report for performance measures and detailed route level statistics.

Performance Measures Q2 Highlights• System wide On-Time Performance in Q2 was 73%.• Boardings by route are reported for weekdays, Saturdays, and Sundays.
The average daily weekday passenger count in Q2 was 90,785.• Departure Line call volumes reported over 7500 passengers call the
departure line on a typical weekday in the second quarter. • Overall ridership increased 1.7% compared to second quarter last year,
while revenue decreased 0.04%.• Trips provided by Access-A-Bus increased 3.7% while the number of
waitlisted clients increased 8%. Approximately 40 new applicants are accepted every month.
• 98% of customer feedback in Q2 was resolved within service standards.• Fuel cost was 63 cents/litre in Q2, 2 cents/litre lower than the budgeted
amount.• The Mean distance between vehicle failures was 3,402 km in Q2.• Maintenance cost per kilometre in Q2 was in line with the budget price of
$1.18/km.