Embed Size (px)
Citation preview
Zambia 2017
www.africaneconomicoutlook.org
Peter Engbo RASMUSSEN / [email protected] Colleen ZAMBA / [email protected]
Elda CHIRWA / [email protected]
2AFRICAN ECONOMIC OUTLOOK © AfDB, OECD, UNDP 2017
ZAMBIA
Zambia
• Although the next twelve months look more promising, Zambia faced economicchallengesin2016followinganotheryearoflowcopperpricesandcripplingelectricitysupplydeficitsaffectingeconomicactivity.
• Thenewgovernmenttookoffice inSeptember2016andhasstartedimplementingitseconomicreformprogrammethataspirestoexpandgrowthandrestorebudgetcredibilitywhilereducingthefiscaldeficit.
• JobcreationguidedbyanIndustrialisationStrategyisakeypriorityofthegovernmentasZambiastillretainsalowformalemploymentbaseofjust11%oftotalemployment.
Overview
Despite negligibly higher growth than in 2015, 2016 proved to be challenging for the Zambian economy. Growth remained restrained and insufficient to ensure a positive per capita growth rate. Global growth prospects and demand for copper remained low throughout most of the year affecting the price which averaged USD 4 860 per ton. The lower price affected mining profitability and overall activity in the Copperbelt Province which is the traditional mining area. On the other hand, the mining industry in the North Western Province is buoyed by their lower cost structure. New mining activities initiated in 2016 led to an increase in total copper production by 8.4%. Despite a drought in Southern Africa, late rains resulted in a decent harvest sufficient to ensure food security, but insufficient to contribute to overall growth. Maize output increased by 9.7% to 2.9 million tons while other crops reduced production. Economic performance is expected to improve in the medium term. Copper output is projected to increase by 16% in 2017 and by 8% in 2018. The agriculture season has started with good rains. The projections assume sufficient electricity will be available to increase copper production while weather conditions remain conducive with a limited effect from army worms for a good harvest.
President Edgar Lungu was re-elected in the August 2016 general elections. The first major task of his government was to launch the five point economic recovery programme termed “Zambia Plus”. This programme aims at balancing the budget to sustainable levels following the increase in fiscal deficits to about 10% of GDP in 2016. A substantial part of the budget is used for paying non-discretionary expenditures such as salaries and interest payments on domestic and foreign loans, and subsidies. Only one third of the domestic revenues are available for goods and services, transfers and other expenditures. Key policies focus on enhancing domestic resource mobilisation, improving fiscal governance, accountability and transparency, restoring budget credibility and raising the confidence of the private sector.
The government launched its Jobs and Industrialisation Strategy in 2013 as an important initiative to diversify the economy and reduce vulnerability to mining. It is noteworthy that foreign direct investment in manufacturing surpassed mining for the first time in the past decade in 2015. This could be an indication that non-mining investors are looking to Zambia that offers, by regional standards, a stable investor environment.
3AFRICAN ECONOMIC OUTLOOK © AfDB, OECD, UNDP 2017
ZAMBIA
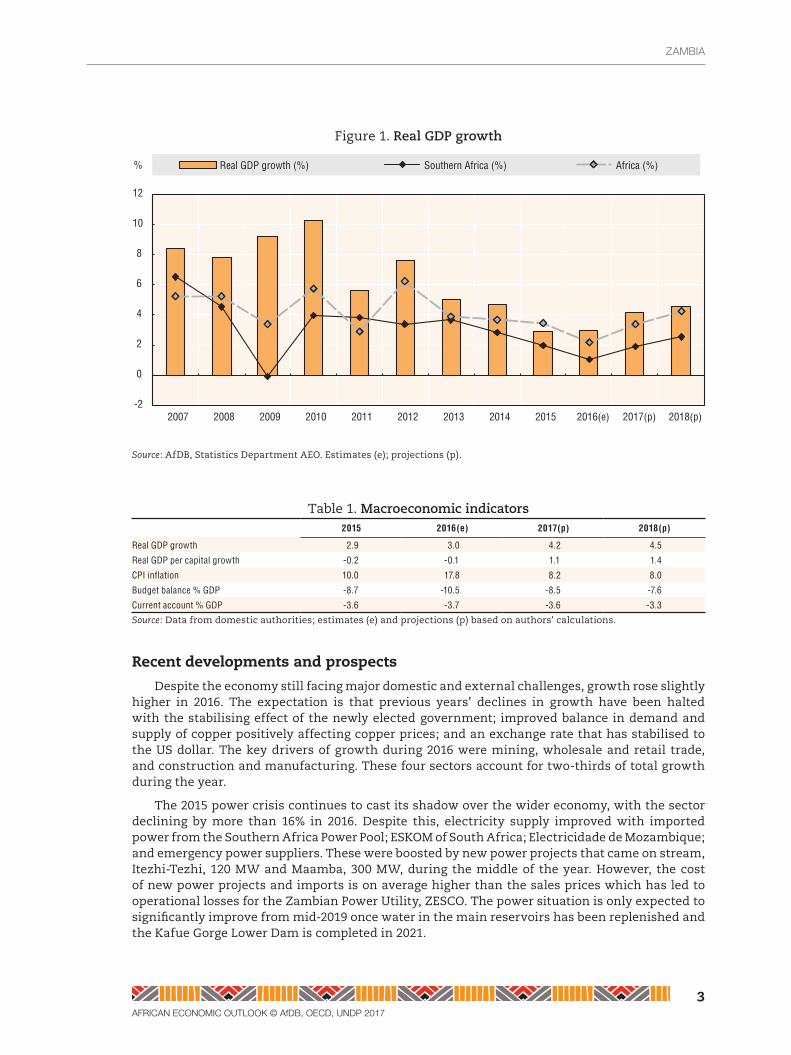
Figure 1. RealGDPgrowth
-2
0
2
4
6
8
10
12
2007 2008 2009 2010 2011 2012 2013 2014 2015 2016(e) 2017(p) 2018(p)
Real GDP growth (%) Southern Africa (%) Africa (%)%
Source: AfDB, Statistics Department AEO. Estimates (e); projections (p).
Table 1. Macroeconomicindicators2015 2016(e) 2017(p) 2018(p)
Real GDP growth 2.9 3.0 4.2 4.5
Real GDP per capital growth -0.2 -0.1 1.1 1.4
CPI inflation 10.0 17.8 8.2 8.0
Budget balance % GDP -8.7 -10.5 -8.5 -7.6
Current account % GDP -3.6 -3.7 -3.6 -3.3
Source: Data from domestic authorities; estimates (e) and projections (p) based on authors' calculations.
Recent developments and prospects
Despite the economy still facing major domestic and external challenges, growth rose slightly higher in 2016. The expectation is that previous years’ declines in growth have been halted with the stabilising effect of the newly elected government; improved balance in demand and supply of copper positively affecting copper prices; and an exchange rate that has stabilised to the US dollar. The key drivers of growth during 2016 were mining, wholesale and retail trade, and construction and manufacturing. These four sectors account for two-thirds of total growth during the year.
The 2015 power crisis continues to cast its shadow over the wider economy, with the sector declining by more than 16% in 2016. Despite this, electricity supply improved with imported power from the Southern Africa Power Pool; ESKOM of South Africa; Electricidade de Mozambique; and emergency power suppliers. These were boosted by new power projects that came on stream, Itezhi-Tezhi, 120 MW and Maamba, 300 MW, during the middle of the year. However, the cost of new power projects and imports is on average higher than the sales prices which has led to operational losses for the Zambian Power Utility, ZESCO. The power situation is only expected to significantly improve from mid-2019 once water in the main reservoirs has been replenished and the Kafue Gorge Lower Dam is completed in 2021.
4AFRICAN ECONOMIC OUTLOOK © AfDB, OECD, UNDP 2017
ZAMBIA
The mining sector continued to expand in 2016 as mines were largely safeguarded against the electricity supply deficit. Copper output increased by 8.4% in 2016 to about 770 000 tons, as a result of the ramping up of production at the new Kalumbila Mine in North-Western Province. The Mopani mines in the Copperbelt Province are undergoing major rehabilitation. Once works are completed towards the end of 2017, these mines will be able to produce copper more cost-efficiently. The mining taxes where adjusted in 2016 to a variable royalty between 4% and 6% depending on the price of copper. Prices over USD 6 000 per ton attract 6% in royalty. Assuming that there will be sufficient electricity supply and favourable copper prices exceeding the 2016 average of USD 4 860 per ton, copper production is expected to increase by 100 000 to 130 000 tons in 2017 and a further 60 000 to 80 000 tons in 2018.
The regional drought affected the planting period early in the 2015-16 rainy season. Late in the season in Zambia, however, rains resumed to yield a decent harvest. Maize output rose by 9.7% yielding a total harvest of 2.9 million tons which was more than sufficient to cover domestic needs. The 2016-17 season has started with good rains. However, attacks by army worms and stalk borers could affect 10-15% of the planted areas. With effective interventions by the government, we still project a higher maize production than the previous harvest. Although the sector has waned in economic importance relative to other sectors, it maintains the lead in terms of employment. Just under 50% of the active labour force, work in agriculture related industries. Most employed are small-scale farmers or family members helping on the farms.
The service sectors continue to gain prominence in the economy and are important drivers of overall growth. Price pressures and exchange rate volatility together with load shedding were key factors affecting growth in services. Wholesale and retail trade, education, financial services and transportation were particularly hit by the challenges. These sectors are expected to rebound in 2017 and 2018 as external pressures weaken and prices stabilise.
Poverty levels remains high with more than 55% of the population living below the government-defined poverty line. The absence of gains in wealth for the poor remains an enormous task for government. The working-age population numbers 8.1 million of which 6.3 million are economically active. A large majority of the inactive are full-time students, while 7.4% of the economically active are unemployed. Nine out of 10 of the 5.9 million economic active citizens work in the informal sector without any contracts, employment or social security coverage including pension savings, and other employment entitlements. For rural dwellers that are mainly working in farming, this leaves them vulnerable to adverse weather conditions while urban dwellers are dependent on self-employment, microenterprise, trading, contract work, and odd jobs.
In recent years, public consumption and capital investment have been increasingly important factors in driving growth, while private consumption has been growing at a much slower pace. However, in 2015 foreign direct investment declined to USD 1.3 billion, down from 1.5 billion in 2014 and 2.1 billion in 2013. Policy uncertainty and frequent changes in mining taxation have been a contributing factor in keeping investors, especially those interested in mining, at bay. No significant exploration activities have taken place for more than half a decade. Given the lead-time required to move a commercially viable reserve to production, this aspect is likely to impact mining production within the next decade. The latest year for which data is available also confirms that mining investments have declined while 2015 manufacturing investments accounted for about half of all FDI.
Looking to the medium term it is projected that with the expansion of economic activity, the economy is expected to grow. As the government has committed to tightening its fiscal position over the medium term, private sector activity will be key in driving growth and job creation in the next two to three years. This will require favourable market conditions, particularly price stability and lower interest rates to spur domestic investment. These projections are susceptible
5AFRICAN ECONOMIC OUTLOOK © AfDB, OECD, UNDP 2017
ZAMBIA
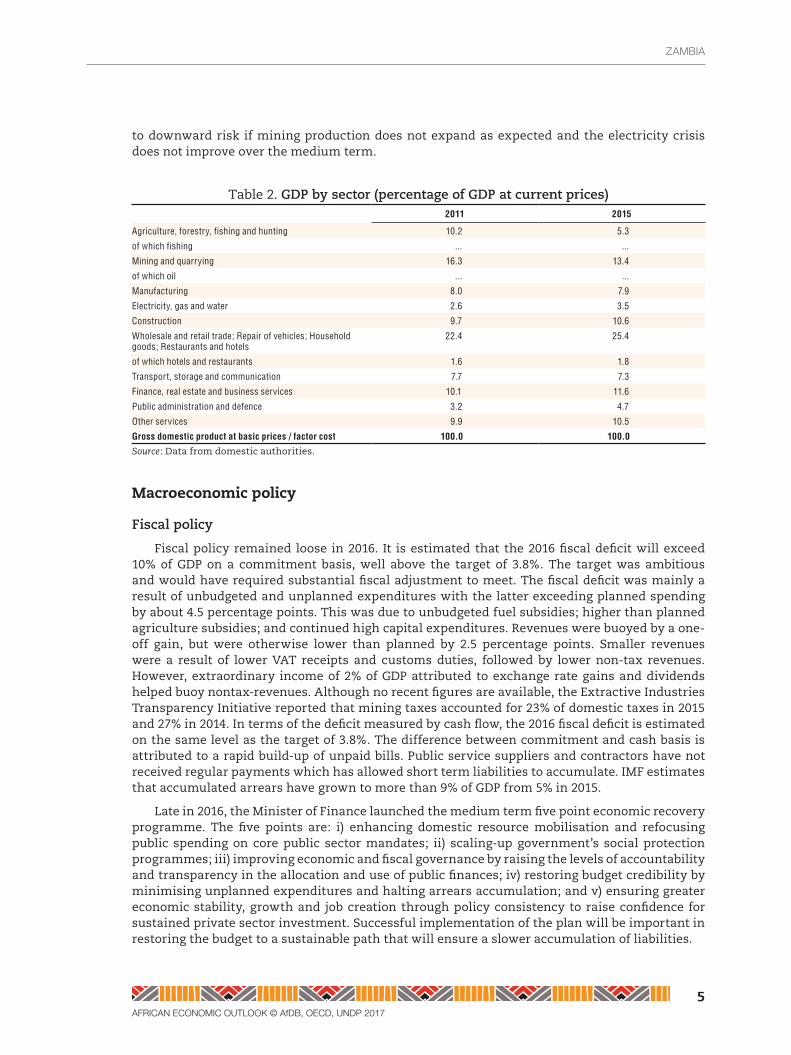
to downward risk if mining production does not expand as expected and the electricity crisis does not improve over the medium term.
Table 2. GDPbysector(percentageofGDPatcurrentprices)2011 2015
Agriculture, forestry, fishing and hunting 10.2 5.3
of which fishing ... ...
Mining and quarrying 16.3 13.4
of which oil ... ...
Manufacturing 8.0 7.9
Electricity, gas and water 2.6 3.5
Construction 9.7 10.6
Wholesale and retail trade; Repair of vehicles; Household goods; Restaurants and hotels
22.4 25.4
of which hotels and restaurants 1.6 1.8
Transport, storage and communication 7.7 7.3
Finance, real estate and business services 10.1 11.6
Public administration and defence 3.2 4.7
Other services 9.9 10.5
Gross domestic product at basic prices / factor cost 100.0 100.0
Source: Data from domestic authorities.
macroeconomic policy
Fiscalpolicy
Fiscal policy remained loose in 2016. It is estimated that the 2016 fiscal deficit will exceed 10% of GDP on a commitment basis, well above the target of 3.8%. The target was ambitious and would have required substantial fiscal adjustment to meet. The fiscal deficit was mainly a result of unbudgeted and unplanned expenditures with the latter exceeding planned spending by about 4.5 percentage points. This was due to unbudgeted fuel subsidies; higher than planned agriculture subsidies; and continued high capital expenditures. Revenues were buoyed by a one-off gain, but were otherwise lower than planned by 2.5 percentage points. Smaller revenues were a result of lower VAT receipts and customs duties, followed by lower non-tax revenues. However, extraordinary income of 2% of GDP attributed to exchange rate gains and dividends helped buoy nontax-revenues. Although no recent figures are available, the Extractive Industries Transparency Initiative reported that mining taxes accounted for 23% of domestic taxes in 2015 and 27% in 2014. In terms of the deficit measured by cash flow, the 2016 fiscal deficit is estimated on the same level as the target of 3.8%. The difference between commitment and cash basis is attributed to a rapid build-up of unpaid bills. Public service suppliers and contractors have not received regular payments which has allowed short term liabilities to accumulate. IMF estimates that accumulated arrears have grown to more than 9% of GDP from 5% in 2015.
Late in 2016, the Minister of Finance launched the medium term five point economic recovery programme. The five points are: i) enhancing domestic resource mobilisation and refocusing public spending on core public sector mandates; ii) scaling-up government’s social protection programmes; iii) improving economic and fiscal governance by raising the levels of accountability and transparency in the allocation and use of public finances; iv) restoring budget credibility by minimising unplanned expenditures and halting arrears accumulation; and v) ensuring greater economic stability, growth and job creation through policy consistency to raise confidence for sustained private sector investment. Successful implementation of the plan will be important in restoring the budget to a sustainable path that will ensure a slower accumulation of liabilities.
6AFRICAN ECONOMIC OUTLOOK © AfDB, OECD, UNDP 2017
ZAMBIA
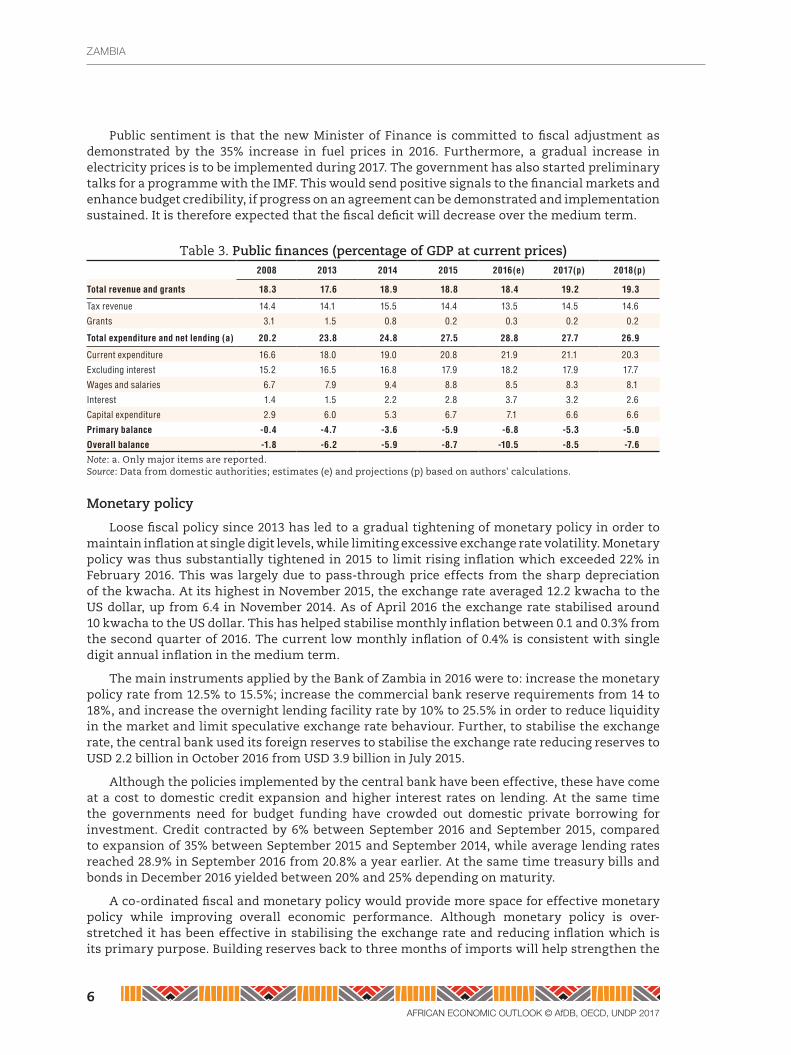
Public sentiment is that the new Minister of Finance is committed to fiscal adjustment as demonstrated by the 35% increase in fuel prices in 2016. Furthermore, a gradual increase in electricity prices is to be implemented during 2017. The government has also started preliminary talks for a programme with the IMF. This would send positive signals to the financial markets and enhance budget credibility, if progress on an agreement can be demonstrated and implementation sustained. It is therefore expected that the fiscal deficit will decrease over the medium term.
Table 3. Publicfinances(percentageofGDPatcurrentprices)2008 2013 2014 2015 2016(e) 2017(p) 2018(p)
Total revenue and grants 18.3 17.6 18.9 18.8 18.4 19.2 19.3
Tax revenue 14.4 14.1 15.5 14.4 13.5 14.5 14.6
Grants 3.1 1.5 0.8 0.2 0.3 0.2 0.2
Total expenditure and net lending (a) 20.2 23.8 24.8 27.5 28.8 27.7 26.9
Current expenditure 16.6 18.0 19.0 20.8 21.9 21.1 20.3
Excluding interest 15.2 16.5 16.8 17.9 18.2 17.9 17.7
Wages and salaries 6.7 7.9 9.4 8.8 8.5 8.3 8.1
Interest 1.4 1.5 2.2 2.8 3.7 3.2 2.6
Capital expenditure 2.9 6.0 5.3 6.7 7.1 6.6 6.6
Primary balance -0.4 -4.7 -3.6 -5.9 -6.8 -5.3 -5.0
Overall balance -1.8 -6.2 -5.9 -8.7 -10.5 -8.5 -7.6
Note: a. Only major items are reported.Source: Data from domestic authorities; estimates (e) and projections (p) based on authors' calculations.
Monetarypolicy
Loose fiscal policy since 2013 has led to a gradual tightening of monetary policy in order to maintain inflation at single digit levels, while limiting excessive exchange rate volatility. Monetary policy was thus substantially tightened in 2015 to limit rising inflation which exceeded 22% in February 2016. This was largely due to pass-through price effects from the sharp depreciation of the kwacha. At its highest in November 2015, the exchange rate averaged 12.2 kwacha to the US dollar, up from 6.4 in November 2014. As of April 2016 the exchange rate stabilised around 10 kwacha to the US dollar. This has helped stabilise monthly inflation between 0.1 and 0.3% from the second quarter of 2016. The current low monthly inflation of 0.4% is consistent with single digit annual inflation in the medium term.
The main instruments applied by the Bank of Zambia in 2016 were to: increase the monetary policy rate from 12.5% to 15.5%; increase the commercial bank reserve requirements from 14 to 18%, and increase the overnight lending facility rate by 10% to 25.5% in order to reduce liquidity in the market and limit speculative exchange rate behaviour. Further, to stabilise the exchange rate, the central bank used its foreign reserves to stabilise the exchange rate reducing reserves to USD 2.2 billion in October 2016 from USD 3.9 billion in July 2015.
Although the policies implemented by the central bank have been effective, these have come at a cost to domestic credit expansion and higher interest rates on lending. At the same time the governments need for budget funding have crowded out domestic private borrowing for investment. Credit contracted by 6% between September 2016 and September 2015, compared to expansion of 35% between September 2015 and September 2014, while average lending rates reached 28.9% in September 2016 from 20.8% a year earlier. At the same time treasury bills and bonds in December 2016 yielded between 20% and 25% depending on maturity.
A co-ordinated fiscal and monetary policy would provide more space for effective monetary policy while improving overall economic performance. Although monetary policy is over-stretched it has been effective in stabilising the exchange rate and reducing inflation which is its primary purpose. Building reserves back to three months of imports will help strengthen the
7AFRICAN ECONOMIC OUTLOOK © AfDB, OECD, UNDP 2017
ZAMBIA
monetary framework. Analysts foresee single digit inflation of between 7% and 9% in the medium term.
Economic co-operation, regional integration and trade
The government is expected to operationalise bilateral trade agreements with the Democratic Republic of Congo and Angola signed in 2015. Trade agreements remain vehicles to boost market opportunities and diversification. In 2016 Zambia launched two critical systems to facilitate expedient customs clearing and enhance trade. The Zambia National Electronic Single Window will enable parties involved in international trade to submit regulatory import and export related documentation required by various agencies through a single platform. The other system supported from the Common Market for Eastern and Southern Africa (COMESA), will allow electronic cargo tracking. This system is used to monitor the movement of consignments along transport corridors while using a single regional window to connect national customs offices, thereby facilitating the documentation process. This system will help improve logistics in transit trade and reduce administrative costs. Furthermore, Zambia will provide for advance ruling on rules of origin for goods originating from countries with which it has signed trade agreements; and establish trade centres at borders of major non-traditional export markets.
Zambia is a landlocked country and therefore depends on its neighbours for exports and imports to access seaports. This requires a high level of co-operation and co-ordination to ensure that movement of goods and services across borders is as efficient as possible. Major challenges prevail. The most recent ranking for Trading Across Borders (the World Bank’s Doing Business 2017 report) dropped to 161 out of 190, while the World Bank Logistics Performance Index 2016 ranked Zambia 114 out of 160 countries. The upgraded and modern Kasumbalesa border to the Congo caters for 700 to 900 trucks on a daily basis making it once of COMESA’s largest borders.
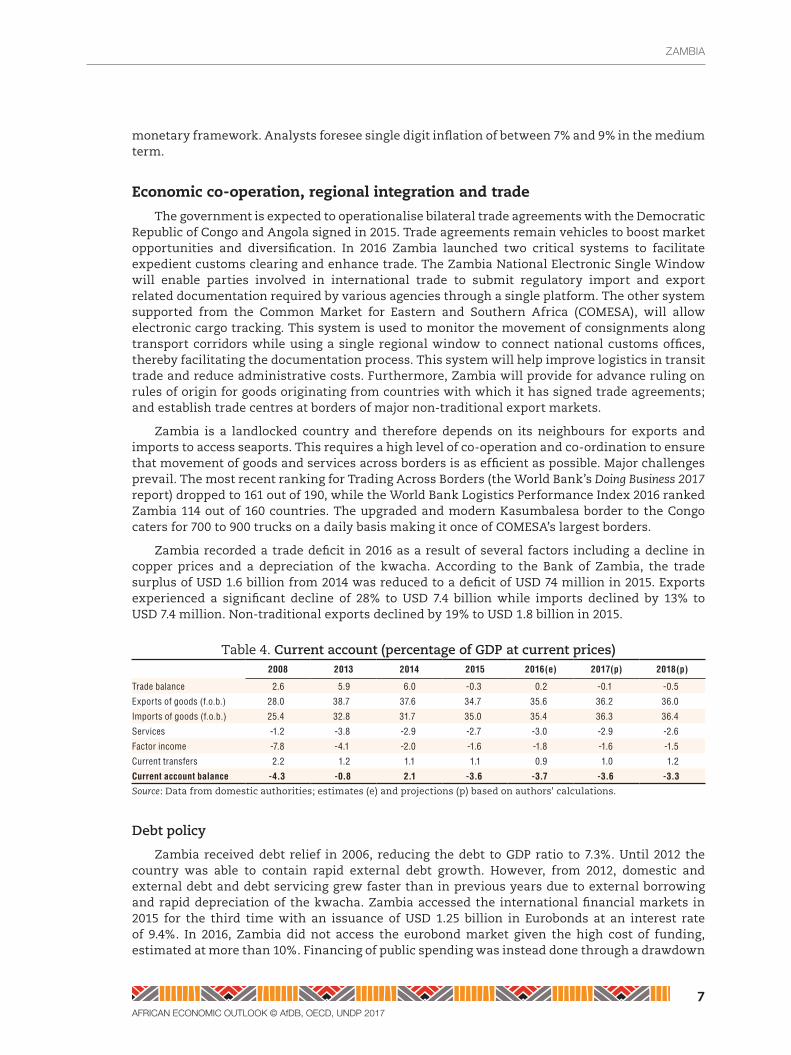
Zambia recorded a trade deficit in 2016 as a result of several factors including a decline in copper prices and a depreciation of the kwacha. According to the Bank of Zambia, the trade surplus of USD 1.6 billion from 2014 was reduced to a deficit of USD 74 million in 2015. Exports experienced a significant decline of 28% to USD 7.4 billion while imports declined by 13% to USD 7.4 million. Non-traditional exports declined by 19% to USD 1.8 billion in 2015.
Table 4. Currentaccount(percentageofGDPatcurrentprices)2008 2013 2014 2015 2016(e) 2017(p) 2018(p)
Trade balance 2.6 5.9 6.0 -0.3 0.2 -0.1 -0.5
Exports of goods (f.o.b.) 28.0 38.7 37.6 34.7 35.6 36.2 36.0
Imports of goods (f.o.b.) 25.4 32.8 31.7 35.0 35.4 36.3 36.4
Services -1.2 -3.8 -2.9 -2.7 -3.0 -2.9 -2.6
Factor income -7.8 -4.1 -2.0 -1.6 -1.8 -1.6 -1.5
Current transfers 2.2 1.2 1.1 1.1 0.9 1.0 1.2
Current account balance -4.3 -0.8 2.1 -3.6 -3.7 -3.6 -3.3
Source: Data from domestic authorities; estimates (e) and projections (p) based on authors' calculations.
Debtpolicy
Zambia received debt relief in 2006, reducing the debt to GDP ratio to 7.3%. Until 2012 the country was able to contain rapid external debt growth. However, from 2012, domestic and external debt and debt servicing grew faster than in previous years due to external borrowing and rapid depreciation of the kwacha. Zambia accessed the international financial markets in 2015 for the third time with an issuance of USD 1.25 billion in Eurobonds at an interest rate of 9.4%. In 2016, Zambia did not access the eurobond market given the high cost of funding, estimated at more than 10%. Financing of public spending was instead done through a drawdown
8AFRICAN ECONOMIC OUTLOOK © AfDB, OECD, UNDP 2017
ZAMBIA
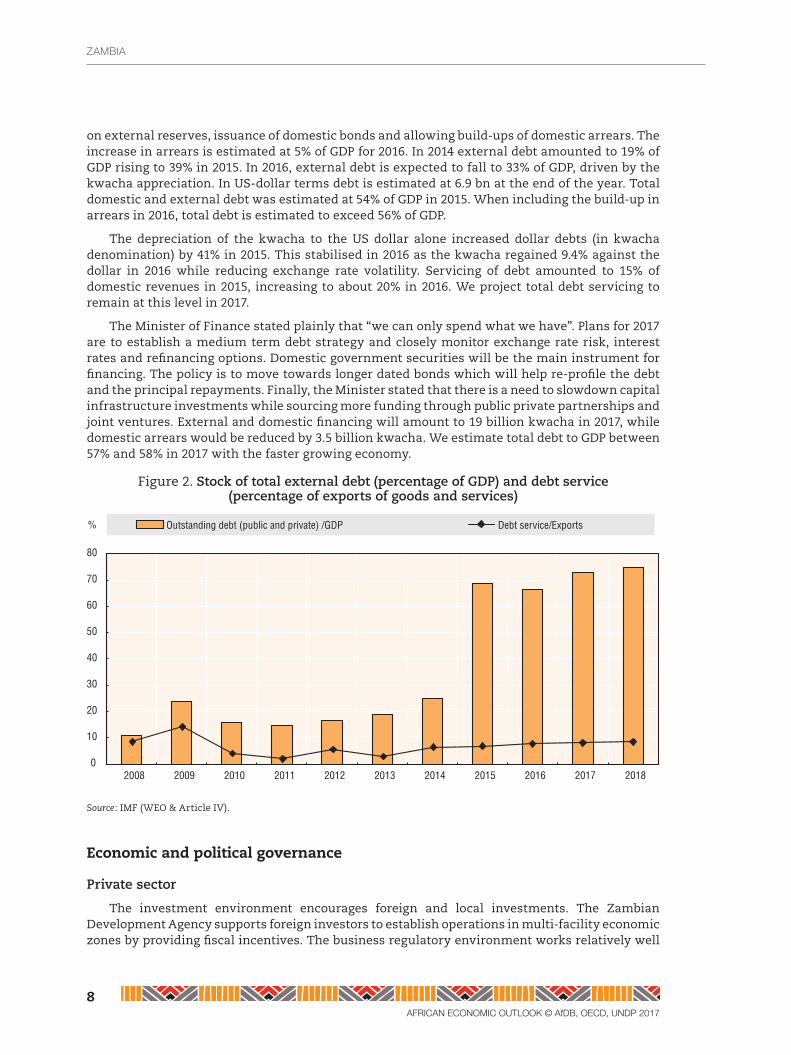
on external reserves, issuance of domestic bonds and allowing build-ups of domestic arrears. The increase in arrears is estimated at 5% of GDP for 2016. In 2014 external debt amounted to 19% of GDP rising to 39% in 2015. In 2016, external debt is expected to fall to 33% of GDP, driven by the kwacha appreciation. In US-dollar terms debt is estimated at 6.9 bn at the end of the year. Total domestic and external debt was estimated at 54% of GDP in 2015. When including the build-up in arrears in 2016, total debt is estimated to exceed 56% of GDP.
The depreciation of the kwacha to the US dollar alone increased dollar debts (in kwacha denomination) by 41% in 2015. This stabilised in 2016 as the kwacha regained 9.4% against the dollar in 2016 while reducing exchange rate volatility. Servicing of debt amounted to 15% of domestic revenues in 2015, increasing to about 20% in 2016. We project total debt servicing to remain at this level in 2017.
The Minister of Finance stated plainly that “we can only spend what we have”. Plans for 2017 are to establish a medium term debt strategy and closely monitor exchange rate risk, interest rates and refinancing options. Domestic government securities will be the main instrument for financing. The policy is to move towards longer dated bonds which will help re-profile the debt and the principal repayments. Finally, the Minister stated that there is a need to slowdown capital infrastructure investments while sourcing more funding through public private partnerships and joint ventures. External and domestic financing will amount to 19 billion kwacha in 2017, while domestic arrears would be reduced by 3.5 billion kwacha. We estimate total debt to GDP between 57% and 58% in 2017 with the faster growing economy.
Figure 2. Stockoftotalexternaldebt(percentageofGDP)anddebtservice(percentageofexportsofgoodsandservices)
0
10
20
30
40
50
60
70
80
2008 2009 2010 2011 2012 2013 2014 2015 2016 2017 2018
Outstanding debt (public and private) /GDP Debt service/Exports%
Source: IMF (WEO & Article IV).
Economic and political governance
Privatesector
The investment environment encourages foreign and local investments. The Zambian Development Agency supports foreign investors to establish operations in multi-facility economic zones by providing fiscal incentives. The business regulatory environment works relatively well
9AFRICAN ECONOMIC OUTLOOK © AfDB, OECD, UNDP 2017
ZAMBIA
when compared to the countries in the Southern Africa region. According to the World Bank report Doing Business 2017, Zambia ranks fourth in the region. This finding correlates to the 2016 Global Competitiveness Report that places Zambia fifth in the region behind Mauritius, South Africa, Botswana and Namibia.
The Doing Business report also states that starting a business, paying taxes, and obtaining credit are all within 25% of the best performing countries globally. The Patents and Companies Registration Authority has made it much easier to register a company as most registration forms are now available online. The tax authority with the implementation of Tax-online is also making it easier for businesses to register for tax and complete tax returns. However, some key areas continue to perform dismally. These areas are resolving insolvency; registering property; trading across borders; and enforcing contracts which need to improve by more than 50 percentage points to reach the level of the best performing countries.
Despite this relatively good performance, the regulatory environment remains a challenge for entrepreneurs and investors. Licensing and labour code requirements are often excessive, discouraging formalisation and requiring significant knowledge to remain compliant, especially for small businesses. According to the 2016 Global Competitiveness Report the burden of government regulation ranks 47. However, the score is low at 3.7 indicating that there is considerable room for improvement. Furthermore, 5.2% of respondents state that inefficient government bureaucracy is a key problematic factor for doing business.
Business-friendly policies and more policy predictability have often been called for by the private sector. Since 2008, the mining sector has experienced changes in the mining regulation almost every year. Frequently changing mining taxation policies, and inflexible and bureaucratic business environment will affect investor sentiment and reduce investments.
Financialsector
Zambia experienced three microfinance bank liquidations in 2016. This was a result of accelerated lending to small lenders and a fast growing portfolio of non-performing loans. Furthermore, liquidity constraints in the market made it increasingly more difficult for the small lending institutions to access capital. According to the 2016 Global Competitiveness Report, the “soundness of banks” has deteriorated several years in a row scoring 4.1 in 2015 from 5.3 in 2012. Zambia continues to have 19 registered commercial banks and a large group of microfinance institutions. Overall gross non-performing loans (gNPL) to total loans have improved over a five-year period. However, in June 2016 NPL accounted for 9.2%, a fall from 6.2% over the same period the previous year.
Affordability of financial services remains a key challenge to consumers and businesses. Average interest rates have exceeded 27.5% in 2016 up from 21.1% in 2015. In the current economic environment with high interest rates and increasing non-performing loans some commercial banks have stopped providing consumer loans. SMEs also struggle to access finance. A 2013 study by Financial Sector Deepening reports that almost half perceive access to credit either as being a severe or major obstacle to develop their business. Although improving, banks are slow to develop an understanding of SME businesses and their needs. Venture capital would be a way to access affordable financing, but remains an undeveloped area in Zambia. The 2016 Global Competitiveness Report scores “venture capital availability” at 2.2. Although the expansion of Agent Banking and mobile phone technology may not help small businesses obtain loans, it will provide new opportunities for providing financial services to rural and remote communities within the country.
The Ministry of Finance is projecting a 9.3% real increase in financial services and insurance activities in 2016, down from 12.1% in 2015. Since 2013 following the new and higher capital requirements for domestic and foreign banks the sector has been growing in size. In 2013, the
10AFRICAN ECONOMIC OUTLOOK © AfDB, OECD, UNDP 2017
ZAMBIA
sector accounted for 3.2% of GDP. In 2016 the sector grew to 4.1%, and with expectations of an expanding economy in the medium term, the sector is expected to further increase.
Publicsectormanagement,institutionsandreforms
During the first five months of 2016, the public service was preoccupied with drafting elections-related legislation which needed to be enacted by the National Assembly before its dissolution in May. New reforms were not introduced during the remaining part of the year as the Executive was preparing for the August general elections, followed by forming the new government.
New ministries were created and others realigned following the inauguration of President Lungu in September 2016, bringing the number of cabinet ministers to 29. These changes were driven by the need to increase overall effectiveness of the public service and streamline service delivery. The public service at the senior level was generally in a state of flux due to a number of new appointments at Permanent Secretary and Director levels in ministries and departments. Key national processes such as the preparation of the national budget were only marginally affected, however some delay is likely in launching the National Development Plan 2017-21.
The implementation of reforms and measures presented in 2015 and earlier continued to be implemented with focus on increasing inter-governmental co-ordination. This was achieved by the adoption of the “Whole Government Approach” to service delivery, performance management of individuals and institutions as well as enhancing accountability and transparency in the public service. Measures included the requirement for ministers to submit quarterly reports to cabinet; performance contracts for permanent secretaries and directors; and score cards for monitoring performance of ministries and provinces and spending agencies.
The government renewed its commitment to reducing costs and maintained austerity measures regarding the use of transport and other resources. Zero tolerance for corruption was also maintained as a key pillar of public service performance. There was also the reintroduction of the School of Government at the National Institute of Public Administration as a way of increasing competence levels and promoting public service values.
Natural resource management and environment
Zambia’s environment is guided by the Environmental Management Act of 2011 and several other related pieces of legislation that regulate urban and rural planning, forestry, wildlife, mining, radiation and water. The implementation of this legislation is inadequate given the environmental challenges that Zambia faces and the small budgetary allocation environment receives annually. In 2016, the allocation to environment was 0.3% of the total budgetary allocation. All environmental impact assessments and strategic environmental assessments are published on the Environmental Management Agency’s website.
The key environmental challenges relate to deforestation due to high levels of charcoal production, and more volatile weather with drought or flooding. The “Atlas of our Changing Environment” indicates that the southern parts of the country are getting dryer than in the past. As a result of the El Niño weather event the rainy seasons of 2014 and 2015 have been dryer than previous years. The report also mentions surface and groundwater pollution, air pollution, loss of wildlife and biodiversity, poor solid waste management, and land degradation. The 2016 Environmental Performance Index further indicates that Zambia’s ranking has improved to 106 from 121 in 2014. Environmental risk exposure (i.e. negative health impacts), unsafe sanitation and unsafe drinking water, and forestry coverage are the areas doing the poorest.
11AFRICAN ECONOMIC OUTLOOK © AfDB, OECD, UNDP 2017
ZAMBIA
Politicalcontext
The general elections held in August 2016 dominated the political landscape. They were held under a new constitution enacted in January 2016 which brought changes to the electoral process. For the first time, the President was elected by a 50% plus one vote system. Mayors were also elected for the first time. Although elections were regarded as peaceful and credible, observers noted imbalanced media coverage and an atmosphere of violence during the 90-day campaign. It was observed that the referendum to amend the Bill of Rights did not meet the eligibility threshold, although the new Constitution contains enhanced rights provisions.
The incumbent, President Lungu, won 50.4 % of the vote, securing a narrow first round victory and his Patriotic Front party attained a 53.6% majority in Parliament. The main opposition candidate accrued 47.6%. Voting patterns showed strong polarisation, with four of the 10 provinces voting mainly for the opposition party. The opposition identified what was perceived as irregularities in the electoral process. This resulted in the contesting of several seats including an appeal against the constitutional court decision to uphold the election. The opposition’s bid to have the election nullified in the courts failed on a controversial technicality. This impasse spawned residual and latent discontent on the political arena. The President pledged to develop the entire country, regardless of voter affiliation. Plans are underway to review and amend the contentious parts of the constitution. The 2016 Mo Ibrahim index of Governance shows that Zambia ranked 13th in Africa out of 54 countries and since 2006 has risen by 4.3 points to 58.8.
Social context and human development
Buildinghumanresources
Zambia’s human development has continued to improve, although marked by slippages. Human Development Index (HDI) value increased from 0.422 in 1980, to 0.586 in 2014, a 40% gain, placing the country in the medium human development range according to the 2015 Human Development Report. However, relatively low per capita incomes (USD 1 740 in 2014) and inequality have kept poverty levels high, low fiscal expenditure in health, education and social protection (9% of GDP), and weak access to rural health and education amenities, have placed Zambia in the bottom quartile of the human development rankings. The country was ranked 139 out of 188 economies in 2014.
Zambia’s high inequalities in life expectancy, education and skills, as well as incomes differentiated by gender and geographical location, have also contributed to the country’s relatively poor progress in promoting human development. The inequality adjusted HDI puts Zambia on 0.384, a loss of more than 34% in HDI. These inequalities are highest in income dimensions. Inequality as measured by the Gini coefficient, has worsened from 0.65 in 2010 to 0.69 in 2015, according to the Central Statistics Office, placing Zambia among one of the most unequal countries in Sub-Saharan Africa.
Good progress in areas of health service delivery, namely maternal, child, infant, and neonatal mortality rates, have been recorded according to the Millennium Development Goal End Point Report. HIV prevalence rates have reduced to 13.3% from 14.3% in 2007 and tuberculosis and malaria incidence rates have declined according to the 2014 Demographic and Health Survey. Despite these achievements, the sector has continued to face challenges, including a high disease burden, which places significant pressure on the healthcare system. Further, non-communicable diseases are on the rise, now causing 23% of all deaths.
Zambia has made steady progress towards universal primary education and met the 2015 Millennium Development Goal target of 100% for net enrolment in primary schools for both girls and boys. This notable achievement may be attributed to the government declaration of free

12AFRICAN ECONOMIC OUTLOOK © AfDB, OECD, UNDP 2017
ZAMBIA
primary education that was accompanied by a sustained development of education infrastructure between 2000 and 2015. The education system is, however, beset by two major problems: poor quality of education, and the poor conversion rates of primary school leavers into secondary school and tertiary institutions. If these two challenges are addressed, it may be possible in the long term, to reach an education standard where inequality-reducing growth occurs.
Povertyreduction,socialprotectionandlabour
Headcount poverty declined from 60.5% in 2010 to 54.4% in 2015, with very high rural poverty at 76.6% according to the 2015 Poverty Report from the Central Statistics Office. When measured against a basket of welfare indicators (education, health and living standards), the average household in Zambia has seen its level and intensity of multi-dimensional poverty increase from 18.7% in 2006 to 22.2% in 2010. In 2015, Zambia’s multi-dimensional poverty index was 26.4%. Persistent inequalities reflect the structural composition of Zambia’s economy and its extensive territory, which has marked regional differences in resources. Although Zambia has abundant natural resources, the economy relies heavily on extractive industries which account for over 70% of export earnings that exposes the country to the volatility of world copper prices and only employs 1.4% of total employed. Roughly 60% of the country’s population live in rural areas, where they depend on subsistence agriculture and fishing.
Developing social protection legislation was a priority area in 2016 and the Bill is expected to be passed in 2017. The national policies on disability and old age have been approved and launched. The number of households receiving social cash transfers increased from about 190 000 in 2015 to 239 000 in 2016. The government now finances more than 80% of the social cash transfer scheme with the remaining from co-operating partners. In 2016, a government led evaluation of the child grants and multiple categorical targeting showed that households enrolled were able to smooth consumption between seasons, increase ownership of assets and reduce their debt. The wider communities benefited by social and economic multipliers such as increased liquidity, consumption and investments in improved living conditions and sanitation.
A significant part of the Zambian labour market is involved in either marginal or semi-productive activities including household economic activities, informal enterprises, and subsistence farming. Out of the 5.9 million employed in Zambia 22.3% are paid employees; 28.1% are self-employed; 48.6% are contributing family workers; and the small remainder are apprentices, interns, employers, and volunteers according to Central Statistics Office. Employment data reveals that the country has witnessed the reallocation of labour from employment in agriculture, to employment in the urban informal sector.
Despite many years of solid growth, the economy has created too few jobs within those sectors that generate a sufficiently high output per worker to offer decent wages and act as a viable labour market mechanism out of poverty. The movement by workers from agriculture to other high productivity sectors is generally considered the key avenue through which economic growth, development, and an improvement in standards of living can occur. However, the growth pattern yielded thus far has not resulted in this structural shift. Instead, a persistent proportion of the workforce remains in informal employment.
Genderequality
The Parliament passed the Gender Equity and Equality Bill in 2015 assented to by the President in 2016. While this law provides the legal framework for the promotion of equality between men and women, its full impact might be undermined by the failure of the 2016 Bill of Rights to pass the referendum. The existing Bill of Rights provides for derogation on matters of family law and inheritance. The revised constitution provides for a minimum 30% representation of either gender in key government decision-making bodies, which resulted in some political parties setting a target of 40% for adoption of women as candidates for parliamentary and local government
13AFRICAN ECONOMIC OUTLOOK © AfDB, OECD, UNDP 2017
ZAMBIA
elections. Ultimately, during 2016, the proportion of women elected to parliament increased to 26 (16.6%) female members up from 17 (13.3%) in 2011. The number of women councillors also increased to 127 from 85.
The Gender Development Index measures gender development in achievement in three basic dimensions of human development: health, education; and command over economic resources. The index ranks Zambia 139 out of 188 countries. The Gender Inequality Index scores 0.609 for males and 0.558 for females in Zambia indicating that males have a slight advantage.
Thematic analysis: Entrepreneurship and industrialisation in Zambia
Evidence from the Zambia Labour Force Survey states that the number of self-employed exceeds four out of ten of total employed, demonstrating that the country has more entrepreneurs than most countries in Africa. Yet Zambia is not considered the most entrepreneurial according to the Human Development Report 2015. Products from Zambian entrepreneurs are characterised by quality issues, low investment in innovation and technology and unavailability of cold chains that would guarantee maintenance of standards. With the absence of these key parameters, entrepreneurs tend to concentrate on selling vegetables, mobile top-up cards, and other artefacts mainly along road sides. Entrepreneurs have not taken advantage of the abundant natural resources to establish cottage industries that can run alongside large corporations. The international retailer chains that have set up in the country provide an opportunity for the SMEs to manufacture goods that would easily find their way to the shelves. Zambia’s low ranking of 96 (of 137 countries) in the 2017 Global Entrepreneurship Index confirms this characterisation.
Since the economy’s liberalising in 1991 various policy changes and initiatives have been invoked to spur growth in industry and manufacturing that had declined during the era of nationalisation. These included the privatisation of over 100 state owned enterprises including the mines. Although other industries where part of the privatisation process it was the re-ignition of the mines from 2000 that was the main driver of growth. On the other hand, this created the situation where Zambia is relatively vulnerable to volatility on the copper markets. The past two governments have therefore launched new initiatives to expand non-mining industrial growth. Multi Facility Economic Zones were established in 2006 with the intention of increase manufacturing’s share of GDP. These zones are a mix of free trade zones, export processing zones, and industrial parks while creating the administrative infrastructure, rules, and regulations to support both export and domestic-oriented industries. In 2013, the Industrialisation and Job Creation strategy was launched. The strategy, apart from proposing changes to the legal framework, monitoring and compliance, and trade facilitation also prioritised four key sectors, tourism, construction, agriculture and manufacturing. Manufacturing sub sectors directly targeted in the strategy include the leather industry, agro processing, wood products, copper fabrication, engineering and iron products, pharmaceutical and textile production.
The establishment of Multi Facility Economic Zones have not yet yielded the expected results with only three of the six zones being developed that have become operational. The zones are located in the Copperbelt, North-Western, and Lusaka regions. The Chambishi Zone on the Copperbelt focuses mainly on the copper supply chain, and houses both heavy and light industries, including copper smelting, manufacture of copper wire and cables, household appliances such as stoves, motor parts, and agro-processing. More than 10 enterprises have been established, creating over 3 500 jobs. The Lusaka East Zone, located adjacent to the Lusaka International Airport, was launched in January 2009 as an extension of the Chambishi Zone. This one is designed to focus on light manufacturing activities and services such as the provision of conference facilities, and hotel accommodation, among other things. The Lusaka South Zone that is in early stages of start-up has attracted large companies like the breweries and a solar farm. MSMEs in growth-oriented sectors are key to Zambia’s economic development according to the
14AFRICAN ECONOMIC OUTLOOK © AfDB, OECD, UNDP 2017
ZAMBIA
ILO, but require both financial and technical support to participate meaningfully in the economy. Despite a significant number of MSMEs in Zambia, they contribute very little to manufacturing output.
The majority of the self-employed work in agriculture, household activities or trading, live in rural areas and have limited education. According to the 2014 Labour Market Survey there were 2.4 million self-employed in Zambia. The majority (41.3%) of these worked in agriculture, followed by 24.5% working in households and 20.7% in wholesale and retail trading, and vehicle repairs. The remaining 13.5% were working in various sectors such as manufacturing, construction and transport. More than two-thirds of the self-employed live in rural areas and 64% of them have primary education or less. 34% have secondary level education, while only 1.4% have A-levels, a certificate or a degree. The low level of higher education in self-employed is an indication of the general quality of entrepreneurs. Most of the entrepreneurs are necessity driven as they are not able to find work elsewhere, according to the 2012 Global Entrepreneurial Monitor (GEM).
For entrepreneurs to create decent employment opportunities, the continuity and maturity of entrepreneurs and the eventual attainment of established entrepreneurs are important factors. These firms will be able to grow and create substantial employment over time. According to GEM, business maturity is only achieved for 4% of entrepreneurs in Zambia. This implies that very few jobs are created and sustained. According to the 2017 Global Entrepreneurial Index, one of the key challenges affecting Zambian entrepreneurs are start-up skills. This relates to the overall level of education and ability to create and manage a business with all its facets. The low level of technological absorption restricts the intake of technology in businesses. Finally, the absence of focus on high growth sectors, product innovation and process innovation further hinders on-going development of businesses in Zambia.
According to the Global Competitiveness Report, access to long-term finance, tax rates and corruption are key bottlenecks affecting business start-ups. Additional challenges include a shortage of desired artisanal, technical and managerial skills for large-scale industrial development. Specific technical and marketing skills are also inadequate. The shortage is more severe in smaller operations whereas larger firms can afford to recruit expatriates when needed. The shortage of artisans is a result of insufficient training facilities, whereas lack of adequate managerial capabilities is linked to the structure of the education system and historic legacies from a public sector driven industrial sector.
Mismatches between labour supply and labour demand are visible at the micro level and often inhibit growth. In certain key areas, specific skills such as management, information technology and engineering are lacking. Sectors affected by these mismatches include financial services and construction. These mismatches result in high overhead costs as skilled labour often has to be sourced from abroad.