Embed Size (px)
Citation preview
2017 World VitiViniculture Situation
oiV StatiStical report on World VitiViniculture

© OIV Statistical Report on World Vitiviniculture
OIV Statistical Report on World Vitiviniculture ©
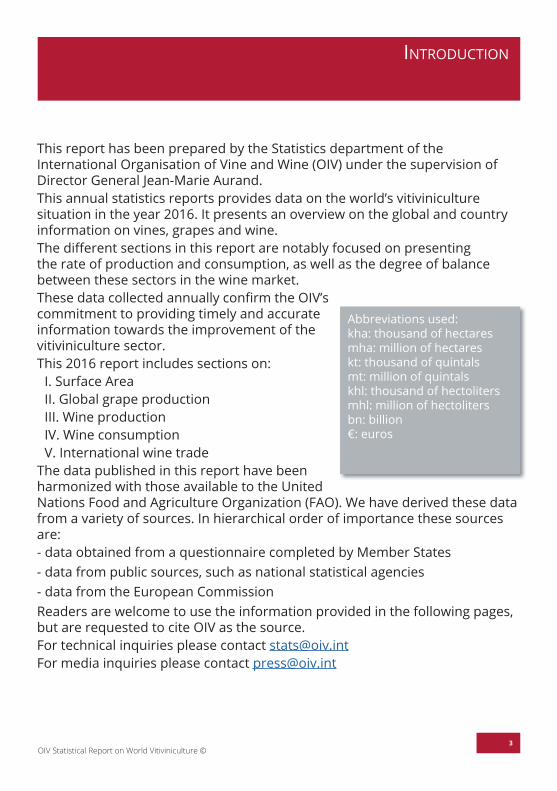
IntroductIon
3
Abbreviations used:kha: thousand of hectaresmha: million of hectareskt: thousand of quintals mt: million of quintals khl: thousand of hectolitersmhl: million of hectolitersbn: billion€: euros
This report has been prepared by the Statistics department of the International Organisation of Vine and Wine (OIV) under the supervision of Director General Jean-Marie Aurand.This annual statistics reports provides data on the world’s vitiviniculture situation in the year 2016. It presents an overview on the global and country information on vines, grapes and wine.The different sections in this report are notably focused on presenting the rate of production and consumption, as well as the degree of balance between these sectors in the wine market. These data collected annually confirm the OIV’s commitment to providing timely and accurate information towards the improvement of the vitiviniculture sector. This 2016 report includes sections on:
I. Surface AreaII. Global grape production III. Wine productionIV. Wine consumptionV. International wine trade
The data published in this report have been harmonized with those available to the United Nations Food and Agriculture Organization (FAO). We have derived these data from a variety of sources. In hierarchical order of importance these sources are:-- data obtained from a questionnaire completed by Member States-- data from public sources, such as national statistical agencies-- data from the European Commission
Readers are welcome to use the information provided in the following pages, but are requested to cite OIV as the source. For technical inquiries please contact [email protected] For media inquiries please contact [email protected]
© OIV Statistical Report on World Vitiviniculture4
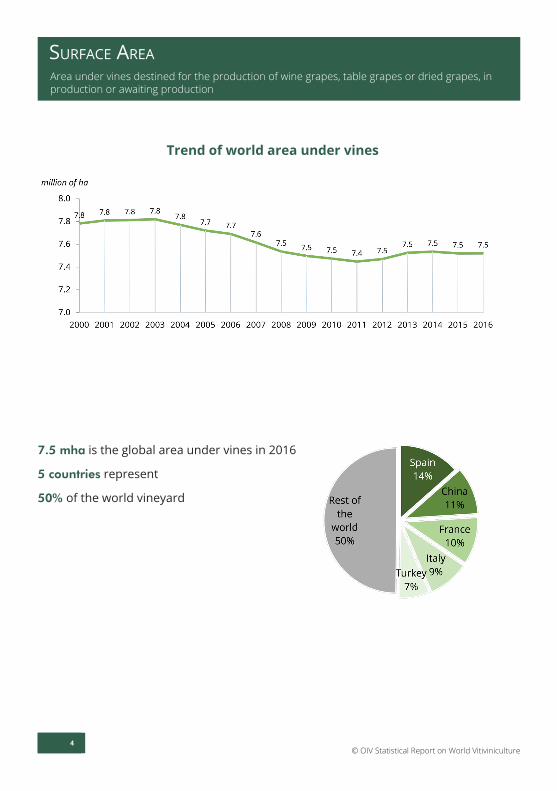
Surface area
4
Area under vines destined for the production of wine grapes, table grapes or dried grapes, in production or awaiting production
7.5 mha is the global area under vines in 2016
5 countries represent
50% of the world vineyard
Trend of world area under vines
OIV Statistical Report on World Vitiviniculture ©
Surface area
5
Area under vines destined for the production of wine grapes, table grapes or dried grapes, in production or awaiting production
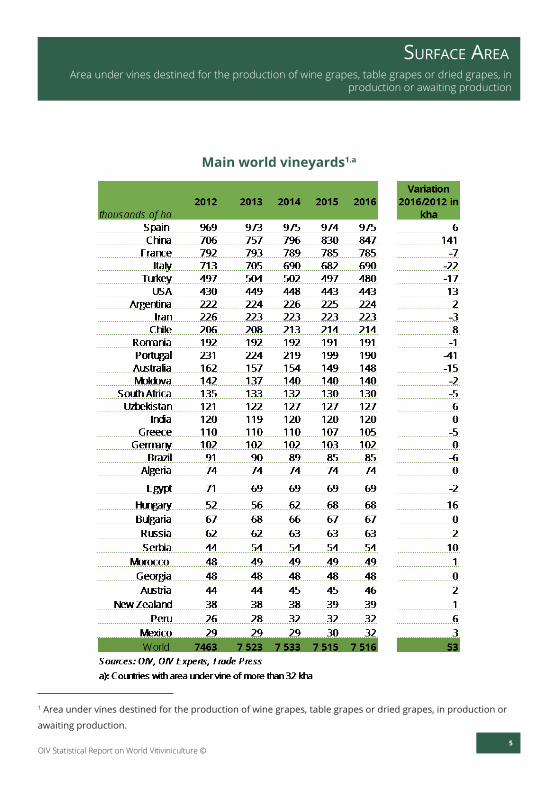
Main world vineyards1.a
1 Area under vines destined for the production of wine grapes, table grapes or dried grapes, in production or
awaiting production.
© OIV Statistical Report on World Vitiviniculture6
Surface area
6
Area under vines destined for the production of wine grapes, table grapes or dried grapes, in production or awaiting production
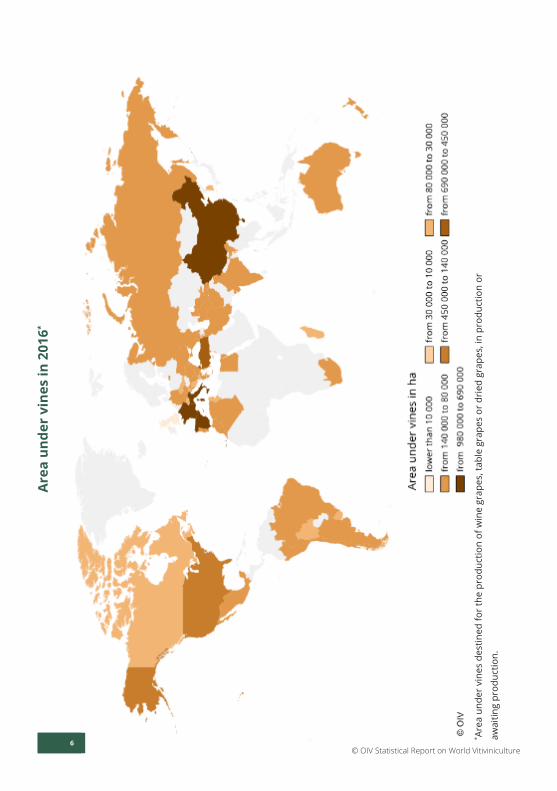
Are
a un
der
vine
s in
201
6*
* Are
a un
der
vine
s de
stin
ed fo
r th
e pr
oduc
tion
of w
ine
grap
es, t
able
gra
pes
or d
ried
gra
pes,
in p
rodu
ctio
n or
awai
ting
prod
uctio
n.
OIV Statistical Report on World Vitiviniculture ©
Grape production
7
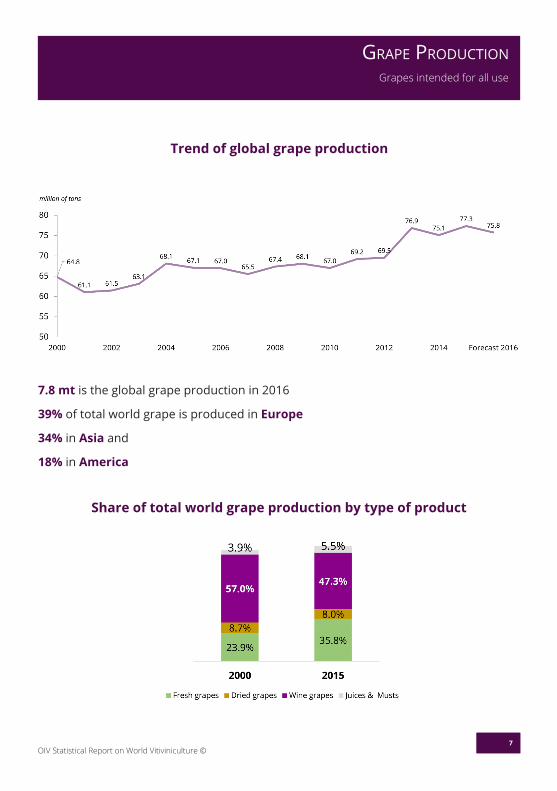
Grapes intended for all use
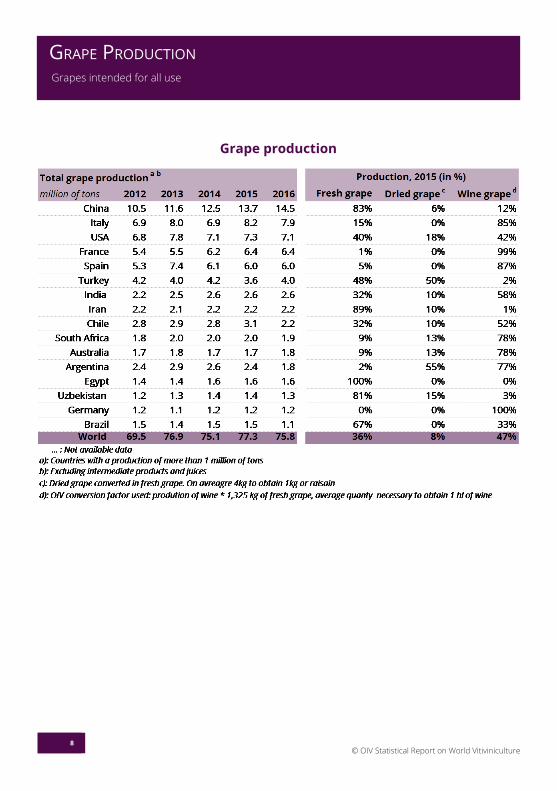
7.8 mt is the global grape production in 2016
39% of total world grape is produced in Europe
34% in Asia and
18% in America
Trend of global grape production
Share of total world grape production by type of product
© OIV Statistical Report on World Vitiviniculture
Grape production
8
Grapes intended for all use
Grape production
OIV Statistical Report on World Vitiviniculture ©
Grape production
9
Grapes intended for all use
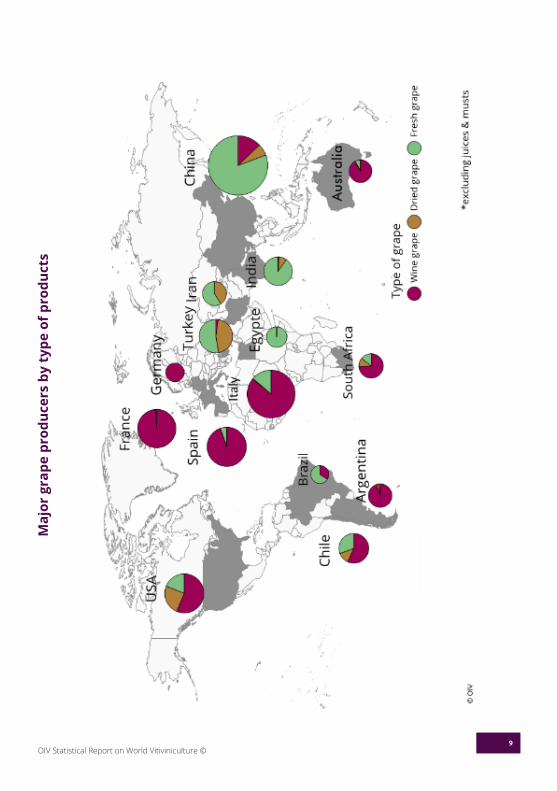
Maj
or g
rape
pro
duce
rs b
y ty
pe o
f pro
duct
s
© OIV Statistical Report on World Vitiviniculture
Wine Production
10
Total of wine, including sparkling and special wines, excluding juice and musts
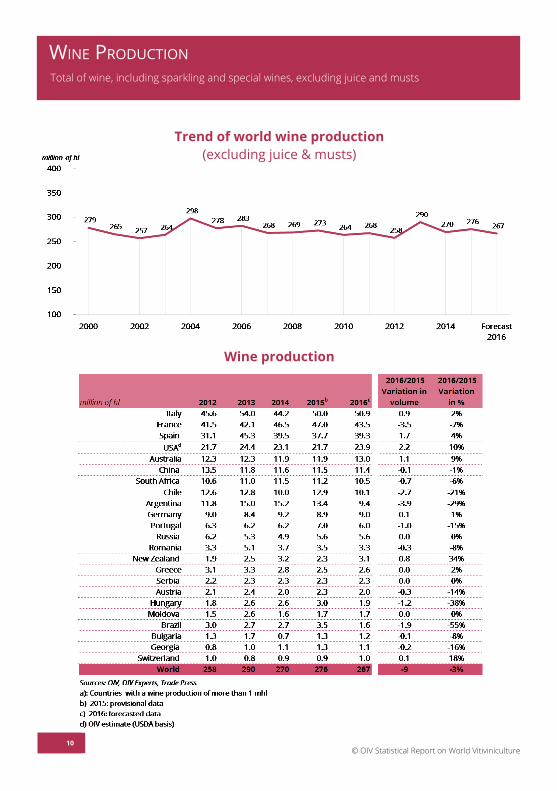
Trend of world wine production (excluding juice & musts)
Wine production
OIV Statistical Report on World Vitiviniculture ©
Wine Production
11
Total of wine, including sparkling and special wines, excluding juice and musts
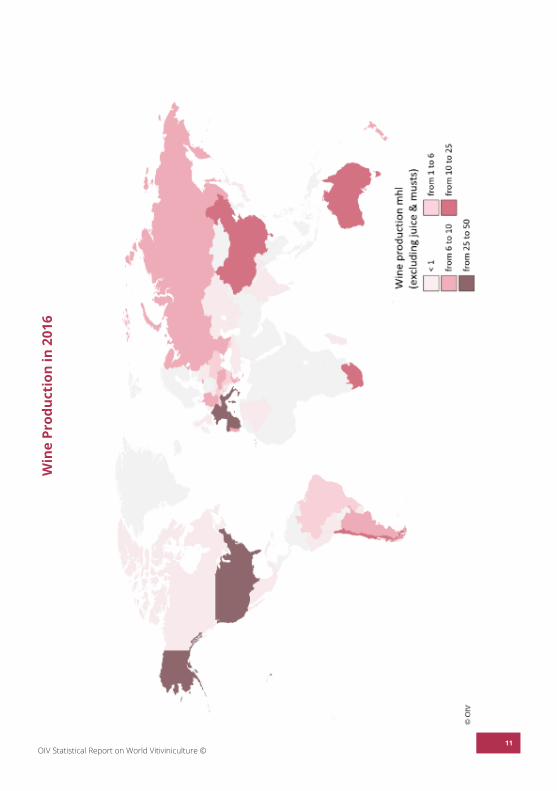
Win
e Pr
oduc
tion
in 2
016
© OIV Statistical Report on World Vitiviniculture
Wine Consumption
12
Including sparkling and special wines
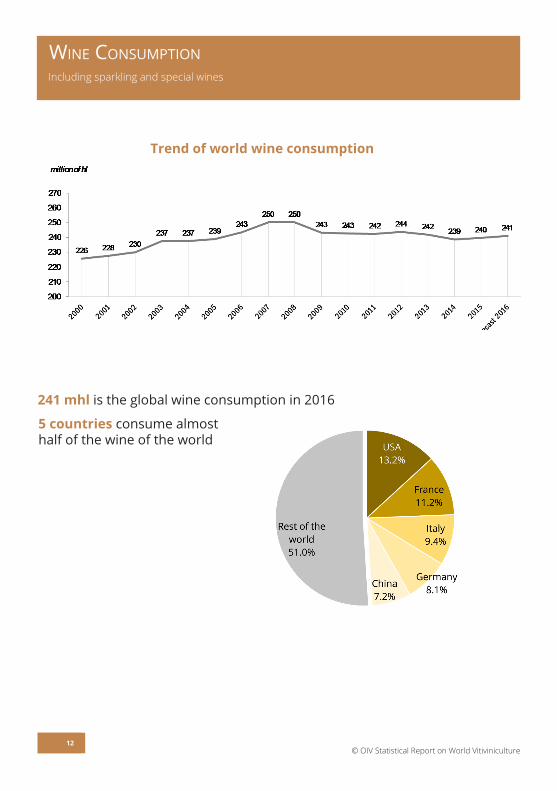
Trend of world wine consumption
241 mhl is the global wine consumption in 2016
5 countries consume almost half of the wine of the world
OIV Statistical Report on World Vitiviniculture ©
Wine Consumption
13
Including sparkling and special wines
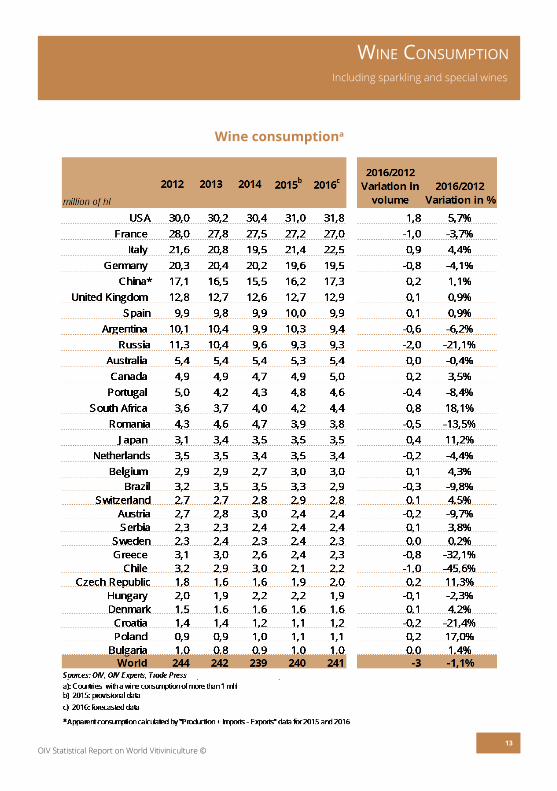
Wine consumptiona
© OIV Statistical Report on World Vitiviniculture
Wine Consumption
14
Including sparkling and special wines
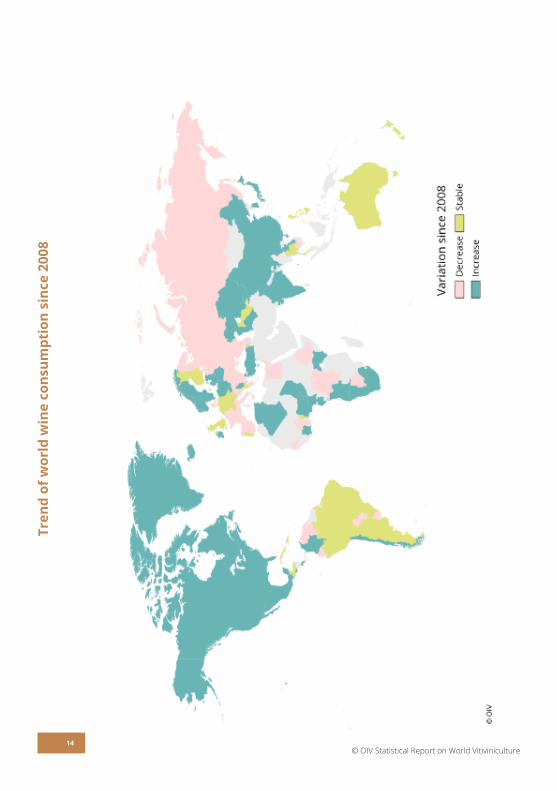
Tren
d of
wor
ld w
ine
cons
umpt
ion
sinc
e 20
08
OIV Statistical Report on World Vitiviniculture ©
InternatIonal WIne trade
15
Including sparkling and special wines
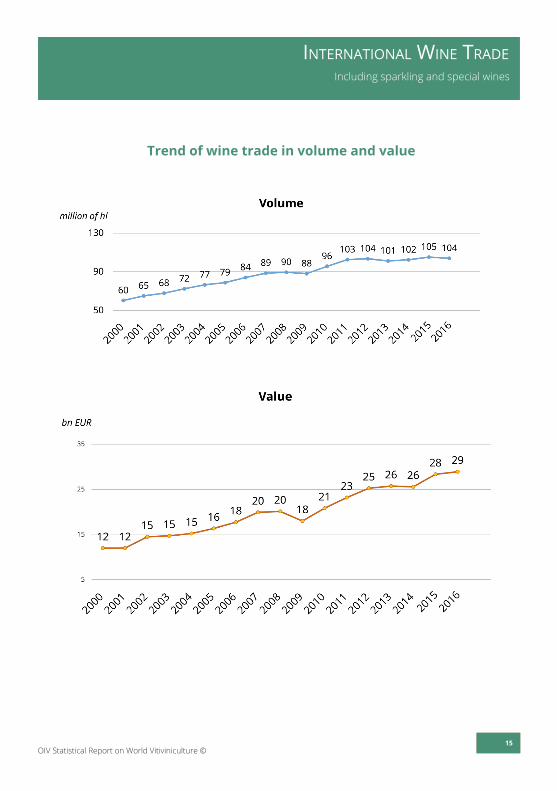
Trend of wine trade in volume and value
© OIV Statistical Report on World Vitiviniculture
InternatIonal WIne trade
16
Including sparkling and special wines
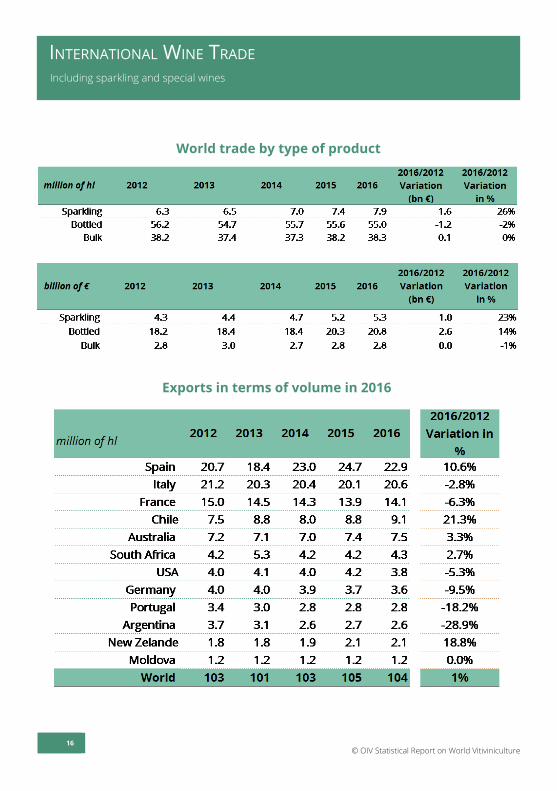
Exports in terms of volume in 2016
World trade by type of product
OIV Statistical Report on World Vitiviniculture ©
InternatIonal WIne trade
17
Including sparkling and special wines
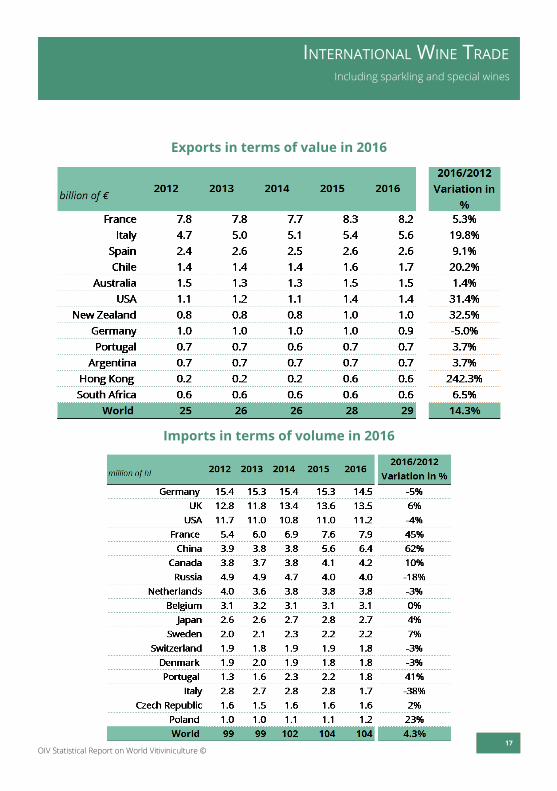
Imports in terms of volume in 2016
Exports in terms of value in 2016
© OIV Statistical Report on World Vitiviniculture
InternatIonal WIne trade
18
Including sparkling and special wines
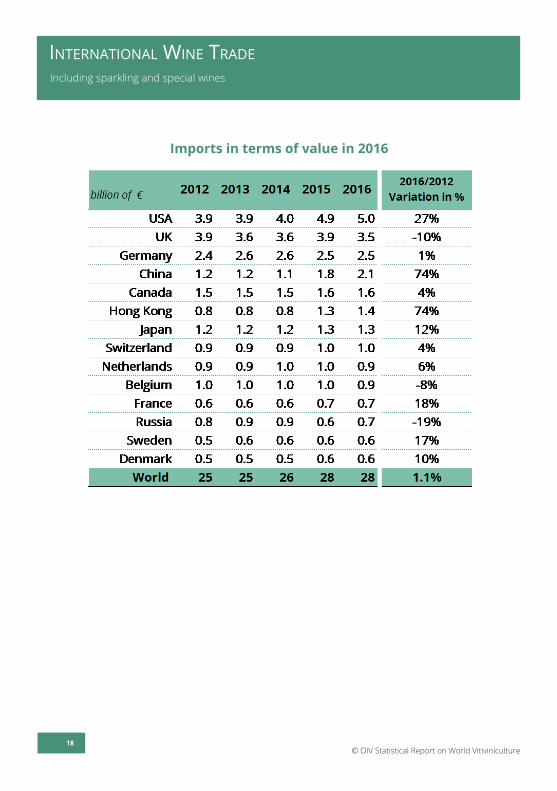
Imports in terms of value in 2016
OIV Statistical Report on World Vitiviniculture ©
InternatIonal WIne trade
19
Including sparkling and special wines
International Organisation of Vine and Wine18, rue d’Aguesseau
75008 Parishttp://www.oiv.int
Tel. +33 1 44 94 80 80Follow us: