Embed Size (px)
Citation preview
2017State of the Industry Report on Mobile MoneyEXECUTIVE SUMMARY
Copyright © 2018 GSM Association
The GSMA represents the interests of mobile operators worldwide, uniting nearly 800 operators with almost 300 companies in the broader mobile ecosystem, including handset and device makers, software companies, equipment providers and internet companies, as well as organisations in adjacent industry sectors. The GSMA also produces industry-leading events such as Mobile World Congress, Mobile World Congress Shanghai, Mobile World Congress Americas and the Mobile 360 Series of conferences.
For more information, please visit the GSMA corporate website at www.gsma.com
Follow the GSMA on Twitter: @GSMA
GSMA Mobile Money
The GSMA’s Mobile Money programme works to accelerate the development of the mobile money ecosystem for the underserved.
For more information, please contact us:
Web: www.gsma.com/mobilemoney
Twitter: @gsmammu
Email: [email protected]
THE MOBILE MONEY PROGRAMME IS SUPPORTED BY THE BILL & MELINDA GATES
FOUNDATION, THE MASTERCARD FOUNDATION, AND OMIDYAR NETWORK
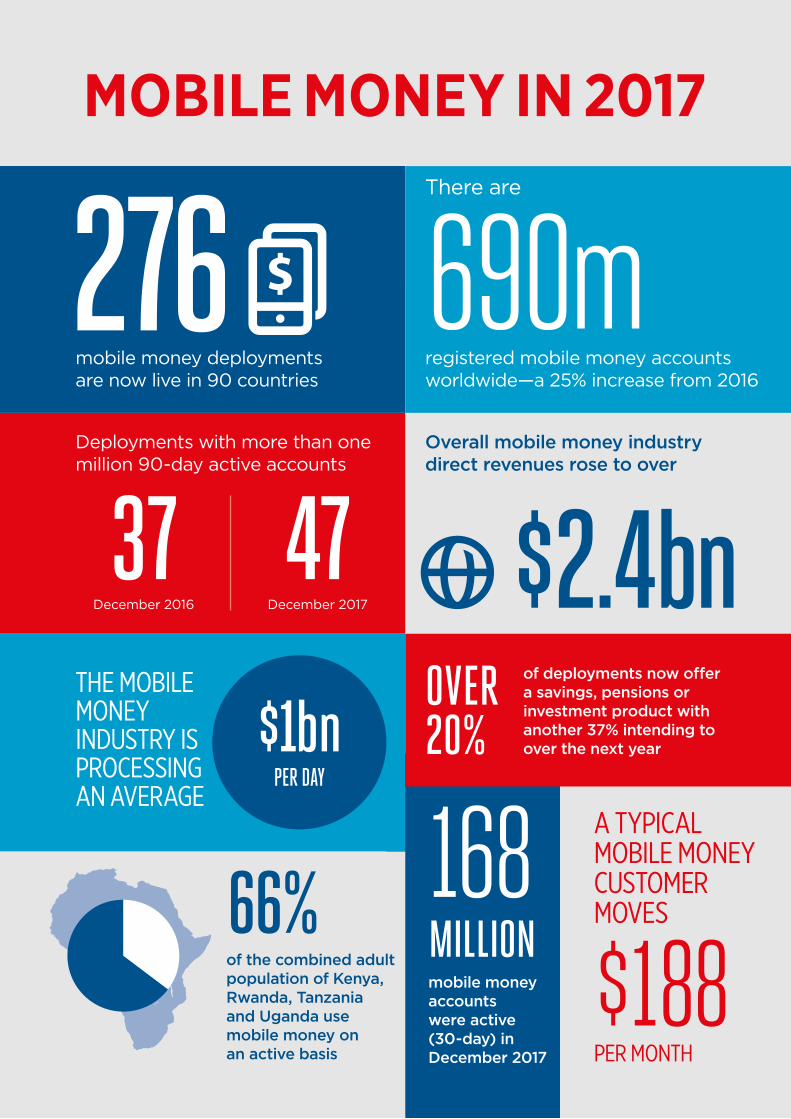
MOBILE MONEY IN 2017
MOBILE MONEY IN 2017
168
Deployments with more than one million 90-day active accounts
THE MOBILE MONEY INDUSTRY IS PROCESSING AN AVERAGE
mobile money accounts were active (30-day) in December 2017
A TYPICAL MOBILE MONEY CUSTOMER MOVES
MILLION
PER MONTH
$188
Overall mobile money industry direct revenues rose to over
OVER 20%
of deployments now offer a savings, pensions or investment product with another 37% intending to over the next year
37 47December 2016 December 2017
690mmobile money deployments are now live in 90 countries
registered mobile money accounts worldwide—a 25% increase from 2016
There are
276
$1bnPER DAY
of the combined adult population of Kenya, Rwanda, Tanzania and Uganda use mobile money on an active basis
66%
$2.4bn
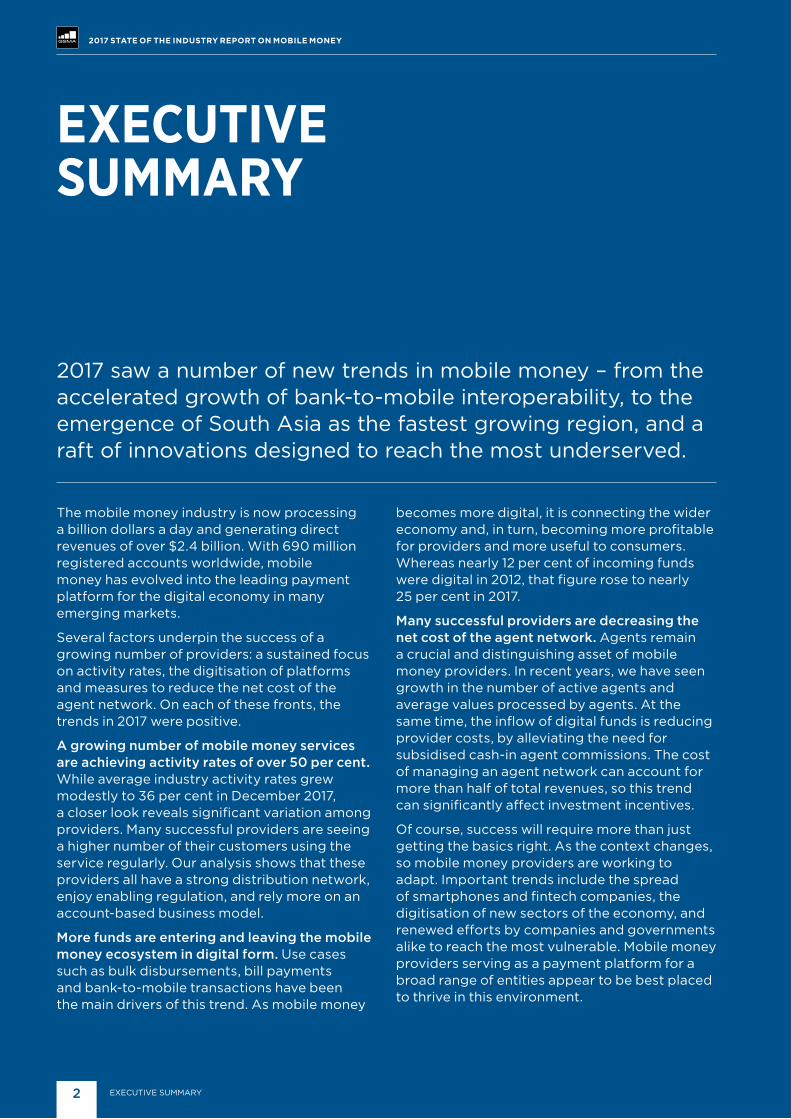
EXECUTIVE SUMMARY
2017 saw a number of new trends in mobile money – from the accelerated growth of bank-to-mobile interoperability, to the emergence of South Asia as the fastest growing region, and a raft of innovations designed to reach the most underserved.
The mobile money industry is now processing a billion dollars a day and generating direct revenues of over $2.4 billion. With 690 million registered accounts worldwide, mobile money has evolved into the leading payment platform for the digital economy in many emerging markets.
Several factors underpin the success of a growing number of providers: a sustained focus on activity rates, the digitisation of platforms and measures to reduce the net cost of the agent network. On each of these fronts, the trends in 2017 were positive.
A growing number of mobile money services are achieving activity rates of over 50 per cent. While average industry activity rates grew modestly to 36 per cent in December 2017, a closer look reveals significant variation among providers. Many successful providers are seeing a higher number of their customers using the service regularly. Our analysis shows that these providers all have a strong distribution network, enjoy enabling regulation, and rely more on an account-based business model.
More funds are entering and leaving the mobile money ecosystem in digital form. Use cases such as bulk disbursements, bill payments and bank-to-mobile transactions have been the main drivers of this trend. As mobile money
becomes more digital, it is connecting the wider economy and, in turn, becoming more profitable for providers and more useful to consumers. Whereas nearly 12 per cent of incoming funds were digital in 2012, that figure rose to nearly 25 per cent in 2017.
Many successful providers are decreasing the net cost of the agent network. Agents remain a crucial and distinguishing asset of mobile money providers. In recent years, we have seen growth in the number of active agents and average values processed by agents. At the same time, the inflow of digital funds is reducing provider costs, by alleviating the need for subsidised cash-in agent commissions. The cost of managing an agent network can account for more than half of total revenues, so this trend can significantly affect investment incentives.
Of course, success will require more than just getting the basics right. As the context changes, so mobile money providers are working to adapt. Important trends include the spread of smartphones and fintech companies, the digitisation of new sectors of the economy, and renewed efforts by companies and governments alike to reach the most vulnerable. Mobile money providers serving as a payment platform for a broad range of entities appear to be best placed to thrive in this environment.
2017 STATE OF THE INDUSTRY REPORT ON MOBILE MONEY
2 EXECUTIVE SUMMARY
The most successful providers are integrated with a wide range of third parties. On average, providers with the highest activity rates are integrated with seven banks, 95 billers and 31 organisations for bulk disbursements, and 6,500 merchants - well above the industry average.
As a burgeoning fintech community seeks to marry start-up innovation with mobile money scale, these connections and the potential to serve as the gateway to the digital economy will become increasingly central to the story of mobile money.
Policy objectives will play an increasingly important role, as the scope of mobile money regulation broadens. The pace of core regulatory reform slowed in 2017, as the total number of markets with enabling regulatory frameworks rose from 52 to 54.
This, however, masked two important trends: the growth of new areas of digital financial services regulation and the spread of national financial inclusion policy frameworks. As regulators confront questions around data protection, regulatory sandboxes, and more, the policy end game of greater inclusion must remain at the fore.
Amidst this changing landscape, many traditional tools remain relevant. The persistence and scale of the cash economy in emerging markets means that complex distribution networks remain crucial for digital services to interface with physical lives.
In a business that relies deeply on trust, the role of longstanding brands and the understanding of local contexts is integral to the engagement of people outside of the formal system. And as governments and regulators take a broader approach to digital financial services, providers and national authorities must continue to work in concert to strike a balance that ensures sustainable and responsible market growth.
By leveraging these enduring assets and finding new ways to connect scale with innovation, mobile money providers can serve as a gateway to the widening array of digital services in emerging markets. In this report, we take a closer look at these and other trends shaping the mobile money industry around the world. The full findings of this year’s State of the Industry Report on Mobile Money are based on the analysis of data collected through the GSMA’s Annual Global Adoption Survey.
2017 STATE OF THE INDUSTRY REPORT ON MOBILE MONEY
EXECUTIVE SUMMARY 3
Registeredaccounts
Transaction volume
ValueUSD
Registeredaccounts
Number of deployments
Transaction volume
ValueUSD
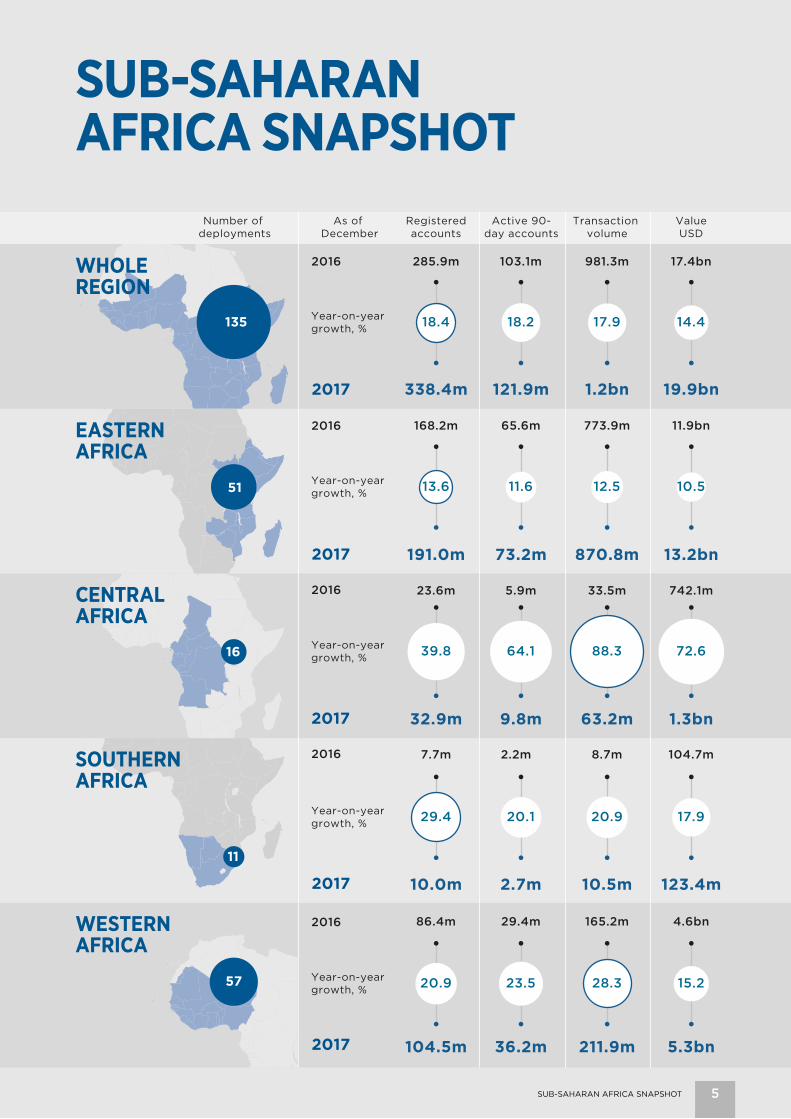
19.9bn1.2bn121.9m338.4m
17.4bn981.3m103.1m285.9m
Year-on-year growth, % 18.4 18.2 17.9 14.4
13.2bn870.8m73.2m191.0m
11.9bn773.9m65.6m168.2m
Year-on-year growth, % 13.6 11.6 12.5 10.5
Year-on-year growth, %
742.1m33.5m5.9m23.6m
1.3bn63.2m9.8m32.9m
64.1 72.688.339.8
123.4m10.5m2.7m10.0m
104.7m8.7m2.2m7.7m
Year-on-year growth, % 29.4 20.1 20.9 17.9
5.3bn211.9m36.2m104.5m
4.6bn165.2m29.4m86.4m
Year-on-year growth, % 20.9 23.5 28.3 15.2
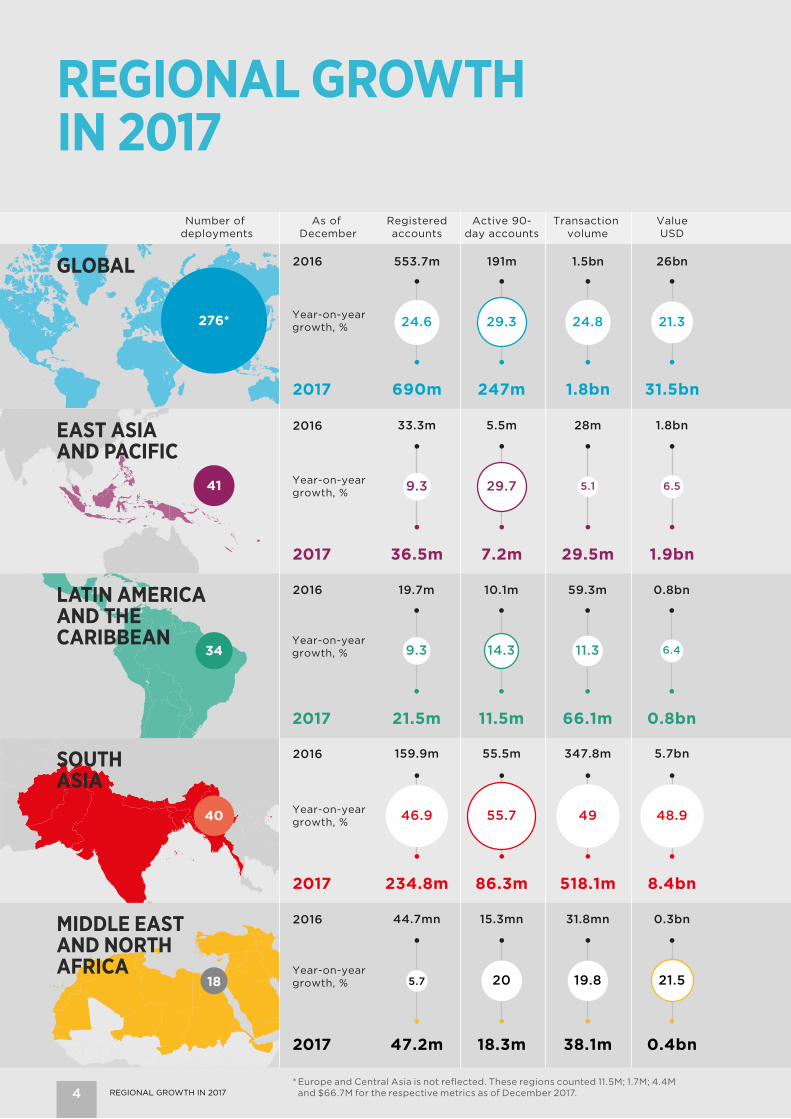
31.5bn1.8bn247m690m 2017
26bn1.5bn191m553.7m
Year-on-year growth, % 24.6 29.3 24.8 21.3
1.9bn29.5m7.2m36.5m2017
1.8bn28m5.5m33.3m
Year-on-year growth, % 9.3 29.7 5.1 6.5
0.8bn66.1m11.5m21.5m2017
0.8bn59.3m10.1m19.7m
Year-on-year growth, % 9.3 14.3 11.3 6.4
8.4bn518.1m86.3m234.8m2017
5.7bn347.8m55.5m159.9m
Year-on-year growth, % 46.9 55.7 49 48.9
0.4bn38.1m18.3m47.2m2017
0.3bn31.8mn15.3mn44.7mn
Year-on-year growth, % 5.7 19.8 21.520
16
135
51
11
57
Number of deployments
18
40
34
41
276*
Active 90-day accounts
Active 90-day accounts
As of December
As of December
2016
2016
2016
2016
2016
2016
2016
2016
2016
2016
2017
2017
2017
2017
2017
REGIONAL GROWTH IN 2017
GLOBAL
EAST ASIA AND PACIFIC
LATIN AMERICA AND THE CARIBBEAN
SOUTH ASIA
MIDDLE EAST AND NORTH AFRICA
* Europe and Central Asia is not reflected. These regions counted 11.5M; 1.7M; 4.4M and $66.7M for the respective metrics as of December 2017.4 REGIONAL GROWTH IN 2017
Registeredaccounts
Transaction volume
ValueUSD
Registeredaccounts
Number of deployments
Transaction volume
ValueUSD
19.9bn1.2bn121.9m338.4m
17.4bn981.3m103.1m285.9m
Year-on-year growth, % 18.4 18.2 17.9 14.4
13.2bn870.8m73.2m191.0m
11.9bn773.9m65.6m168.2m
Year-on-year growth, % 13.6 11.6 12.5 10.5
Year-on-year growth, %
742.1m33.5m5.9m23.6m
1.3bn63.2m9.8m32.9m
64.1 72.688.339.8
123.4m10.5m2.7m10.0m
104.7m8.7m2.2m7.7m
Year-on-year growth, % 29.4 20.1 20.9 17.9
5.3bn211.9m36.2m104.5m
4.6bn165.2m29.4m86.4m
Year-on-year growth, % 20.9 23.5 28.3 15.2
31.5bn1.8bn247m690m 2017
26bn1.5bn191m553.7m
Year-on-year growth, % 24.6 29.3 24.8 21.3
1.9bn29.5m7.2m36.5m2017
1.8bn28m5.5m33.3m
Year-on-year growth, % 9.3 29.7 5.1 6.5
0.8bn66.1m11.5m21.5m2017
0.8bn59.3m10.1m19.7m
Year-on-year growth, % 9.3 14.3 11.3 6.4
8.4bn518.1m86.3m234.8m2017
5.7bn347.8m55.5m159.9m
Year-on-year growth, % 46.9 55.7 49 48.9
0.4bn38.1m18.3m47.2m2017
0.3bn31.8mn15.3mn44.7mn
Year-on-year growth, % 5.7 19.8 21.520
16
135
51
11
57
Number of deployments
18
40
34
41
276*
Active 90-day accounts
Active 90-day accounts
As of December
As of December
2016
2016
2016
2016
2016
2016
2016
2016
2016
2016
2017
2017
2017
2017
2017
SUB-SAHARAN AFRICA SNAPSHOT
WHOLE REGION
EASTERN AFRICA
CENTRAL AFRICA
SOUTHERN AFRICA
WESTERN AFRICA
SUB-SAHARAN AFRICA SNAPSHOT 5
GSMA HEAD OFFICEFloor 2The Walbrook Building25 WalbrookLondon EC4N 8AF United KingdomTel: +44 (0)20 7356 0600Fax: +44 (0)20 7356 0601
For the full version of the report, please visit gsma.com/sotir