Embed Size (px)
Citation preview
2017 Spring Sales SurveyA nation-wide survey of footwear consumers
on their purchasing habits for Spring 2017
National Footwear Sales ECPS April 4-‐6, 2017 1
This survey was commissioned by
The footwear industry’s business and trade association
At over 80% of the entire industry, the Footwear Distributors Retailers of America (FDRA) is the largest and most respected footwear trade association in the U.S. It represents and serves the entire footwear industry from small family owned footwear businesses to global footwear companies as well as domestic manufactures, importers and retailers. In all, it supports more than 130 companies and over 200 brands designing, producing and selling great footwear to consumers all over the globe.
This survey was conducted by
The Emerson College Polling Society (ECPS) is a research center at Emerson College in Boston, Massachusetts whose focus is on economics, politics, sports, and entertainment public opinion. ECPS surveys and polls are internationally recognized and in 2016 Bloomberg News ranked ECPS as the most accurate collegiate pollster for the Presidential Primaries. ECPS is a charter member of the Transparency Initiative of the American Association of Public Opinion Research (AAPOR).
Questions about this survey should be directed to [email protected]
Any portion of this survey used for any purpose without written consent of FDRA is strictly prohibited.
National Footwear Sales ECPS April 4-‐6, 2017 2
Contents
Methodology ..................................................................................................................... 3 Executive Summary ......................................................................................................... 4 Results ............................................................................................................................. 6 Key Cross Tabs .............................................................................................................. 13
National Footwear Sales ECPS April 4-‐6, 2017 3
Methodology The Emerson College Polling Society, under the supervision of Professor Spencer Kimball is pleased to present Footwear Distributors and Retailers of America with the findings from a survey of US Consumers. All respondents interviewed in this study were part of a fully representative sample using an area probabilistic sampling method of N= 600 (sample size). The margin of error for the sample is +/-‐ 3.9% in 19 of 20 cases unless otherwise specified in the results section.
The poll is based on a random sample of adults, 18 years of age and older. The survey was administered using both landlines via IVR data collection (77%) and cellphones (23%) via online data collection using Survey Sampling International SSI and was conducted April 4-‐6, 2017. The results presented in this report include univariate and bivariate analysis of the data. Frequency distributions for each item included on the questionnaire are shown in the tables. In all cases, cross-‐tabulation results are also shown. This type of bivariate analysis examines differences between sub-‐groups of the overall population.
In the cases where cross tabulation results are presented, a chi-‐square test, an independent t-‐test for means, or a Z-‐test for independent percentages is shown. A chi-‐square test is used in cases where comparisons are made for categorical variables. A t-‐test is used in cases where comparisons are made for measurement variables. A Z-‐test is used in cases where comparisons are made between independent population percentages.
The purpose of these statistical tests is to determine whether or not the observed difference between sub-‐groups in the sample is due to sampling error or whether it is due to a real difference in the population. When the results are statistically significant, it strongly suggests that the observed difference between sub-‐groups found in the sample is due to a real difference in the population, and not due to sampling error.
A chi-‐square significance level of.05 indicates significance at the 95 percent level. In other words, it is 95 percent likely that the results are due to a real difference between comparison groups. A chi-‐square significance level of .01 indicates significance at the 99 percent level. When a t-‐test or a Z-‐test is shown, lower-‐ and upper-‐case letters indicate significance at the 90 and 95 percent levels respectively.
This survey uses statistical weighting procedures to account for deviations in the survey sample from known population characteristics, which helps correct for differential survey participation and random variation in samples. The overall adult sample is weighted to recent Census data using a sample balancing procedure to match the demographic makeup of the population by region, gender, age, education and race. Margins of sampling error for this survey are not adjusted for design effect.
National Footwear Sales ECPS April 4-‐6, 2017 4
Executive Summary
The Footwear Distributors & Retailers of America (FDRA) commissioned this 2017 Spring Sales
Survey to accurately ascertain the evolving behaviors and insights of the American footwear
consumer this spring season. Respondents answered key questions focused on the likelihood of an
upcoming shoe purchase, for whom those shoes shall be purchased, the types of footwear
consumers are searching for, and the channel in which they will buy their shoes. The results
support current industry notions with some definite surprises along the way.
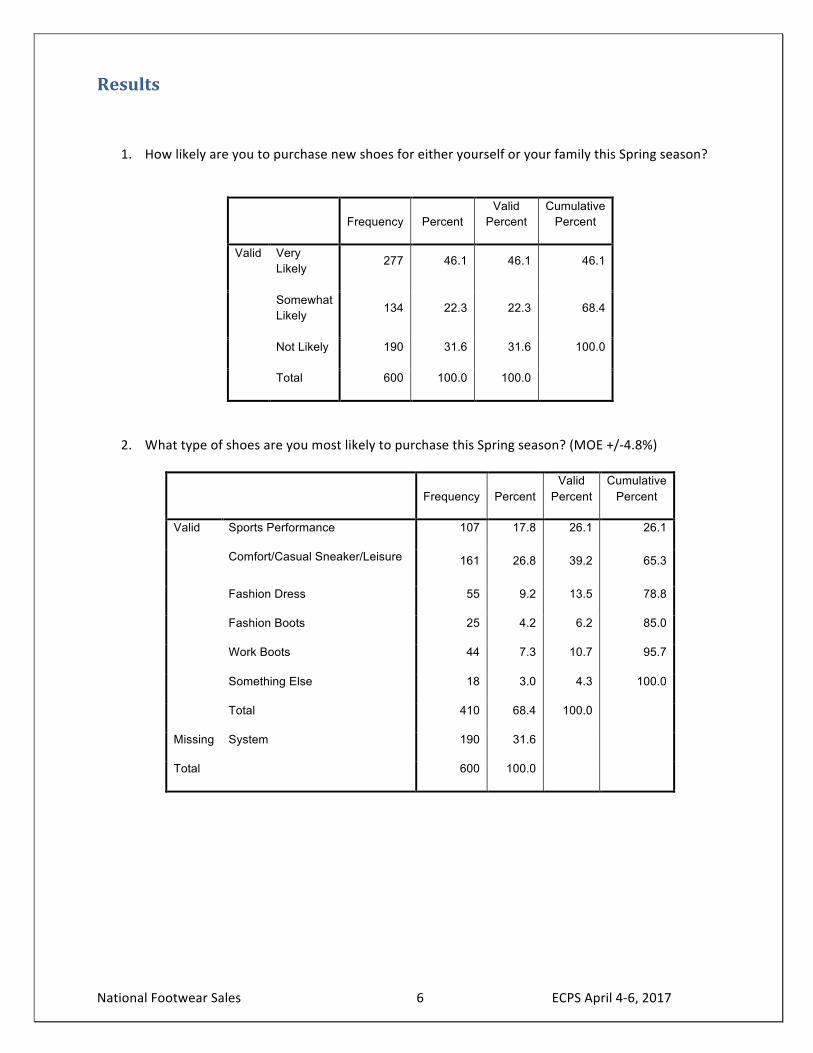
Overall, 46% of respondents were very likely to purchase new shoes for either themselves or their
family this spring season with another 22% saying they were somewhat likely and 32% saying they
were not likely at all.
Among respondents purchasing shoes, 39% said they were buying comfort/casual sneakers/leisure
shoes and 26% said they were purchasing performance sneakers for the gym or sports. Fourteen-‐
percent (14%) said they were buying fashion/dress shoes like heels, flats, or men’s oxfords while
11% were buying work boots/shoes and 6% were buying fashion boots. Four-‐percent (4%) said they
were buying something else.
Comfort/Casual and Leisure shoes will be most popular in the Northeast (61%) and the Midwest
(57%) and among Caucasians (43%), African Americans (54%) and Asians (41%). Sports performance
shoes will be most popular in the South (36%) and among Hispanics (51%).
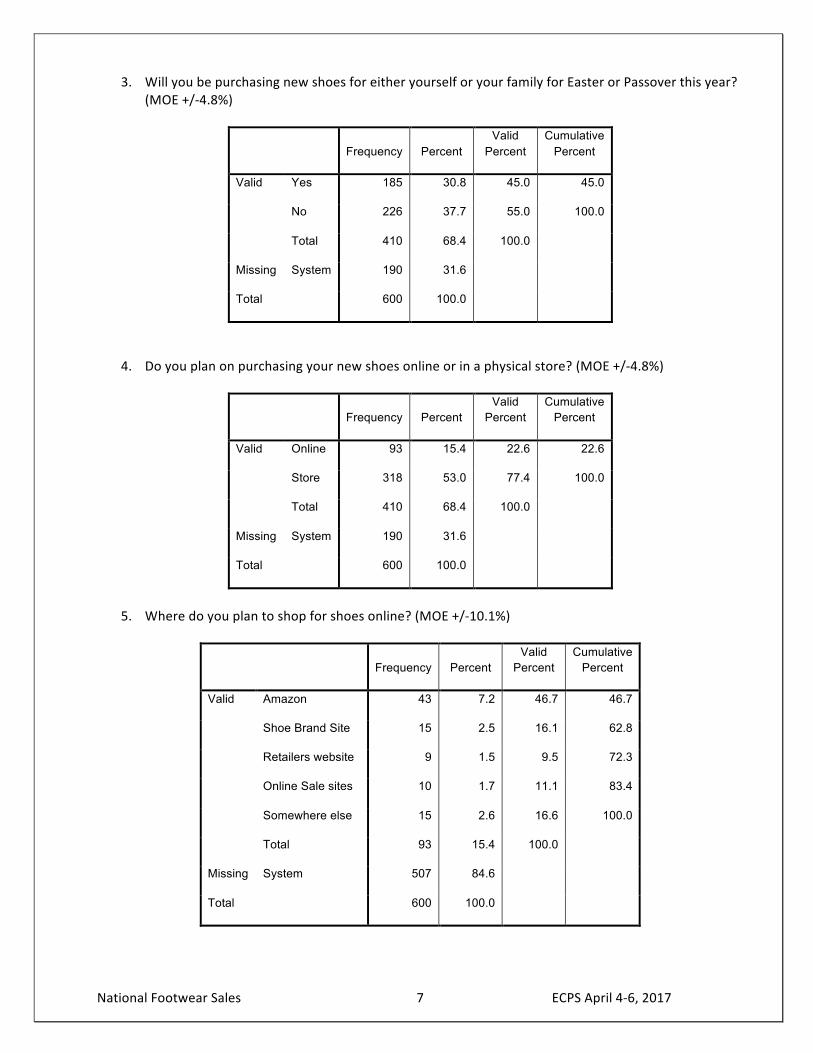
Thirty-‐one-‐percent (31%) of respondents plan on purchasing new shoes for Easter or Passover this
year.
Shoppers prefer 3:1 purchasing new shoes in a physical store (77%) versus purchasing online (23%).
Of those purchasing shoes this holiday season, 69% said they are going to a physical store and 31%
said they are purchasing online.
Of those 23% shopping online, 47% plan to shop on Amazon, 16% plan to shop at the shoe brand’s
own website such as nike.com or stevemadden.com, 10% at a retailer’s website like Nordstrom,
National Footwear Sales ECPS April 4-‐6, 2017 5
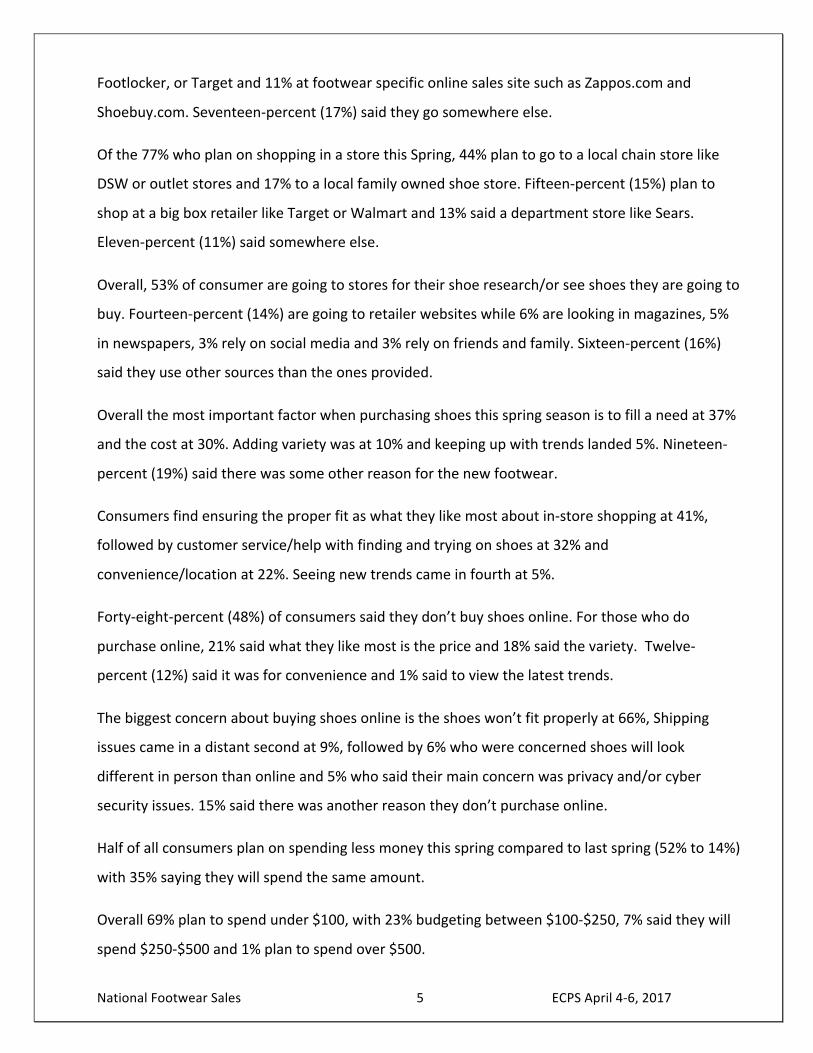
Footlocker, or Target and 11% at footwear specific online sales site such as Zappos.com and
Shoebuy.com. Seventeen-‐percent (17%) said they go somewhere else.
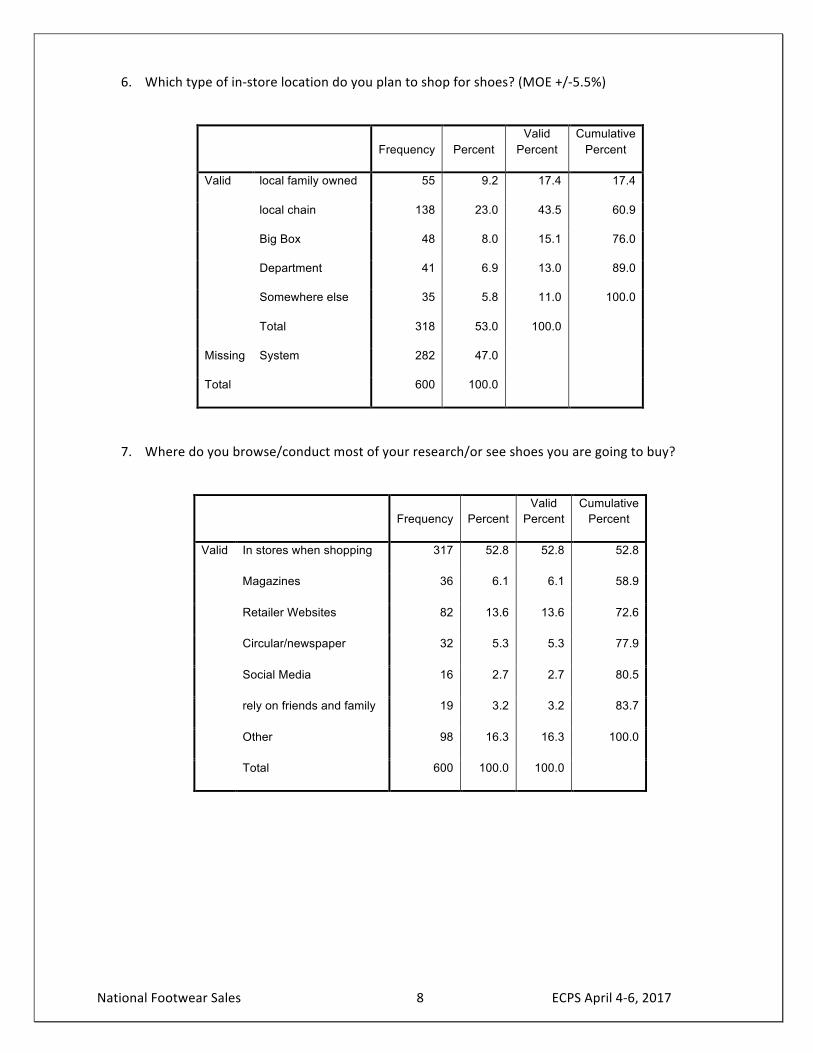
Of the 77% who plan on shopping in a store this Spring, 44% plan to go to a local chain store like
DSW or outlet stores and 17% to a local family owned shoe store. Fifteen-‐percent (15%) plan to
shop at a big box retailer like Target or Walmart and 13% said a department store like Sears.
Eleven-‐percent (11%) said somewhere else.
Overall, 53% of consumer are going to stores for their shoe research/or see shoes they are going to
buy. Fourteen-‐percent (14%) are going to retailer websites while 6% are looking in magazines, 5%
in newspapers, 3% rely on social media and 3% rely on friends and family. Sixteen-‐percent (16%)
said they use other sources than the ones provided.
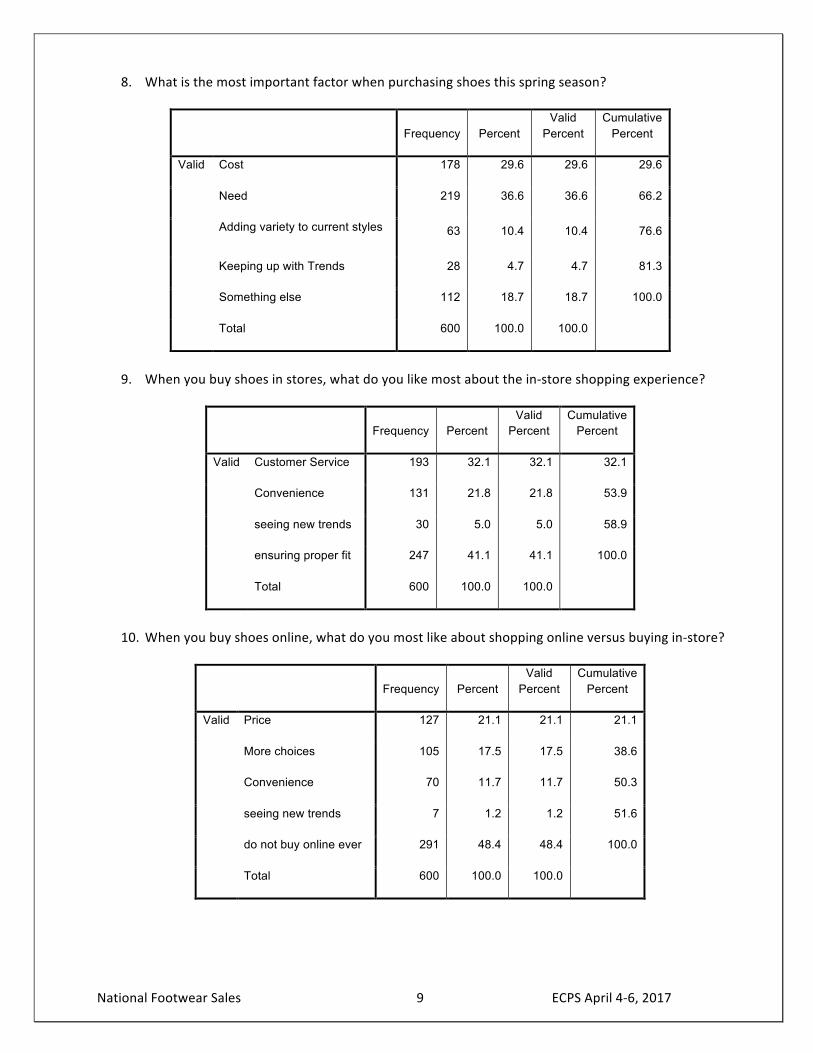
Overall the most important factor when purchasing shoes this spring season is to fill a need at 37%
and the cost at 30%. Adding variety was at 10% and keeping up with trends landed 5%. Nineteen-‐
percent (19%) said there was some other reason for the new footwear.
Consumers find ensuring the proper fit as what they like most about in-‐store shopping at 41%,
followed by customer service/help with finding and trying on shoes at 32% and
convenience/location at 22%. Seeing new trends came in fourth at 5%.
Forty-‐eight-‐percent (48%) of consumers said they don’t buy shoes online. For those who do
purchase online, 21% said what they like most is the price and 18% said the variety. Twelve-‐
percent (12%) said it was for convenience and 1% said to view the latest trends.
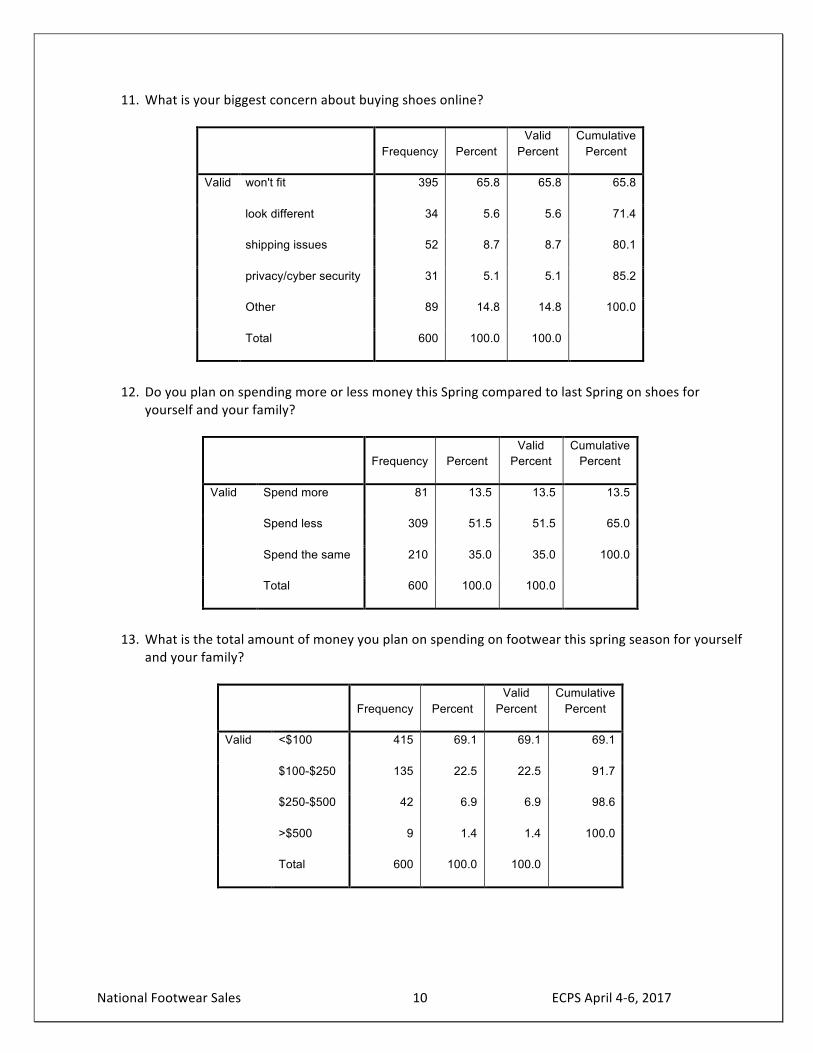
The biggest concern about buying shoes online is the shoes won’t fit properly at 66%, Shipping
issues came in a distant second at 9%, followed by 6% who were concerned shoes will look
different in person than online and 5% who said their main concern was privacy and/or cyber
security issues. 15% said there was another reason they don’t purchase online.
Half of all consumers plan on spending less money this spring compared to last spring (52% to 14%)
with 35% saying they will spend the same amount.
Overall 69% plan to spend under $100, with 23% budgeting between $100-‐$250, 7% said they will
spend $250-‐$500 and 1% plan to spend over $500.
National Footwear Sales ECPS April 4-‐6, 2017 6
Results
1. How likely are you to purchase new shoes for either yourself or your family this Spring season?
Frequency Percent Valid
Percent Cumulative
Percent
Valid Very Likely
277 46.1 46.1 46.1
Somewhat Likely 134 22.3 22.3 68.4
Not Likely 190 31.6 31.6 100.0
Total 600 100.0 100.0
2. What type of shoes are you most likely to purchase this Spring season? (MOE +/-‐4.8%)
Frequency Percent Valid
Percent Cumulative
Percent
Valid Sports Performance 107 17.8 26.1 26.1
Comfort/Casual Sneaker/Leisure 161 26.8 39.2 65.3
Fashion Dress 55 9.2 13.5 78.8
Fashion Boots 25 4.2 6.2 85.0
Work Boots 44 7.3 10.7 95.7
Something Else 18 3.0 4.3 100.0
Total 410 68.4 100.0
Missing System 190 31.6
Total 600 100.0
National Footwear Sales ECPS April 4-‐6, 2017 7
3. Will you be purchasing new shoes for either yourself or your family for Easter or Passover this year? (MOE +/-‐4.8%)
Frequency Percent Valid
Percent Cumulative
Percent
Valid Yes 185 30.8 45.0 45.0
No 226 37.7 55.0 100.0
Total 410 68.4 100.0
Missing System 190 31.6
Total 600 100.0
4. Do you plan on purchasing your new shoes online or in a physical store? (MOE +/-‐4.8%)
Frequency Percent Valid
Percent Cumulative
Percent
Valid Online 93 15.4 22.6 22.6
Store 318 53.0 77.4 100.0
Total 410 68.4 100.0
Missing System 190 31.6
Total 600 100.0
5. Where do you plan to shop for shoes online? (MOE +/-‐10.1%)
Frequency Percent Valid
Percent Cumulative
Percent
Valid Amazon 43 7.2 46.7 46.7
Shoe Brand Site 15 2.5 16.1 62.8
Retailers website 9 1.5 9.5 72.3
Online Sale sites 10 1.7 11.1 83.4
Somewhere else 15 2.6 16.6 100.0
Total 93 15.4 100.0
Missing System 507 84.6
Total 600 100.0
National Footwear Sales ECPS April 4-‐6, 2017 8
6. Which type of in-‐store location do you plan to shop for shoes? (MOE +/-‐5.5%)
Frequency Percent Valid
Percent Cumulative
Percent
Valid local family owned 55 9.2 17.4 17.4
local chain 138 23.0 43.5 60.9
Big Box 48 8.0 15.1 76.0
Department 41 6.9 13.0 89.0
Somewhere else 35 5.8 11.0 100.0
Total 318 53.0 100.0
Missing System 282 47.0
Total 600 100.0
7. Where do you browse/conduct most of your research/or see shoes you are going to buy?
Frequency Percent Valid
Percent Cumulative
Percent
Valid In stores when shopping 317 52.8 52.8 52.8
Magazines 36 6.1 6.1 58.9
Retailer Websites 82 13.6 13.6 72.6
Circular/newspaper 32 5.3 5.3 77.9
Social Media 16 2.7 2.7 80.5
rely on friends and family 19 3.2 3.2 83.7
Other 98 16.3 16.3 100.0
Total 600 100.0 100.0
National Footwear Sales ECPS April 4-‐6, 2017 9
8. What is the most important factor when purchasing shoes this spring season?
Frequency Percent Valid
Percent Cumulative
Percent
Valid Cost 178 29.6 29.6 29.6
Need 219 36.6 36.6 66.2
Adding variety to current styles 63 10.4 10.4 76.6
Keeping up with Trends 28 4.7 4.7 81.3
Something else 112 18.7 18.7 100.0
Total 600 100.0 100.0
9. When you buy shoes in stores, what do you like most about the in-‐store shopping experience?
Frequency Percent Valid
Percent Cumulative
Percent
Valid Customer Service 193 32.1 32.1 32.1
Convenience 131 21.8 21.8 53.9
seeing new trends 30 5.0 5.0 58.9
ensuring proper fit 247 41.1 41.1 100.0
Total 600 100.0 100.0
10. When you buy shoes online, what do you most like about shopping online versus buying in-‐store?
Frequency Percent Valid
Percent Cumulative
Percent
Valid Price 127 21.1 21.1 21.1
More choices 105 17.5 17.5 38.6
Convenience 70 11.7 11.7 50.3
seeing new trends 7 1.2 1.2 51.6
do not buy online ever 291 48.4 48.4 100.0
Total 600 100.0 100.0
National Footwear Sales ECPS April 4-‐6, 2017 10
11. What is your biggest concern about buying shoes online?
Frequency Percent Valid
Percent Cumulative
Percent
Valid won't fit 395 65.8 65.8 65.8
look different 34 5.6 5.6 71.4
shipping issues 52 8.7 8.7 80.1
privacy/cyber security 31 5.1 5.1 85.2
Other 89 14.8 14.8 100.0
Total 600 100.0 100.0
12. Do you plan on spending more or less money this Spring compared to last Spring on shoes for
yourself and your family?
Frequency Percent Valid
Percent Cumulative
Percent
Valid Spend more 81 13.5 13.5 13.5
Spend less 309 51.5 51.5 65.0
Spend the same 210 35.0 35.0 100.0
Total 600 100.0 100.0
13. What is the total amount of money you plan on spending on footwear this spring season for yourself
and your family?
Frequency Percent Valid
Percent Cumulative
Percent
Valid <$100 415 69.1 69.1 69.1
$100-$250 135 22.5 22.5 91.7
$250-$500 42 6.9 6.9 98.6
>$500 9 1.4 1.4 100.0
Total 600 100.0 100.0
National Footwear Sales ECPS April 4-‐6, 2017 11
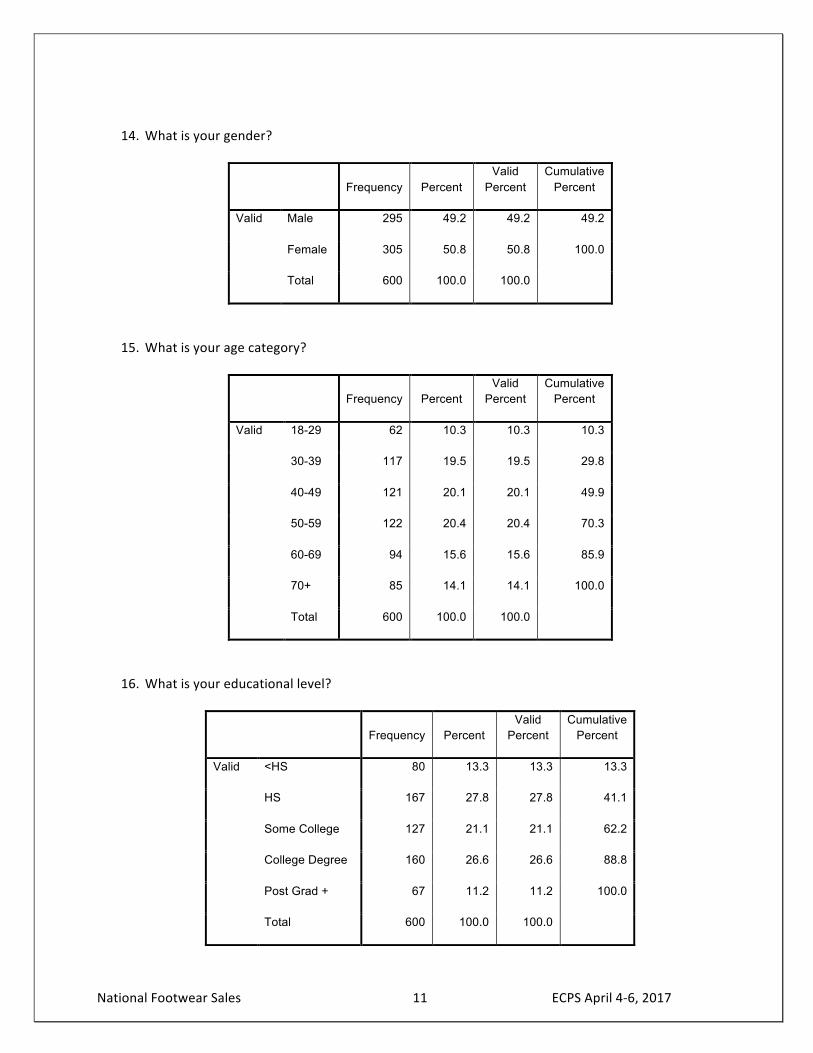
14. What is your gender?
Frequency Percent Valid
Percent Cumulative
Percent
Valid Male 295 49.2 49.2 49.2
Female 305 50.8 50.8 100.0
Total 600 100.0 100.0
15. What is your age category?
Frequency Percent Valid
Percent Cumulative
Percent
Valid 18-29 62 10.3 10.3 10.3
30-39 117 19.5 19.5 29.8
40-49 121 20.1 20.1 49.9
50-59 122 20.4 20.4 70.3
60-69 94 15.6 15.6 85.9
70+ 85 14.1 14.1 100.0
Total 600 100.0 100.0
16. What is your educational level?
Frequency Percent Valid
Percent Cumulative
Percent
Valid <HS 80 13.3 13.3 13.3
HS 167 27.8 27.8 41.1
Some College 127 21.1 21.1 62.2
College Degree 160 26.6 26.6 88.8
Post Grad + 67 11.2 11.2 100.0
Total 600 100.0 100.0
National Footwear Sales ECPS April 4-‐6, 2017 12
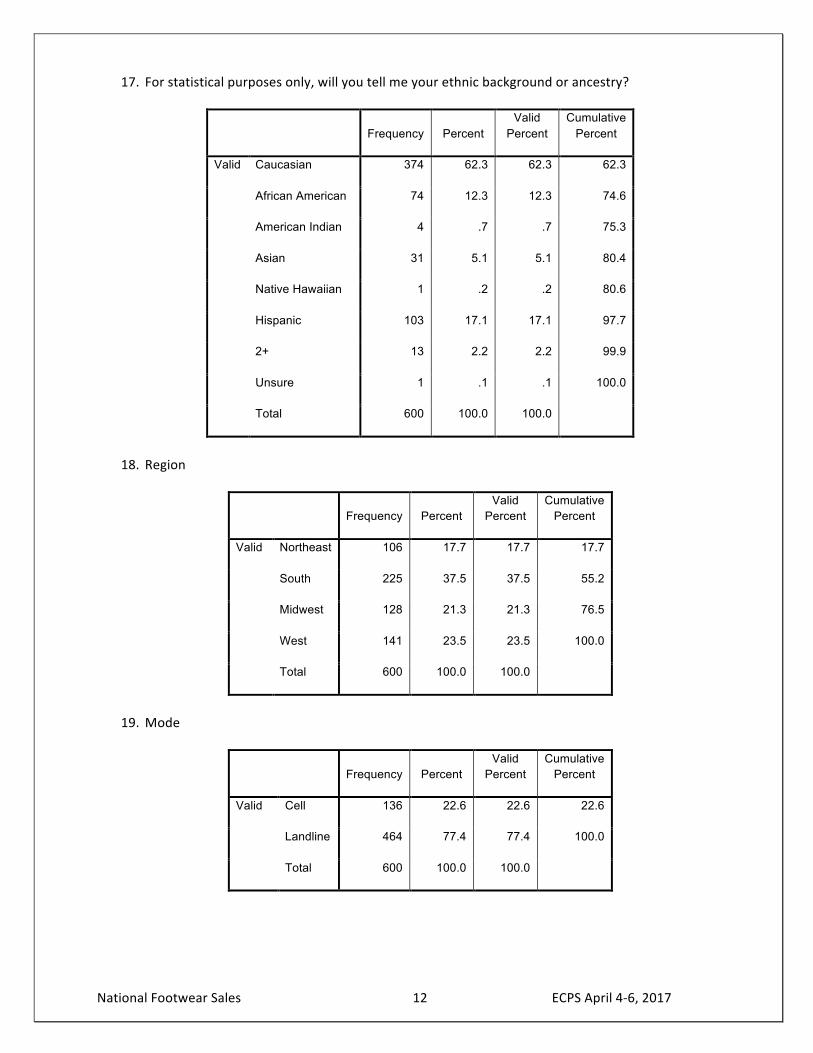
17. For statistical purposes only, will you tell me your ethnic background or ancestry?
Frequency Percent Valid
Percent Cumulative
Percent
Valid Caucasian 374 62.3 62.3 62.3
African American 74 12.3 12.3 74.6
American Indian 4 .7 .7 75.3
Asian 31 5.1 5.1 80.4
Native Hawaiian 1 .2 .2 80.6
Hispanic 103 17.1 17.1 97.7
2+ 13 2.2 2.2 99.9
Unsure 1 .1 .1 100.0
Total 600 100.0 100.0
18. Region
Frequency Percent Valid
Percent Cumulative
Percent
Valid Northeast 106 17.7 17.7 17.7
South 225 37.5 37.5 55.2
Midwest 128 21.3 21.3 76.5
West 141 23.5 23.5 100.0
Total 600 100.0 100.0
19. Mode
Frequency Percent Valid
Percent Cumulative
Percent
Valid Cell 136 22.6 22.6 22.6
Landline 464 77.4 77.4 100.0
Total 600 100.0 100.0
National Footwear Sales ECPS April 4-‐6, 2017 13
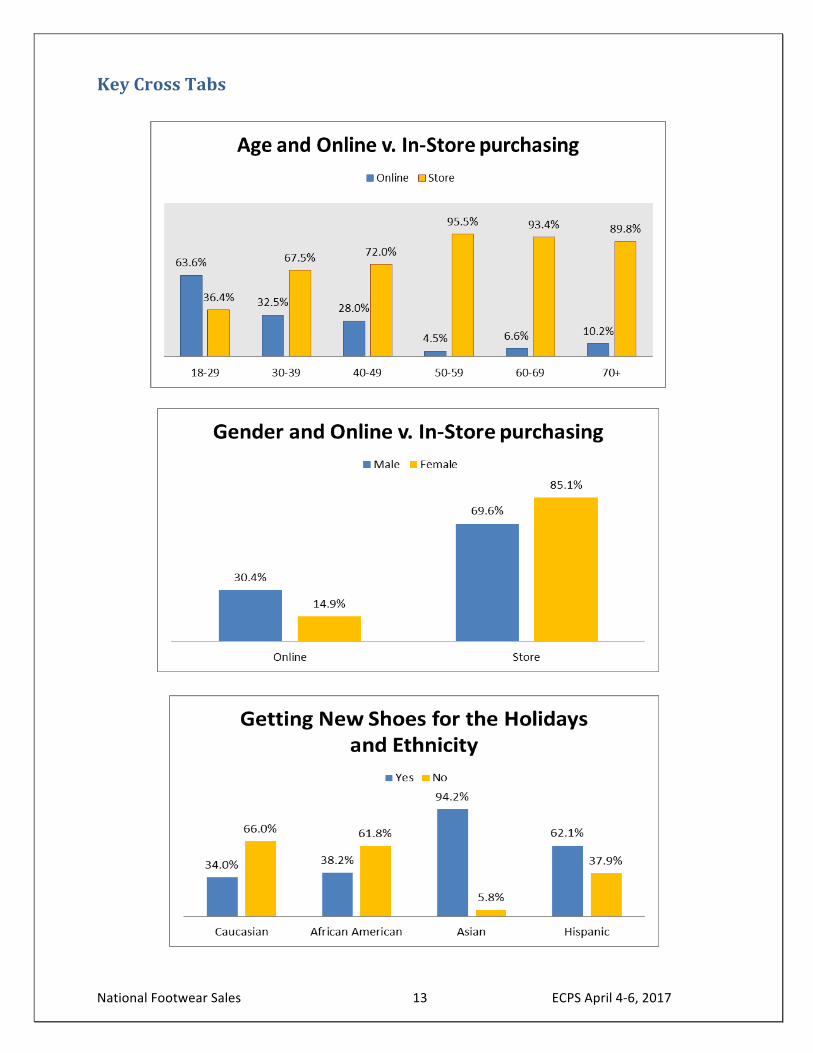
Key Cross Tabs

1319 F Street, NW, Suite 700Washington, DC 20004
the footwear industry’s business and trade association