Embed Size (px)
Citation preview

United StateS Office Of PerSOnnel ManageMent
2017 SES Exit Report
OPM.GOV JULY 2017

Table of ContentsExecutive Summary 1
Key findings 1Background 2
Data Sources and Response Rate 2Analysis 3
SES Separations Trends 4Who participated? 4Why are they leaving? 5Where are they going? 5Work Intentions and Pay 7
SES Retention Considerations 8Stay Factors 8Factors Influencing Decisions to Leave 10
Succession Management 13Performance Management 13Executive Perceptions of Senior Executive Service and Agency 13
Ranking the Executive Core Qualifications 13Executives Recommend the SES 15Executives Recommend Their Agency 15
Conclusion 16Appendices 17
Appendix 1: Figure Descriptions and Data 18Appendix 2: Governmentwide SES Exit Survey Results, Year-Over-Year Comparison 22Appendix 3: Participation by Agency 29Appendix 4: Executive Core Qualifications and Competencies 31Appendix 5: SES Onboarding Survey Instrument 33

List of TablesTable 1. Participant Demographics 4
Table 2. Organizations for Which Departing SES Intend to Work 6
Table 3. Summary of Open Ended Responses – Reasons “Nothing Would Have Encouraged Them to Stay” 8
Table 4. Departing SES Performance Ratings 13
Table 5. Departing SES Rankings of Executive Core Qualifications (ECQs) 14
Table 6. Open Comment Themes: Perceptions of the Senior Executive Service 15
Table 7. Open Comment Themes: Perceptions of the Agency 15
Table 8. Summary – Aspects departing SES liked most about their agencies 16

List of FiguresFigure 1. Circumstances Under Which SES are Leaving 5
Figure 2. SES Intentions to Work for Pay 5
Figure 3. Changes in SES Work Schedule and Salary Expectations Over Time 7
Figure 4. Comparison of Stay Factors By Retirement Status 9
Figure 5. Comparison of Reasons for Leaving Categories by Retirement Status 10
Figure 6. Comparison of Reasons for Leaving by Retirement Status 11
Figure 7. SES Succession Planning Efforts 13
Perceptions of the Senior Executive Service 15
Perceptions of the Agency 15

Executive SummaryIn April 2013, the U.S. Office of Personnel Management (OPM) issued a new exit survey for standard distribution by all agencies across the Federal Government to departing members of the Senior Executive Service (SES). The SES Exit Survey is designed to capture valuable information regarding the circumstances under which senior executives leave the Federal Government and offer an opportunity for executives to provide candid feedback about their work experiences. The data presented are intended to support agency and Governmentwide recruitment, engagement, retention, and succes-sion planning efforts for current and future executives. This Governmentwide report focuses on the analysis of survey responses collected from August 2015 to July 2016, as well as trend data from previous SES Exit reports.
Key findings
• Retirement continues to be the most common reason SES are leaving their agencies. As in previous years, the majority of SES indicated they were leaving their agency due to retirement (61 percent).
• Executives are leaving with intent to continue working, in many cases for higher pay; an increasing number intend to work without any reduction in pay. A cross-year survey comparison of work schedule and salary expectations from Year 1 (2013-14) to Year 3 (2015-16) highlighted that an increasing percentage of departing SES intended to continue to work full-time without taking a cut in pay. And while the percentage of departing SES seeking an increase in pay has remained relatively stable between Year 1 and Year 3, the percentage expecting their pay to decrease has dimin-ished by 8 percentage points.
• Agencies can influence whether or not an executive stays in the organization; however, factors may vary based on retirement eligibility status. Many executives who intend to keep working indicated they would stay for increased pay (39 percent), change in duties or responsibilities (28 percent), increased autonomy (27 percent), and better work-life balance (22 percent). Fewer retirement eligible executives indicated they would stay for these same factors. In addition, executives who leave their agencies to pursue opportunities that do not include retirement were more likely to indicate that the lack of advancement opportunities and recognition contributed greatly or very greatly to their decisions to leave (48 percent vs 34 percent), while executives who retired were more likely to attribute exit decisions to personal reasons (63 percent vs 54 percent).
• Work environment issues continue to be the highest contributing factors in an executive’s decision to leave. Overall, work environment issues such as the “political environment” (42 percent), “organizational culture” (42 percent), and “senior leadership” (40 percent) contributed the most to executives’ decisions to their leaving the agency.
• Formal succession planning is not the norm for senior-level roles. A majority of departing SES (61 percent) said their agencies had no formal succession planning efforts for executives, and more than half (56 percent) said their agency made no efforts to involve them in preparing their successor.
12017 SES Exit Report

BackgroundOPM, in partnership with other agencies, designed the SES Exit Survey to capture valuable information regarding the circumstances under which senior executives leave the Federal Government and offer an opportunity for executives to provide candid feedback about their work experiences and their perspectives of their agencies. The information will enable Federal agencies to have increased awareness of their executives’ work environments and to inform their continued efforts to successfully recruit, manage, and retain their senior leadership workforce. Specifically, this report provides insight on:
• SES separations trends
• Stay factors
• Factors influencing decisions to leave
• Succession management
• Performance management
• Compensation
• Executive perceptions of the Senior Executive Service and agency
Methodology
Data Sources and Response Rate
Data for the OPM SES Exit Survey were gathered via an online survey (see Appendix 5 for the SES Exit Survey). Each agency appoints an agency-wide Point of Contact (POC) who is responsible for distributing the common survey link to departing executives. The survey link is available on an ongoing basis for an indefinite period of time.
This Governmentwide report focuses on the analysis of survey responses collected from August 2015 to July 2016, as well as trend data from the previous reports, covering April 2013 to July 2014 and August 2014 to July 2015. Year-to-year comparisons of results are available in Appendix 2.
A total of 212 members of the SES who were in the process of leaving their agencies responded to the survey. The response rate is difficult to calculate because OPM does not directly distribute the individual surveys to departing exec-utives. OPM conservatively calculated a response rate of 21 percent.1 Since it may not be possible for every member of the SES who leaves an agency to receive the survey link, the actual response rate is expected to be higher than the approximated response rate provided in this report.
2
Collection PeriodAugust 2015 - July 2016
21%
Response Rate
Number of Participants
212
1 The response rate calculation relies on agencies to voluntarily submit data on the number of SES who left the organiza-tion and the number of SES who were provided the Exit Survey link between August 2015 and July 2016. Any data that is not collected through the data call is filled in using EHRI separations data which covers the time period of the report.
2017 SES Exit Report
Analysis
Most of the data collected through the SES Exit Survey consisted of categorical information. OPM used common sta-tistical methods such as frequencies, percentages, and cross-tabulations to analyze these survey items. In some cases, results from previous surveys were used to assess changes over time. Additionally, as described below, OPM grouped some response categories to simplify presentations.
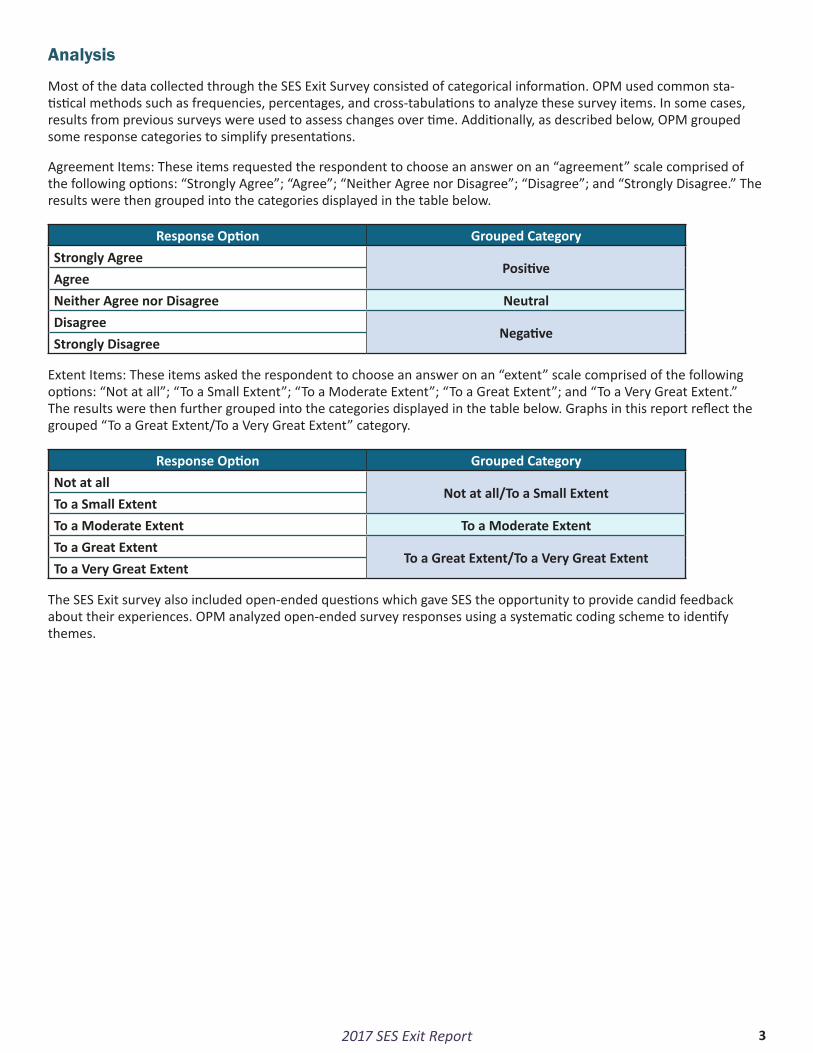
Agreement Items: These items requested the respondent to choose an answer on an “agreement” scale comprised of the following options: “Strongly Agree”; “Agree”; “Neither Agree nor Disagree”; “Disagree”; and “Strongly Disagree.” The results were then grouped into the categories displayed in the table below.
Response Option Grouped CategoryStrongly Agree
PositiveAgreeNeither Agree nor Disagree NeutralDisagree
NegativeStrongly Disagree
Extent Items: These items asked the respondent to choose an answer on an “extent” scale comprised of the following options: “Not at all”; “To a Small Extent”; “To a Moderate Extent”; “To a Great Extent”; and “To a Very Great Extent.” The results were then further grouped into the categories displayed in the table below. Graphs in this report reflect the grouped “To a Great Extent/To a Very Great Extent” category.
Response Option Grouped CategoryNot at all
Not at all/To a Small ExtentTo a Small ExtentTo a Moderate Extent To a Moderate ExtentTo a Great Extent
To a Great Extent/To a Very Great ExtentTo a Very Great Extent
The SES Exit survey also included open-ended questions which gave SES the opportunity to provide candid feedback about their experiences. OPM analyzed open-ended survey responses using a systematic coding scheme to identify themes.
32017 SES Exit Report

SES Separations Trends
Who participated?
A total of 212 members of the SES who were in the process of leaving their agencies responded to the survey. Respondents represented 23 agencies (see Appendix 3 for participation by agency). Participants tended to be older than 50 (79 percent), were career SES (95 percent), and a majority of the respondents indicated their race as White (79 percent). The majority of participants were appointed to their senior positions from a Federal service position (81 percent), and almost half had worked in the agency from which they were separating for more than 20 years (49 percent). Participant demographics are further summarized in Table 1.
Table 1. Participant Demographics
Demographic Category Percentage Demographic Category PercentageAge (N=210) Agency tenure (N=208)Under 30 1% Less than one year 4%30-39 3% 1-3 years 12%40-49 17% 4-5 years 9%50-59 17% 6-10 years 15%60 or older 39% 11-20 years 11%
More than 20 years 49%Demographic Category Percentage Demographic Category PercentageRace/Ethnicity* (N=201) Appointment type (N=209)American Indian or Alaska Native
2% Career 95%
Asian 3% Non-Career 4%Black or African American
17% Limited Term 1%
Native Hawaiian or Other Pacific Islander
1% Limited Emergency 0%
White 79%Hispanic/Latino 10%Demographic Category Percentage Demographic Category PercentageYears in Senior Executive Service (N=186)
Appointed from… (N=197)
Less than one year 10% Federal service position 81%1-3 years 18% Private sector 7%4-5 years 21% State/local government 2%6-10 years 30% Military service 4%11-20 years 17% Academia 1%More than 20 years 5% Reinstatement 1%
Other 7%*Respondents were able to select multiple categories
2017 SES Exit Report 4

Why are they leaving?
Shown in Figure 1, the majority of the executives indicated they were leaving to retire (61 percent), and almost all were doing so voluntarily (98 percent). These percentages have remained relatively stable across all three years of the SES Exit Survey (see Appendix 2 for year-over-year comparisons).
Where are they going?
More departing executives reported they are leaving the workforce permanently than in previous years. The number of members of the SES who indicated they would not be working for pay (31 percent) was higher this year than in previous administrations of the survey (27 percent in 2013-14 and 20 percent in 2014-15). In contrast, 30 percent of the members of the SES departing this year indicated they would be working for pay after leaving their agencies; 15 percent intended
52017 SES Exit Report
* Percentages are rounded and may not add to 100%

to look for work in the near future; and 24 percent were undecided (see Figure 2).
The executives who intend to work in the future responded they are unlikely to pursue Federal employment, even though a large portion (69 percent) indicated they would be willing to work for their agencies in the future either full-time (26 percent) or part-time (20 percent). Thirty-five percent indicated they planned to work for the private sector (not Government contractors), 14 percent planned to work for themselves, and 14 percent planned to work in the not-for-profit sector (see Table 2).
Table 2
Organizations for Which Departing SES Intend to Work
Percentage of Departing SES
Private company, not a Government contractor 35%Non-profit organization 14%Self-employed 14%Government contractor 7%Not sure* 7%State or local government 6%Academia* 6%Another Federal agency* 3%Military* 1%Work as a reemployed annuitant for a Federal agency
1%
Other 6%N=72; only includes those who indicated they would be working or would be looking for work
*Percentages were calculated from an analysis of written “Other” responses
2017 SES Exit Report 6

Work Intentions and Pay
Over half of the departing executives indicated they would be working for increased pay (57 percent), and, in comparison to previous years, more departing executives intend to work full-time (81 percent this year vs 71 percent in 2014-15) without decreasing their salary ( 18 percent this year vs 26 percent in 2014-15). Figure 3 shows a cross-year compar-ison of work schedule and salary expectations among departing members of the SES who intended to seek work. While the percentage of departing members of the SES seeking an increase in pay through other opportunities has remained relatively stable from 2013-14 to 2015-16 (over half), those expecting their pay to stay the same has increased by 10 percentage points, and those expecting a decrease has declined by 8 percentage points.
72017 SES Exit Report

SES Retention ConsiderationsFederal agencies continue to have opportunities to better understand and find ways to retain their senior executives. As noted above, a majority of the departing senior executives indicated they were considering or definitely planning to work; only one-third definitively indicated they were not seeking employment (Figure 1). Agencies have less opportunity to persuade retiring members of the SES to stay. Literature on organizational withdrawal often considers separations due to retirement distinct from other types of voluntary turnover2 -- retirees want to reduce their commitment to employ-ment in general, and place more emphasis on other life roles.3 However, the other executives (non-retirees) are leaving with the intent to continue working, and it would benefit agencies to explore ways to retain those employees.
Stay Factors
As agencies explore ways to retain the members of the SES who intend to work after leaving, they should consider stay factors that are rated highly. Stay factors represent hypothetical changes in work-related circumstances that, if offered, might encourage an executive to stay in their current role. Overall, “increase in pay” was the most frequently endorsed stay factor (34 percent). Non-retirees indicated “change in duties or responsibilities” (28 percent), “increased autonomy” (27 percent), and “better work-life balance” (22 percent) as important stay factors. Retirees indicated “retention incen-tives” (25 percent) and “verbal encouragement to stay based on value to the organization” (22 percent) as top reasons they would have stayed. Considering that almost three-fourths of departing SES (71 percent) said no efforts were made to encourage them to stay, agencies should not underestimate the value of stay interviews as a first step in the process of retaining top executive talent. See Figure 4 for additional comparison results.
However, agencies should not get frustrated if their efforts are not entirely successful because thirty-two percent of departing SES indicated that nothing would have encouraged them to stay, a higher percentage than the previous two years of the survey. Among members of the SES who selected this response option, 69 percent were retiring, 8 percent were resigning, 15 percent were transferring to another agency, and 3 percent were accepting a non-SES position within another Federal agency. These departing executives were also provided the opportunity to explain their answer, and a summary of response themes can be found in Table 3.
Table 3
Summary of Open Ended Responses – Reasons SES Said “Nothing Would Have Encouraged Them to Stay”
Number of Comments
Ready to retire 23Pursuing other career interests 11Work environment issues 4Personal reasons 3Poor leadership 3Disrespectful treatment 2Better compensation 2
2 See, for example: Cho, Y. J. and Lewis, G. B. 2012. “Turnover Intention and Turnover Behavior: Implications forRetaining Federal Employees.” Review of Public Personnel Administration, 32: 4-23. Partnership for Public Service & Booz Allen Hamilton. (2010). Beneath the Surface: Understanding Attrition at Your Agency and Why It Matters. Washington, DC: Partnership for Public Service
3 Schmidt, J. and Lee, K. 2008. “Voluntary Retirement and Organizational Turnover Intentions: The Differential Associations with Work and Non-Work Commitment Constructs.” Journal of Business and Psychology, 22: 297-309
2017 SES Exit Report 8

92017 SES Exit Report
Figure 4. Stay Factor Comparisons By Retirement Status
*Participants were able to select multiple responses

Factors Influencing Decisions to Leave
Work environment issues (e.g., political environment, organizational culture, senior leadership, lack of autonomy) continue to be the most influential reasons for leaving. Departing executives rated the extent to which various elements contributed to their reasons for leaving their agency, and regardless of retirement status, a majority of executives indi-cated at least one work environment element contributed to their decision to leave “to a great extent” or “to a very great extent” (see Figure 5). Other reasons for leaving tended to vary based on retirement status. Executives indicating they were going to continue to work (non-retirees) were generally more likely to rate advancement and recognition (48 percent vs 34 percent), and executives who intended not to work (retirees) generally rated personal reasons (63 percent vs 52 percent) as important factors.
34%
62%
42%
63%
30%
48%
65%
41%
52%
37%
Advancement andRecognition
Work Environment Work-Life Balance Personal Reasons Compensation andBenefits
Figure 5. Comparison of Reasons for Leaving Categories by Retirement Status
Retiree Non-Retiree
The results reinforce the importance of engaging in open and candid conversations with departing executives, as SES in different career stages appear to be leaving for different reasons. Figure 6 provides a more detailed comparison of the factors that had the most impact on the two departing SES subgroups. The largest percentage point gaps were observed for the following reasons: “desire to live life without work commitments” (retirees – 41 percent, non-retirees – 1 percent), “more attractive job offer elsewhere” (non-retirees – 50 percent, retirees – 13 percent), “lack of opportunities for development” (non-retirees – 36 percent, retirees – 10 percent), and “desire to leave the workforce” (retirees – 22 percent, non-retirees – 1 percent).
2017 SES Exit Report 10
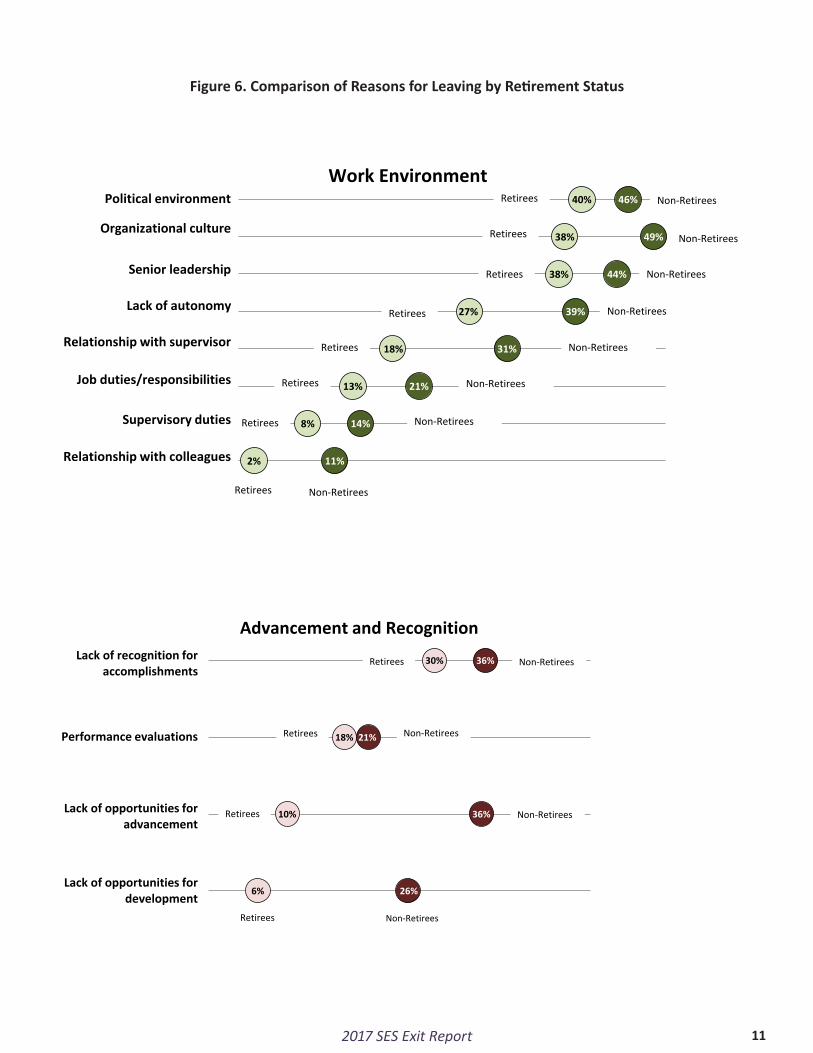
Figure 6. Comparison of Reasons for Leaving by Retirement Status
112017 SES Exit Report
Work Environment40%
38%
38%
27%
18%
13%
8%
2%
46%
49%
44%
39%
31%
21%
14%
11%
Political environment
Organizational culture
Senior leadership
Lack of autonomy
Relationship with supervisor
Job duties/responsibilities
Supervisory duties
Relationship with colleagues
Retirees Non-Retirees
Retirees
Retirees
Retirees
Retirees
Non-Retirees
Retirees
Retirees
Retirees Non-Retirees
Non-Retirees
Non-Retirees
Non-Retirees
Non-Retirees
Non-Retirees
Advancement and Recognition
30%
18%
10%
6%
36%
21%
36%
26%
Retirees
Retirees
Retirees
Retirees
Non-Retirees
Non-Retirees
Non-Retirees
Non-RetireesLack of recognition for accomplishments
Performance evaluations
Lack of opportunities for development
Lack of opportunities for advancement

Figure 6 (continued)
2017 SES Exit Report 12
Personal Reasons
41%
22%
15%
13%
13%
11%
2%
1%
1%
6%
50%
7%
3%
6%
Retirees
Retirees
Retirees
Retirees
Retirees
Retirees
Retirees
Non-Retirees
Non-Retirees
Non-Retirees
Non-Retirees
Non-Retirees
Non-Retirees
Non-RetireesDesire to enjoy life without work commitments
Desire to leave the workforce
More attractive job offer elsewhere
Personal health reasons
Relocation
Care for family member
Desire to pursue education
Work-Life Balance29%
17%
14%
13%
7%
5%
27%
14%
8%
16%
9%
10%
Non-Retirees
Non-Retirees
Non-Retirees
Non-Retirees
Non-Retirees
Non-Retirees
Retirees
Retirees
Retirees
Retirees
Retirees
Retirees
Job stress
Workload
Long work hours
Commute
Work hours not flexible
Geographic assignment
Compensation/Benefits
23%
20%
7%
27%
27%
4%
Retirees
Retirees
Retirees
Non-Retirees
Non-Retirees
Non-Retirees
Unsatisfactory benefits
Insufficient pay
Lack of awards

Succession ManagementA majority of departing SES indicated their agencies have no formal succession planning efforts for executives (61 percent), and over half of departing members of the SES (56 percent) said their agencies made no efforts to involve them in preparing their successors (see Figure 7). Results for these items have been relatively stable across survey admin-istrations (see Appendix 2). Succession management is critical to mission success and creates an effective process for recognizing, developing, and retaining top leadership talent. Agencies are required to develop a comprehensive man-agement succession program to fill agency supervisory and managerial positions (5 CFR 412.101). The exit survey results indicate agencies should focus efforts to ensure smooth transitions in leadership.
61%
Had no formal succession planning efforts for executives
56%
Made no efforts to involve them in preparing their sucessor
Figure 7. SES Succession Planning EffortsDeparting SES reported that their agencies...
Performance ManagementExecutive performance is evaluated on a pay-for-performance system where senior executives are rated each year on a combination of demonstrated leadership through the five Executive Core Qualifications (ECQs) as well as measur-able results. A majority of executives (79 percent) indicated they were rated either “Outstanding” or “Exceeds Fully Successful” on their most recent performance appraisal (see Table 4).
Table 4
Departing SES Performance RatingsPercentage of Departing SES
Outstanding 46%Exceeds Fully Successful 33%Fully Successful 16%Minimally Satisfactory 0%Unsatisfactory 0%I did not receive a performance rating 5%I prefer not to respond -
Executive Perceptions of Senior Executive Service and AgencyIn addition to capturing departing executives’ separation motivations and employment intentions, the Exit Survey provides members of the SES an opportunity to share their perceptions of general aspects of their employment experiences.
132017 SES Exit Report

Ranking the Executive Core Qualifications
The Executive Core Qualifications (ECQs) are leadership skills designated by OPM to evaluate individuals for entrance into the SES and to evaluate their performance. A chart summarizing each ECQ and its competencies can be found in Appendix 4. The survey asked executives to rank the ECQs in order of importance to achieve success in their position (5 = most important for success, 1 = least important for success). Table 5 shows that Leading People received the highest average ranking of the five ECQs, with an average ranking of 3.93. These ratings have remained stable across each itera-tion of the survey.
Table 5. Departing SES Rankings of Executive Core Qualifications (ECQs)
Executive Core Qualification (ECQ)
Average Ranking ECQ Description
Leading People (1) 3.93 This core qualification involves the ability to lead people toward meeting the organization’s vision, mission and goals. Inherent in this ECQ is the ability to provide an inclusive workplace that fosters the development of others, facilitates cooperation and teamwork and supports constructive resolution of conflicts
Results Driven (2) 3.26 This core qualification involves the ability to meet organi-zational goals and customer expectations. Inherent in this ECQ is the ability to make decisions that produce high-quality results by applying technical knowledge, analyzing problems and calculating risks.
Leading Change (3) 3.12 This core qualification involves the ability to bring about strategic change, both within and outside the organiza-tion, to meet organizational goals. Inherent in this ECQ is the ability to establish an organizational vision and to implement it in a continuously changing environment.
Building Coalitions (4) 2.62 This core qualification involves the ability to build coa-litions internally and with other Federal agencies, State and local governments, nonprofit and private sector organizations, foreign governments, or international orga-nizations to achieve common goals.
Business Acumen (5) 2.08 This core qualification involves the ability to manage human, financial and information resources strategically.
2017 SES Exit Report 14

Executives Recommend the SES
A majority of departing members of the SES recommend employment in the SES (63 percent) (see graph below). Departing executives were given an opportunity to explain their opinions, and a sample of positive, neutral, and negative themes are provided in Table 6.
Perceptions of the Senior Executive Service
Positive, 63% Neutral,11%
Negative, 26%
Table 6. Open Comment Themes
Positive Comment Themes Neutral Comment Themes Negative Comment Themes
Rewarding job Rewarding, but under compensated Toxic political environment
Opportunity to make a difference Has pros and cons Insufficient pay for workload/responsibilities
An honor to serve Challenging and not for everyone Unsupportive environmentImpactful work Too bureaucratic
Executives Recommend Their Agency
A majority of departing members of the SES would recommend their agency as a good place to work (63 percent). Departing members of the SES were given an opportunity to explain their opinions, and a sample of positive, neutral, and negative themes are provided in Table 7.
Perceptions of the Agency
Positive, 63% Neutral, 24%Negative,
13%
Table 7. Open Comment Themes
Positive Comment Themes Neutral Comment Themes Negative Comment Themes
Important/worthwhile mission Growing tensions between career and political appointees Too political
Dedicated employees Good agency, limited resources Unfair treatmentGreat place to work Lack of respect for SES
Rewarding work Poor organizational culture
152017 SES Exit Report

Departing members of the SES were also given the opportunity to describe what they liked best about working at their agency. Responses are summarized in Table 8.
Table 8
Summary – Aspects departing SES liked most about their agencies
Number of comments
Mission 43The employees 36Positive impact of work 19Colleagues 14The work itself 12Team-oriented environment 6Supportive leadership 5Sense of organizational commitment 4Autonomy 3Open communication 2Work flexibility 2Geographically dispersed workforce 1Executive training 1Agency size 1Variety of work 1Work-life balance 1Opportunity to learn 1Availability of resources 1
ConclusionWith SES retirement rates remaining high and steady, it is imperative for agencies to understand what they can do to engage and retain top-performing executives, while mitigating factors that cause executives to leave the Federal Government.
2017 SES Exit Report 16

Appendices
172017 SES Exit Report

Appendix 1: Figure Descriptions and Data
Figure 1. Circumstances Under which SES are Leaving
Retirement was the most commonly cited reason for SES departure
Reason for Leaving 2013-14 2014-15 2015-16Retiring 59% 56% 61%Resigning 11% 17% 10%Transferring to another Federal agency
12% 16% 18%
Accepting non-SES position within a Federal agency
2% 5% 4%
Leaving involuntarily 1% 1% 1%Other 14% 6% 5%
N=217 N=224 N=210
Figure 2. SES Intentions to Work for Pay
A majority of departing SES were considering working for pay after leaving their agencies
Will you be working for pay after you leave your agency? PercentageYes 30%No, but I intend to look for employment in the near future 15%No 31%Undecided 24%
Figure 3. Changes in SES Work Schedule and Salary Expectations Over Time
More departing SES intend to work full-time without taking a cut in pay
YearWork Schedule Percentage
2013-14 Full-time 71%Part-time 29%
2015-16 Full-time 81%Part-time 19%
Year Salary Change Percentage2013-14 Increase 59%
Stay the same 15%Decrease 26%
2015-16 Increase 57%Stay the same 25%Decrease 18%
2017 SES Exit Report 18

Figure 4. Stay Factor Comparisons By Retirement Status
Category Stay FactorsPercentage of Retirees
Percentage of Non-Retirees
Compensation Benefits Increase in Pay 28% 39%Performance/Other award 18% 20%Retention Incentive 25% 15%Dual compensation waiver (If retiring)
10%
Student loan repayment 1% 5%Benefits 1% 5%
Increased Authority/Support
Greater engagement from senior leadership
17% 19%
High level position 6% 20%Greater scope of responsibility
2% 15%
Increased autonomy 19% 27%Increased delegation 6% 14%Increased funding/resources
12% 19%
Increased support dealing w/ poor performers
8% 15%
Verbal encouragement to stay
22% 20%
Work-Life Balance Relocation 13% 14%Increased telework opportunity
10% 3%
Flexible/part-time schedule 14% 4%Change in duties/responsibilities
10% 28%
More comprehensive eldercare
2% 1%
Better work-life balance 14% 22%Developmental Opportunities
Mobility assignment 4% 5%Sabbatical 10% 4%Coaching 1% 3%Executive development training
5% 1%
Reassignment to new job w/in agency
10% 15%
192017 SES Exit Report

Figure 5. Comparison of Reasons for Leaving Categories by Retirement Status
CategoryPercentage of Retirees
Percentage of Non-Retirees
Work Environment 62% 65%Advancement and Recognition 34% 48%Personal Reasons 63% 52%Work-Life Balance 42% 41%Compensation and Benefits 30% 37%
Figure 6. Comparison of Reasons for Leaving by Retirement Status
Category Reason for LeavingPercentage of Retirees
Percentage of Non-Retirees
Work environment Political environment 40% 46%Organizational culture 38% 49%Senior leadership 38% 44%Lack of autonomy 27% 39%Relationship w/ supervisor 18% 31%Job duties/responsibilities 13% 21%Supervisory duties 8% 14%Relationship w/ colleagues 2% 11%
Advancement/recognition Lack of rec for accomplishments 30% 36%Performance evaluations 18% 21%Lack of opportunities for advancement
10% 36%
Lack of opportunities for development
6% 26%
Personal reasons Desire to enjoy life without work commitments
41% 1%
Desire to leave workforce 22% 1%Personal reasons health 15% 6%More attractive job offer elsewhere 13% 50%Relocation 13% 7%Care for family member 11% 3%Desire to pursue education 2% 6%
W-L Balance Job stress 29% 27%Workload 17% 14%Long work hours 14% 8%Commute 13% 16%Work hours not flexible 7% 9%Geographic assignment 5% 10%
Compensation/Benefits Lack of awards 23% 27%Insufficient pay 20% 27%Unsatisfactory benefits 7% 4%
2017 SES Exit Report 20

Figure 7. SES Succession Planning Efforts
Departing SES reported that...
Their agency had formal succession planning efforts for executives PercentageNo 61%Yes 39%
They were involved in preparing their successor PercentageNo 56%Yes 44%
212017 SES Exit Report

Appendix 2: Governmentwide SES Exit Survey Results, Year-Over-Year Comparison
Which of the following best describes the circumstances under which you are leaving your agency?
2013-2014
2014-2015
2015-2016
I am retiring 59% 56% 61%I am resigning 11% 17% 10%I am transferring to another Federal agency 12% 16% 18%I am accepting a non-SES position within a Federal agency 2% 5% 4%I am leaving involuntarily 1% 1% 1%Other 14% 6% 5%
N=217 N=224 N=210
I am retiring:2013-2014
2014-2015
2015-2016
Voluntarily 97% 93% 98%Involuntarily (Mandatory Retirement) 2% 5% 1%Involuntarily for reasons other than Mandatory Retirement 2% 2% 2%
N=128 N=120 N=129
Will you be working for pay after you leave your agency?2013-2014
2014-2015
2015-2016
Yes 35% 37% 30%No, but I intend to look for employment in the near future 14% 19% 15%No 27% 20% 31%Undecided 24% 24% 24%
N=169 N=160 N=158
Which of the following best describes the type of organization you will be working for after you leave your agency:
2013-2014
2014-2015
2015-2016
Government contractor 10% 14% 7%Private company, not a Government contractor 33% 33% 35%Self-employed 21% 13% 14%State or local government 6% 8% 6%Non-profit organization 16% 11% 14%Work as a reemployed annuitant for a Federal agency 5% 2% 1%Other 9% 20% 24%
N=81 N=86 N=72
Will you be working full-time or part-time?2013-2014
2014-2015
2015-2016
Full-Time 71% 78% 81%Part-Time 29% 22% 19%
N=111 N=125 N=118
2017 SES Exit Report 22
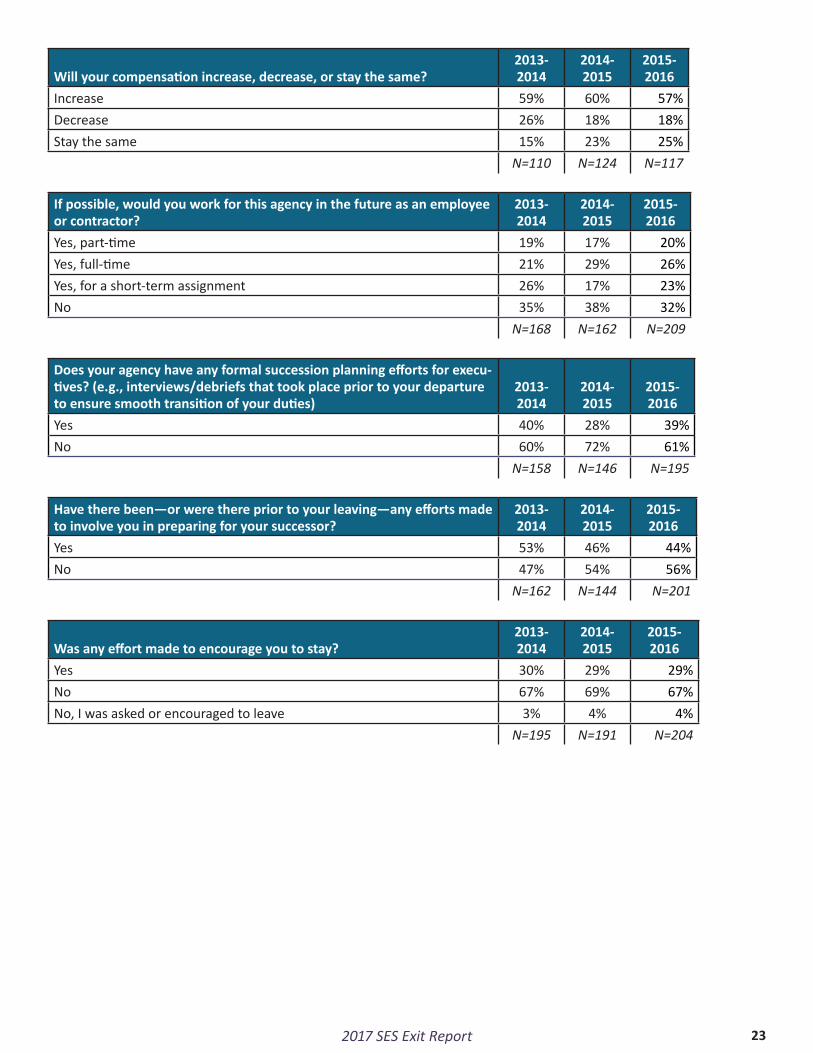
Will your compensation increase, decrease, or stay the same?2013-2014
2014-2015
2015-2016
Increase 59% 60% 57%Decrease 26% 18% 18%Stay the same 15% 23% 25%
N=110 N=124 N=117
If possible, would you work for this agency in the future as an employee or contractor?
2013-2014
2014-2015
2015-2016
Yes, part-time 19% 17% 20%Yes, full-time 21% 29% 26%Yes, for a short-term assignment 26% 17% 23%No 35% 38% 32%
N=168 N=162 N=209
Does your agency have any formal succession planning efforts for execu-tives? (e.g., interviews/debriefs that took place prior to your departure to ensure smooth transition of your duties)
2013-2014
2014-2015
2015-2016
Yes 40% 28% 39%No 60% 72% 61%
N=158 N=146 N=195
Have there been—or were there prior to your leaving—any efforts made to involve you in preparing for your successor?
2013-2014
2014-2015
2015-2016
Yes 53% 46% 44%No 47% 54% 56%
N=162 N=144 N=201
Was any effort made to encourage you to stay?2013-2014
2014-2015
2015-2016
Yes 30% 29% 29%No 67% 69% 67%No, I was asked or encouraged to leave 3% 4% 4%
N=195 N=191 N=204
232017 SES Exit Report

Stay Factor Categories
Stay Factors2013-2014
2014-2015
2015-2016
Compensation/Benefits Increase in Pay 37% 41% 34%Performance/Other award 24% 26% 19%Retention Incentive 20% 23% 22%Dual compensation waiver (if retiring) 10% 6% 7%Student loan repayment 2% 3% 3%Benefits 5% 4% 3%
Increased Authority/Support Greater engagement from senior leadership
22% 28% 18%
High level position 12% 14% 12%Greater scope of responsibility 12% 16% 7%Increased autonomy in decision making 21% 31% 23%Increased delegation of authority 14% 20% 9%Increased funding/resources 17% 16% 15%Increased support dealing with poor performers
10% 19% 11%
Verbal encouragement to stay based on your value to the organization
24% 29% 22%
Work-Life Balance Relocation to a geographical location of your choice
9% 11% 14%
Increased telework opportunity 9% 9% 7%Flexible/part-time schedule 16% 15% 10%Change in duties/responsibilities 15% 17% 17%More comprehensive eldercare options 2% 2% 2%Better work-life balance 23% 24% 17%
Developmental Opportunities Mobility assignment 9% 7% 5%Sabbatical 9% 8% 8%Coaching 6% 8% 2%Executive development training 5% 9% 6%Reassignment to new job within agency 10% 14% 12%
N=173 N=167 N=191
2017 SES Exit Report 24

Reasons for Leaving Categories Reasons for Leaving
2013-2014
2014-2015
2015-2016
Work environment Political environment 42% 42% 42%Organizational culture 38% 37% 42%Senior leadership 38% 43% 40%Lack of autonomy in decision making 26% 33% 32%Relationship with supervisor 24% 25% 23%Job duties/responsibilities 16% 17% 16%Supervisory duties/responsibilities 14% 9% 10%Relationship with colleagues 5% 9% 6%
Advancement/recognition Lack of recognition for accomplishments 34% 35% 32%Performance evaluations 20% 27% 19%Lack of opportunities for advancement 22% 26% 20%Lack of opportunities for development 15% 19% 14%
Work-Life Balance Job stress 30% 31% 28%Workload 17% 20% 16%Long work hours 17% 14% 12%Commute 17% 13% 14%Work hours not flexible 12% 10% 8%Geographic assignment 11% 9% 7%
Personal reasons Desire to enjoy life without work commitments 38% 24% 26%Desire to leave workforce 19% 13% 14%Personal reasons/health 9% 12% 11%More attractive job offer elsewhere 30% 34% 28%Relocation 20% 14% 11%Care for family member 13% 8% 8%Desire to pursue education 6% 1% 7%
Compensation/Benefits Lack of awards 27% 25% 24%Insufficient pay 29% 21% 23%Unsatisfactory benefits 6% 5% 6%
N=146-161
N=149-160
N=165-186
252017 SES Exit Report

What performance rating (or equivalent) did you receive on your last performance appraisal?
2013-2014
2014-2015
2015-2016
Outstanding 45% 43% 46%Exceeds Fully Successful 39% 34% 33&Fully Successful 11% 13% 16%Minimally Satisfactory 0% 2% 0%Unsatisfactory 0% 1% 0%I did not receive a performance rating 5% 7% 5%I prefer not to respond - - -
N=179 N=175 N=212
To what extent do you agree or disagree that this rating was a reflection of your performance?
2013-2014
2014-2015
2015-2016
Strongly Agree 41% 43% 45%Agree 33% 27% 28%Neither Agree nor Disagree 9% 6% 8%Disagree 9% 10% 9%Strongly Disagree 8% 14% 10%I prefer not to respond - - -
N=170 N=162 N=199
Please rank the following Executive Core Qualifications (ECQs) in order of importance to achieve success in your position.
(Ratings averaged; 5= most important, 1= least important)2013-2014
2014-2015
2015-2016
Leading Change 2.99 3.12 3.12Leading People 3.82 3.81 3.93Results Driven 3.38 3.26 3.26Business Acumen 2.05 2.17 2.08Building Coalitions 2.79 2.7 2.62
N=169-171
N=163-165
N=198-201
I would recommend employment in the Senior Executive Service to others.
2013-2014
2014-2015
2015-2016
Positive 62% 54% 63%
Neutral 25% 25% 24%Negative 13% 21% 13%
N=169 N=163 N=207
I would recommend this agency to others as a good place to work.2013-2014
2014-2015
2015-2016
Positive 63% 57% 63%Neutral 15% 16% 11%Negative 23% 27% 26%
N=167 N=160 N=210
2017 SES Exit Report 26

How long have you worked in this agency?2013-2014
2014-2015
2015-2016
Less than one year 1% 3% 4%1-3 years 13% 14% 12%4-5 years 14% 16% 9%6-10 years 12% 11% 15%11-20 years 12% 14% 11%More than 20 years 47% 44% 49%
N=164 N=161 N=208
How long have you been a member of the Senior Executive Service?2013-2014
2014-2015
2015-2016
Less than one year 11% 7% 10%1-3 years 16% 24% 18%4-5 years 13% 19% 21%6-10 years 28% 31% 30%11-20 years 23% 11% 17%More than 20 years 9% 8% 5%
N=159 N=140 N=186
What is your age group?2013-2014
2014-2015
2015-2016
Under 30 2% 1% 1%30-39 4% 8% 3%40-49 9% 16% 17%50-59 42% 34% 40%60 or older 43% 42% 39%
N=166 N=159 N=210
What type of appointment do you hold?2013-2014
2014-2015
2015-2016
Career 88% 87% 95%Non-Career 10% 10% 4%Limited Term 3% 3% 1%Limited Emergency 0% 0% 0%
N=168 N=156 N=209
272017 SES Exit Report

From where were you appointed to your senior position?2013-2014
2014-2015
2015-2016
From a Federal service position 83% 76% 81%From the private sector 6% 9% 7%From State or local government 1% 3% 2%From military service 2% 6% 4%From academia 3% 1% 1%Reinstatement 1% 1% 1%Other 6% 4% 7%
N=163 N=146 N=197
Please select the racial category or categories with which you most closely identify *select all that apply
2013-2014
2014-2015
2015-2016
American Indian or Alaska Native 2% 3% 2%Asian 6% 7% 3%Black or African American 12% 15% 17%Native Hawaiian or Other Pacific Islander 0% 2% 1%White 82% 79% 79%
N=162 N=158 N=201
Are you Hispanic or Latino?2013-2014
2014-2015
2015-2016
Yes 7% 7% 10%No 93% 94% 90%
N=162 N=154 N=201
2017 SES Exit Report 28

Appendix 3: Participation by Agency
Agency Frequency PercentageDepartment of Agriculture 9 4%Department of Commerce 0 0%Department of Defense 14 7%Department of Education 1 >1%Department of Energy 12 6%Department of Health and Human Services 3 1%Department of Homeland Security 33 16%Department of Housing and Urban Development 2 1%Department of Justice 14 7%Department of Labor 4 2%Department of State 3 1%Department of the Interior 7 3%Department of the Treasury 18 8%Department of Transportation 5 2%Department of Veterans Affairs 35 17%Broadcasting Board of Governors 0 0%Environmental Protection Agency 4 2%Equal Employment Opportunity Commission 5 2%Federal Communications Commission 3 1%Federal Energy Regulatory Commission 0 0%Federal Trade Commission 0 0%General Services Administration 8 4%National Aeronautics and Space Administration 0 0%National Archives and Records Administration 4 2%National Labor Relations Board 0 0%National Science Foundation 0 0%Nuclear Regulatory Commission 11 5%Office of Management and Budget 0 0%Office of Personnel Management 1 >1%Office of the U.S. Trade Representative 0 0%Small Business Administration 1 >1%Social Security Administration 0 0%U.S. Agency for International Development 1 >1%Railroad Retirement Board 0 0%U.S. Office of Government Ethics 0 0%National Transportation Safety Board 0 0%
N=212
292017 SES Exit Report

Do you work in an Office of the Inspector General? Frequency PercentageYes 10 5%No 196 95%
2017 SES Exit Report 30
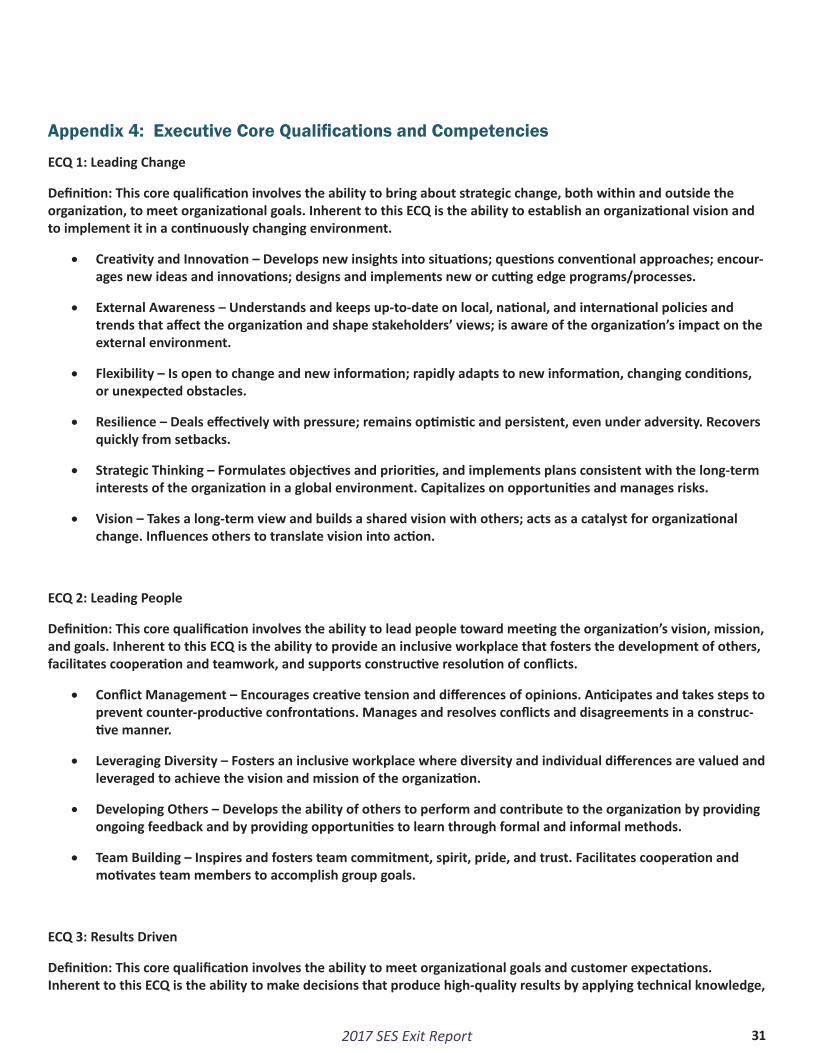
Appendix 4: Executive Core Qualifications and Competencies
ECQ 1: Leading Change
Definition: This core qualification involves the ability to bring about strategic change, both within and outside the organization, to meet organizational goals. Inherent to this ECQ is the ability to establish an organizational vision and to implement it in a continuously changing environment.
• Creativity and Innovation – Develops new insights into situations; questions conventional approaches; encour-ages new ideas and innovations; designs and implements new or cutting edge programs/processes.
• External Awareness – Understands and keeps up-to-date on local, national, and international policies and trends that affect the organization and shape stakeholders’ views; is aware of the organization’s impact on the external environment.
• Flexibility – Is open to change and new information; rapidly adapts to new information, changing conditions, or unexpected obstacles.
• Resilience – Deals effectively with pressure; remains optimistic and persistent, even under adversity. Recovers quickly from setbacks.
• Strategic Thinking – Formulates objectives and priorities, and implements plans consistent with the long-term interests of the organization in a global environment. Capitalizes on opportunities and manages risks.
• Vision – Takes a long-term view and builds a shared vision with others; acts as a catalyst for organizational change. Influences others to translate vision into action.
ECQ 2: Leading People
Definition: This core qualification involves the ability to lead people toward meeting the organization’s vision, mission, and goals. Inherent to this ECQ is the ability to provide an inclusive workplace that fosters the development of others, facilitates cooperation and teamwork, and supports constructive resolution of conflicts.
• Conflict Management – Encourages creative tension and differences of opinions. Anticipates and takes steps to prevent counter-productive confrontations. Manages and resolves conflicts and disagreements in a construc-tive manner.
• Leveraging Diversity – Fosters an inclusive workplace where diversity and individual differences are valued and leveraged to achieve the vision and mission of the organization.
• Developing Others – Develops the ability of others to perform and contribute to the organization by providing ongoing feedback and by providing opportunities to learn through formal and informal methods.
• Team Building – Inspires and fosters team commitment, spirit, pride, and trust. Facilitates cooperation and motivates team members to accomplish group goals.
ECQ 3: Results Driven
Definition: This core qualification involves the ability to meet organizational goals and customer expectations. Inherent to this ECQ is the ability to make decisions that produce high-quality results by applying technical knowledge,
312017 SES Exit Report

analyzing problems, and calculating risks.
• Accountability – Holds self and others accountable for measurable high-quality, timely, and cost-effective results. Determines objectives, sets priorities, and delegates work. Accepts responsibility for mistakes. Complies with established control systems and rules.
• Customer Service – Anticipates and meets the needs of both internal and external customers. Delivers high-quality products and services; is committed to continuous improvement.
• Decisiveness – Makes well-informed, effective, and timely decisions, even when data are limited or solutions produce unpleasant consequences; perceives the impact and implications of decisions.
• Entrepreneurship – Positions the organization for future success by identifying new opportunities; builds the organization by developing or improving products or services. Takes calculated risks to accomplish organiza-tional objectives.
• Problem Solving – Identifies and analyzes problems; weighs relevance and accuracy of information; generates and evaluates alternative solutions; makes recommendations.
• Technical Credibility – Understands and appropriately applies principles, procedures, requirements, regula-tions, and policies related to specialized expertise.
ECQ 4: Business Acumen
Definition: This core qualification involves the ability to manage human, financial, and information resources strategically.
• Financial Management – Understands the organization’s financial processes. Prepares, justifies, and admin-isters the program budget. Oversees procurement and contracting to achieve desired results. Monitors expenditures and uses cost-benefit thinking to set priorities.
• Human Capital Management – Builds and manages workforce based on organizational goals, budget consid-erations, and staffing needs. Ensures that employees are appropriately recruited, selected, appraised, and rewarded; takes action to address performance problems. Manages a multi-sector workforce and a variety of work situations.
• Technology Management – Keeps up-to-date on technological developments. Makes effective use of tech-nology to achieve results. Ensures access to and security of technology systems.
ECQ 5: Building Coalitions
Definition: This core qualification involves the ability to build coalitions internally and with other Federal agencies, State and local governments, nonprofit and private sector organizations, foreign governments, or international organi-zations to achieve common goals.
• Partnering – Develops networks and builds alliances; collaborates across boundaries to build strategic relation-ships and achieve common goals.
• Political Savvy – Identifies the internal and external politics that impact the work of the organization. Perceives organizational and political reality and acts accordingly.
• Influencing/Negotiating – Persuades others; builds consensus through give and take; gains cooperation from others to obtain information and accomplish goals.
2017 SES Exit Report 32

Appendix 5: SES Onboarding Survey Instrument
U.S. Office of Personnel Management
SES Exit Survey
Dear Executive,
OPM is conducting a Governmentwide exit survey for all departing SES members. The survey will be used to capture information regarding the circumstances under which you are choosing to leave your agency, and offer an opportunity for you to provide candid and confidential feedback about your work experience. This information will be used to support agency and governmentwide reten-tion and succession planning efforts for current and future executives.
The survey will take approximately 15 minutes to complete. Your participation is voluntary and your responses are anonymous. Only aggregated information will be reported.
Thank you for your participation. Your input is valued and appreciated. If you have any questions, please contact the OPM Training and Executive Development office at [email protected].
This survey should take approximately 15 minutes to complete. Participation is voluntary and your responses are anonymous. Only aggregated information will be reported.
As you complete the survey, a bar at the bottom of each page will indicate your progress. When navigating through the survey, please use the buttons on the bottom of the survey pages and not your browser Back or Forward buttons.
If you have any questions, please contact the OPM Training and Executive Development office at [email protected].
1. Which of the following best describes the circumstances under which you are leaving your agency?
o I am retiring. If they choose this answer, the next 3 options are provided for them to answer
o Voluntarily
o Involuntarily (Mandatory Retirement). —branch to #8
o Involuntarily for reasons other than Mandatory Retirement. —branch to #8
o I am resigning.
o I am transferring to another Federal agency.—branch to #4
o I am accepting a non-SES position within a Federal agency.—branch to #4
o I am leaving involuntarily. —branch to #8
o Other. Please specify: ___________________________________
2. Will you be working for pay after you leave your agency?
o Yes
o No, but I intend to look for employment in the near future
332017 SES Exit Report

o No—branch to #6
o Undecided—branch to #6
3. Which of the following best describes the type of organization you will be working for after you leave your agency:
o Government contractor
o Private company, not a Government contractor
o Self-employed
o State or local government
o Non-profit organization
o Work as a reemployed annuitant for a Federal agency. If they choose this answer, the next 3 options are provided for them to answer
o With a dual compensation waiver
o Without a dual compensation waiver
o Under phased retirement options
o Other. Please specify: ___________________________________
4. Will you be working full-time or part-time?
o Full-Time
o Part-Time
5. Will your compensation increase, decrease, or stay the same?
o Increase
o Decrease
o Stay the same
6. Was any effort made to encourage you to stay?
o Yes. Please explain: ______________________________________
o No
o No, I was asked or encouraged to leave—branch to #8
7. What, if anything, would have encouraged you to stay? Select all that apply.
Work-Life Balance
2017 SES Exit Report 34

o Relocation to a geographical location of your choice
o Increased telework opportunity
o Flexible or part-time schedule
o A change in job duties/responsibilities
o More comprehensive eldercare options
o Better work-life balance
Increased Authority/Support
o Greater engagement from senior leadership
o Higher level position
o Greater scope of responsibility
o Increased autonomy in decision making
o Increased delegation of authority
o Increased funding/resources
o Increased support in dealing with poor performers
o Verbal encouragement to stay based on your value to the organization
Developmental Opportunity
o Mobility assignment
o Sabbatical
o Coaching
o Executive development training
o Reassignment to a new job within the agency
Compensation and Benefits
o Increase in pay
o Performance or other award
o Retention incentive
o Dual compensation waiver (if retiring)
o Student loan repayment
o Benefits
o Other. Please specify: ________________________________
o Nothing would have encouraged me to stay. Please explain:____________________________________—if selected, can’t select anything else.
352017 SES Exit Report

8. To what extent did each of the following contribute to your reasons for leaving the agency?
Scale: 1 - Not at all
2 - To a Small Extent
3- To a Moderate Extent
4 - To a Great Extent
5 - To a Very Great Extent
NA - Not Applicable
Advancement and Recognition
o Lack of opportunities for development 1 2 3 4 5 NA
o Lack of opportunities for advancement 1 2 3 4 5 NA
o Lack of recognition for accomplishments 1 2 3 4 5 NA
o Performance evaluations 1 2 3 4 5 NA
Work Environment
o Senior leadership 1 2 3 4 5 NA
o Political environment 1 2 3 4 5 NA
o Organizational culture 1 2 3 4 5 NA
o Job duties/responsibilities 1 2 3 4 5 NA
o Supervisory duties/responsibilities 1 2 3 4 5 NA
o Relationship with supervisor 1 2 3 4 5 NA
o Relationship with colleagues 1 2 3 4 5 NA
o Lack of autonomy in decision making 1 2 3 4 5 NA
Work-Life Balance
o Geographic reassignment 1 2 3 4 5 NA
o Long work hours 1 2 3 4 5 NA
o Work hours not flexible 1 2 3 4 5 NA
o Workload 1 2 3 4 5 NA
o Job stress
o Commute 1 2 3 4 5 NA
Personal Reasons
o More attractive job offer elsewhere 1 2 3 4 5 NA
o Desire to pursue education 1 2 3 4 5 NA
2017 SES Exit Report 36

o Relocation 1 2 3 4 5 NA
o Personal health reasons 1 2 3 4 5 NA
o Care for a family member 1 2 3 4 5 NA
o Desire to leave the workforce 1 2 3 4 5 NA
o Desire to enjoy life without work commitments
1 2 3 4 5 NA
Compensation and Benefits
o Insufficient pay 1 2 3 4 5 NA
o Unsatisfactory benefits 1 2 3 4 5 NA
o Lack of Awards 1 2 3 4 5 NA
9. Please describe your most important reason for leaving. ____________________________________
10. What performance rating (or equivalent) did you receive on your last performance appraisal?
o Outstanding
o Exceeds fully successful
o Fully successful
o Minimally satisfactory
o Unsatisfactory
o I did not receive a performance rating—branch to #12
o I prefer not to respond.
11. To what extent do you agree or disagree that this rating was a reflection of your performance?
o Strongly Agree
o Agree
o Neither Agree nor Disagree
o Disagree
o Strongly Disagree
o I prefer not to respond
12. Please rank the following Executive Core Qualifications (ECQs) in order of importance to achieve success in your position? 1= Most Important for Success; 5 = Least Important for Success
o Leading Change
372017 SES Exit Report

o Leading People
o Results Driven
o Business Acumen
o Building Coalitions
13. I would recommend this agency to others as a good place to work.
o Strongly Agree
o Agree
o Neither Agree nor Disagree
o Disagree
o Strongly Disagree
13a. Please explain your answer______________________________________________
14. I would recommend employment in the Senior Executive Service to others.
o Strongly Agree
o Agree
o Neither Agree nor Disagree
o Disagree
o Strongly Disagree
14a. Please explain your answer______________________________________________
15. If possible, would you work for this agency in the future as an employee or contractor?
o Yes, part-time.
o Yes, full-time.
o Yes, for a short-term assignment.
o No.
The reporting of demographic information is optional and will only be reported to agencies in an aggregated format.
16. What type of agency do you work for? (A list of agencies will be provided)
2017 SES Exit Report 38

o Cabinet Level Agency
o Please select your agency.
o Independent Agency
o Please select your agency.
16a. Do you work in an Office of the Inspector General?
o Yes
o No
16b.If you do not see your agency in the previous lists, please provide the name
of your agency below. ___________________________________________
17. How long have you worked in this agency?
o Less than one year
o 1-3 years
o 4-5 years
o 6-10 years
o 11-20 years
o More than 20 years
18. How long have you been a member of the Senior Executive Service?
o Less than one year
o 1-3 years
o 4-5 years
o 6-10 years
o 11-20 years
o More than 20 years
19. What is your age group?
o Under 30
o 30-39
o 40-49
o 50-59
392017 SES Exit Report

o 60 or older
20. What type of appointment do you hold?
o Career
o Non-Career
o Limited Term
o Limited Emergency
21. From where were you appointed to your senior position?
o From a Federal service position
o From the private sector
o From state or local government
o From military service
o From academia
o Reinstatement
o Other. Please specify:__________________
22. Please select the racial category or categories with which you most closely identify (mark as many as apply).
o American Indian or Alaska Native
o Asian
o Black or African American
o Native Hawaiian or Other Pacific Islander
o White
23. Are you Hispanic or Latino?
o Yes
o No
24. Does your agency have any formal succession planning efforts for executives? (e.g., interviews/debriefs that took place prior to your departure to ensure smooth transition of your duties)
o Yes
o No
25. Have there been—or were there prior to your leaving—any efforts made to involve you in preparing your successor?
2017 SES Exit Report 40

o Yes
o No
26. If given the opportunity, what would you have changed at your agency, in the Federal Government, or the SES?
27. What did you like best about working in your agency?
28. Please provide any other comments:
** If you are interested in serving as a mentor after your departure from the organization, please contact OPM’s Executive Resources office at 202-606-8046 or by email at [email protected].
412017 SES Exit Report

U.S. Office of Personnel Management
Work-Life & Leadership and Executive Development
1900 E Street, NW, Washington, DC 20415
OPM.GOV
SESPM-WLLED-02925-07-17