Embed Size (px)
Citation preview
THE STATE OF SENIOR LIVING & SENIOR LIVING CAPITAL MARKETS 2017
2017 SENIOR LIVING SYMPOSIUM
DAN HERMANNHead of Investment BankingZiegler
LISA MCCRACKENSenior Vice PresidentZiegler
KEITH ROBERTSONManaging DirectorZiegler
B.C. Ziegler and Company | Member of SIPC & FINRA
PRESENTED BY:
March 16, 2017
2
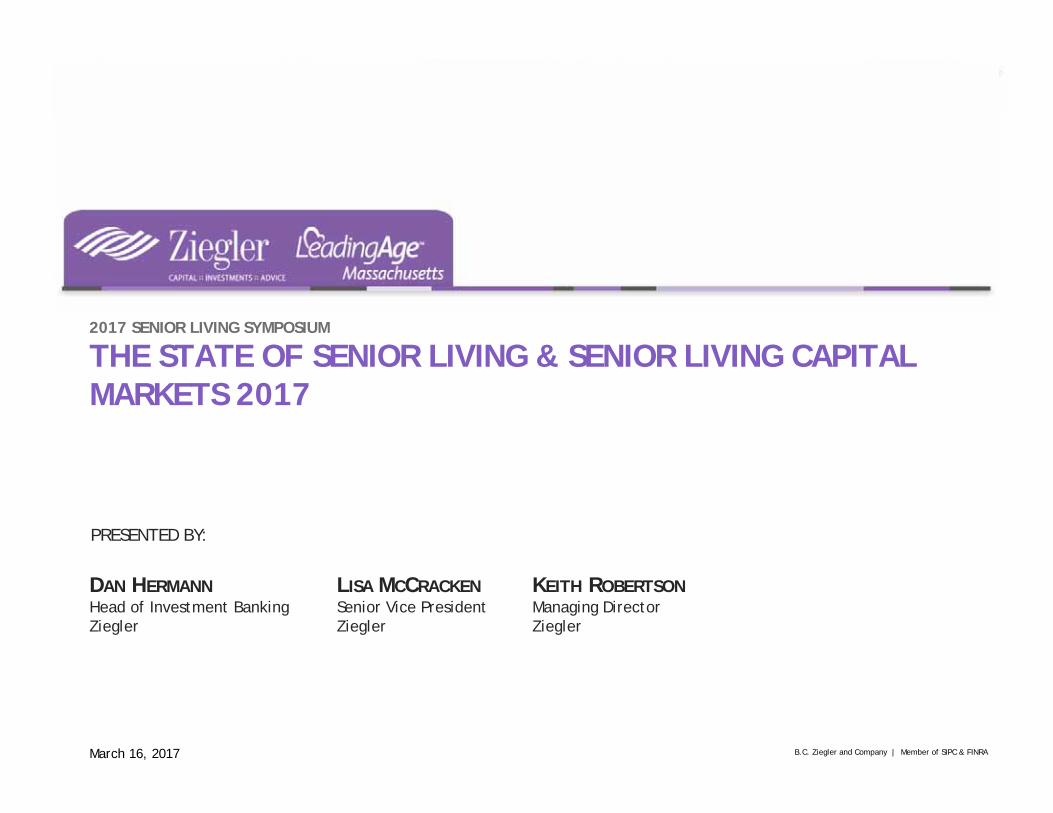
Ziegler is one of the nation’s oldest and largest investment banking firms serving healthcare providers• Full service financial services firm• Founded in 1902 with a focus on
healthcare since 1928– Celebrated 115 years of service in 2017
– Over 270 professionals and support staff dedicated to serving our clients
• National presence, demonstrated execution expertise and broad-based experience
• Strong underwriting and sales & trading capabilities.
– Primary and secondary market efforts focused exclusively on muni sector
• Ziegler’s mission is to provide tailored financial solutions
• Ziegler’s goal is to be our client’s trusted advisor and partner
THE ZIEGLER COMPANIES, INC.
3
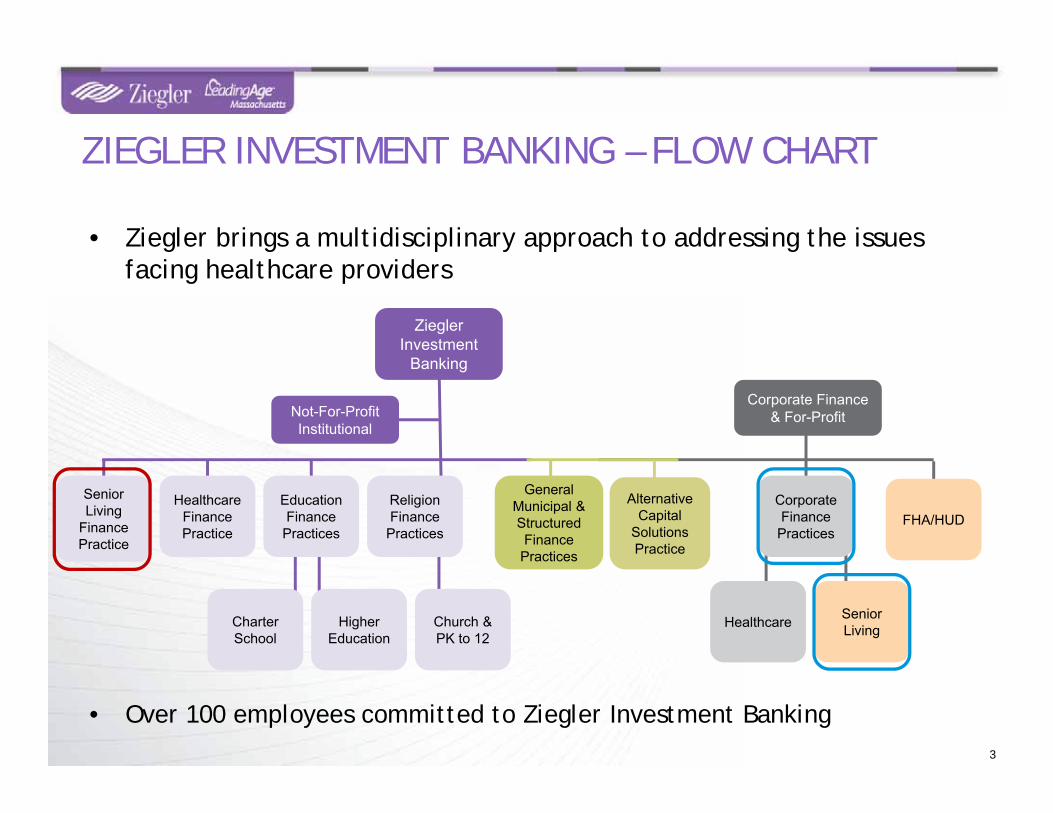
• Over 100 employees committed to Ziegler Investment Banking
• Ziegler brings a multidisciplinary approach to addressing the issues facing healthcare providers
ZIEGLER INVESTMENT BANKING – FLOW CHART
Ziegler Investment
Banking
Senior Living
Finance Practice
Not-For-Profit Institutional
Healthcare Finance Practice
Charter School
Higher Education
EducationFinance
Practices
ReligionFinance
Practices
Church & PK to 12
General Municipal &Structured Finance
Practices
Healthcare
Corporate Finance & For-Profit
CorporateFinance
Practices
AlternativeCapital
Solutions Practice
Senior Living
FHA/HUD
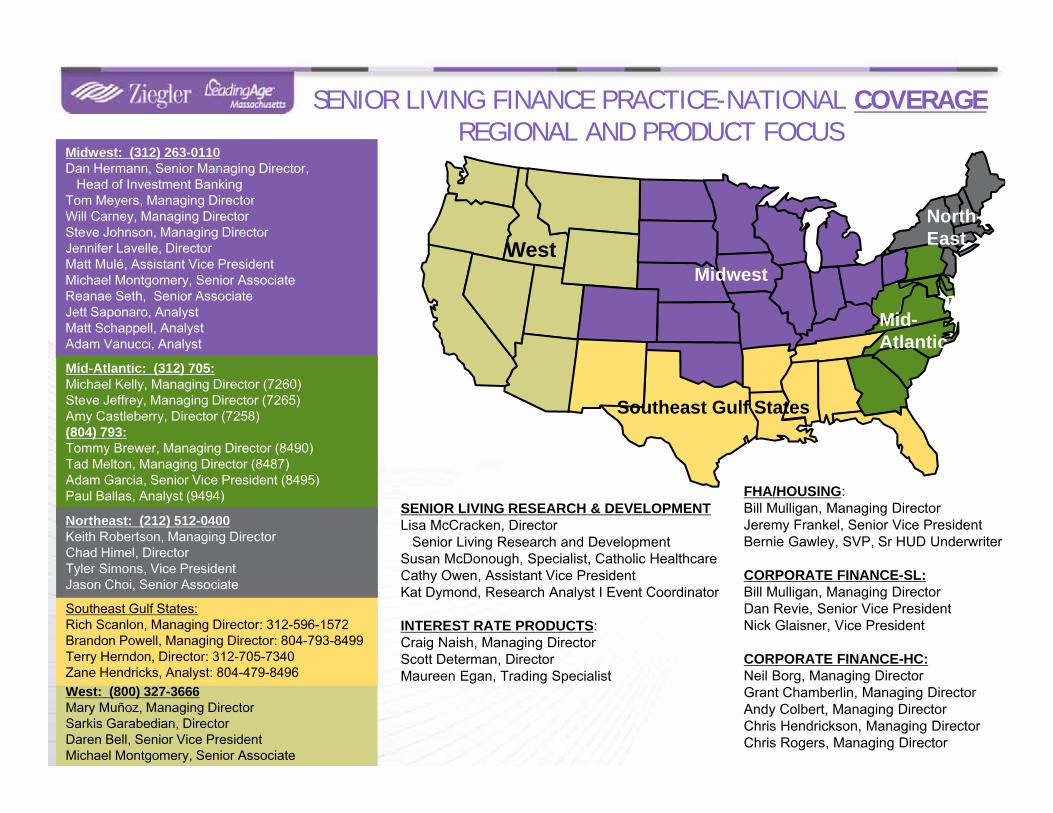
FHA/HOUSING:Bill Mulligan, Managing DirectorJeremy Frankel, Senior Vice PresidentBernie Gawley, SVP, Sr HUD Underwriter
CORPORATE FINANCE-SL:Bill Mulligan, Managing DirectorDan Revie, Senior Vice PresidentNick Glaisner, Vice President
CORPORATE FINANCE-HC:Neil Borg, Managing DirectorGrant Chamberlin, Managing DirectorAndy Colbert, Managing DirectorChris Hendrickson, Managing DirectorChris Rogers, Managing Director
SENIOR LIVING RESEARCH & DEVELOPMENTLisa McCracken, Director
Senior Living Research and DevelopmentSusan McDonough, Specialist, Catholic HealthcareCathy Owen, Assistant Vice PresidentKat Dymond, Research Analyst Ι Event Coordinator
INTEREST RATE PRODUCTS:Craig Naish, Managing DirectorScott Determan, DirectorMaureen Egan, Trading Specialist
West
Southeast Gulf States
Midwest
North-East
Mid-Atlantic
SENIOR LIVING FINANCE PRACTICE-NATIONAL COVERAGEREGIONAL AND PRODUCT FOCUS
Midwest: (312) 263-0110Dan Hermann, Senior Managing Director,
Head of Investment BankingTom Meyers, Managing DirectorWill Carney, Managing DirectorSteve Johnson, Managing DirectorJennifer Lavelle, DirectorMatt Mulé, Assistant Vice PresidentMichael Montgomery, Senior AssociateReanae Seth, Senior AssociateJett Saponaro, AnalystMatt Schappell, AnalystAdam Vanucci, Analyst
Mid-Atlantic: (312) 705:Michael Kelly, Managing Director (7260)Steve Jeffrey, Managing Director (7265)Amy Castleberry, Director (7258)(804) 793:Tommy Brewer, Managing Director (8490)Tad Melton, Managing Director (8487)Adam Garcia, Senior Vice President (8495)Paul Ballas, Analyst (9494)
West: (800) 327-3666Mary Muñoz, Managing DirectorSarkis Garabedian, DirectorDaren Bell, Senior Vice PresidentMichael Montgomery, Senior Associate
Southeast Gulf States:Rich Scanlon, Managing Director: 312-596-1572Brandon Powell, Managing Director: 804-793-8499Terry Herndon, Director: 312-705-7340Zane Hendricks, Analyst: 804-479-8496
Northeast: (212) 512-0400Keith Robertson, Managing DirectorChad Himel, DirectorTyler Simons, Vice PresidentJason Choi, Senior Associate
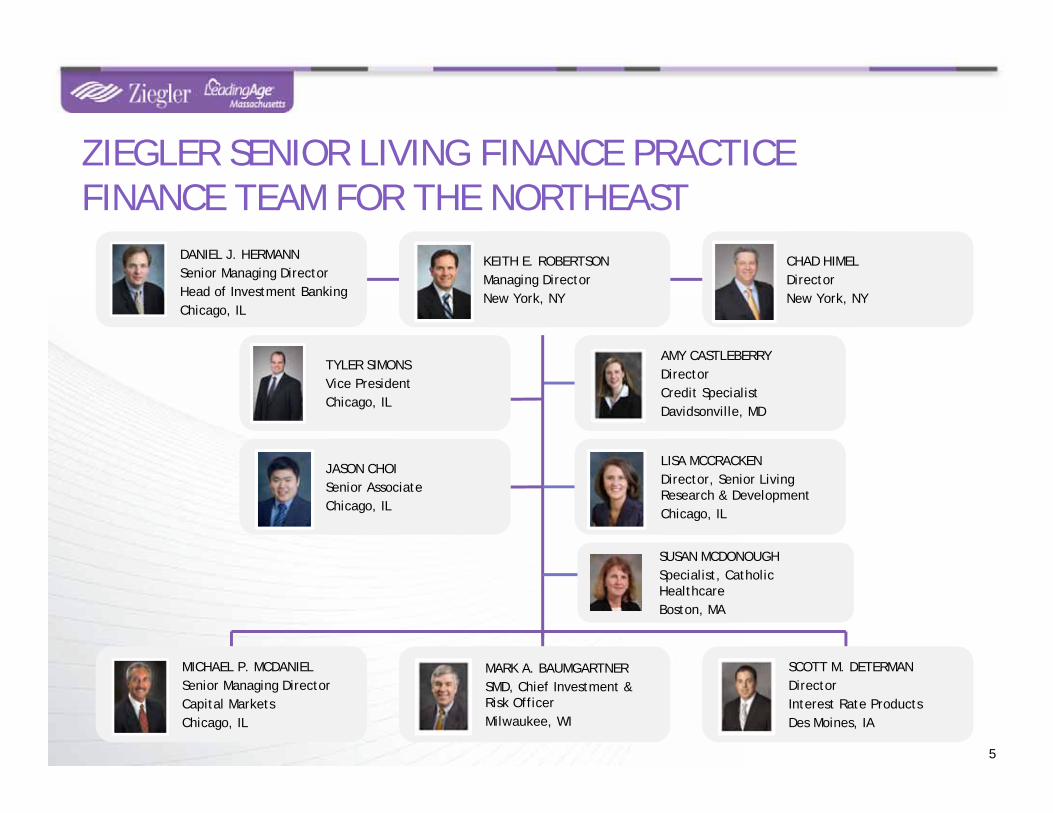
ZIEGLER SENIOR LIVING FINANCE PRACTICEFINANCE TEAM FOR THE NORTHEAST
5
KEITH E. ROBERTSONManaging DirectorNew York, NY
CHAD HIMELDirectorNew York, NY
TYLER SIMONSVice PresidentChicago, IL
MICHAEL P. MCDANIELSenior Managing DirectorCapital MarketsChicago, IL
MARK A. BAUMGARTNERSMD, Chief Investment & Risk OfficerMilwaukee, WI
AMY CASTLEBERRYDirectorCredit SpecialistDavidsonville, MD
LISA MCCRACKENDirector, Senior Living Research & DevelopmentChicago, IL
DANIEL J. HERMANNSenior Managing DirectorHead of Investment BankingChicago, IL
SCOTT M. DETERMANDirectorInterest Rate ProductsDes Moines, IA
SUSAN MCDONOUGHSpecialist, Catholic HealthcareBoston, MA
JASON CHOISenior AssociateChicago, IL
6
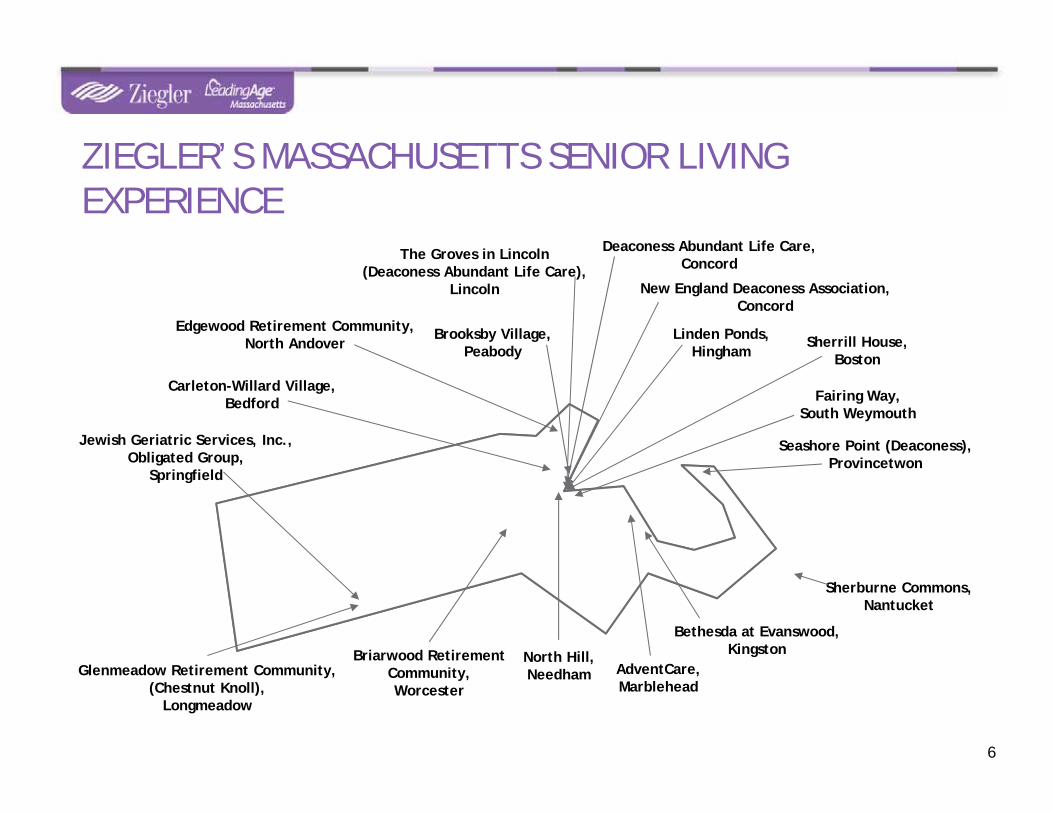
Jewish Geriatric Services, Inc.,Obligated Group,
Springfield
Bethesda at Evanswood,Kingston
Edgewood Retirement Community,North Andover
Carleton-Willard Village,Bedford
Glenmeadow Retirement Community,(Chestnut Knoll),
Longmeadow
Briarwood RetirementCommunity,Worcester
Brooksby Village,Peabody
Sherrill House,Boston
New England Deaconess Association,Concord
Sherburne Commons,Nantucket
Seashore Point (Deaconess),Provincetwon
AdventCare,Marblehead
Linden Ponds,Hingham
The Groves in Lincoln(Deaconess Abundant Life Care),
Lincoln
Deaconess Abundant Life Care,Concord
ZIEGLER’S MASSACHUSETTS SENIOR LIVING EXPERIENCE
North Hill,Needham
Fairing Way,South Weymouth
• Education– 2017: will host a total of 11 Conferences/
Symposiums– Annual Ziegler Senior Living Finance +
Strategy Conference– LeadingAge Ziegler National CFO Workshop– Ziegler National Senior Living Investor
Workshop SeriesSM
• External research– LeadingAge Ziegler 150– CARF Financial Ratios and Trends Publication
(Baker Tilly, CARF)– Resident Contract Study– Statewide CCRC Reports (MD; VA; TX) (My
LifeSite)
• Industry communication– Z-News– White papers– Ziegler CFO HotlineSM
7
• Internal information and research– Ziegler CCRC National Listing & Profile– Client-requested research– Client education sessions
• Secondary Market Investor Research– Surveillance updates on current credits– Supports active secondary trading
• Investor Market Research– ZieglerResearch.com
• Databases– Industry Trends (e.g. CCaH, Rental
CCRCs)– All Senior Living Financings– All New Communities (start-up CCRCs)
since 1990– Senior Living Rated Organizations
ZIEGLER’S SENIOR LIVING RESEARCH, EDUCATION& THOUGHT LEADERSHIP
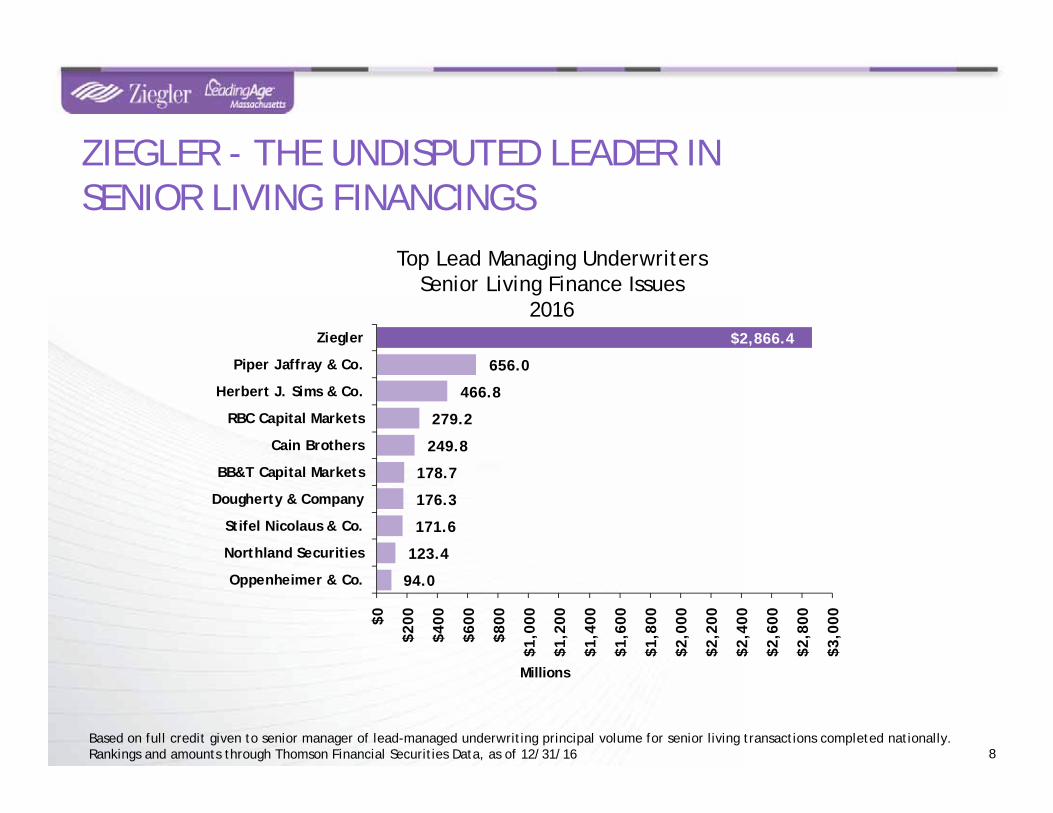
ZIEGLER - THE UNDISPUTED LEADER INSENIOR LIVING FINANCINGS
8
Top Lead Managing UnderwritersSenior Living Finance Issues
2016
Based on full credit given to senior manager of lead-managed underwriting principal volume for senior living transactions completed nationally. Rankings and amounts through Thomson Financial Securities Data, as of 12/31/16
94.0
123.4
171.6
176.3
178.7
249.8
279.2
466.8
656.0
$2,866.4
$0
$200
$400
$600
$800
$1,0
00
$1,2
00
$1,4
00
$1,6
00
$1,8
00
$2,0
00
$2,2
00
$2,4
00
$2,6
00
$2,8
00
$3,0
00
Oppenheimer & Co.
Northland Securities
Stifel Nicolaus & Co.
Dougherty & Company
BB&T Capital Markets
Cain Brothers
RBC Capital Markets
Herbert J. Sims & Co.
Piper Jaffray & Co.
Ziegler
Millions
AGENDA
9
• YOUR KEY STAKEHOLDERS: CONSUMERS & STAFF
TOPIC 1
• NFP SENIOR LIVING GROWTH & EVOLUTIONTOPIC 2
• DISRUPTORS IMPACTING SENIOR LIVINGTOPIC 3
• SENIOR LIVING CAPITAL MARKETSTOPIC 4
QUESTIONS & ANSWERSQUESTIONS & ANSWERS
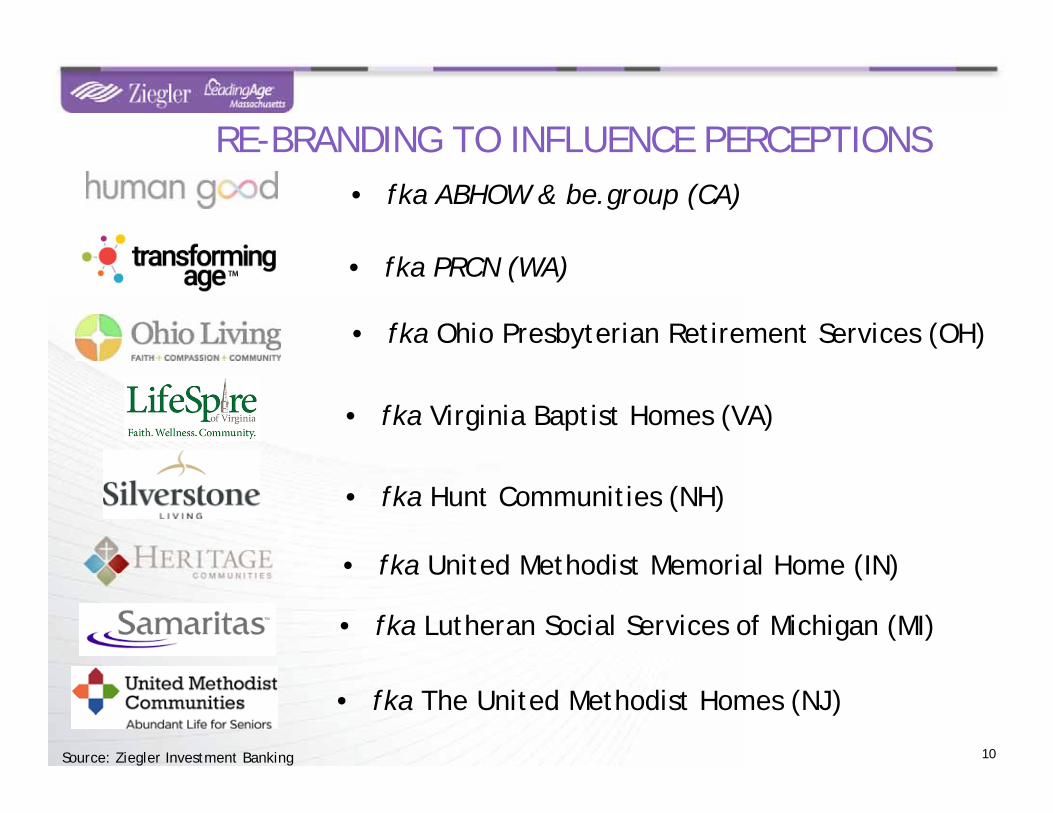
Source: Ziegler Investment Banking
RE-BRANDING TO INFLUENCE PERCEPTIONS
• fka Lutheran Social Services of Michigan (MI)
• fka Hunt Communities (NH)
• fka United Methodist Memorial Home (IN)
• fka Virginia Baptist Homes (VA)
• fka The United Methodist Homes (NJ)
• fka Ohio Presbyterian Retirement Services (OH)
• fka PRCN (WA)
10
• fka ABHOW & be.group (CA)
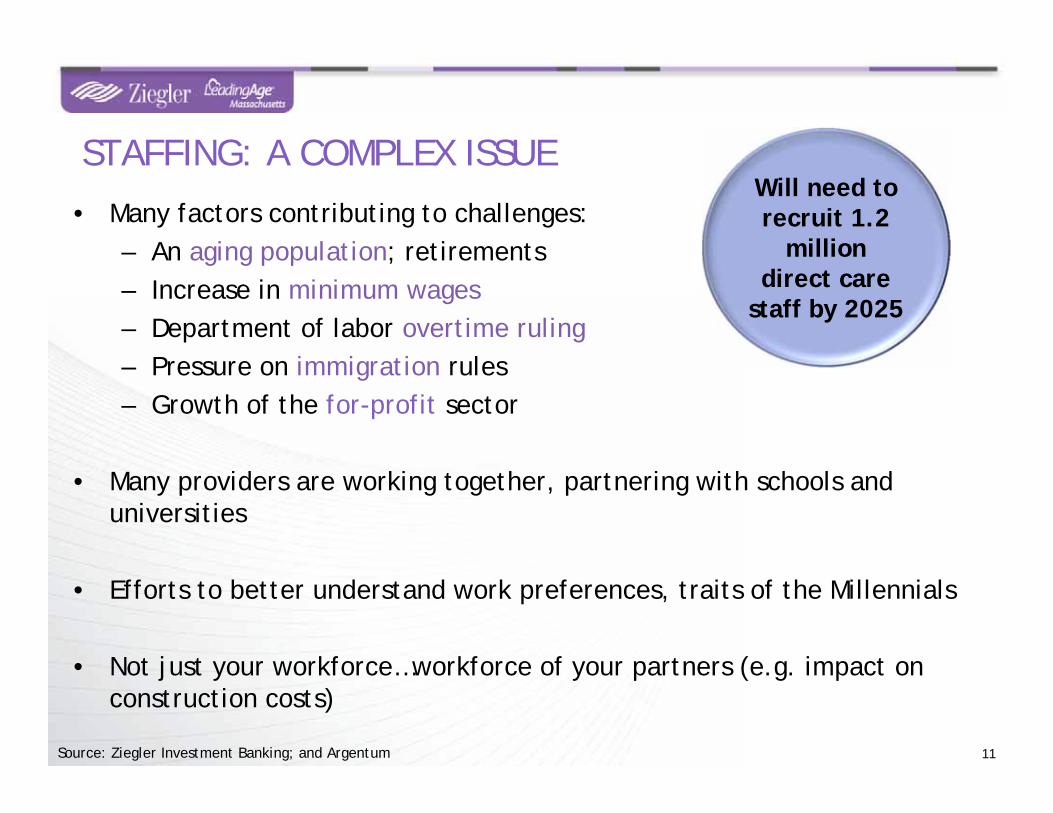
• Many factors contributing to challenges:– An aging population; retirements– Increase in minimum wages– Department of labor overtime ruling– Pressure on immigration rules– Growth of the for-profit sector
• Many providers are working together, partnering with schools and universities
• Efforts to better understand work preferences, traits of the Millennials
• Not just your workforce…workforce of your partners (e.g. impact on construction costs)
11Source: Ziegler Investment Banking; and Argentum
Will need to recruit 1.2
million direct care
staff by 2025
STAFFING: A COMPLEX ISSUE
12
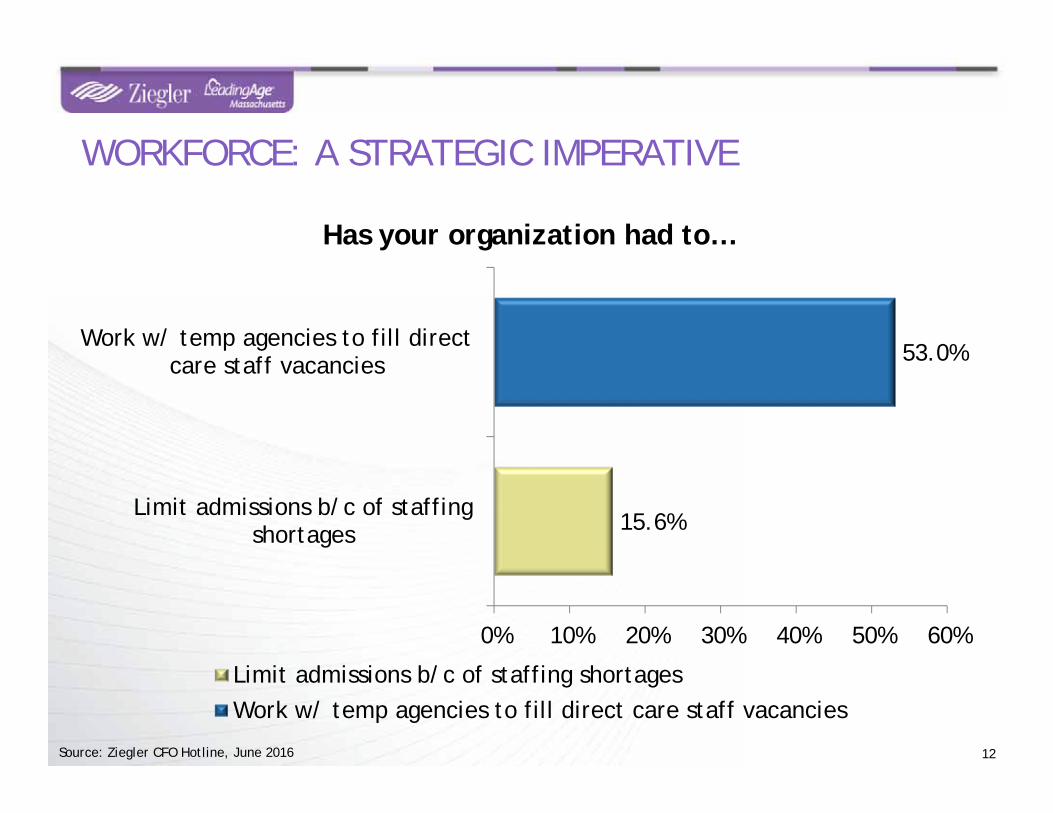
15.6%
53.0%
0% 10% 20% 30% 40% 50% 60%
Limit admissions b/c of staffingshortages
Work w/ temp agencies to fill directcare staff vacancies
Has your organization had to…
Limit admissions b/c of staffing shortagesWork w/ temp agencies to fill direct care staff vacancies
Source: Ziegler CFO Hotline, June 2016
WORKFORCE: A STRATEGIC IMPERATIVE
TOPIC 2: NOT-FOR-PROFIT SENIOR LIVING GROWTH & EVOLUTION
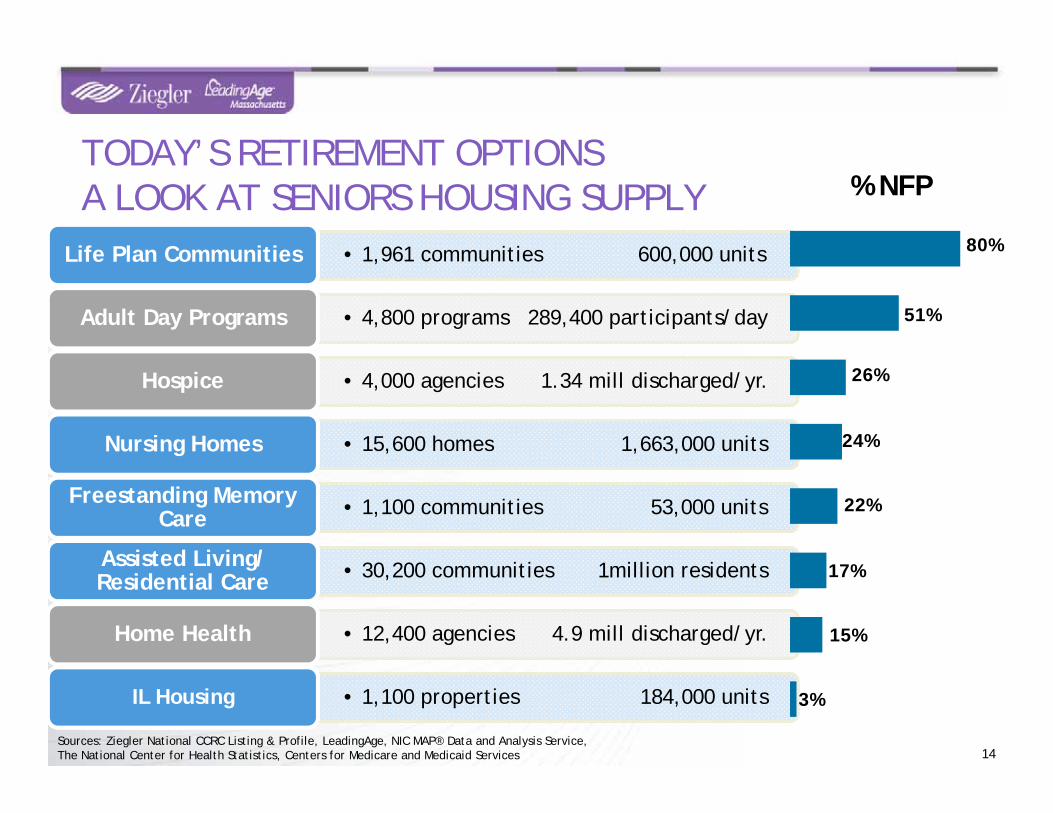
14Sources: Ziegler National CCRC Listing & Profile, LeadingAge, NIC MAP® Data and Analysis Service, The National Center for Health Statistics, Centers for Medicare and Medicaid Services
TODAY’S RETIREMENT OPTIONSA LOOK AT SENIORS HOUSING SUPPLY
• 1,961 communities 600,000 unitsLife Plan Communities
• 4,800 programs 289,400 participants/dayAdult Day Programs
• 4,000 agencies 1.34 mill discharged/yr.Hospice
• 15,600 homes 1,663,000 units Nursing Homes
• 1,100 communities 53,000 unitsFreestanding Memory Care
• 30,200 communities 1million residentsAssisted Living/ Residential Care
• 12,400 agencies 4.9 mill discharged/yr.Home Health
• 1,100 properties 184,000 unitsIL Housing 3%
15%
17%
22%
24%
26%
51%
80%
% NFP
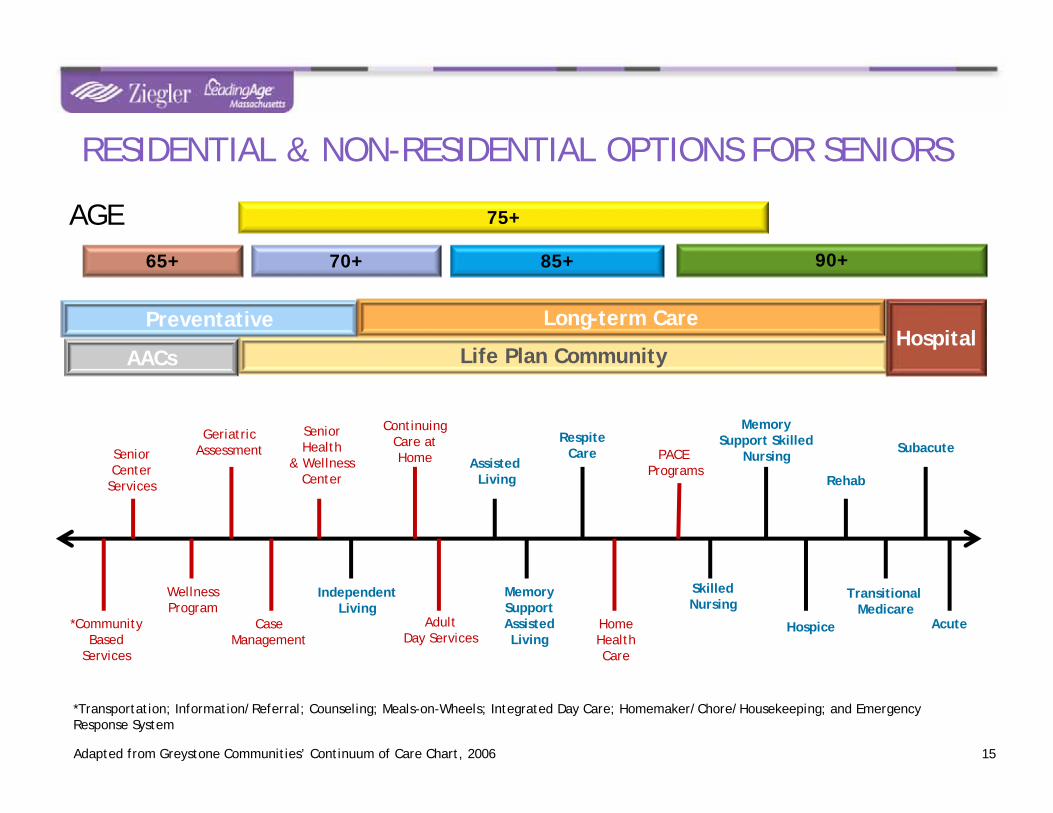
15
Subacute
Rehab
Memory Support Skilled
NursingPACE Programs
RespiteCare
Assisted Living
Continuing Care at Home
SeniorHealth
& WellnessCenter
GeriatricAssessmentSenior
CenterServices
*CommunityBased
Services
WellnessProgram
CaseManagement
IndependentLiving
AdultDay Services
MemorySupportAssistedLiving
HomeHealthCare
Skilled Nursing
Hospice Acute
Transitional Medicare
*Transportation; Information/Referral; Counseling; Meals-on-Wheels; Integrated Day Care; Homemaker/Chore/Housekeeping; and Emergency Response System
Adapted from Greystone Communities’ Continuum of Care Chart, 2006
AACs
15
85+65+ 90+
75+
70+
AGE
Preventative Long-term Care
Life Plan CommunityHospital
RESIDENTIAL & NON-RESIDENTIAL OPTIONS FOR SENIORS
16Source: 2016 LeadingAge Ziegler 150
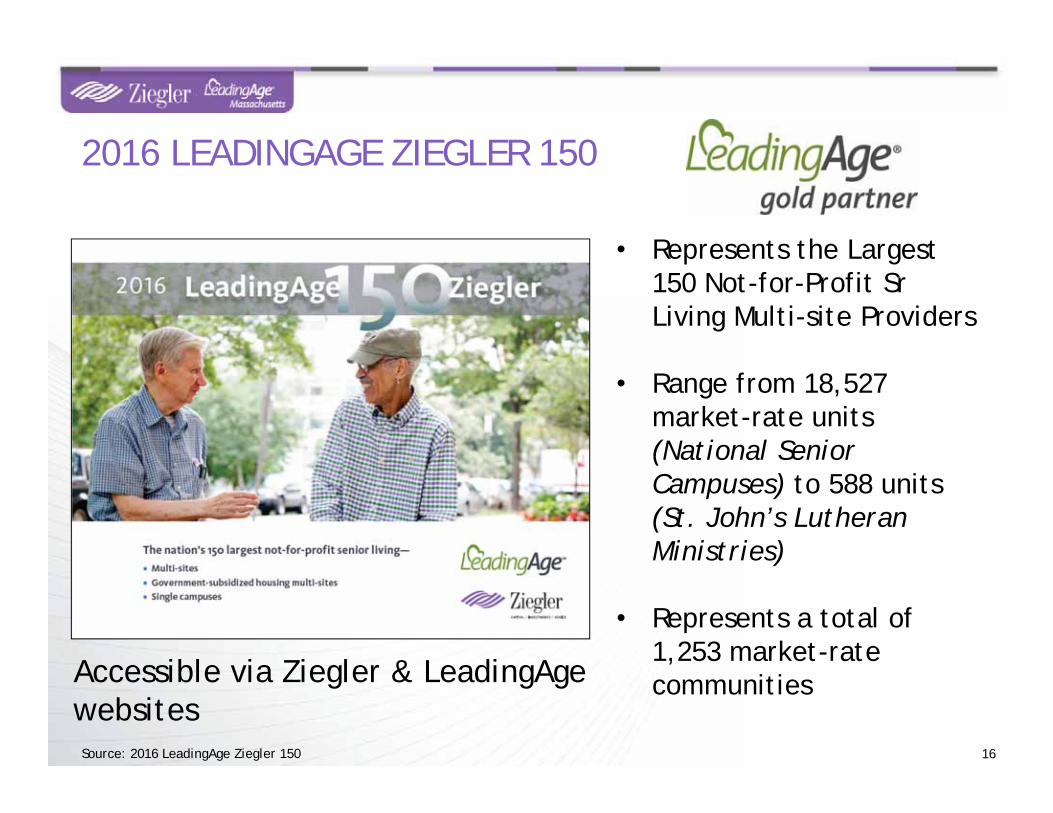
• Represents the Largest 150 Not-for-Profit Sr Living Multi-site Providers
• Range from 18,527 market-rate units (National Senior Campuses) to 588 units (St. John’s Lutheran Ministries)
• Represents a total of 1,253 market-rate communities
2016 LEADINGAGE ZIEGLER 150
Accessible via Ziegler & LeadingAge websites
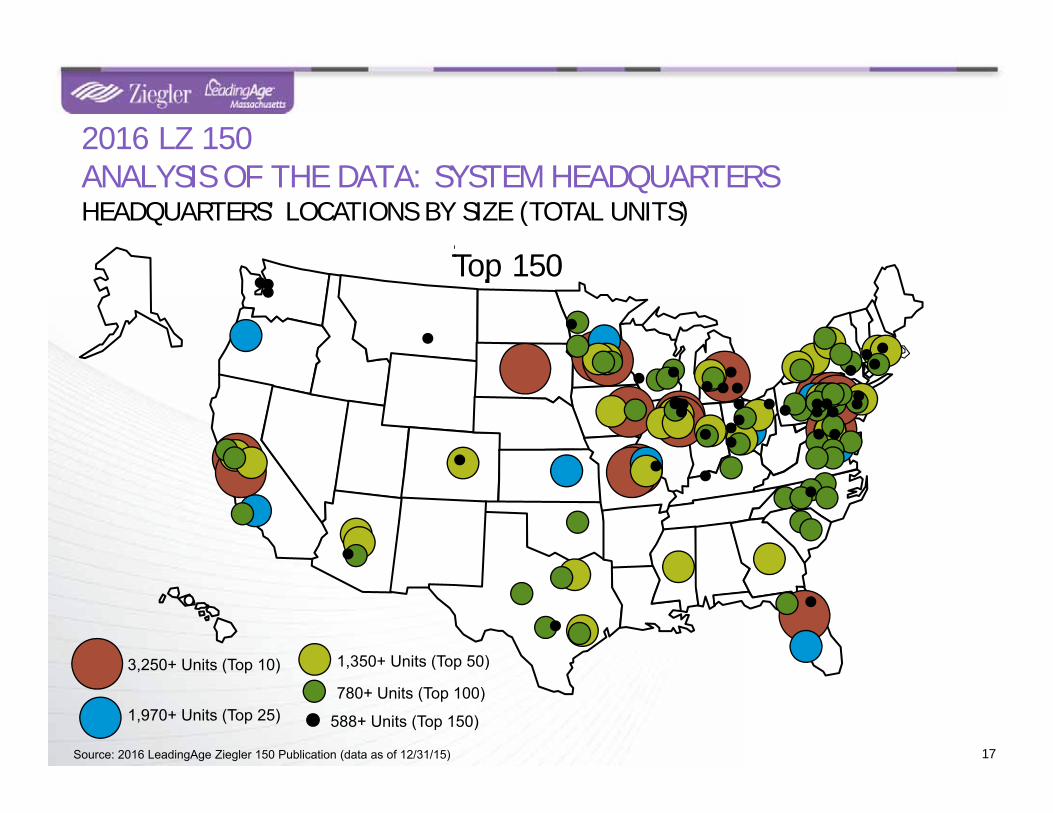
2016 LZ 150ANALYSIS OF THE DATA: SYSTEM HEADQUARTERSHEADQUARTERS’ LOCATIONS BY SIZE (TOTAL UNITS)
17Source: 2016 LeadingAge Ziegler 150 Publication (data as of 12/31/15)
588+ Units (Top 150)
3,250+ Units (Top 10)
1,970+ Units (Top 25)
1,350+ Units (Top 50)
780+ Units (Top 100)
Top 10Top 25Top 50Top 100Top 150
2016
Ran
k
2015
Ran
k
Units(as of 12/31/15)
Communities(as of 12/31/15)
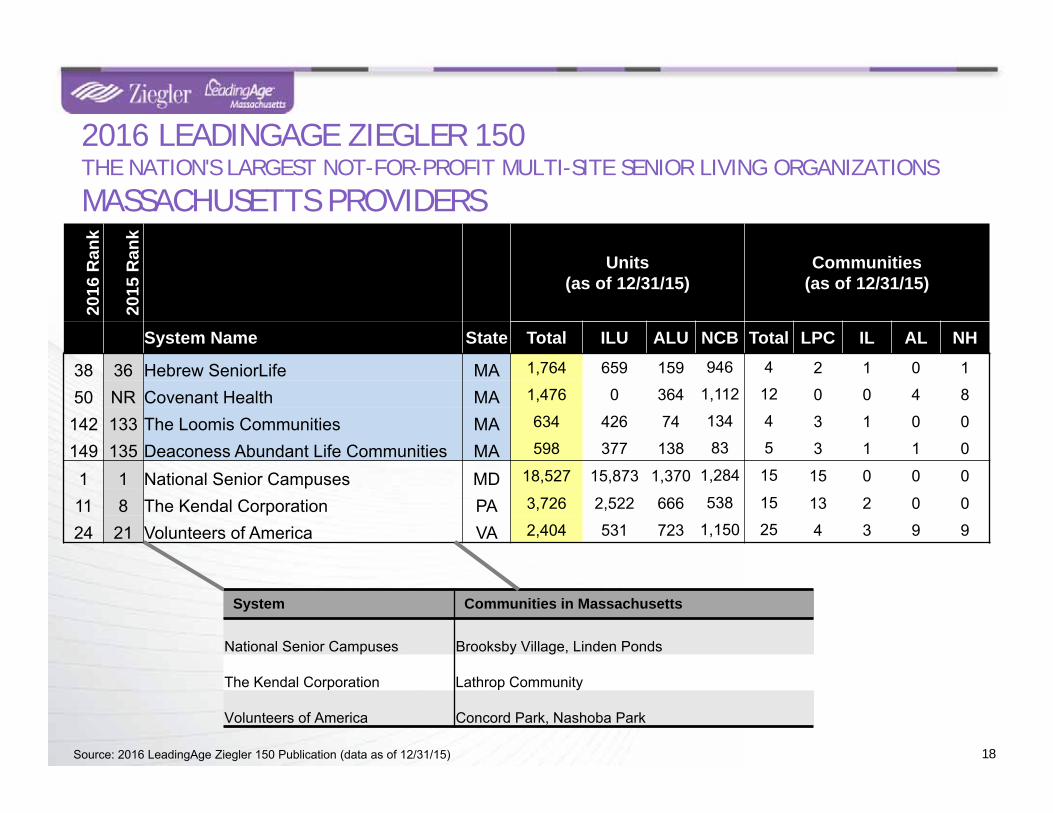
System Name State Total ILU ALU NCB Total LPC IL AL NH
38 36 Hebrew SeniorLife MA 1,764 659 159 946 4 2 1 0 1
50 NR Covenant Health MA 1,476 0 364 1,112 12 0 0 4 8
142 133 The Loomis Communities MA 634 426 74 134 4 3 1 0 0
149 135 Deaconess Abundant Life Communities MA 598 377 138 83 5 3 1 1 0
1 1 National Senior Campuses MD 18,527 15,873 1,370 1,284 15 15 0 0 0
11 8 The Kendal Corporation PA 3,726 2,522 666 538 15 13 2 0 0
24 21 Volunteers of America VA 2,404 531 723 1,150 25 4 3 9 9
2016 LEADINGAGE ZIEGLER 150THE NATION'S LARGEST NOT-FOR-PROFIT MULTI-SITE SENIOR LIVING ORGANIZATIONS
MASSACHUSETTS PROVIDERS
18Source: 2016 LeadingAge Ziegler 150 Publication (data as of 12/31/15)
System Communities in Massachusetts
National Senior Campuses Brooksby Village, Linden Ponds
The Kendal Corporation Lathrop Community
Volunteers of America Concord Park, Nashoba Park
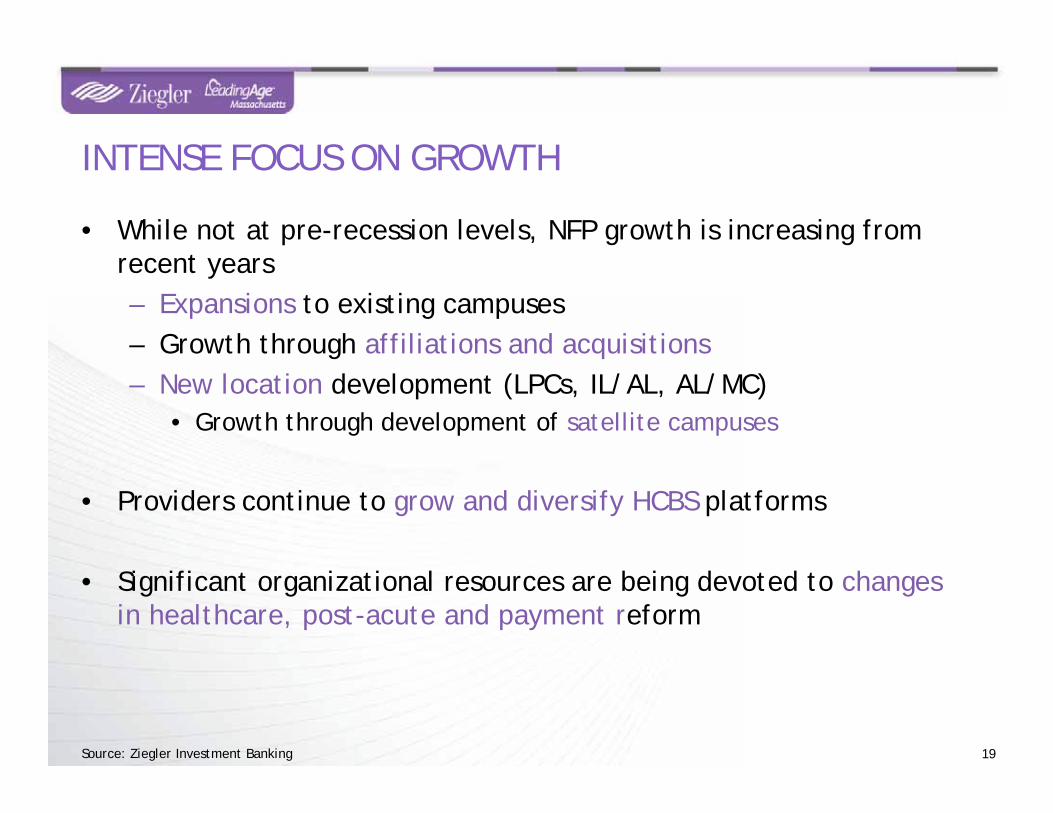
• While not at pre-recession levels, NFP growth is increasing from recent years– Expansions to existing campuses– Growth through affiliations and acquisitions– New location development (LPCs, IL/AL, AL/MC)
• Growth through development of satellite campuses
• Providers continue to grow and diversify HCBS platforms
• Significant organizational resources are being devoted to changes in healthcare, post-acute and payment reform
19Source: Ziegler Investment Banking
INTENSE FOCUS ON GROWTH
0
5,000
10,000
15,000
20,000
25,000
30,000
35,000
40,000
45,000
50,000
55,000
60,000
1980 1985 1990 1995 2000 2005 2010 2015
Uni
ts
Year
ILU ALU NCB All Units
All other organizations pre-1980
National Senior Campuses
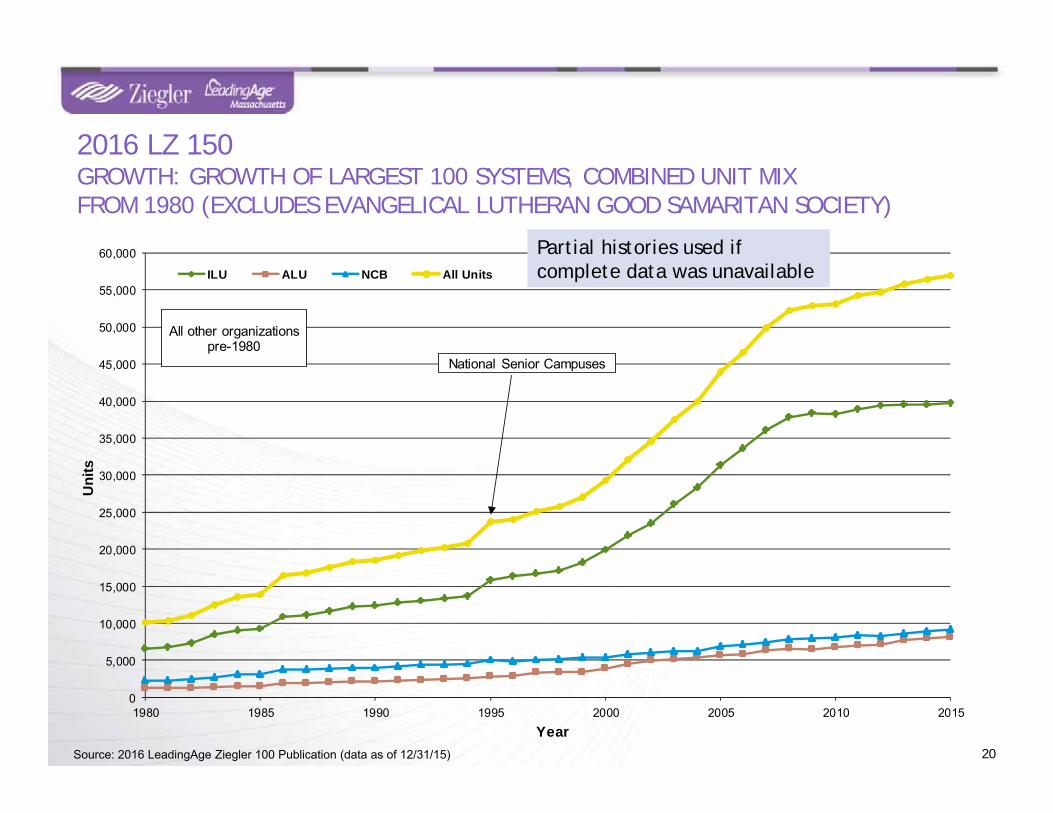
2016 LZ 150GROWTH: GROWTH OF LARGEST 100 SYSTEMS, COMBINED UNIT MIXFROM 1980 (EXCLUDES EVANGELICAL LUTHERAN GOOD SAMARITAN SOCIETY)
Partial histories used if complete data was unavailable
20Source: 2016 LeadingAge Ziegler 100 Publication (data as of 12/31/15)
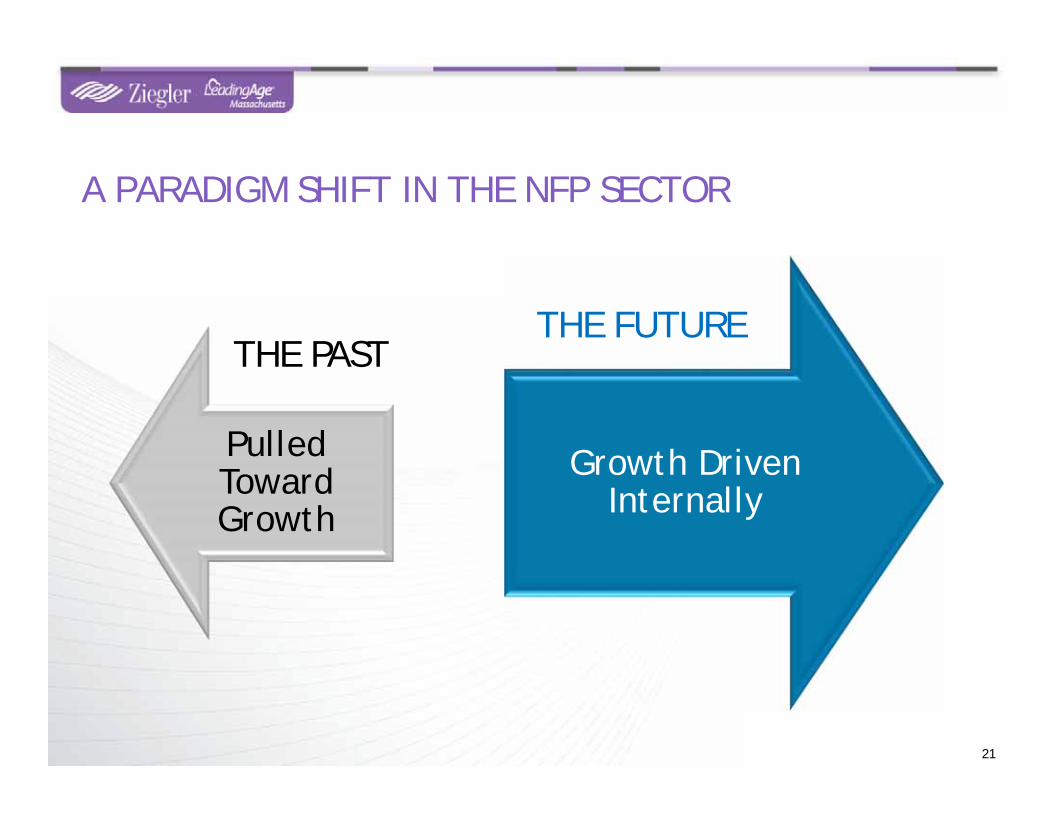
Pulled Toward Growth
Growth Driven Internally
A PARADIGM SHIFT IN THE NFP SECTOR
21
THE PASTTHE FUTURE
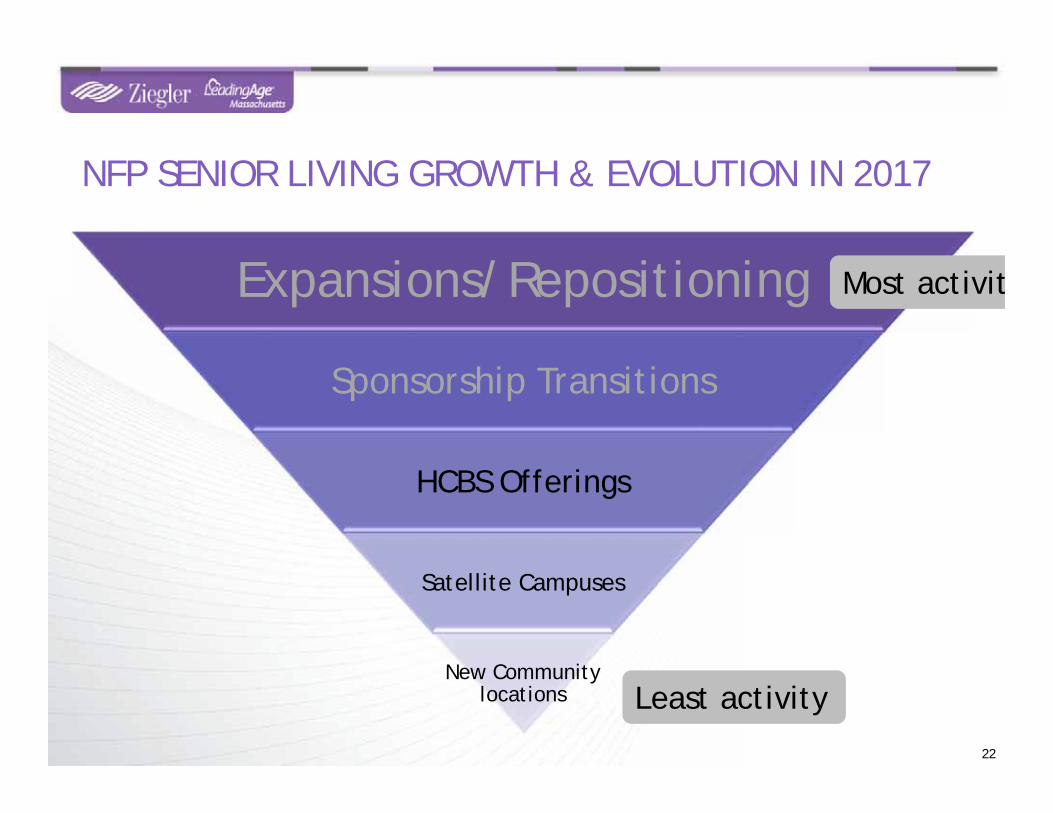
Expansions/Repositioning
Sponsorship Transitions
HCBS Offerings
Satellite Campuses
New Community locations
NFP SENIOR LIVING GROWTH & EVOLUTION IN 2017
22
Least activity
Most activit
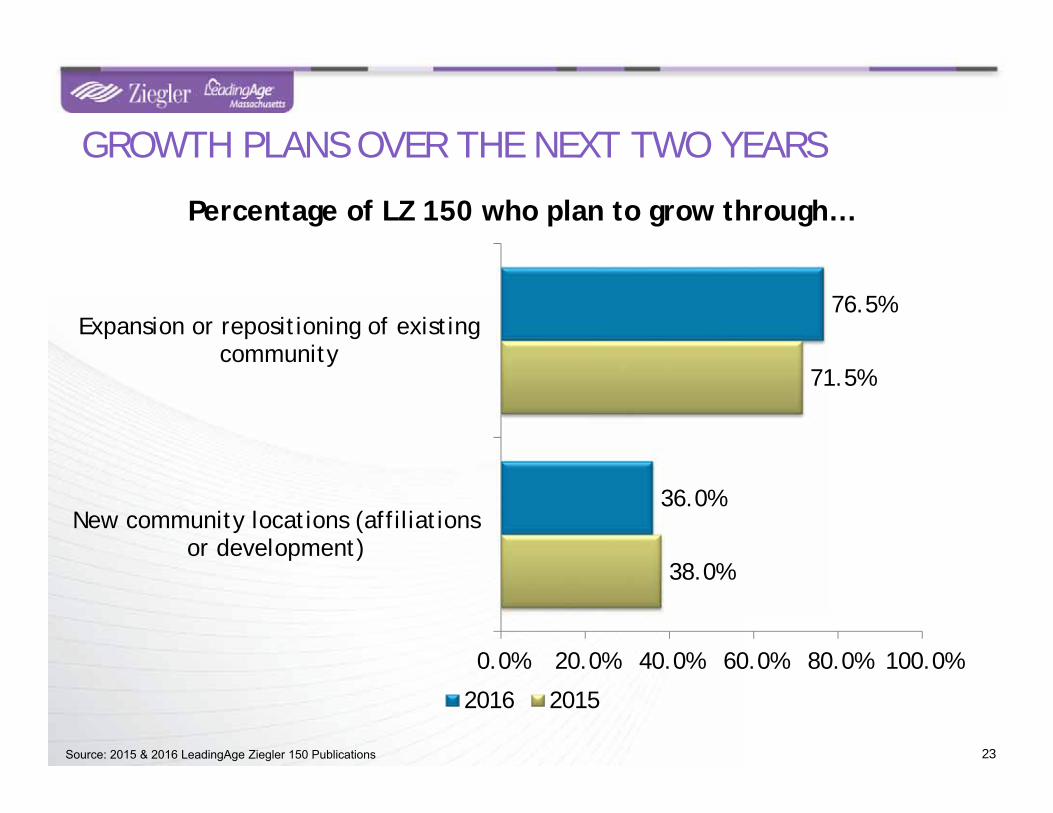
38.0%
71.5%
36.0%
76.5%
0.0% 20.0% 40.0% 60.0% 80.0% 100.0%
New community locations (affiliationsor development)
Expansion or repositioning of existingcommunity
Percentage of LZ 150 who plan to grow through…
2016 2015
GROWTH PLANS OVER THE NEXT TWO YEARS
23Source: 2015 & 2016 LeadingAge Ziegler 150 Publications
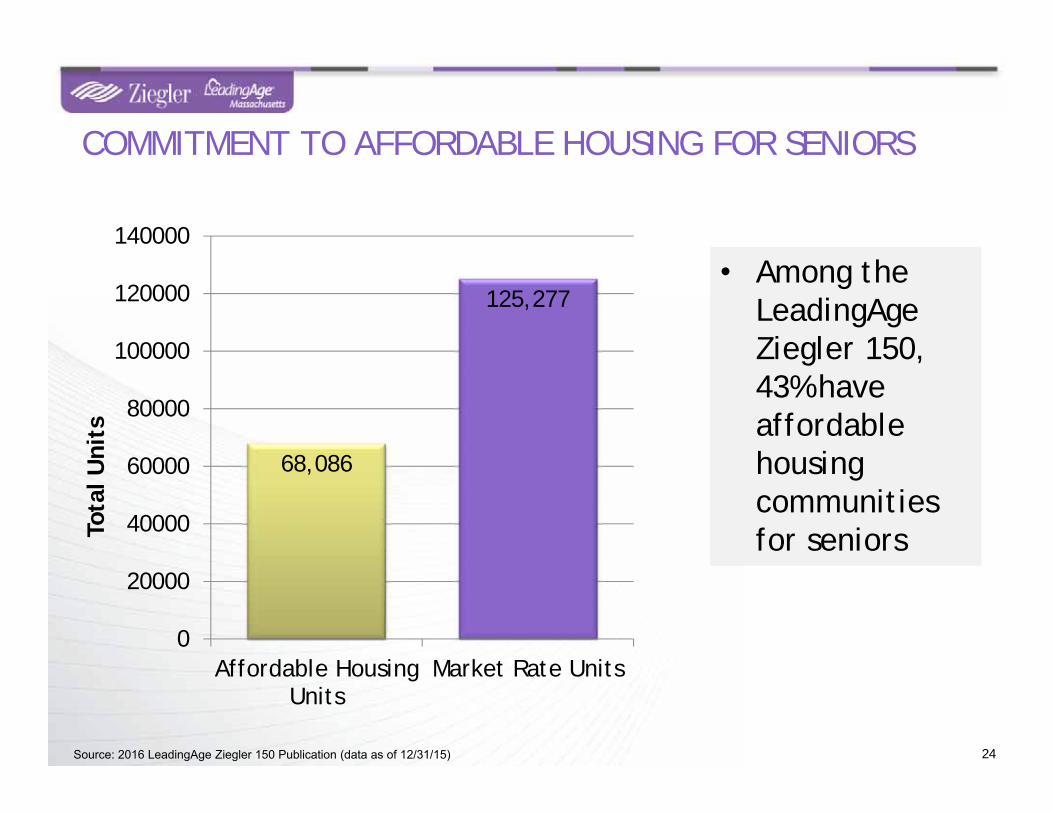
COMMITMENT TO AFFORDABLE HOUSING FOR SENIORS
24
68,086
125,277
0
20000
40000
60000
80000
100000
120000
140000
Affordable HousingUnits
Market Rate Units
Tota
l Uni
ts
Source: 2016 LeadingAge Ziegler 150 Publication (data as of 12/31/15)
• Among the LeadingAge Ziegler 150, 43% have affordable housing communities for seniors
Ran
k
2016
LZ
150
Ran
k Units(as of 12/31/15)
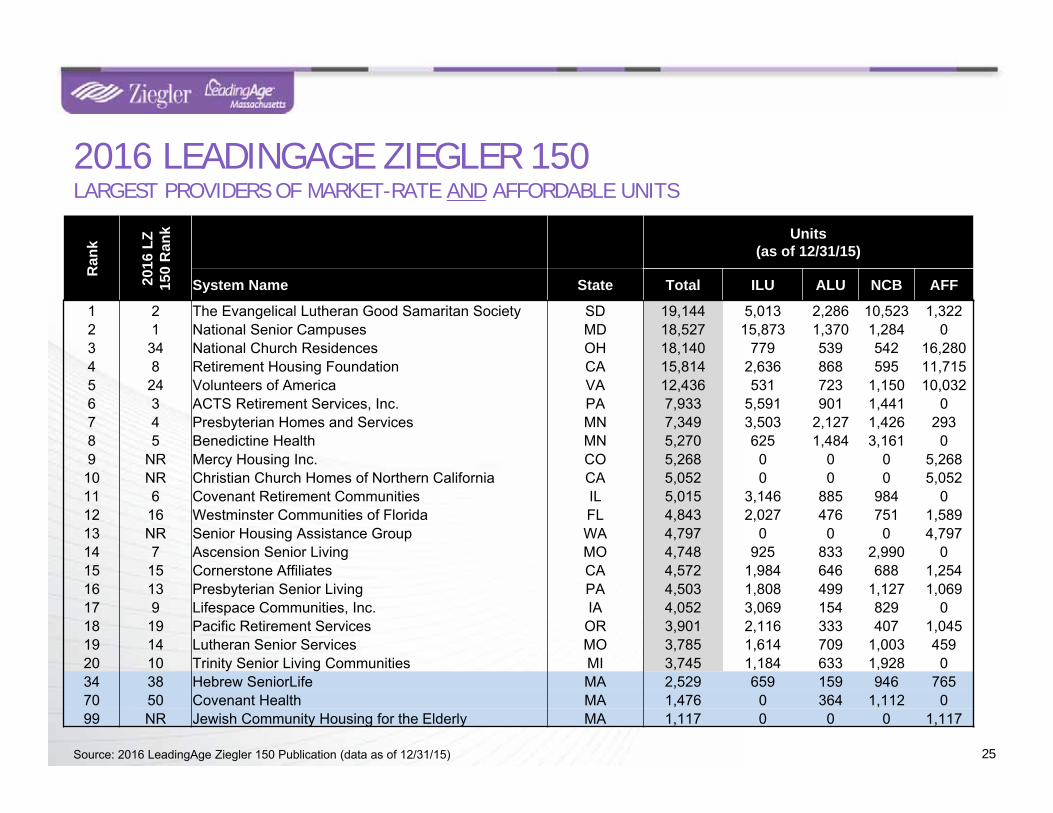
System Name State Total ILU ALU NCB AFF
1 2 The Evangelical Lutheran Good Samaritan Society SD 19,144 5,013 2,286 10,523 1,3222 1 National Senior Campuses MD 18,527 15,873 1,370 1,284 03 34 National Church Residences OH 18,140 779 539 542 16,2804 8 Retirement Housing Foundation CA 15,814 2,636 868 595 11,7155 24 Volunteers of America VA 12,436 531 723 1,150 10,0326 3 ACTS Retirement Services, Inc. PA 7,933 5,591 901 1,441 07 4 Presbyterian Homes and Services MN 7,349 3,503 2,127 1,426 2938 5 Benedictine Health MN 5,270 625 1,484 3,161 09 NR Mercy Housing Inc. CO 5,268 0 0 0 5,268
10 NR Christian Church Homes of Northern California CA 5,052 0 0 0 5,05211 6 Covenant Retirement Communities IL 5,015 3,146 885 984 012 16 Westminster Communities of Florida FL 4,843 2,027 476 751 1,58913 NR Senior Housing Assistance Group WA 4,797 0 0 0 4,79714 7 Ascension Senior Living MO 4,748 925 833 2,990 015 15 Cornerstone Affiliates CA 4,572 1,984 646 688 1,25416 13 Presbyterian Senior Living PA 4,503 1,808 499 1,127 1,06917 9 Lifespace Communities, Inc. IA 4,052 3,069 154 829 018 19 Pacific Retirement Services OR 3,901 2,116 333 407 1,04519 14 Lutheran Senior Services MO 3,785 1,614 709 1,003 45920 10 Trinity Senior Living Communities MI 3,745 1,184 633 1,928 034 38 Hebrew SeniorLife MA 2,529 659 159 946 76570 50 Covenant Health MA 1,476 0 364 1,112 099 NR Jewish Community Housing for the Elderly MA 1,117 0 0 0 1,117
25
2016 LEADINGAGE ZIEGLER 150LARGEST PROVIDERS OF MARKET-RATE AND AFFORDABLE UNITS
Source: 2016 LeadingAge Ziegler 150 Publication (data as of 12/31/15)
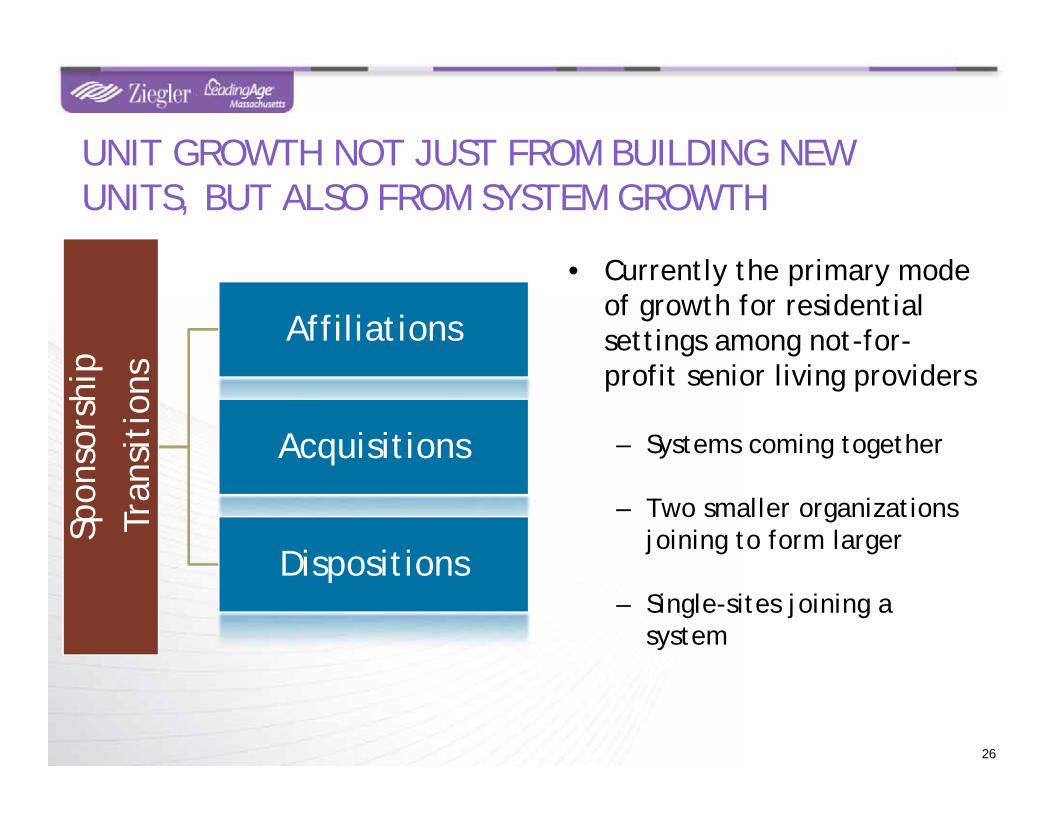
• Currently the primary mode of growth for residential settings among not-for-profit senior living providers
– Systems coming together
– Two smaller organizations joining to form larger
– Single-sites joining a system
26
UNIT GROWTH NOT JUST FROM BUILDING NEW UNITS, BUT ALSO FROM SYSTEM GROWTH
Spon
sors
hip
Tran
siti
ons
Affiliations
Acquisitions
Dispositions
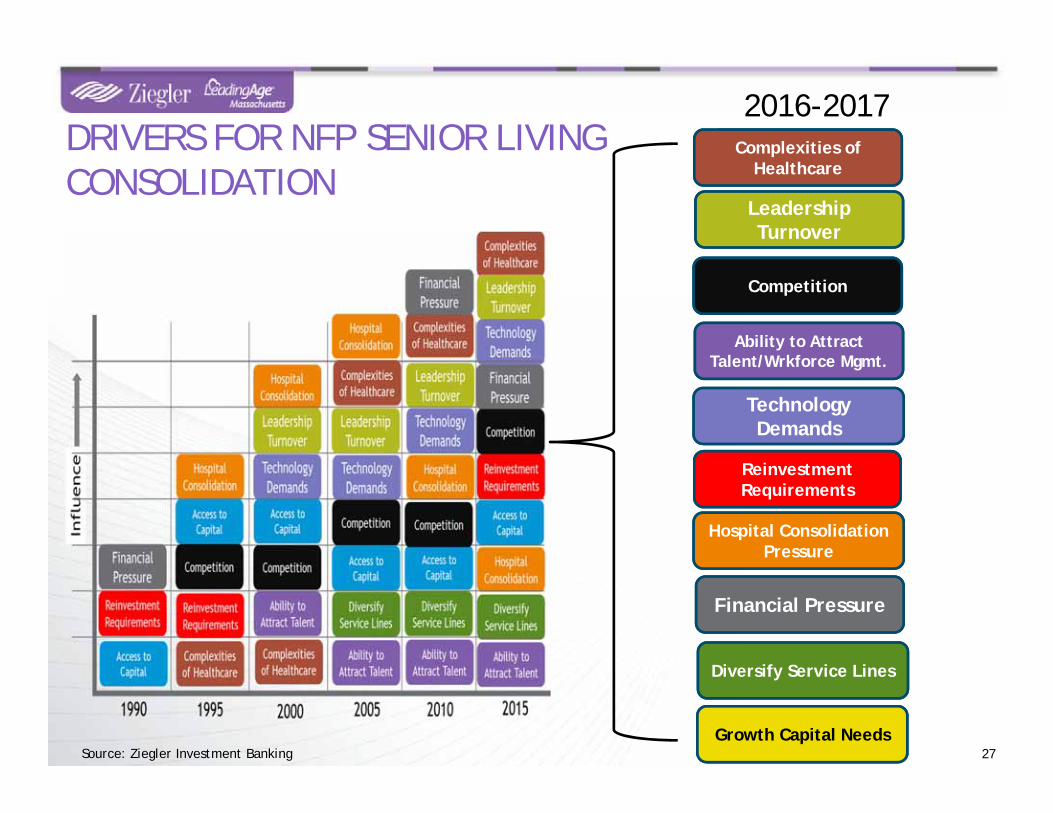
DRIVERS FOR NFP SENIOR LIVING CONSOLIDATION
27
Complexities of Healthcare
Leadership Turnover
Ability to Attract Talent/Wrkforce Mgmt.
Competition
Reinvestment Requirements
Technology Demands
Financial Pressure
Hospital Consolidation Pressure
Diversify Service Lines
2016-2017
Source: Ziegler Investment BankingGrowth Capital Needs
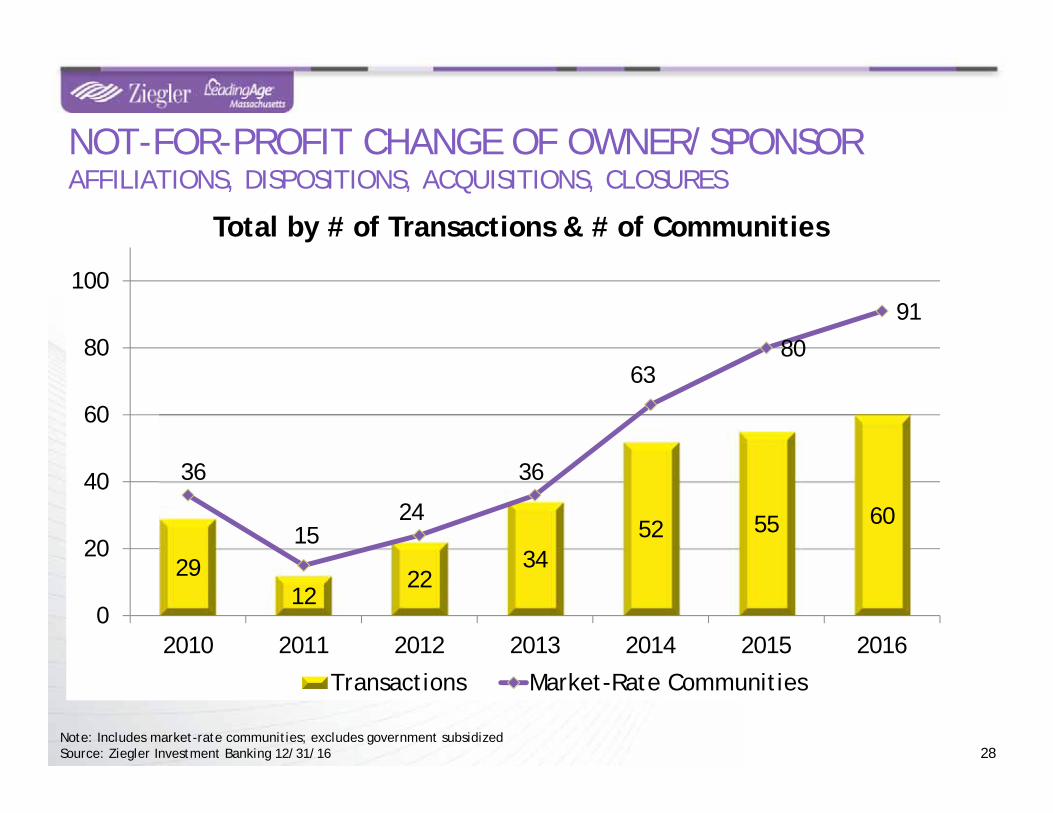
2912
2234
52 55 60
36
1524
36
6380
91
0
20
40
60
80
100
2010 2011 2012 2013 2014 2015 2016
Total by # of Transactions & # of Communities
Transactions Market-Rate Communities
Note: Includes market-rate communities; excludes government subsidizedSource: Ziegler Investment Banking 12/31/16
NOT-FOR-PROFIT CHANGE OF OWNER/SPONSORAFFILIATIONS, DISPOSITIONS, ACQUISITIONS, CLOSURES
28
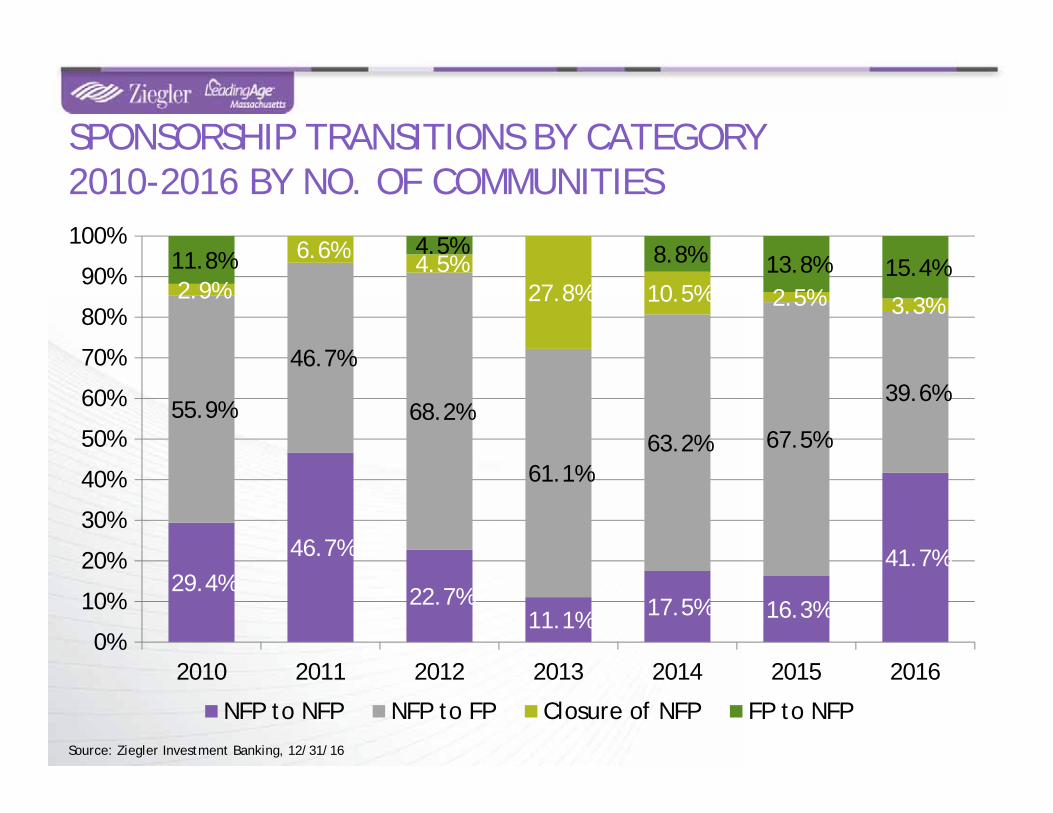
29.4%46.7%
22.7%11.1% 17.5% 16.3%
41.7%
55.9%
46.7%
68.2%
61.1%63.2% 67.5%
39.6%
2.9%
6.6% 4.5%27.8% 10.5% 2.5% 3.3%
11.8%4.5% 8.8% 13.8% 15.4%
0%
10%
20%
30%
40%
50%
60%
70%
80%
90%
100%
2010 2011 2012 2013 2014 2015 2016
NFP to NFP NFP to FP Closure of NFP FP to NFP
SPONSORSHIP TRANSITIONS BY CATEGORY2010-2016 BY NO. OF COMMUNITIES
Source: Ziegler Investment Banking, 12/31/16
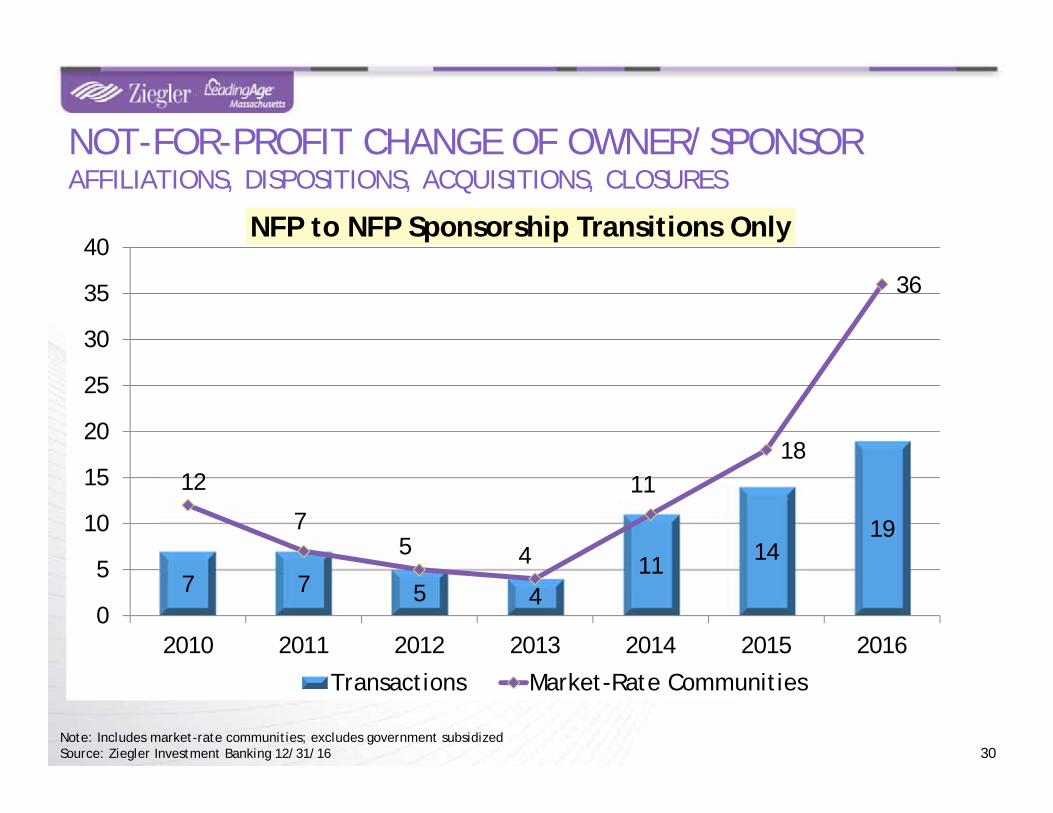
7 7 5 411 14
19
12
75 4
1118
36
0
5
10
15
20
25
30
35
40
2010 2011 2012 2013 2014 2015 2016
NFP to NFP Sponsorship Transitions Only
Transactions Market-Rate Communities
Note: Includes market-rate communities; excludes government subsidizedSource: Ziegler Investment Banking 12/31/16
NOT-FOR-PROFIT CHANGE OF OWNER/SPONSORAFFILIATIONS, DISPOSITIONS, ACQUISITIONS, CLOSURES
30
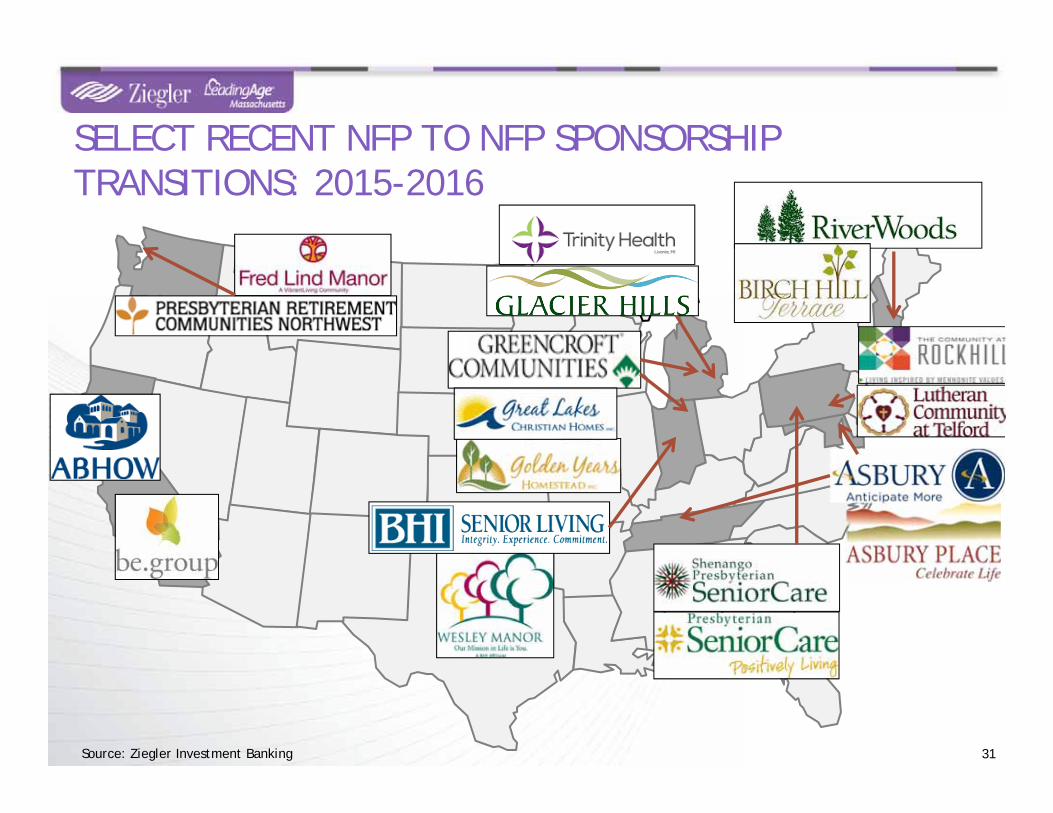
SELECT RECENT NFP TO NFP SPONSORSHIP TRANSITIONS: 2015-2016
31Source: Ziegler Investment Banking
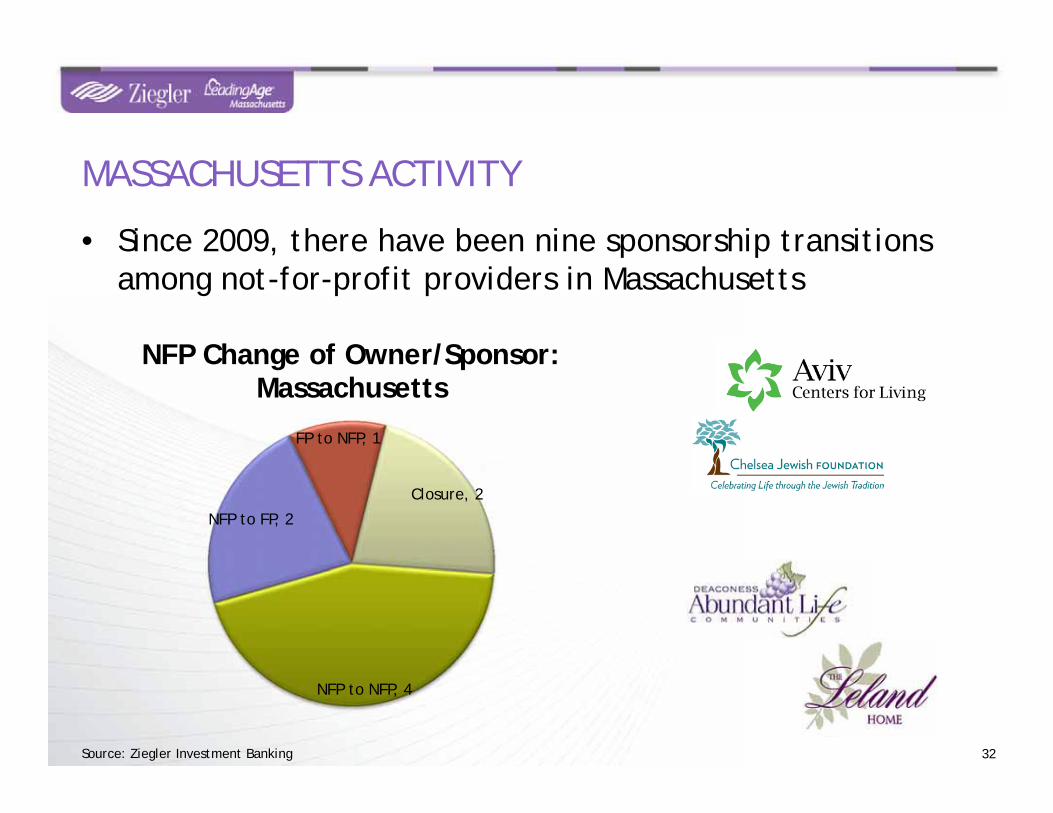
• Since 2009, there have been nine sponsorship transitions among not-for-profit providers in Massachusetts
MASSACHUSETTS ACTIVITY
32Source: Ziegler Investment Banking
NFP to NFP, 4
NFP to FP, 2
FP to NFP, 1
Closure, 2
NFP Change of Owner/Sponsor: Massachusetts
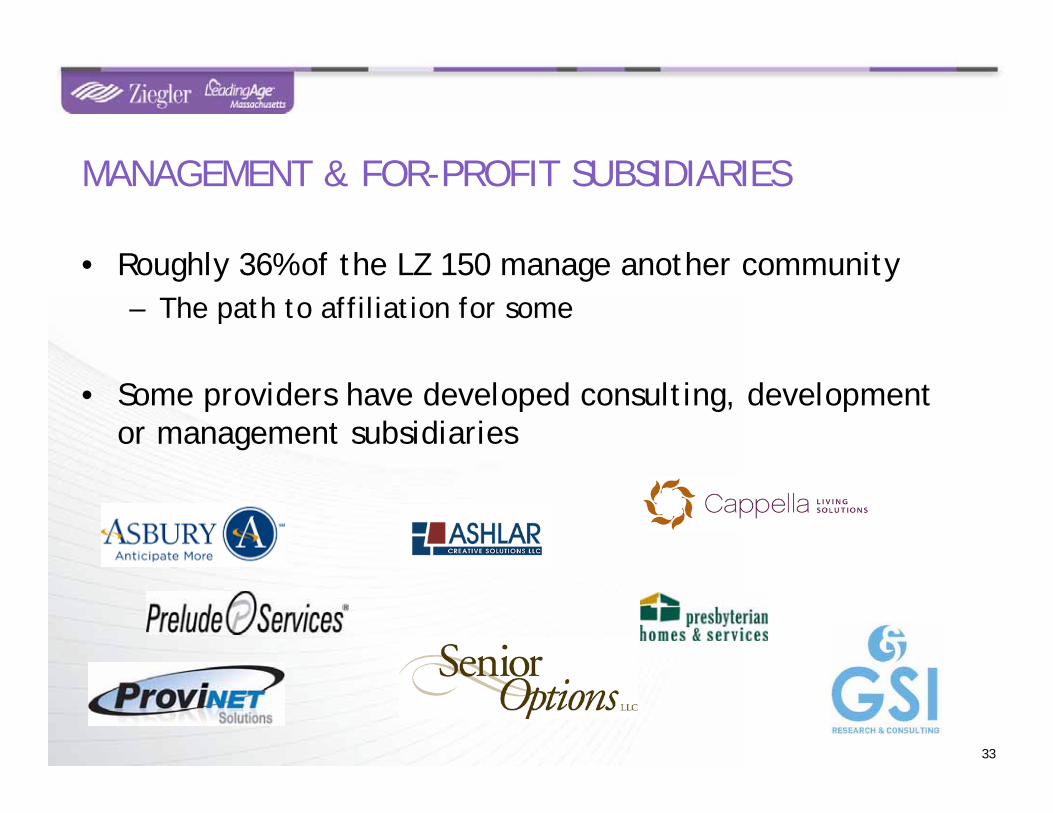
• Roughly 36% of the LZ 150 manage another community– The path to affiliation for some
• Some providers have developed consulting, development or management subsidiaries
MANAGEMENT & FOR-PROFIT SUBSIDIARIES
33
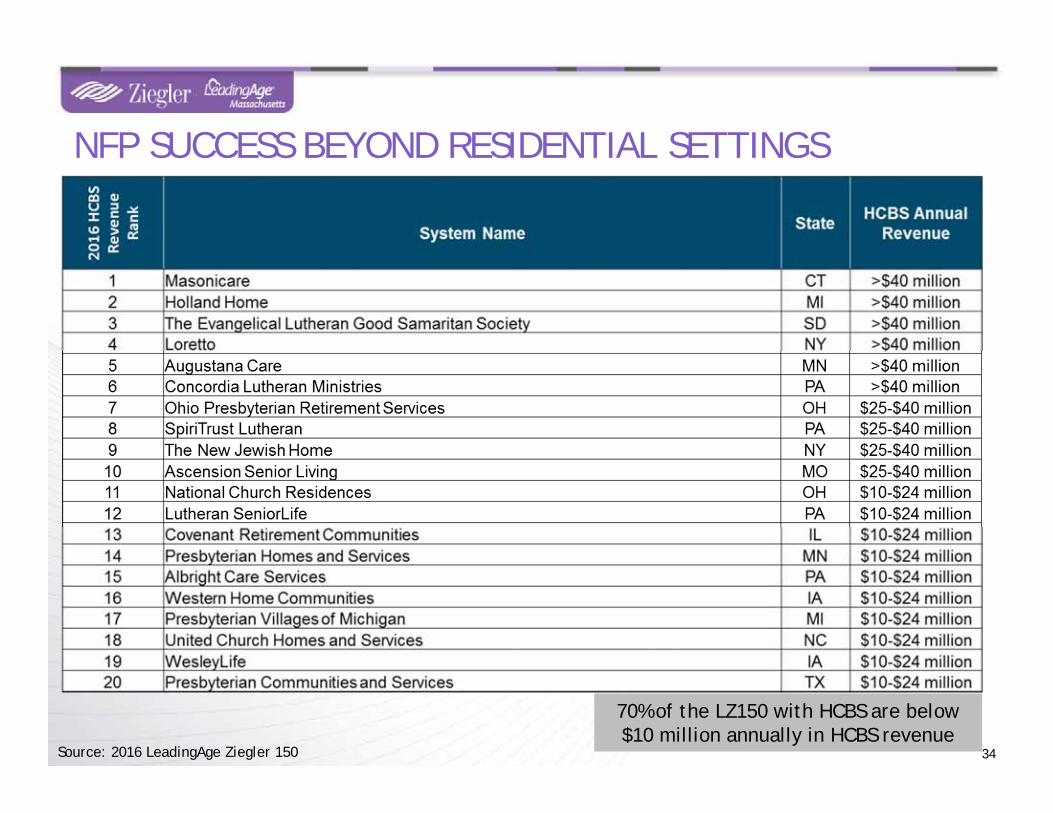
NFP SUCCESS BEYOND RESIDENTIAL SETTINGS
34Source: 2016 LeadingAge Ziegler 150
70% of the LZ150 with HCBS are below $10 million annually in HCBS revenue
TOPIC 3: DISRUPTORS IMPACTING NOT-FOR-PROFIT SENIOR LIVING
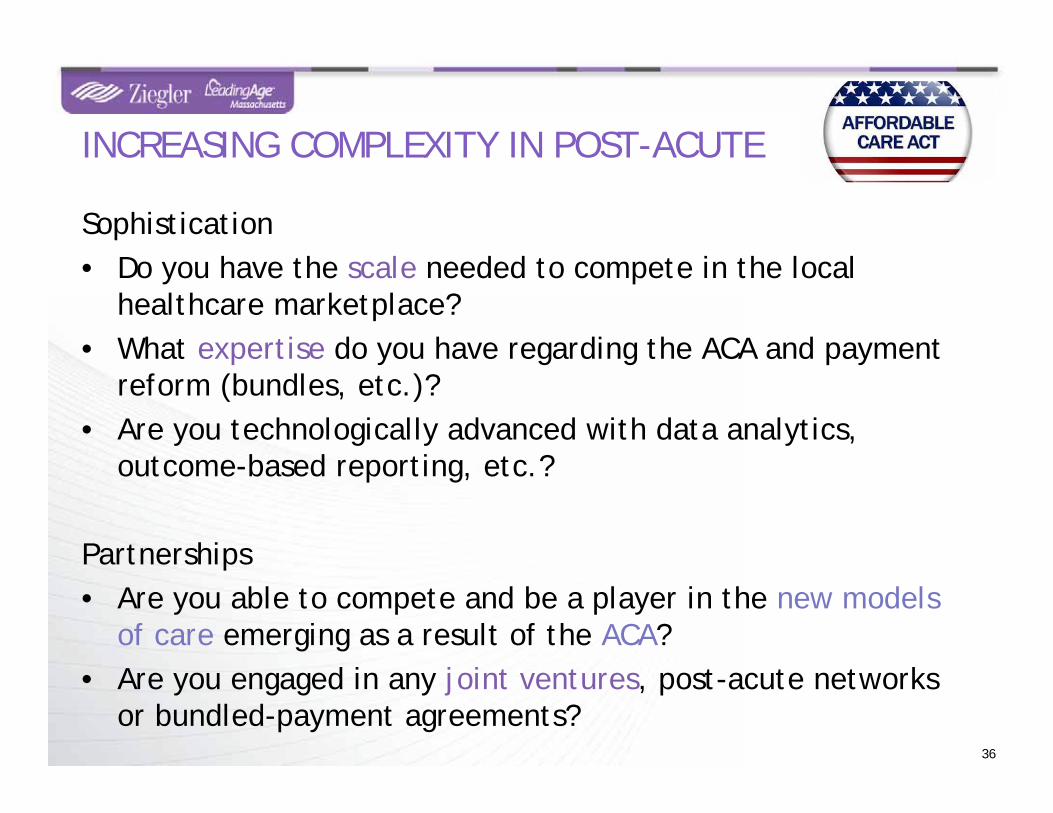
Sophistication• Do you have the scale needed to compete in the local
healthcare marketplace?• What expertise do you have regarding the ACA and payment
reform (bundles, etc.)?• Are you technologically advanced with data analytics,
outcome-based reporting, etc.?
Partnerships• Are you able to compete and be a player in the new models
of care emerging as a result of the ACA?• Are you engaged in any joint ventures, post-acute networks
or bundled-payment agreements?
INCREASING COMPLEXITY IN POST-ACUTE
36
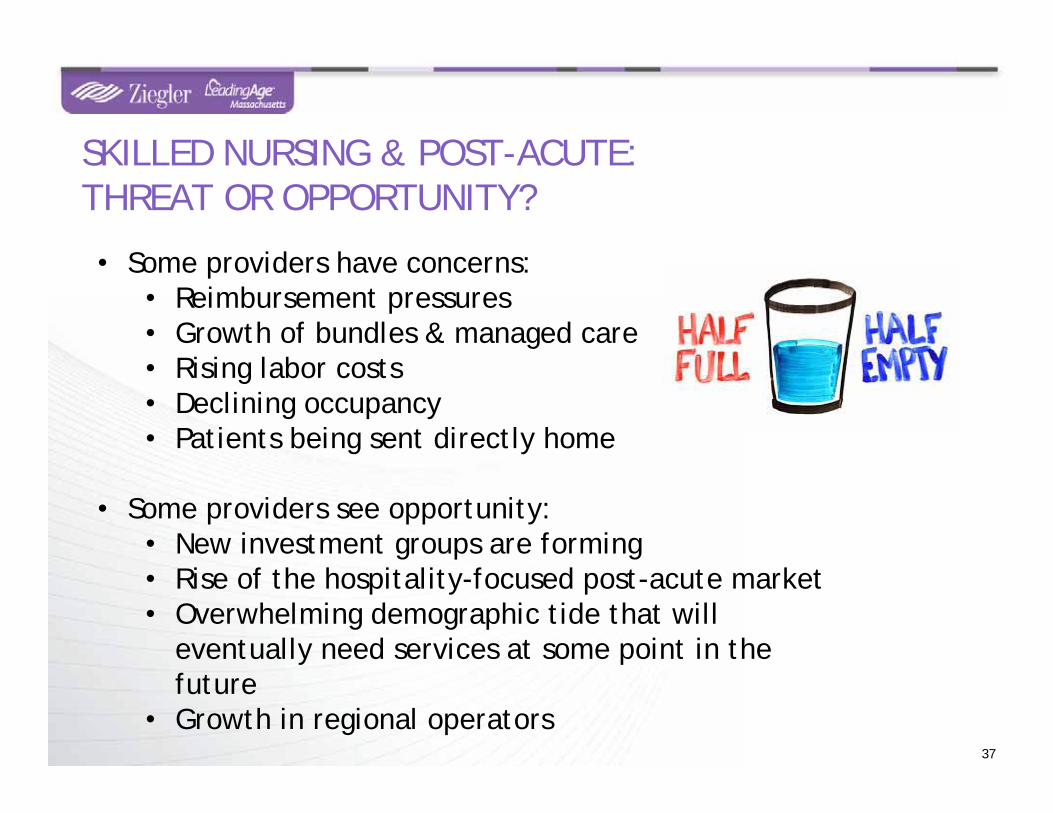
SKILLED NURSING & POST-ACUTE:THREAT OR OPPORTUNITY?
37
• Some providers have concerns:• Reimbursement pressures• Growth of bundles & managed care• Rising labor costs• Declining occupancy• Patients being sent directly home
• Some providers see opportunity:• New investment groups are forming• Rise of the hospitality-focused post-acute market• Overwhelming demographic tide that will
eventually need services at some point in the future
• Growth in regional operators
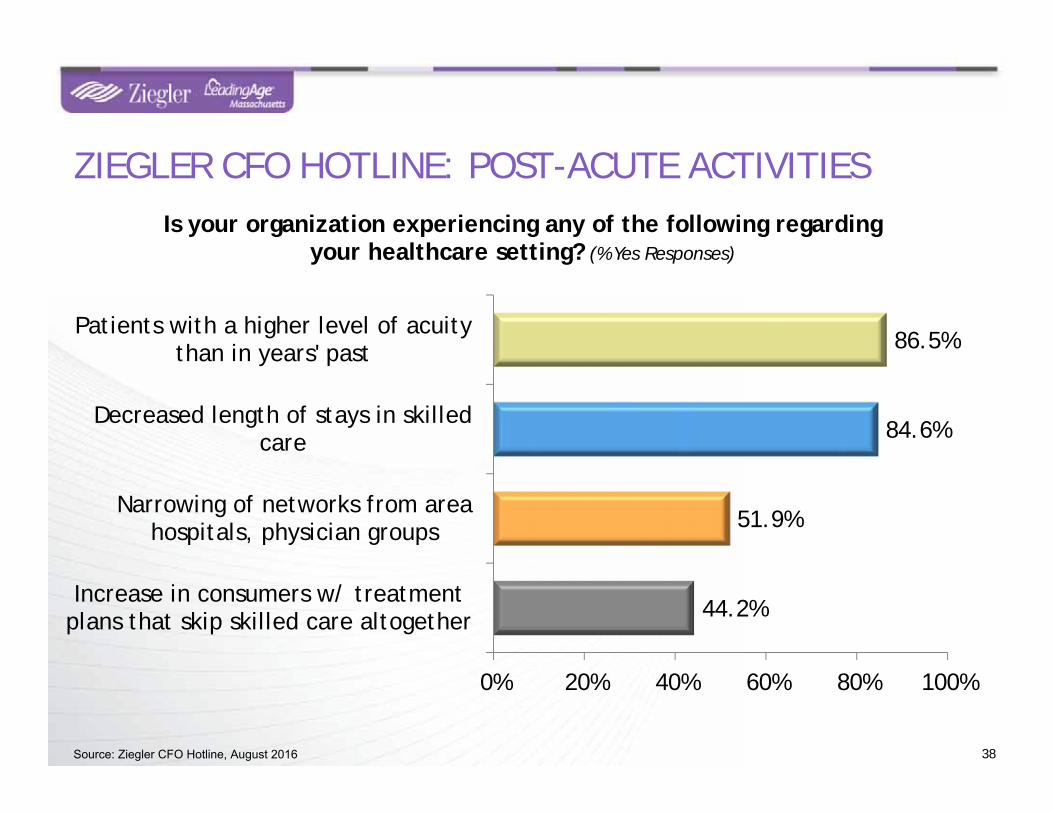
44.2%
51.9%
84.6%
86.5%
0% 20% 40% 60% 80% 100%
Increase in consumers w/ treatmentplans that skip skilled care altogether
Narrowing of networks from areahospitals, physician groups
Decreased length of stays in skilledcare
Patients with a higher level of acuitythan in years' past
Is your organization experiencing any of the following regarding your healthcare setting? (% Yes Responses)
38Source: Ziegler CFO Hotline, August 2016
ZIEGLER CFO HOTLINE: POST-ACUTE ACTIVITIES
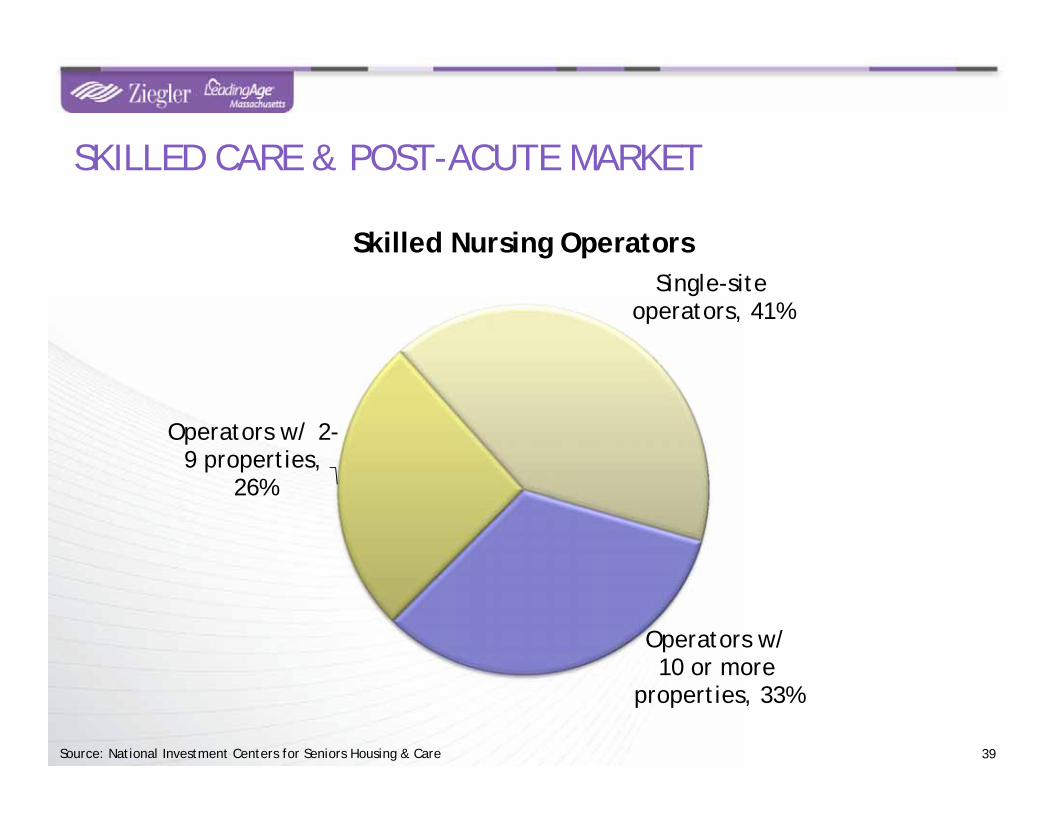
Operators w/ 10 or more
properties, 33%
Operators w/ 2-9 properties,
26%
Single-site operators, 41%
Skilled Nursing Operators
SKILLED CARE & POST-ACUTE MARKET
39Source: National Investment Centers for Seniors Housing & Care
• For-profits continue to grow nationally with new location development– Largely Independent Living, Assisted Living, Memory Care– Some hospitality-based post acute (e.g Mainstreet)
• For-profits are growing in residential services as well as home & community-based services
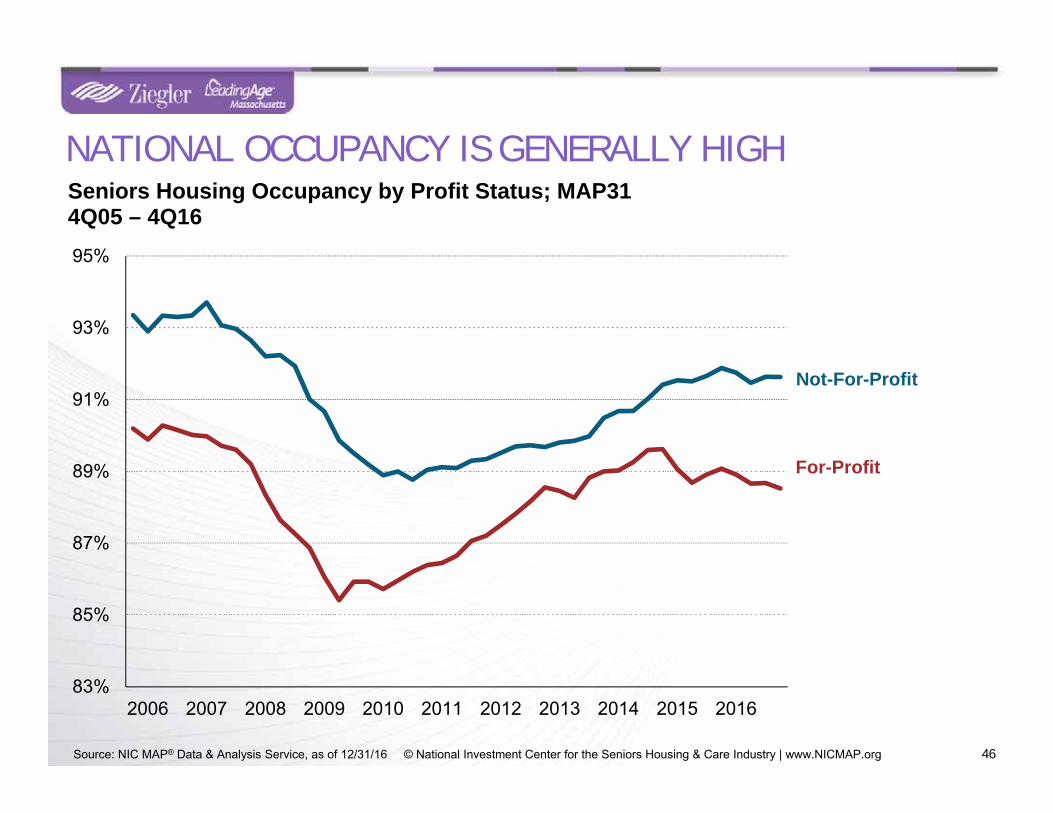
• Not-for-profits, however, consistently outperform for-profits with regard to occupancy
CONTINUED FOR-PROFIT GROWTH
40
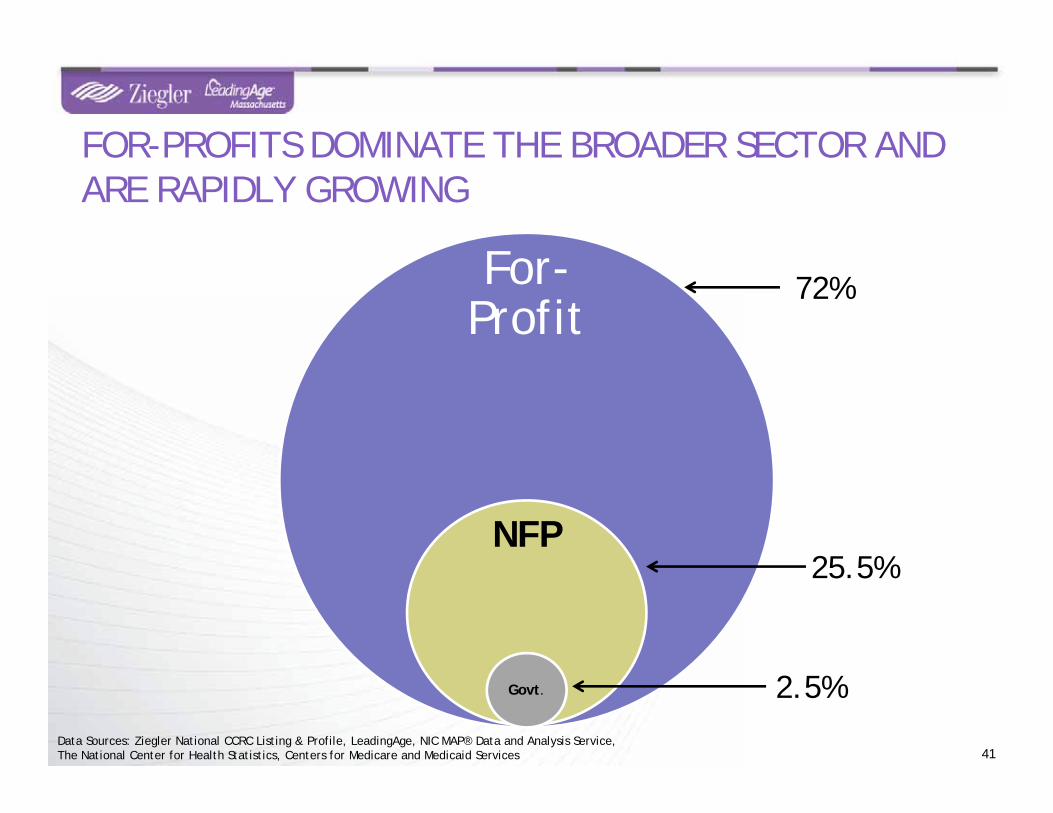
For-Profit
NFP
Govt.
FOR-PROFITS DOMINATE THE BROADER SECTOR AND ARE RAPIDLY GROWING
41Data Sources: Ziegler National CCRC Listing & Profile, LeadingAge, NIC MAP® Data and Analysis Service, The National Center for Health Statistics, Centers for Medicare and Medicaid Services
72%
25.5%
2.5%
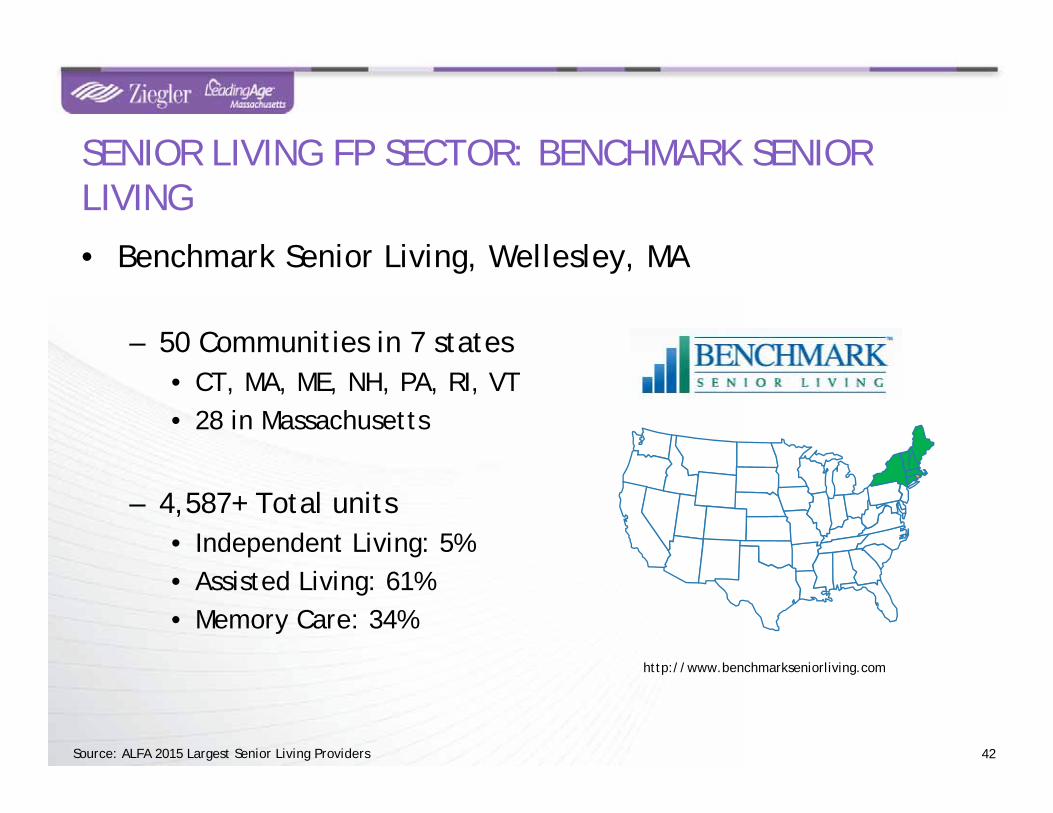
42
http://www.benchmarkseniorliving.com
SENIOR LIVING FP SECTOR: BENCHMARK SENIOR LIVING
• Benchmark Senior Living, Wellesley, MA
– 50 Communities in 7 states• CT, MA, ME, NH, PA, RI, VT• 28 in Massachusetts
– 4,587+ Total units• Independent Living: 5%• Assisted Living: 61%• Memory Care: 34%
Source: ALFA 2015 Largest Senior Living Providers
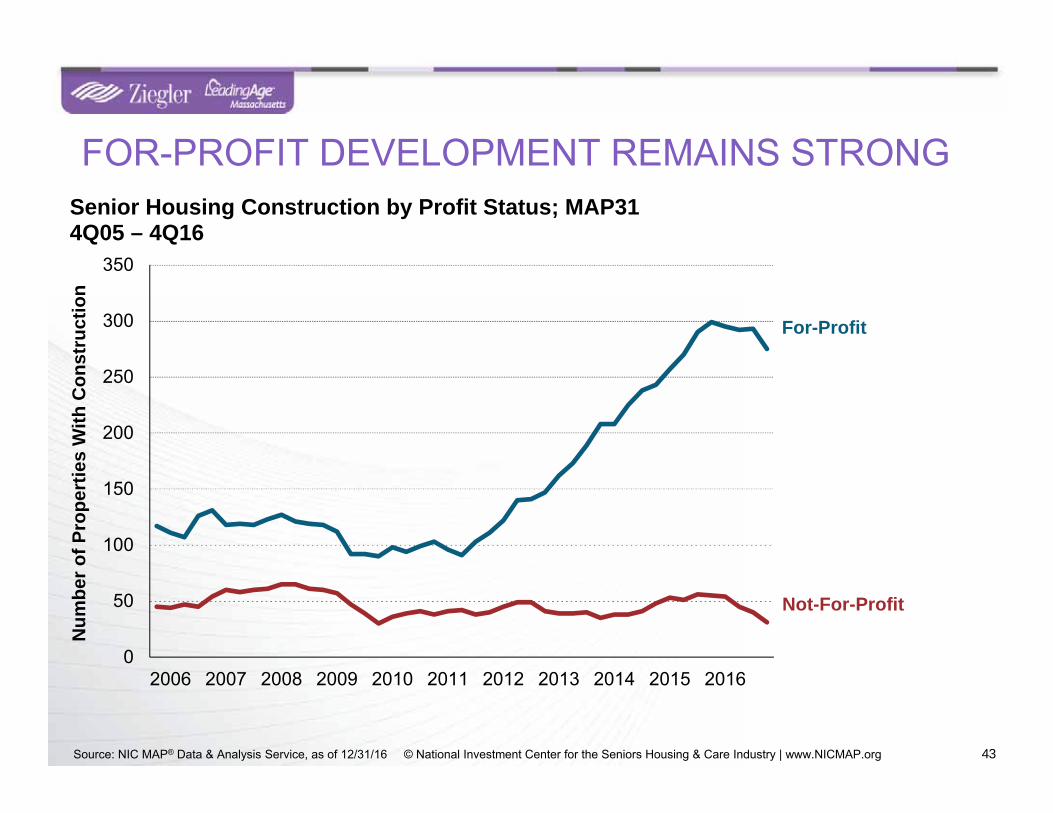
43Source: NIC MAP® Data & Analysis Service, as of 12/31/16 © National Investment Center for the Seniors Housing & Care Industry | www.NICMAP.org
FOR-PROFIT DEVELOPMENT REMAINS STRONG
43
0
50
100
150
200
250
300
350
2006 2007 2008 2009 2010 2011 2012 2013 2014 2015 2016
Num
ber o
f Pro
pert
ies
With
Con
stru
ctio
n
Senior Housing Construction by Profit Status; MAP314Q05 – 4Q16
Not-For-Profit
For-Profit
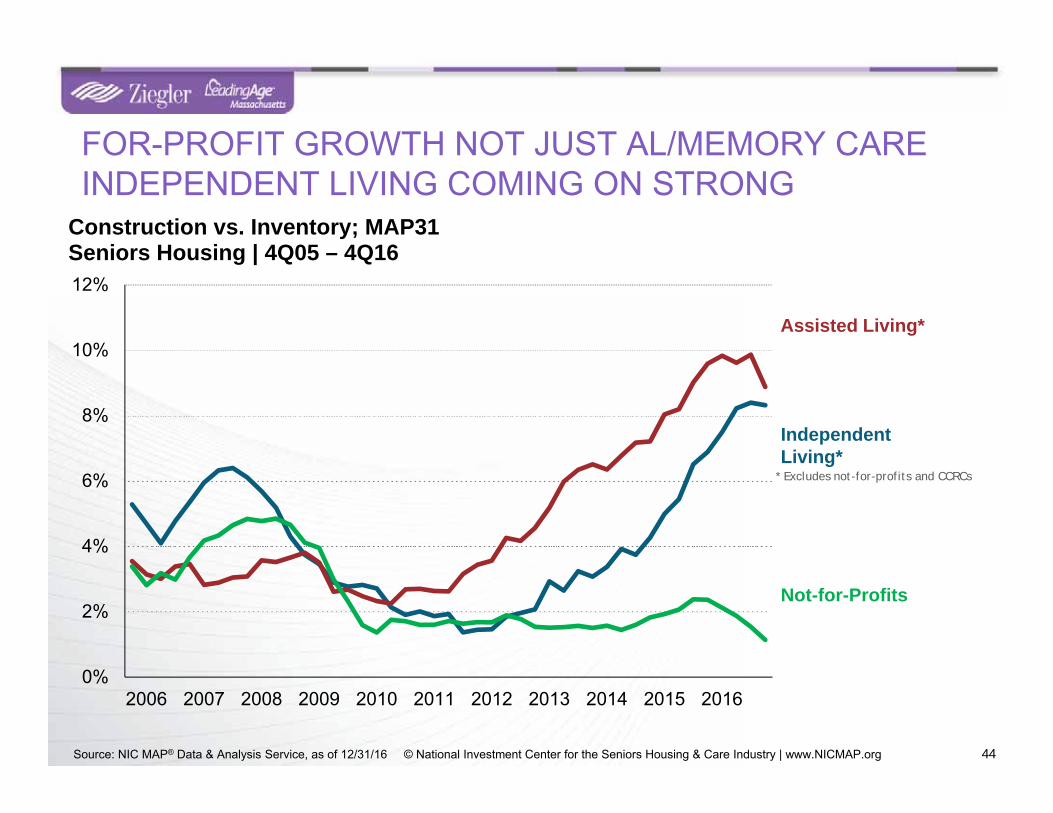
FOR-PROFIT GROWTH NOT JUST AL/MEMORY CARE INDEPENDENT LIVING COMING ON STRONG
44
* Excludes not-for-profits and CCRCs
Source: NIC MAP® Data & Analysis Service, as of 12/31/16 © National Investment Center for the Seniors Housing & Care Industry | www.NICMAP.org 44
0%
2%
4%
6%
8%
10%
12%
2006 2007 2008 2009 2010 2011 2012 2013 2014 2015 2016
Construction vs. Inventory; MAP31Seniors Housing | 4Q05 – 4Q16
Independent Living*
Assisted Living*
Not-for-Profits
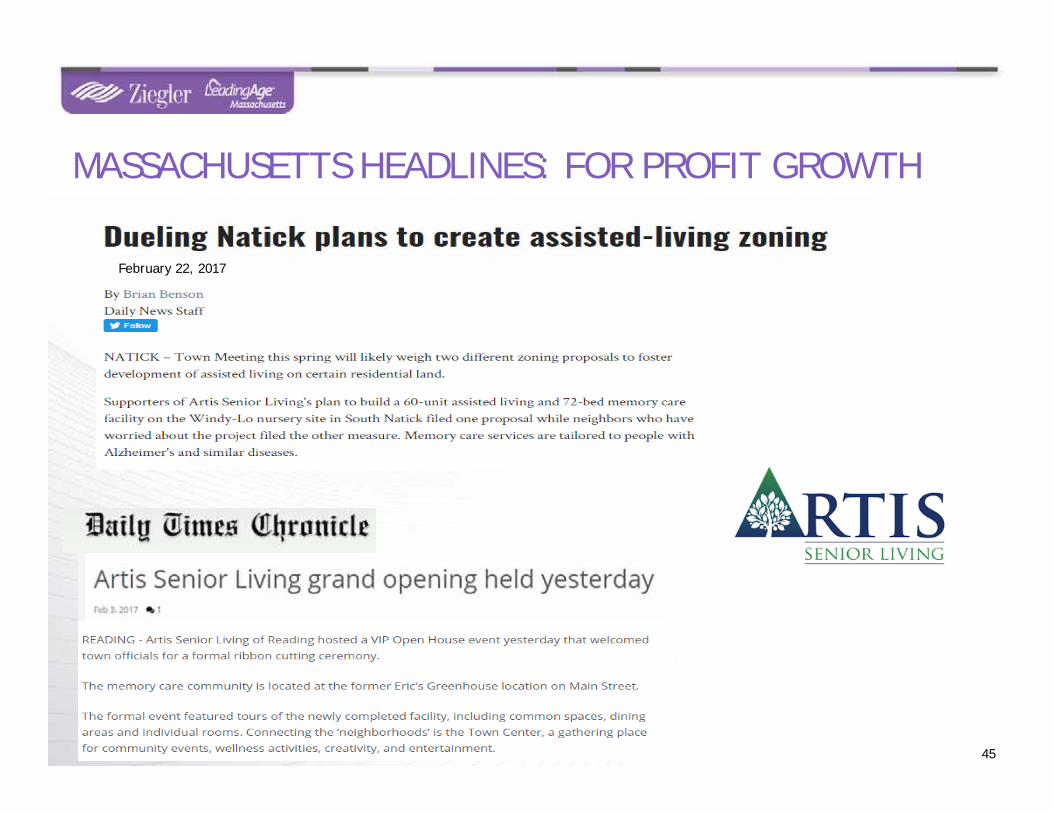
MASSACHUSETTS HEADLINES: FOR PROFIT GROWTH
45
February 22, 2017
46
NATIONAL OCCUPANCY IS GENERALLY HIGH
83%
85%
87%
89%
91%
93%
95%
2006 2007 2008 2009 2010 2011 2012 2013 2014 2015 2016
Seniors Housing Occupancy by Profit Status; MAP314Q05 – 4Q16
Not-For-Profit
For-Profit
Source: NIC MAP® Data & Analysis Service, as of 12/31/16 © National Investment Center for the Seniors Housing & Care Industry | www.NICMAP.org
47
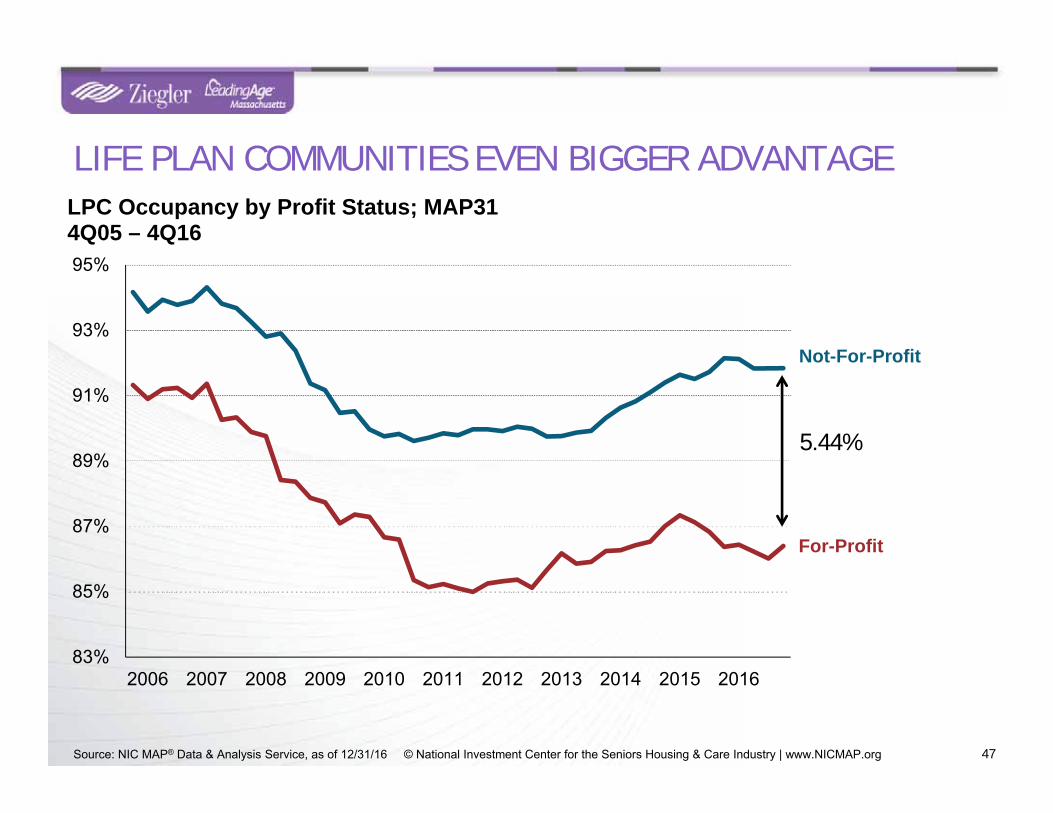
LIFE PLAN COMMUNITIES EVEN BIGGER ADVANTAGE
83%
85%
87%
89%
91%
93%
95%
2006 2007 2008 2009 2010 2011 2012 2013 2014 2015 2016
LPC Occupancy by Profit Status; MAP314Q05 – 4Q16
Not-For-Profit
For-Profit
5.44%
Source: NIC MAP® Data & Analysis Service, as of 12/31/16 © National Investment Center for the Seniors Housing & Care Industry | www.NICMAP.org
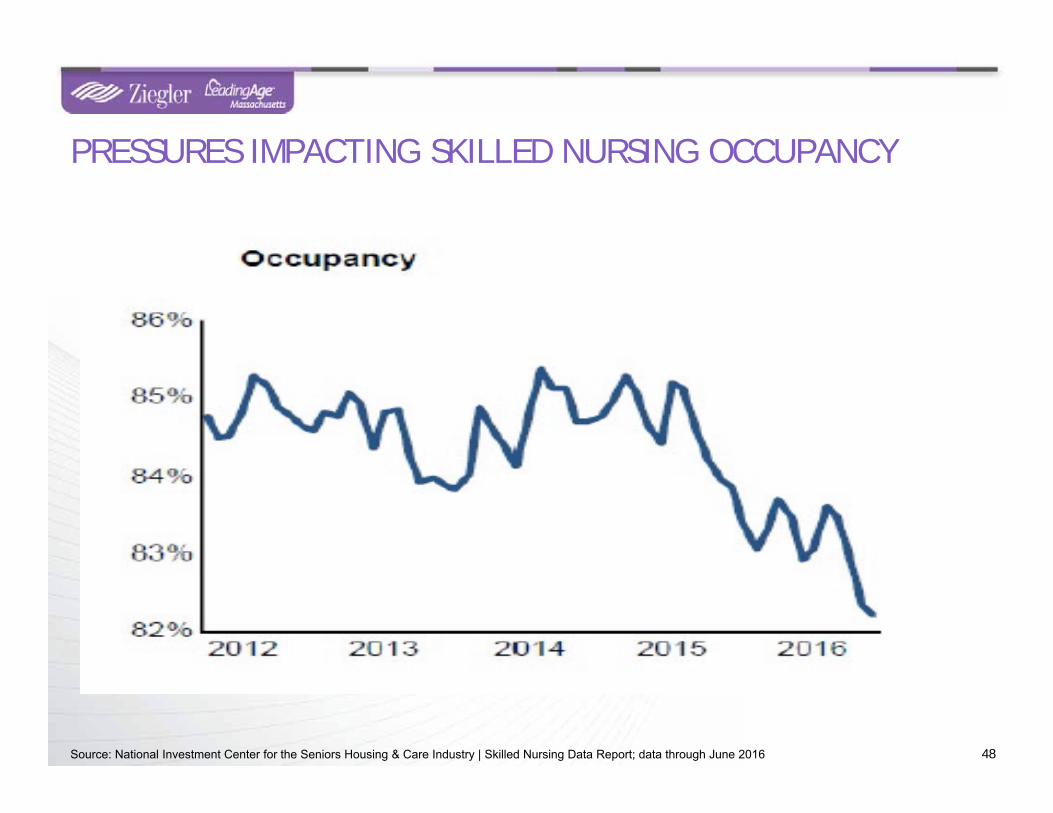
PRESSURES IMPACTING SKILLED NURSING OCCUPANCY
48Source: National Investment Center for the Seniors Housing & Care Industry | Skilled Nursing Data Report; data through June 2016
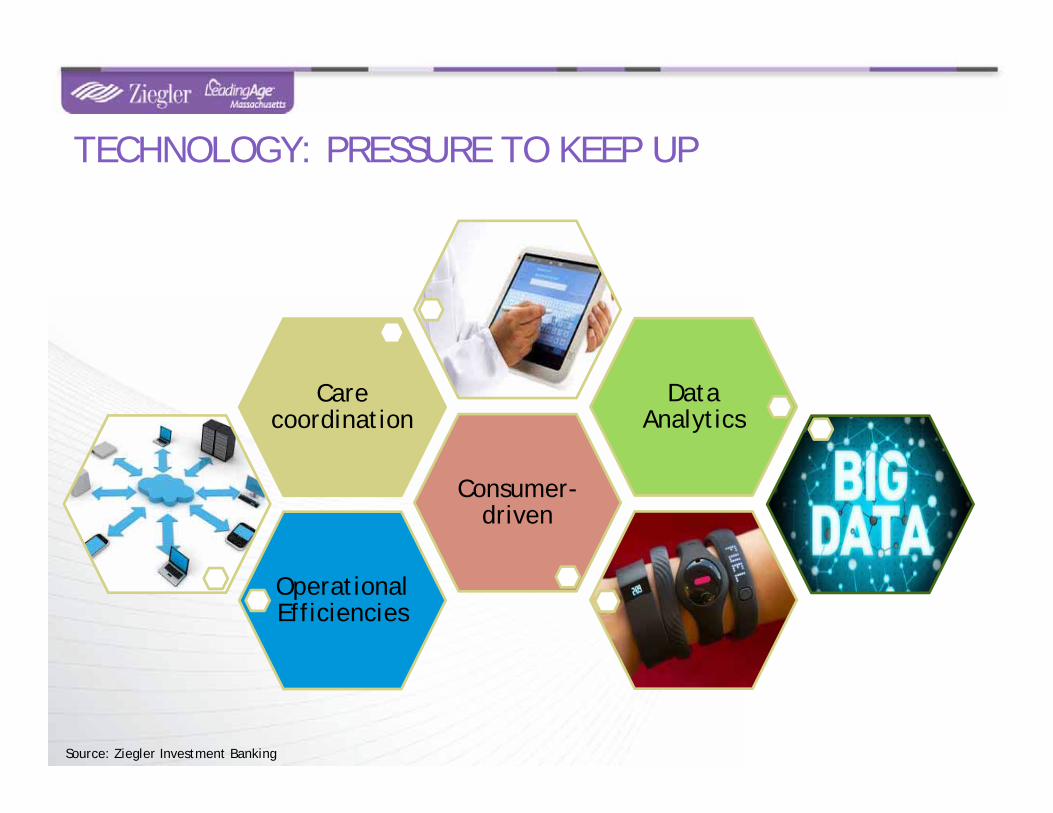
Operational Efficiencies
Consumer-driven
Care coordination
Data Analytics
TECHNOLOGY: PRESSURE TO KEEP UP
Source: Ziegler Investment Banking
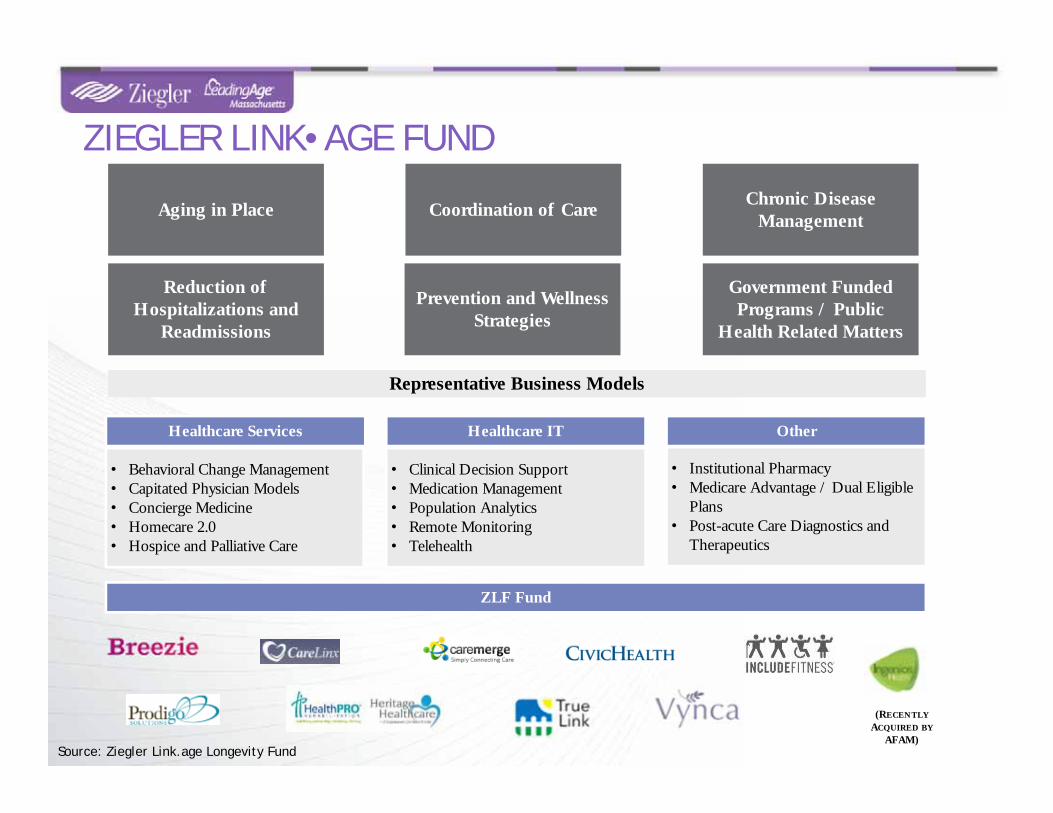
ZIEGLER LINK•AGE FUND
Healthcare Services Healthcare IT Other
• Behavioral Change Management• Capitated Physician Models• Concierge Medicine• Homecare 2.0• Hospice and Palliative Care
• Clinical Decision Support• Medication Management• Population Analytics• Remote Monitoring• Telehealth
• Institutional Pharmacy• Medicare Advantage / Dual Eligible
Plans• Post-acute Care Diagnostics and
Therapeutics
Representative Business Models
Reduction of Hospitalizations and
Readmissions
Prevention and Wellness Strategies
Government Funded Programs / Public
Health Related Matters
Aging in Place Coordination of CareChronic Disease
Management
ZLF Fund
(RECENTLY
ACQUIRED BY
AFAM)Source: Ziegler Link.age Longevity Fund
Age
Income
Services
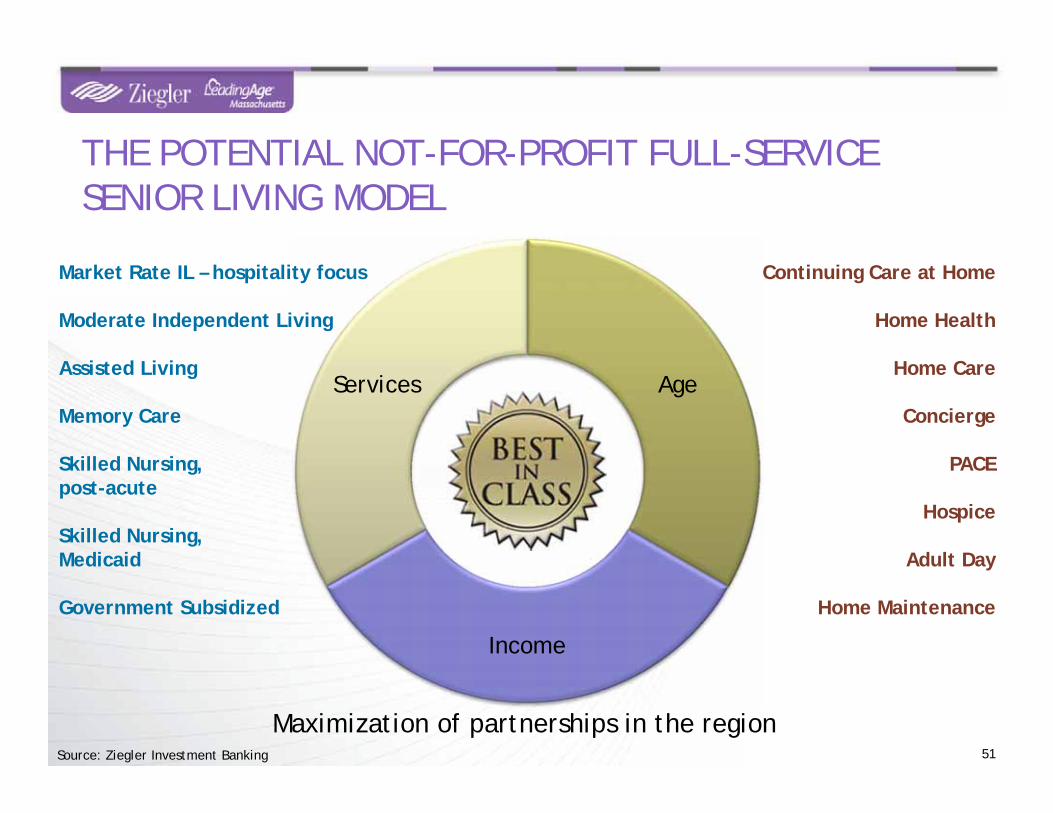
THE POTENTIAL NOT-FOR-PROFIT FULL-SERVICE SENIOR LIVING MODEL
51
Market Rate IL – hospitality focus
Moderate Independent Living
Assisted Living
Memory Care
Skilled Nursing, post-acute
Skilled Nursing, Medicaid
Government Subsidized
Continuing Care at Home
Home Health
Home Care
Concierge
PACE
Hospice
Adult Day
Home Maintenance
Source: Ziegler Investment Banking
Maximization of partnerships in the region
TOPIC 4: THE SENIOR LIVING CAPITAL MARKETS
$1,5
77
$1,4
90
$2,2
46
$2,5
06
$2,3
20
$2,2
93
$3,1
42
$3,5
24
$5,0
77
$4,9
82
$2,8
49
$2,8
60
$3,7
80
$3,1
60
$3,0
32
$4,1
38
$5,9
11
$7,3
94
$2,4
80
$1,8
01
$2,6
37
$1,1
48
$3,6
65
$2,7
95
$2,7
18
$3,8
02
$5,6
91
$475 $1
,066
$1,3
77
$1,4
35
$1,9
74
$2,5
43
$1,6
60
$1,5
00
$0
$1,000
$2,000
$3,000
$4,000
$5,000
$6,000
$7,000
$8,000
1990
1991
1992
1993
1994
1995
1996
1997
1998
1999
2000
2001
2002
2003
2004
2005
2006
2007
2008
2009
2010
2011
2012
2013
2014
2015
2016
(In
Mill
ions
)
Other Bank Credit Par Volume
53
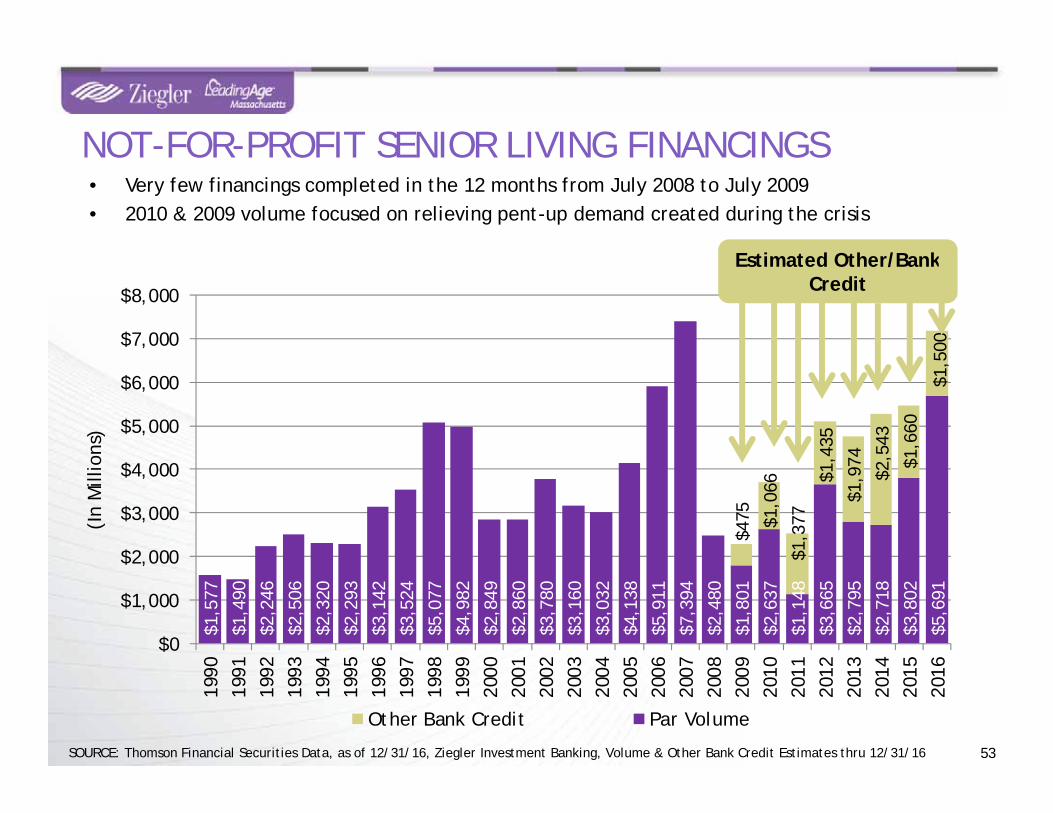
• Very few financings completed in the 12 months from July 2008 to July 2009• 2010 & 2009 volume focused on relieving pent-up demand created during the crisis
NOT-FOR-PROFIT SENIOR LIVING FINANCINGS
SOURCE: Thomson Financial Securities Data, as of 12/31/16, Ziegler Investment Banking, Volume & Other Bank Credit Estimates thru 12/31/16
Estimated Other/Bank Credit
54
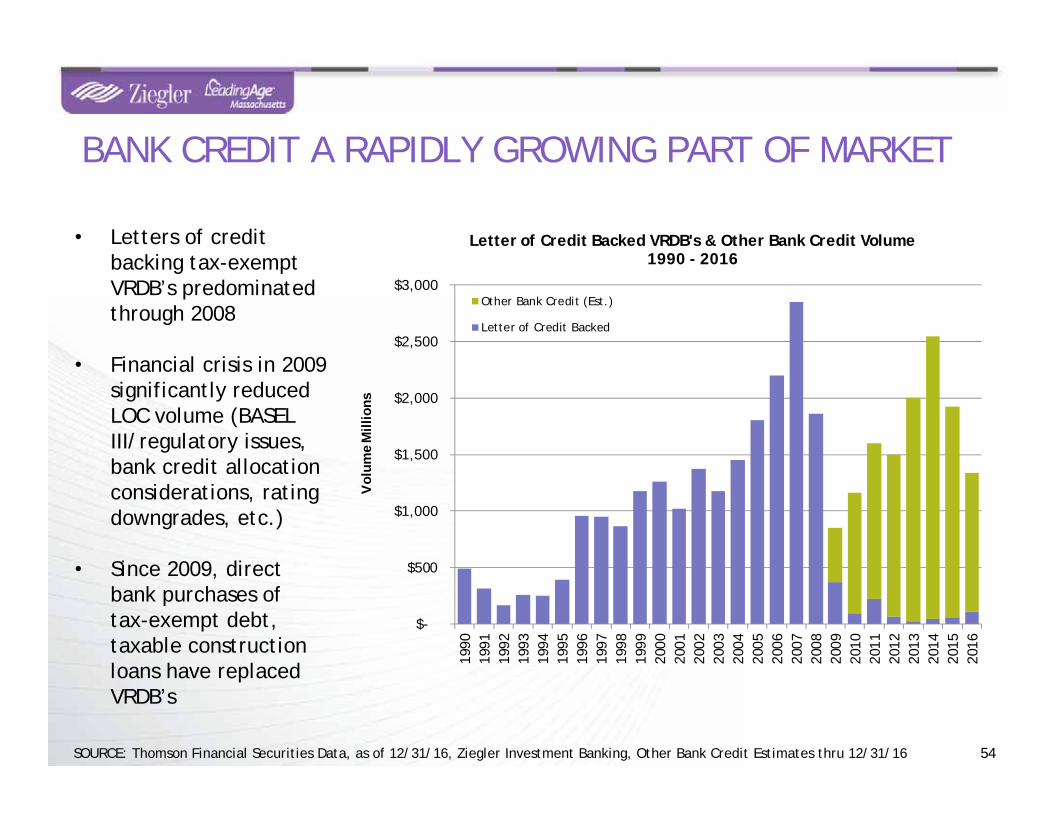
BANK CREDIT A RAPIDLY GROWING PART OF MARKET
SOURCE: Thomson Financial Securities Data, as of 12/31/16, Ziegler Investment Banking, Other Bank Credit Estimates thru 12/31/16
$-
$500
$1,000
$1,500
$2,000
$2,500
$3,000
1990
1991
1992
1993
1994
1995
1996
1997
1998
1999
2000
2001
2002
2003
2004
2005
2006
2007
2008
2009
2010
2011
2012
2013
2014
2015
2016
Vol
ume
Mill
ions
Letter of Credit Backed VRDB's & Other Bank Credit Volume1990 - 2016
Other Bank Credit (Est.)
Letter of Credit Backed
• Letters of credit backing tax-exempt VRDB’s predominated through 2008
• Financial crisis in 2009 significantly reduced LOC volume (BASEL III/regulatory issues, bank credit allocation considerations, rating downgrades, etc.)
• Since 2009, direct bank purchases of tax-exempt debt, taxable construction loans have replaced VRDB’s
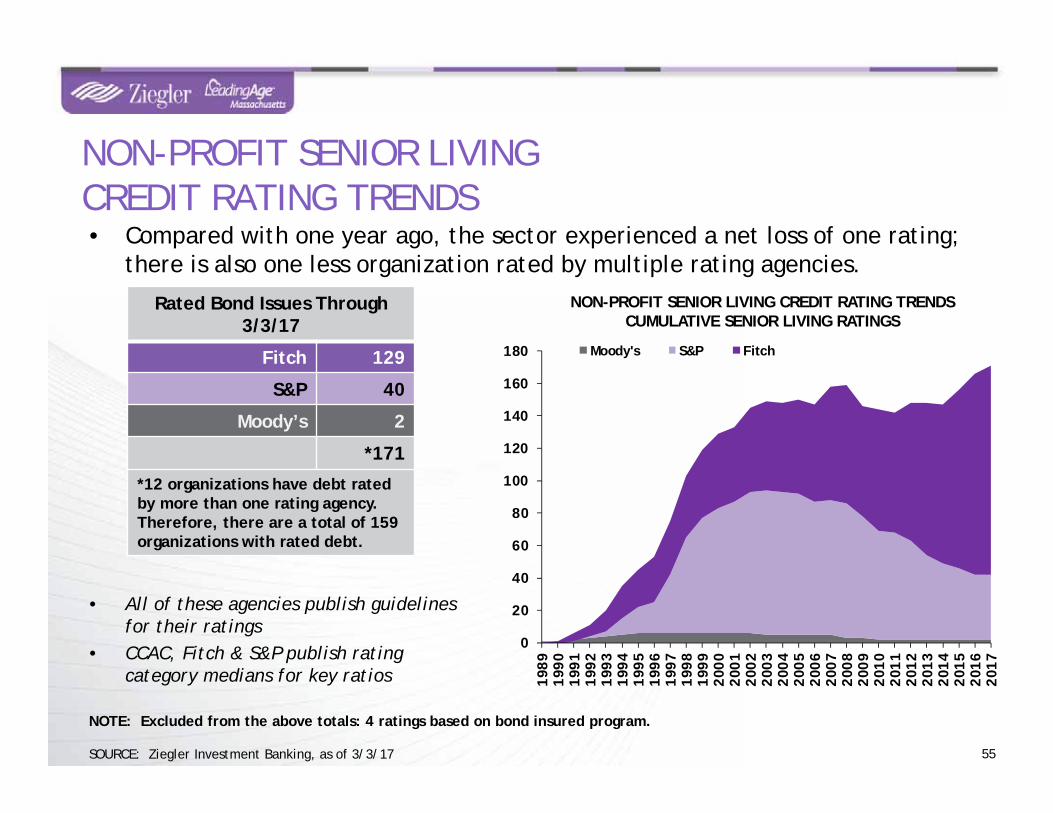
• Compared with one year ago, the sector experienced a net loss of one rating; there is also one less organization rated by multiple rating agencies.
55
NON-PROFIT SENIOR LIVING CREDIT RATING TRENDSCUMULATIVE SENIOR LIVING RATINGS
• All of these agencies publish guidelines for their ratings
• CCAC, Fitch & S&P publish rating category medians for key ratios
Rated Bond Issues Through 3/3/17
Fitch 129
S&P 40
Moody’s 2
*171
*12 organizations have debt rated by more than one rating agency. Therefore, there are a total of 159organizations with rated debt.
SOURCE: Ziegler Investment Banking, as of 3/3/17
NON-PROFIT SENIOR LIVINGCREDIT RATING TRENDS
NOTE: Excluded from the above totals: 4 ratings based on bond insured program.
0
20
40
60
80
100
120
140
160
180
1989
1990
1991
1992
1993
1994
1995
1996
1997
1998
1999
2000
2001
2002
2003
2004
2005
2006
2007
2008
2009
2010
2011
2012
2013
2014
2015
2016
2017
Moody's S&P Fitch
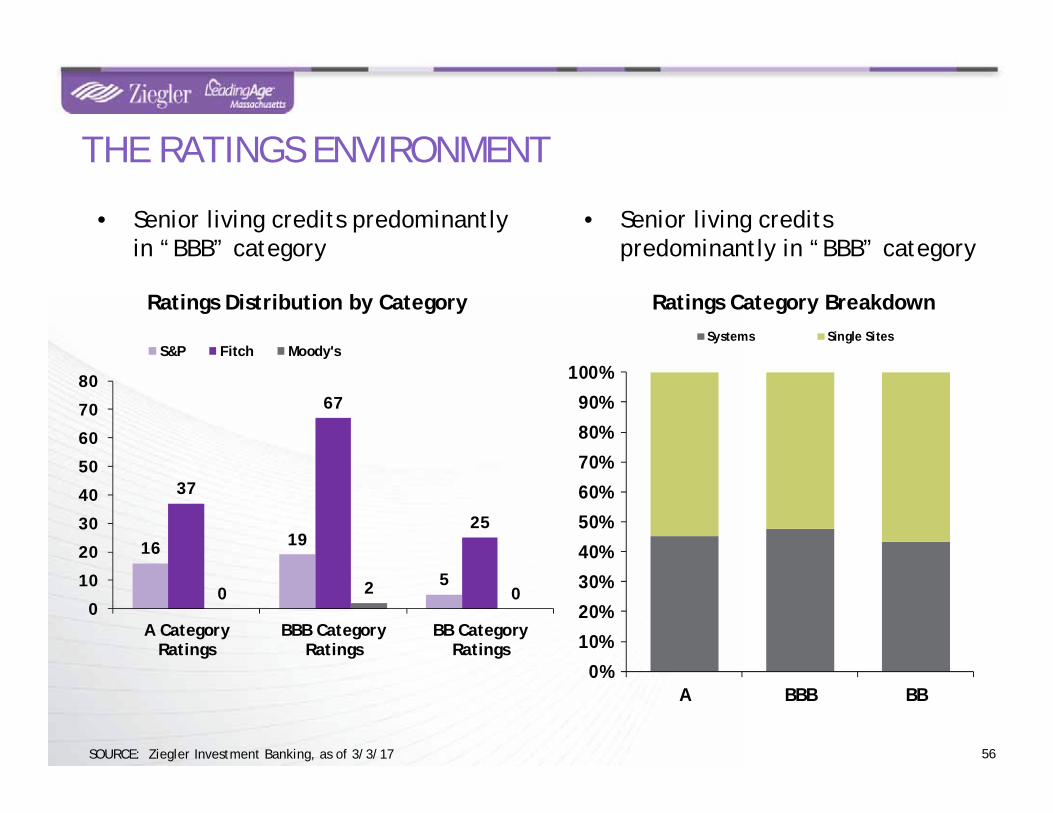
• Senior living credits predominantly in “BBB” category
THE RATINGS ENVIRONMENT
56
• Senior living credits predominantly in “BBB” category
16 19
5
37
67
25
0 2 00
10
20
30
40
50
60
70
80
A CategoryRatings
BBB CategoryRatings
BB CategoryRatings
S&P Fitch Moody's
0%
10%
20%
30%
40%
50%
60%
70%
80%
90%
100%
A BBB BB
Systems Single Sites
Ratings Distribution by Category Ratings Category Breakdown
SOURCE: Ziegler Investment Banking, as of 3/3/17
0
5
10
15
20
25
30
35
40
1.95
2.05
2.15
2.25
2.35
2.45
2.55
2.65
2.75
2.85
2.95
3.05
3.15
3.25
3.35
3.45
3.55
3.65
3.75
3.85
3.95
4.05
4.15
4.25
4.35
4.45
4.55
4.65
4.75
4.85
4.95
5.05
5.15
5.25
5.35
5.45
5.55
5.65
5.75
5.85
5.95
6.05
6.15
6.25
6.35
6.45
6.55
6.65
6.75
6.85
6.95
7.05
Freq
uenc
y
30-yr "AAA" MMD
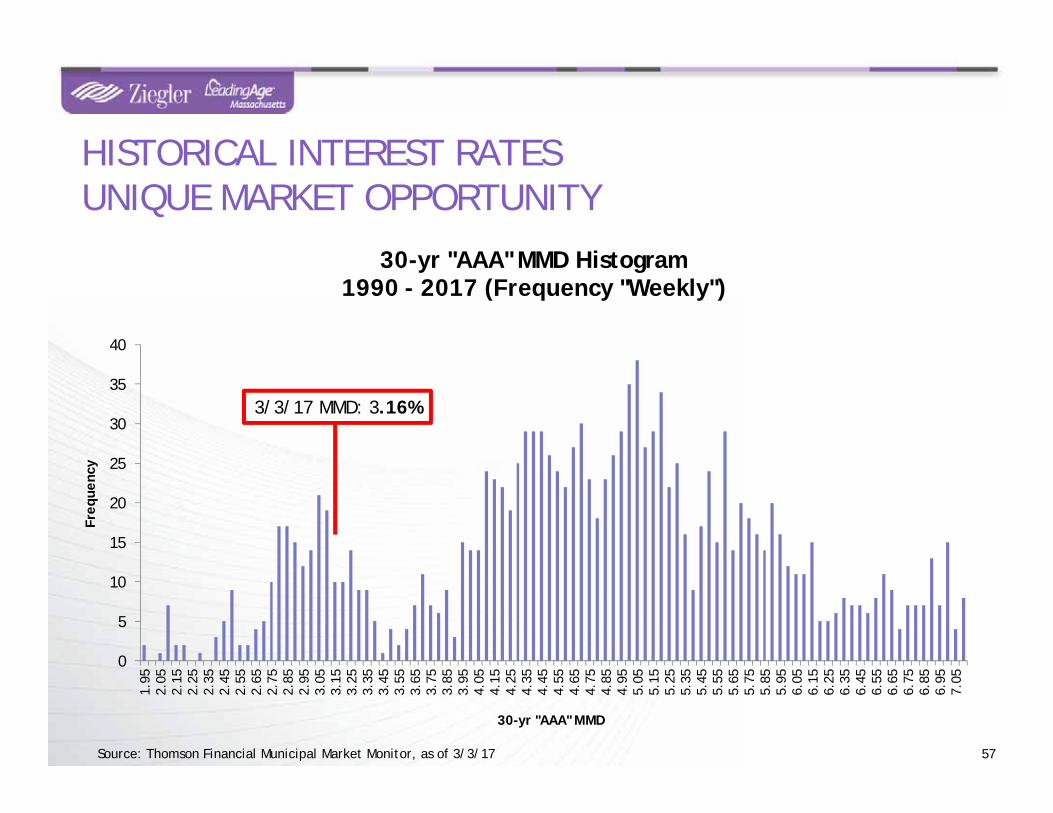
30-yr "AAA" MMD Histogram1990 - 2017 (Frequency "Weekly")
57
HISTORICAL INTEREST RATESUNIQUE MARKET OPPORTUNITY
3/3/17 MMD: 3.16%
Source: Thomson Financial Municipal Market Monitor, as of 3/3/17
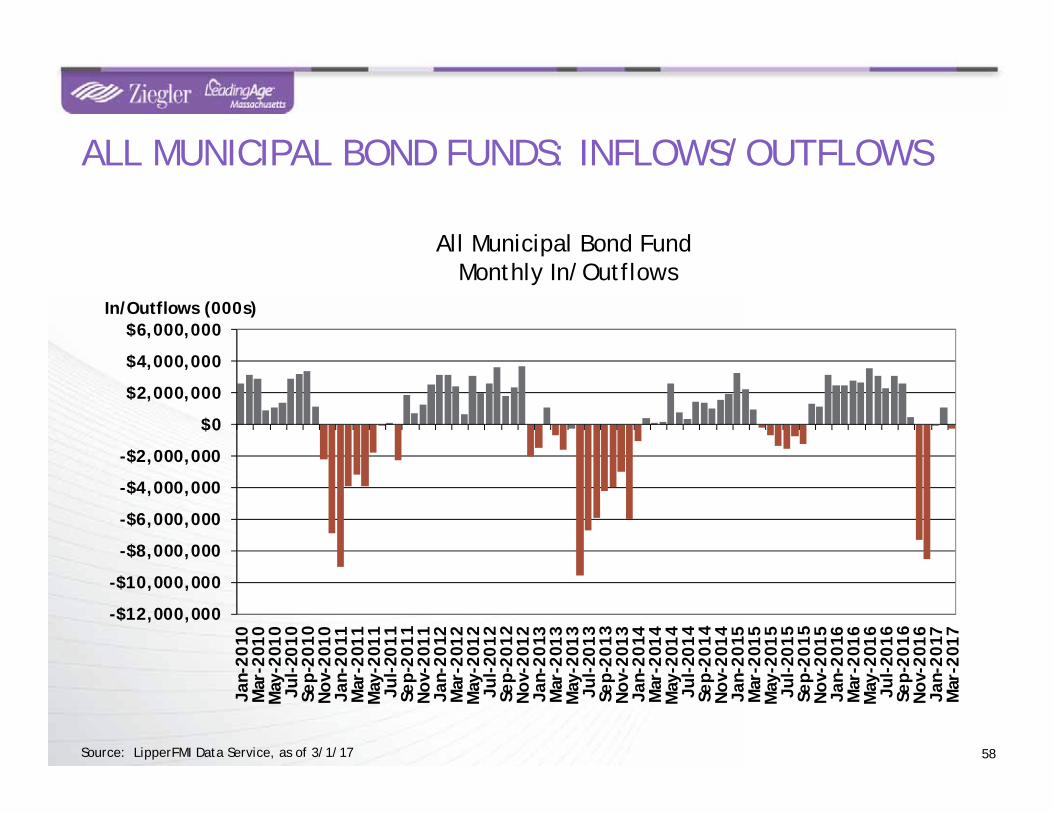
ALL MUNICIPAL BOND FUNDS: INFLOWS/OUTFLOWS
58
All Municipal Bond Fund Monthly In/Outflows
-$12,000,000
-$10,000,000
-$8,000,000
-$6,000,000
-$4,000,000
-$2,000,000
$0
$2,000,000
$4,000,000
$6,000,000
Jan-
2010
Mar
-201
0M
ay-2
010
Jul-
2010
Sep-
2010
Nov
-201
0Ja
n-20
11M
ar-2
011
May
-201
1Ju
l-20
11Se
p-20
11N
ov-2
011
Jan-
2012
Mar
-201
2M
ay-2
012
Jul-
2012
Sep-
2012
Nov
-201
2Ja
n-20
13M
ar-2
013
May
-201
3Ju
l-20
13Se
p-20
13N
ov-2
013
Jan-
2014
Mar
-201
4M
ay-2
014
Jul-
2014
Sep-
2014
Nov
-201
4Ja
n-20
15M
ar-2
015
May
-201
5Ju
l-20
15Se
p-20
15N
ov-2
015
Jan-
2016
Mar
-201
6M
ay-2
016
Jul-
2016
Sep-
2016
Nov
-201
6Ja
n-20
17M
ar-2
017
In/Outflows (000s)
Source: LipperFMI Data Service, as of 3/1/17
59
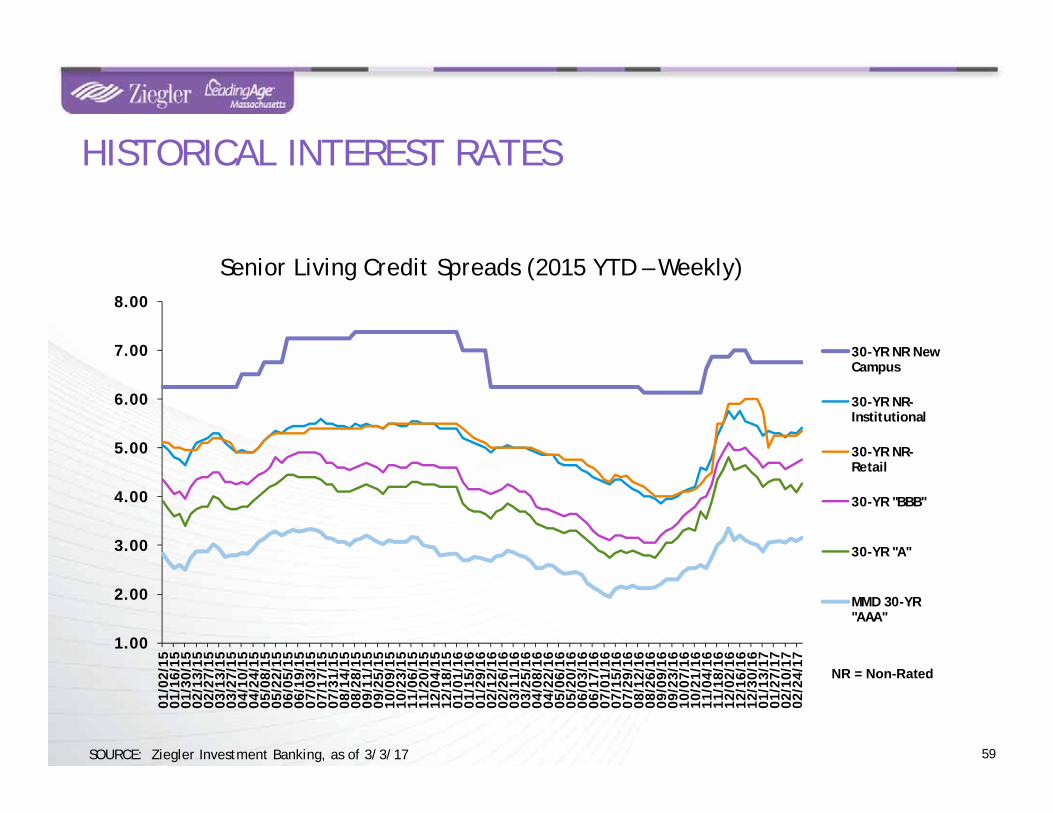
HISTORICAL INTEREST RATES
Senior Living Credit Spreads (2015 YTD – Weekly)
NR = Non-Rated
SOURCE: Ziegler Investment Banking, as of 3/3/17
1.00
2.00
3.00
4.00
5.00
6.00
7.00
8.00
01/0
2/15
01/1
6/15
01/3
0/15
02/1
3/15
02/2
7/15
03/1
3/15
03/2
7/15
04/1
0/15
04/2
4/15
05/0
8/15
05/2
2/15
06/0
5/15
06/1
9/15
07/0
3/15
07/1
7/15
07/3
1/15
08/1
4/15
08/2
8/15
09/1
1/15
09/2
5/15
10/0
9/15
10/2
3/15
11/0
6/15
11/2
0/15
12/0
4/15
12/1
8/15
01/0
1/16
01/1
5/16
01/2
9/16
02/1
2/16
02/2
6/16
03/1
1/16
03/2
5/16
04/0
8/16
04/2
2/16
05/0
6/16
05/2
0/16
06/0
3/16
06/1
7/16
07/0
1/16
07/1
5/16
07/2
9/16
08/1
2/16
08/2
6/16
09/0
9/16
09/2
3/16
10/0
7/16
10/2
1/16
11/0
4/16
11/1
8/16
12/0
2/16
12/1
6/16
12/3
0/16
01/1
3/17
01/2
7/17
02/1
0/17
02/2
4/17
30-YR NR NewCampus
30-YR NR-Institutional
30-YR NR-Retail
30-YR "BBB"
30-YR "A"
MMD 30-YR"AAA"
60
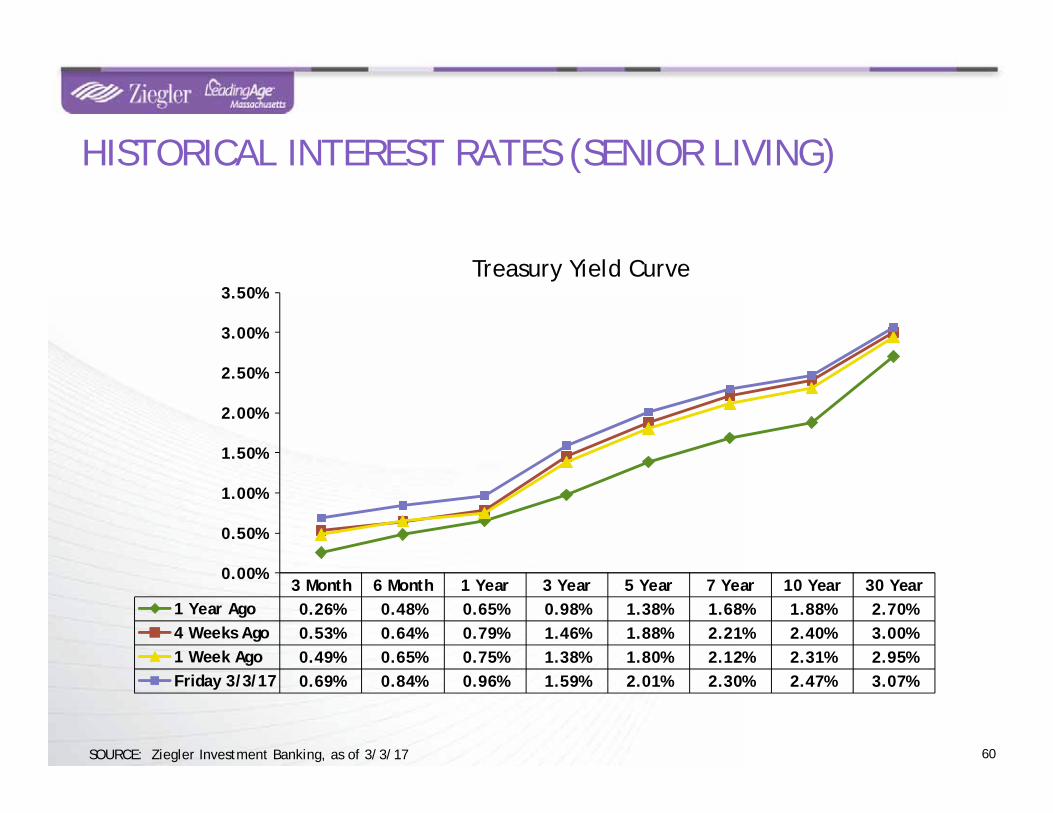
3 Month 6 Month 1 Year 3 Year 5 Year 7 Year 10 Year 30 Year1 Year Ago 0.26% 0.48% 0.65% 0.98% 1.38% 1.68% 1.88% 2.70%4 Weeks Ago 0.53% 0.64% 0.79% 1.46% 1.88% 2.21% 2.40% 3.00%1 Week Ago 0.49% 0.65% 0.75% 1.38% 1.80% 2.12% 2.31% 2.95%Friday 3/3/17 0.69% 0.84% 0.96% 1.59% 2.01% 2.30% 2.47% 3.07%
0.00%
0.50%
1.00%
1.50%
2.00%
2.50%
3.00%
3.50%Treasury Yield Curve
HISTORICAL INTEREST RATES (SENIOR LIVING)
SOURCE: Ziegler Investment Banking, as of 3/3/17
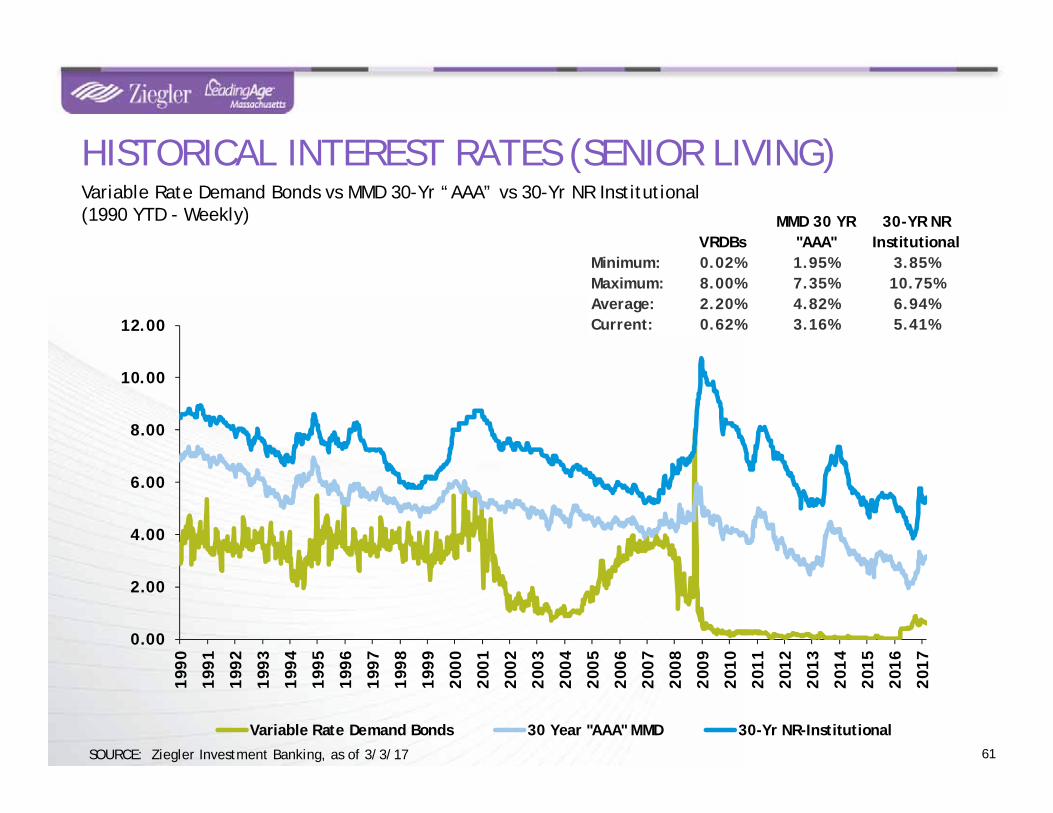
VRDBsMMD 30 YR
"AAA"30-YR NR
InstitutionalMinimum: 0.02% 1.95% 3.85%Maximum: 8.00% 7.35% 10.75%Average: 2.20% 4.82% 6.94%Current: 0.62% 3.16% 5.41%
HISTORICAL INTEREST RATES (SENIOR LIVING)
61
Variable Rate Demand Bonds vs MMD 30-Yr “AAA” vs 30-Yr NR Institutional(1990 YTD - Weekly)
0.00
2.00
4.00
6.00
8.00
10.00
12.00
1990
1991
1992
1993
1994
1995
1996
1997
1998
1999
2000
2001
2002
2003
2004
2005
2006
2007
2008
2009
2010
2011
2012
2013
2014
2015
2016
2017
Variable Rate Demand Bonds 30 Year "AAA" MMD 30-Yr NR-InstitutionalSOURCE: Ziegler Investment Banking, as of 3/3/17
QUESTIONS & ANSWERS
B.C. Ziegler and Company is registered with the National Association of State Boards of Accountancy (NASBA) as a sponsor of continuing professional education on the National Registry of CPE Sponsors. State boards of accountancy have final authority on the acceptance of individual courses for CPE credit. Complaints regarding registered sponsors may be addressed to the National Registry of CPE Sponsors, 150 Fourth Avenue North, Suite 700, Nashville, TN, 37219-2417. Web site: www.nasba.org. Attendees are eligible to receive credits for attendance at the 2017 LeadingAge Massachusetts & Ziegler Senior Living Symposium. No prerequisites are required for this group-live educational conference. Program level is basic.
For more information regarding administrative policies such as complaint and refund, please contact our offices at 312-705-7262. Fees for this workshop are detailed on the registration form.
©2017 B.C. Ziegler and Company | Member SIPC and FINRA
• Ziegler is a privately-held investment bank, capital markets, wealth management and alternative investments firm
• A registered broker dealer with SIPC & FINRA
• Ziegler provides its clients with capital raising, strategic advisory services, equity & fixed-income trading, wealth management and research
• Founded in 1902, Ziegler specializes in the healthcare, senior living, educational and religious sectors as well as general municipal finance
ABOUT ZIEGLER
63
DISCLAIMERInvestment banking services offered through B.C. Ziegler and Company. FHA mortgage banking services are provided through ZieglerFinancing Corporation which is not a registered broker/dealer. Ziegler Financing Corporation and B.C. Ziegler and Company areaffiliated and referral fees may be paid by either entity for services provided.
This presentation was prepared based upon information provided to Ziegler Investment Banking (ZIB) and contains certain financialinformation, including audited and unaudited information, certain statistical information and explanations of such information innarrative form (the “Information”). ZIB believes this information to be correct as of the date or dates contained herein. However,the financial affairs change constantly, and such changes may be material. Today’s discussion may contain forward-lookingstatements, which may or may not come to fruition depending on certain circumstances, including those outside the control ofmanagement. Please be advised that ZIB has not undertaken, assumed no duty and are not obligated to update the Information. Inaddition, please be advised that past financial results do not predict future financial performance. The material in this presentationis designed to present potential financing structures and options for discussion, however it does not represent a commitment tounderwrite bonds, place debt or provide financing and thus should not be relied upon as a promise of financing or underwritingcommitment.