Embed Size (px)
Citation preview
2017 Salary Survey Report of College Graduates and Interns
2017 SALARY SURVEY REPORT OF COLLEGE GRADUATES AND INTERNS
Table of Contents
Section Page
About Compensation Resources, Inc. ............................................................................................................................................................................ 1
Study Background .......................................................................................................................................................................................................... 2
Definitions and Reporting .............................................................................................................................................................................................. 3
Participant Demographics .............................................................................................................................................................................................. 4
Part 1: College Graduate Compensation Reporting ...................................................................................................................................................... 5
Part 2: Key Position Compensation Reporting ............................................................................................................................................................ 17
Part 3: Intern Compensation Reporting ...................................................................................................................................................................... 28
Part 4: Compensation Practices .................................................................................................................................................................................. 33
Survey Participants ...................................................................................................................................................................................................... 38
SAMPLE
2017 SALARY SURVEY REPORT OF COLLEGE GRADUATES AND INTERNS
About Compensation Resources, Inc.
Compensation Resources, Inc. (CRI) provides compensation and human resource consulting services to mid- and small-cap public companies, private, family-owned, and closely-held firms, as well as not-for-profit organizations. CRI specializes in executive compensation, sales compensation, pay-for-performance and incentive compensation, performance management programs, and expert witness services.
For more information on our services, please contact:
Diana D. Neelman, CCP Principal, Executive Vice President [email protected]
310 Route 17 North Upper Saddle River, NJ 07458
(201) 934-0505(201) 934-0737 (Fax)
www.compensationresources.com
Copyright © 2017 Compensation Resources, Inc. All Rights Reserved. No part of the report may be reproduced, stored in a retrieval system, or transmitted, in any form or by any means, electronic, mechanical, photocopying, recording, or otherwise, without prior written permission of Compensation Resources, Inc.
This survey has been prepared based on the responses received by Compensation Resources, Inc. Although CRI believes that the data provided by participants was reliable and representative of the practices within responding organizations, the survey results are provided for informational purpose only and without warranty of any kind. The results represented in this survey report should be considered in light of your organization’s mission, business plan, strategy, competitive position and the manner in which the information contained herein supports its direction. CRI recommends that this study be used in concert with additional sources of information in order to validate all results.
1
SAMPLE
2017 SALARY SURVEY REPORT OF COLLEGE GRADUATES AND INTERNS
Study Background
May 18, 2017
Compensation Resources, Inc. (CRI) is pleased to present the results of the 2017 Salary Survey Report of College Graduates and Interns. The purpose of this study was to obtain compensation data for new and recent college graduates and college interns. Data was collected between February and April 2017, and results were compiled from survey questions that were developed by CRI and distributed to companies in all industrial classifications. There were 152 organizations that participated in this study.
Compensation data is reported as of January 1, 2017 in the following dimensions:
• Average• Weighted Average• Median• 25th and 75th percentiles
CRI is dedicated to providing accurate results of this survey to participants; therefore, should you have any questions or need clarification regarding any aspect of the survey's results, please contact me at (201) 934-0505, x105.
We thank you for your participation.
2
SAMPLE
2017 SALARY SURVEY REPORT OF COLLEGE GRADUATES AND INTERNS
Definitions and Reporting
Reported compensation data is as of January 1, 2017, unless otherwise indicated. Revenue data was reported by respondents as of the last fiscal year end date (2016).
The term "college graduate" refers in the broader context to those who were graduated with a Bachelor's or Master's degree.
Insufficient data is reported with an asterisk (*). For positions with insufficient data in the revenue, industry classification, and/or region cuts, only the overall data is reported.
Part 1: College Graduate Compensation Reporting # Incs: The number of incumbents reported by participants for the position. # Orgs: The number of reporting organizations for the position. Avg: The sum of all base salaries reported divided by the number of reporting organizations. Wghtd Avg: The sum of all reported base salaries divided by the number of incumbents. Where one organization dominated the results by 25% or greater, no weighted average is reported; indicated with a double asterisk (**). 25th: The point below which 25% of the data falls. Median: The middle number in the data array. 75th: The point below which 75% of the data falls. Annual Bonus/Incentive Target $: Average target annual incentive/bonus opportunity for 2017 in dollars for college graduates hired within the major indicated. Sign-On Bonus $: Sign-on bonus provided to newly hired college graduates in dollars. Long-Term Incentive Target $: Average target long-term incentive opportunity for 2017 in dollars for college graduates hired within the major indicated.
Part 2: Key Position Compensation Reporting Starting salaries and compensation arrangements for the specified positions. See definitions in Part 1.
Part 3: Intern Compensation Reporting Hourly compensation rates of respondents as they pertain to college interns. See definitions in Part 1.
Part 4: Compensation Practices Information relative to the compensation practices within responding organizations.
3
SAMPLE
2017 SALARY SURVEY REPORT OF COLLEGE GRADUATES AND INTERNS
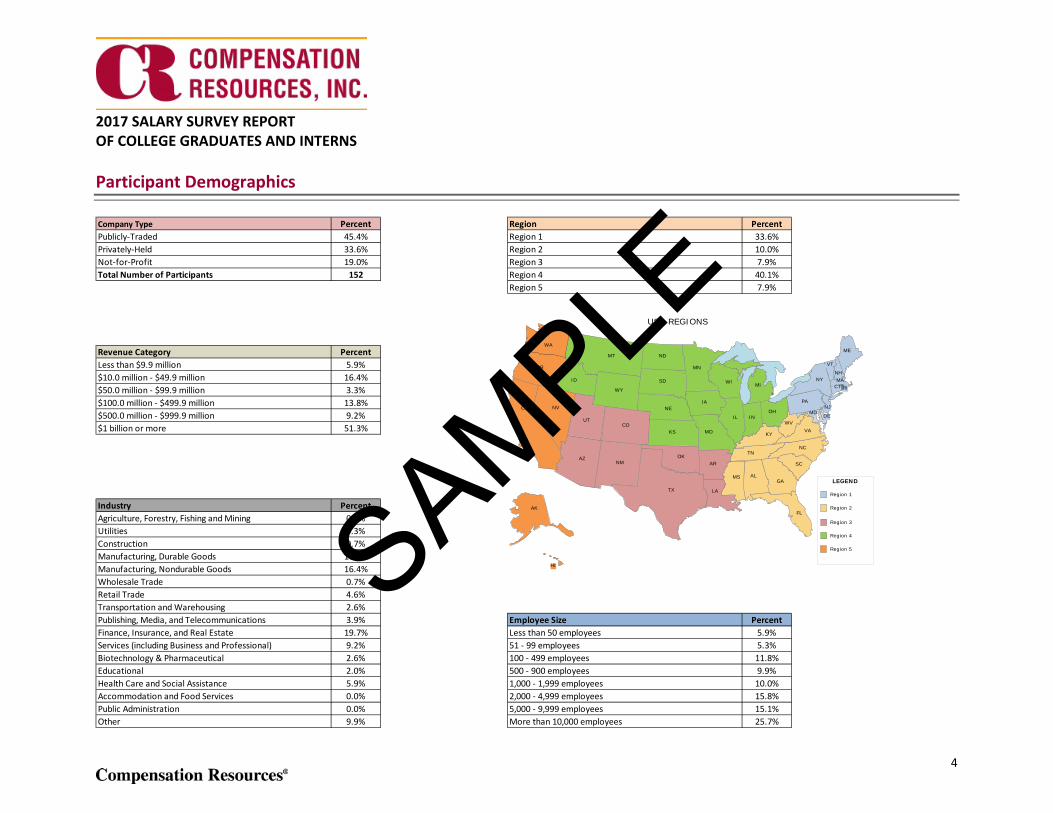
Participant Demographics
Company Type Percent Region PercentPublicly-Traded 45.4% Region 1 33.6%Privately-Held 33.6% Region 2 10.0%Not-for-Profit 19.0% Region 3 7.9%Total Number of Participants 152 Region 4 40.1%
Region 5 7.9%
Revenue Category PercentLess than $9.9 million 5.9%$10.0 million - $49.9 million 16.4%$50.0 million - $99.9 million 3.3%$100.0 million - $499.9 million 13.8%$500.0 million - $999.9 million 9.2%$1 billion or more 51.3%
Industry PercentAgriculture, Forestry, Fishing and Mining 0.0%Utilities 5.3%Construction 0.7%Manufacturing, Durable Goods 16.4%Manufacturing, Nondurable Goods 16.4%Wholesale Trade 0.7%Retail Trade 4.6%Transportation and Warehousing 2.6%Publishing, Media, and Telecommunications 3.9% Employee Size PercentFinance, Insurance, and Real Estate 19.7% Less than 50 employees 5.9%Services (including Business and Professional) 9.2% 51 - 99 employees 5.3%Biotechnology & Pharmaceutical 2.6% 100 - 499 employees 11.8%Educational 2.0% 500 - 900 employees 9.9%Health Care and Social Assistance 5.9% 1,000 - 1,999 employees 10.0%Accommodation and Food Services 0.0% 2,000 - 4,999 employees 15.8%Public Administration 0.0% 5,000 - 9,999 employees 15.1%Other 9.9% More than 10,000 employees 25.7%
LEGEND
Region 1
Region 2
Region 3
Region 4
Region 5
USA REGIONS
ID
AZ
UT
MT
WY
NM
CO
AL
FL
SC
TN
KY
INOH
NC
SD
KS
NE
MN
WI
IA
IL
MO
AR
MS
OK
ND
OR
CA NV
WA
AK
PA
ME
VA
NY CT
WV
MDNJ
VT
NHMA
DE
RI
HI
LA
MI
GA
TX
4
SAMPLE
2017 SALARY SURVEY REPORTOF COLLEGE GRADUATES AND INTERNS
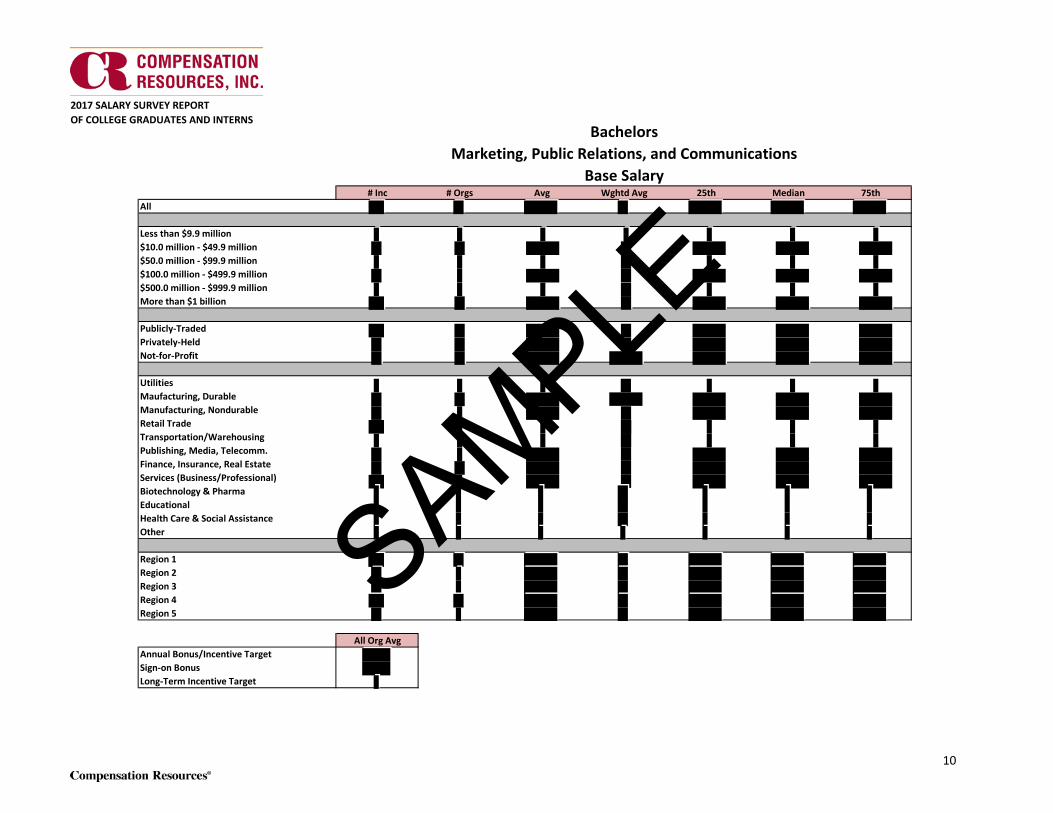
# Inc # Orgs Avg Wghtd Avg 25th Median 75thAll
Less than $9.9 million$10.0 million - $49.9 million$50.0 million - $99.9 million$100.0 million - $499.9 million
$500.0 million - $999.9 millionMore than $1 billion
Publicly-TradedPrivately-HeldNot-for-Profit
UtilitiesMaufacturing, DurableManufacturing, NondurableRetail TradeTransportation/WarehousingPublishing, Media, Telecomm.Finance, Insurance, Real EstateServices (Business/Professional)
Biotechnology & PharmaEducationalHealth Care & Social AssistanceOther
Region 1Region 2Region 3Region 4Region 5
All Org AvgAnnual Bonus/Incentive TargetSign-on BonusLong-Term Incentive Target
Marketing, Public Relations, and CommunicationsBachelors
Base Salary
10
SAMPLE
2017 SALARY SURVEY REPORTOF COLLEGE GRADUATES AND INTERNS
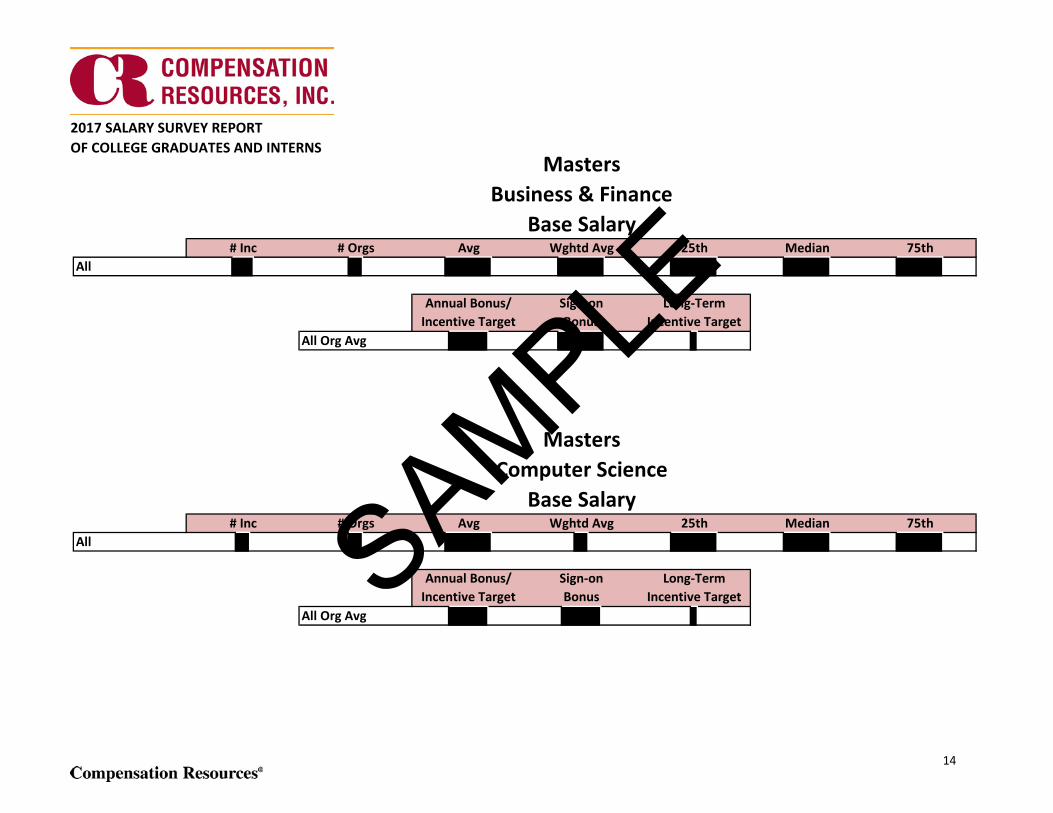
# Inc # Orgs Avg Wghtd Avg 25th Median 75thAll
Annual Bonus/Incentive Target
Sign-on Bonus
Long-Term Incentive Target
All Org Avg
# Inc # Orgs Avg Wghtd Avg 25th Median 75thAll
Annual Bonus/Incentive Target
Sign-on Bonus
Long-Term Incentive Target
All Org Avg
Masters
Masters
Business & Finance
Computer Science
Base Salary
Base Salary
14
SAMPLE
2017 SALARY SURVEY REPORTOF COLLEGE GRADUATES AND INTERNS
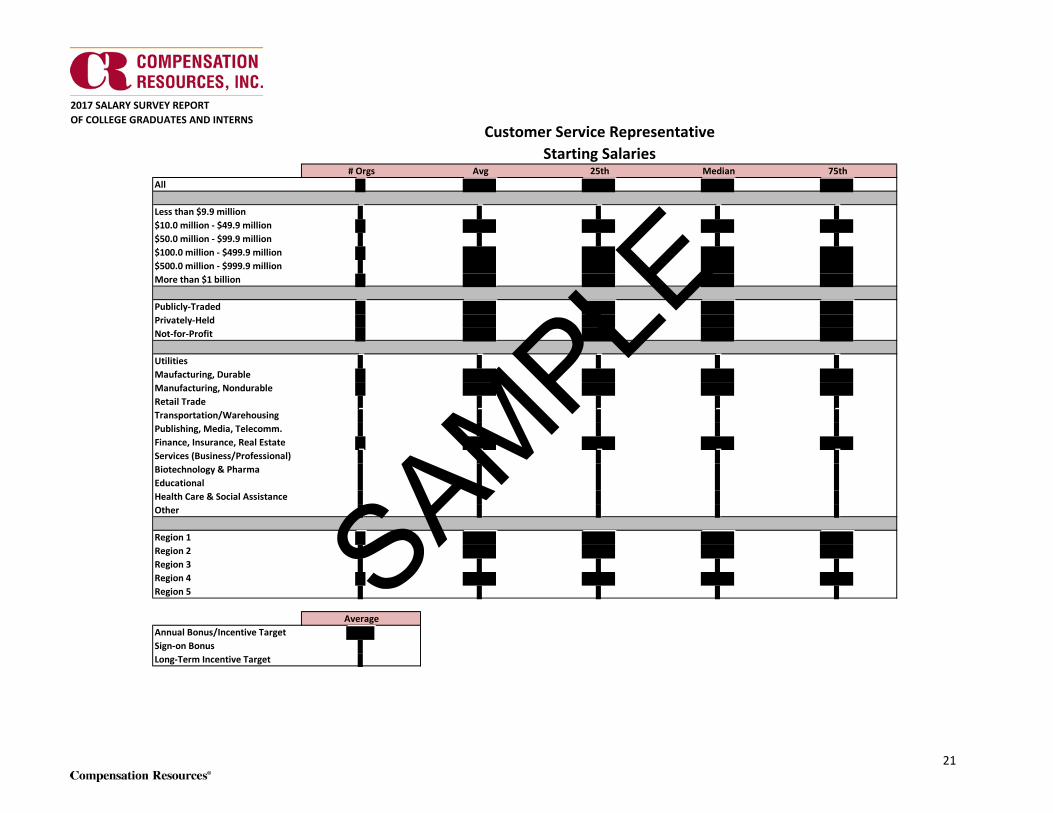
# Orgs Avg 25th Median 75thAll
Less than $9.9 million$10.0 million - $49.9 million$50.0 million - $99.9 million$100.0 million - $499.9 million$500.0 million - $999.9 millionMore than $1 billion
Publicly-TradedPrivately-HeldNot-for-Profit
UtilitiesMaufacturing, DurableManufacturing, NondurableRetail TradeTransportation/WarehousingPublishing, Media, Telecomm.Finance, Insurance, Real EstateServices (Business/Professional)Biotechnology & PharmaEducationalHealth Care & Social AssistanceOther
Region 1Region 2Region 3Region 4Region 5
AverageAnnual Bonus/Incentive TargetSign-on BonusLong-Term Incentive Target
Customer Service RepresentativeStarting Salaries
21
SAMPLE
2017 SALARY SURVEY REPORTOF COLLEGE GRADUATES AND INTERNS
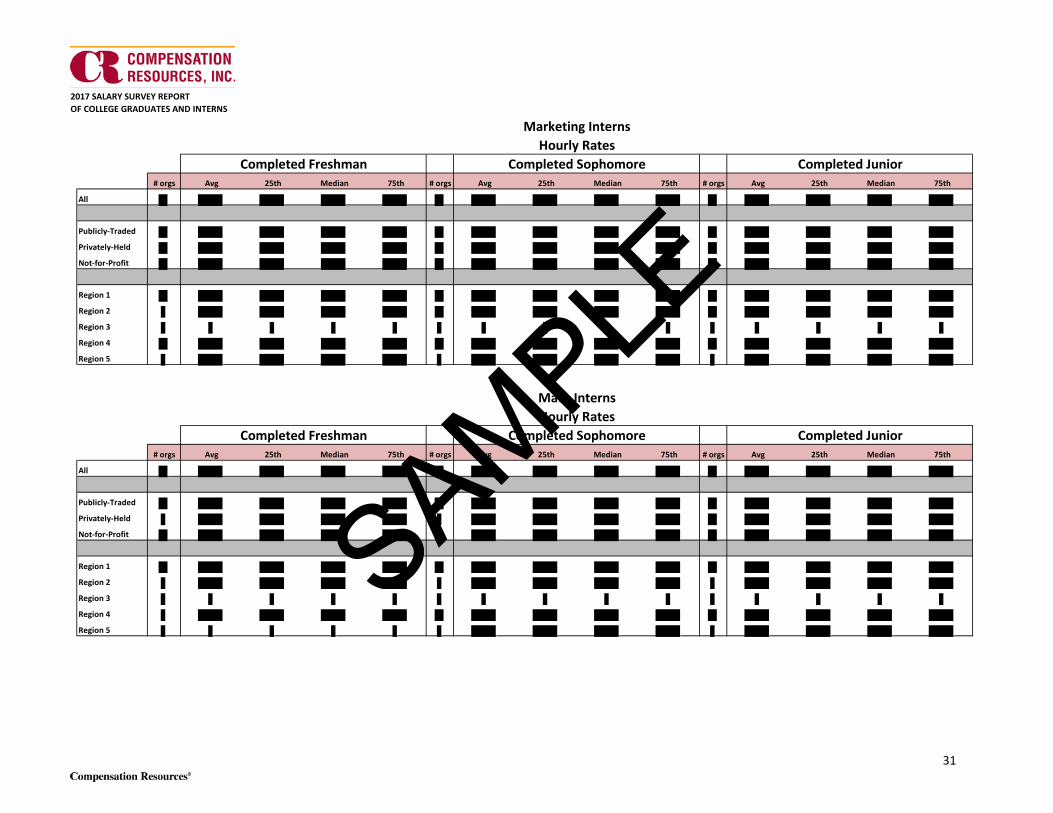
# orgs Avg 25th Median 75th # orgs Avg 25th Median 75th # orgs Avg 25th Median 75th
All
Publicly-Traded
Privately-Held
Not-for-Profit
Region 1
Region 2
Region 3
Region 4
Region 5
# orgs Avg 25th Median 75th # orgs Avg 25th Median 75th # orgs Avg 25th Median 75th
All
Publicly-Traded
Privately-Held
Not-for-Profit
Region 1
Region 2
Region 3
Region 4
Region 5
Marketing Interns
Math Interns
Hourly Rates
Hourly Rates
Completed Freshman Completed Sophomore Completed Junior
Completed Freshman Completed Sophomore Completed Junior
31
SAMPLE
2017 SALARY SURVEY REPORT OF COLLEGE GRADUATES AND INTERNS
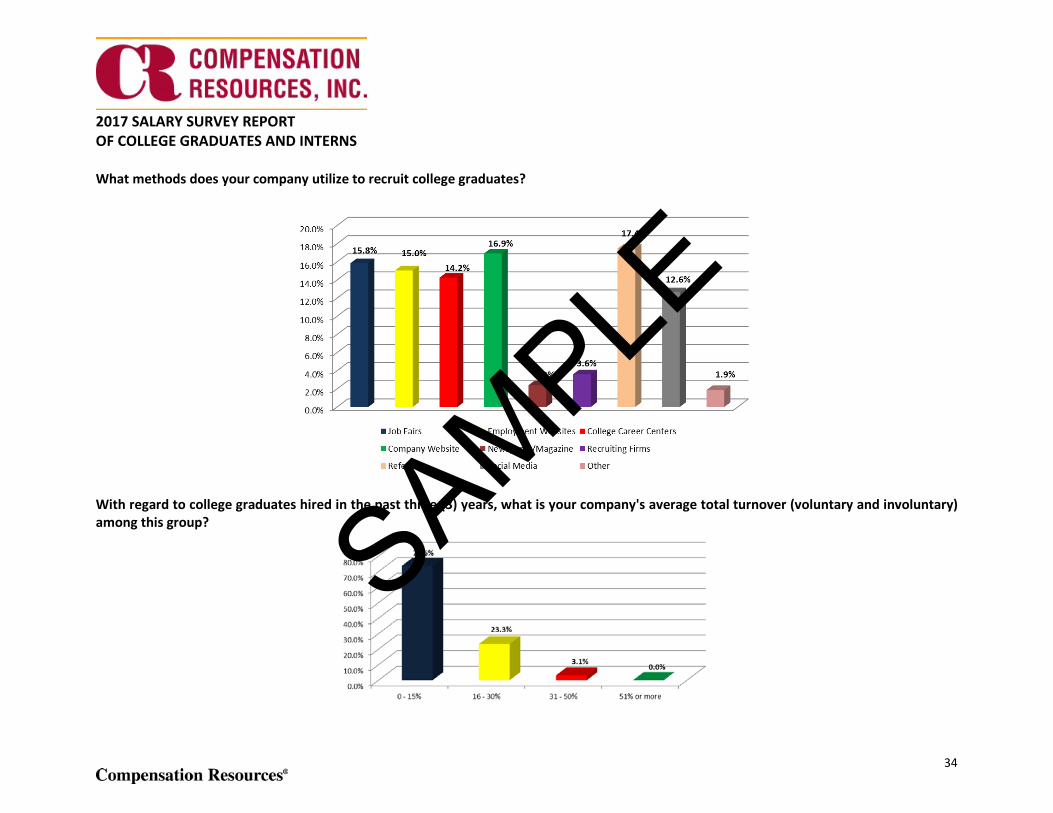
What methods does your company utilize to recruit college graduates?
With regard to college graduates hired in the past three (3) years, what is your company's average total turnover (voluntary and involuntary) among this group?
34
SAMPLE
2017 SALARY SURVEY REPORT OF COLLEGE GRADUATES AND INTERNS
Survey Participants
The following list contains only the organizations that gave permission to be identified.
A.O. Smith Corporation Adient ADP Adventist Health System Agilent Technologies AgStar Financial Services AIG Altria Ameren American Axle Manufacturing Anheuser-Busch Apio Inc. Aptargroup Aquinas Consulting Armstrong Flooring, Inc. Armstrong World Industries Arthur J Gallagher Service Co. Ascena Retail group Associated Bank BB&T BNSF Logistics, Inc. BNSF Railway Boehringer Laboratories Boston Scientific Briggs & Stratton Brookhaven National Laboratory CareFirst BlueCross BlueShield Catholic Charities Corp Chicago Commons Citizens Property Insurance Corporation Citizens State Bank CommScope Conagra Brands Construction Specialties Cornerstone Family Healthcare COUNTRY Financial Crossings Ministries Cutco Corporation Daiich Sankyo, Inc Dakota Electric Associaiton Digi International Dominion Resources, Inc. DSw, Inc.
Ellucian Emerson Endo International plc Equinix Findley Davies, Inc. First Empire Securities Florida Blue Froedtert Health Givaudan Grande Cheese Company Harford Mutual Insurance Hendrickson Herman Miller, Inc. Honeywell FM&T Independence Blue Cross Involved for Life, Inc. J.B. Hunt Transport Services, Inc. Jet Propulsion Laboratory John Wiley & Sons Inc. Johnson & Quin Johnson Controls K2M, Inc. Kellogg Company Keurig Green Mountian, Inc. KeyBank Kimberly-Clark Corp Kinder Morgan KLX Inc. Kreisler L Brands Laureate Education, Inc. Lawrence Livermore National Laboratory Liberty Mutual Insurance Lifetime Healthcare Companies, Inc. - Excellus Health Plan Luminex Corporation Macy's MAHLE Industrial Thermal Systems America, LP Marsh & McLennan Companies Inc. Merchants Bonding Company Molex LLC MTS Systems Corporation Mutual of Omaha Nisivoccia LLP
North American Bancard Northern Trust NRG NuStar Energy L.P. Ohio Mutual Insurance Group Ohio Willowwood Omnitrans OneAmerica Oxford University Press Panduit Picatinny Federal Credit Union Praxair Prudential Qfix RAND Corporation Regeneron Pharmaceuticals Schreiber Foods Sempra Energy Shopko Stores Southwest Research Institute SRC, Inc. Symetra Syncora Guarantee Services Inc. Talbots Terracon Consultants, Inc. Tesoro Corporation Aerospace Corporation, The Christ Hospital Health Network, The Hershey Company, The Lane Construction Corporation, The Lubrizol Corporation, The National Academies of Sciences, Engineering, and Medicine, The Salvation Army, The United Launch Alliance (ULA) Veralon Verizon Washington Gas Light Company Wawa, Inc. WestSound Engineering Inc. Whirlpool YMCA of Greater Rochester Zebra Technologies
38
SAMPLE