Embed Size (px)
Citation preview

FY 2017 RESULTS PRESENTATION
Released on 19 February 2018 – 7.20am CET
19 February 2018

MAIN SPEAKERS
Giorgio Modica
Stéphane Boujnah
CFO
CEO & Chairman of the Managing Board
Euronext FY 2017 results |2

AGENDA
I 2017 Main Highlights
II 2017 Financials
III Outlook
Euronext FY 2017 results |3

I. 2017 MAIN HIGHLIGHTS

EURONEXT PERFORMED A DEEP TRANSFORMATION IN 2017…
Euronext FY 2017 results |5
Securing of clearing environment
Transformational projects
Expansion of the federal model and of the debt franchise
Revenue profile diversification
Agility for Growth initiatives
─ Signature of a 10-year clearing agreement with LCH SA for the clearing of financial and commodity derivatives products
─ Acquisition of a 11.1% minority stake in LCH SA1) with pre-emption rights
─ Compliance of systems to MIFID II at date ─ First milestones of Optiq®:
─ Optiq® Market Data Gateway live in March 2017 for cash and in July 2017 for derivatives
─ Announced acquisition of the Irish Stock Exchange in November 2017 for €137m3)
─ Closing expected in March 2018
─ Expansion into global FX markets through the acquisition of FastMatch, a leading spot FX ECN, in August 2017, for $153m2)
─ Adding value to issuers: ─ Corporate Services: acquisition of Company Webcast, iBabs and InsiderLog ─ Launch of the European Tech SME initiative: 5 new offices opened in 4 non-Euronext
countries (Germany, Spain, Switzerland and Italy)
─ Adding value to investors: ─ Euronext Synapse MTF: Platform launched in December 2017 in Europe ─ Launch of 2 new Morningstar indices, the Morningstar Eurozone 50 Index and the
Morningstar Developed Markets Europe 100 Index and launch of futures
1) Euronext swapped its 2.3% stake in LCH Group for 11.1% of LCH SA. The transaction generated a non-cash gross capital gain of €40.6m in 2017
2) Excluding cash 3) On a debt-free cash-free basis and excluding existing regulatory capital requirements

…THROUGH REVENUE DIVERSIFICATION AND EXPANSION OF THE FEDERAL MODEL
Fixed income technology
• Joint-venture creation and minority investment
• New trading facility to improve liquidity in pan-European corporate bond trading
$10m investment
March 2017
FX trading
• Fastest growing electronic communication network in the spot FX market
• Acquisition of a 90% stake
$153m investment
August 2017
Deployment of Agility for
Growth initiatives
Post-trade development
Asset class diversification
Corporate services
February 2017
• Acquisition of 51% • Comprehensive range of
webcast, webinar and conference call services for Investor Relations and corporate events
€3.6m investment
Corporate services
• Acquisition of 60% • Dematerialized board
portal solution and decision making tool for corporates and public organisations
€30.1m investment
July 2017
• Acquisition of a 20% stake in EuroCCP
• User Choice Clearing Model for Equity Markets
December 2016
Equity clearing
€13.4m investment
• 11.1% minority stake in LCH SA
December 2017
Multi-asset clearing
Swap2)
• 10-year agreement for the clearing of derivatives products
Madrid
Zurich
Munich
Frankfurt
Milan
Euronext historical presence Euronext recent Tech hub expansion
Paris
London1) Brussels
Amsterdam
Lisbon
Regulated markets Technology center
Porto
Sales office
Dublin
1)Euronext London is recognised as a Recognised Investment Exchange (RIE) by the Financial Conduct Authority (FCA) 2) Non cash. Euronext swapped its 2.3% stake in LCH Group for 11.1% of LCH SA. The transaction generated a non-cash gross capital gain of €40.6m in 2017 3) Closing is expected in March 2018 4) Enterprise value on a debt-free cash-free basis and excluding existing regulatory capital requirements
• Acquisition of 100% of the shares
• Expansion of Euronext federal model and debt franchise
Signed November 20173)
Irish Stock Exchange
€137m4) commitment
Irish Stock Exchange
Corporate services
• Acquisition of 80% • Management of insider
lists
€5.8m investment
January 2018
Expansion of the federal
model and of our debt franchise
A
B
C D
Euronext FY 2017 results |6
• European post-trading blockchain infrastructure for the Small and Medium Enterprise (SME) market
July 2017
Blockchain
Co-founder
LIQUIDSHARE

Euronext FY 2017 results |7
ALL ISSUERS GROWTH INITIATIVES HAVE BEEN LAUNCHED AND DEPLOYED…
─ Deployment in four new countries
outside of Euronext’s markets (Germany, Spain, Italy and Switzerland) to attract Tech SMEs companies
─ Confirmed interest from Tech companies and investors
─ Continued increased commercial intensity
Trade & Leverage initiative launch
Continue pipeline building for IPOs
Extend TechShare to EU Tech SMEs countries
The exchange for European Tech SMEs
─ Acquisition of new services over the year (Company Webcast, iBabs, IR.Manager)
─ Intensified cross-selling through Euronext issuers’ base
─ First revenue contribution: €9.1m in 2017
Pursue commercial intensity
Mature the integration of the different services
Acquisition of InsiderLog (Jan. 18)
The modular Corporate Services provider
2017 Next steps
Launched in Sept. 2017
Ongoing commercial deployment
Acquisitions made in 2017
Ongoing commercial deployment

Euronext FY 2017 results |8
…AND MAJOR GROWTH INITIATIVES FOR INVESTORS ARE READY
─ Client interest confirmed ─ Go-live postponed after Optiq delivery
Delivery of the platform Client onboarding
One-stop-shop pan-European ETF platform
─ New indices launched with Morningstar:
─ Morningstar Eurozone 50 IndexTM
─ Morningstar Developed markets Europe 100 IndexTM
Launch of new future contract in Jan.18 on the Morningstar Eurozone 50 IndexTM
European family of indices
─ Capture OTC Flows: Ongoing IT development
─ Commodities data provider: paused
OTC flow: delivery of IT and post-trade solution and go live
Specialist content on agricultural commodities
─ Launch of Euronext Synapse MTF in Dec. 2017 in Europe
─ US platform waiting regulators approval
US regulatory approval Continued clients
onboarding in Europe Fixed income
─ RiskGuard: main features of derivatives launched and first clients invoiced
─ APA/ARM: live ─ Inventory management: Ongoing
development. Collateral abandoned.
APA/ARM: continued onboarding of customers
Inventory management: Adoption of the platform
Post-trade
2017 Next steps
To be launched in H2 2018
Ongoing commercial deployment
Tradable since July 2017
Ongoing commercial deployment
EU platform live in Dec. 17
Ongoing commercial deployment
RiskGuard and APA/ARM services launched in 2017
Ongoing commercial deployment

EURONEXT GENERATED A STRONG OPERATIONAL PERFORMANCE IN 2017…
Euronext FY 2017 results
‒ Improved cash market share at 64.4% ‒ Strong growth in listing revenue ‒ First revenue from Agility For Growth initiatives and FastMatch
‒ Strong operating performance: EBITDA up 4.9%, +€14m, to €297.8m
‒ Continued costs discipline, despite ramp up of acquisitions, MIFID II and Optiq projects costs
‒ Net income at €241.3m, benefitting from good operating performance, capital gain related to LCH SA swap2) and exceptional items
‒ Adjusted EPS up +4.8% at €3.09
Continued value creation for shareholders, with a proposed dividend3) up 21.8% (+31cts / share)
|9 1) Unless stated otherwise, % compare Full Year 2017 data to Full Year 2016 data 2) Euronext swapped its 2.3% stake in LCH Group for 11.1% of LCH SA. The transaction generated a non-cash gross
capital gain of €40.6m in 2017 3) Subject to the approval of the AGM on 15 May 2018
55.9% EBITDA margin
+€36m
revenue growth
+22.4% reported EPS
€1.73 2017 dividend3)
Strong increase in revenue +7.2%1) at €532.3m
Robust EBITDA margin
Significant increase in reported EPS to €3.47

…AND NEW ACQUISITIONS1) FEED VALUE CREATION POTENTIAL
Euronext FY 2017 results |10 1) ISE acquisition closing expected in March 2018 2) Company Webcast, iBabs, IR.Soft 3) For 12 months of 2017. Unaudited accounts 4) Margin of acquisitions related to Agility for Growth. Does not include the costs of organic initiatives 5) Enterprise value on a debt-free cash-free basis and excluding existing regulatory capital requirements 6) Excluding cash
Rationale
FastMatch - FY173)
19.4
Irish Stock Exchange - FY173)
32.3
Acquisitions related to Agility for Growth 2)3)
11.8
Euronext excl. Agility for Growth initiatives
515.3
Capital invested or committed
Revenue for FY 2017 (€m)
For illustration purposes only
€137m5) $1536) €33.9m
Expand the federal model
Diversify into new asset classes
EBITDA margin 57.6% ~50%4) 31.9% 40.7%
Non volume related revenue

II. 2017 FINANCIALS

2017 REVENUE UP 7.2% TO €532.3M KEY DRIVERS: VOLUMES GROWTH AND ACQUISITIONS
1) Volume-related businesses include IPO revenue, cash, derivatives and Spot FX trading and clearing revenues. Follow-ons, bonds and other listing revenues are considered as non-volume related due to their lower volatility
2) Include other income of €0.4m in 2017 and €0.6m in 2016 3) Non-volume related businesses revenue divided by operating costs (excluding D&A)
Revenue In €m
2)
Euronext FY 2017 results
Market Solutions & Other revenue
190.3
84.2
2016
496.4
33.6 19.6
+7.2%
FX Spot trading
48.0
Market Data & Indices
Custody & Settlement
180.7
68.7
33.8
Listing
Clearing
2017
Derivatives trading
Cash trading
532.3
20.6
51.1
7.2 40.3
105.7 104.7
40.1
+22.6%
+5.3%
+0.6%
+6.5%
+4.7%
+0.8%
-1.0%
Vol Related1)
56% 56%
2017 revenue up 7.2% to €532.3m (+€35.9m)
Positive impact from Corporate Services (€9.1m revenue) due to the acquisition of iBabs in July 2017 and Company Webcast in February 2017
Improved cash trading volumes (+6.7% ADV) and market share (64.4%) translated into revenue growth of +€9.5m
Diversification in spot FX trading revenue (+€7.2m) with FastMatch acquisition in August 2017
Robustness of Market Data revenue (-€1.0m), with organic performance intact offset by lower contractual audit findings compared to last year
Operating cost coverage ratio3) at 100% in 2017
|12

LISTING REVENUE UP 22.6% TO €84.2M STRONG REVENUE SUPPORTED BY FOLLOW-ONS AND POSITIVE IMPACT OF CORPORATE SERVICES
Money raised2)
Growing primary market activity
26 new listings
Continued trend of large capitalisations returning to Euronext’s markets such as ALD and Volkerwessels
Strong secondary market activity
Follow-on revenue up +9.1% reflecting the growing use of equity financing through the year
Strong dynamism of SMEs with 531 deals
Dynamic bond market, revenue up +38.0%
Successful launch of the European Tech SME initiative and confirmed interests from Tech companies and investors
Increased commercial intensity of the Corporate Services offering and fine-tuning of the value proposition following the acquisitions to complement the suite
# of listings
In €bn
1) ‘Corporate Services’ revenue previously reported as part of ‘Other’ 2) Total money raised figures revised as from January 2017. Corporate bonds figures revised as from January 2017 to
exclude Euronext listed financials issuers and to regroup them in a broader newly created financial bonds category. Total money raised also now includes Public/Semi-Public bonds category not reported before, created as from January 2017
Euronext FY 2017 results
Listing revenue1)
In €m
+9.4%
+9.1%
-3.7%
+12.1%
+38%
|13
28 26
Follow ons
Annual fees
2017
84.2
6.8 6.4
7.8
21.5
32.6
2016
68.7
4.9 5.7
8.1
19.7
29.8
+22.6%
Bond fees
Other
IPOs
0.5 9.1
+6.5%
SMEs
Large Caps
2017
323.9
8.1
315.8
2016
304.1
10.2
293.9
Corporate services

CASH TRADING REVENUE UP 5.3% TO €190.3M STRENGTHENED MARKET SHARE AT 64.4% AND GROWTH IN VOLUMES
Average daily turnover
Improved cash market share at 64.4%, to its strongest yearly level since IPO, supported by:
the continued optimisation of the SLP programme,
the innovative Omega pack for non members
and the Best of Book service for retail flows
Robust yield at 0.50bps, stable compared to 2016
80% present at EBBO in December 2017, with deepest market depth
Significant achievements in key Core Business projects: Launch of Euronext Fund services Launch of Euronext Block, the new block trading
service for equities, and first trades executed on the platform
Launch of Euronext Synapse for Europe in Dec.17
74 new ETF products listed over 2017, bringing the total numbers of ETFs to 804, and declining ETF trading due to low volatility
Revenue per trade
Euronext FY 2017 results
Cash trading Market share for 2017
In €m, single counted
In bps, single counted
|14
64.4%
Vs. 61.0% in 2016
Market share for Q4 2017 at 67.1%
554
473
ETF
Structured Products
Bonds
2017
7,478
6,939
40 26
2016
7,012
6,395
37 26
+6.7%
Equities
-0.5%
2017
0.50
2016
0.50
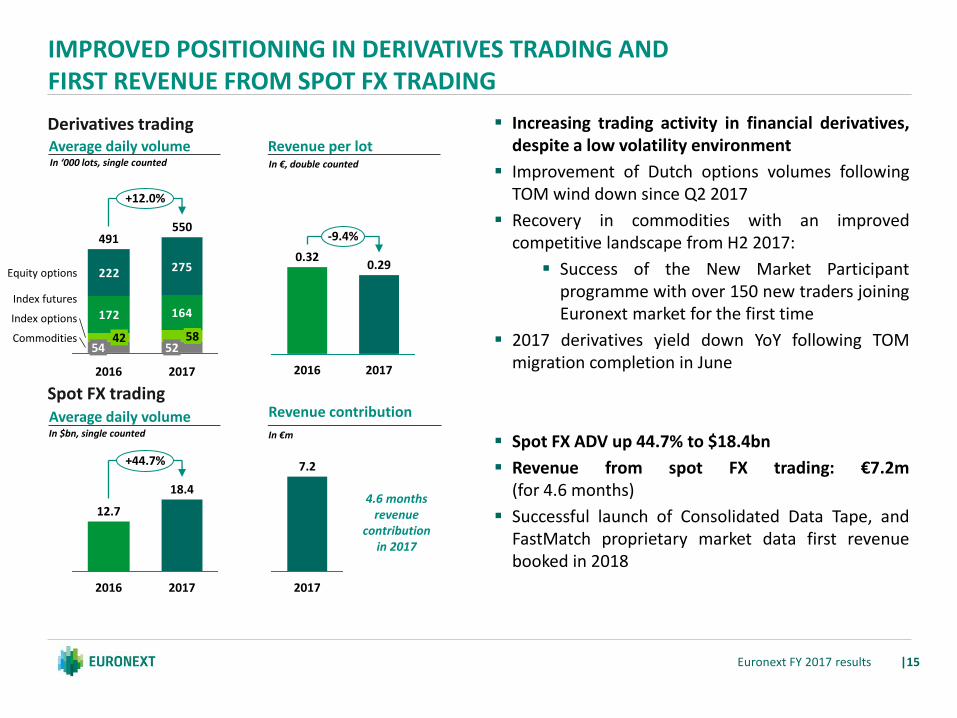
IMPROVED POSITIONING IN DERIVATIVES TRADING AND FIRST REVENUE FROM SPOT FX TRADING
Average daily volume Revenue per lot
Increasing trading activity in financial derivatives, despite a low volatility environment
Improvement of Dutch options volumes following TOM wind down since Q2 2017
Recovery in commodities with an improved competitive landscape from H2 2017:
Success of the New Market Participant programme with over 150 new traders joining Euronext market for the first time
2017 derivatives yield down YoY following TOM migration completion in June
Spot FX ADV up 44.7% to $18.4bn
Revenue from spot FX trading: €7.2m (for 4.6 months)
Successful launch of Consolidated Data Tape, and FastMatch proprietary market data first revenue booked in 2018
Euronext FY 2017 results
Derivatives trading
Spot FX trading Average daily volume
In ‘000 lots, single counted In €, double counted
In $bn, single counted
Revenue contribution
In €m
4.6 months revenue
contribution in 2017
|15
172 164
222 275Equity options
Index futures
Commodities
Index options
2017
+12.0%
52 58
2016
54 42
550 491
2017
0.29 0.32
-9.4%
2016
18.4
2016
12.7
+44.7%
2017
7.2
2017
1) The planned non-recurring migration of open interest from TOM to Euronext over June 2017 took place at marginal rates due to the exceptional circumstances of the TOM closure

OTHER BUSINESSES ROBUST MARKET DATA PERFORMANCE DESPITE NEGATIVE BASE EFFECTS
Continued benefits from MiFID II projects and related work for commercial technology clients
Launch and first milestones of the Optiq® delivery projects for clients in the Middle East, North Africa and Brazil
Decrease in revenue due to negative base effect (large contractual audit findings in Q2 2016 and Q3 2016), while organic performance intact
New market data agreements to comply with MiFID II data disaggregation requirements in 2018
─ Launch of two indices with Morningstar (Morningstar Eurozone 50 IndexTM & Morningstar Developed markets Europe 100 IndexTM)
Clearing revenues benefited from stronger derivatives trading activity and higher treasury income
Numerous contracts signed for Euronext’s APA/ARM services live since December 2017
Revenue growth in Interbolsa driven by an increase of settlement, public debt and equities under custody
Euronext FY 2017 results
Market Data and Indices In €m
Market solutions & Others In €m
Post trade In €m
|16
-1.0%
2017
104.7
2016
105.7
+1.4%
2017
33.5
2016
33.0
19.6 20.6
Clearing Custody & Settlement
+4.7%
+6.5%
48.0 51.1
2016
2017

EBITDA UP 4.9% TO €297.8M ROBUST EBITDA MARGIN AT 55.9%
Euronext FY 2017 results
297.8
+€13.9m
EBITDA 2016
283.9
EBITDA 2017 Other
-3.3
Clearing expenses
-1.6
Professional Services
-7.2
Systems and Comms.
-5.3
Staff expenses
-4.6
Revenue 2017
35.9
€10.9m of costs savings achieved since 1 April 2016, slightly down compared to 2016 (€15.6M) due to IT and regulation projects
Core business costs reduction expected to start in H2 2018
Agility for Growth initiatives: €9.8m of revenue and €11.0m of costs, with well-established initiatives funding earlier stage ones
In €m
55.9%
57.2% EBITDA margin
|17
Mainly acquisitions’ staff impact
Projects costs (MIFID II, Optiq,
Acquisitions)

2017 NET INCOME DRIVEN BY GOOD OPERATING PERFORMANCE, CAPITAL GAINS AND EXCEPTIONAL ITEMS
Euronext FY 2017 results
In €m
|18
2.7
Capital gains or losses
(LCH SA)
40.6
Exceptional items
-14.8
Intangible assets adj. related to
acquisitions (PPA)
2016 Exceptional
items
10.0
Net Income
2016
197.0
-4.5
Adj. EPS +4.8%
EBITDA Other items
13.9
Net Income
Adj. 2016
215.2
205.2
Adj. In tax Net Income
Adjusted 2017
D&A
-1.9
241.3
+22.5%
Net income
Adj 2017
-2.4
Adj. In tax
0.6
Incl. Non-recurring tax release for
€20.4m in 2017 and €16.3m in
2016
Incl. FastMatch and iBabs
PPA
Incl. €5m of ICE break-up fee

STRONG CASH FLOW GENERATION AND LIQUIDITY POSITION
Euronext FY 2017 results
EBITDA / operating cash flow conversion rate Balance sheet
Liquidity Debt
Assets Liabilities & Equity
60% 72%
In €m In €m
In €m
64% 72%
In €m
2017
213.1
297.8
2016
181.1
283.9
Net operating cash flow
EBITDA
2017
1,065.6
266.2
515.1
96.4 187.8
2016
757.5
172.6
321.2
89.2 174.5
Other non-current assets
Goodwill & other intangibles
Other current assets
Cash & Cash Equivalent
2017
1,065.6
729.5
164.7 46.6
124.8
2016
757.5
548.0
69.0 20.3 120.2
Equity
Borrowings
Other non-current liabilities
Current liabilities
-105
69
Net debt Gross debt
31 Dec. 2016 31 Dec. 2017
-23
165
Net debt Gross debt
|19
€110m Targeted cash for operation
Cash & Cash equivalent
RCF
Liquidity 2017
437.8
RCF facility
250.0
Cash in 2017
187.8
Other
4.7
Dividends
98.8
Acquistions
167.3
Capex
23.9
Net
borrowings
95.0
Operating
CF
213.1
Cash in 2016
174.5
Euronext FY 2017 results

III. OUTLOOK

2018 FIRST TRENDS
Strong start of volumes in 2018
Cash ADV at €7.8bn, up +20.4% compared to Jan. 2017 Derivatives ADV at 561,231 lots, up +25.9% compared to Jan. 2017 Spot FX ADV at $20.8bn, up +22.0% compared to Jan. 2017 Volatility index up since beginning of February 2018
Acquisition in Corporate Services
Acquisition in January 2018 of InsiderLog, an innovative insider list management solution
Euronext FY 2017 results
Integration of newly acquired businesses
Closing of the Irish Stock Exchange acquisition expected in March 2018 Start of integration works after closing
Optiq® project milestones
Optiq® conformance testing started end of January 2018 Final client software release for user acceptance delivered in February 2018 Optiq® Cash to be live in H1 2018
|21

2019 FINANCIAL TARGETS
+2.0% CAGR2015-2019, i.e. 505m€ Core Business revenue in 2019 excluding clearing (unchanged)
€55m incremental revenue in 2019 (excluding clearing) (vs. €70m in May 2016),
50 % EBITDA margin (unchanged)
61 to 63% EBITDA margin in 2019 excl. clearing (unchanged), excluding FastMatch and ISE
22m€ of gross costs savings on Core Business (unchanged), i.e. €15m net of inflation
Core business costs reduction expected to start in H2 2018
Dividend policy: 50% Pay-out of reported net income, with a floor at €1.42 per share
(unchanged)
ROCE>WACC in year 3 (unchanged) Full-year contribution of FastMatch and
the Irish Stock Exchange2) in 2019
€505m +4.3% CAGR17-19
€55m revenue €27.5m costs
-€22m gross savings -€15m net of inflation
61-63%
50% pay-out 1.42€/share floor
Not applicable
Euronext FY 2017 results |22
Deliver strong operating performance in Core Business
Focus on most value creating organic initiatives
Improve company efficiency
Deploy the balance sheet through targeted M&A to create value
Continue capital return to shareholders
Continue cost control
2019 TARGETS
€464m
€9.8m rev. €11m costs
57.5%
-€10.9m savings
€121m proposed for distribution1)
~€300m capital
deployed
2017
1) Subject to the approval of the AGM on 15 May 2018 2) Closing of ISE acquisition is expected in March 2018

Q&A
Euronext FY 2017 results |23
Giorgio Modica
Stéphane Boujnah
CFO
CEO & Chairman of the Managing Board
Lee Hodgkinson
Head of Markets & Global Sales
Anthony Attia
Global Head of Listing

APPENDICES

CASH AND DERIVATIVES TRADING PERFORMANCE
Euronext FY 2017 results
Cash trading
ADV (in €m)
|25
2015 2016 2017
+6.7%
2017 2016
7,478
-15.3%
7,012
2015
8,282
Yield
Market Share
63.6% 60.9%
2015
64.4%
2017 2016
0.50 0.50
2016 2017
0.47
2015
Derivatives trading
ADV (in €m)
Yield
529
2015 2016
550
2017
+12.0% -7.2%
491
0.33
2016 2017
0.29 0.32
2015
Improved volumes:
Best of Book Non-member Omega
pack Optimisation of the SLP
programme
Efficient yield management
Market share > 60% on equity
Improved competitive landscape

CASH – MARKET QUALITY AND SHARE
Euronext FY 2017 results
Market share
Market quality
2017 market share: 64.4%
20%
40%
60%
80%
Jan-14 Jul-14 Jan-15 Jul-15 Jan-16 Jul-16 Jan-17 Jul-17
EURONEXT MTF
Blue Chips Presence time at EBBO (%) EBBO with greatest size (%) EBBO setter (%) Relative spread (bps) Displayed market depth (€)
(31 December 2017) Euronext
80% 43% 65% 3.72 58,289 BATS Europe
34% 0% 3% 8.01 14,620 Chi-X
55% 2% 10% 6.29 18,375 Equiduct
2% 0% 0% 61.8 23,984 Turquoise
41% 0% 5% 7.3 16,737
|26 Euronext FY 2017 results

2017 P&L
Euronext FY 2017 results |27
Unaudited, In €m 2017 2016 % change
Revenue 532.3 496.4 +7.2%
Listing 84.2 68.7 +22.6%
Trading revenue 237.9 220.8 +7.7%
Cash Trading 190.3 180.7 +5.3%
Derivatives Trading 40.3 40.1 +0.6%
Spot FX Trading 7.2 - n/a
Market Data & indices 104.7 105.7 -1.0%
Post-trade 71.7 67.6 +6.0%
Clearing 51.1 48.0 +6.5%
Custody and Settlement 20.6 19.6 +4.7%
Market Solutions & other revenue 33.5 33.0 +1.4%
Other income 0.4 0.6 -36.2%
Operational expenses excluding D&A -234.5 -212.5 +10.3%
Salaries and employee benefits -104.4 -99.8 +4.6%
Other Operational Expenses -130.1 -112.8 +15.4%
System & Communication -22.4 -17.1 +30.7%
Professional Services -45.5 -38.4 +18.7%
Clearing expense -27.9 -26.3 +6.1%
Accommodation -10.0 -10.2 -2.7%
Other Operational Expenses -24.4 -20.7 +17.5%
EBITDA 297.8 283.9 +4.9%
EBITDA margin 55.9% 57.2% -1.2 pts
Depreciation & Amortisation -16.9 -15.1 +12.2%
Operating Profit before Exceptional items 280.8 268.8 +4.5%
Exceptional items -14.8 -10.0 +47.3%
Operating Profit 266.1 258.8 +2.8%
Net financing income / (expense) -3.6 -0.8 n/a
Results from equity investments 48.6 6.0 n/a
Profit before income tax 311.1 264.0 +17.8%
Income tax expense -68.9 -67.0 +2.9%
Share of non-controlling interests -0.9 0.0 n/a
Profit for the period 241.3 197.0 22.5%

ADJUSTED EPS DEFINITION
Euronext FY 2017 results |28
In €m unless stated otherwise 2017 2016
Net Income Reported 241.3 197.0
EPS Reported (€ per share) 3.47 2.83
Intangible assets adj. related to acquisitions (PPA) - 2.4 -
Exceptional items - 14.8 - 10.0
Capital gains or losses (LCH SA swap) 40.6 -
Tax related to those items 2.7 1.9
Adjusted for intangible assets related to acquisitions, capital gains or losses
and exceptional items, incl. tax
Adj. Net Income 215.2 205.2
Adj. EPS (€ per share) 3.09 2.95

BALANCE SHEET AS AT 31 DEC. 2017
Euronext FY 2017 results |29
Unaudited, In €m As at 31 December 2017 As at 31 December 2016
Non-current assets
Property, plant and equipment 27.8 27.5
Goodwill and other intangible assets 515.1 321.2
Deferred income tax assets 8.0 5.0
Investments in associates and JV 75.0 16.0
Available-for-sale financial assets 147.5 117.1
Other receivables 8.0 7.1
Total non-current assets 781.4 493.8
Current assets
Trade and other receivables 95.0 81.6
Income tax receivable 1.4 7.6
Cash & cash equivalents 187.8 174.5
Total current assets 284.2 263.7
Total assets 1,065.6 757.5
Shareholders' equity
Shareholders' equity 715.3 548.0
Non-controlling interests 14.2 0.0
Total equity 729.5 548.0
Non-current liabilities
Borrowings 164.7 69.0
Other long-term financial liabilities 10.0 0.0
Deferred income tax liabilities 19.8 0.6
Post-employment benefits 11.7 13.2
Other provisions 5.1 6.5
Total Non-current liabilities 211.3 89.3
Current liabilities
Borrowings 0.2 0.1
Other short-term financial liabilities 6.7 0.0
Income tax payable 17.4 27.2
Trade and other payables 99.2 90.6
Other provisions 1.3 2.3
Total Current liabilities 124.8 120.2
Total equity and liabilities 1,065.6 757.5

CASH FLOW & LIQUIDITY
Euronext FY 2017 results
Cash Flow Statement for 2017 Liquidity for 2017
|30
Unaudited, In €m 2017 2016
Cash beginning of period 174.5 158.6
Debt repayment -70.0 -40.0
Debt subscribed 165.0 -
Acquisitions -167.3 -
Dividend -98.8 -86.2
Cash accumulation, net of others 184.4 142.1
Cash end of period 187.8 174.5
RCF 250 390
Available Liquidity 437.8 564.5
Unaudited, In €m 2017 2016
Profit before tax 311.1 264.0
Adjustments for:
- Depreciation and amortization 16.9 15.1
- Share based payments 3.8 2.8
- Gain on disposal of available-for-sale financial assets -42.2 0.0
- Share of profit from associates and joint ventures -0.3 0.0
- Changes in working capital -7.7 -20.3
Cash flow from operating activities 281.5 261.6
Income tax paid -68.4 -80.4
Net cash flows from operating activities 213.1 181.1
Cash flow from investing activities
Acquisitions of associates and joint ventures -2.1 -14.8
Acquisition of subsidiary, net of cash acquired -157.3 0.0
Purchase of available-for-sale financial assets -9.6 0.0
Proceeds from disposal of available-for-sale financial assets 1.7 0.0
Purchase of property, plant and equipment -6.1 -5.5
Purchase of intangible assets -17.8 -9.2
Net cash flow from investing activities -191.2 -29.6
Cash flow from financing activities
Proceeds from borrowings, net of transaction fees 165.0 0.0
Repayment of borrowings, net of transaction fees -71.2 -40.0
Interest paid -0.7 -1.3
Interest received 0.3 0.3
Dividends paid to the company's shareholders -98.8 -86.2
Transaction of own shares -1.0 -1.4
Employee Share transactions -2.1 0.0
Net cash flow from financing activities -8.5 -128.6
Total cash flow over the period 13.4 22.9
Cash and cash equivalents - Beginning of period 174.5 158.6
Non Cash exchange gains/(losses) on cash and cash equivalents -0.1 -7.1
Cash and cash equivalents - End of period 187.8 174.5

DISCLAIMER AND CONTACTS
This presentation is for information purposes only and is not a recommendation to engage in investment activities. The information and materials contained in this presentation are provided ‘as is’ and Euronext does not warrant as to the accuracy, adequacy or completeness of the information and materials and expressly disclaims liability for any errors or omissions. This presentation contains materials (including videos) produced by third parties and this content has been created solely by such third parties with no creative input from Euronext. It is not intended to be, and shall not constitute in any way a binding or legal agreement, or impose any legal obligation on Euronext. All proprietary rights and interest in or connected with this publication shall vest in Euronext. No part of it may be redistributed or reproduced without the prior written permission of Euronext. This presentation may include forward-looking statements, which are based on Euronext’s current expectations and projections about future events. By their nature, forward-looking statements involve known and unknown risks, uncertainties, assumptions and other factors because they relate to events and depend on circumstances that will occur in the future whether or not outside the control of Euronext. Such factors may cause actual results, performance or developments to differ materially from those expressed or implied by such forward-looking statements. Accordingly, no undue reliance should be placed on any forward-looking statements. Forward-looking statements speak only as at the date at which they are made. Euronext expressly disclaims any obligation or undertaking to update, review or revise any forward-looking statements contained in this presentation to reflect any change in its expectations or any change in events, conditions or circumstances on which such statements are based unless required to do so by applicable law. Financial objectives are internal objectives of the Company to measure its operational performance and should not be read as indicating that the Company is targeting such metrics for any particular fiscal year. The Company’s ability to achieve these financial objectives is inherently subject to significant business, economic and competitive uncertainties and contingencies, many of which are beyond the Company’s control, and upon assumptions with respect to future business decisions that are subject to change. As a result, the Company’s actual results may vary from these financial objectives, and those variations may be material. Efficiencies are net, before tax and on a run-rate basis, ie taking into account the full-year impact of any measure to be undertaken before the end of the period mentioned. The expected operating efficiencies and cost savings were prepared on the basis of a number of assumptions, projections and estimates, many of which depend on factors that are beyond the Company’s control. These assumptions, projections and estimates are inherently subject to significant uncertainties and actual results may differ, perhaps materially, from those projected. The Company cannot provide any assurance that these assumptions are correct and that these projections and estimates will reflect the Company's actual results of operations Euronext refers to Euronext N.V. and its affiliates. Information regarding trademarks and intellectual property rights of Euronext is located at https://www.euronext.com/terms-use. © 2017, Euronext N.V. - All rights reserved.
Website: www.euronext.com/en/investors Contact: Aurélie Cohen, Euronext Head of Investor Relations - [email protected] - +33 1 70 48 24 17
Euronext FY 2017 results |31