Embed Size (px)
Citation preview

www.vccedge.com
2017ANNUAL DEAL
REPORT
Snapshot of deal activity in private equity, venture capital, mergers & acquisitions and
equity capital market deals in 2016

Preface
Dear Reader,
We are delighted to present VCC Edge’s Annual Deal Report for the calendar year 2016. This annual publication reflects VCC Edge's commitment to facilitating a robust deal ecosystem in our country by promoting transparency via information dissemination.
Our Annual Deal Report presents a data-driven holistic view of private equity, venture capital, M&A and equity capital market deals in India, with sector and region-wise analysis
In 2016 we saw private equity and venture capital investments fall because of waning enthu-siasm after a strong 2015. This reflected a mood of cautious optimism where investors turned selective about their investment choices despite ample funds at their disposal.
The year was characterized by an increased focus on profitable and viable business models. Investors took their foot off the pedal when came to unproven business models and those led by heavy discounting and freebies.
Investors unlocked significant value via exits. M&A was the favoured exit route this year. M&A further emerged as a key means to market share consolidation and debt reduction.
As we step into 2017 we hope to see a stronger investment climate post demonetization as fund flows stabilize.Here's wishing you every success in 2017.
Regards,
Gaurav RoyBusiness HeadVCC Edge

Contents
VCCEdge | COPYRIGHT © 2017 All rights reserved
Disclaimer:VCCEdge (the research arm of VCCircle.com) has taken due care and caution in preparing this report. Information has been obtained from the VCCEdge platform and sources which it considers reliable. However, VCCEdge does not guarantee the accuracy, adequacy or completeness of any information and is not responsible for any errors or omissions or for the results obtained from the use of such information. No part of this report may be published/ reproduced in any form without VCCEdge’s prior written approval. VCCEdge or its owner Mosaic Media Ventures Pvt. Ltd. is not liable for decisions which may be based on the views expressed in this report.
I. Executive Summary ....................................................... 1
II. Timeline / India Investments Roadmap-2016 ............ 2
III (A) Private Equity InvestmentsOverview ....................................................................................... 4Deal Type Analysis ....................................................................... 5Sector Analysis ............................................................................. 7Top 10 Private Equity Investments .......................................... 8Regional Analysis ........................................................................ 9Most Active Investors ................................................................. 10III (B) Private Equity FundsFunds Launched .......................................................................... 12Funds Raised ................................................................................ 13
IV. Private Equity ExitsOverview ........................................................................................ 15
Breakdown of Private Equity Exits ........................................... 16Sector Analysis ............................................................................ 17Top 10 Private Equity Exits ........................................................ 18
V. Mergers & AcquisitionsOverview ....................................................................................... 20Deal Type Analysis ...................................................................... 21Sector Analysis ............................................................................ 23Top 10 Mergers & Acquisitions ................................................ 24Regional Analysis ........................................................................ 25
VI. Equity Capital Market Overview ........................................................................................ 27Sector Analysis ............................................................................ 28Deal Type Analysis ...................................................................... 29Top 10 ECM, IPOs Closed ......................................................... 30
VII. Glossary................................................................................ 31

The year 2016 was characterised by a funding drought - High valuations saw the likes of Flipkart, Snapdeal, Ola, Zomato and InMobi come under investor scrutiny in 2016 and
subject to sharp mark downs by both investors and analysts. The heady run of huge promotional spends, successive rounds of funding at ever-increasing valua-tions and crazy traffic growth saw a pause. 2016 was indeed a year where startups, mature businesses and fund managers took a moment to reflect on the hubris.
With performance under scrutiny and a slowdown in fund raising, investors started consolidating their investments via mergers, reducing costs by pulling back on past excesses and slashing debt.
Private equity (PE) investments fell both in number and value in 2016 as enthusiasm about investment prospects in local companies waned after a relatively strong 2015.
Venture capital deals too dropped across stages this year after peaking in 2015 with early stage funding getting significantly hit both by deal activity and value, as investors turned extremely cautious and selective in placing their bets on startups despite adequate funds at their disposal.
Investors’ cautious optimism was aptly reflected in their increased focus on viable and profitable business models and their reduced aggression on funding unprov-en business models, and marketing/ promotion heavy,
freebies/discounts led businesses.
Information Technology sector continues to attract a dominant share of private equity investments. The sector witnessed some aggressive deal making in 2016 with 766 deals as investors reposed faith on dot coms.
While total investments dropped this year, Exit and M&A deal value remained buoyant. Private equity investors unlocked $6.8 billion worth of investments across 239 exits in 2016, whereas, M&A deal value hits a five year high- a jump of 2.6 times to $61.4 billion in 2016. Merger and acquisition activity in India perked up this year thanks to a few multi-billion-dollar deals that companies struck either to slash debt or consolidate their market share
Private Equity
PE deal activity dropped by 25% from a year earlier to 1309 deals. The value of PE transactions, slumped by 44% to around $12.4 billion from $22 billion as compared to the same period last year. The data excludes Real Estate and Venture debt invest-ments
Angel and Seed investors drove the deal activity, contributing 57% to total private equity investments in 2016, while it was 50% in 2015
Big-ticket deals contributed 53% to total private equity investment value in 2016. There were 26 big-ticket deals with a total value of $6.6 billion, compared to 54 deals with a total value of $13.5 billion in 2015
The average deal value slipped to $13.1 million in 2016, as compared to $14.5 million a year ago
The median deal value saw a slight increase from $0.9 million last year to $1 million this year
Mergers and Acquisitions
M&A deals remained robust this year at 1,002 deals, with the corresponding deal value of $61.4 billion, hitting a five year high – a jump of 2.6 times in value from 2015 which saw 995 deals worth to $23.7 billion
The biggest deal of the year came in the energy sector and involved Russian giant Rosneft. The other top deals involved domestic players in sectors such as Financials, Telecommunication and Industrials
The median deal amount dropped to $5.9 million in 2016 from $10.8 million in 2015 while the average deal value increased significantly from $53.3 million in 2015 to $125.7 million in 2016
Big-ticket deals accounted for only 6% of total M&A deal activity this year, while contributed a whopping 92% to total M&A value disclosed in 2016, on the back of outlier deals
T
1VCCEdge | COPYRIGHT © 2017 All rights reserved
Executive Summary

2VCCEdge | COPYRIGHT © 2017 All rights reserved
Timeline / India Investments Roadmap - 2016
STOCK MARKET: WORST TWO-WEEK START EVER- JANUARY
The global slowdown, China’s slowing economy & deflation in Japan, led to weak capital markets.
CRUDE OIL PRICES- JANUARY, OCTOBER & DECEMBER
Volatility in the oil prices affected the sentiments of foreign investors who contribute the lion’s share of funds for PE/VC investments.
CO-INVESTMENT OPPORTUNITIES- MARCH
PE / VC firms are seeing significant co-investment opportunities along with the fund’s investors.
• $230 million investment in Greenko Energy Holdings by Abu Dhabi Investment Council and GIC
BREXIT- JUNE
The Brexit referendum, cast a shadow on the future of the European economy, the British Pound and Britain's pre-eminent position in the world’s financial markets
FDI NORMS - JUNE
India Government relaxed Foreign Direct Investment (FDI) norms across various sectors, 100% FDI in airlines, 74% in pharmaceuticals
• Shanghai Fosun Pharmaceuticals acquired 86% stake in Gland Pharma for $1.3 billion
BETTER ECONOMIC AND INFLATION CONDITION - SEPTEMBER
IPOs surged to a five-year high with $4.12 billion raised across 93 IPOs
• ICICI Prudential Life Insurance's $905 million IPO, is the country's biggest IPO this year
DEMONETIZATION - NOVEMBER
India’s giant macroeconomic experiment put a huge squeeze on liquidity, slowed the economy down to almost a standstill and set back growth
INCREASING RATES - DECEMBER
The Federal Reserve decided to raise interest rates by 25 basis points in its December meeting, citing higher home prices, low unemployment and improving confidence in the economy as it projected three additional rate hikes in 2017
DONALD TRUMP - NOVEMBER
Donald Trump’s controversial candidature and eventual victory in US Presidential race led investors to panic with widespread fears of undue protectionism and hostile immigration laws which are expected to result in a global trade slowdown
MAKE IN INDIA CAMPAIGN - STRONG FOCUS ON ENERGY SECTOR
Energy sector witnessed a couple of multi-billion dollar deals this year
• Russian state energy giant, Rosneft along with United Capital Partners Mauritius and Trafigura struck a $10.7 billion deal with Essar Oil. The buyers also acquired Vadinar Oil for $1.9 billion
• Tata Power acquired Welspun for 1.4 billion
• Acquisition of Taas Yuryakh Neftegazodobycha and Gujarat State Petroleum Corporation for $1.3 & $1.2 billion respectively
The private equity sector has been hit by a number of headwinds this year, including weak currency and high valuation, has turned a corner and seems to be on a path to recovery

PRIVATE EQUITY INVESTMENT
2014 and 2015 were a period of over investments while 2016 was a correction period and all about measured
investment at a steady pace”Sanjay Nath, Co-founder and Managing Partner, Blume Ventures

rivate equity investments in India fell both in number and value in 2016 as the invest-ment climate waned post a relatively strong 2015. The value of transactions
dropped 44%, from $22 billion to $12.3 billion. Transaction activity too went down by 25% to 1,309 deals in 2016, as compared to 1,752 deals in 2015.
Surprisingly, Canadian investors emerged as the top PE investors in India (by value) this year. Investment firms like Fairfax, Canada Pension Plan Investment Board, Brookfield and Quebec Deposit and Investment Fund account-ed for 21% of total PE investments in 2016.
Investors’ cautious optimism is aptly reflected in their increased focus on viable and profitable
business models and their reduced aggression on funding unproven business models, and marketing/ promotion heavy, freebies/discounts led businesses.
Angel and Seed investors drove the deal activity during the year, contributing 57% to total PE investments in 2016. This figure stood at 33% in 2012 and has been rising steadily since. They accounted for 748 deals amounting to $324 million in 2016. Dheeraj Jain, managing partner at
London-based investment firm Redcliffe Capital, and former Snapdeal product head Anand Chandrase-karan were among India’s top angel investors this year by number of deals they disclosed. Jain closed 23 deals in 2016 versus eight in 2015, and Chan-drasekaran added 20 companies to his portfolio this
year compared with 15 last year.
Information Technology (which includes online businesses and software companies) continues to attract a lion’s share of PE investments. This sector witnessed aggressive deal making in 2016 with 766 deals as investors reposed faith on dot coms, however, when compared to 2015, the sector dipped 20% in terms of number of deals and 50% in terms of deal value. Internet software and services, and application software companies attracted a total of 714 investments in 2016, accounting for 93% of total investments in the sector.
Consumer Discretionary came in second with 228 deals amounting to $1.6 billion. Internet Retail with 107 deals drove the deal activity in the Consumer Discretionary sector. Sectors such as Industrials, Healthcare, and others showed a downward trend both by investment activity and value in 2016.
Brookfield Asset Management’s purchase of Reliance Communications’ telecom tower business for $1.6 billion was the biggest deal of the year. Blackstone Advisors’ $825 million investment in Mphasis came in next.
*Note: The data includes only equity transactions and excludes non-convertible debt investments across all categories as well as debt funding by PE players in sectors such as real estate
PPrivate Equity Investments - Overview
4VCCEdge | COPYRIGHT © 2017 All rights reserved
Private Equity InvestmentsNumber of Deals Value of Deals ($ bn)
2012 2013 2014 2015 2016
10.6
830 918
10.9
1,119
13.5
1,752
22.0
1,309
12.4
Canadian investors emerged as the top PE investors in India (by value) this year

ngel and Seed investors continued to drive deal activity this year accounting for 57% of total private equity investments
in 2016, up from was 50% in 2015. Although, when compared to last year, number of deals reduced by 15% to 748 (from 878 in 2015).
Early stage investments in start-ups (including Angel/Seed and Venture Capital Series A and Series B rounds) has shown a signifi-cant decline of 39% to $1.6 billion in CY2016, as compared to $2.6 billion last year, while the number of deals declined by 23% from 1,286 to 984. Bridge rounds accounted for 14% of total venture capital deals with 50 deals worth $40 million illustrating the challenges investors and companies have faced in raising funds and doing closures.
Venture capital deal activity declined sharply by 39% to 362 deals from 594 deals in 2015. Deal value too declined by 58% to $2.7 billion, as compared to $6.5 billion in the preceding year. PE funds
Deal Type Analysis
5VCCEdge | COPYRIGHT © 2017 All rights reserved
Private Equity Breakdown – Number of Deals
Angel/ Seed Venture Capital Private Equity Funds Pre-IPO Placements
Mean Deal Value ($ mn)
2012 2013 2014 2015 2016
Median Deal Value ($ mn)
and placements deals declined by 27% and 33% respectively to 153 and 45 deals in 2016, as compared to 209 and 67 deals in 2015.
PE funds contributed 60% to total value of the private equity investments during the year.
273
748
225218 110
4 451153
362
0
200
400
600
800
1000
2012 2013 2014 2015 2016
Private Equity Breakdown – Value of Deals ($ mn)
5,1244,002
1,210123 118
7,384
2,742
1,89343 324
2012 2013 2014 2015 2016
Angel/ Seed Venture Capital Private Equity Funds Pre-IPO Placements
0
2000
4000
6000
8000
10000
12000
14.94 14.31 14.09 14.4813.09
2012 2013 2014 2015 2016
2.88
1.85
1.180.91 1.00
A The number of big-ticket deals declined 52% to 26 deals in 2016, compared to 54 deals in 2015. Big-ticket deals amounted to $6.6 billion contributed 53% to total private equity investments in 2016 against a contribu-tion of 61% amounting to $13.5 billion in 2015.
Angel and Seed investors drive deal activity this year accounting for 57%

6VCCEdge | COPYRIGHT © 2017 All rights reserved
Deal activity across different transaction sizes declined significantly apart from the undisclosed deals. The share of undisclosed deals rose to 28% in 2016 from 13% in 2015.
Big-ticket deals comprised 53% or $6.6 billion worth of the total private equity investments in 2016, down from 61% or $13.5 billion in 2015.
Deal Type Analysis
Transactions by Deal SizeUndisclosed Under $5 mn $5 - $25 mn $25 - $50 mn $50 - $100 mn $100 mn+
Total Investment by Deal SizeUnder $5 mn $5 - $25 mn $25 - $50 mn $50 - $100 mn $100 mn+
Transactions by Deal Size
Undisclosed
Under $5 mn
$5 - $25 mn
$25 - $50 mn
$50 - $100 mn
$100 mn+
2012
122
432
186
55
20
15
2013
157
504
178
39
18
22
2014
158
672
177
49
37
26
2015
231
1,115
258
53
41
54
2016
363
669
180
47
24
26
Total Investment by Deal Size ($ mn)
Under $5 mn
$5 - $25 mn
$25 - $50 mn
$50 - $100 mn
$100 mn+
2012
529
2,047
1,928
1,417
4,656
2013
558
2,060
1,359
1,179
5,733
2014
706
2,033
1,707
2,554
6,540
2015
1,007
2,860
1,850
2,766
13,533
2016
562
2,071
1,543
1,625
6,585
2012
2013
2014
2015
2016
0% 20% 40% 60% 80% 100%
2012
2013
2014
2015
2016
0% 20% 40% 60% 80% 100%

Information TechnologyConsumer DiscretionaryIndustrialsHealthcareFinancialsConsumer StaplesMaterialsUtilitiesTelecommunication ServicesEnergyTotal
Number of Deals7662288682814015731
1,309
Number of Deals959341149989558192544
1,752
3,158 1,582 2,992
731 2,977
204 257 463
0 20
12,385
6,300 4,447 3,639 1,325 3,328
551 221
1,681 4
521 22,018
Value of Deals ($ mn) Value of Deals ($ mn)
2016 2015
Private Equity Sectoral Analysis
Sector Analysis
nformation Technology attracted the largest share of private equity investments in 2016, both in terms of deal activity number and value, with 766 deals worth $3.2 billion. The
sector contributed 59% to total private equity
7VCCEdge | COPYRIGHT © 2017 All rights reserved
Top 5 Sectors by Value of Deals ($ mn)
Top 5 Sectors by Number of Deals
investments in terms of number and 25% in terms of value. Consumer Discretionary came in a distant second with 228 deals, followed by Industrials, Healthcare and Financials with 86, 82 and 81 deals respectively.
In terms of value, Industrials sector came in second with $3 billion, closely followed by Financials, Consumer Discretionary and Healthcare with $3 billion, $1.6 billion and $731 million respectively.
I
Consumer Discretionary
3,158Information Technology
2,992Financials 2,977
Industrials
1,582Healthcare731
Information Technology
766Consumer Discretionary
228
Industrials 86
Health Care82 Financials
81

Top 10 Private Equity Investments
8VCCEdge | COPYRIGHT © 2017 All rights reserved
$825SUB-INDUSTRY: DATA PROCESSING & OUTSOURCED SERVICESAnnounced on: Apr-2016Target: Mphasis Ltd.Buyer: Blackstone Advisors India Pvt. Ltd.
$1610SUB-INDUSTRY: CONSTRUCTION & ENGINEERINGAnnounced on: Dec-2016Target: Towercom Infrastructure Pvt. Ltd.Buyer: Brookfield Asset Management Inc.
$190SUB-INDUSTRY: DIVERSIFIED BANKSAnnounced on: Sep-2016Target: Kotak Mahindra Bank Ltd.Buyer: Canada Pension Plan Investment Board
$194SUB-INDUSTRY: SPECIALIZED FINANCEAnnounced on: Mar-2016Target: National Stock Exchange of India Ltd.Buyer: ChrysCapital Investment Advisors India Pvt. Ltd.,Life Insurance Corp. of India,Ward Ferry Management Ltd.,ICICI Lombard General Insurance Company Ltd.
$200SUB-INDUSTRY: INTERNET RETAILAnnounced on: Jan-2016Target: Jasper Infotech Pvt. Ltd.Buyer: Bennett Coleman and Co. Ltd.,Ontario Teachers Pension Plan
$266SUB-INDUSTRY: LIFE & HEALTH INSURANCEAnnounced on: Dec-2016Target: SBI Life Insurance Company Ltd.Buyer: Temasek Holdings Advisors India Pvt. Ltd.,KKR India Advisors Pvt. Ltd.
$330SUB-INDUSTRY:CONSUMER FINANCEAnnounced on: Mar-2016Target: GE Capital Services IndiaBuyer: AION India Investment Advisors Pvt. Ltd.
$210SUB-INDUSTRY: SPECIALIZED FINANCEAnnounced on: Feb-2016Target: Janalakshmi Financial Services Pvt. Ltd.Buyer: GIC Pte. Ltd.,QRG Enterprises Ltd.,Morgan Stanley Private Equity Asia IV LP,TPG Asia Buyout Fund VI,Havells India Ltd.
$370SUB-INDUSTRY:AIRPORT SERVICESAnnounced on: Mar-2016Target: Bangalore International Airport Ltd.Buyer: Fairfax India Holdings Corporation,Fairfax Financial Holdings Ltd.
$230SUB-INDUSTRY: INDEPENDENT POWER PRODUCERS & ENERGY TRADERSAnnounced on: Mar-2016Target: Greenko Energy HoldingsBuyer: Abu Dhabi Investment Council,GIC Pte. Ltd.
Private Equity Funds
Private Equity Funds
Private Equity Funds
Private Equity Funds
Private Equity Funds
Private Equity Funds
Private Equity Funds
Private Equity Funds
Placements
Placements
Deal Value ($ mn)

Regional Analysis
Delhi NCR saw the most activity with 350 deals, Bengaluru came in the second with 277 deals, closely followed by Mumbai with 227 deals. However, when measured in value terms, Mumbai topped the charts at $4.3 billion followed by Delhi NCR ($2.6 billion) and Bengaluru ($2.5 billion).
Maharashtra led the deal value and activity for both 2016 and 2015, followed by Karnataka.
9VCCEdge | COPYRIGHT © 2017 All rights reserved
Value of Deals ($ mn)2016 Number of Deals Value of Deals ($ mn)2016 Number of Deals
Value of Deals ($ mn)2015 Number of DealsValue of Deals ($ mn)2015 Number of Deals
Top 5 States Top 5 Cities
4,462
2,518
3,675
1,302
2,369 2,396
1,094 257
2,493
5,399
4,337
532
879
Maharashtra Karnataka Delhi Haryana Uttar Pradesh Delhi NCR Bengaluru Mumbai Pune Chennai
Bengaluru Delhi NCR Mumbai Chennai HyderabadMaharashtra Karnataka Delhi Haryana Tamil Nadu
303
429
423
241 17681
350 277
417
444360
7266
227
6547
280
190 114 58
5,979
2,560
3,654
4,829
871 477
123

Most Active Investors - 2016
10VCCEdge | COPYRIGHT © 2017 All rights reserved
Angel/Seed
ASSET MANAGER NAME NUMBER OF DEALS VALUE OF DEALS ($ mn)*
Indian Angel Network Services Pvt. Ltd. 23 1.78Blume Venture Advisors Pvt. Ltd. 11 2.63Singapore Angel Network Pte Ltd. 10 0.16Global Super Angels Forum 9 1.44The Chennai Angels 9 0.16
Venture Capital
ASSET MANAGER NAME NUMBER OF DEALSSequoia Capital India Advisors Pvt. Ltd. 31 52.41Accel India Management Co. Pvt. Ltd. 26 20.52Omidyar Network India Advisors Pvt. Ltd. 16 13.07IDG Ventures India Management Co. Ltd. 15 8.10Blume Venture Advisors Pvt. Ltd. 13 1.92
VALUE OF DEALS ($ mn)*
Private Equity Funds
ASSET MANAGER NAME NUMBER OF DEALSInternational Finance Corp. 6 161IDFC Alternatives Ltd. 5 239TPG Capital Inc. 4 218PremjiInvest 4 26Fairfax India Holdings Corporation 4 56
* Subject to limited deal value disclosure
VALUE OF DEALS ($ mn)*

PRIVATE EQUITY FUNDS
We are in a period of rightsizing now. Funding is not going anymore into
me-too activities. We saw a lot of startups in the food tech space shutting shop and rightfully so. This year was a period of hunkering down and there is cautious optimism... However, the fundamentals are strong so it is not gloom and doom as the numbers may suggest”Sanjay Nath, Co-founder and Managing Partner, Blume Ventures

Private Equity Fundraising - Funds Launched
12VCCEdge | COPYRIGHT © 2017 All rights reserved
n 2016, a total of fifty India dedicated funds were launched targeting an aggregated capital raised
of $5.3 billion. This is the second highest in the last five years after 2015 which saw 56 funds being launched. The capital sought saw a notable dip of 68% from $16.9 billion last year going back to 2012 and 2013 levels.
The significant dip in targeted capital this year illustrates tough fund raising conditions. The year has seen 34 new funds which are sub-$100 million and 13 funds of above $100 million, most of which target Real Estate and Infrastruc-ture. HDFC Capital Advisors Ltd launched the largest fund in the Real Estate sector with a target size of $749 million.
I Number of Funds Launched by Fund SizeNumber of Funds Launched
Top Funds Launched - 2016
FUND NAME ASSET MANAGER TARGET SIZE ($ mn) AREA OF INTEREST HDFC Capital Affordable Real Estate Fund-1 HDFC Capital Advisors Ltd. 749 Real EstateReliance Jio Digital India Startup Fund - 745 TechnologyKotak Special Situations Credit Fund Canada Pension Plan Investment Board 525 Banking & Financial ServicesASK Real Estate Special Situations Fund ASK Property Investment Advisors Pvt. Ltd. 300 Real EstateIndia Vision Fund SREI Venture Capital Ltd. 291 InfrastructureGodrej Residential Investment Program II Godrej Fund Management 275 Real EstateKotak India Real Estate Fund VIII Kotak Investment Advisors Ltd. 250 Real Estate
KKR India Debt Opportunities Fund II KKR India Advisors Pvt. Ltd. 236 Banking & Financial Services,Infrastructure,Renewable Energy,Technology
Maitreyi Digital India Fund Maitreyi Capital Advisors Pvt. Ltd. 222 TechnologyMilestone Commercial Advantage Fund Milestone Capital Advisors Ltd. 210 Real Estate
2012 2013 2014 20162015 2012 2013 2014 20162015
Undisclosed <$100 mn $100 mn-$250 mn $250 mn-$500 mn >$500 mn
5.3 5.47.0
16.9
5.3
40 4544
56
50
4
20
7 63 4
28
8
2 31
23
10
55
2
24
34
1310
7
36
4 3
Number of funds launched Total targeted Capital ($ bn)

Funds Raised
13VCCEdge | COPYRIGHT © 2017 All rights reserved
Top 10 Funds Raised-2016
FUND NAME FUND STATUS ASSET MANAGER YEAR LAUNCHEDFUND SIZE ($ mn) AMOUNT RAISED ($ mn)
und raising by PE funds dipped 26% to $4.2 billion in 2016, down from $5.7 billion in 2015. The number of funds too fell by 9% to
39 funds the lowest in the five-year period starting 2012. The dip in both number and value can be attributed to the low fund raising activity in the last two quarters which saw 14 funds raising a mere $895 million as compared to 29 funds in first half raising a total of $3.3 billion (similar to the what we saw in 2015).
F Funds Raised Number of Funds Amount Raised ($ bn)
Number of Funds Raised by Fund Type Private Equity/Buyout Venture Capital
2012 2013 2014 2015 2016 2012 2013 2014 2015 2016
55 4143
43
39
3.5 3.24.0
5.7
4.2
41
2326
18
30
17
2521 22 22
Sequoia Capital India V Ltd. Final Close 800 920 Sequoia Capital India Advisors Pvt. Ltd. Oct-2015
HDFC Capital Affordable Real Estate Fund-1 Final Close 749 405 HDFC Capital Advisors Ltd. Jan-2016
Multiples Private Equity Fund II LLP Final Close 600 285 Multiples Alternate Asset Management Pvt. Ltd. Apr-2015
Godrej Residential Investment Program II Final Close 275 275 Godrej Fund Management Mar-2016
Kotak India Real Estate International Fund III Final Close 250 250 Kotak Investment Advisors Ltd. Jan-2015
Oman India Joint Investment Fund II First Close 400 250 Oman India Joint Investment Fund - Management Company Pvt. Ltd. Nov-2015
India Advantage Fund Series IV First Close 500 190 ICICI Venture Funds Management Company Ltd. Jan-2015
Matrix Partners India II LLC Final Close 331 110 Matrix India Asset Advisors Pvt. Ltd. Apr-2011
Gaja Capital Fund III Ltd. Final Close 240 110 Gaja Capital Dec-2013
ASK India Real Estate Special Opportunities Fund Pte Ltd. Final Close 200 96 ASK Capital Management Pte. Ltd. Jul-2013

PRIVATE EQUITY EXITS
The startup investments in 2016 signified maturity. The
learning from 2015 were well-captured in the evaluation and subsequent rounds. Investors become wiser by observing and participating in such economic cycles. We are happy that we had this opportunity in early days of YourNest journey.”Sunil K Goyal, Founder and CEO, YourNest India VC Fund

Private Equity Exits - Overview
15VCCEdge | COPYRIGHT © 2017 All rights reserved
2012 2013 2014 2015 2016
rivate equity investors unlocked $6.8 billion worth of investments across 239 exits in 2016. While total number of exit deals fell
from last year, the value unlocked was higher indicating large deal sizes. Deal value increased by 17% compared to the same period last year.
KKR, which struck its first India exit in
P 2015 from Bharti Infratel, sealed four stake sale deals in 2016. These two included with over $1 billion in valuation. KKR exiting from tyre maker Alliance Tyres Group taking back $943 million as exit realization was the top exit of the year. This was closely followed by Temasek Holdings selling its 7.39% stake in Bharti Telecom to Singapore Telecommunications Ltd. for $657 million.
In other significant deals, Actis Private Equity exited
Private Equity Exits
254271
306297
239
6.0 5.5 5.1
5.8
6.8
Number of Exits Value of Exits ($ bn)
auto-component maker Endurance Technologies, Goldman Sachs Private Equity exited Sigma Electric and KKR sold its stake in Dalmia Cement. KKR and Goldman both also exited TVS Logistics.
In the financial services sector, Kedaara Capital exited non-banking finance company AU Financiers. The telecom sector saw two key deals with Temasek exiting Bharti Airtel and Providence Equity Partners selling a stake in Idea Cellular. Gland Pharma and Care Hospitals were the healthcare companies that saw exit deals this year. Here are the top PE exit deals of this year.
KKR exiting from tyre maker Alliance Tyres Group taking back $943 million as exit realization was the top exit of the year.

Breakdown of Private Equity Exits
&A exits superseded the Open market exits this year, both in terms of number of deals and deal value. M&A exits contributed 43% to total exit activity and
52% to exit value (102 deals worth $3.6 billion). This was followed by Open Market exits with 76 deals accounting for 32% of total exit activity and 26% of total exit value.
The number of M&A exits increased 19% in 2016 to 102 deals as against 86 deals in 2015. IPO exits also picked up pace from last year with 14 deals marking an increase of 17%. Open market exits has been lowest in past five years dropping by 38% in 2016 to 76 deals from 122 exits during the same period last year. Buyback exits too dipped significantly by 64 percent from 33 to 12 deals, while Secondary Sales marginally slipped by 20% to 35 deals when compared to 44 deals in the previous year.
Exits through M&A increased more than 20 times to $3.6 billion in 2016 from $175 million in 2015 (highest in the last five years). IPO exits also increased 2.3 times to $910 million as compared to $392 million recorded last year (another 5 year high). Open market exits value declined by 48% to $1.7 billion from $3.4 billion last year, recording a 5 year low. Buyback and Secondary Sales declined by 45% ($290 million from $523 million) and 78% ($302 million from $1,359 million) respectively.
16VCCEdge | COPYRIGHT © 2017 All rights reserved
M&A Public Offerings Open Market Buyback Secondary Sales
M&A Public Offerings Open Market Buyback Secondary Sales
Exits Breakdown - Number of Exits
Exits Breakdown - Value of Exits ($ mn)
M
2012 2013 2014 2015 2016
2012 2013 2014 2015 2016
6479
62
43
62
3
47
2
41 4435
89
66
155
42
86
12
122
33
102
14
76
12
70
6
491 407
3,495
395743
1,257
317
2,416
792
1,216
820
54
3,751
218215 175 392
3,367
523
1,359
3,554
910
1,737
290 302

Sector Analysis
17VCCEdge | COPYRIGHT © 2017 All rights reserved
Exits Sectoral Breakdown
The Financials sector led the exit activity with 56 deals amounting to $1.7 billion (majorly contributed by one big-ticket deal . This was closely followed by Information Technology sector with 55 deals. The other sectors to witness significant exit activity during the year include Consumer Discre-tionary (39 deals), Industrials (35 deals), and Healthcare with 25 deals.
FinancialsInformation TechnologyConsumer DiscretionaryIndustrialsHealthcareConsumer StaplesMaterialsUtilitiesTelecommunication ServicesEnergyTotal
Number of Exits5655393525129422
239
Number of Exits7261435123171875-
297
1,726 1,284 1,396
697 987 232 227
34 205
4 6,793
1,698 513 698 685 558 551 538 114 462
- 5,817
Value of Exits ($ mn) Value of Exits ($ mn)
2016 2015
SectorMerger and Acquisition Public Offerings Open Market Buyback Secondary Sales
Number of Exits Value of Exits ($ mn) Number of Exits Value of Exits ($ mn) Number of Exits Value of Exits ($ mn) Number of Exits Value of Exits ($ mn) Number of Exits Value of Exits ($ mn)
Information Technology 44 1,077 1 13 4 19 1 - 5 175
Financials 22 614 3 362 17 631 3 78 11 41
Industrials 8 255 2 65 18 287 3 31 4 59
Consumer Discretionary 12 997 2 139 15 240 4 - 6 21
Telecommunication Services 1 - - - 1 205 - - - -
Consumer Staples 1 - 1 46 8 179 - - 2 6
Healthcare 9 597 4 286 6 104 - - 6 -
Materials 1 9 - - 6 37 1 181 1 -
Utilities 2 - 1 - 1 34 - - - -
Energy 2 4 - - - - - - - -

Top 10 Private Equity Exits
18VCCEdge | COPYRIGHT © 2017 All rights reserved
Exit Value ($ mn)
M&A
$943 Sub-Industry: Tires & RubberAnnounced on: Mar-2016 | Return(x): 2.01Target: Alliance Tire Group B.V.Seller: KKR India Advisors Pvt. Ltd.
M&A
$657 Sub-Industry: Communications EquipmentAnnounced on: Aug-2016Target: Bharti Telecom Ltd.Seller: Temasek Holdings Advisors India Pvt. Ltd.
M&A
$577Sub-Industry: PharmaceuticalsAnnounced on: Jul-2016 | Return(x): 5.77Target: Gland Pharma Ltd.Seller: KKR India Advisors Pvt. Ltd.
M&A
$420Sub-Industry: IT Consulting & Other ServicesAnnounced on: Jul-2016 | Return(x): 1.62Target: Minacs Pvt. Ltd.Seller: Capital Square Partners Pte.Ltd, CX Capital Management Ltd.
M&A
$235 Sub-Industry: Construction & Farm Machinery & Heavy TrucksAnnounced on: Dec-2016Target: International Tractors Ltd.Seller: Blackstone Advisors India Pvt. Ltd.
M&A
$224Sub-Industry: Real Estate DevelopmentAnnounced on: Oct-2016 | Return(x): 2.10Target: Lodha Group, World OneSeller: HDFC Property Fund
Open Market
$205Sub-Industry: Wireless Telecommunication ServicesAnnounced on: Jun-2016 | Return(x): 0.51Target: Idea Cellular Ltd.Seller: Providence Equity Partners LLC
Buyback
$181 Sub-Industry: Construction MaterialsAnnounced on: Jan-2016 | Return(x): 1.64 Target: Dalmia Cement Bharat Ltd.Seller: KKR India Advisors Pvt. Ltd.
Secondary Sales
$175 Sub-Industry: Electronic Manufacturing ServicesAnnounced on: Jan-2016 | Return(x): 13.91Target: Amber Enterprises India Pvt. Ltd.Seller: Reliance Alternative Investments Fund Private Equity Scheme I
Initial Public Offering
$224Sub-Industry: Thrifts & Mortgage FinanceAnnounced on: Apr-2016Target: Equitas Holdings Ltd.Seller: Aavishkaar Goodwell India Microfinance Development Co. Ltd.,India Financial Inclusion Fund,MicroVentures SPA,ARIA Investment Partners III LP,Sequoia Capital India III LP,WestBridge Ventures II LLC,Aquarius Investment Advisors India Pvt. Ltd.,Helion Venture Partners II LLC,International Finance Corp.,Netherlands Development Finance Co., Creation Investments Capital Management LLC,Sarva Capital LLC

MERGERS & ACQUISITIONS

Mergers & Acquisitions – Overview
20VCCEdge | COPYRIGHT © 2017 All rights reserved
erger and Acquisition activity in India perked up this year thanks to a few multi-billion-dollar deals
that companies struck either to slash debt or consolidate their market share. The number of M&A deals remained robust this year with 1,002 deals, with the corresponding deal value of $61.4 billion, hitting a five year high – a jump of 2.6 times in value from 2015 which saw 995 deals amounting to $23.7 billion. There were 633 domestic M&A
deals amounting to $32.8 billion – a jump of over 3.8 times in value and 143 inbound deals amounting to $18.8 billion – a jump of over 2.3 times in value.
The increase in the M&A deal value can be attributed to the three largest deals worth $27.7 billion. These are Essar Oil Ltd, Max Life Insurance Co. Ltd and Reliance Communica-tions Ltd., Wireless Telecom Business acquisitions contributing 45% to total M&A deal value.
Information Technology witnessed maximum M&A
Mergers & Acquisitions
deals with 288 deals, followed by the Consumer Discretionary, Industrials and Financials with 170, 138 and 119 deals, respectively. M&As in the information technology sector was led by Internet software and services (192 deals) and IT consulting companies (46 deals)
The largest M&A deal of 2016 was the acquisition of Essar Oil Ltd by Rosneft, United Capital Partners Mauritius Ltd and Trafigura Ltd, for a total consider-ation of $10.7 billion (an all cash deal for 98% stake). The buyers also acquired Vadinar Oil Termi-nal Ltd for $1.9 billion.
In the second largest M&A transaction this year, HDFC Standard Life Insurance Co. Ltd inked a deal to acquire Max Life Insurance Co. Ltd for a total consideration of $9.7 billion. As a part of the trans-action, Max Financial Services Ltd, Axis Bank Ltd and Mitsui Sumitomo Insurance Co. Ltd will sell their entire stake in Max Life Insurance.
The third largest and long awaited, Reliance and Aircel announced the merger of their telecom business for $7.3 billion.
M
2012 2013 2014 2015 2016
Number of Deals Value of Deals ($ bn)
21.21 24.19 32.91 23.71
61.44
808869
911
995
1,002
The increase in the M&A deal value can be attributed to the three largest deals worth $27.7 billion.

Deal Type Analysis
21VCCEdge | COPYRIGHT © 2017 All rights reserved
M&A Breakdown - By Number of DealsInbound Outbound Domestic Others
2012 2013 2014 2015 2016
156
11.00
8.99
11.10 10.75
58.92
58.72
80.27
53.29
125.65
5.92
156
425
71
161
136
489
83
168133
512
98
151137
607
100
143
115
633
111
DomesticInbound Outbound Others Figures in $mn
M&A Breakdown - By Value of Deals ($ mn)
2012 2013 2014 2015 2016 2012 2013 2014 2015 2016
Figures in $ mn
Median Deal Size Mean Deal Size
&A activity remained robust this year however inbound and outbound deals saw a slight drop in the number of transac-tions. Inbound deals saw a 5% drop in number to 143 and outbound activity declined by 16% to 115 deals versus
2015 both hitting a five year low of. Domestic M&A deals saw an increase of 3.8% in value to $32.8 billion, while inbound deals rose by 1.3 times to $18.8 billion in 2016.
The other M&As that includes cross-border acquisitions by offshore vehicles of Indian companies contributed 11% to total M&A activity and 8% to total value this year. The activity increased by 11% to 111 deals in 2016 as compared to 100 deals in 2015. In value terms, it surged 2.9 times amounting to $5 billion as against $1.7 billion in a year ago period.
The mean deal value increased to a five-year high $125.7 million, while median value dropped to a five-year low $5.9 million.
M
7,154 6,832
5,908 1,318
7,472 8,660
6,481 1,580
4,229 2,593
19,679 6,407
8,048 5,310
8,653 1,702
18,782 4,887
32,775 4,999
2012
2013
2014
2015
2016
30
60
90
120
150

Deal Type Analysis
22VCCEdge | COPYRIGHT © 2017 All rights reserved
Big ticket deals contributed a significant 92% to total M&A value disclosed in 2016
Big ticket deals accounted for only 6% of total deal activity while a signifi-cant 23% is contributed by small size deals of under $5 million.
Transactions by Deal SizeUndisclosed Under $5 mn $5 - $25 mn $25 - $50 mn $50 - $100 mn $100 mn+
Total Investment by Deal Size ($ mn) Under $5 mn $5 - $25 mn $25 - $50 mn $50 - $100 mn $100 mn+
Transactions by Deal Size
2012 2013 2014 2015 2016
Undisclosed 448 457 501 550 513
Under $5 mn 118 159 149 164 230
$5 - $25 mn 115 133 135 127 129
$25 - $50 mn 51 46 40 60 41
$50 - $100 mn 28 30 31 36 27
$100 mn+ 48 44 55 58 62
Total Investment by Deal Size ($ mn)
2012 2013 2014 2015 2016
Under $5 mn 199 267 222 234 301
$5 - $25 mn 1,386 1,711 1,801 1,581 1,550
$25 - $50 mn 1,743 1,563 1,405 2,015 1,446
$50 - $100 mn 1,943 2,031 2,226 2,508 1,847
$100 mn+ 15,942 18,621 27,255 17,375 56,300
0% 20% 40% 60% 80% 100%0% 20% 40% 60% 80% 100%
2012
2013
2014
2015
2016
2012
2013
2014
2015
2016
Sector Analysis
23VCCEdge | COPYRIGHT © 2017 All rights reserved
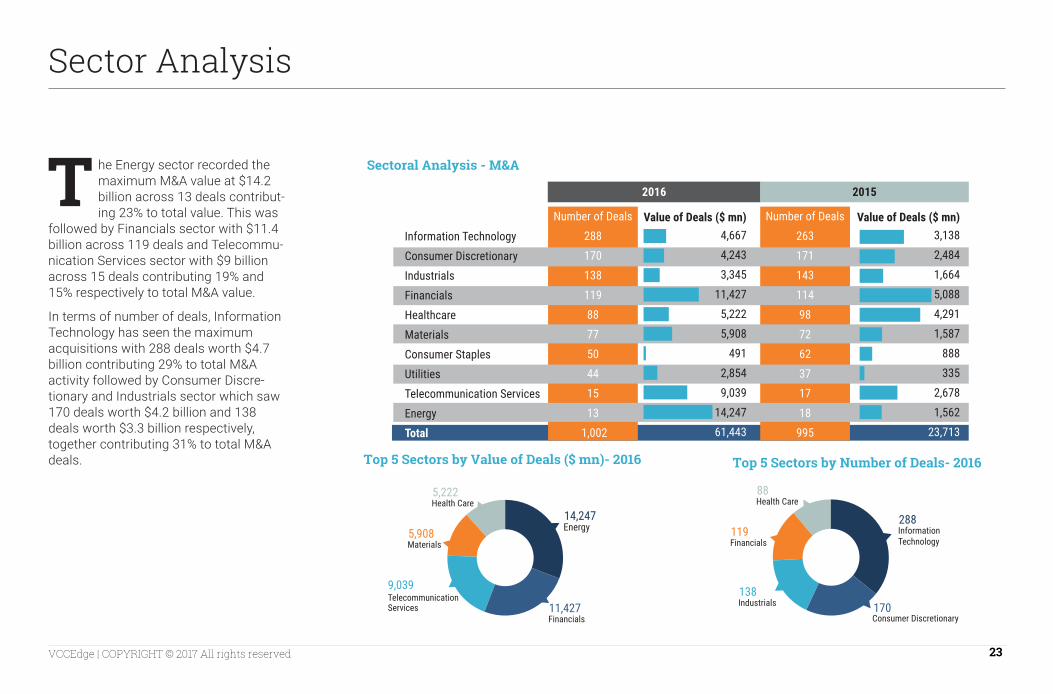
he Energy sector recorded the maximum M&A value at $14.2 billion across 13 deals contribut-ing 23% to total value. This was
followed by Financials sector with $11.4 billion across 119 deals and Telecommu-nication Services sector with $9 billion across 15 deals contributing 19% and 15% respectively to total M&A value.
In terms of number of deals, Information Technology has seen the maximum acquisitions with 288 deals worth $4.7 billion contributing 29% to total M&A activity followed by Consumer Discre-tionary and Industrials sector which saw 170 deals worth $4.2 billion and 138 deals worth $3.3 billion respectively, together contributing 31% to total M&A deals.
Information TechnologyConsumer DiscretionaryIndustrialsFinancialsHealthcareMaterialsConsumer StaplesUtilitiesTelecommunication ServicesEnergyTotal
Number of Deals288170138119887750441513
1,002
Number of Deals263171143114987262371718
995
4,667 4,243 3,345
11,427 5,222 5,908
491 2,854 9,039
14,247 61,443
3,1382,4841,6645,0884,2911,587
888335
2,6781,562
23,713
Sectoral Analysis - M&A
Value of Deals ($ mn) Value of Deals ($ mn)
Top 5 Sectors by Value of Deals ($ mn)- 2016 Top 5 Sectors by Number of Deals- 2016
T
Energy14,247
Financials11,427
Telecommunication Services
9,039
Materials5,908 Information
Technology
288
Consumer Discretionary170Industrials
138
Financials119
Health Care88
Health Care5,222
2016 2015

Top 10 Mergers & Acquisitions
24VCCEdge | COPYRIGHT © 2017 All rights reserved
Deal Value ($ mn)
Inbound
$10,680 Sub-Industry: Integrated Oil & GasAnnounced on: Oct-2016Target: Essar Oil Ltd.Buyer: Rosneft,United Capital Partners Mauritius Ltd.,Trafigura Ltd.
Domestic
$1,195Sub-Industry: Oil & Gas Exploration & ProductionAnnounced on: Dec-2016Target: Gujarat State Petroleum Corporation Ltd., KG-OSN-2001/3 BlockBuyer: Oil and Natural Gas Corporation Ltd.
Domestic
$9,730 Sub-Industry: Life & Health InsuranceAnnounced on: Aug-2016Target: Max Life Insurance Co. Ltd.Buyer: HDFC Standard Life Insurance Co. Ltd.
Domestic
$2,350 Sub-Industry: Construction MaterialsAnnounced on: Feb-2016Target: Jaiprakash Associates Ltd.,Five Cement PlantsBuyer: UltraTech Cement Ltd.
Inbound
$1,990Sub-Industry: MarineAnnounced on: Oct-2016Target: Vadinar Oil Terminal Ltd.Buyer: Rosneft,United Capital Partners Mauritius Ltd.,Trafigura Ltd.
Domestic
$1,400 Sub-Industry: Construction MaterialsAnnounced on: Jul-2016Target: Lafarge India Pvt. Ltd.Buyer: Nirma Ltd.
Domestic
$1,383 Sub-Industry: Electric UtilitiesAnnounced on: Jun-2016Target: Welspun Renewables Energy Pvt. Ltd.Buyer: Tata Power Renewable Energy Ltd.
Inbound
$1,261Sub-Industry: PharmaceuticalsAnnounced on: Jul-2016Target: Gland Pharma Ltd.Buyer: Shanghai Fosun Pharmaceutical Group Co. Ltd.
Outbound
$1,300 Sub-Industry: Oil & Gas Exploration & ProductionAnnounced on: Mar-2016Target: Taas Yuryakh Neftegazodobycha LLCBuyer: Bharat PetroResources Ltd.,Oil India Ltd.,Indian Oil Corporation Ltd.
Domestic
$7,300 Sub-Industry: Wireless Telecommunication ServicesAnnounced on: Sep-2016Target: Reliance Communications Ltd., Wireless Telecom BusinessBuyer: Aircel Ltd.,Dishnet Wireless Ltd.

Maharashtra saw 243 M&A deals being struck, worth $23.9 billion. Compared to 2015, deal value up by 2.9 times while deal volume largely remains unchanged. Substantial increase in the Haryana’s deal value is contributed by acquisition of Max Life Insurance for a total consideration of $9.7 billion
Mumbai recorded the maximum deal activity at 198 deals worth $23.4 billion. Delhi NCR and Bengaluru secured the second and the third spot with 175 and 126 deals respectively with the corresponding investment value of worth $16.3 billion and $2.3 billion, respectively.
Regional Analysis
25VCCEdge | COPYRIGHT © 2017 All rights reserved
Value of Deals ($ mn)2016 Number of Deals Value of Deals ($ mn)2016 Number of Deals
Value of Deals ($ mn)2015 Number of Deals
Top 5 States Top 5 Cities
23,911
2,305
959
2,083
1,137 966
11,837 1,839
16,348
1,035
2,282 660
1,067
Maharashtra Karnataka Delhi Haryana Telangana Mumbai Delhi NCR Bengaluru Hyderabad Chennai
Delhi NCR Mumbai Bengaluru Hyderabad ChennaiMaharashtra Delhi Karnataka Telangana Tamil Nadu
243
240
129 118 61 54
198
175
191
189
112 57 47
126 50 32130 89
66
55
6,188
23,643
4,440
5,604
966 1,028
1,836
Value of Deals ($ mn)2015 Number of Deals

EQUITY CAPITAL MARKET
We did see a dip in private investments in 2016 compared to the previous year.
We, however, stay positive for 2017. There are few IPOs lined up this year so public market is likely to drive some of the activity and set the tone for investments. The investments should be across the early and growth stage situations. The investments will also be driven by how things pan out in the US, the after effects of demonetization and legislation's for some sectors."Amit Varma, Managing Partner, Quadria Capital

Equity Capital Markets – Overview
27VCCEdge | COPYRIGHT © 2017 All rights reserved
2012 2013 2014 2015 2016
quity Capital Market (ECM) deals constituting IPOs, Follow on Offerings, Rights issue, Qualified Institutional
Placements (QIPs) and Institutional Placements increased 19% in 2016 to 117 deals as compared to 98 deals in 2015. However, amount of capital raised dropped by approximately 20% from $6.2 billion to $5 billion. Rights Issues and QIPs saw a five year low at $213.5 million and $656.4 million respectively. There was a single follow-on offering worth $1.5 million. Institutional Placement Programme have been out of favour
E
Number of Deals Value of Deals ($ bn)
Equity Capital Markets
4.1
4.7
6.2 6.2
5.058
74
98 98
117
for the last two years.
This year has been a record year for IPOs, wherein fundraising via IPOs surged to a five-year high with $4.1 billion raised across 93 IPOs when compared to $2.2 billion from 62 IPOs in 2015.
Industrials sector witnessed maximum ECM activity in 2016 with 27 deals, largely in Construction & Engineering, Industrial Machinery & Trading companies & distributors.
Financial sector contributed over 46% to total
capital raised in 2016 standing at $2.3 billion. ICICI Prudential Life Insurance Company Ltd., PNB Housing Finance Ltd., Equitas Holdings Ltd., and RBL Bank Ltd. are the top companies from the financial sector to tap the capital market this year.
Multispecialty hospital chain Narayana Hrudayalaya, oncology chain Healthcare Global Enterprises (HCG), diagnostics chain Thyrocare Technologies and pharmaceuticals company Laurus Labs all tapped into the primary markets in 2016. This not only increased the representation of healthcare companies in the equity markets but also increased the spread of listed healthcare businesses on the bourses thus far dominated by pharmaceuticals companies.
Financial sector contributed over 46% to total capital raised in 2016 standing at $2.3 billion.

Companies raised $4.1 billion across 93 IPOs, $656 million across 14 Qualified Institutional Placement, $213 million across 9 rights issue and $1.5 million in a single Follow-On Offering this year.
Sector Analysis
28VCCEdge | COPYRIGHT © 2017 All rights reserved
Equity Capital Market Breakdown – Number of Deals
Intial Public OfferingFollow-On OfferingRights IssueQualified Institutional PlacementInstitutional Placement Programme
Equity Capital Market Breakdown – Value of Deals ($ mn)
2012 2013 2014 2015 2016Intial Public Offering 1,322 298 296 2,195 4,121Follow-On Offering 268 1,314 83 - 1Rights IssueQualified Institutional Placement
1,450 750 529 555 213 947 1,468 5,212 3,424 656
Institutional Placement Programme 155 864 69 - -TOTAL 4,142 4,695 6,190 6,174 4,993
Equity Capital Market - Sectoral Summary
2012 2013 2014 2015 2016
24
2
1713
2
38
213 9 12
47
1
15
34
1
62
-11
25
-
93
19
14
IndustrialsConsumer DiscretionaryMaterialsFinancialsHealthcareConsumer StaplesInformation TechnologyUtilitiesEnergyTelecommunication ServicesTotal
Number of Deals2723201998641-
117
Value of Deals ($ mn) 542 725
51 2,317
479 366 283 220
9 -
4,993
Number of Deals28181420834-21
98
Value of Deals ($ mn) 1,982
275 146
2,962 592 124
63 -
2 29
6,174
2016 2015

The smaller deals under $10 million accounted for a significant portion of the entire deal activity at 66 per cent followed by 31 per cent deals under $10-$250 million bracket.
Over 70% of the capital raised in the equity market comes from deal sizes in the range $100 - $500 million.
Deal Type Analysis
VCCEdge | COPYRIGHT © 2017 All rights reserved
Transactions by Deal Size Total Investment by Deal Size ($ mn)
Under $10 mn $10 - $50 mn $50 - $100 mn $100 - $250 mn $250 - $500 mn $500 mn+ Under $10 mn $10 - $50 mn $50 - $100 mn $100 - $250 mn $250 - $500 mn $500 mn+
Transactions by Deal Size2012 2013 2014 2015 2016
Under $10 mn$10 - $50 mn$50 - $100 mn$100 - $250 mn$250 - $500 mn$500 mn+
25 39 50 45 7717 15 21 126 7 13 136 10 10 111 1 1 33 2 3 1
2120
723
Total Investment by Deal Size ($ mn) 2012 2013 2014 2015 2016
Under $10 mn$10 - $50 mn$50 - $100 mn$100 - $250 mn$250 - $500 mn$500 mn+
71 81 96 65 138 521 387 557 532 299 474 453 911 1,489 919 858 1,414 1,549 1,251 1,651 363 346 499 798 1,081
1,854 2,015 2,578 2,040 905
29
0% 20% 40% 60% 80% 100%0% 20% 40% 60% 80% 100%
2012
2013
2014
2015
2016
2012
2013
2014
2015
2016

Top 10 ECM / IPOs Closed – 2016
30VCCEdge | COPYRIGHT © 2017 All rights reserved
ECM / IPOs Deals
DATE TARGET OFFERING TYPE OFFERING SIZE ($ MN) SUB-INDUSTRY
23-Sep-16 ICICI Prudential Life Insurance Company Ltd. Initial Public Offering 905 Life & Health Insurance
1-Nov-16 PNB Housing Finance Ltd. Initial Public Offering 446 Thrifts & Mortgage Finance
12-Apr-16 Equitas Holdings Ltd. Initial Public Offering
Qualified Institutional Placement
336 Thrifts & Mortgage Finance
13-Sep-16 Motherson Sumi Systems Ltd. 300 Auto Parts & Equipment
12-Dec-16 Laurus Labs Ltd. Initial Public Offering 199 Pharmaceuticals
14-Jul-16 Larsen and Toubro Infotech Ltd. Initial Public Offering 187 IT Consulting & Other Services
24-Aug-16 RBL Bank Ltd. Initial Public Offering 179 Regional Banks
10-Oct-16 Endurance Technologies Ltd. Initial Public Offering 173 Auto Parts & Equipment
2-Nov-16 Varun Beverages Ltd. Initial Public Offering 165 Food Distributors
25-Jun-16 Mahanagar Gas Ltd. Initial Public Offering 157 Gas Utilities

GLOSSARY
31VCCEdge | COPYRIGHT © 2017 All rights reserved
PlacementsPlacement deals include QIPs, Open Market & Private Investment in Public Equity (PIPE deals).
Big-ticket DealsBig-ticket deals refers to the deal with an investment size of $100 million and above.
MaterialsMaterial sector covers chemicals used in different segments, construction materials, containers & packaging, metals & mining, and paper & forest products.
Consumer DiscretionaryConsumer Discretionary sector includes automobiles & components, consumer durables & apparel, consumer services, media, and retailing.
Consumer StaplesConsumer Staples sector contains food & staples retailing, food, beverage & tobacco, and household & personal products.
HealthcareHealthcare incorporates healthcare equipment & services, and pharmaceuticals, biotechnology & life sciences.
FinancialsFinancial sector includes banks, diversified financials, insurance, and real estate.
Information Technology (IT)IT comprises software & services, technology hardware & equipment, and semiconductors & semiconductor Equipment.
Telecommunication ServicesIt includes both diversified and wireless telecommuni-cation services.
UtilitiesUtility encompasses electric, gas, water & multi-utili-ties and independent power producers & energy traders as well.
IndustrialsIndustrial sector contains all the capital goods, Commercial & Professional Services, and Transporta-tion (air freight & logistics, airlines, marines, road & rail, infrastructure).
Energy Energy sector consists of energy equipment & services, and oil, gas & consumable fuels.


MUMBAI: Dow Jones & Co. Unit 93, 9th Floor. 2 North Ave., Maker Maxity, Bandra Kurla Complex, Bandra (East) - 400051, India | Phone: 022-61456100
MOSAIC MEDIA VENTURES PVT. LTD. A-83, Sector 2, Noida, UP - 201301 Phone: 0120-4171111
VCCEdgeVCCEdge is an online financial research platform of the VCCircle Network, owned by the global diversified media, news, education and information services company - News Corp. VCCEdge offers information on private equity, venture capital transactions and mergers and acquisitions, including deal terms, structures, deal amounts and valuations. It also contains entity information on all companies involved in the transactions including target companies, investors and advisors.
VCCircle NetworkThe VCCircle Network runs financial news website VCCircle.com, a startup news site Techcircle.in, and the financial data platform VCCEdge. The network also conducts India’s leading investment focused conferences and runs an executive training business for corpo-rate, legal and finance professionals
About News CorpNews Corporation (NASDAQ: NWS, NWSA; ASX: NWS, NWSLV) is a global, diversified media and information services company focused on creating and distributing authoritative and engaging content to consumers throughout the world. The company comprises businesses across a range of media, including: news and information services, book publishing, digital real estate services, cable network program-ming and pay-tv distribution.