Embed Size (px)
Citation preview
California Department of Corrections and Rehabilitation
2017 Outcome Evaluation Report
An Examination of Offenders Released in Fiscal Year 2012‐13
Office of Research October 2017
2017 Outcome Evaluation Report
You can obtain reports by contacting the Department of Corrections and Rehabilitation at the following address:
California Department of Corrections and Rehabilitation
Division of Internal Oversight and Research
Office of Research
1515 S Street, Suite 221N
Sacramento, California 95811
Or
On the internet at:
http://www.cdcr.ca.gov/adult_research_branch/
CDCR Office of Research
"Providing quality research, data analysis and evaluation to implement
evidence‐based programs and practices, strengthen policy, inform
management decisions and ensure accountability."
Scott Kernan, Secretary
Kenneth Pogue, Undersecretary
Bryan Beyer, Director
Julie Basco, Deputy Director
Chris Chambers, Associate Director
Loran Sheley, Chief
Produced by:
Kevin Grassel, Systems Software Specialist III
Kendra Jensen, Research Program Specialist II
Andreana Yribe, Research Analyst II
Christopher Nguyen, Assistant Information Systems Analyst
This report would not have been possible without the generous support of others. Specifically, we would like to thank Shelley Butler
from the Office of Research for providing data quality assurance.
i
2017 Outcome Evaluation Report
Table of Contents
1 Introduction ...................................................................................................................................... 1
2 Evaluation Design .............................................................................................................................. 5
Definitions ......................................................................................................................................... 5
Methods ............................................................................................................................................ 5
Data Sources ...................................................................................................................................... 6
Data Limitations ................................................................................................................................ 6
Impacts of Proposition 47 and Reporting Limitations ...................................................................... 6
3 Description of the Fiscal Year 2012‐13 Release Cohort .................................................................... 8
Offender Demographics .................................................................................................................... 9
Offender Characteristics ................................................................................................................. 11
4 Three‐Year Conviction Rate ............................................................................................................ 15
Three‐Year Conviction Rate for CDCR Offenders Released in Fiscal Year 2012‐13 and the Impact of
Realignment .................................................................................................................................... 15
Time to Conviction .......................................................................................................................... 18
5 Offender Outcomes and Type of Conviction ................................................................................... 20
Three‐Year Outcomes for the Fiscal Year 2012‐13 Release Cohort ................................................ 20
Type of Conviction for the Fiscal Year 2012‐13 Offenders Convicted Following Release from
Prison ............................................................................................................................................... 22
6 Conviction Rates by Offender Demographics and Characteristics .................................................. 24
Conviction Rates by Offender Demographics ................................................................................. 24
6.1.1 Gender ..................................................................................................................................... 24
6.1.2 Age at Release ......................................................................................................................... 26
6.1.3 Race/Ethnicity ......................................................................................................................... 28
6.1.4 County of Release .................................................................................................................... 30
Conviction Rates by Offender Characteristics ................................................................................. 32
6.2.1 Commitment Offense Category .............................................................................................. 32
6.2.2 Commitment Offense .............................................................................................................. 34
6.2.3 Sentence Type ......................................................................................................................... 37
6.2.4 Sex Registrants ........................................................................................................................ 39
6.2.5 Type of Conviction for Sex Registrants .................................................................................... 41
ii
2017 Outcome Evaluation Report
6.2.6 Serious and Violent Offenses .................................................................................................. 42
6.2.7 Mental Health Designation ..................................................................................................... 44
6.2.8 Risk of Conviction .................................................................................................................... 46
6.2.9 Length of Stay .......................................................................................................................... 48
6.2.10 Total Number of CDCR Stays ................................................................................................... 50
6.2.11 In‐Prison and Community‐Based Substance Use Disorder Treatment ................................... 52
6.2.12 Conviction Rates by Substance Use Disorder Treatment Participation for Offenders with an
Identified Treatment Need ...................................................................................................... 54
Appendix A .................................................................................................................................................. 56
Conviction Rates by Fiscal Year and Offender Demographics and Characteristics................................. 56
Appendix B .................................................................................................................................................. 59
Conviction Rates by County of Release ................................................................................................... 59
Appendix C .................................................................................................................................................. 62
Primary and Supplemental Recidivism Rates: Arrests, Convictions, and Returns to Prison ................... 62
Appendix D .................................................................................................................................................. 68
Type of Arrest .......................................................................................................................................... 68
Appendix E .................................................................................................................................................. 70
Type of Return to Prison ......................................................................................................................... 70
Appendix F .................................................................................................................................................. 73
Definitions of Key Terms ......................................................................................................................... 73
i
2017 Outcome Evaluation Report
List of Tables and Figures
Tables
Table 1. Demographics of Offenders Released in Fiscal Year 2012‐13 ....................................................... 10
Table 2. Characteristics of Offenders Released in Fiscal Year 2012‐13 ...................................................... 13
Table 3. Conviction Rates for the Fiscal Year 2012‐13 Release Cohort by Type of Release ....................... 17
Table 4. Three‐Year Quarterly and Cumulative Rate of Conviction for the 16,496 Offenders Convicted
During the Three‐Year Follow‐Up Period .................................................................................... 19
Table 5. Three‐Year Outcomes for the Fiscal Year 2011‐12 and Fiscal Year 2012‐13 Release Cohorts ..... 21
Table 6. Type of Conviction for the Fiscal Year 2011‐12 and Fiscal Year 2012‐13 Offenders Convicted
Following Release from Prison .................................................................................................... 23
Table 7. Conviction Rates by Gender .......................................................................................................... 25
Table 8. Conviction Rates by Age at Release .............................................................................................. 27
Table 9. Conviction Rates by Race/Ethnicity ............................................................................................... 29
Table 10. Conviction Rates by County of Release ....................................................................................... 31
Table 11. Conviction Rates by Commitment Offense Category .................................................................. 33
Table 12. Conviction Rates by Commitment Offense ................................................................................. 36
Table 13. Conviction Rates by Sentence Type ............................................................................................ 38
Table 14. Number and Type of Conviction for Offenders Released by the Board of Parole Hearings and
Other Releases ............................................................................................................................. 38
Table 15. Conviction Rates by Sex Registration Status ............................................................................... 40
Table 16. Type of Conviction for Sex Registrants ........................................................................................ 41
Table 17. Conviction Rates for Offenders with a Serious or Violent Offense ............................................. 43
Table 18. Conviction Rates by Mental Health Designation ......................................................................... 45
Table 19. Conviction Rates by Risk of Conviction ....................................................................................... 47
Table 20. Conviction Rates by Length of Stay ............................................................................................. 49
Table 21. Conviction Rates by Total Number of CDCR Stays ...................................................................... 51
Table 22. Conviction Rates by Substance Use Disorder Treatment Participation ...................................... 53
Table 23. Conviction Rates by Substance Use Disorder Treatment Participation and Substance Abuse
Treatment Need .......................................................................................................................... 55
ii
2017 Outcome Evaluation Report
Figures
Figure 1. Three‐Year Conviction, Return‐to‐Prison, and Arrest Rates for Offenders Released in Fiscal Year
2002‐03 through Fiscal Year 2012‐13 ............................................................................................ 2
Figure 2. Three‐Year Outcomes for Offenders Released from State Prison in Fiscal Year 2012‐13 ............. 3
Figure 3. Number of Offenders in the Fiscal Year 2002‐03 through Fiscal Year 2012‐13 Release Cohorts .. 8
Figure 4. Conviction Rates for the Fiscal Year 2012‐13 Release Cohort by Type of Release ...................... 15
Figure 5. Three‐Year Quarterly and Cumulative Rate of Conviction for the 16,496 Offenders Convicted
During the Three‐Year Follow‐Up Period .................................................................................... 18
Figure 6. Three‐Year Outcomes for the Fiscal Year 2012‐13 Release Cohort ............................................. 20
Figure 7. Type of Conviction for the Fiscal Year 2012‐13 Offenders Convicted Following Release from
Prison ........................................................................................................................................... 22
Figure 8. Conviction Rates by Gender ......................................................................................................... 24
Figure 9. Three‐Year Conviction Rate by Age at Release ............................................................................ 26
Figure 10. Three‐Year Conviction Rate by Race/Ethnicity .......................................................................... 28
Figure 11. Three‐Year Conviction Rate by County of Release .................................................................... 30
Figure 12. Conviction Rates by Commitment Offense Category ................................................................ 32
Figure 13. Three‐Year Conviction Rate by Commitment Offense ............................................................... 34
Figure 14. Conviction Rates by Sentence Type ........................................................................................... 37
Figure 15. Conviction Rates by Sex Registration Status .............................................................................. 39
Figure 16. Type of Conviction for Sex Registrants ...................................................................................... 41
Figure 17. Conviction Rates for Offenders with a Serious or Violent Offense ............................................ 42
Figure 18. Conviction Rates by Mental Health Designation ....................................................................... 44
Figure 19. Conviction Rates by Risk of Conviction ...................................................................................... 46
Figure 20. Three‐Year Conviction Rate by Length of Stay ........................................................................... 48
Figure 21. Three‐Year Conviction Rate by Total Number of CDCR Stays .................................................... 50
Figure 22. Three‐Year Conviction Rate by Substance Use Disorder Treatment Participation .................... 52
Figure 23. Three‐Year Conviction Rate by Substance Use Disorder Treatment Participation and Substance
Abuse Treatment Need ............................................................................................................... 54
i
2017 Outcome Evaluation Report
Executive Summary
The California Department of Corrections and Rehabilitation (CDCR) presents the 2017 Outcome
Evaluation Report, part of an annual series, which examines recidivism outcomes (arrests, convictions,
and returns to prison) for offenders released from CDCR adult institutions during a given fiscal year. The
most recent cohort of offenders was released during Fiscal Year 2012‐13 and tracked for three years.
Historical information is also provided for the Fiscal Year 2002‐03 through Fiscal Year 2011‐12 release
cohorts.
Outcomes for Offenders Released During Fiscal Year 2012‐13
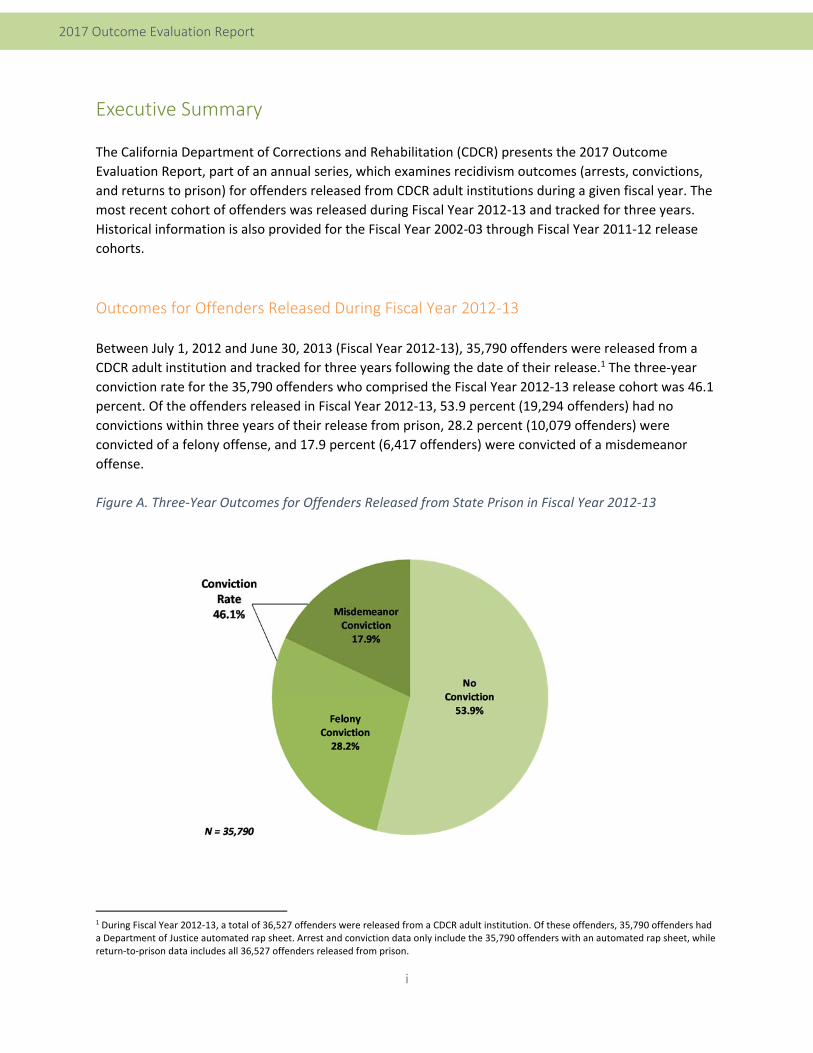
Between July 1, 2012 and June 30, 2013 (Fiscal Year 2012‐13), 35,790 offenders were released from a
CDCR adult institution and tracked for three years following the date of their release.1 The three‐year
conviction rate for the 35,790 offenders who comprised the Fiscal Year 2012‐13 release cohort was 46.1
percent. Of the offenders released in Fiscal Year 2012‐13, 53.9 percent (19,294 offenders) had no
convictions within three years of their release from prison, 28.2 percent (10,079 offenders) were
convicted of a felony offense, and 17.9 percent (6,417 offenders) were convicted of a misdemeanor
offense.
Figure A. Three‐Year Outcomes for Offenders Released from State Prison in Fiscal Year 2012‐13
1 During Fiscal Year 2012‐13, a total of 36,527 offenders were released from a CDCR adult institution. Of these offenders, 35,790 offenders had a Department of Justice automated rap sheet. Arrest and conviction data only include the 35,790 offenders with an automated rap sheet, while return‐to‐prison data includes all 36,527 offenders released from prison.
ii
2017 Outcome Evaluation Report
California’s Public Safety Realignment Act (Realignment), which was implemented in October 2011,
fundamentally changed the state’s post‐release supervision structure. Realignment established Post‐
Release Community Supervision (PRCS) and placed most non‐serious, non‐violent, and non‐sex
registrant offenders under county supervision; whereas serious or violent offenders, high‐risk sex
offenders, and offenders released after serving a life term were released to CDCR parole supervision.2 Of
the 35,790 offenders released in Fiscal Year 2012‐13, 56.5 percent (20,208 offenders) were released to
Post‐Release Community Supervision (PRCS), 41.8 percent (14,951 offenders) were released to parole,
and 1.8 percent (631 offenders) were directly discharged.
Offenders committed to CDCR for property crimes and drug crimes, which tend to be less serious and
less violent and allow for release to PRCS, are characterized by a higher risk to reoffend and higher
recidivism rates than offenders committed for more serious and violent crimes, who continue to be
released to parole.3 Further, younger offenders who are more likely to commit non‐serious and non‐
violent property and drug crimes are characterized by some of the highest recidivism rates among all
offenders, which was an additional factor potentially influencing the conviction rate of PRCS offenders
upward.4 Offenders characterized by lower recidivism rates and a lower risk to reoffend (offenders
committing serious and violent crimes and serving longer terms) continued to be released to parole
thereby influencing the three‐year conviction rate of parolees downward. Post‐Realignment, the three‐
year conviction rate of parolees (38.8 percent) is less than the overall conviction rate (46.1 percent)
because many of the offenders at the highest risk to reoffend are released to PRCS, while offenders with
less risk to reoffend are released to parole.
Direct comparisons between offenders released to PRCS and parole should not be made, as the two
groups represent substantially different groups of offenders. Rather, the rate for PRCS offenders (52.2
percent) should be used as a baseline and compared to rates for PRCS offenders provided in future
Outcome Evaluation Reports and the three‐year conviction rate for parolees (38.8 percent) should be
compared to future rates for parolees. The overall conviction rate (46.1 percent) provides the most
comprehensive picture of reoffending among all offenders released from CDCR institutions into the
community.
Recidivism Trends
Commencing with the 2016 Outcome Evaluation Report and the Fiscal Year 2011‐12 release cohort,
CDCR transitioned its primary measure of recidivism from the three‐year return‐to‐prison rate to the
three‐year conviction rate to better coincide with the state‐wide definition of recidivism and to provide
a more meaningful measure of reoffending behavior for CDCR offenders following the implementation
of Realignment.5 Figure B shows the primary measure of recidivism, the three‐year conviction rate, and
2 Prior to Realignment, all post‐prison release supervision was carried out by CDCR parole. 3 For more information regarding conviction rates by commitment offense category, serious and violent offenses, and risk scores, please see the following sections: 6.2.1 Commitment Offense Category, 6.2.6 Serious and Violent Offenses, and 6.2.8 Risk of Conviction. 4 For more information regarding conviction rates by age at release, please see 6.1.2 Age at Release. 5 Section 3027 of California Penal Code required the Board of State and Community Corrections (BSCC) to develop a state‐wide definition of recidivism. For more information regarding BSCC’s definition, please see Section 2.1 Definitions of this report.
iii
2017 Outcome Evaluation Report
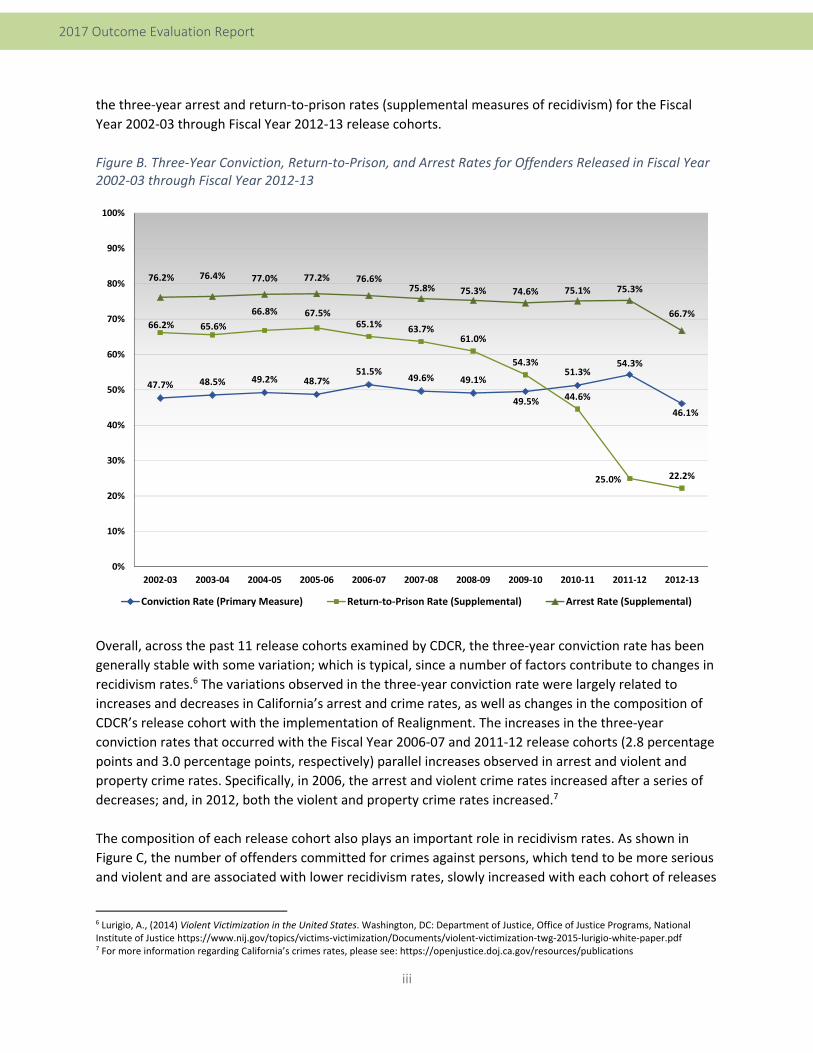
the three‐year arrest and return‐to‐prison rates (supplemental measures of recidivism) for the Fiscal
Year 2002‐03 through Fiscal Year 2012‐13 release cohorts.
Figure B. Three‐Year Conviction, Return‐to‐Prison, and Arrest Rates for Offenders Released in Fiscal Year 2002‐03 through Fiscal Year 2012‐13
Overall, across the past 11 release cohorts examined by CDCR, the three‐year conviction rate has been
generally stable with some variation; which is typical, since a number of factors contribute to changes in
recidivism rates.6 The variations observed in the three‐year conviction rate were largely related to
increases and decreases in California’s arrest and crime rates, as well as changes in the composition of
CDCR’s release cohort with the implementation of Realignment. The increases in the three‐year
conviction rates that occurred with the Fiscal Year 2006‐07 and 2011‐12 release cohorts (2.8 percentage
points and 3.0 percentage points, respectively) parallel increases observed in arrest and violent and
property crime rates. Specifically, in 2006, the arrest and violent crime rates increased after a series of
decreases; and, in 2012, both the violent and property crime rates increased.7
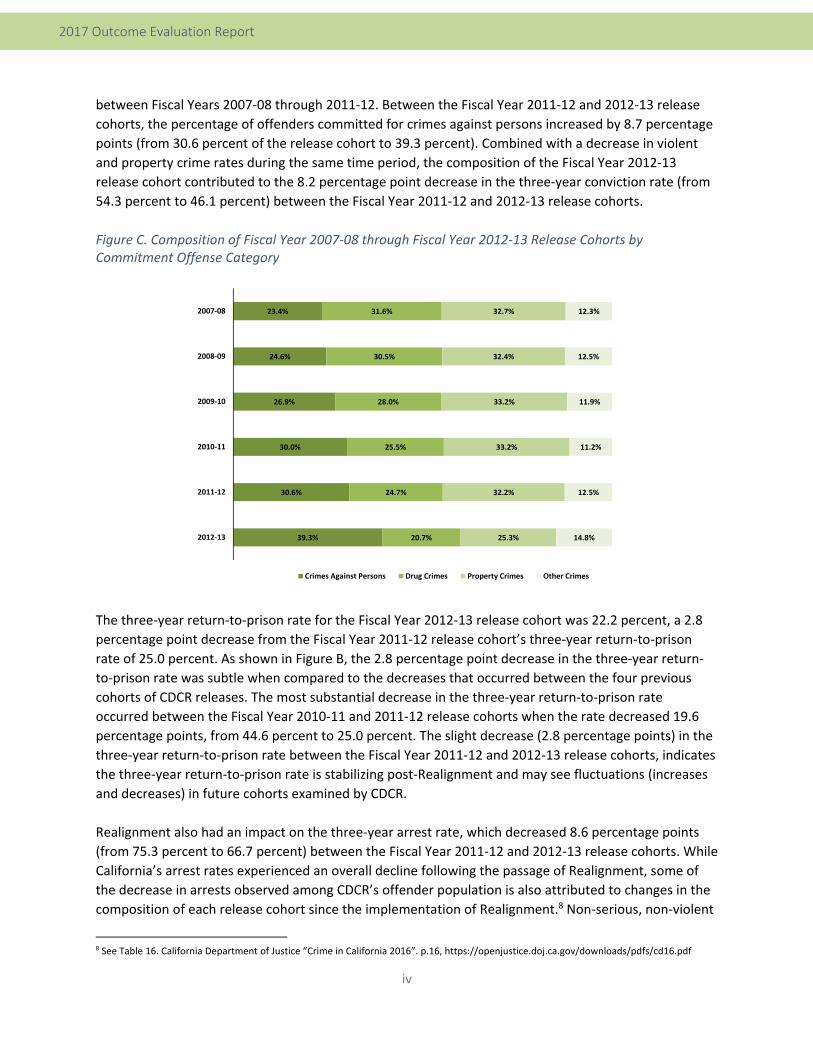
The composition of each release cohort also plays an important role in recidivism rates. As shown in
Figure C, the number of offenders committed for crimes against persons, which tend to be more serious
and violent and are associated with lower recidivism rates, slowly increased with each cohort of releases
6 Lurigio, A., (2014) Violent Victimization in the United States. Washington, DC: Department of Justice, Office of Justice Programs, National Institute of Justice https://www.nij.gov/topics/victims‐victimization/Documents/violent‐victimization‐twg‐2015‐lurigio‐white‐paper.pdf 7 For more information regarding California’s crimes rates, please see: https://openjustice.doj.ca.gov/resources/publications
47.7% 48.5% 49.2% 48.7%51.5%
49.6% 49.1%
49.5%
51.3%54.3%
46.1%
66.2% 65.6%
66.8% 67.5%65.1% 63.7%
61.0%
54.3%
44.6%
25.0% 22.2%
76.2% 76.4% 77.0% 77.2% 76.6%75.8% 75.3% 74.6% 75.1% 75.3%
66.7%
0%
10%
20%
30%
40%
50%
60%
70%
80%
90%
100%
2002‐03 2003‐04 2004‐05 2005‐06 2006‐07 2007‐08 2008‐09 2009‐10 2010‐11 2011‐12 2012‐13
Conviction Rate (Primary Measure) Return‐to‐Prison Rate (Supplemental) Arrest Rate (Supplemental)
iv
2017 Outcome Evaluation Report
between Fiscal Years 2007‐08 through 2011‐12. Between the Fiscal Year 2011‐12 and 2012‐13 release
cohorts, the percentage of offenders committed for crimes against persons increased by 8.7 percentage
points (from 30.6 percent of the release cohort to 39.3 percent). Combined with a decrease in violent
and property crime rates during the same time period, the composition of the Fiscal Year 2012‐13
release cohort contributed to the 8.2 percentage point decrease in the three‐year conviction rate (from
54.3 percent to 46.1 percent) between the Fiscal Year 2011‐12 and 2012‐13 release cohorts.
Figure C. Composition of Fiscal Year 2007‐08 through Fiscal Year 2012‐13 Release Cohorts by Commitment Offense Category
The three‐year return‐to‐prison rate for the Fiscal Year 2012‐13 release cohort was 22.2 percent, a 2.8
percentage point decrease from the Fiscal Year 2011‐12 release cohort’s three‐year return‐to‐prison
rate of 25.0 percent. As shown in Figure B, the 2.8 percentage point decrease in the three‐year return‐
to‐prison rate was subtle when compared to the decreases that occurred between the four previous
cohorts of CDCR releases. The most substantial decrease in the three‐year return‐to‐prison rate
occurred between the Fiscal Year 2010‐11 and 2011‐12 release cohorts when the rate decreased 19.6
percentage points, from 44.6 percent to 25.0 percent. The slight decrease (2.8 percentage points) in the
three‐year return‐to‐prison rate between the Fiscal Year 2011‐12 and 2012‐13 release cohorts, indicates
the three‐year return‐to‐prison rate is stabilizing post‐Realignment and may see fluctuations (increases
and decreases) in future cohorts examined by CDCR.
Realignment also had an impact on the three‐year arrest rate, which decreased 8.6 percentage points
(from 75.3 percent to 66.7 percent) between the Fiscal Year 2011‐12 and 2012‐13 release cohorts. While
California’s arrest rates experienced an overall decline following the passage of Realignment, some of
the decrease in arrests observed among CDCR’s offender population is also attributed to changes in the
composition of each release cohort since the implementation of Realignment.8 Non‐serious, non‐violent
8 See Table 16. California Department of Justice “Crime in California 2016”. p.16, https://openjustice.doj.ca.gov/downloads/pdfs/cd16.pdf
39.3%
30.6%
30.0%
26.9%
24.6%
23.4%
20.7%
24.7%
25.5%
28.0%
30.5%
31.6%
25.3%
32.2%
33.2%
33.2%
32.4%
32.7%
14.8%
12.5%
11.2%
11.9%
12.5%
12.3%
2012‐13
2011‐12
2010‐11
2009‐10
2008‐09
2007‐08
Crimes Against Persons Drug Crimes Property Crimes Other Crimes
v
2017 Outcome Evaluation Report
property and drug offenders, who are more likely to recidivate than serious and violent offenders, now
comprise smaller portions of each release cohort, thereby influencing arrest, conviction, and return‐to‐
prison rates downward.
Pre‐ and Post‐Realignment Comparisons
The Fiscal Year 2007‐08 release cohort represented the last group of offenders released by CDCR in
which their release (July 1, 2007 through June 30, 2008) and three‐year follow‐up (ending June 30, 2011)
periods occurred prior to the implementation of Realignment. In contrast, Realignment was operational
for varying amounts of time during the Fiscal Year 2008‐09 through 2011‐12 release cohorts’ release and
three‐year follow‐up periods. The current Fiscal Year 2012‐13 release cohort marks the first group of
offenders released by CDCR in which their release (July 1, 2012 through June 30, 2013) and three‐year
follow‐up (ending June 30, 2016) periods occurred after the implementation of Realignment, allowing
CDCR to more thoroughly examine Realignment’s impact on the three‐year return‐to‐prison rate.
The pre‐Realignment Fiscal Year 2007‐08 release cohort’s three‐year return‐to‐prison rate was 63.7
percent, 41.5 percentage points higher than the post‐Realignment Fiscal Year 2012‐13 release cohort’s
rate of 22.2 percent. Much of the decrease observed in the three‐year return‐to‐prison rate has been
attributed to a decrease in parole violations. Under Realignment, most parole revocations are served in
county jail rather than state prison.9 Among the offenders released in Fiscal Year 2007‐08, nearly half
(44.0 percent or 51,503 offenders) were returned for parole violations, while eight offenders, all of
whom were released after serving a life term, were returned to prison for parole violations in the post‐
Realignment Fiscal Year 2012‐13 release cohort. Appendix E provides the type of return to prison (e.g.
for parole violations, property crimes, crimes against persons), allowing for an analysis of Realignment’s
impact on parole violations and the types of crimes committed by CDCR offenders post‐release that
resulted in a return to CDCR.
While decreases in returns to prison for parole violations heavily influenced the three‐year return‐to‐
prison rate, the three‐year conviction rate has never included parole violations and was not impacted by
Realignment’s changes to the parole revocation process. Further, Realignment did not impact which
crimes were eligible for felony sentences, only where sentences were served. As fewer offenders were
eligible to serve sentences for new crimes or parole violations in prison, the three‐year return‐to‐prison
rate trended downward, while the three‐year conviction rate remained stable with small fluctuations.
Although Realignment has not extensively influenced the three‐year conviction rate, it had a
considerable effect on the size of each release cohort. Consistent with decreases to CDCR’s offender
population, largely due to Realignment, the size of each release cohort has decreased considerably with
the implementation of Realignment.10 As shown in Section 3 of this report, 116,015 offenders belonged
9 With the exception of offenders previously sentenced to a life term (lifers) and some sex offenders. Penal Code section 3000.8 remands persons on parole pursuant to section 3000.0, subdivision (b), paragraph (4) to the custody of CDCR. For more information regarding specific sex offenses, please see: Penal Code section 3000.0(b)(4). 10 See CDCR’s Population Projections publications for extensive analysis regarding Realignment and other court‐ordered population reduction measures on CDCR’s offender population: http://www.cdcr.ca.gov/Reports_Research/Offender_Information_Services_Branch/Population_Reports.html
vi
2017 Outcome Evaluation Report
to the pre‐Realignment Fiscal Year 2007‐08 release cohort, while 35,790 offenders belonged to the post‐
Realignment Fiscal Year 2012‐13 release cohort, a difference of 80,225 offenders. More offenders in the
pre‐Realignment release cohort were returned to prison for parole violations following their release
(51,503 offenders) than comprised the entire post‐Realignment release cohort (35,790 offenders).
CDCR will continue to monitor changes to the size of each cohort and expects the number of releases to
fluctuate (increase and decrease) with future cohorts as policies impacting the offender population are
modified and implemented, including Proposition 47, which was passed in November 2014 and reduced
penalties for certain non‐serious and non‐violent property and drug crimes by mandating a
misdemeanor sentence instead of a felony.11 While Proposition 47 was only in effect for part of the
Fiscal Year 2012‐13 release cohort’s three‐year follow‐up period, the policy is expected to have an
impact on future release cohorts and in particular, the number of felony and misdemeanor convictions
for property crimes and drug/alcohol crimes.
In addition to analyzing Realignment’s impact on the three‐year conviction and return‐to‐prison rate,
this report examines the conviction rate by demographics (e.g. age, gender) and characteristics (e.g.
commitment offense category, sentence type) for the 35,790 offenders released in Fiscal Year 2012‐13,
allowing CDCR to observe changes in the composition of each release cohort since the implementation
of Realignment. Among the offenders released in CDCR’s last pre‐Realignment cohort (Fiscal Year 2007‐
08), 32.7 percent were committed for property crimes, 31.6 for drug crimes, 23.4 percent for crimes
against persons, and 12.3 percent for other crimes. As shown in Figure C above, these numbers have
changed considerably since the implementation of Realignment with 39.3 percent of the Fiscal Year
2012‐13 release cohort committed for crimes against persons, 25.3 percent for property crimes, 20.7 for
drug crimes, and 14.8 percent for other crimes. While the number of offenders committed for crimes
against persons, which tend to be more serious and violent, has grown since the implementation of
Realignment, these offenders also had lower three‐year conviction rates (38.7 percent) than offenders
committing property and drug crimes with three‐year conviction rates of 54.7 percent and 46.8 percent,
respectively, influencing the overall conviction rate of 46.1 percent downward.12
Three‐year conviction rates by offender demographics and characteristics for the Fiscal Year 2011‐12
and 2012‐13 release cohorts are presented in Appendix A to allow for comparisons and three‐year
conviction rates by county of release are presented in Appendix B. Consistent with previous reports,
one‐, two‐, and three‐year arrest, conviction and return‐to‐prison rates are provided in Appendix C of
this report and type of arrest and return data are provided in Appendix D and E. CDCR will continue to
update arrest, conviction, and return‐to‐prison data as they become available with the goal of spurring
discussion around the best possible ways to reduce recidivism among offenders released from CDCR
adult institutions.
11 The Safe Neighborhoods and Schools Act full text version: https://oag.ca.gov/system/files/initiatives/pdfs/130060%20(130060%20(Neighborhood%20and%20School%20Funding)).pdf 12 For more information regarding commitment offense categories, please see Section 6.2.1 Commitment Offense Category.
vii
2017 Outcome Evaluation Report
Key Findings
Three‐Year Conviction Rate
Between July 1, 2012 and June 30, 2013 (Fiscal Year 2012‐13), 35,790 offenders were released from
California’s state prisons. Of those offenders, 16,496 were convicted of a felony or misdemeanor
within three years of their release for a three‐year conviction rate of 46.1 percent.
Of the 35,790 offenders released in Fiscal Year 2012‐13, 53.9 percent (19,294 offenders) had no
convictions within three years of their release, 28.2 percent (10,079 offenders) were convicted of a
felony offense, and 17.9 percent (6,417 offenders) were convicted of a misdemeanor offense.
The Fiscal Year 2012‐13 release cohort’s three‐year conviction rate of 46.1 percent was 8.2
percentage points lower than the Fiscal Year 2011‐12 release cohort’s rate of 54.3 percent.
The Fiscal Year 2012‐13 release cohort represented the first cohort of offenders whose release from
prison (July 1, 2012 through June 30, 2013) and full three‐year follow‐up (ending June 30, 2016)
periods occurred after the implementation of Realignment.
Of the 35,790 offenders released in Fiscal Year 2012‐13, 56.5 percent (20,208 offenders) were
released to Post‐Release Community Supervision (PRCS), 41.8 percent (14,951 offenders) were
released to parole, and 1.8 percent (631 offenders) were directly discharged.
Type of Conviction
Of the 16,496 offenders who were convicted during the three‐year follow‐up period, 61.1 percent
(10,079 offenders) were convicted of felony offenses and 38.9 percent (6,417 offenders) were
convicted of misdemeanor offenses.
Offenders convicted of felony drug/alcohol offenses represented 21.4 percent (3,536 offenders) of
those convicted, followed by felony property crimes (15.6 percent or 2,577 offenders), and felony
crimes against persons (13.5 percent or 2,235 offenders). Other felony crimes represented 10.5
percent (1,731 offenders) of the total convictions.
Offenders convicted of misdemeanor drug/alcohol crimes represented 13.7 percent (2,264
offenders) of those convicted, followed by misdemeanor crimes against persons (10.2 percent or
1,686 offenders), and misdemeanor property crimes (7.8 percent or 1,289 offenders). Other
misdemeanor crimes represented 7.1 percent (1,178 offenders) of the total convictions.
viii
2017 Outcome Evaluation Report
Outcomes by Offender Demographics
Male offenders comprised over 90 percent of the release cohort (92.6 percent or 33,137 offenders)
and their three‐year conviction rate (46.8 percent) was 9.2 percentage points higher than the rate of
female offenders (37.6 percent), who comprised 7.4 percent (2,653 offenders) of the release cohort.
Younger offenders had higher three‐year conviction rates than older offenders. Offenders ages 18 –
19 had the highest three‐year conviction rate (62.4 percent or 242 offenders) of any age group and
were followed by offenders ages 20 – 24 with a three‐year conviction rate of 57.6 percent (2,967
offenders). Offenders ages 60 and over had the lowest three‐year conviction rate (20.0 percent or
189 offenders) among all age groups.
Outcomes by Offender Characteristics
Offenders committed for property crimes (25.3 percent of the release cohort or 9,037 offenders)
had the highest three‐year conviction rate (54.7 percent or 4,947 offenders) of any commitment
offense category, while offenders committed for crimes against persons (39.3 percent of the release
cohort or 14,071 offenders) had the lowest conviction rate (38.7 percent or 5,444 offenders) of any
commitment offense category. Offenders committed for drug crimes (20.7 percent of the release
cohort or 7,395 offenders) had a three‐year conviction rate of 46.8 percent.
The majority of offenders in the release cohort (98.6 percent or 35,298 offenders) were sentenced
to a determinate term. Offenders sentenced to an indeterminate term comprised just over one
percent of the release cohort (1.4 percent or 492 offenders) and had a substantially lower three‐
year conviction rate (4.1 percent or 20 offenders) than offenders serving a determinate sentence
(46.7 percent or 16,476 offenders).
Of the 478 offenders released by the Board of Parole Hearings, 4.2 percent (20 offenders) were
convicted of a new crime during the three‐year follow‐up period. Of the 14 offenders released by
other means (e.g. court order), none were convicted of a new crime during the three‐year follow‐up
period.
Offenders who were committed for non‐serious and non‐violent offenses (61.0 percent of the
release cohort or 21,821 offenders) had a three‐year conviction rate of 51.1 percent. Offenders
committed for a serious offense (20.5 percent of the release cohort or 7,343 offenders) had a three‐
year conviction rate of 46.6 percent, and offenders committed for a violent offense (18.5 percent of
the release cohort or 6,626 offenders) had a three‐year conviction rate of 29.1 percent.
Offenders with a California Static Risk Assessment score of high (44.5 percent of the release cohort
or 15,931 offenders) had a higher three‐year conviction rate (62.4 percent) than offenders with a
score of moderate (29.5 percent of the release cohort or 10,561 offenders) with a rate of 43.8
percent, and offenders with a score of low (26.0 percent of the release cohort or 9,296 offenders)
with a rate of 20.7 percent.
ix
2017 Outcome Evaluation Report
Most offenders in the release cohort (81.3 percent or 29,093 offenders) did not have a mental
health designation at release and had a three‐year conviction rate of 45.0 percent. Offenders
assigned to the Enhanced Outpatient Program (2.6 percent of the release cohort or 914 offenders)
had a three‐year conviction rate of 51.8 percent, and offenders assigned to the Correctional Clinical
Case Management System (16.0 percent of the release cohort or 5,728 offenders) had a three‐year
conviction rate of 50.9 percent.
Offenders who received in‐prison Substance Use Disorder Treatment (SUDT) and completed
aftercare (339 offenders) had a lower three‐year conviction rate (29.2 percent) than offenders
associated with any other combination of in‐prison SUDT or aftercare (e.g. offenders who received
in‐prison SUDT and received some or no aftercare).
1
2017 Outcome Evaluation Report
California Department of Corrections and Rehabilitation 2017 Outcome Evaluation Report
1 Introduction
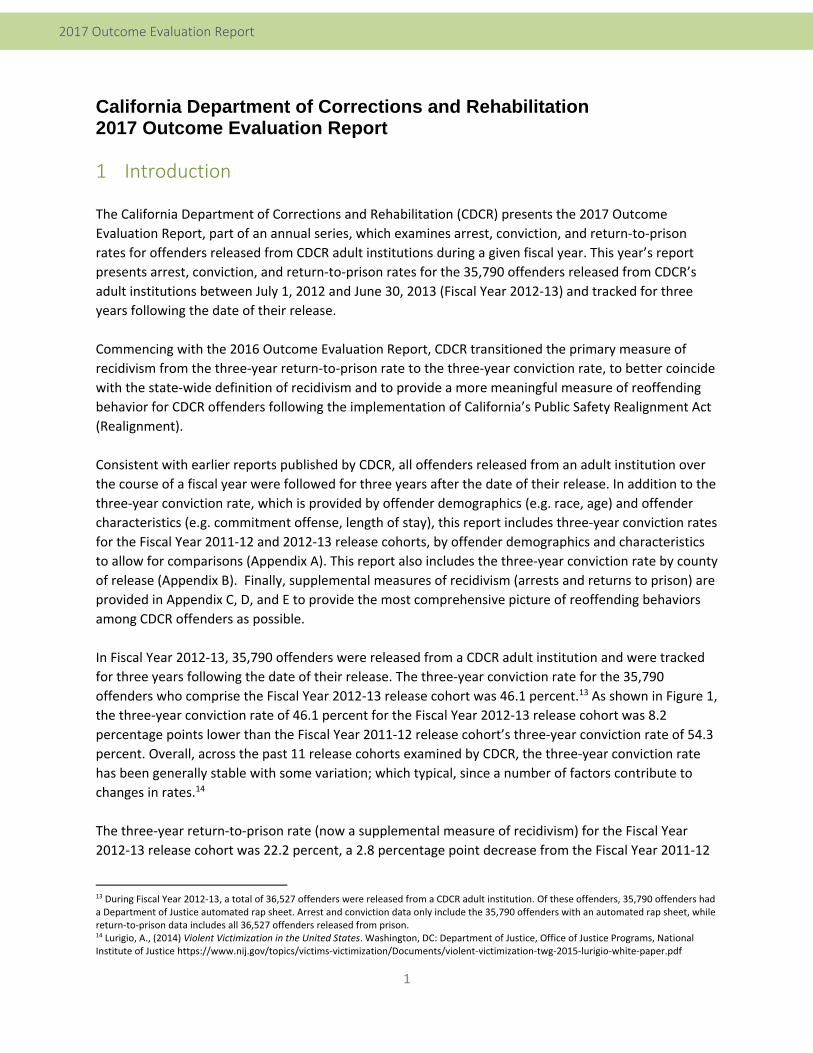
The California Department of Corrections and Rehabilitation (CDCR) presents the 2017 Outcome
Evaluation Report, part of an annual series, which examines arrest, conviction, and return‐to‐prison
rates for offenders released from CDCR adult institutions during a given fiscal year. This year’s report
presents arrest, conviction, and return‐to‐prison rates for the 35,790 offenders released from CDCR’s
adult institutions between July 1, 2012 and June 30, 2013 (Fiscal Year 2012‐13) and tracked for three
years following the date of their release.
Commencing with the 2016 Outcome Evaluation Report, CDCR transitioned the primary measure of
recidivism from the three‐year return‐to‐prison rate to the three‐year conviction rate, to better coincide
with the state‐wide definition of recidivism and to provide a more meaningful measure of reoffending
behavior for CDCR offenders following the implementation of California’s Public Safety Realignment Act
(Realignment).
Consistent with earlier reports published by CDCR, all offenders released from an adult institution over
the course of a fiscal year were followed for three years after the date of their release. In addition to the
three‐year conviction rate, which is provided by offender demographics (e.g. race, age) and offender
characteristics (e.g. commitment offense, length of stay), this report includes three‐year conviction rates
for the Fiscal Year 2011‐12 and 2012‐13 release cohorts, by offender demographics and characteristics
to allow for comparisons (Appendix A). This report also includes the three‐year conviction rate by county
of release (Appendix B). Finally, supplemental measures of recidivism (arrests and returns to prison) are
provided in Appendix C, D, and E to provide the most comprehensive picture of reoffending behaviors
among CDCR offenders as possible.
In Fiscal Year 2012‐13, 35,790 offenders were released from a CDCR adult institution and were tracked
for three years following the date of their release. The three‐year conviction rate for the 35,790
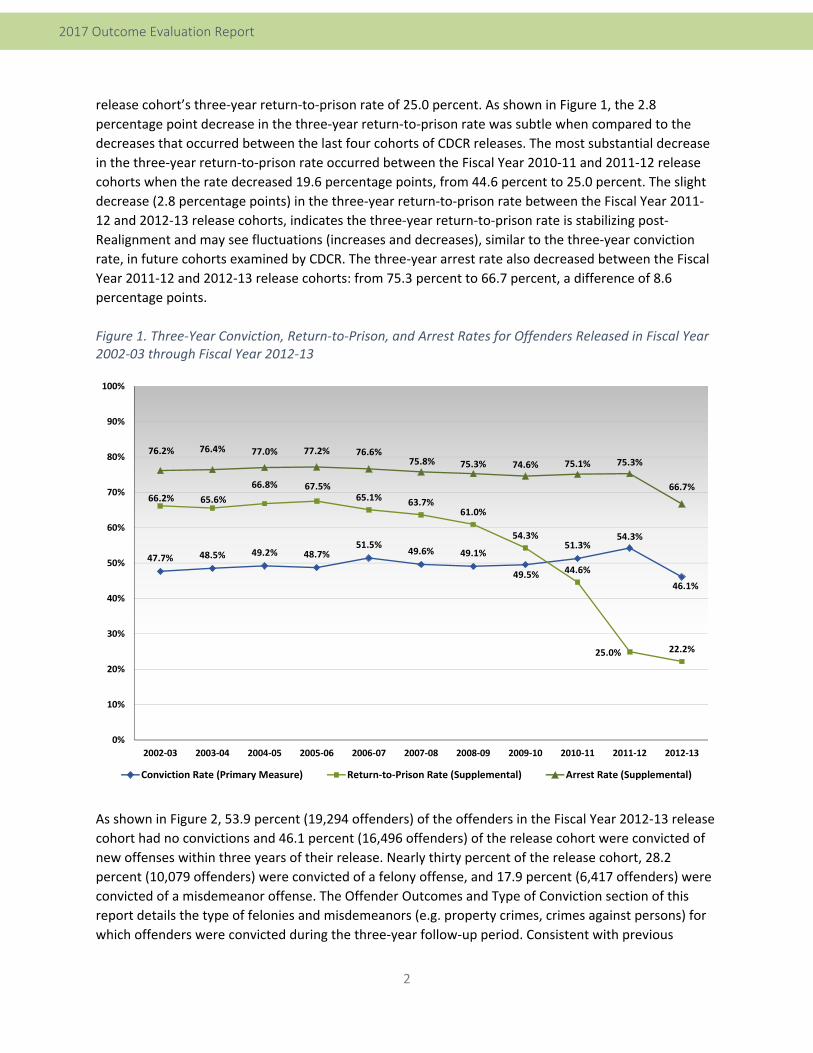
offenders who comprise the Fiscal Year 2012‐13 release cohort was 46.1 percent.13 As shown in Figure 1,
the three‐year conviction rate of 46.1 percent for the Fiscal Year 2012‐13 release cohort was 8.2
percentage points lower than the Fiscal Year 2011‐12 release cohort’s three‐year conviction rate of 54.3
percent. Overall, across the past 11 release cohorts examined by CDCR, the three‐year conviction rate
has been generally stable with some variation; which typical, since a number of factors contribute to
changes in rates.14
The three‐year return‐to‐prison rate (now a supplemental measure of recidivism) for the Fiscal Year
2012‐13 release cohort was 22.2 percent, a 2.8 percentage point decrease from the Fiscal Year 2011‐12
13 During Fiscal Year 2012‐13, a total of 36,527 offenders were released from a CDCR adult institution. Of these offenders, 35,790 offenders had a Department of Justice automated rap sheet. Arrest and conviction data only include the 35,790 offenders with an automated rap sheet, while return‐to‐prison data includes all 36,527 offenders released from prison. 14 Lurigio, A., (2014) Violent Victimization in the United States. Washington, DC: Department of Justice, Office of Justice Programs, National Institute of Justice https://www.nij.gov/topics/victims‐victimization/Documents/violent‐victimization‐twg‐2015‐lurigio‐white‐paper.pdf
2
2017 Outcome Evaluation Report
release cohort’s three‐year return‐to‐prison rate of 25.0 percent. As shown in Figure 1, the 2.8
percentage point decrease in the three‐year return‐to‐prison rate was subtle when compared to the
decreases that occurred between the last four cohorts of CDCR releases. The most substantial decrease
in the three‐year return‐to‐prison rate occurred between the Fiscal Year 2010‐11 and 2011‐12 release
cohorts when the rate decreased 19.6 percentage points, from 44.6 percent to 25.0 percent. The slight
decrease (2.8 percentage points) in the three‐year return‐to‐prison rate between the Fiscal Year 2011‐
12 and 2012‐13 release cohorts, indicates the three‐year return‐to‐prison rate is stabilizing post‐
Realignment and may see fluctuations (increases and decreases), similar to the three‐year conviction
rate, in future cohorts examined by CDCR. The three‐year arrest rate also decreased between the Fiscal
Year 2011‐12 and 2012‐13 release cohorts: from 75.3 percent to 66.7 percent, a difference of 8.6
percentage points.
Figure 1. Three‐Year Conviction, Return‐to‐Prison, and Arrest Rates for Offenders Released in Fiscal Year 2002‐03 through Fiscal Year 2012‐13
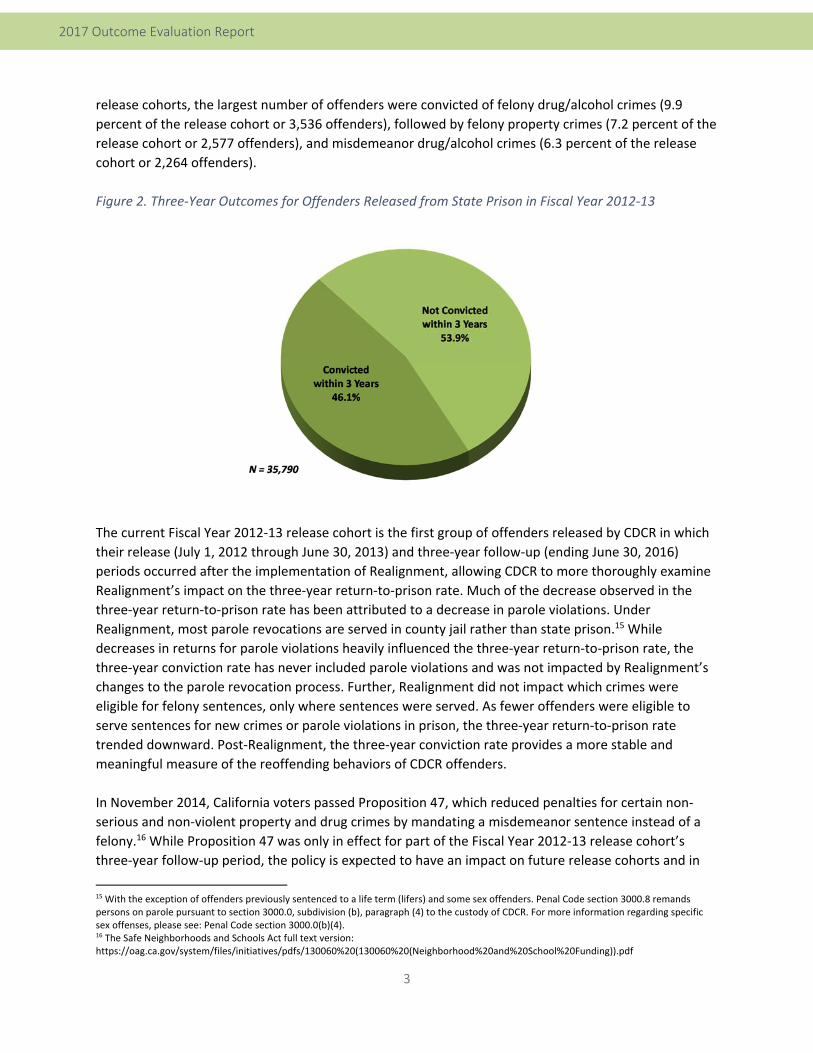
As shown in Figure 2, 53.9 percent (19,294 offenders) of the offenders in the Fiscal Year 2012‐13 release
cohort had no convictions and 46.1 percent (16,496 offenders) of the release cohort were convicted of
new offenses within three years of their release. Nearly thirty percent of the release cohort, 28.2
percent (10,079 offenders) were convicted of a felony offense, and 17.9 percent (6,417 offenders) were
convicted of a misdemeanor offense. The Offender Outcomes and Type of Conviction section of this
report details the type of felonies and misdemeanors (e.g. property crimes, crimes against persons) for
which offenders were convicted during the three‐year follow‐up period. Consistent with previous
47.7% 48.5% 49.2% 48.7%51.5%
49.6% 49.1%
49.5%
51.3%54.3%
46.1%
66.2% 65.6%
66.8% 67.5%65.1% 63.7%
61.0%
54.3%
44.6%
25.0% 22.2%
76.2% 76.4% 77.0% 77.2% 76.6%75.8% 75.3% 74.6% 75.1% 75.3%
66.7%
0%
10%
20%
30%
40%
50%
60%
70%
80%
90%
100%
2002‐03 2003‐04 2004‐05 2005‐06 2006‐07 2007‐08 2008‐09 2009‐10 2010‐11 2011‐12 2012‐13
Conviction Rate (Primary Measure) Return‐to‐Prison Rate (Supplemental) Arrest Rate (Supplemental)
3
2017 Outcome Evaluation Report
release cohorts, the largest number of offenders were convicted of felony drug/alcohol crimes (9.9
percent of the release cohort or 3,536 offenders), followed by felony property crimes (7.2 percent of the
release cohort or 2,577 offenders), and misdemeanor drug/alcohol crimes (6.3 percent of the release
cohort or 2,264 offenders).
Figure 2. Three‐Year Outcomes for Offenders Released from State Prison in Fiscal Year 2012‐13
The current Fiscal Year 2012‐13 release cohort is the first group of offenders released by CDCR in which
their release (July 1, 2012 through June 30, 2013) and three‐year follow‐up (ending June 30, 2016)
periods occurred after the implementation of Realignment, allowing CDCR to more thoroughly examine
Realignment’s impact on the three‐year return‐to‐prison rate. Much of the decrease observed in the
three‐year return‐to‐prison rate has been attributed to a decrease in parole violations. Under
Realignment, most parole revocations are served in county jail rather than state prison.15 While
decreases in returns for parole violations heavily influenced the three‐year return‐to‐prison rate, the
three‐year conviction rate has never included parole violations and was not impacted by Realignment’s
changes to the parole revocation process. Further, Realignment did not impact which crimes were
eligible for felony sentences, only where sentences were served. As fewer offenders were eligible to
serve sentences for new crimes or parole violations in prison, the three‐year return‐to‐prison rate
trended downward. Post‐Realignment, the three‐year conviction rate provides a more stable and
meaningful measure of the reoffending behaviors of CDCR offenders.
In November 2014, California voters passed Proposition 47, which reduced penalties for certain non‐
serious and non‐violent property and drug crimes by mandating a misdemeanor sentence instead of a
felony.16 While Proposition 47 was only in effect for part of the Fiscal Year 2012‐13 release cohort’s
three‐year follow‐up period, the policy is expected to have an impact on future release cohorts and in
15 With the exception of offenders previously sentenced to a life term (lifers) and some sex offenders. Penal Code section 3000.8 remands persons on parole pursuant to section 3000.0, subdivision (b), paragraph (4) to the custody of CDCR. For more information regarding specific sex offenses, please see: Penal Code section 3000.0(b)(4). 16 The Safe Neighborhoods and Schools Act full text version: https://oag.ca.gov/system/files/initiatives/pdfs/130060%20(130060%20(Neighborhood%20and%20School%20Funding)).pdf
4
2017 Outcome Evaluation Report
particular, the number of felony and misdemeanor convictions for property crimes and drug/alcohol
crimes. Although more time is needed to fully understand the impacts of Proposition 47 on the three‐
year conviction rate, CDCR will continue to monitor Proposition 47’s effect on the type of conviction
(e.g. felony and misdemeanor property crimes and drug crimes) for CDCR offenders.
Realignment’s impact on the three‐year return‐to‐prison rate is evident: the three‐year return‐to‐prison
rate for the last group of CDCR offenders released pre‐Realignment (Fiscal Year 2007‐08) was 63.7
percent, 41.5 percentage points higher than the Fiscal Year 2012‐13 release cohort’s rate of 22.2
percent. With the three‐year return‐to‐prison rate experiencing drastic declines due to Realignment, the
three‐year conviction rate is a more meaningful measure of post‐release recidivism. CDCR will continue
to monitor the impacts of policies, such as Proposition 47, on arrest, conviction, and return‐to‐prison
rates to provide the most comprehensive picture of reoffending as possible and in order to spur
discussion around the best possible ways to reduce reoffending among offenders released from CDCR.
5
2017 Outcome Evaluation Report
2 Evaluation Design
Definitions
The State of California defines recidivism as “conviction of a new felony or misdemeanor committed
within three years of release from custody or committed within three years of placement on supervision
for a previous criminal conviction.”17 The definition also allows for supplemental measures of recidivism
including: new arrests, returns to custody, criminal filings, or supervision violations. In prior reports,
CDCR used a supplemental measure, the three‐year return‐to‐prison rate, as the primary measure of
recidivism. Commencing with the 2016 Outcome Evaluation Report, CDCR implemented the State of
California’s definition of recidivism and used the three‐year conviction rate as the primary measure of
recidivism.
The three‐year conviction rate is defined as follows:
“An individual convicted of a felony18 and incarcerated in a CDCR adult institution who was released to
parole, discharged after being paroled, or directly discharged during Fiscal Year 2012‐13 and
subsequently convicted of a felony or misdemeanor offense within three years of their release date.”
The conviction rate is calculated using the ratio of the number of offenders in the release cohort who
were convicted during the follow‐up period, to the total number of offenders in the release cohort,
multiplied by 100.
Conviction Rate = Number Convicted
X 100 Release Cohort
Appendix C of this report provides supplemental recidivism rates using arrest and return‐to‐prison data
for year‐to‐year comparisons. Three‐year rates for each of the supplemental measures are available
from Fiscal Year (FY) 2002‐03 through 2012‐13. One‐year and two‐year rates are available for the FY
2013‐14 release cohort and one‐year rates are available for the FY 2014‐15 release cohort.
Methods
This report provides conviction rates at one‐, two‐, and three‐year intervals for offenders released from
CDCR’s Division of Adult Institutions (DAI) between July 1, 2012 and June 30, 2013 (FY 2012‐13). The
release cohort includes: 1) offenders who were directly discharged from CDCR; 2) offenders who were
released to parole or PRCS for the first time on their current term; and 3) offenders who were released
to parole on their current term prior to FY 2012‐13, returned to prison on this term, and were then re‐
released during FY 2012‐13. Convictions are further examined according to offender demographics (e.g.
gender and age) and offender characteristics (e.g. commitment offense and sentence type).
17 Section 3027 of California Penal Code required the Board of State and Community Corrections to develop a state‐wide definition of recidivism. 18 Due to reporting limitations, civil addicts are excluded.
6
2017 Outcome Evaluation Report
Data Sources
Data were extracted from CDCR’s Strategic Offender Management System (SOMS), CDCR’s system of
record, to identify offenders released between July 1, 2012 and June 30, 2013 and to determine which
released offenders returned to state prison during the three‐year follow‐up period. Arrest and
conviction data were obtained from the Department of Justice’s (DOJ) Criminal Justice Information
System and the California Law Enforcement Telecommunications System.
Data Limitations
Data quality is important with all analyses performed by CDCR’s Office of Research. The intent of this
report is to provide summary (aggregate) information, rather than individual information. The aggregate
data are strong when a large number of records (releases) are available for analysis, but are less robust
as subgroups are influenced by nuances associated with each case. Therefore, caution should be
exercised when interpreting results associated with fewer records. As such, conviction rates are only
presented for offender releases (i.e. denominators) that are equal to or greater than 30.
Conviction rates are fixed at three years, meaning the follow‐up period is considered complete and no
further analyses are performed. Arrest, conviction, and return‐to‐prison data presented in the
appendices of this report may see slight fluctuations, particularly as the one‐year and two‐year rates are
updated in subsequent reporting years. These data are routinely updated in accordance with criminal
justice system processing. As data become available, subsequent reports will be updated.
Impacts of Proposition 47 and Reporting Limitations
Proposition 47 passed in November 2014 and reduced penalties for certain non‐serious and non‐violent
property and drug crimes by mandating a misdemeanor sentence instead of a felony.19 Under Proposition
47, offenders serving sentences in prison for felony offenses can petition the courts for resentencing
under new misdemeanor provisions and offenders who have completed their sentences may apply to
have felony convictions reclassified as misdemeanors, unless the offender has been previously convicted
of a disqualifying offense.20
Proposition 47 was in effect for varying amounts of time during the FY 2012‐13 release cohort’s three‐
year follow‐up period. Since the proposition’s resentencing provisions were retroactive, some offenders
in the release cohort were eligible to have their commitment offense reclassified as a misdemeanor.
Additionally, some offenders who were convicted after release may have been eligible to have their
post‐release felony conviction reclassified as a misdemeanor. Data are not available on offenders who
19 The Safe Neighborhoods and Schools Act full text version: https://oag.ca.gov/system/files/initiatives/pdfs/130060%20(130060%20(Neighborhood%20and%20School%20Funding)).pdf 20 Disqualification from provisions of the Safe Neighborhoods and Schools Act only applies to offenders with an offense requiring registration pursuant to subdivision (c) of Section 290 or offenders with a prior conviction for an offense specified in Section 667(e)(2)(C)(iv).
7
2017 Outcome Evaluation Report
were actually resentenced after release from CDCR. However, approximately 22.8 percent of the release
cohort (8,148 offenders) were committed to prison for offenses that were potentially eligible for
resentencing under Proposition 47.21 Commitment offense data (presented in Section 6.2.2), represent
the offense for which offenders were originally committed to prison and do not represent any
resentencing that took place after Proposition 47’s passage.
Furthermore, over ten percent of the release cohort (10.3 percent or 3,695 offenders) had a post‐
release felony conviction that occurred prior to the implementation of Proposition 47 and was
potentially eligible for resentencing to a misdemeanor. Type of conviction data (Sections 5.1 and 5.2)
present the felony offense for which the offender was originally convicted during the three‐year follow‐
up period and do not reflect any reclassification of the felony offense to misdemeanor that may have
occurred following the implementation of Proposition 47.
Similarly, information related to the type of release (i.e. to parole, PRCS or directly discharged)
presented in Section 4.1, represent the type of supervision to which the offender was originally released
and does not include any discharges from parole or PRCS that took place following the implementation
of Proposition 47. In other words, if an offender was released to PRCS and subsequently discharged
from supervision as a result of Proposition 47, the offender is categorized as being released to PRCS
regardless of discharge from supervision during the three‐year follow‐up period.
21 The estimate of offenders eligible for resentencing is based upon the offenses for which an offender was convicted and does not consider details of the offense (e.g. the dollar amount associated with petty theft or prior disqualifying offenses) courts may consider in reducing a felony to a misdemeanor. This estimate is based upon the limited data available to CDCR.
8
2017 Outcome Evaluation Report
3 Description of the Fiscal Year 2012‐13 Release Cohort
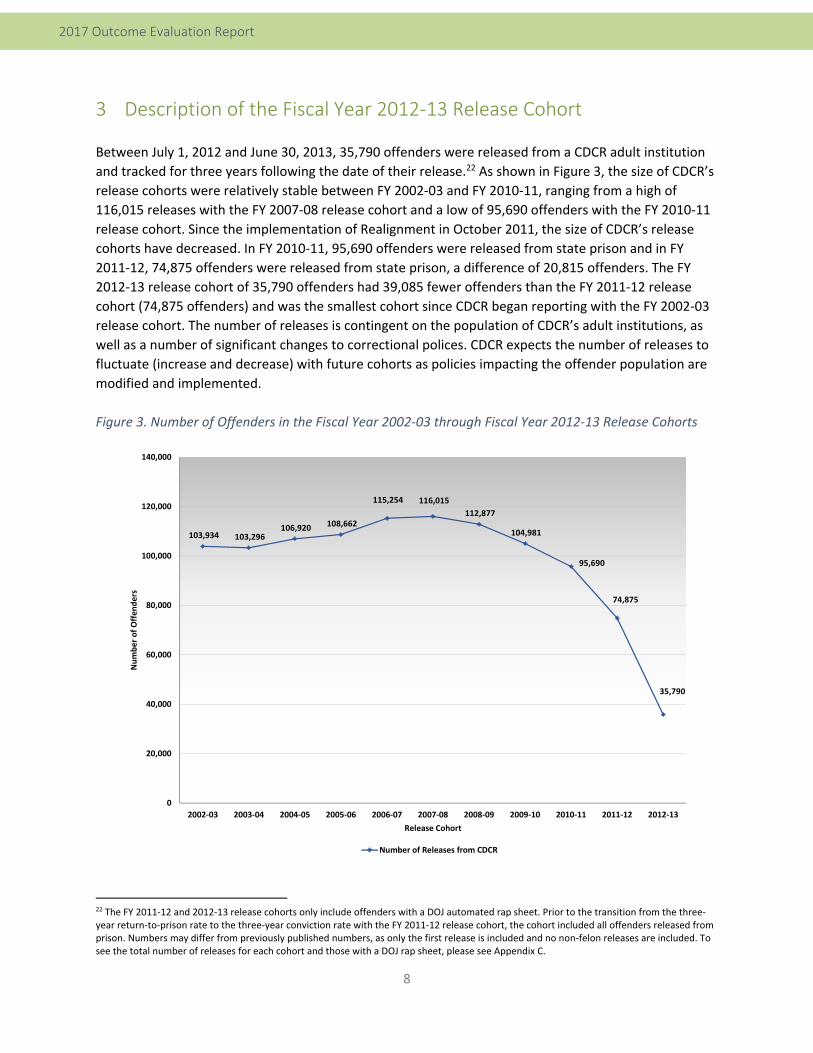
Between July 1, 2012 and June 30, 2013, 35,790 offenders were released from a CDCR adult institution
and tracked for three years following the date of their release.22 As shown in Figure 3, the size of CDCR’s
release cohorts were relatively stable between FY 2002‐03 and FY 2010‐11, ranging from a high of
116,015 releases with the FY 2007‐08 release cohort and a low of 95,690 offenders with the FY 2010‐11
release cohort. Since the implementation of Realignment in October 2011, the size of CDCR’s release
cohorts have decreased. In FY 2010‐11, 95,690 offenders were released from state prison and in FY
2011‐12, 74,875 offenders were released from state prison, a difference of 20,815 offenders. The FY
2012‐13 release cohort of 35,790 offenders had 39,085 fewer offenders than the FY 2011‐12 release
cohort (74,875 offenders) and was the smallest cohort since CDCR began reporting with the FY 2002‐03
release cohort. The number of releases is contingent on the population of CDCR’s adult institutions, as
well as a number of significant changes to correctional polices. CDCR expects the number of releases to
fluctuate (increase and decrease) with future cohorts as policies impacting the offender population are
modified and implemented.
Figure 3. Number of Offenders in the Fiscal Year 2002‐03 through Fiscal Year 2012‐13 Release Cohorts
22 The FY 2011‐12 and 2012‐13 release cohorts only include offenders with a DOJ automated rap sheet. Prior to the transition from the three‐year return‐to‐prison rate to the three‐year conviction rate with the FY 2011‐12 release cohort, the cohort included all offenders released from prison. Numbers may differ from previously published numbers, as only the first release is included and no non‐felon releases are included. To see the total number of releases for each cohort and those with a DOJ rap sheet, please see Appendix C.
103,934 103,296 106,920 108,662
115,254 116,015
112,877
104,981
95,690
74,875
35,790
0
20,000
40,000
60,000
80,000
100,000
120,000
140,000
2002‐03 2003‐04 2004‐05 2005‐06 2006‐07 2007‐08 2008‐09 2009‐10 2010‐11 2011‐12 2012‐13
Number of Offen
ders
Release Cohort
Number of Releases from CDCR
9
2017 Outcome Evaluation Report
Offender Demographics
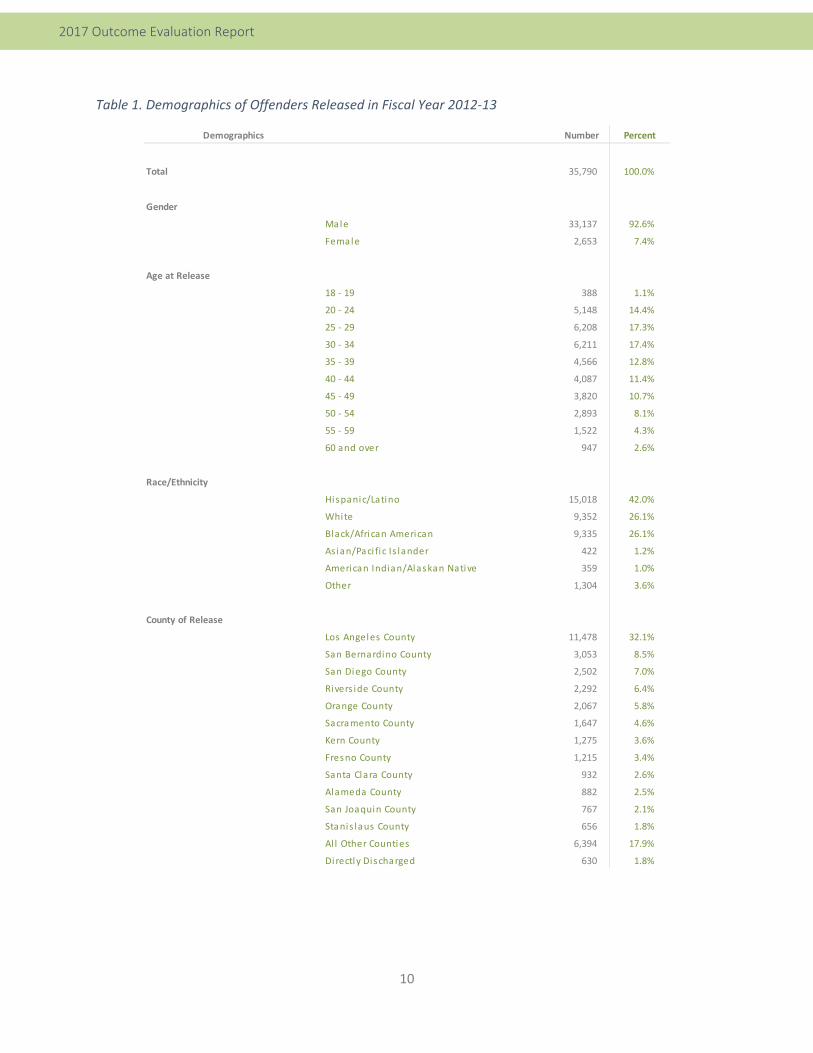
Gender
Of the 35,790 offenders released from prison in FY 2012‐13, the majority were male (92.6 percent or
33,137 offenders) and less than eight percent (7.4 percent or 2,653 offenders) were female.
Age at Release
Offenders ages 30 – 34 represented the largest number of releases (17.4 percent or 6,211 offenders) in
the release cohort, followed by offenders ages 25 – 29 (17.3 percent or 6,208 offenders). Over 80
percent (83.9 percent or 30,040 offenders) of the release cohort was comprised of offenders between
the ages of 20 – 49. Offenders ages 18 – 19 comprised a very small portion of the release cohort (1.1
percent or 388 offenders), as did offenders 60 and over (2.6 percent or 947 offenders).
Race/Ethnicity
Over 40 percent (42 percent or 15,018 offenders) of the FY 2012‐13 release cohort were
Hispanic/Latino, followed by White (26.1 percent or 9,352 offenders) and Black/African American (26.1
percent or 9,335 offenders). Over three percent (3.6 percent or 1,304 offenders) belonged to the other
race/ethnicity category, 1.2 percent (422 offenders) were Asian/Pacific Islander, and 1.0 percent (359
offenders) were American Indian/Alaskan Native.
County of Release
Nearly one‐third of the FY 2012‐13 release cohort (32.1 percent or 11,478 offenders) were released to
Los Angeles County, followed by San Bernardino County with 8.5 percent of the release cohort (3,053
offenders), and San Diego County with 7.0 percent of the release cohort (2,502 offenders). Over 80
percent (80.4 percent or 28,766 offenders) of the offenders were released to 12 California counties, as
shown in Table 1. Nearly 20 percent (17.9 percent or 6,394 offenders) were released to all other
California counties and 1.8 percent (630 offenders) were directly discharged from prison.
10
2017 Outcome Evaluation Report
Table 1. Demographics of Offenders Released in Fiscal Year 2012‐13
Demographics Number Percent
Total 35,790 100.0%
Gender
Male 33,137 92.6%
Female 2,653 7.4%
Age at Release
18 ‐ 19 388 1.1%
20 ‐ 24 5,148 14.4%
25 ‐ 29 6,208 17.3%
30 ‐ 34 6,211 17.4%
35 ‐ 39 4,566 12.8%
40 ‐ 44 4,087 11.4%
45 ‐ 49 3,820 10.7%
50 ‐ 54 2,893 8.1%
55 ‐ 59 1,522 4.3%
60 and over 947 2.6%
Race/Ethnicity
Hispanic/Latino 15,018 42.0%
White 9,352 26.1%
Black/African American 9,335 26.1%
Asian/Paci fic Is lander 422 1.2%
American Indian/Alaskan Native 359 1.0%
Other 1,304 3.6%
County of Release
Los Angeles County 11,478 32.1%
San Bernardino County 3,053 8.5%
San Diego County 2,502 7.0%
Rivers ide County 2,292 6.4%
Orange County 2,067 5.8%
Sacramento County 1,647 4.6%
Kern County 1,275 3.6%
Fresno County 1,215 3.4%
Santa Clara County 932 2.6%
Alameda County 882 2.5%
San Joaquin County 767 2.1%
Stanis laus County 656 1.8%
Al l Other Counties 6,394 17.9%
Directly Discharged 630 1.8%
11
2017 Outcome Evaluation Report
Offender Characteristics
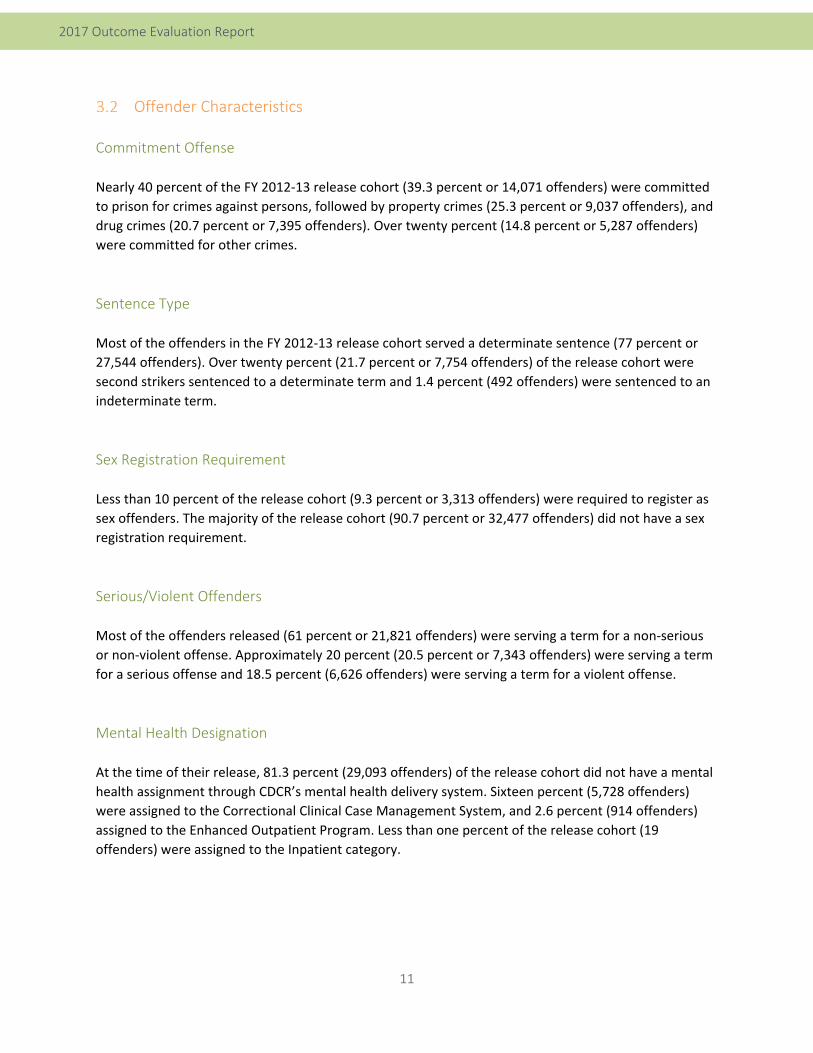
Commitment Offense
Nearly 40 percent of the FY 2012‐13 release cohort (39.3 percent or 14,071 offenders) were committed
to prison for crimes against persons, followed by property crimes (25.3 percent or 9,037 offenders), and
drug crimes (20.7 percent or 7,395 offenders). Over twenty percent (14.8 percent or 5,287 offenders)
were committed for other crimes.
Sentence Type
Most of the offenders in the FY 2012‐13 release cohort served a determinate sentence (77 percent or
27,544 offenders). Over twenty percent (21.7 percent or 7,754 offenders) of the release cohort were
second strikers sentenced to a determinate term and 1.4 percent (492 offenders) were sentenced to an
indeterminate term.
Sex Registration Requirement
Less than 10 percent of the release cohort (9.3 percent or 3,313 offenders) were required to register as
sex offenders. The majority of the release cohort (90.7 percent or 32,477 offenders) did not have a sex
registration requirement.
Serious/Violent Offenders
Most of the offenders released (61 percent or 21,821 offenders) were serving a term for a non‐serious
or non‐violent offense. Approximately 20 percent (20.5 percent or 7,343 offenders) were serving a term
for a serious offense and 18.5 percent (6,626 offenders) were serving a term for a violent offense.
Mental Health Designation
At the time of their release, 81.3 percent (29,093 offenders) of the release cohort did not have a mental
health assignment through CDCR’s mental health delivery system. Sixteen percent (5,728 offenders)
were assigned to the Correctional Clinical Case Management System, and 2.6 percent (914 offenders)
assigned to the Enhanced Outpatient Program. Less than one percent of the release cohort (19
offenders) were assigned to the Inpatient category.
12
2017 Outcome Evaluation Report
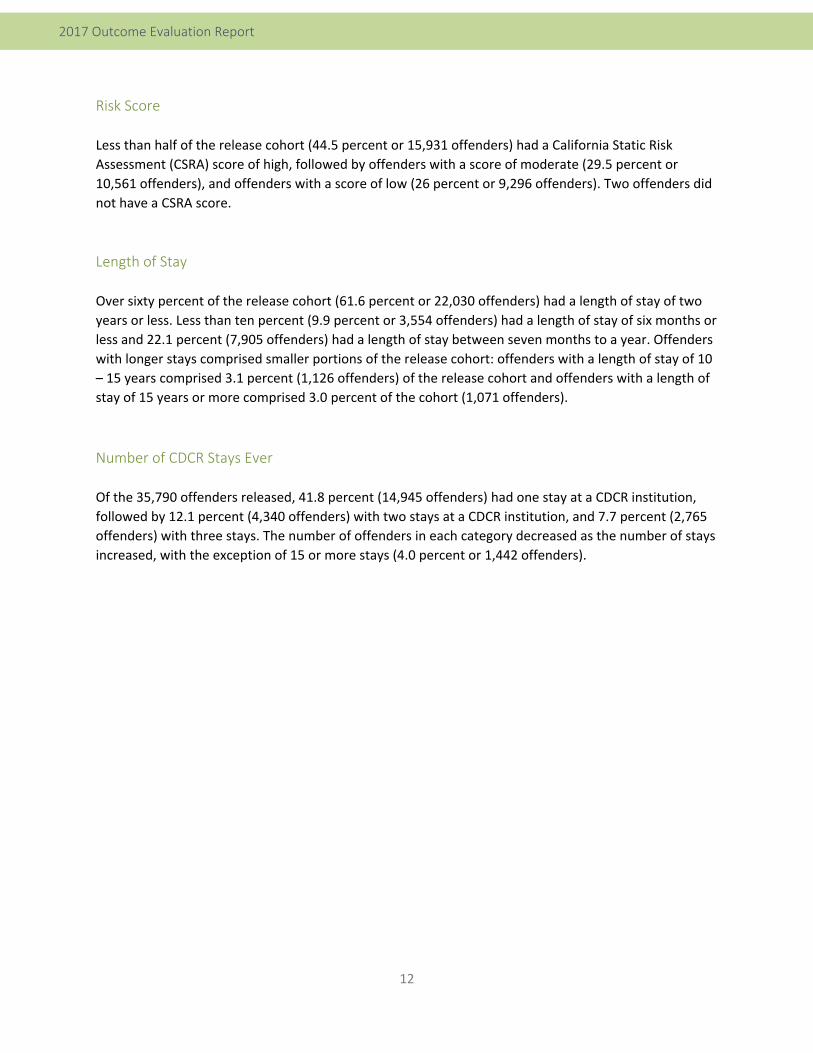
Risk Score
Less than half of the release cohort (44.5 percent or 15,931 offenders) had a California Static Risk
Assessment (CSRA) score of high, followed by offenders with a score of moderate (29.5 percent or
10,561 offenders), and offenders with a score of low (26 percent or 9,296 offenders). Two offenders did
not have a CSRA score.
Length of Stay
Over sixty percent of the release cohort (61.6 percent or 22,030 offenders) had a length of stay of two
years or less. Less than ten percent (9.9 percent or 3,554 offenders) had a length of stay of six months or
less and 22.1 percent (7,905 offenders) had a length of stay between seven months to a year. Offenders
with longer stays comprised smaller portions of the release cohort: offenders with a length of stay of 10
– 15 years comprised 3.1 percent (1,126 offenders) of the release cohort and offenders with a length of
stay of 15 years or more comprised 3.0 percent of the cohort (1,071 offenders).
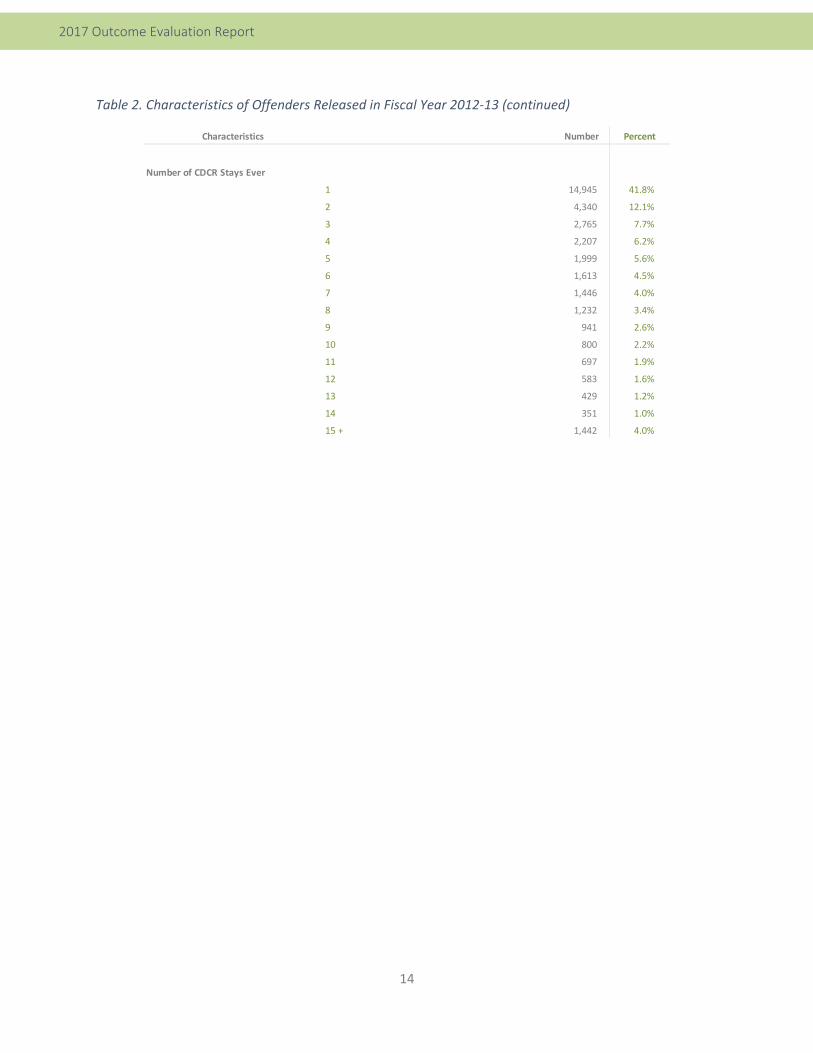
Number of CDCR Stays Ever
Of the 35,790 offenders released, 41.8 percent (14,945 offenders) had one stay at a CDCR institution,
followed by 12.1 percent (4,340 offenders) with two stays at a CDCR institution, and 7.7 percent (2,765
offenders) with three stays. The number of offenders in each category decreased as the number of stays
increased, with the exception of 15 or more stays (4.0 percent or 1,442 offenders).
13
2017 Outcome Evaluation Report
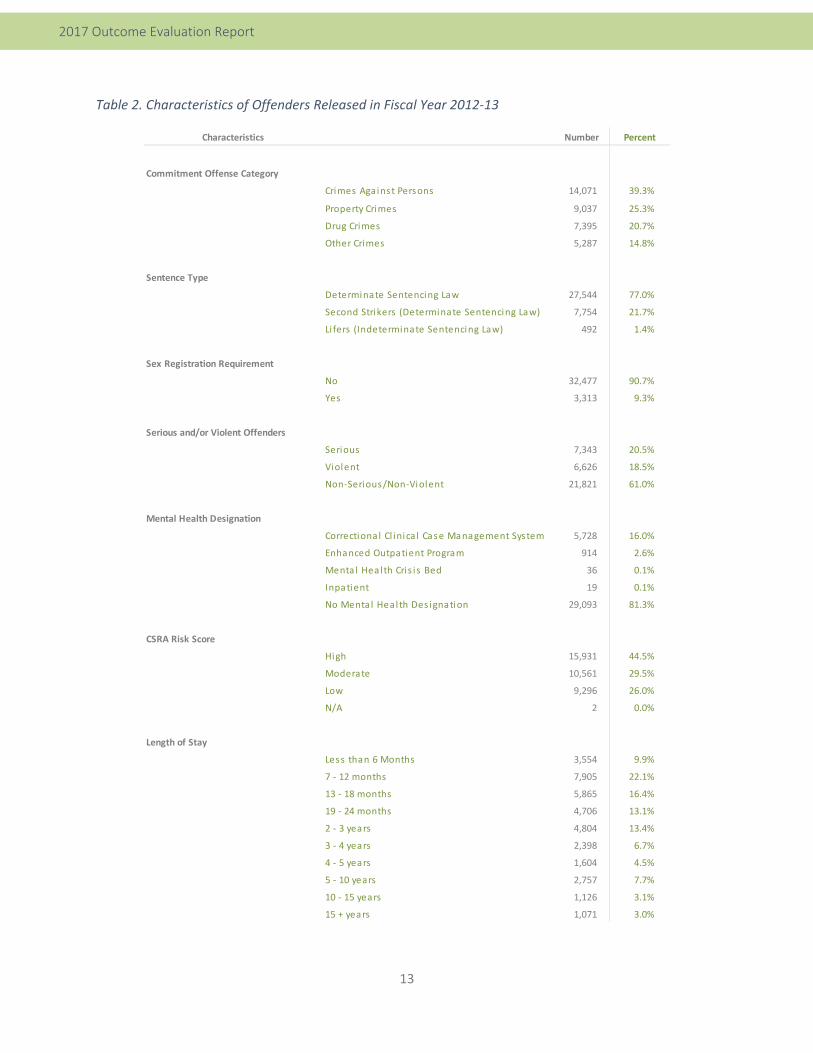
Table 2. Characteristics of Offenders Released in Fiscal Year 2012‐13
Characteristics Number Percent
Commitment Offense Category
Crimes Against Persons 14,071 39.3%
Property Crimes 9,037 25.3%
Drug Crimes 7,395 20.7%
Other Crimes 5,287 14.8%
Sentence Type
Determinate Sentencing Law 27,544 77.0%
Second Strikers (Determinate Sentencing Law) 7,754 21.7%
Li fers (Indeterminate Sentencing Law) 492 1.4%
Sex Registration Requirement
No 32,477 90.7%
Yes 3,313 9.3%
Serious and/or Violent Offenders
Serious 7,343 20.5%
Violent 6,626 18.5%
Non‐Serious/Non‐Violent 21,821 61.0%
Mental Health Designation
Correctiona l Cl inica l Case Management System 5,728 16.0%
Enhanced Outpatient Program 914 2.6%
Menta l Health Cris is Bed 36 0.1%
Inpatient 19 0.1%
No Menta l Heal th Des ignation 29,093 81.3%
CSRA Risk Score
High 15,931 44.5%
Moderate 10,561 29.5%
Low 9,296 26.0%
N/A 2 0.0%
Length of Stay
Less than 6 Months 3,554 9.9%
7 ‐ 12 months 7,905 22.1%
13 ‐ 18 months 5,865 16.4%
19 ‐ 24 months 4,706 13.1%
2 ‐ 3 years 4,804 13.4%
3 ‐ 4 years 2,398 6.7%
4 ‐ 5 years 1,604 4.5%
5 ‐ 10 years 2,757 7.7%
10 ‐ 15 years 1,126 3.1%
15 + years 1,071 3.0%
14
2017 Outcome Evaluation Report
Table 2. Characteristics of Offenders Released in Fiscal Year 2012‐13 (continued)
Characteristics Number Percent
Number of CDCR Stays Ever
1 14,945 41.8%
2 4,340 12.1%
3 2,765 7.7%
4 2,207 6.2%
5 1,999 5.6%
6 1,613 4.5%
7 1,446 4.0%
8 1,232 3.4%
9 941 2.6%
10 800 2.2%
11 697 1.9%
12 583 1.6%
13 429 1.2%
14 351 1.0%
15 + 1,442 4.0%
15
2017 Outcome Evaluation Report
4 Three‐Year Conviction Rate
Three‐Year Conviction Rate for CDCR Offenders Released in Fiscal Year 2012‐13 and
the Impact of Realignment
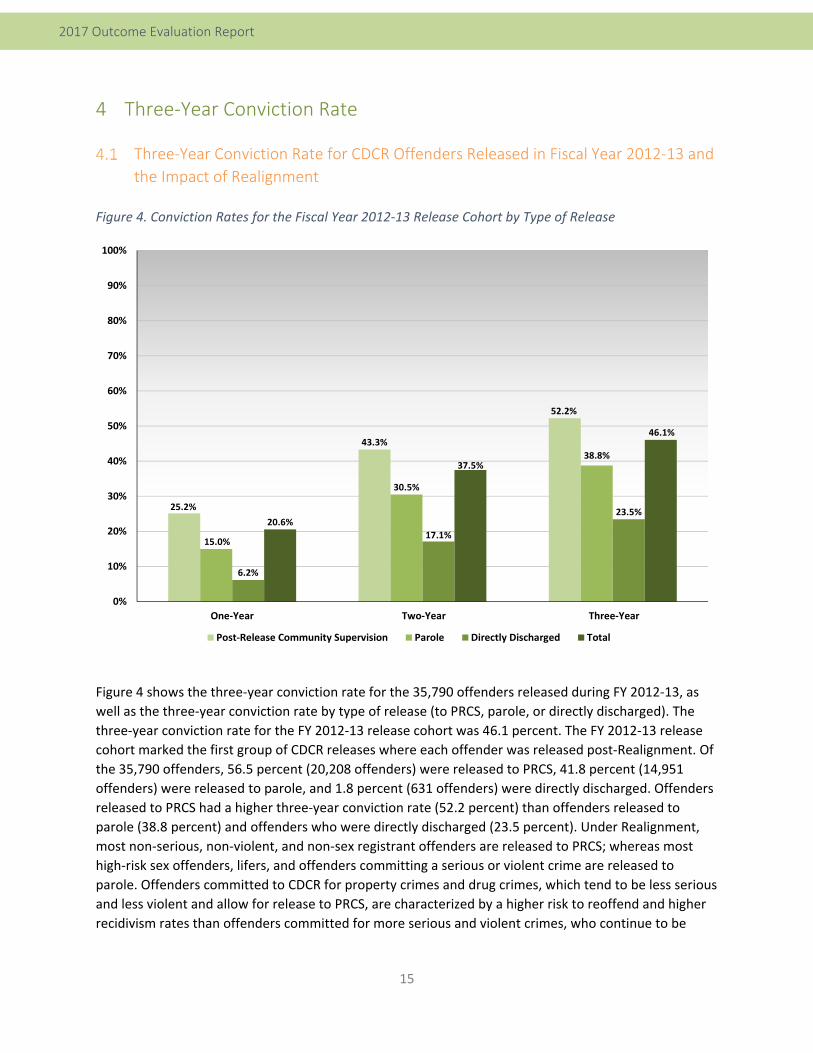
Figure 4. Conviction Rates for the Fiscal Year 2012‐13 Release Cohort by Type of Release
Figure 4 shows the three‐year conviction rate for the 35,790 offenders released during FY 2012‐13, as
well as the three‐year conviction rate by type of release (to PRCS, parole, or directly discharged). The
three‐year conviction rate for the FY 2012‐13 release cohort was 46.1 percent. The FY 2012‐13 release
cohort marked the first group of CDCR releases where each offender was released post‐Realignment. Of
the 35,790 offenders, 56.5 percent (20,208 offenders) were released to PRCS, 41.8 percent (14,951
offenders) were released to parole, and 1.8 percent (631 offenders) were directly discharged. Offenders
released to PRCS had a higher three‐year conviction rate (52.2 percent) than offenders released to
parole (38.8 percent) and offenders who were directly discharged (23.5 percent). Under Realignment,
most non‐serious, non‐violent, and non‐sex registrant offenders are released to PRCS; whereas most
high‐risk sex offenders, lifers, and offenders committing a serious or violent crime are released to
parole. Offenders committed to CDCR for property crimes and drug crimes, which tend to be less serious
and less violent and allow for release to PRCS, are characterized by a higher risk to reoffend and higher
recidivism rates than offenders committed for more serious and violent crimes, who continue to be
25.2%
43.3%
52.2%
15.0%
30.5%
38.8%
6.2%
17.1%
23.5% 20.6%
37.5%
46.1%
0%
10%
20%
30%
40%
50%
60%
70%
80%
90%
100%
One‐Year Two‐Year Three‐Year
Post‐Release Community Supervision Parole Directly Discharged Total
16
2017 Outcome Evaluation Report
released to parole.23 Further, younger offenders who are more likely to commit non‐serious and non‐
violent property and drug crimes are characterized by some of the highest recidivism rates among all
offenders, which was an additional factor that influenced the conviction rate of PRCS offenders
upward.24 Offenders characterized by lower recidivism rates and a lower risk to reoffend (offenders
committing serious and violent crimes) continue to be released to parole thereby influencing the three‐
year conviction rate of parolees downward.
Direct comparisons between offenders released to PRCS and parole should not be made, as the two
groups represent substantially different groups of offenders. Rather, the rate for PRCS offenders (52.2
percent) should be used as a baseline and compared to rates for PRCS offenders provided in future
Outcome Evaluation Reports and the three‐year conviction rate for parolees (38.8 percent) should be
compared to future rates for parolees. The overall conviction rate (46.1 percent) provides the most
comprehensive picture of reoffending among all offenders released from CDCR institutions into the
community.
In earlier reports, the three‐year return‐to‐prison rate and the three‐year conviction rate were
organized by first releases (an offender’s first release on the current term for a new admission) and re‐
releases (an offender’s subsequent release on the current term for a parole violation). For example, the
vast majority of the FY 2011‐12 release cohort was admitted to prison prior to the implementation of
Realignment with nearly a third (33.2 percent or 24,858 offenders) admitted for parole violations (re‐
releases) and 66.8 percent or 50,017 of the 74,875 offenders considered first releases.25 Prior to
Realignment, offenders served parole revocations in State prison and a large number of each release
cohort was comprised of re‐releases. Post‐Realignment all parole revocations are served in county jail,
with the exception of offenders previously sentenced to a life term and some sex offenders, which
substantially reduced the number of re‐releases.26
Realignment was operational for all of the period during which the FY 2012‐13 release cohort was
released, with very few offenders eligible to return to prison for parole violations. Specifically, of the
current FY 2012‐13 release cohort, less than one percent (331 offenders) were re‐releases and these
offenders were released and returned to prison for a parole violation, prior to the implementation of
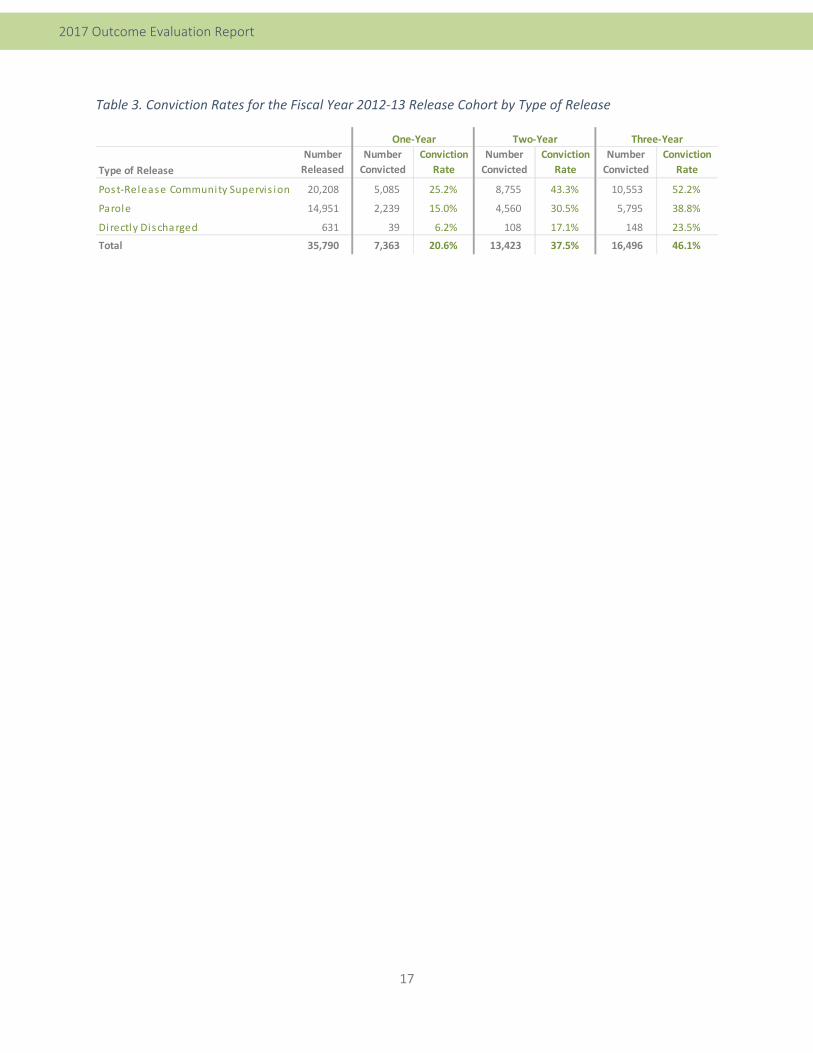
Realignment. With Realignment causing substantial declines to the number of re‐releases, providing the
three‐year conviction rate by type of release (to parole, PRCS or directly discharged), provides a more
meaningful presentation of the three‐year conviction rate as displayed in Table 3.
23 For more information regarding conviction rates by commitment offense category, serious and violent offenses, and risk scores, please see the following sections: 2.2.1 Commitment Offense Category, 5.2.6 Serious and Violent Offenses, and 5.2.8 Risk of Conviction. 24 For more information regarding conviction rates by age at release, please see 5.1.2 Age at Release. 25 See pages 14 – 15 of the 2016 Outcome Evaluation Report for more information regarding first and re‐releases. 26 Section 3000.8 remands persons on parole pursuant to Section 3000.0, subdivision (b), paragraph (4) to the custody of CDCR. For more information regarding specific sex offenses, please see: Penal Code 3000.0(b)(4).
17
2017 Outcome Evaluation Report
Table 3. Conviction Rates for the Fiscal Year 2012‐13 Release Cohort by Type of Release
Type of Release
Number
Released
Number
Convicted
Conviction
Rate
Number
Convicted
Conviction
Rate
Number
Convicted
Conviction
Rate
Post‐Release Community Supervis ion 20,208 5,085 25.2% 8,755 43.3% 10,553 52.2%
Parole 14,951 2,239 15.0% 4,560 30.5% 5,795 38.8%
Directly Discharged 631 39 6.2% 108 17.1% 148 23.5%
Total 35,790 7,363 20.6% 13,423 37.5% 16,496 46.1%
One‐Year Two‐Year Three‐Year
18
2017 Outcome Evaluation Report
Time to Conviction
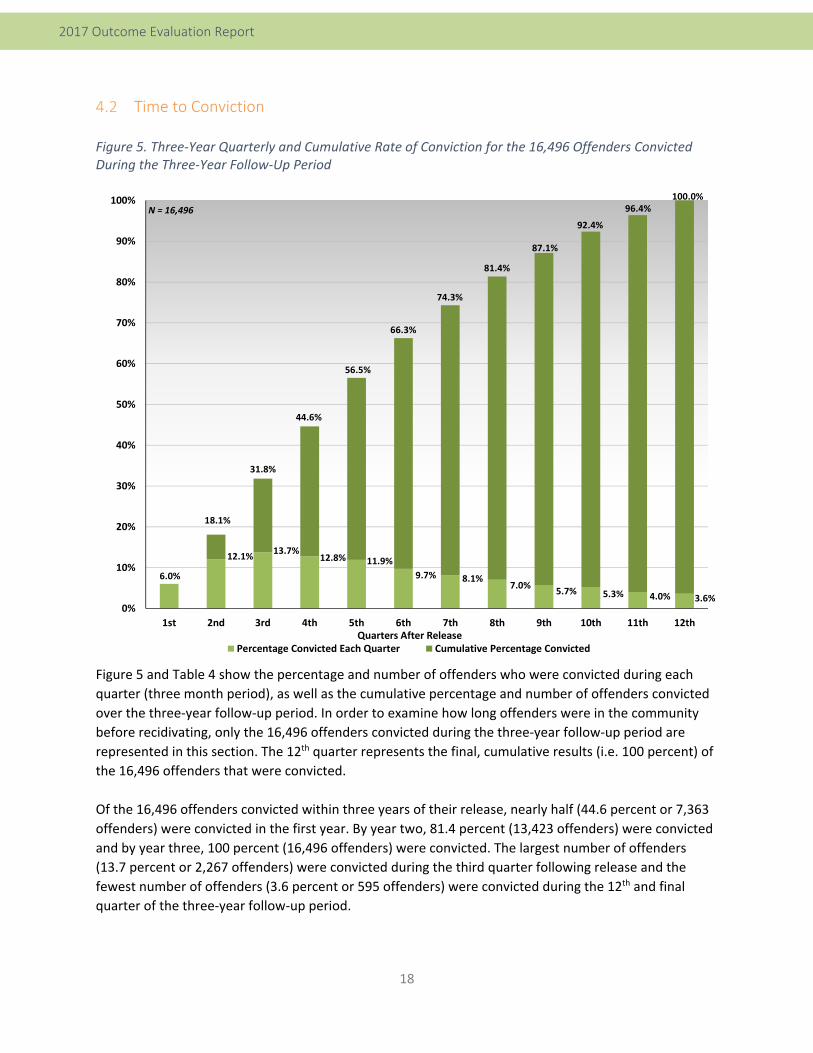
Figure 5. Three‐Year Quarterly and Cumulative Rate of Conviction for the 16,496 Offenders Convicted During the Three‐Year Follow‐Up Period
Figure 5 and Table 4 show the percentage and number of offenders who were convicted during each
quarter (three month period), as well as the cumulative percentage and number of offenders convicted
over the three‐year follow‐up period. In order to examine how long offenders were in the community
before recidivating, only the 16,496 offenders convicted during the three‐year follow‐up period are
represented in this section. The 12th quarter represents the final, cumulative results (i.e. 100 percent) of
the 16,496 offenders that were convicted.
Of the 16,496 offenders convicted within three years of their release, nearly half (44.6 percent or 7,363
offenders) were convicted in the first year. By year two, 81.4 percent (13,423 offenders) were convicted
and by year three, 100 percent (16,496 offenders) were convicted. The largest number of offenders
(13.7 percent or 2,267 offenders) were convicted during the third quarter following release and the
fewest number of offenders (3.6 percent or 595 offenders) were convicted during the 12th and final
quarter of the three‐year follow‐up period.
6.0%
12.1%13.7%
12.8% 11.9%
9.7% 8.1%7.0%
5.7% 5.3% 4.0% 3.6%0%
10%
20%
30%
40%
50%
60%
70%
80%
90%
100%
1st 2nd 3rd 4th 5th 6th 7th 8th 9th 10th 11th 12thQuarters After Release
Percentage Convicted Each Quarter Cumulative Percentage Convicted
N = 16,496
18.1%
31.8%
44.6%
56.5%
66.3%
74.3%
81.4%
87.1%
92.4%
96.4%100.0%
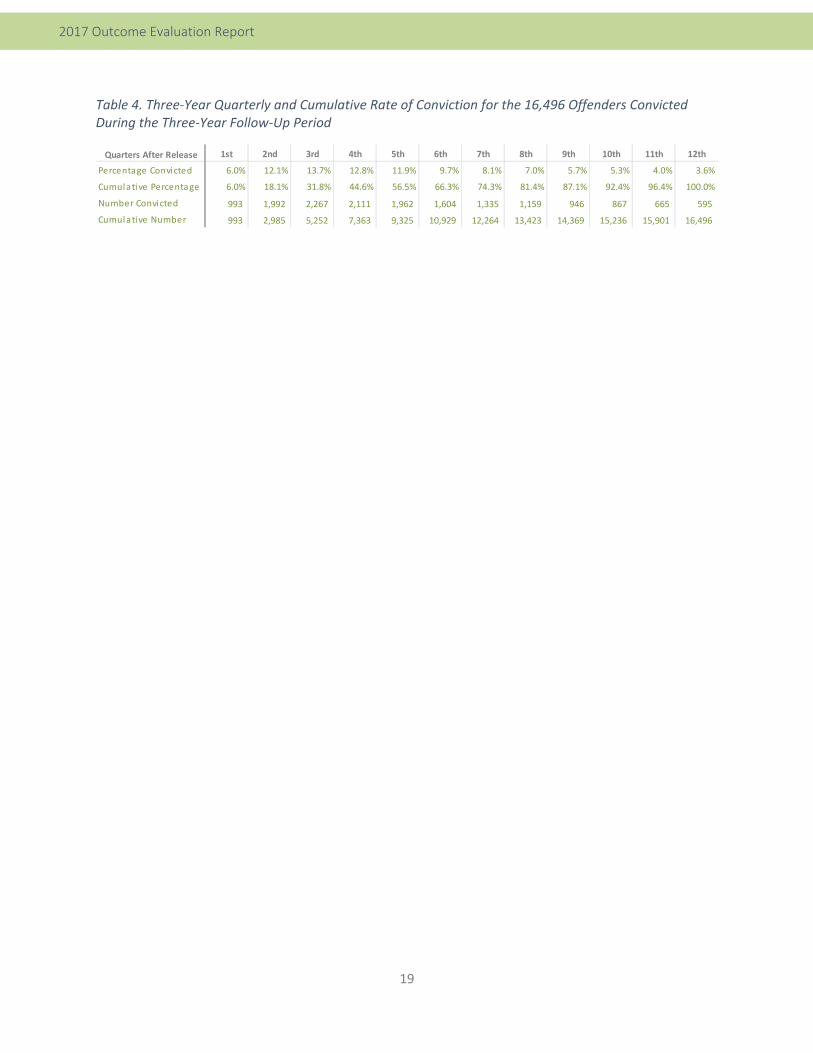
19
2017 Outcome Evaluation Report
Table 4. Three‐Year Quarterly and Cumulative Rate of Conviction for the 16,496 Offenders Convicted During the Three‐Year Follow‐Up Period
Quarters After Release 1st 2nd 3rd 4th 5th 6th 7th 8th 9th 10th 11th 12th
Percentage Convicted 6.0% 12.1% 13.7% 12.8% 11.9% 9.7% 8.1% 7.0% 5.7% 5.3% 4.0% 3.6%
Cumulative Percentage 6.0% 18.1% 31.8% 44.6% 56.5% 66.3% 74.3% 81.4% 87.1% 92.4% 96.4% 100.0%
Number Convicted 993 1,992 2,267 2,111 1,962 1,604 1,335 1,159 946 867 665 595
Cumulative Number 993 2,985 5,252 7,363 9,325 10,929 12,264 13,423 14,369 15,236 15,901 16,496
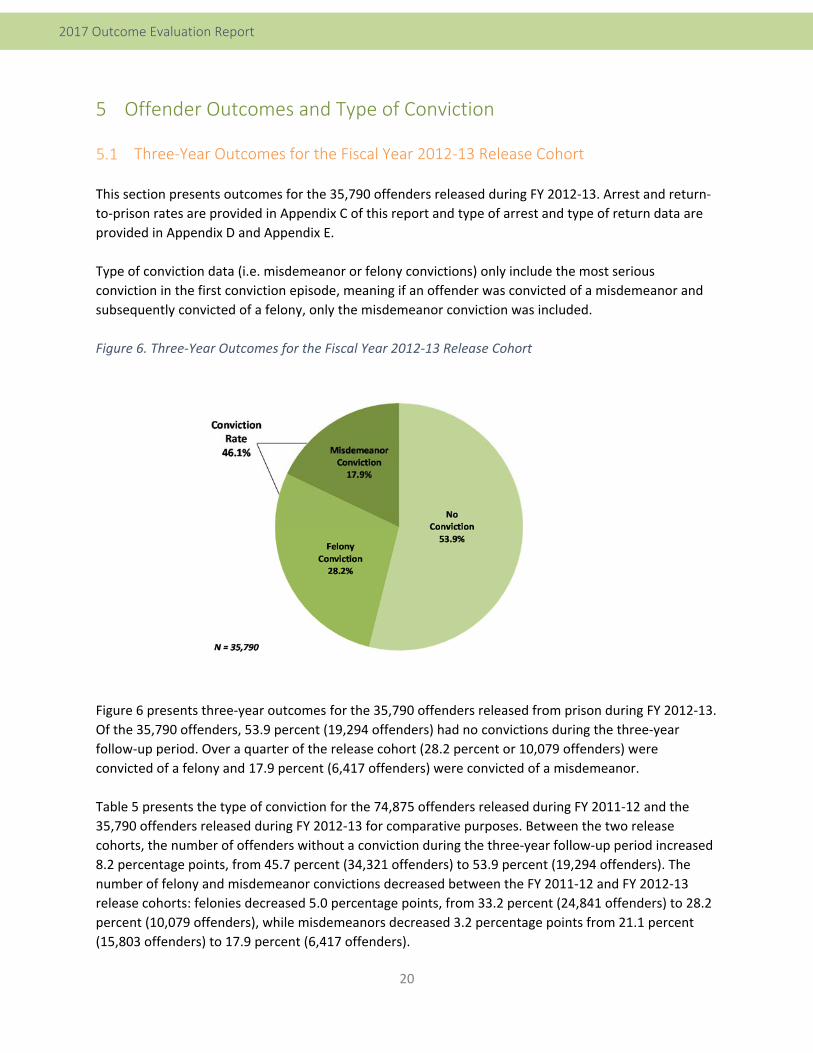
20
2017 Outcome Evaluation Report
5 Offender Outcomes and Type of Conviction
Three‐Year Outcomes for the Fiscal Year 2012‐13 Release Cohort
This section presents outcomes for the 35,790 offenders released during FY 2012‐13. Arrest and return‐
to‐prison rates are provided in Appendix C of this report and type of arrest and type of return data are
provided in Appendix D and Appendix E.
Type of conviction data (i.e. misdemeanor or felony convictions) only include the most serious
conviction in the first conviction episode, meaning if an offender was convicted of a misdemeanor and
subsequently convicted of a felony, only the misdemeanor conviction was included.
Figure 6. Three‐Year Outcomes for the Fiscal Year 2012‐13 Release Cohort
Figure 6 presents three‐year outcomes for the 35,790 offenders released from prison during FY 2012‐13.
Of the 35,790 offenders, 53.9 percent (19,294 offenders) had no convictions during the three‐year
follow‐up period. Over a quarter of the release cohort (28.2 percent or 10,079 offenders) were
convicted of a felony and 17.9 percent (6,417 offenders) were convicted of a misdemeanor.
Table 5 presents the type of conviction for the 74,875 offenders released during FY 2011‐12 and the
35,790 offenders released during FY 2012‐13 for comparative purposes. Between the two release
cohorts, the number of offenders without a conviction during the three‐year follow‐up period increased
8.2 percentage points, from 45.7 percent (34,321 offenders) to 53.9 percent (19,294 offenders). The
number of felony and misdemeanor convictions decreased between the FY 2011‐12 and FY 2012‐13
release cohorts: felonies decreased 5.0 percentage points, from 33.2 percent (24,841 offenders) to 28.2
percent (10,079 offenders), while misdemeanors decreased 3.2 percentage points from 21.1 percent
(15,803 offenders) to 17.9 percent (6,417 offenders).
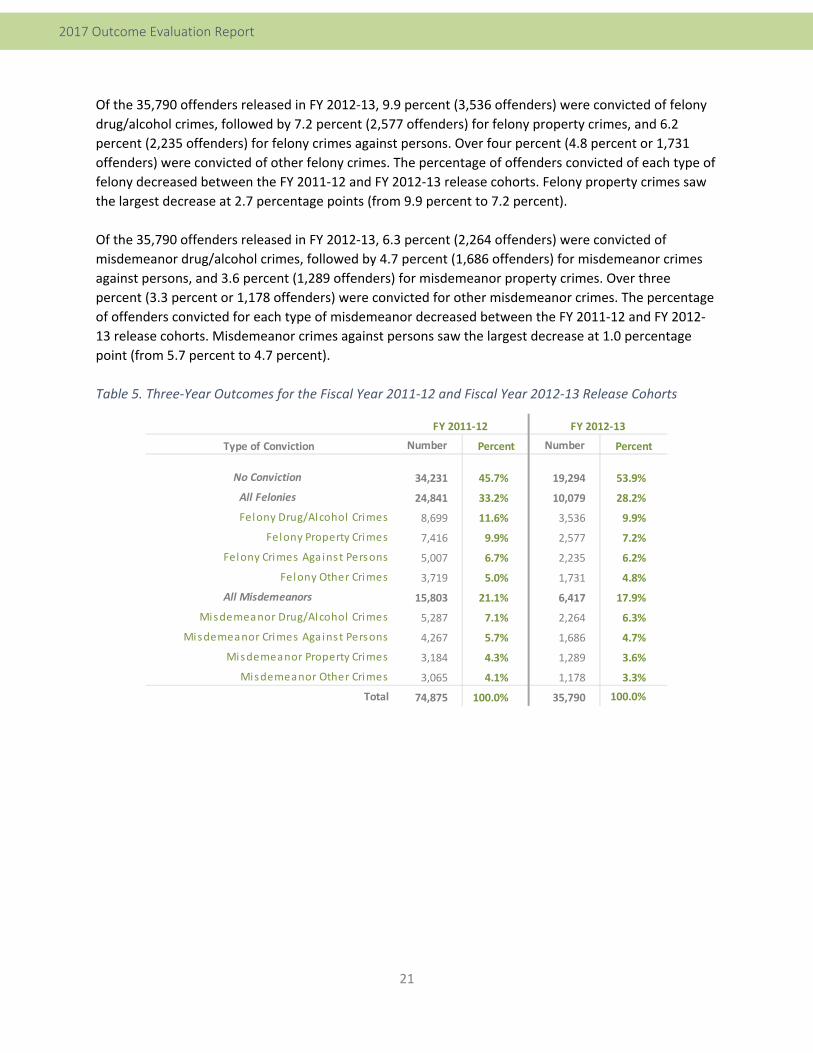
21
2017 Outcome Evaluation Report
Of the 35,790 offenders released in FY 2012‐13, 9.9 percent (3,536 offenders) were convicted of felony
drug/alcohol crimes, followed by 7.2 percent (2,577 offenders) for felony property crimes, and 6.2
percent (2,235 offenders) for felony crimes against persons. Over four percent (4.8 percent or 1,731
offenders) were convicted of other felony crimes. The percentage of offenders convicted of each type of
felony decreased between the FY 2011‐12 and FY 2012‐13 release cohorts. Felony property crimes saw
the largest decrease at 2.7 percentage points (from 9.9 percent to 7.2 percent).
Of the 35,790 offenders released in FY 2012‐13, 6.3 percent (2,264 offenders) were convicted of
misdemeanor drug/alcohol crimes, followed by 4.7 percent (1,686 offenders) for misdemeanor crimes
against persons, and 3.6 percent (1,289 offenders) for misdemeanor property crimes. Over three
percent (3.3 percent or 1,178 offenders) were convicted for other misdemeanor crimes. The percentage
of offenders convicted for each type of misdemeanor decreased between the FY 2011‐12 and FY 2012‐
13 release cohorts. Misdemeanor crimes against persons saw the largest decrease at 1.0 percentage
point (from 5.7 percent to 4.7 percent).
Table 5. Three‐Year Outcomes for the Fiscal Year 2011‐12 and Fiscal Year 2012‐13 Release Cohorts
Type of Conviction Number Percent Number Percent
No Conviction 34,231 45.7% 19,294 53.9%
All Felonies 24,841 33.2% 10,079 28.2%
Felony Drug/Alcohol Crimes 8,699 11.6% 3,536 9.9%
Felony Property Crimes 7,416 9.9% 2,577 7.2%
Felony Crimes Against Persons 5,007 6.7% 2,235 6.2%
Felony Other Crimes 3,719 5.0% 1,731 4.8%
All Misdemeanors 15,803 21.1% 6,417 17.9%
Misdemeanor Drug/Alcohol Crimes 5,287 7.1% 2,264 6.3%
Misdemeanor Crimes Against Persons 4,267 5.7% 1,686 4.7%
Misdemeanor Property Crimes 3,184 4.3% 1,289 3.6%
Misdemeanor Other Crimes 3,065 4.1% 1,178 3.3%
Total 74,875 100.0% 35,790 100.0%
FY 2011‐12 FY 2012‐13
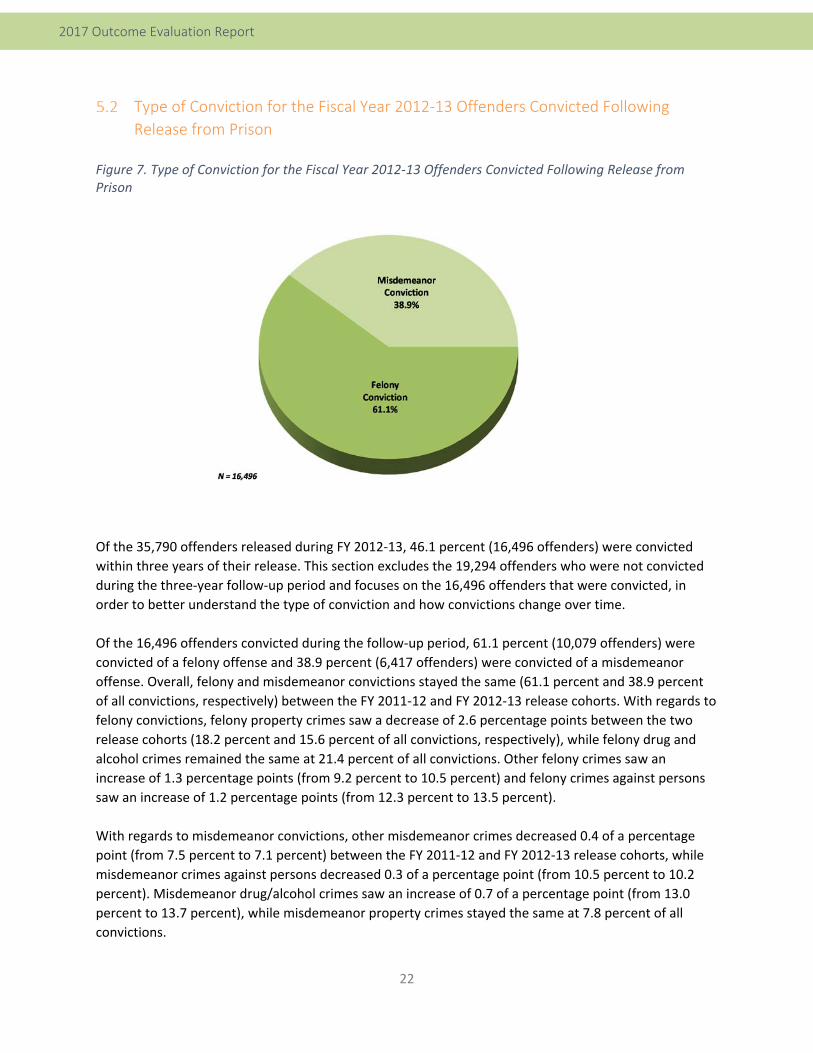
22
2017 Outcome Evaluation Report
Type of Conviction for the Fiscal Year 2012‐13 Offenders Convicted Following
Release from Prison
Figure 7. Type of Conviction for the Fiscal Year 2012‐13 Offenders Convicted Following Release from Prison
Of the 35,790 offenders released during FY 2012‐13, 46.1 percent (16,496 offenders) were convicted
within three years of their release. This section excludes the 19,294 offenders who were not convicted
during the three‐year follow‐up period and focuses on the 16,496 offenders that were convicted, in
order to better understand the type of conviction and how convictions change over time.
Of the 16,496 offenders convicted during the follow‐up period, 61.1 percent (10,079 offenders) were
convicted of a felony offense and 38.9 percent (6,417 offenders) were convicted of a misdemeanor
offense. Overall, felony and misdemeanor convictions stayed the same (61.1 percent and 38.9 percent
of all convictions, respectively) between the FY 2011‐12 and FY 2012‐13 release cohorts. With regards to
felony convictions, felony property crimes saw a decrease of 2.6 percentage points between the two
release cohorts (18.2 percent and 15.6 percent of all convictions, respectively), while felony drug and
alcohol crimes remained the same at 21.4 percent of all convictions. Other felony crimes saw an
increase of 1.3 percentage points (from 9.2 percent to 10.5 percent) and felony crimes against persons
saw an increase of 1.2 percentage points (from 12.3 percent to 13.5 percent).
With regards to misdemeanor convictions, other misdemeanor crimes decreased 0.4 of a percentage
point (from 7.5 percent to 7.1 percent) between the FY 2011‐12 and FY 2012‐13 release cohorts, while
misdemeanor crimes against persons decreased 0.3 of a percentage point (from 10.5 percent to 10.2
percent). Misdemeanor drug/alcohol crimes saw an increase of 0.7 of a percentage point (from 13.0
percent to 13.7 percent), while misdemeanor property crimes stayed the same at 7.8 percent of all
convictions.
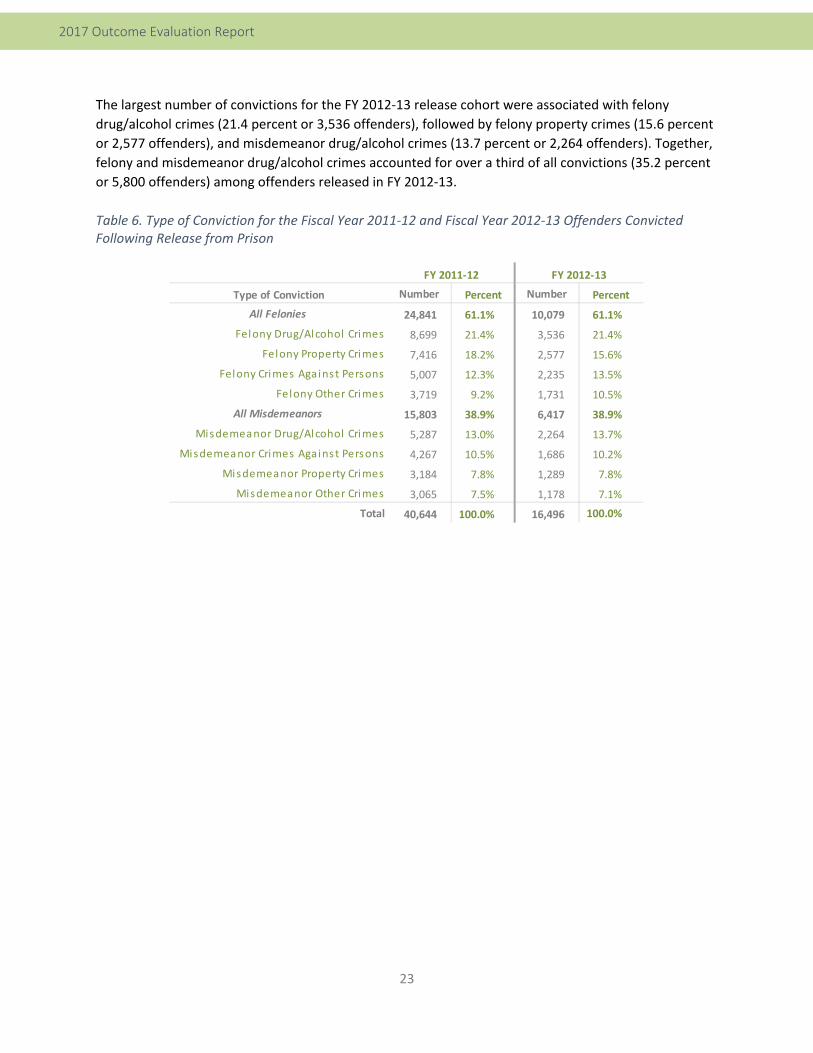
23
2017 Outcome Evaluation Report
The largest number of convictions for the FY 2012‐13 release cohort were associated with felony
drug/alcohol crimes (21.4 percent or 3,536 offenders), followed by felony property crimes (15.6 percent
or 2,577 offenders), and misdemeanor drug/alcohol crimes (13.7 percent or 2,264 offenders). Together,
felony and misdemeanor drug/alcohol crimes accounted for over a third of all convictions (35.2 percent
or 5,800 offenders) among offenders released in FY 2012‐13.
Table 6. Type of Conviction for the Fiscal Year 2011‐12 and Fiscal Year 2012‐13 Offenders Convicted Following Release from Prison
Type of Conviction Number Percent Number Percent
All Felonies 24,841 61.1% 10,079 61.1%
Felony Drug/Alcohol Crimes 8,699 21.4% 3,536 21.4%
Felony Property Crimes 7,416 18.2% 2,577 15.6%
Felony Crimes Against Persons 5,007 12.3% 2,235 13.5%
Felony Other Crimes 3,719 9.2% 1,731 10.5%
All Misdemeanors 15,803 38.9% 6,417 38.9%
Misdemeanor Drug/Alcohol Crimes 5,287 13.0% 2,264 13.7%
Misdemeanor Crimes Against Persons 4,267 10.5% 1,686 10.2%
Misdemeanor Property Crimes 3,184 7.8% 1,289 7.8%
Misdemeanor Other Crimes 3,065 7.5% 1,178 7.1%
Total 40,644 100.0% 16,496 100.0%
FY 2011‐12 FY 2012‐13
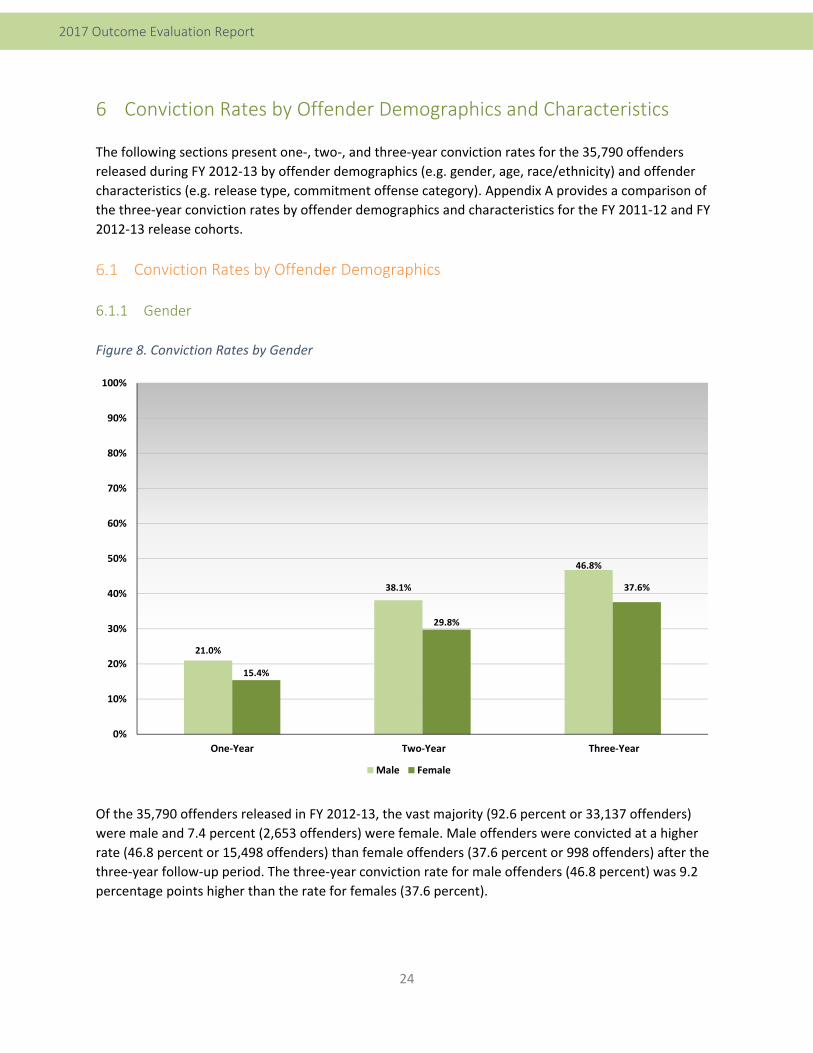
24
2017 Outcome Evaluation Report
6 Conviction Rates by Offender Demographics and Characteristics
The following sections present one‐, two‐, and three‐year conviction rates for the 35,790 offenders
released during FY 2012‐13 by offender demographics (e.g. gender, age, race/ethnicity) and offender
characteristics (e.g. release type, commitment offense category). Appendix A provides a comparison of
the three‐year conviction rates by offender demographics and characteristics for the FY 2011‐12 and FY
2012‐13 release cohorts.
Conviction Rates by Offender Demographics
6.1.1 Gender
Figure 8. Conviction Rates by Gender
Of the 35,790 offenders released in FY 2012‐13, the vast majority (92.6 percent or 33,137 offenders)
were male and 7.4 percent (2,653 offenders) were female. Male offenders were convicted at a higher
rate (46.8 percent or 15,498 offenders) than female offenders (37.6 percent or 998 offenders) after the
three‐year follow‐up period. The three‐year conviction rate for male offenders (46.8 percent) was 9.2
percentage points higher than the rate for females (37.6 percent).
21.0%
38.1%
46.8%
15.4%
29.8%
37.6%
0%
10%
20%
30%
40%
50%
60%
70%
80%
90%
100%
One‐Year Two‐Year Three‐Year
Male Female
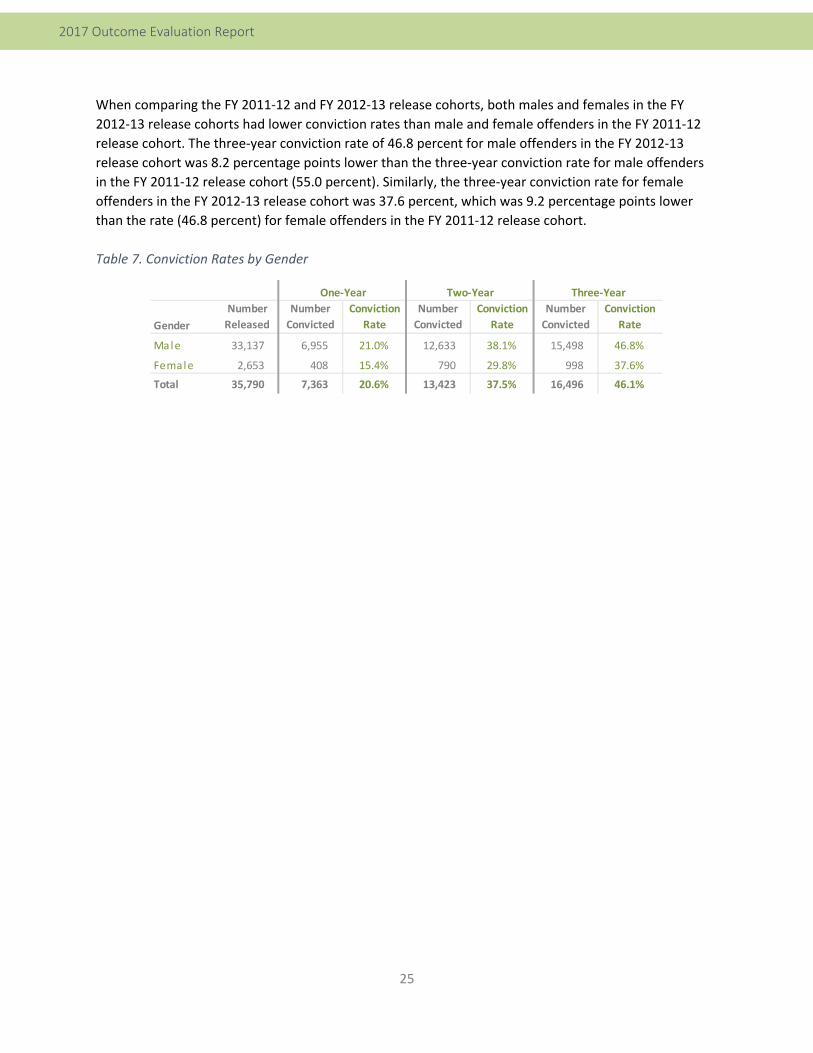
25
2017 Outcome Evaluation Report
When comparing the FY 2011‐12 and FY 2012‐13 release cohorts, both males and females in the FY
2012‐13 release cohorts had lower conviction rates than male and female offenders in the FY 2011‐12
release cohort. The three‐year conviction rate of 46.8 percent for male offenders in the FY 2012‐13
release cohort was 8.2 percentage points lower than the three‐year conviction rate for male offenders
in the FY 2011‐12 release cohort (55.0 percent). Similarly, the three‐year conviction rate for female
offenders in the FY 2012‐13 release cohort was 37.6 percent, which was 9.2 percentage points lower
than the rate (46.8 percent) for female offenders in the FY 2011‐12 release cohort.
Table 7. Conviction Rates by Gender
Gender
Number
Released
Number
Convicted
Conviction
Rate
Number
Convicted
Conviction
Rate
Number
Convicted
Conviction
Rate
Male 33,137 6,955 21.0% 12,633 38.1% 15,498 46.8%
Female 2,653 408 15.4% 790 29.8% 998 37.6%
Total 35,790 7,363 20.6% 13,423 37.5% 16,496 46.1%
One‐Year Two‐Year Three‐Year
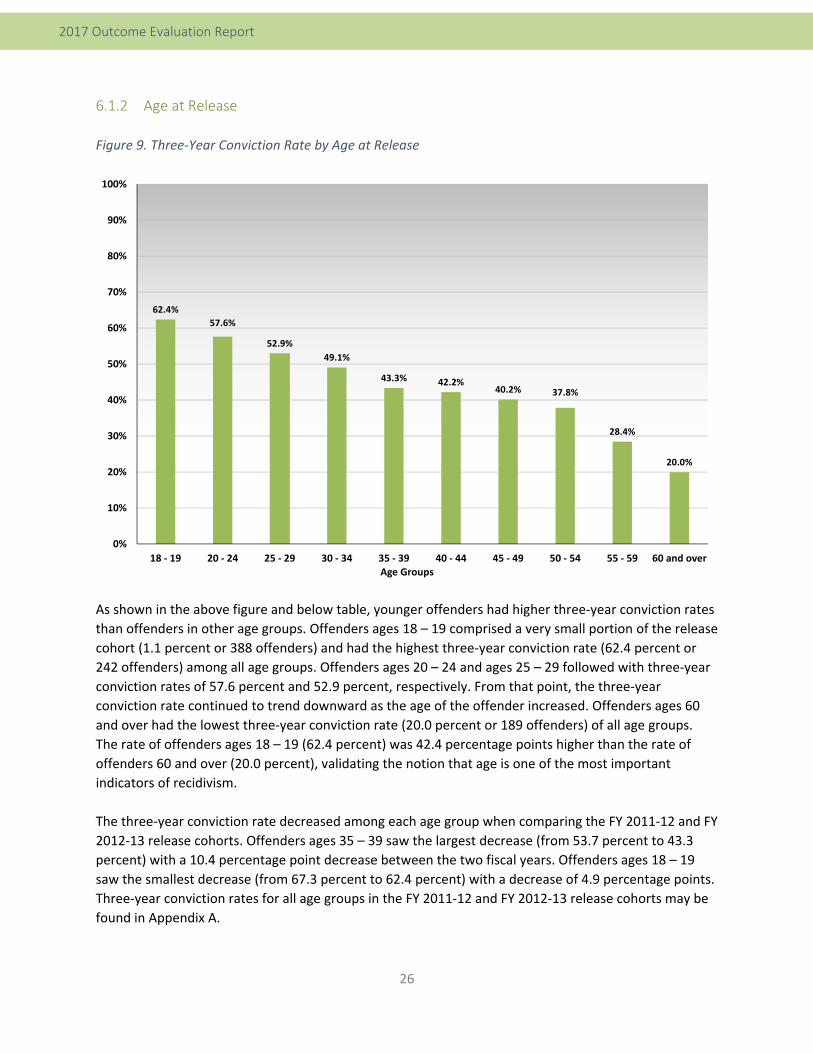
26
2017 Outcome Evaluation Report
6.1.2 Age at Release
Figure 9. Three‐Year Conviction Rate by Age at Release
As shown in the above figure and below table, younger offenders had higher three‐year conviction rates
than offenders in other age groups. Offenders ages 18 – 19 comprised a very small portion of the release
cohort (1.1 percent or 388 offenders) and had the highest three‐year conviction rate (62.4 percent or
242 offenders) among all age groups. Offenders ages 20 – 24 and ages 25 – 29 followed with three‐year
conviction rates of 57.6 percent and 52.9 percent, respectively. From that point, the three‐year
conviction rate continued to trend downward as the age of the offender increased. Offenders ages 60
and over had the lowest three‐year conviction rate (20.0 percent or 189 offenders) of all age groups.
The rate of offenders ages 18 – 19 (62.4 percent) was 42.4 percentage points higher than the rate of
offenders 60 and over (20.0 percent), validating the notion that age is one of the most important
indicators of recidivism.
The three‐year conviction rate decreased among each age group when comparing the FY 2011‐12 and FY
2012‐13 release cohorts. Offenders ages 35 – 39 saw the largest decrease (from 53.7 percent to 43.3
percent) with a 10.4 percentage point decrease between the two fiscal years. Offenders ages 18 – 19
saw the smallest decrease (from 67.3 percent to 62.4 percent) with a decrease of 4.9 percentage points.
Three‐year conviction rates for all age groups in the FY 2011‐12 and FY 2012‐13 release cohorts may be
found in Appendix A.
62.4%
57.6%
52.9%
49.1%
43.3% 42.2% 40.2% 37.8%
28.4%
20.0%
0%
10%
20%
30%
40%
50%
60%
70%
80%
90%
100%
18 ‐ 19 20 ‐ 24 25 ‐ 29 30 ‐ 34 35 ‐ 39 40 ‐ 44 45 ‐ 49 50 ‐ 54 55 ‐ 59 60 and overAge Groups
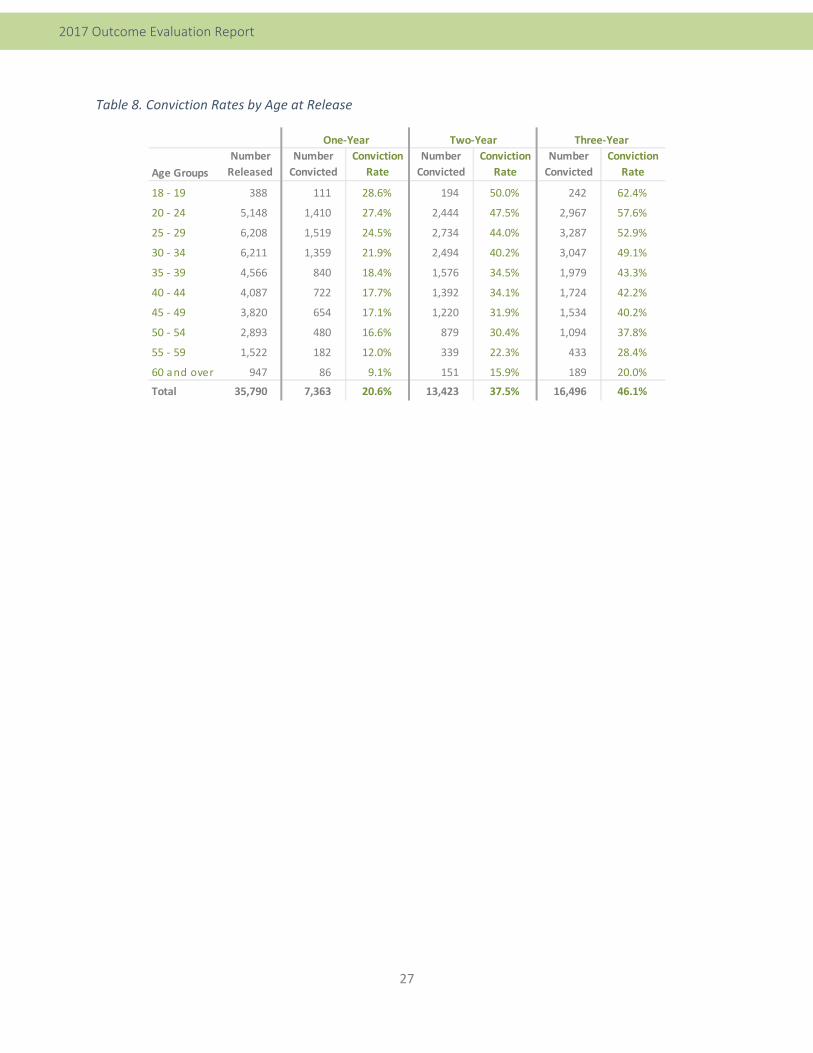
27
2017 Outcome Evaluation Report
Table 8. Conviction Rates by Age at Release
Age Groups
Number
Released
Number
Convicted
Conviction
Rate
Number
Convicted
Conviction
Rate
Number
Convicted
Conviction
Rate
18 ‐ 19 388 111 28.6% 194 50.0% 242 62.4%
20 ‐ 24 5,148 1,410 27.4% 2,444 47.5% 2,967 57.6%
25 ‐ 29 6,208 1,519 24.5% 2,734 44.0% 3,287 52.9%
30 ‐ 34 6,211 1,359 21.9% 2,494 40.2% 3,047 49.1%
35 ‐ 39 4,566 840 18.4% 1,576 34.5% 1,979 43.3%
40 ‐ 44 4,087 722 17.7% 1,392 34.1% 1,724 42.2%
45 ‐ 49 3,820 654 17.1% 1,220 31.9% 1,534 40.2%
50 ‐ 54 2,893 480 16.6% 879 30.4% 1,094 37.8%
55 ‐ 59 1,522 182 12.0% 339 22.3% 433 28.4%
60 and over 947 86 9.1% 151 15.9% 189 20.0%
Total 35,790 7,363 20.6% 13,423 37.5% 16,496 46.1%
One‐Year Two‐Year Three‐Year
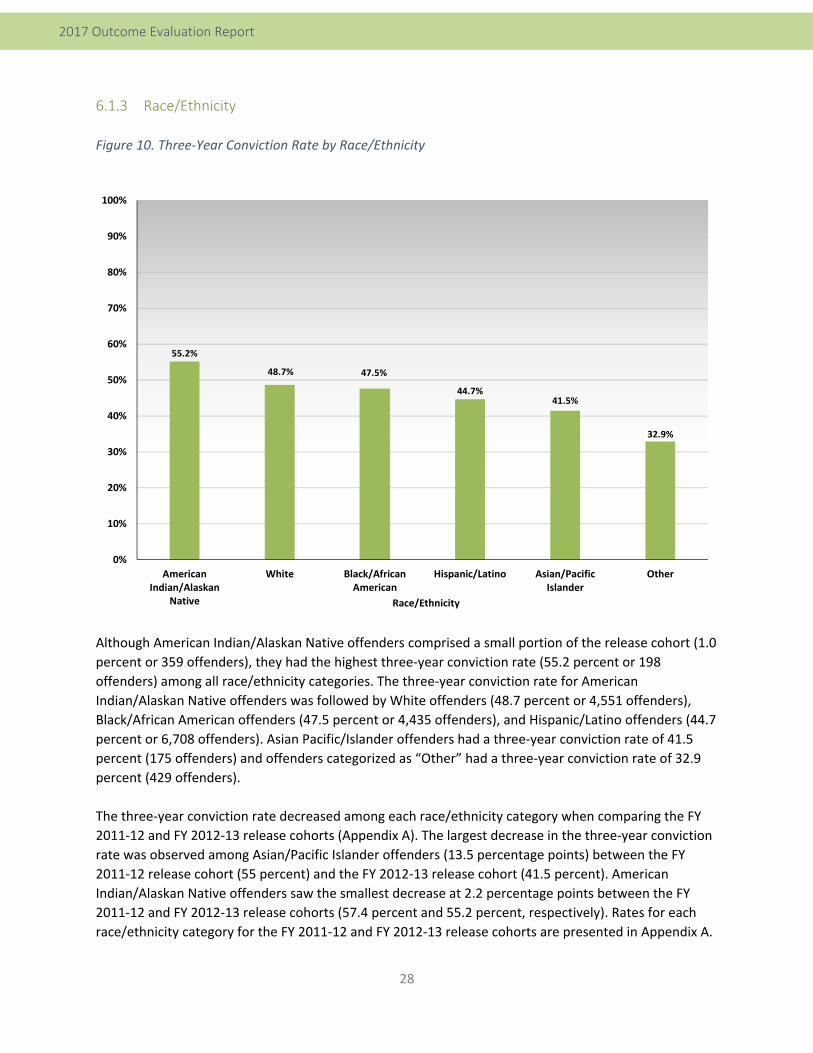
28
2017 Outcome Evaluation Report
6.1.3 Race/Ethnicity
Figure 10. Three‐Year Conviction Rate by Race/Ethnicity
Although American Indian/Alaskan Native offenders comprised a small portion of the release cohort (1.0
percent or 359 offenders), they had the highest three‐year conviction rate (55.2 percent or 198
offenders) among all race/ethnicity categories. The three‐year conviction rate for American
Indian/Alaskan Native offenders was followed by White offenders (48.7 percent or 4,551 offenders),
Black/African American offenders (47.5 percent or 4,435 offenders), and Hispanic/Latino offenders (44.7
percent or 6,708 offenders). Asian Pacific/Islander offenders had a three‐year conviction rate of 41.5
percent (175 offenders) and offenders categorized as “Other” had a three‐year conviction rate of 32.9
percent (429 offenders).
The three‐year conviction rate decreased among each race/ethnicity category when comparing the FY
2011‐12 and FY 2012‐13 release cohorts (Appendix A). The largest decrease in the three‐year conviction
rate was observed among Asian/Pacific Islander offenders (13.5 percentage points) between the FY
2011‐12 release cohort (55 percent) and the FY 2012‐13 release cohort (41.5 percent). American
Indian/Alaskan Native offenders saw the smallest decrease at 2.2 percentage points between the FY
2011‐12 and FY 2012‐13 release cohorts (57.4 percent and 55.2 percent, respectively). Rates for each
race/ethnicity category for the FY 2011‐12 and FY 2012‐13 release cohorts are presented in Appendix A.
55.2%
48.7% 47.5%
44.7% 41.5%
32.9%
0%
10%
20%
30%
40%
50%
60%
70%
80%
90%
100%
AmericanIndian/Alaskan
Native
White Black/AfricanAmerican
Hispanic/Latino Asian/PacificIslander
Other
Race/Ethnicity
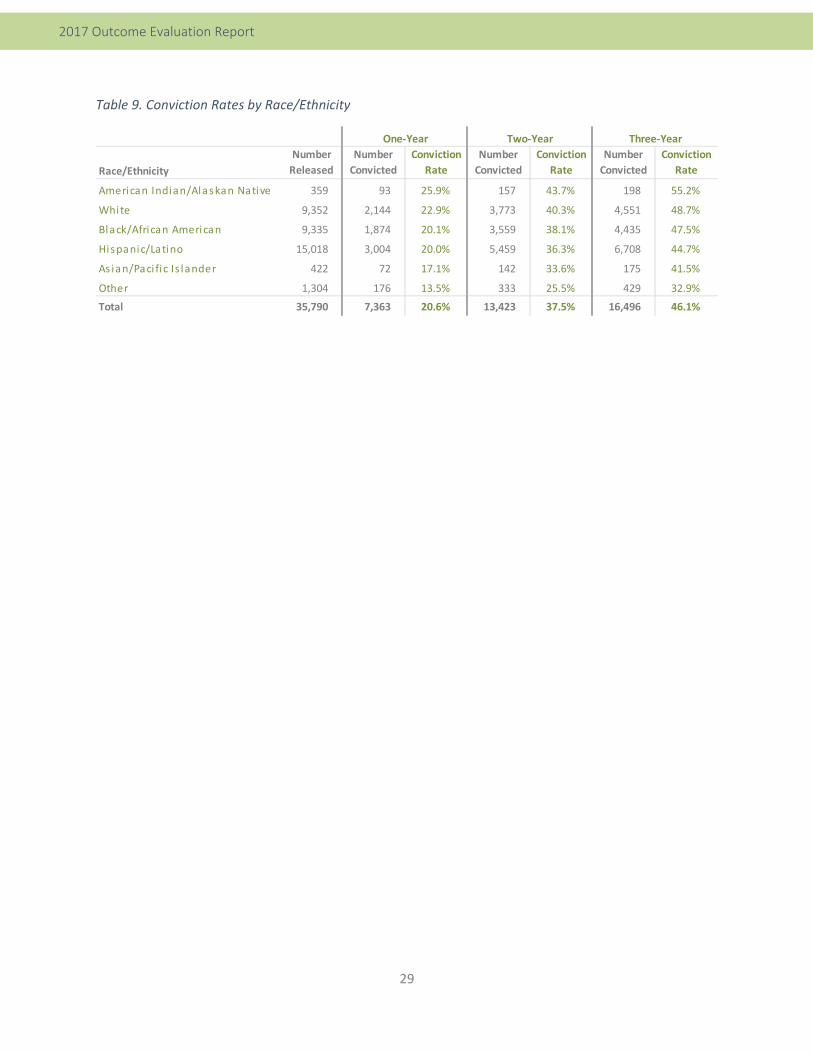
29
2017 Outcome Evaluation Report
Table 9. Conviction Rates by Race/Ethnicity
Race/Ethnicity
Number
Released
Number
Convicted
Conviction
Rate
Number
Convicted
Conviction
Rate
Number
Convicted
Conviction
Rate
American Indian/Alaskan Native 359 93 25.9% 157 43.7% 198 55.2%
White 9,352 2,144 22.9% 3,773 40.3% 4,551 48.7%
Black/African American 9,335 1,874 20.1% 3,559 38.1% 4,435 47.5%
Hispanic/Latino 15,018 3,004 20.0% 5,459 36.3% 6,708 44.7%
As ian/Paci fic Is lander 422 72 17.1% 142 33.6% 175 41.5%
Other 1,304 176 13.5% 333 25.5% 429 32.9%
Total 35,790 7,363 20.6% 13,423 37.5% 16,496 46.1%
One‐Year Two‐Year Three‐Year
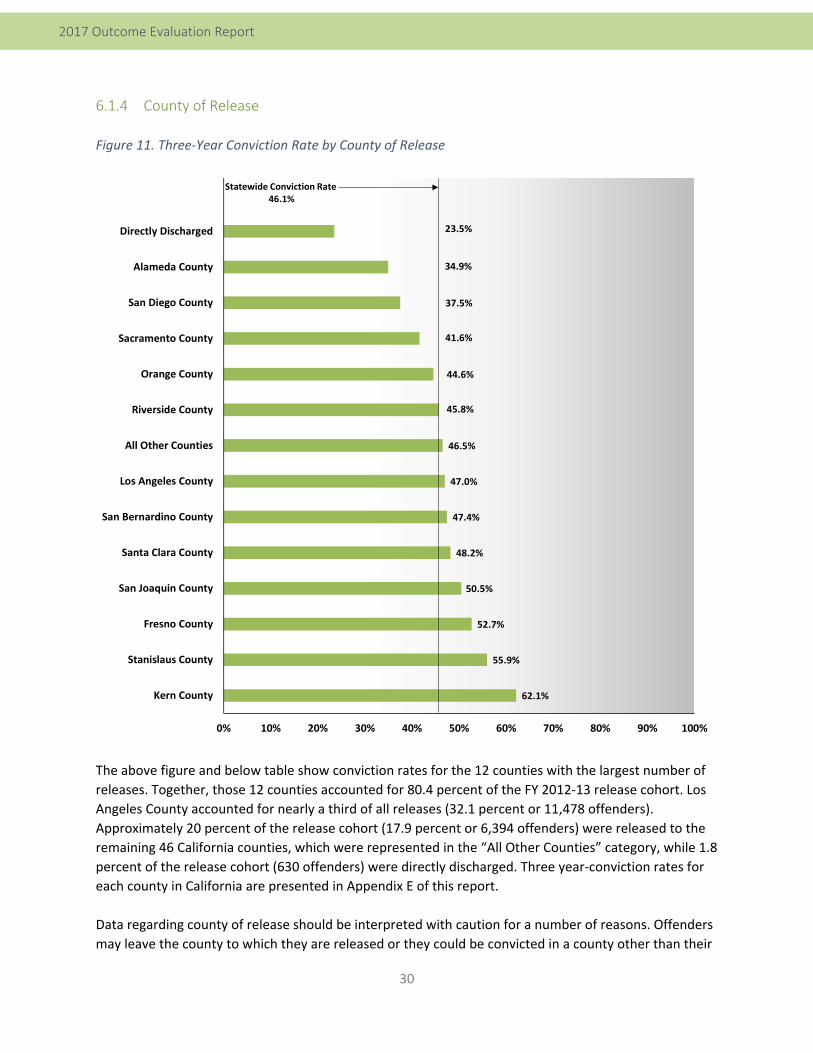
30
2017 Outcome Evaluation Report
6.1.4 County of Release
Figure 11. Three‐Year Conviction Rate by County of Release
The above figure and below table show conviction rates for the 12 counties with the largest number of
releases. Together, those 12 counties accounted for 80.4 percent of the FY 2012‐13 release cohort. Los
Angeles County accounted for nearly a third of all releases (32.1 percent or 11,478 offenders).
Approximately 20 percent of the release cohort (17.9 percent or 6,394 offenders) were released to the
remaining 46 California counties, which were represented in the “All Other Counties” category, while 1.8
percent of the release cohort (630 offenders) were directly discharged. Three year‐conviction rates for
each county in California are presented in Appendix E of this report.
Data regarding county of release should be interpreted with caution for a number of reasons. Offenders
may leave the county to which they are released or they could be convicted in a county other than their
23.5%
34.9%
37.5%
41.6%
44.6%
45.8%
46.5%
47.0%
47.4%
48.2%
50.5%
52.7%
55.9%
62.1%
0% 10% 20% 30% 40% 50% 60% 70% 80% 90% 100%
Directly Discharged
Alameda County
San Diego County
Sacramento County
Orange County
Riverside County
All Other Counties
Los Angeles County
San Bernardino County
Santa Clara County
San Joaquin County
Fresno County
Stanislaus County
Kern County
Statewide Conviction Rate46.1%
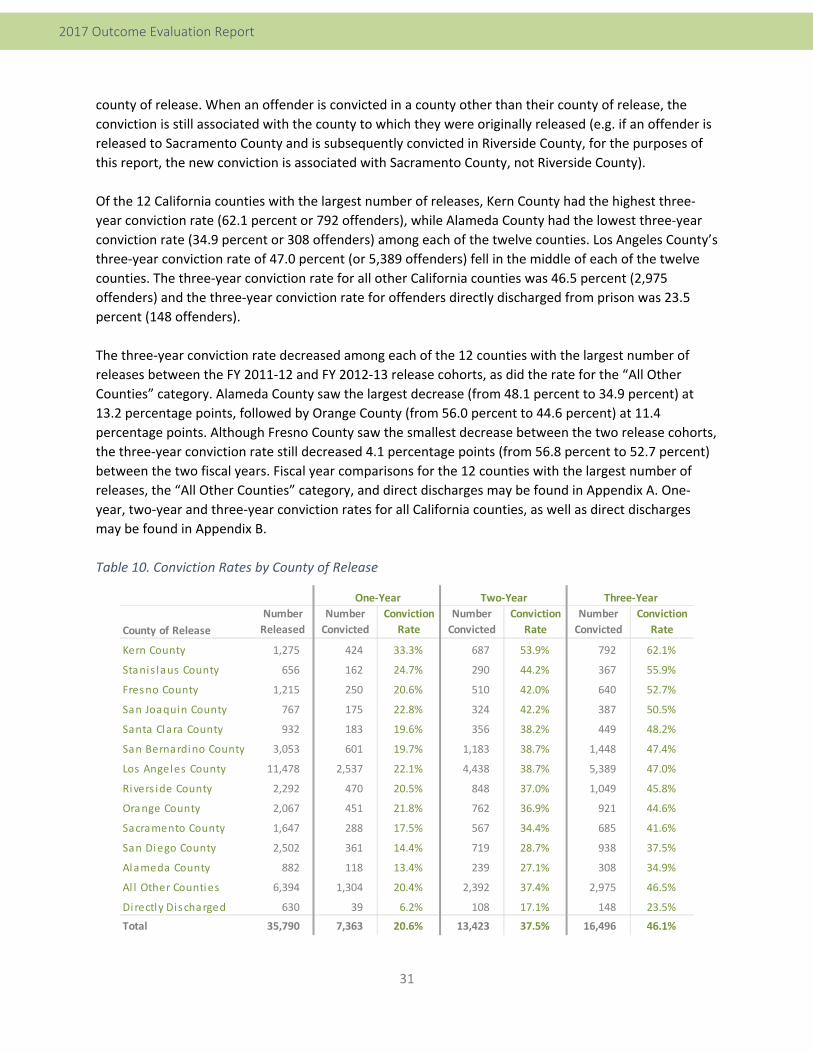
31
2017 Outcome Evaluation Report
county of release. When an offender is convicted in a county other than their county of release, the
conviction is still associated with the county to which they were originally released (e.g. if an offender is
released to Sacramento County and is subsequently convicted in Riverside County, for the purposes of
this report, the new conviction is associated with Sacramento County, not Riverside County).
Of the 12 California counties with the largest number of releases, Kern County had the highest three‐
year conviction rate (62.1 percent or 792 offenders), while Alameda County had the lowest three‐year
conviction rate (34.9 percent or 308 offenders) among each of the twelve counties. Los Angeles County’s
three‐year conviction rate of 47.0 percent (or 5,389 offenders) fell in the middle of each of the twelve
counties. The three‐year conviction rate for all other California counties was 46.5 percent (2,975
offenders) and the three‐year conviction rate for offenders directly discharged from prison was 23.5
percent (148 offenders).
The three‐year conviction rate decreased among each of the 12 counties with the largest number of
releases between the FY 2011‐12 and FY 2012‐13 release cohorts, as did the rate for the “All Other
Counties” category. Alameda County saw the largest decrease (from 48.1 percent to 34.9 percent) at
13.2 percentage points, followed by Orange County (from 56.0 percent to 44.6 percent) at 11.4
percentage points. Although Fresno County saw the smallest decrease between the two release cohorts,
the three‐year conviction rate still decreased 4.1 percentage points (from 56.8 percent to 52.7 percent)
between the two fiscal years. Fiscal year comparisons for the 12 counties with the largest number of
releases, the “All Other Counties” category, and direct discharges may be found in Appendix A. One‐
year, two‐year and three‐year conviction rates for all California counties, as well as direct discharges
may be found in Appendix B.
Table 10. Conviction Rates by County of Release
County of Release
Number
Released
Number
Convicted
Conviction
Rate
Number
Convicted
Conviction
Rate
Number
Convicted
Conviction
Rate
Kern County 1,275 424 33.3% 687 53.9% 792 62.1%
Stanis laus County 656 162 24.7% 290 44.2% 367 55.9%
Fresno County 1,215 250 20.6% 510 42.0% 640 52.7%
San Joaquin County 767 175 22.8% 324 42.2% 387 50.5%
Santa Clara County 932 183 19.6% 356 38.2% 449 48.2%
San Bernardino County 3,053 601 19.7% 1,183 38.7% 1,448 47.4%
Los Angeles County 11,478 2,537 22.1% 4,438 38.7% 5,389 47.0%
Rivers ide County 2,292 470 20.5% 848 37.0% 1,049 45.8%
Orange County 2,067 451 21.8% 762 36.9% 921 44.6%
Sacramento County 1,647 288 17.5% 567 34.4% 685 41.6%
San Diego County 2,502 361 14.4% 719 28.7% 938 37.5%
Alameda County 882 118 13.4% 239 27.1% 308 34.9%
Al l Other Counties 6,394 1,304 20.4% 2,392 37.4% 2,975 46.5%
Directly Discharged 630 39 6.2% 108 17.1% 148 23.5%
Total 35,790 7,363 20.6% 13,423 37.5% 16,496 46.1%
One‐Year Two‐Year Three‐Year
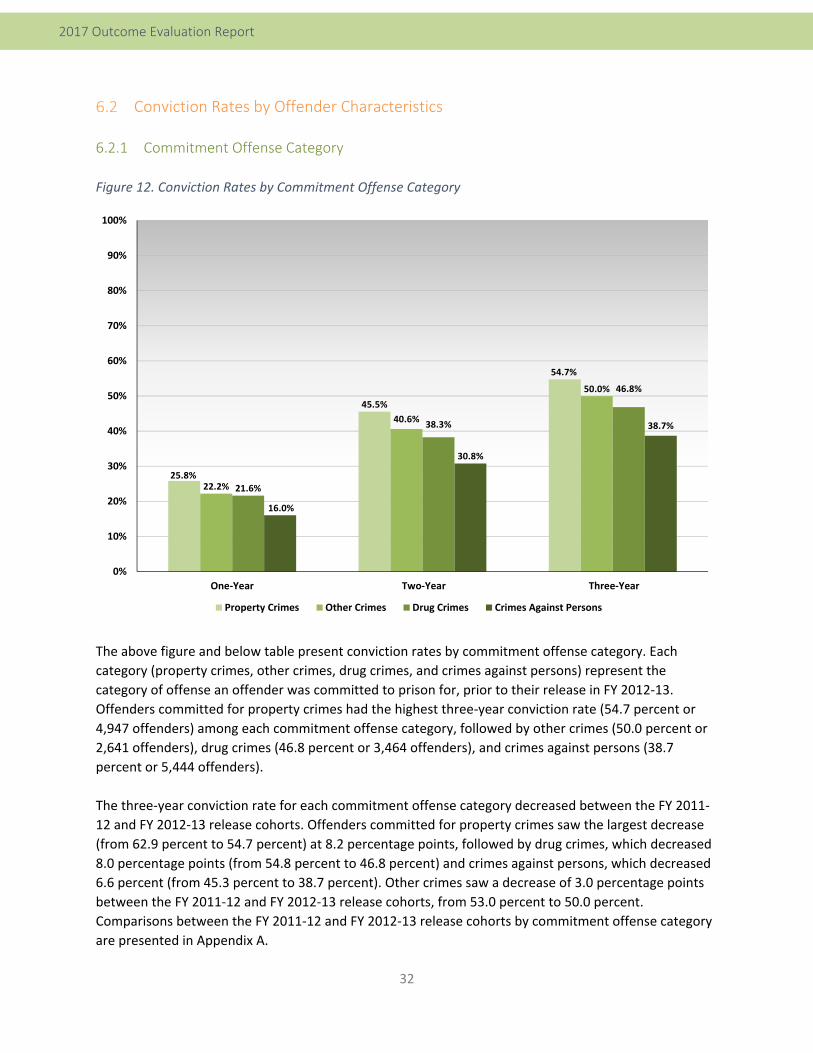
32
2017 Outcome Evaluation Report
Conviction Rates by Offender Characteristics
6.2.1 Commitment Offense Category
Figure 12. Conviction Rates by Commitment Offense Category
The above figure and below table present conviction rates by commitment offense category. Each
category (property crimes, other crimes, drug crimes, and crimes against persons) represent the
category of offense an offender was committed to prison for, prior to their release in FY 2012‐13.
Offenders committed for property crimes had the highest three‐year conviction rate (54.7 percent or
4,947 offenders) among each commitment offense category, followed by other crimes (50.0 percent or
2,641 offenders), drug crimes (46.8 percent or 3,464 offenders), and crimes against persons (38.7
percent or 5,444 offenders).
The three‐year conviction rate for each commitment offense category decreased between the FY 2011‐
12 and FY 2012‐13 release cohorts. Offenders committed for property crimes saw the largest decrease
(from 62.9 percent to 54.7 percent) at 8.2 percentage points, followed by drug crimes, which decreased
8.0 percentage points (from 54.8 percent to 46.8 percent) and crimes against persons, which decreased
6.6 percent (from 45.3 percent to 38.7 percent). Other crimes saw a decrease of 3.0 percentage points
between the FY 2011‐12 and FY 2012‐13 release cohorts, from 53.0 percent to 50.0 percent.
Comparisons between the FY 2011‐12 and FY 2012‐13 release cohorts by commitment offense category
are presented in Appendix A.
25.8%
45.5%
54.7%
22.2%
40.6%
50.0%
21.6%
38.3%
46.8%
16.0%
30.8%
38.7%
0%
10%
20%
30%
40%
50%
60%
70%
80%
90%
100%
One‐Year Two‐Year Three‐Year
Property Crimes Other Crimes Drug Crimes Crimes Against Persons
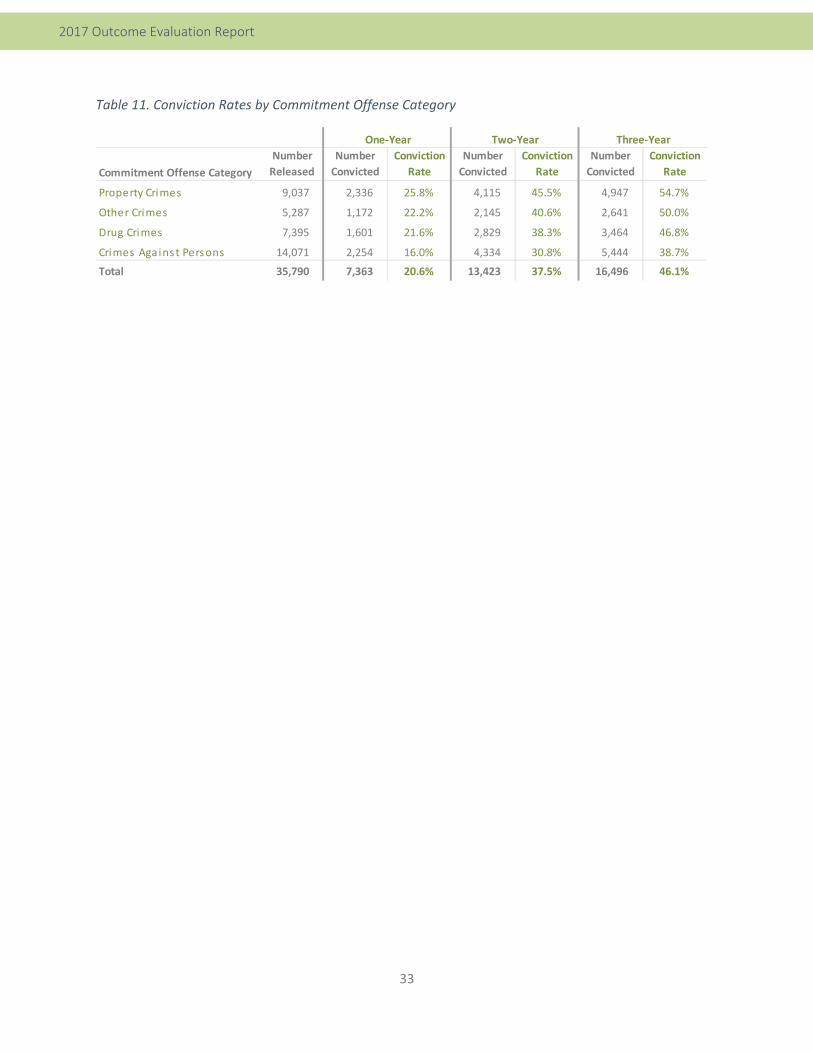
33
2017 Outcome Evaluation Report
Table 11. Conviction Rates by Commitment Offense Category
Commitment Offense Category
Number
Released
Number
Convicted
Conviction
Rate
Number
Convicted
Conviction
Rate
Number
Convicted
Conviction
Rate
Property Crimes 9,037 2,336 25.8% 4,115 45.5% 4,947 54.7%
Other Crimes 5,287 1,172 22.2% 2,145 40.6% 2,641 50.0%
Drug Crimes 7,395 1,601 21.6% 2,829 38.3% 3,464 46.8%
Crimes Against Persons 14,071 2,254 16.0% 4,334 30.8% 5,444 38.7%
Total 35,790 7,363 20.6% 13,423 37.5% 16,496 46.1%
One‐Year Two‐Year Three‐Year
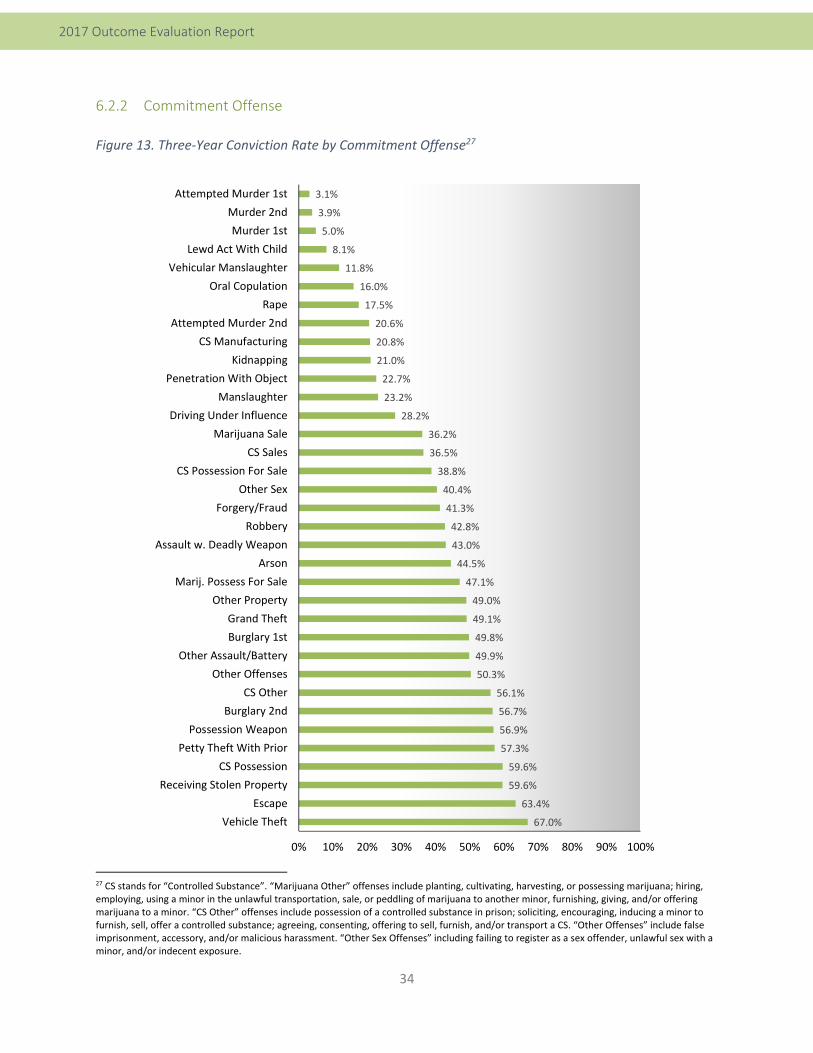
34
2017 Outcome Evaluation Report
6.2.2 Commitment Offense
Figure 13. Three‐Year Conviction Rate by Commitment Offense27
27 CS stands for “Controlled Substance”. “Marijuana Other” offenses include planting, cultivating, harvesting, or possessing marijuana; hiring, employing, using a minor in the unlawful transportation, sale, or peddling of marijuana to another minor, furnishing, giving, and/or offering marijuana to a minor. “CS Other” offenses include possession of a controlled substance in prison; soliciting, encouraging, inducing a minor to furnish, sell, offer a controlled substance; agreeing, consenting, offering to sell, furnish, and/or transport a CS. “Other Offenses” include false imprisonment, accessory, and/or malicious harassment. “Other Sex Offenses” including failing to register as a sex offender, unlawful sex with a minor, and/or indecent exposure.
3.1%
3.9%
5.0%
8.1%
11.8%
16.0%
17.5%
20.6%
20.8%
21.0%
22.7%
23.2%
28.2%
36.2%
36.5%
38.8%
40.4%
41.3%
42.8%
43.0%
44.5%
47.1%
49.0%
49.1%
49.8%
49.9%
50.3%
56.1%
56.7%
56.9%
57.3%
59.6%
59.6%
63.4%
67.0%
0% 10% 20% 30% 40% 50% 60% 70% 80% 90% 100%
Attempted Murder 1st
Murder 2nd
Murder 1st
Lewd Act With Child
Vehicular Manslaughter
Oral Copulation
Rape
Attempted Murder 2nd
CS Manufacturing
Kidnapping
Penetration With Object
Manslaughter
Driving Under Influence
Marijuana Sale
CS Sales
CS Possession For Sale
Other Sex
Forgery/Fraud
Robbery
Assault w. Deadly Weapon
Arson
Marij. Possess For Sale
Other Property
Grand Theft
Burglary 1st
Other Assault/Battery
Other Offenses
CS Other
Burglary 2nd
Possession Weapon
Petty Theft With Prior
CS Possession
Receiving Stolen Property
Escape
Vehicle Theft
35
2017 Outcome Evaluation Report
As shown in Figure 13 and Table 12, the three‐year conviction rate varied extensively when examined by
commitment offense. Offenders with a commitment offense of vehicle theft, escape, receiving stolen
property, and controlled substance possession were associated with higher conviction rates (67.0
percent, 63.4 percent, and 59.6 percent each, respectively) than offenders whose offenses tended to be
more serious and violent. Offenders with a commitment offense of first degree attempted murder,
second degree murder, and first degree murder were convicted at the lowest rates among all
commitment offense categories (3.1 percent, 3.9 percent, and 5.0 percent, respectively). Similar to
offenders committed for escape (41 offenders), offenders committed for first degree attempted murder
comprised a very small portion of the release cohort (32 offenders).
With the exception of five commitment offenses, the three‐year conviction rate decreased for each
commitment offense between the FY 2011‐12 and FY 2012‐13 release cohorts. Of the five commitment
offenses that saw an increase, escape saw the largest increase at 5.5 percentage points (from 57.9
percent to 63.4 percent). Second degree attempted murder saw the largest decrease at 13.9 percentage
points (from 34.5 percent to 20.6 percent). The three‐year conviction rate for offenders released in FY
2011‐12 and FY 2012‐13 by commitment offense are provided in Appendix A.
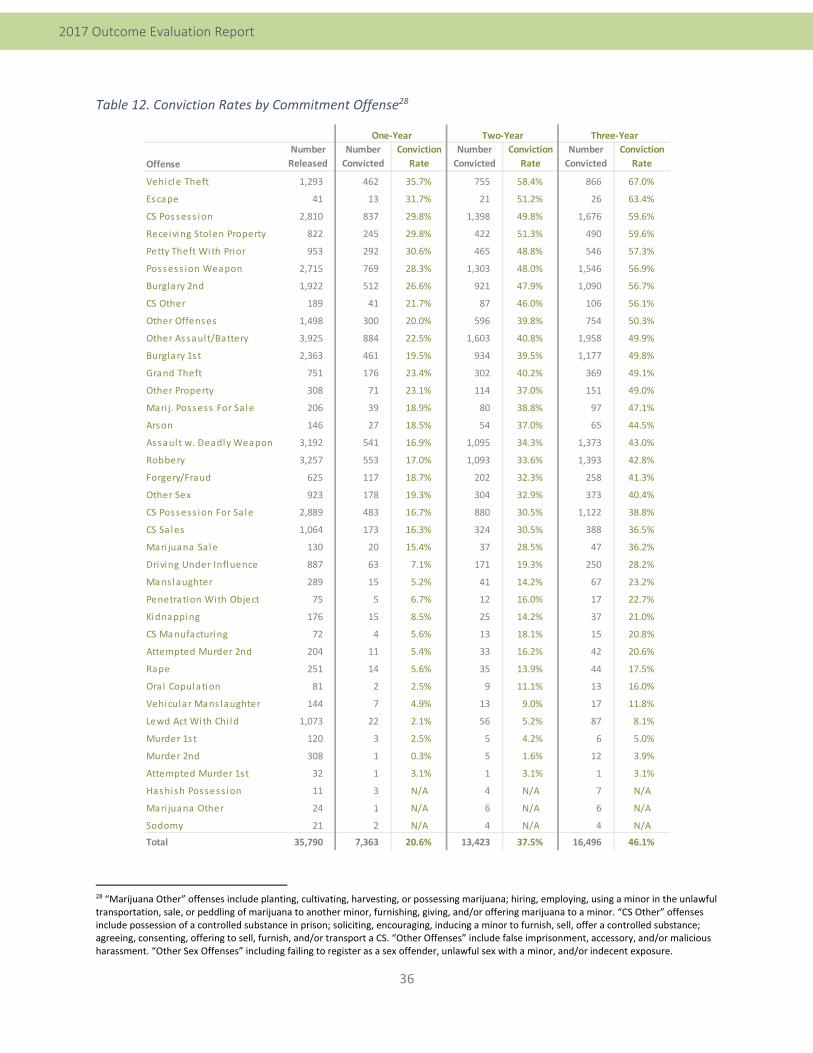
36
2017 Outcome Evaluation Report
Table 12. Conviction Rates by Commitment Offense28
28 “Marijuana Other” offenses include planting, cultivating, harvesting, or possessing marijuana; hiring, employing, using a minor in the unlawful transportation, sale, or peddling of marijuana to another minor, furnishing, giving, and/or offering marijuana to a minor. “CS Other” offenses include possession of a controlled substance in prison; soliciting, encouraging, inducing a minor to furnish, sell, offer a controlled substance; agreeing, consenting, offering to sell, furnish, and/or transport a CS. “Other Offenses” include false imprisonment, accessory, and/or malicious harassment. “Other Sex Offenses” including failing to register as a sex offender, unlawful sex with a minor, and/or indecent exposure.
Offense
Number
Released
Number
Convicted
Conviction
Rate
Number
Convicted
Conviction
Rate
Number
Convicted
Conviction
Rate
Vehicle Theft 1,293 462 35.7% 755 58.4% 866 67.0%
Escape 41 13 31.7% 21 51.2% 26 63.4%
CS Possess ion 2,810 837 29.8% 1,398 49.8% 1,676 59.6%
Receiving Stolen Property 822 245 29.8% 422 51.3% 490 59.6%
Petty Theft With Prior 953 292 30.6% 465 48.8% 546 57.3%
Possess ion Weapon 2,715 769 28.3% 1,303 48.0% 1,546 56.9%
Burglary 2nd 1,922 512 26.6% 921 47.9% 1,090 56.7%
CS Other 189 41 21.7% 87 46.0% 106 56.1%
Other Offenses 1,498 300 20.0% 596 39.8% 754 50.3%
Other Assault/Battery 3,925 884 22.5% 1,603 40.8% 1,958 49.9%
Burglary 1st 2,363 461 19.5% 934 39.5% 1,177 49.8%
Grand Theft 751 176 23.4% 302 40.2% 369 49.1%
Other Property 308 71 23.1% 114 37.0% 151 49.0%
Mari j. Possess For Sale 206 39 18.9% 80 38.8% 97 47.1%
Arson 146 27 18.5% 54 37.0% 65 44.5%
Assault w. Deadly Weapon 3,192 541 16.9% 1,095 34.3% 1,373 43.0%
Robbery 3,257 553 17.0% 1,093 33.6% 1,393 42.8%
Forgery/Fraud 625 117 18.7% 202 32.3% 258 41.3%
Other Sex 923 178 19.3% 304 32.9% 373 40.4%
CS Possess ion For Sale 2,889 483 16.7% 880 30.5% 1,122 38.8%
CS Sales 1,064 173 16.3% 324 30.5% 388 36.5%
Mari juana Sale 130 20 15.4% 37 28.5% 47 36.2%
Driving Under Influence 887 63 7.1% 171 19.3% 250 28.2%
Manslaughter 289 15 5.2% 41 14.2% 67 23.2%
Penetration With Object 75 5 6.7% 12 16.0% 17 22.7%
Kidnapping 176 15 8.5% 25 14.2% 37 21.0%
CS Manufacturing 72 4 5.6% 13 18.1% 15 20.8%
Attempted Murder 2nd 204 11 5.4% 33 16.2% 42 20.6%
Rape 251 14 5.6% 35 13.9% 44 17.5%
Oral Copulation 81 2 2.5% 9 11.1% 13 16.0%
Vehicular Mans laughter 144 7 4.9% 13 9.0% 17 11.8%
Lewd Act With Chi ld 1,073 22 2.1% 56 5.2% 87 8.1%
Murder 1st 120 3 2.5% 5 4.2% 6 5.0%
Murder 2nd 308 1 0.3% 5 1.6% 12 3.9%
Attempted Murder 1st 32 1 3.1% 1 3.1% 1 3.1%
Hashish Possess ion 11 3 N/A 4 N/A 7 N/A
Mari juana Other 24 1 N/A 6 N/A 6 N/A
Sodomy 21 2 N/A 4 N/A 4 N/A
Total 35,790 7,363 20.6% 13,423 37.5% 16,496 46.1%
One‐Year Two‐Year Three‐Year
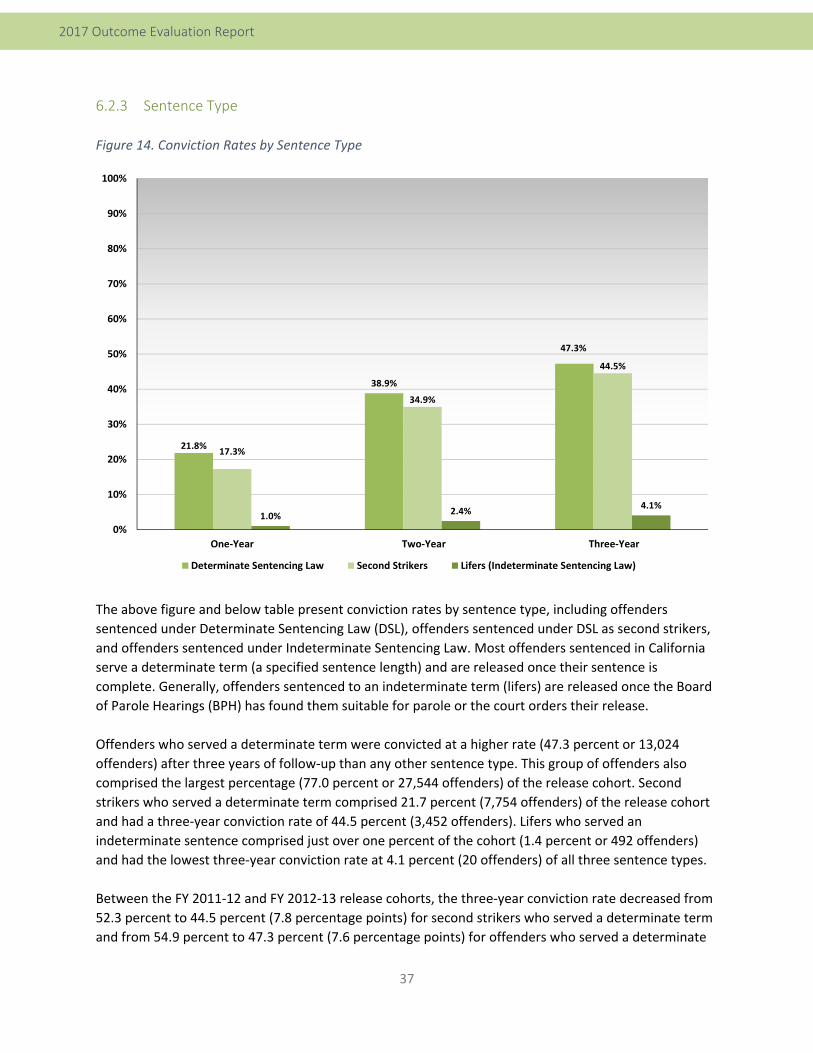
37
2017 Outcome Evaluation Report
6.2.3 Sentence Type
Figure 14. Conviction Rates by Sentence Type
The above figure and below table present conviction rates by sentence type, including offenders
sentenced under Determinate Sentencing Law (DSL), offenders sentenced under DSL as second strikers,
and offenders sentenced under Indeterminate Sentencing Law. Most offenders sentenced in California
serve a determinate term (a specified sentence length) and are released once their sentence is
complete. Generally, offenders sentenced to an indeterminate term (lifers) are released once the Board
of Parole Hearings (BPH) has found them suitable for parole or the court orders their release.
Offenders who served a determinate term were convicted at a higher rate (47.3 percent or 13,024
offenders) after three years of follow‐up than any other sentence type. This group of offenders also
comprised the largest percentage (77.0 percent or 27,544 offenders) of the release cohort. Second
strikers who served a determinate term comprised 21.7 percent (7,754 offenders) of the release cohort
and had a three‐year conviction rate of 44.5 percent (3,452 offenders). Lifers who served an
indeterminate sentence comprised just over one percent of the cohort (1.4 percent or 492 offenders)
and had the lowest three‐year conviction rate at 4.1 percent (20 offenders) of all three sentence types.
Between the FY 2011‐12 and FY 2012‐13 release cohorts, the three‐year conviction rate decreased from
52.3 percent to 44.5 percent (7.8 percentage points) for second strikers who served a determinate term
and from 54.9 percent to 47.3 percent (7.6 percentage points) for offenders who served a determinate
21.8%
38.9%
47.3%
17.3%
34.9%
44.5%
1.0% 2.4% 4.1%
0%
10%
20%
30%
40%
50%
60%
70%
80%
90%
100%
One‐Year Two‐Year Three‐Year
Determinate Sentencing Law Second Strikers Lifers (Indeterminate Sentencing Law)
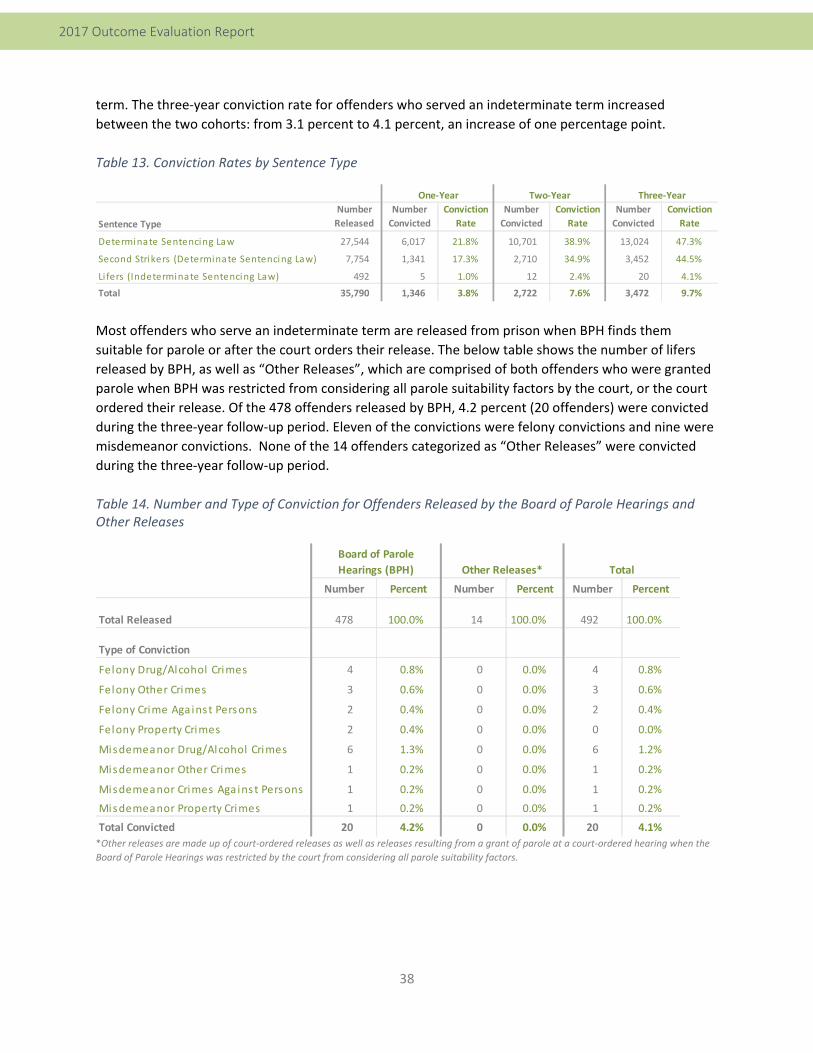
38
2017 Outcome Evaluation Report
term. The three‐year conviction rate for offenders who served an indeterminate term increased
between the two cohorts: from 3.1 percent to 4.1 percent, an increase of one percentage point.
Table 13. Conviction Rates by Sentence Type
Most offenders who serve an indeterminate term are released from prison when BPH finds them
suitable for parole or after the court orders their release. The below table shows the number of lifers
released by BPH, as well as “Other Releases”, which are comprised of both offenders who were granted
parole when BPH was restricted from considering all parole suitability factors by the court, or the court
ordered their release. Of the 478 offenders released by BPH, 4.2 percent (20 offenders) were convicted
during the three‐year follow‐up period. Eleven of the convictions were felony convictions and nine were
misdemeanor convictions. None of the 14 offenders categorized as “Other Releases” were convicted
during the three‐year follow‐up period.
Table 14. Number and Type of Conviction for Offenders Released by the Board of Parole Hearings and Other Releases
*Other releases are made up of court‐ordered releases as well as releases resulting from a grant of parole at a court‐ordered hearing when the
Board of Parole Hearings was restricted by the court from considering all parole suitability factors.
Sentence Type
Number
Released
Number
Convicted
Conviction
Rate
Number
Convicted
Conviction
Rate
Number
Convicted
Conviction
Rate
Determinate Sentencing Law 27,544 6,017 21.8% 10,701 38.9% 13,024 47.3%
Second Strikers (Determinate Sentencing Law) 7,754 1,341 17.3% 2,710 34.9% 3,452 44.5%
Li fers (Indeterminate Sentencing Law) 492 5 1.0% 12 2.4% 20 4.1%
Total 35,790 1,346 3.8% 2,722 7.6% 3,472 9.7%
One‐Year Two‐Year Three‐Year
Number Percent Number Percent Number Percent
Total Released 478 100.0% 14 100.0% 492 100.0%
Type of Conviction
Felony Drug/Alcohol Crimes 4 0.8% 0 0.0% 4 0.8%
Felony Other Crimes 3 0.6% 0 0.0% 3 0.6%
Felony Crime Against Persons 2 0.4% 0 0.0% 2 0.4%
Felony Property Crimes 2 0.4% 0 0.0% 0 0.0%
Misdemeanor Drug/Alcohol Crimes 6 1.3% 0 0.0% 6 1.2%
Misdemeanor Other Crimes 1 0.2% 0 0.0% 1 0.2%
Misdemeanor Crimes Against Persons 1 0.2% 0 0.0% 1 0.2%
Misdemeanor Property Crimes 1 0.2% 0 0.0% 1 0.2%
Total Convicted 20 4.2% 0 0.0% 20 4.1%
Other Releases*
Board of Parole
Hearings (BPH) Total
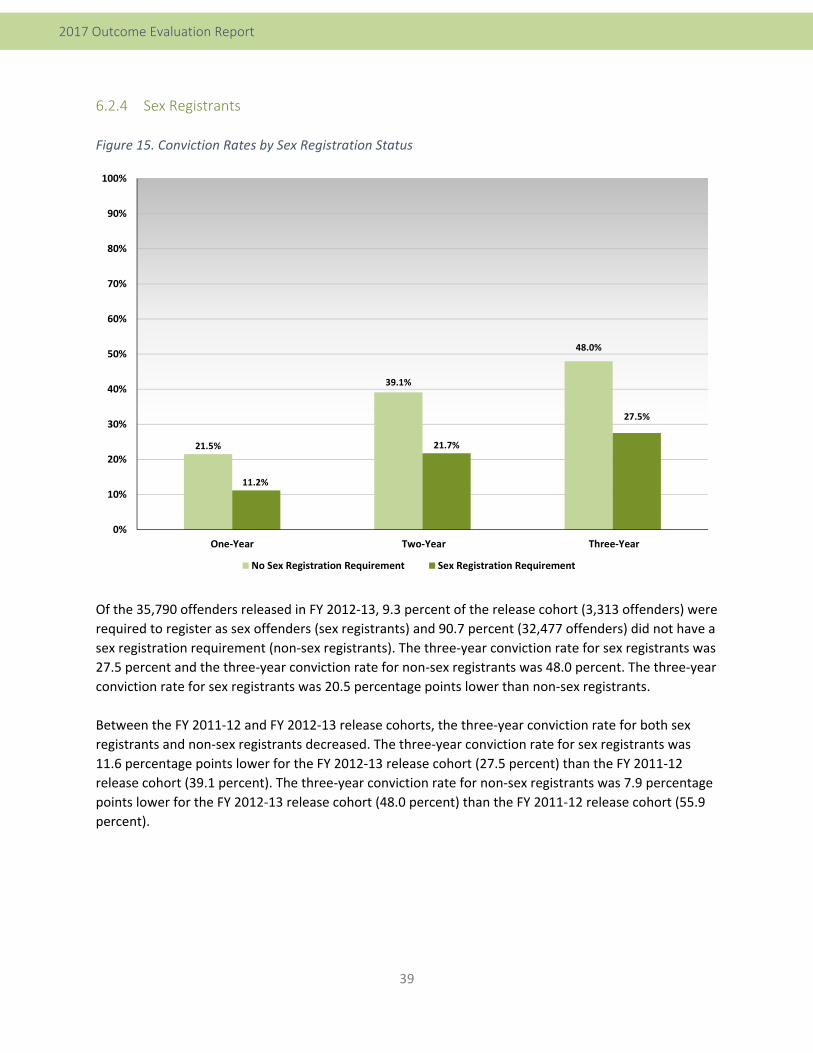
39
2017 Outcome Evaluation Report
6.2.4 Sex Registrants
Figure 15. Conviction Rates by Sex Registration Status
Of the 35,790 offenders released in FY 2012‐13, 9.3 percent of the release cohort (3,313 offenders) were
required to register as sex offenders (sex registrants) and 90.7 percent (32,477 offenders) did not have a
sex registration requirement (non‐sex registrants). The three‐year conviction rate for sex registrants was
27.5 percent and the three‐year conviction rate for non‐sex registrants was 48.0 percent. The three‐year
conviction rate for sex registrants was 20.5 percentage points lower than non‐sex registrants.
Between the FY 2011‐12 and FY 2012‐13 release cohorts, the three‐year conviction rate for both sex
registrants and non‐sex registrants decreased. The three‐year conviction rate for sex registrants was
11.6 percentage points lower for the FY 2012‐13 release cohort (27.5 percent) than the FY 2011‐12
release cohort (39.1 percent). The three‐year conviction rate for non‐sex registrants was 7.9 percentage
points lower for the FY 2012‐13 release cohort (48.0 percent) than the FY 2011‐12 release cohort (55.9
percent).
21.5%
39.1%
48.0%
11.2%
21.7%
27.5%
0%
10%
20%
30%
40%
50%
60%
70%
80%
90%
100%
One‐Year Two‐Year Three‐Year
No Sex Registration Requirement Sex Registration Requirement
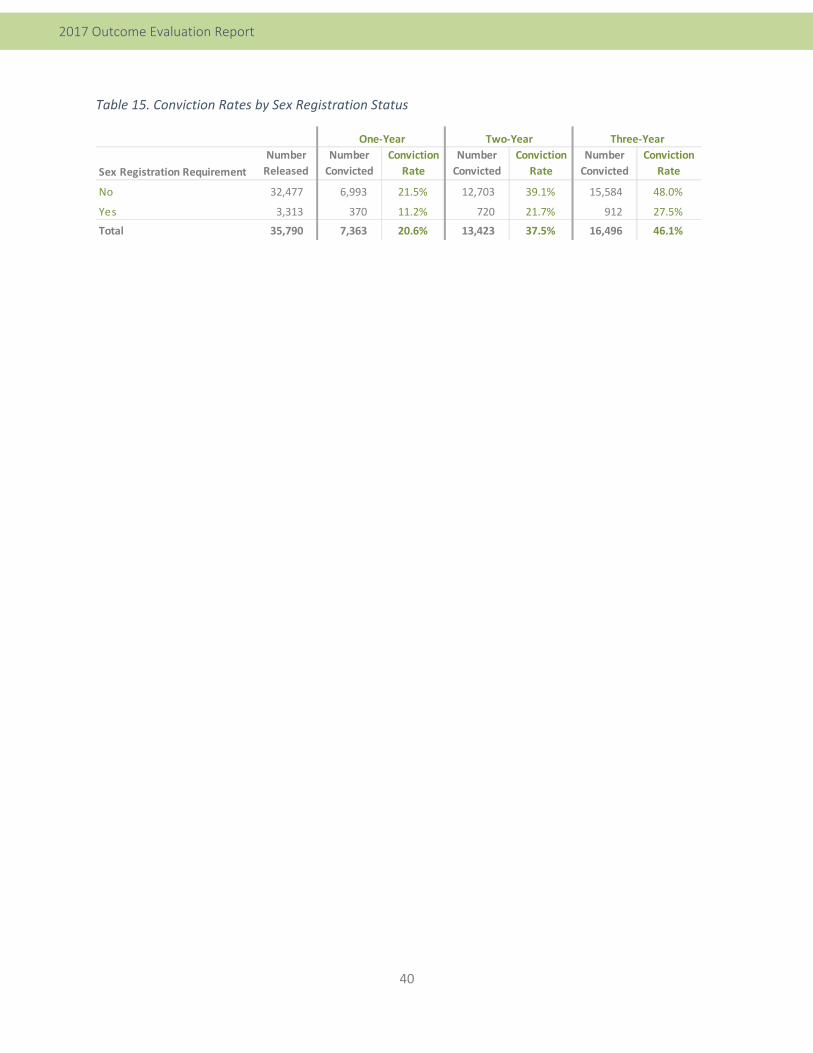
40
2017 Outcome Evaluation Report
Table 15. Conviction Rates by Sex Registration Status
Sex Registration Requirement
Number
Released
Number
Convicted
Conviction
Rate
Number
Convicted
Conviction
Rate
Number
Convicted
Conviction
Rate
No 32,477 6,993 21.5% 12,703 39.1% 15,584 48.0%
Yes 3,313 370 11.2% 720 21.7% 912 27.5%
Total 35,790 7,363 20.6% 13,423 37.5% 16,496 46.1%
One‐Year Two‐Year Three‐Year
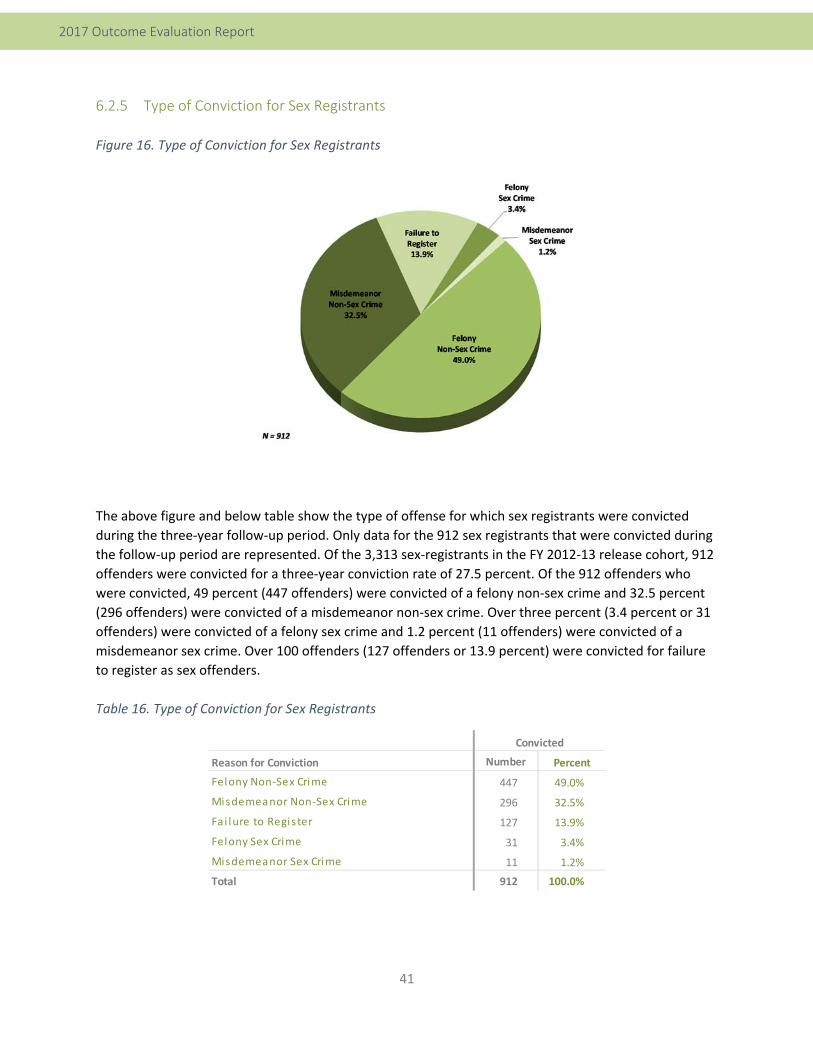
41
2017 Outcome Evaluation Report
6.2.5 Type of Conviction for Sex Registrants
Figure 16. Type of Conviction for Sex Registrants
The above figure and below table show the type of offense for which sex registrants were convicted
during the three‐year follow‐up period. Only data for the 912 sex registrants that were convicted during
the follow‐up period are represented. Of the 3,313 sex‐registrants in the FY 2012‐13 release cohort, 912
offenders were convicted for a three‐year conviction rate of 27.5 percent. Of the 912 offenders who
were convicted, 49 percent (447 offenders) were convicted of a felony non‐sex crime and 32.5 percent
(296 offenders) were convicted of a misdemeanor non‐sex crime. Over three percent (3.4 percent or 31
offenders) were convicted of a felony sex crime and 1.2 percent (11 offenders) were convicted of a
misdemeanor sex crime. Over 100 offenders (127 offenders or 13.9 percent) were convicted for failure
to register as sex offenders.
Table 16. Type of Conviction for Sex Registrants
Reason for Conviction Number Percent
Felony Non‐Sex Crime 447 49.0%
Misdemeanor Non‐Sex Crime 296 32.5%
Fai lure to Regis ter 127 13.9%
Felony Sex Crime 31 3.4%
Misdemeanor Sex Crime 11 1.2%
Total 912 100.0%
Convicted
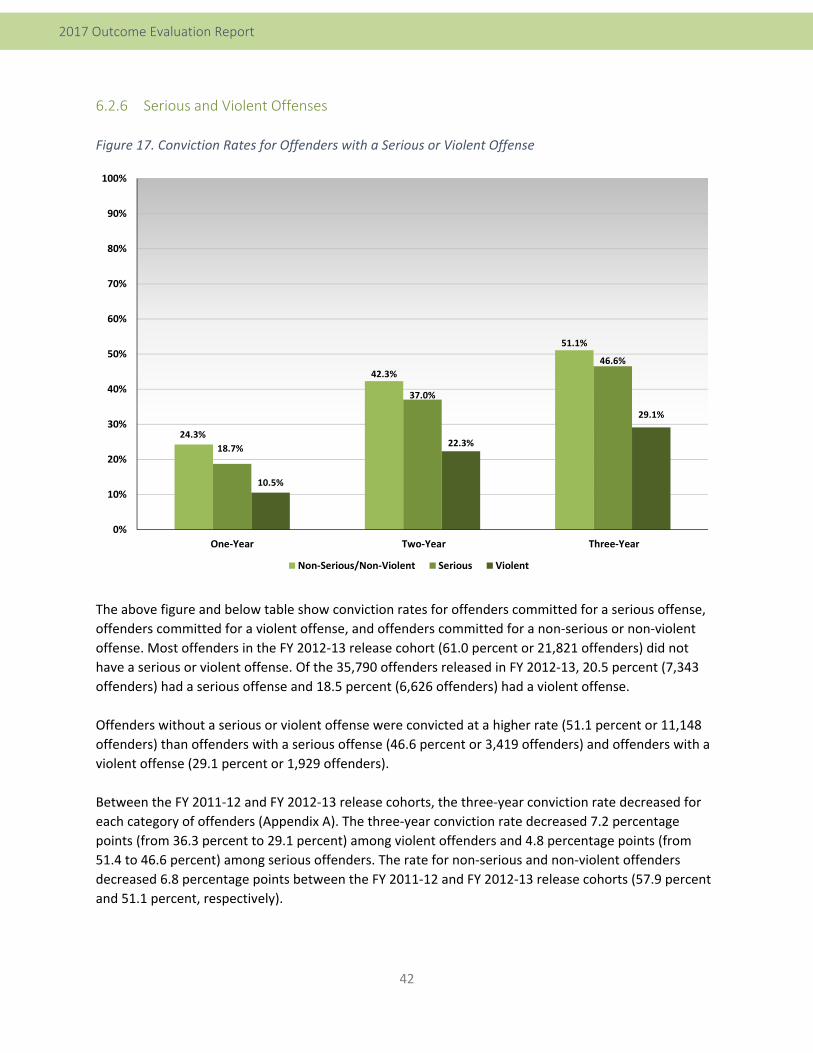
42
2017 Outcome Evaluation Report
6.2.6 Serious and Violent Offenses
Figure 17. Conviction Rates for Offenders with a Serious or Violent Offense
The above figure and below table show conviction rates for offenders committed for a serious offense,
offenders committed for a violent offense, and offenders committed for a non‐serious or non‐violent
offense. Most offenders in the FY 2012‐13 release cohort (61.0 percent or 21,821 offenders) did not
have a serious or violent offense. Of the 35,790 offenders released in FY 2012‐13, 20.5 percent (7,343
offenders) had a serious offense and 18.5 percent (6,626 offenders) had a violent offense.
Offenders without a serious or violent offense were convicted at a higher rate (51.1 percent or 11,148
offenders) than offenders with a serious offense (46.6 percent or 3,419 offenders) and offenders with a
violent offense (29.1 percent or 1,929 offenders).
Between the FY 2011‐12 and FY 2012‐13 release cohorts, the three‐year conviction rate decreased for
each category of offenders (Appendix A). The three‐year conviction rate decreased 7.2 percentage
points (from 36.3 percent to 29.1 percent) among violent offenders and 4.8 percentage points (from
51.4 to 46.6 percent) among serious offenders. The rate for non‐serious and non‐violent offenders
decreased 6.8 percentage points between the FY 2011‐12 and FY 2012‐13 release cohorts (57.9 percent
and 51.1 percent, respectively).
24.3%
42.3%
51.1%
18.7%
37.0%
46.6%
10.5%
22.3%
29.1%
0%
10%
20%
30%
40%
50%
60%
70%
80%
90%
100%
One‐Year Two‐Year Three‐Year
Non‐Serious/Non‐Violent Serious Violent
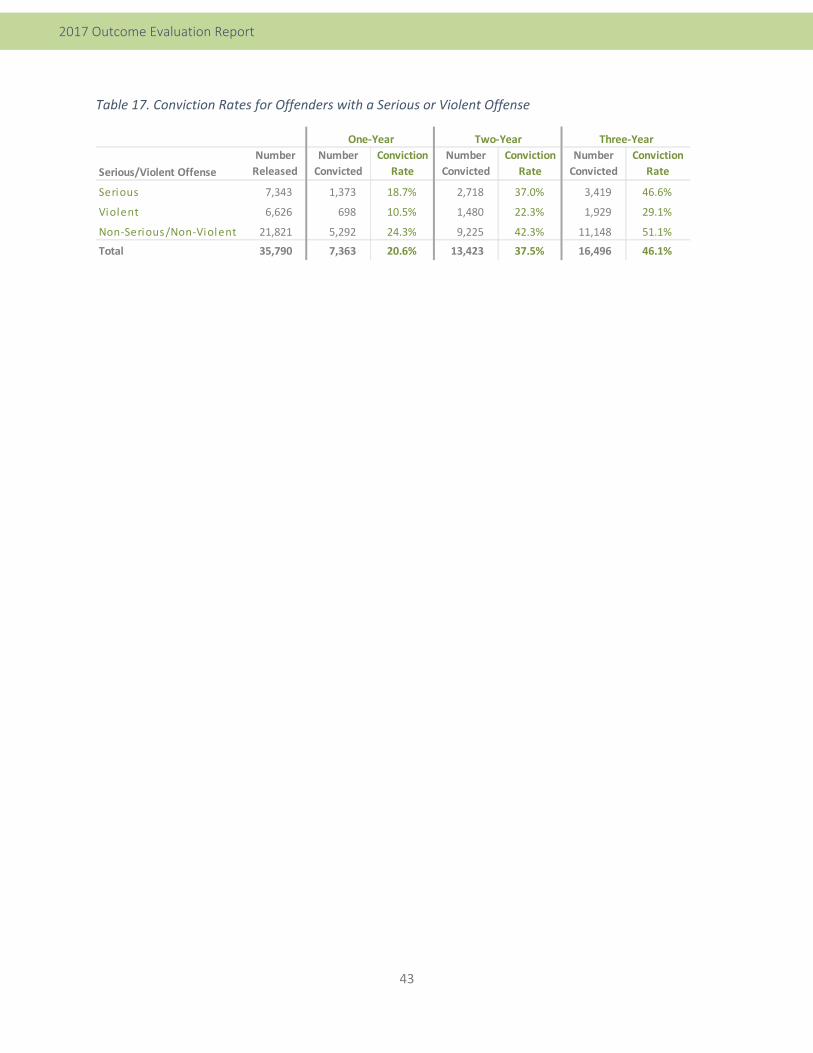
43
2017 Outcome Evaluation Report
Table 17. Conviction Rates for Offenders with a Serious or Violent Offense
Serious/Violent Offense
Number
Released
Number
Convicted
Conviction
Rate
Number
Convicted
Conviction
Rate
Number
Convicted
Conviction
Rate
Serious 7,343 1,373 18.7% 2,718 37.0% 3,419 46.6%
Violent 6,626 698 10.5% 1,480 22.3% 1,929 29.1%
Non‐Serious/Non‐Violent 21,821 5,292 24.3% 9,225 42.3% 11,148 51.1%
Total 35,790 7,363 20.6% 13,423 37.5% 16,496 46.1%
One‐Year Two‐Year Three‐Year
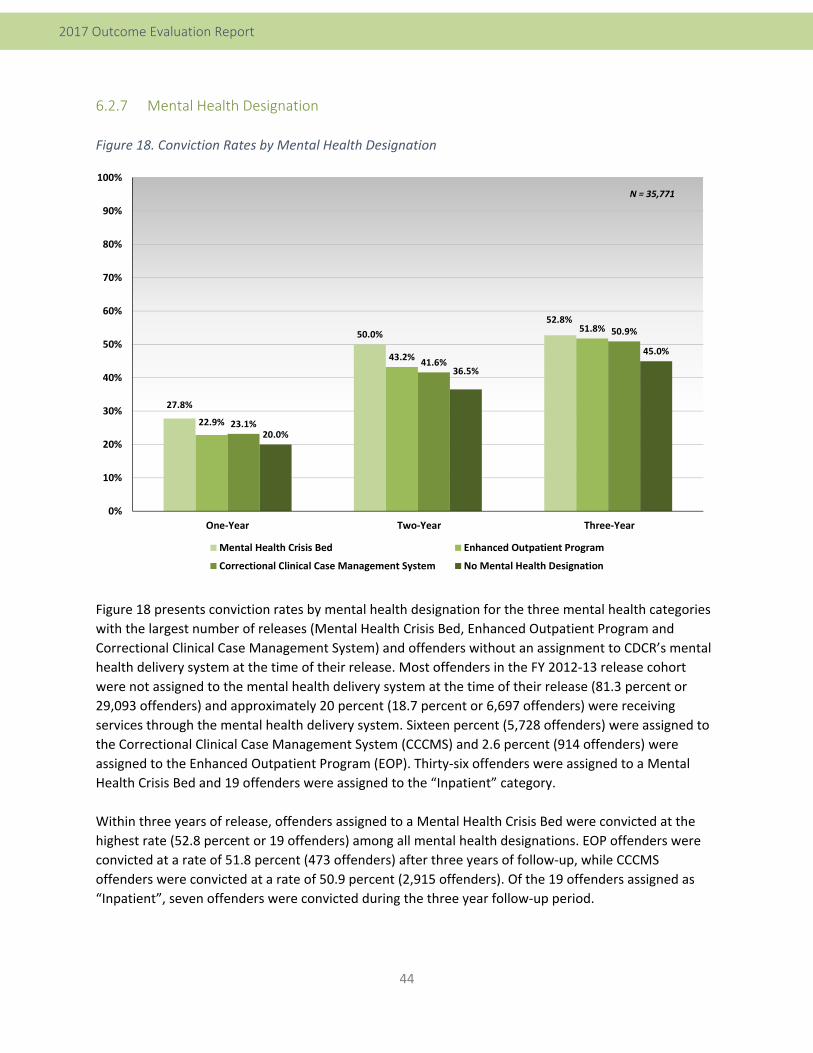
44
2017 Outcome Evaluation Report
6.2.7 Mental Health Designation
Figure 18. Conviction Rates by Mental Health Designation
Figure 18 presents conviction rates by mental health designation for the three mental health categories
with the largest number of releases (Mental Health Crisis Bed, Enhanced Outpatient Program and
Correctional Clinical Case Management System) and offenders without an assignment to CDCR’s mental
health delivery system at the time of their release. Most offenders in the FY 2012‐13 release cohort
were not assigned to the mental health delivery system at the time of their release (81.3 percent or
29,093 offenders) and approximately 20 percent (18.7 percent or 6,697 offenders) were receiving
services through the mental health delivery system. Sixteen percent (5,728 offenders) were assigned to
the Correctional Clinical Case Management System (CCCMS) and 2.6 percent (914 offenders) were
assigned to the Enhanced Outpatient Program (EOP). Thirty‐six offenders were assigned to a Mental
Health Crisis Bed and 19 offenders were assigned to the “Inpatient” category.
Within three years of release, offenders assigned to a Mental Health Crisis Bed were convicted at the
highest rate (52.8 percent or 19 offenders) among all mental health designations. EOP offenders were
convicted at a rate of 51.8 percent (473 offenders) after three years of follow‐up, while CCCMS
offenders were convicted at a rate of 50.9 percent (2,915 offenders). Of the 19 offenders assigned as
“Inpatient”, seven offenders were convicted during the three year follow‐up period.
27.8%
50.0%
52.8%
22.9%
43.2%
51.8%
23.1%
41.6%
50.9%
20.0%
36.5%
45.0%
0%
10%
20%
30%
40%
50%
60%
70%
80%
90%
100%
One‐Year Two‐Year Three‐Year
Mental Health Crisis Bed Enhanced Outpatient Program
Correctional Clinical Case Management System No Mental Health Designation
N = 35,771
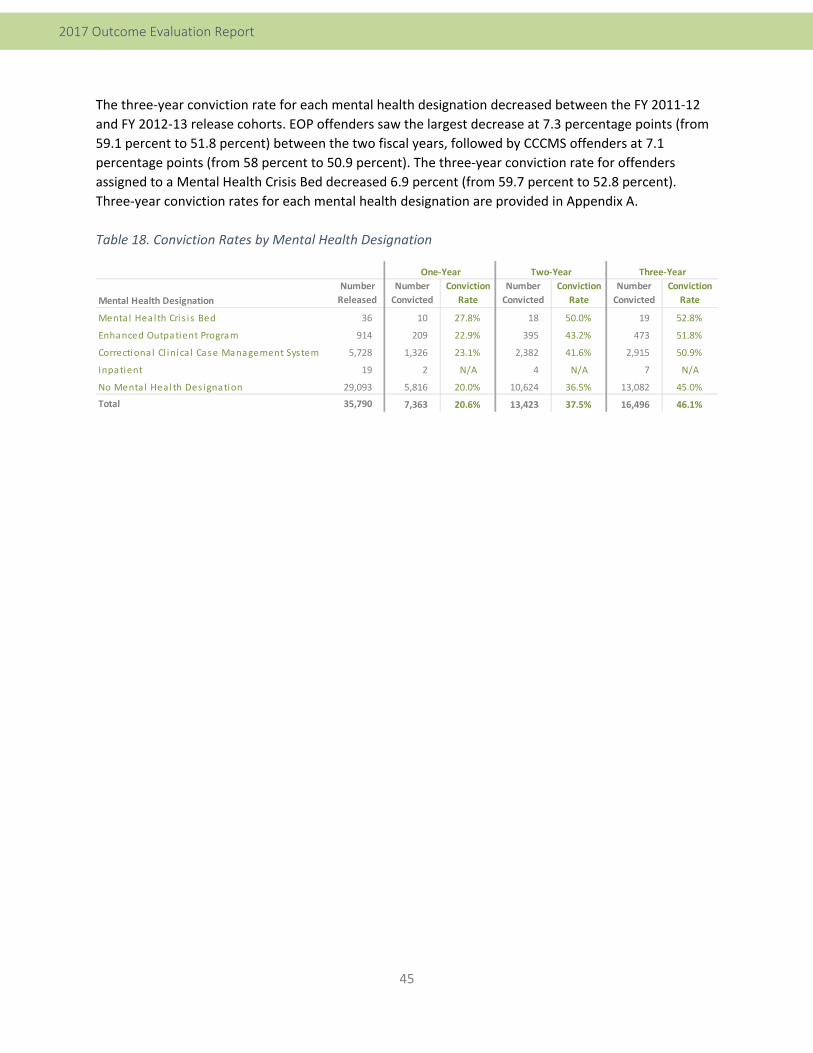
45
2017 Outcome Evaluation Report
The three‐year conviction rate for each mental health designation decreased between the FY 2011‐12
and FY 2012‐13 release cohorts. EOP offenders saw the largest decrease at 7.3 percentage points (from
59.1 percent to 51.8 percent) between the two fiscal years, followed by CCCMS offenders at 7.1
percentage points (from 58 percent to 50.9 percent). The three‐year conviction rate for offenders
assigned to a Mental Health Crisis Bed decreased 6.9 percent (from 59.7 percent to 52.8 percent).
Three‐year conviction rates for each mental health designation are provided in Appendix A.
Table 18. Conviction Rates by Mental Health Designation
Mental Health Designation
Number
Released
Number
Convicted
Conviction
Rate
Number
Convicted
Conviction
Rate
Number
Convicted
Conviction
Rate
Mental Health Cris i s Bed 36 10 27.8% 18 50.0% 19 52.8%
Enhanced Outpatient Program 914 209 22.9% 395 43.2% 473 51.8%
Correctional Cl inica l Case Management System 5,728 1,326 23.1% 2,382 41.6% 2,915 50.9%
Inpatient 19 2 N/A 4 N/A 7 N/A
No Mental Heal th Des ignation 29,093 5,816 20.0% 10,624 36.5% 13,082 45.0%
Total 35,790 7,363 20.6% 13,423 37.5% 16,496 46.1%
One‐Year Two‐Year Three‐Year
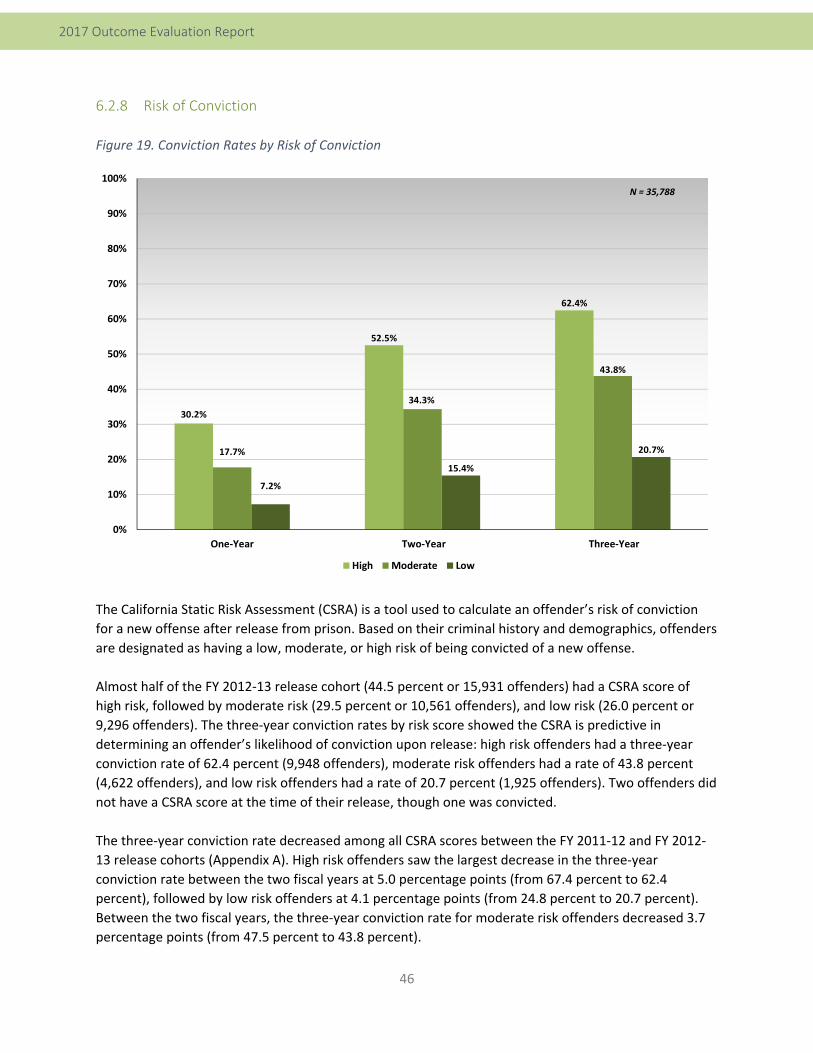
46
2017 Outcome Evaluation Report
6.2.8 Risk of Conviction
Figure 19. Conviction Rates by Risk of Conviction
The California Static Risk Assessment (CSRA) is a tool used to calculate an offender’s risk of conviction
for a new offense after release from prison. Based on their criminal history and demographics, offenders
are designated as having a low, moderate, or high risk of being convicted of a new offense.
Almost half of the FY 2012‐13 release cohort (44.5 percent or 15,931 offenders) had a CSRA score of
high risk, followed by moderate risk (29.5 percent or 10,561 offenders), and low risk (26.0 percent or
9,296 offenders). The three‐year conviction rates by risk score showed the CSRA is predictive in
determining an offender’s likelihood of conviction upon release: high risk offenders had a three‐year
conviction rate of 62.4 percent (9,948 offenders), moderate risk offenders had a rate of 43.8 percent
(4,622 offenders), and low risk offenders had a rate of 20.7 percent (1,925 offenders). Two offenders did
not have a CSRA score at the time of their release, though one was convicted.
The three‐year conviction rate decreased among all CSRA scores between the FY 2011‐12 and FY 2012‐
13 release cohorts (Appendix A). High risk offenders saw the largest decrease in the three‐year
conviction rate between the two fiscal years at 5.0 percentage points (from 67.4 percent to 62.4
percent), followed by low risk offenders at 4.1 percentage points (from 24.8 percent to 20.7 percent).
Between the two fiscal years, the three‐year conviction rate for moderate risk offenders decreased 3.7
percentage points (from 47.5 percent to 43.8 percent).
30.2%
52.5%
62.4%
17.7%
34.3%
43.8%
7.2%
15.4%
20.7%
0%
10%
20%
30%
40%
50%
60%
70%
80%
90%
100%
One‐Year Two‐Year Three‐Year
High Moderate Low
N = 35,788
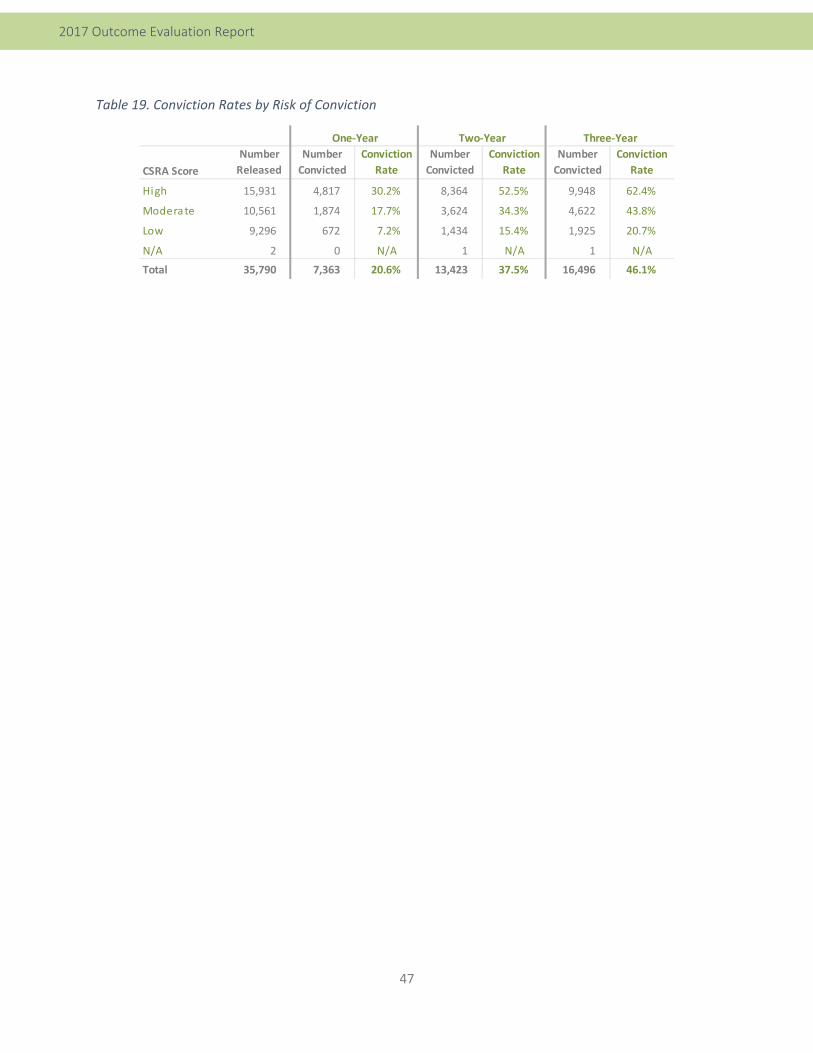
47
2017 Outcome Evaluation Report
Table 19. Conviction Rates by Risk of Conviction
CSRA Score
Number
Released
Number
Convicted
Conviction
Rate
Number
Convicted
Conviction
Rate
Number
Convicted
Conviction
Rate
High 15,931 4,817 30.2% 8,364 52.5% 9,948 62.4%
Moderate 10,561 1,874 17.7% 3,624 34.3% 4,622 43.8%
Low 9,296 672 7.2% 1,434 15.4% 1,925 20.7%
N/A 2 0 N/A 1 N/A 1 N/A
Total 35,790 7,363 20.6% 13,423 37.5% 16,496 46.1%
One‐Year Two‐Year Three‐Year
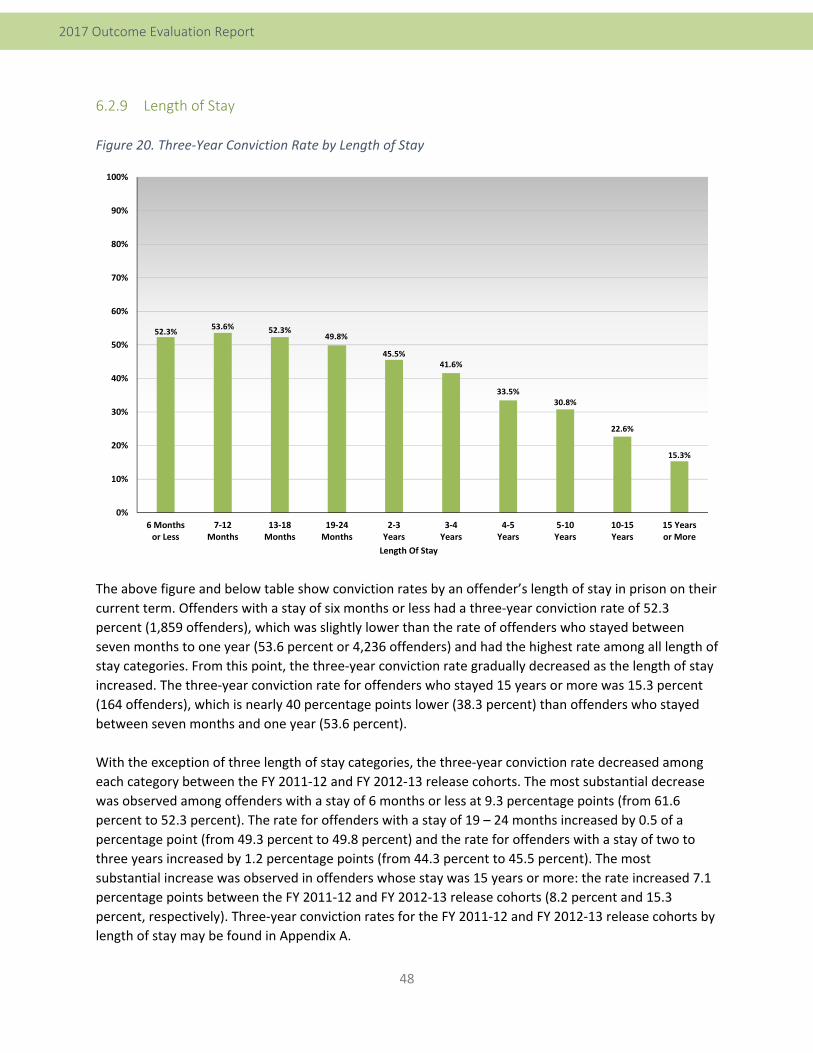
48
2017 Outcome Evaluation Report
6.2.9 Length of Stay
Figure 20. Three‐Year Conviction Rate by Length of Stay
The above figure and below table show conviction rates by an offender’s length of stay in prison on their
current term. Offenders with a stay of six months or less had a three‐year conviction rate of 52.3
percent (1,859 offenders), which was slightly lower than the rate of offenders who stayed between
seven months to one year (53.6 percent or 4,236 offenders) and had the highest rate among all length of
stay categories. From this point, the three‐year conviction rate gradually decreased as the length of stay
increased. The three‐year conviction rate for offenders who stayed 15 years or more was 15.3 percent
(164 offenders), which is nearly 40 percentage points lower (38.3 percent) than offenders who stayed
between seven months and one year (53.6 percent).
With the exception of three length of stay categories, the three‐year conviction rate decreased among
each category between the FY 2011‐12 and FY 2012‐13 release cohorts. The most substantial decrease
was observed among offenders with a stay of 6 months or less at 9.3 percentage points (from 61.6
percent to 52.3 percent). The rate for offenders with a stay of 19 – 24 months increased by 0.5 of a
percentage point (from 49.3 percent to 49.8 percent) and the rate for offenders with a stay of two to
three years increased by 1.2 percentage points (from 44.3 percent to 45.5 percent). The most
substantial increase was observed in offenders whose stay was 15 years or more: the rate increased 7.1
percentage points between the FY 2011‐12 and FY 2012‐13 release cohorts (8.2 percent and 15.3
percent, respectively). Three‐year conviction rates for the FY 2011‐12 and FY 2012‐13 release cohorts by
length of stay may be found in Appendix A.
52.3% 53.6% 52.3%
49.8%
45.5% 41.6%
33.5% 30.8%
22.6%
15.3%
0%
10%
20%
30%
40%
50%
60%
70%
80%
90%
100%
6 Monthsor Less
7‐12Months
13‐18Months
19‐24Months
2‐3Years
3‐4Years
4‐5Years
5‐10Years
10‐15Years
15 Yearsor More
Length Of Stay
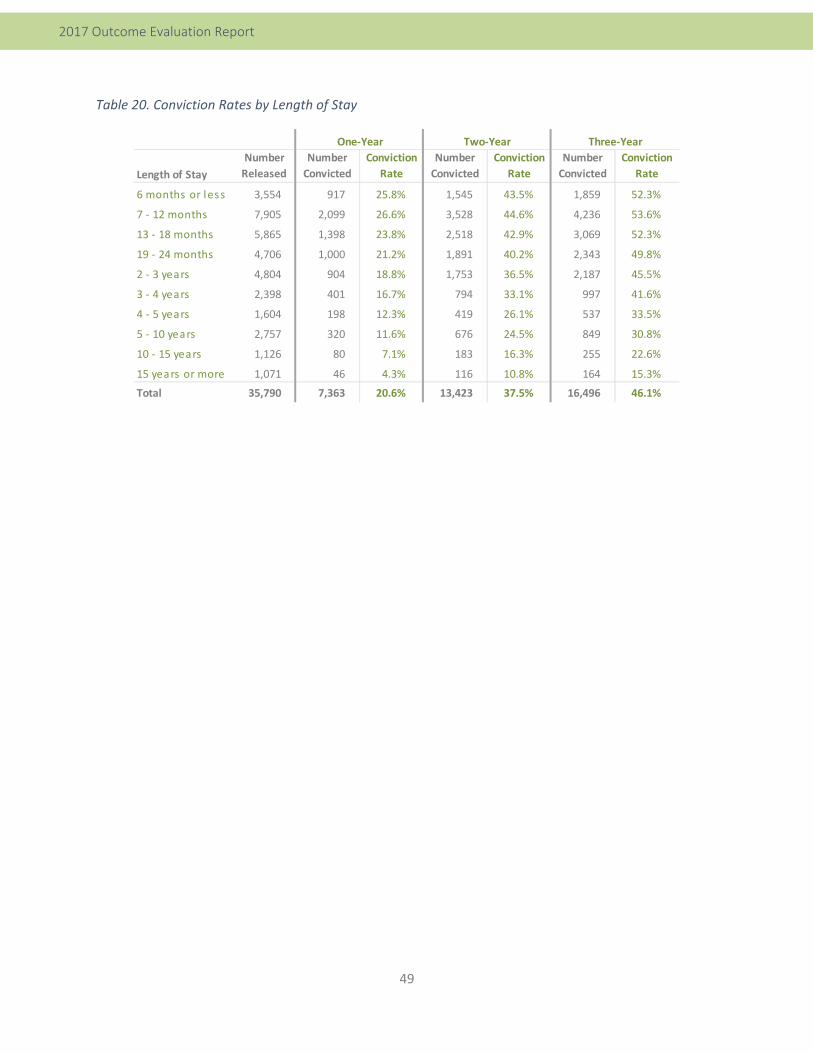
49
2017 Outcome Evaluation Report
Table 20. Conviction Rates by Length of Stay
Length of Stay
Number
Released
Number
Convicted
Conviction
Rate
Number
Convicted
Conviction
Rate
Number
Convicted
Conviction
Rate
6 months or less 3,554 917 25.8% 1,545 43.5% 1,859 52.3%
7 ‐ 12 months 7,905 2,099 26.6% 3,528 44.6% 4,236 53.6%
13 ‐ 18 months 5,865 1,398 23.8% 2,518 42.9% 3,069 52.3%
19 ‐ 24 months 4,706 1,000 21.2% 1,891 40.2% 2,343 49.8%
2 ‐ 3 years 4,804 904 18.8% 1,753 36.5% 2,187 45.5%
3 ‐ 4 years 2,398 401 16.7% 794 33.1% 997 41.6%
4 ‐ 5 years 1,604 198 12.3% 419 26.1% 537 33.5%
5 ‐ 10 years 2,757 320 11.6% 676 24.5% 849 30.8%
10 ‐ 15 years 1,126 80 7.1% 183 16.3% 255 22.6%
15 years or more 1,071 46 4.3% 116 10.8% 164 15.3%
Total 35,790 7,363 20.6% 13,423 37.5% 16,496 46.1%
One‐Year Two‐Year Three‐Year
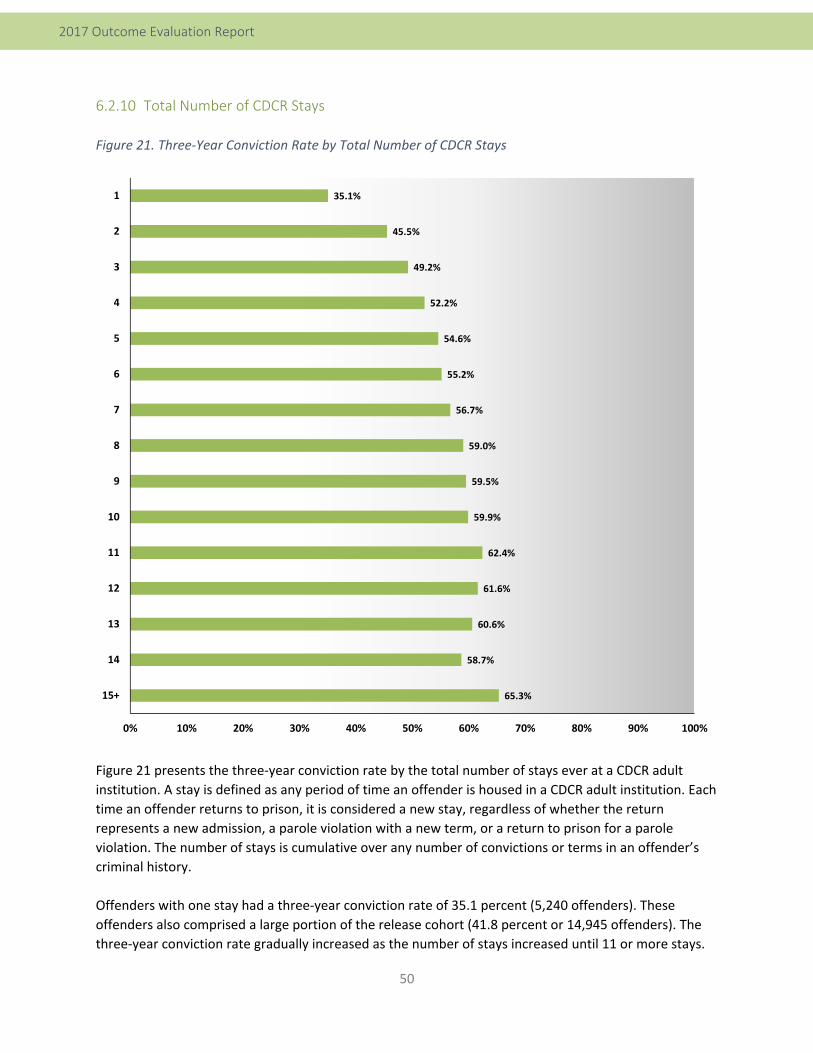
50
2017 Outcome Evaluation Report
6.2.10 Total Number of CDCR Stays
Figure 21. Three‐Year Conviction Rate by Total Number of CDCR Stays
Figure 21 presents the three‐year conviction rate by the total number of stays ever at a CDCR adult
institution. A stay is defined as any period of time an offender is housed in a CDCR adult institution. Each
time an offender returns to prison, it is considered a new stay, regardless of whether the return
represents a new admission, a parole violation with a new term, or a return to prison for a parole
violation. The number of stays is cumulative over any number of convictions or terms in an offender’s
criminal history.
Offenders with one stay had a three‐year conviction rate of 35.1 percent (5,240 offenders). These
offenders also comprised a large portion of the release cohort (41.8 percent or 14,945 offenders). The
three‐year conviction rate gradually increased as the number of stays increased until 11 or more stays.
65.3%
58.7%
60.6%
61.6%
62.4%
59.9%
59.5%
59.0%
56.7%
55.2%
54.6%
52.2%
49.2%
45.5%
35.1%
0% 10% 20% 30% 40% 50% 60% 70% 80% 90% 100%
15+
14
13
12
11
10
9
8
7
6
5
4
3
2
1
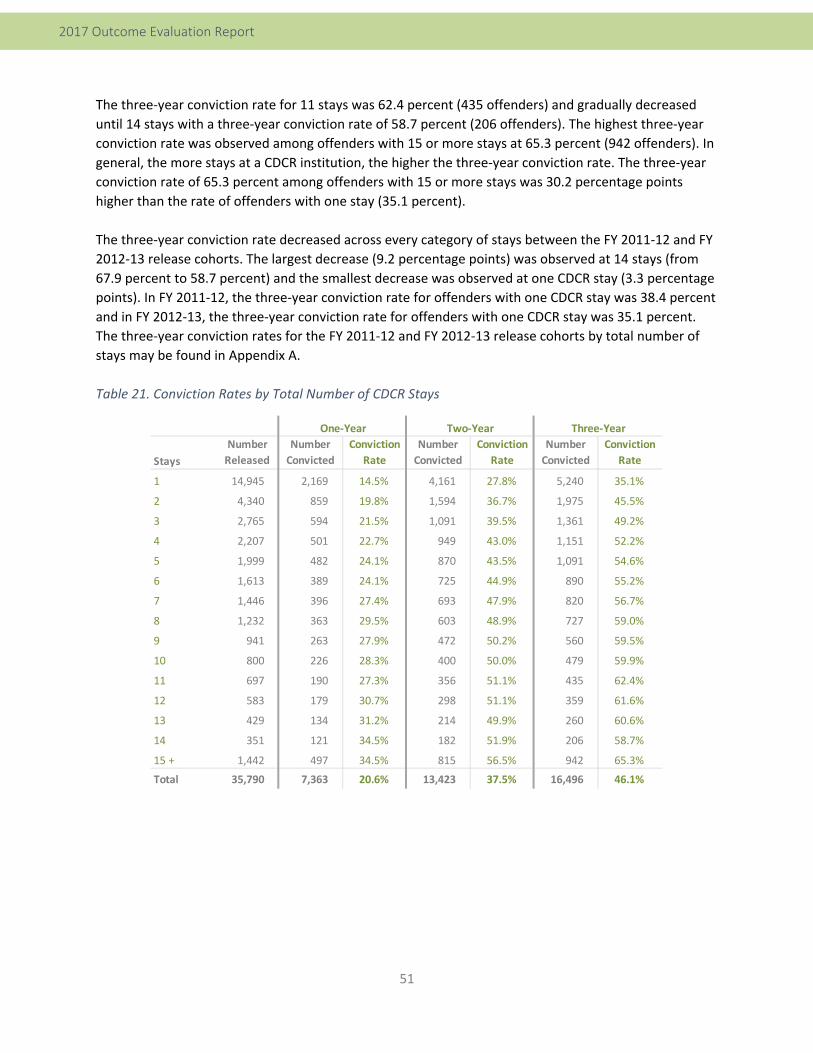
51
2017 Outcome Evaluation Report
The three‐year conviction rate for 11 stays was 62.4 percent (435 offenders) and gradually decreased
until 14 stays with a three‐year conviction rate of 58.7 percent (206 offenders). The highest three‐year
conviction rate was observed among offenders with 15 or more stays at 65.3 percent (942 offenders). In
general, the more stays at a CDCR institution, the higher the three‐year conviction rate. The three‐year
conviction rate of 65.3 percent among offenders with 15 or more stays was 30.2 percentage points
higher than the rate of offenders with one stay (35.1 percent).
The three‐year conviction rate decreased across every category of stays between the FY 2011‐12 and FY
2012‐13 release cohorts. The largest decrease (9.2 percentage points) was observed at 14 stays (from
67.9 percent to 58.7 percent) and the smallest decrease was observed at one CDCR stay (3.3 percentage
points). In FY 2011‐12, the three‐year conviction rate for offenders with one CDCR stay was 38.4 percent
and in FY 2012‐13, the three‐year conviction rate for offenders with one CDCR stay was 35.1 percent.
The three‐year conviction rates for the FY 2011‐12 and FY 2012‐13 release cohorts by total number of
stays may be found in Appendix A.
Table 21. Conviction Rates by Total Number of CDCR Stays
Stays
Number
Released
Number
Convicted
Conviction
Rate
Number
Convicted
Conviction
Rate
Number
Convicted
Conviction
Rate
1 14,945 2,169 14.5% 4,161 27.8% 5,240 35.1%
2 4,340 859 19.8% 1,594 36.7% 1,975 45.5%
3 2,765 594 21.5% 1,091 39.5% 1,361 49.2%
4 2,207 501 22.7% 949 43.0% 1,151 52.2%
5 1,999 482 24.1% 870 43.5% 1,091 54.6%
6 1,613 389 24.1% 725 44.9% 890 55.2%
7 1,446 396 27.4% 693 47.9% 820 56.7%
8 1,232 363 29.5% 603 48.9% 727 59.0%
9 941 263 27.9% 472 50.2% 560 59.5%
10 800 226 28.3% 400 50.0% 479 59.9%
11 697 190 27.3% 356 51.1% 435 62.4%
12 583 179 30.7% 298 51.1% 359 61.6%
13 429 134 31.2% 214 49.9% 260 60.6%
14 351 121 34.5% 182 51.9% 206 58.7%
15 + 1,442 497 34.5% 815 56.5% 942 65.3%
Total 35,790 7,363 20.6% 13,423 37.5% 16,496 46.1%
One‐Year Two‐Year Three‐Year
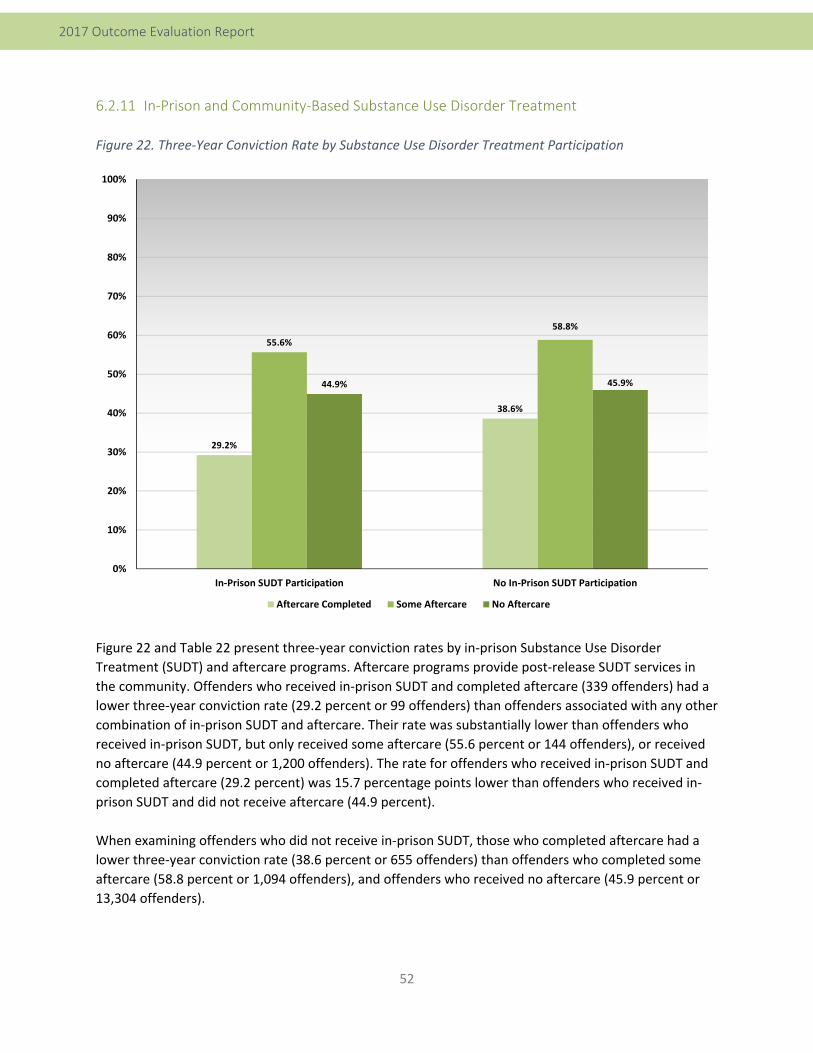
52
2017 Outcome Evaluation Report
6.2.11 In‐Prison and Community‐Based Substance Use Disorder Treatment
Figure 22. Three‐Year Conviction Rate by Substance Use Disorder Treatment Participation
Figure 22 and Table 22 present three‐year conviction rates by in‐prison Substance Use Disorder
Treatment (SUDT) and aftercare programs. Aftercare programs provide post‐release SUDT services in
the community. Offenders who received in‐prison SUDT and completed aftercare (339 offenders) had a
lower three‐year conviction rate (29.2 percent or 99 offenders) than offenders associated with any other
combination of in‐prison SUDT and aftercare. Their rate was substantially lower than offenders who
received in‐prison SUDT, but only received some aftercare (55.6 percent or 144 offenders), or received
no aftercare (44.9 percent or 1,200 offenders). The rate for offenders who received in‐prison SUDT and
completed aftercare (29.2 percent) was 15.7 percentage points lower than offenders who received in‐
prison SUDT and did not receive aftercare (44.9 percent).
When examining offenders who did not receive in‐prison SUDT, those who completed aftercare had a
lower three‐year conviction rate (38.6 percent or 655 offenders) than offenders who completed some
aftercare (58.8 percent or 1,094 offenders), and offenders who received no aftercare (45.9 percent or
13,304 offenders).
29.2%
38.6%
55.6%
58.8%
44.9% 45.9%
0%
10%
20%
30%
40%
50%
60%
70%
80%
90%
100%
In‐Prison SUDT Participation No In‐Prison SUDT Participation
Aftercare Completed Some Aftercare No Aftercare
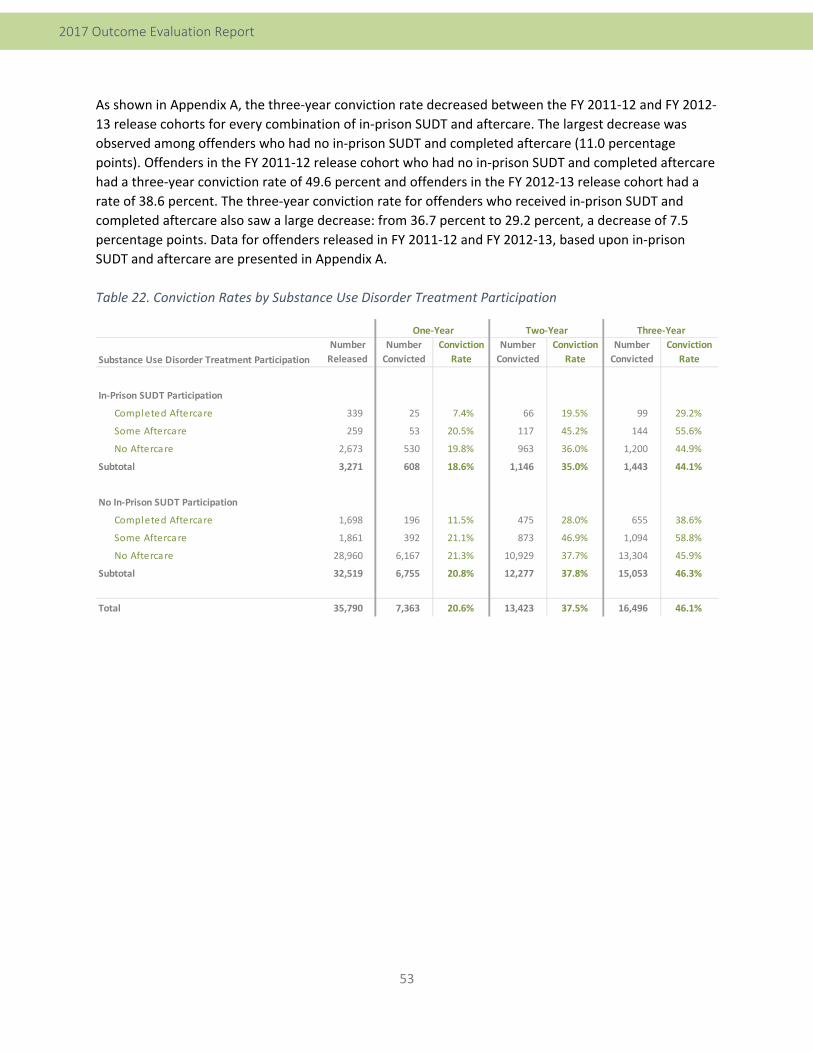
53
2017 Outcome Evaluation Report
As shown in Appendix A, the three‐year conviction rate decreased between the FY 2011‐12 and FY 2012‐
13 release cohorts for every combination of in‐prison SUDT and aftercare. The largest decrease was
observed among offenders who had no in‐prison SUDT and completed aftercare (11.0 percentage
points). Offenders in the FY 2011‐12 release cohort who had no in‐prison SUDT and completed aftercare
had a three‐year conviction rate of 49.6 percent and offenders in the FY 2012‐13 release cohort had a
rate of 38.6 percent. The three‐year conviction rate for offenders who received in‐prison SUDT and
completed aftercare also saw a large decrease: from 36.7 percent to 29.2 percent, a decrease of 7.5
percentage points. Data for offenders released in FY 2011‐12 and FY 2012‐13, based upon in‐prison
SUDT and aftercare are presented in Appendix A.
Table 22. Conviction Rates by Substance Use Disorder Treatment Participation
Substance Use Disorder Treatment Participation
Number
Released
Number
Convicted
Conviction
Rate
Number
Convicted
Conviction
Rate
Number
Convicted
Conviction
Rate
In‐Prison SUDT Participation
Completed Aftercare 339 25 7.4% 66 19.5% 99 29.2%
Some Aftercare 259 53 20.5% 117 45.2% 144 55.6%
No Aftercare 2,673 530 19.8% 963 36.0% 1,200 44.9%
Subtotal 3,271 608 18.6% 1,146 35.0% 1,443 44.1%
No In‐Prison SUDT Participation
Completed Aftercare 1,698 196 11.5% 475 28.0% 655 38.6%
Some Aftercare 1,861 392 21.1% 873 46.9% 1,094 58.8%
No Aftercare 28,960 6,167 21.3% 10,929 37.7% 13,304 45.9%
Subtotal 32,519 6,755 20.8% 12,277 37.8% 15,053 46.3%
Total 35,790 7,363 20.6% 13,423 37.5% 16,496 46.1%
One‐Year Two‐Year Three‐Year
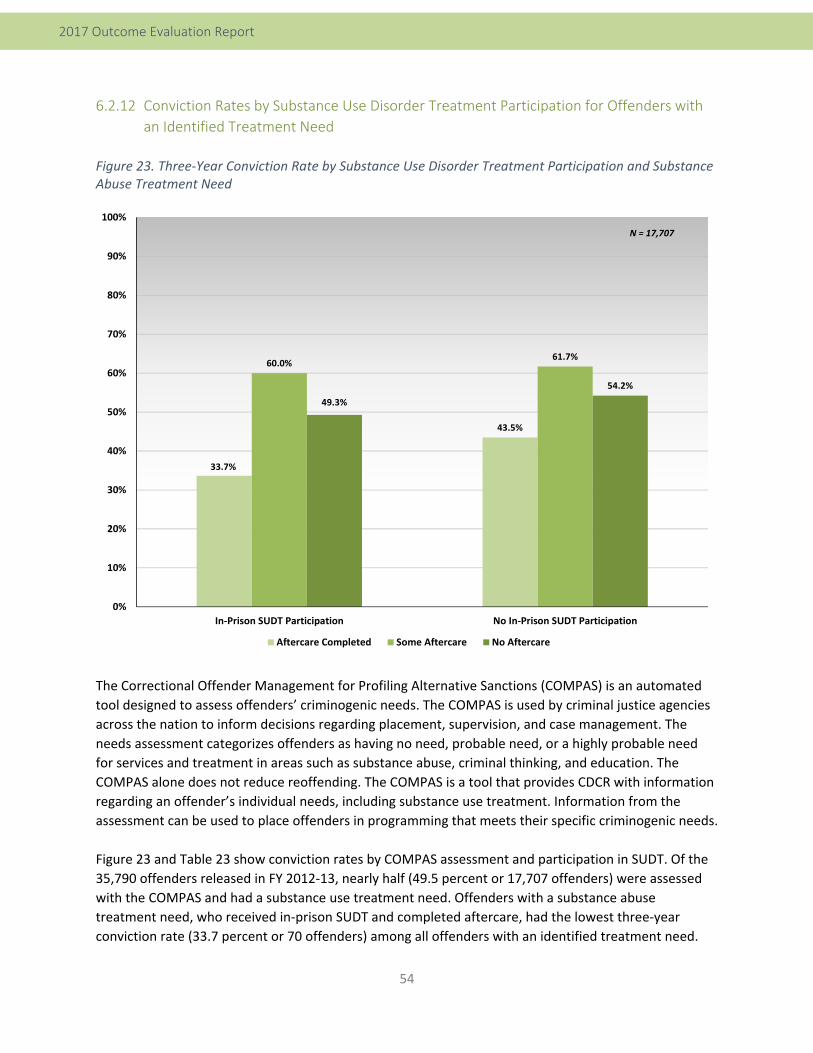
54
2017 Outcome Evaluation Report
6.2.12 Conviction Rates by Substance Use Disorder Treatment Participation for Offenders with
an Identified Treatment Need
Figure 23. Three‐Year Conviction Rate by Substance Use Disorder Treatment Participation and Substance Abuse Treatment Need
The Correctional Offender Management for Profiling Alternative Sanctions (COMPAS) is an automated
tool designed to assess offenders’ criminogenic needs. The COMPAS is used by criminal justice agencies
across the nation to inform decisions regarding placement, supervision, and case management. The
needs assessment categorizes offenders as having no need, probable need, or a highly probable need
for services and treatment in areas such as substance abuse, criminal thinking, and education. The
COMPAS alone does not reduce reoffending. The COMPAS is a tool that provides CDCR with information
regarding an offender’s individual needs, including substance use treatment. Information from the
assessment can be used to place offenders in programming that meets their specific criminogenic needs.
Figure 23 and Table 23 show conviction rates by COMPAS assessment and participation in SUDT. Of the
35,790 offenders released in FY 2012‐13, nearly half (49.5 percent or 17,707 offenders) were assessed
with the COMPAS and had a substance use treatment need. Offenders with a substance abuse
treatment need, who received in‐prison SUDT and completed aftercare, had the lowest three‐year
conviction rate (33.7 percent or 70 offenders) among all offenders with an identified treatment need.
33.7%
43.5%
60.0% 61.7%
49.3%
54.2%
0%
10%
20%
30%
40%
50%
60%
70%
80%
90%
100%
In‐Prison SUDT Participation No In‐Prison SUDT Participation
Aftercare Completed Some Aftercare No Aftercare
N = 17,707
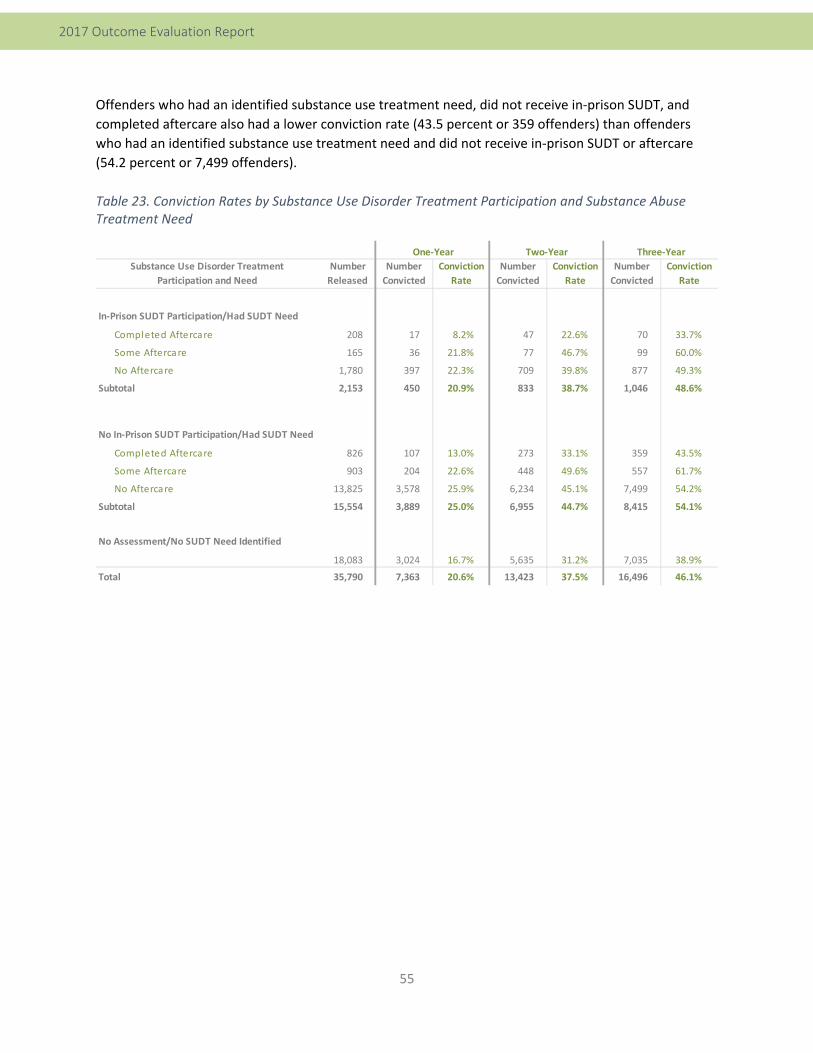
55
2017 Outcome Evaluation Report
Offenders who had an identified substance use treatment need, did not receive in‐prison SUDT, and
completed aftercare also had a lower conviction rate (43.5 percent or 359 offenders) than offenders
who had an identified substance use treatment need and did not receive in‐prison SUDT or aftercare
(54.2 percent or 7,499 offenders).
Table 23. Conviction Rates by Substance Use Disorder Treatment Participation and Substance Abuse Treatment Need
Substance Use Disorder Treatment
Participation and Need
Number
Released
Number
Convicted
Conviction
Rate
Number
Convicted
Conviction
Rate
Number
Convicted
Conviction
Rate
In‐Prison SUDT Participation/Had SUDT Need
Completed Aftercare 208 17 8.2% 47 22.6% 70 33.7%
Some Aftercare 165 36 21.8% 77 46.7% 99 60.0%
No Aftercare 1,780 397 22.3% 709 39.8% 877 49.3%
Subtotal 2,153 450 20.9% 833 38.7% 1,046 48.6%
No In‐Prison SUDT Participation/Had SUDT Need
Completed Aftercare 826 107 13.0% 273 33.1% 359 43.5%
Some Aftercare 903 204 22.6% 448 49.6% 557 61.7%
No Aftercare 13,825 3,578 25.9% 6,234 45.1% 7,499 54.2%
Subtotal 15,554 3,889 25.0% 6,955 44.7% 8,415 54.1%
No Assessment/No SUDT Need Identified
18,083 3,024 16.7% 5,635 31.2% 7,035 38.9%
Total 35,790 7,363 20.6% 13,423 37.5% 16,496 46.1%
One‐Year Two‐Year Three‐Year
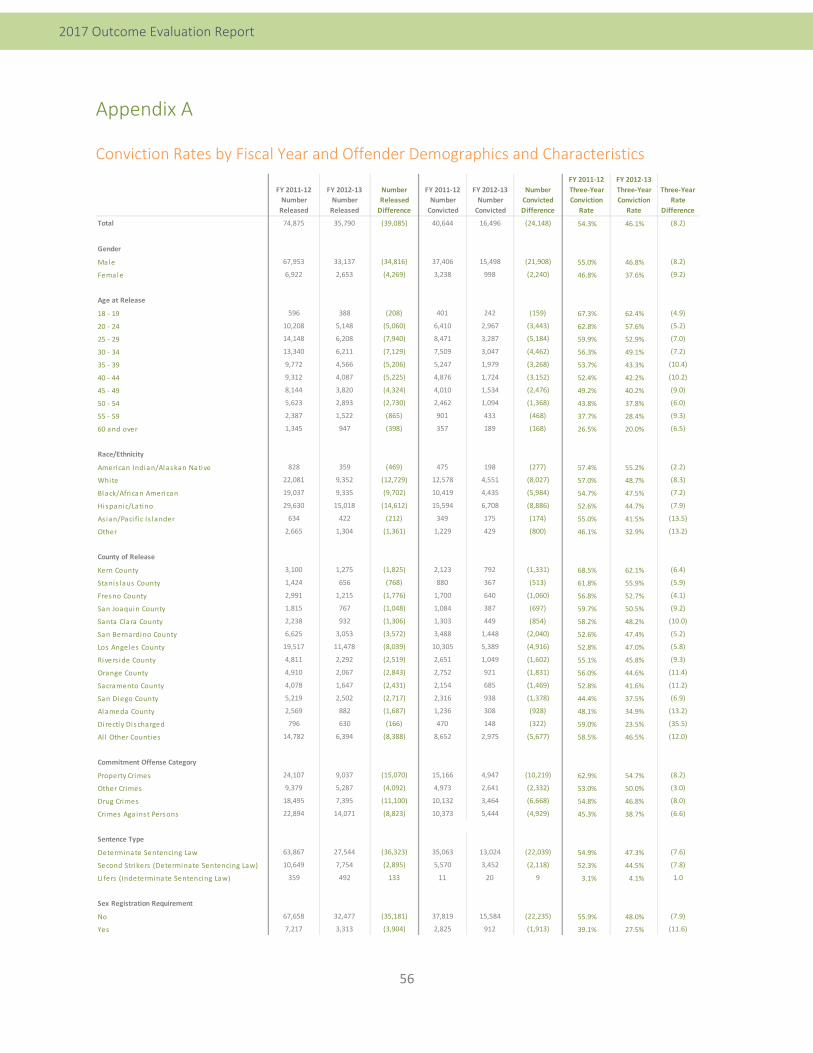
56
2017 Outcome Evaluation Report
Appendix A
Conviction Rates by Fiscal Year and Offender Demographics and Characteristics
FY 2011‐12
Number
Released
FY 2012‐13
Number
Released
Number
Released
Difference
FY 2011‐12
Number
Convicted
FY 2012‐13
Number
Convicted
Number
Convicted
Difference
FY 2011‐12
Three‐Year
Conviction
Rate
FY 2012‐13
Three‐Year
Conviction
Rate
Three‐Year
Rate
Difference
Total 74,875 35,790 (39,085) 40,644 16,496 (24,148) 54.3% 46.1% (8.2)
Gender
Male 67,953 33,137 (34,816) 37,406 15,498 (21,908) 55.0% 46.8% (8.2)
Female 6,922 2,653 (4,269) 3,238 998 (2,240) 46.8% 37.6% (9.2)
Age at Release
18 ‐ 19 596 388 (208) 401 242 (159) 67.3% 62.4% (4.9)
20 ‐ 24 10,208 5,148 (5,060) 6,410 2,967 (3,443) 62.8% 57.6% (5.2)
25 ‐ 29 14,148 6,208 (7,940) 8,471 3,287 (5,184) 59.9% 52.9% (7.0)
30 ‐ 34 13,340 6,211 (7,129) 7,509 3,047 (4,462) 56.3% 49.1% (7.2)
35 ‐ 39 9,772 4,566 (5,206) 5,247 1,979 (3,268) 53.7% 43.3% (10.4)
40 ‐ 44 9,312 4,087 (5,225) 4,876 1,724 (3,152) 52.4% 42.2% (10.2)
45 ‐ 49 8,144 3,820 (4,324) 4,010 1,534 (2,476) 49.2% 40.2% (9.0)
50 ‐ 54 5,623 2,893 (2,730) 2,462 1,094 (1,368) 43.8% 37.8% (6.0)
55 ‐ 59 2,387 1,522 (865) 901 433 (468) 37.7% 28.4% (9.3)
60 and over 1,345 947 (398) 357 189 (168) 26.5% 20.0% (6.5)
Race/Ethnicity
American Indian/Alaskan Native 828 359 (469) 475 198 (277) 57.4% 55.2% (2.2)
White 22,081 9,352 (12,729) 12,578 4,551 (8,027) 57.0% 48.7% (8.3)
Black/African American 19,037 9,335 (9,702) 10,419 4,435 (5,984) 54.7% 47.5% (7.2)
Hispanic/Latino 29,630 15,018 (14,612) 15,594 6,708 (8,886) 52.6% 44.7% (7.9)
As ian/Paci fic Is lander 634 422 (212) 349 175 (174) 55.0% 41.5% (13.5)
Other 2,665 1,304 (1,361) 1,229 429 (800) 46.1% 32.9% (13.2)
County of Release
Kern County 3,100 1,275 (1,825) 2,123 792 (1,331) 68.5% 62.1% (6.4)
Stanis laus County 1,424 656 (768) 880 367 (513) 61.8% 55.9% (5.9)
Fresno County 2,991 1,215 (1,776) 1,700 640 (1,060) 56.8% 52.7% (4.1)
San Joaquin County 1,815 767 (1,048) 1,084 387 (697) 59.7% 50.5% (9.2)
Santa Clara County 2,238 932 (1,306) 1,303 449 (854) 58.2% 48.2% (10.0)
San Bernardino County 6,625 3,053 (3,572) 3,488 1,448 (2,040) 52.6% 47.4% (5.2)
Los Angeles County 19,517 11,478 (8,039) 10,305 5,389 (4,916) 52.8% 47.0% (5.8)
Rivers ide County 4,811 2,292 (2,519) 2,651 1,049 (1,602) 55.1% 45.8% (9.3)
Orange County 4,910 2,067 (2,843) 2,752 921 (1,831) 56.0% 44.6% (11.4)
Sacramento County 4,078 1,647 (2,431) 2,154 685 (1,469) 52.8% 41.6% (11.2)
San Diego County 5,219 2,502 (2,717) 2,316 938 (1,378) 44.4% 37.5% (6.9)
Alameda County 2,569 882 (1,687) 1,236 308 (928) 48.1% 34.9% (13.2)
Di rectly Discharged 796 630 (166) 470 148 (322) 59.0% 23.5% (35.5)
Al l Other Counties 14,782 6,394 (8,388) 8,652 2,975 (5,677) 58.5% 46.5% (12.0)
Commitment Offense Category
Property Crimes 24,107 9,037 (15,070) 15,166 4,947 (10,219) 62.9% 54.7% (8.2)
Other Crimes 9,379 5,287 (4,092) 4,973 2,641 (2,332) 53.0% 50.0% (3.0)
Drug Crimes 18,495 7,395 (11,100) 10,132 3,464 (6,668) 54.8% 46.8% (8.0)
Crimes Aga inst Persons 22,894 14,071 (8,823) 10,373 5,444 (4,929) 45.3% 38.7% (6.6)
Sentence Type
Determinate Sentencing Law 63,867 27,544 (36,323) 35,063 13,024 (22,039) 54.9% 47.3% (7.6)
Second Strikers (Determinate Sentencing Law) 10,649 7,754 (2,895) 5,570 3,452 (2,118) 52.3% 44.5% (7.8)
Li fers (Indeterminate Sentencing Law) 359 492 133 11 20 9 3.1% 4.1% 1.0
Sex Registration Requirement
No 67,658 32,477 (35,181) 37,819 15,584 (22,235) 55.9% 48.0% (7.9)
Yes 7,217 3,313 (3,904) 2,825 912 (1,913) 39.1% 27.5% (11.6)
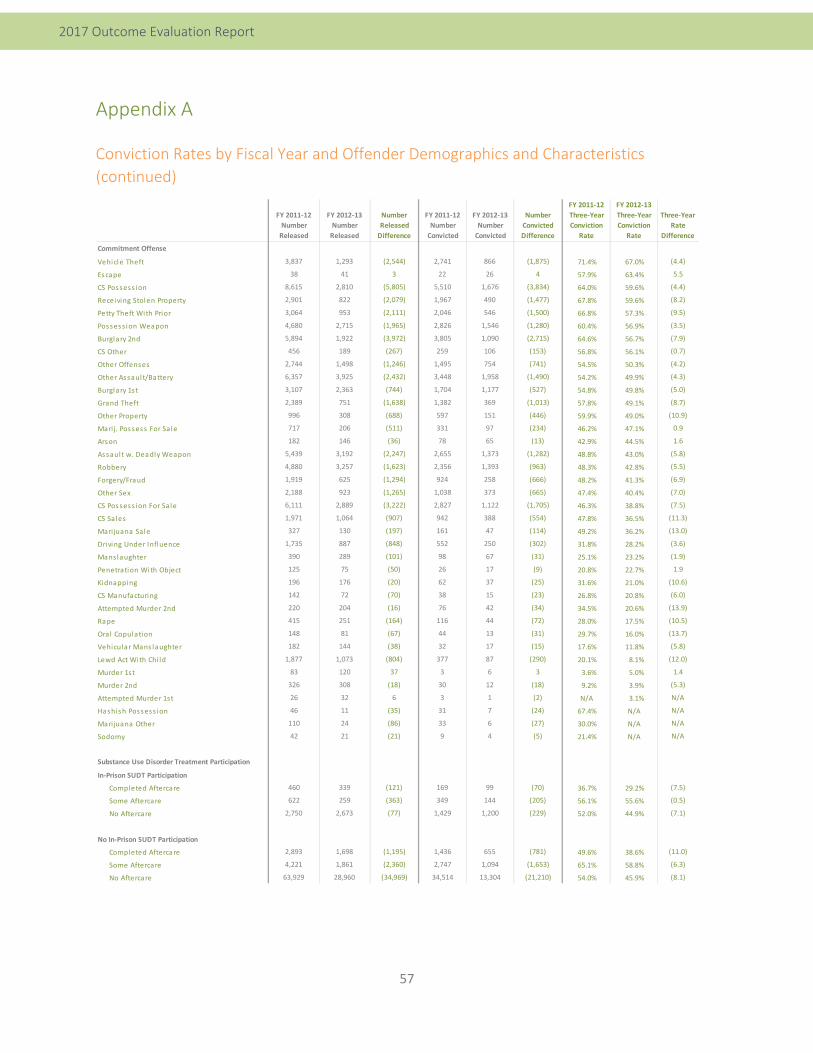
57
2017 Outcome Evaluation Report
Appendix A
Conviction Rates by Fiscal Year and Offender Demographics and Characteristics
(continued)
FY 2011‐12
Number
Released
FY 2012‐13
Number
Released
Number
Released
Difference
FY 2011‐12
Number
Convicted
FY 2012‐13
Number
Convicted
Number
Convicted
Difference
FY 2011‐12
Three‐Year
Conviction
Rate
FY 2012‐13
Three‐Year
Conviction
Rate
Three‐Year
Rate
Difference
Commitment Offense
Vehicle Theft 3,837 1,293 (2,544) 2,741 866 (1,875) 71.4% 67.0% (4.4)
Escape 38 41 3 22 26 4 57.9% 63.4% 5.5
CS Possess ion 8,615 2,810 (5,805) 5,510 1,676 (3,834) 64.0% 59.6% (4.4)
Receiving Stolen Property 2,901 822 (2,079) 1,967 490 (1,477) 67.8% 59.6% (8.2)
Petty Theft With Prior 3,064 953 (2,111) 2,046 546 (1,500) 66.8% 57.3% (9.5)
Possess ion Weapon 4,680 2,715 (1,965) 2,826 1,546 (1,280) 60.4% 56.9% (3.5)
Burglary 2nd 5,894 1,922 (3,972) 3,805 1,090 (2,715) 64.6% 56.7% (7.9)
CS Other 456 189 (267) 259 106 (153) 56.8% 56.1% (0.7)
Other Offenses 2,744 1,498 (1,246) 1,495 754 (741) 54.5% 50.3% (4.2)
Other Assault/Battery 6,357 3,925 (2,432) 3,448 1,958 (1,490) 54.2% 49.9% (4.3)
Burglary 1st 3,107 2,363 (744) 1,704 1,177 (527) 54.8% 49.8% (5.0)
Grand Theft 2,389 751 (1,638) 1,382 369 (1,013) 57.8% 49.1% (8.7)
Other Property 996 308 (688) 597 151 (446) 59.9% 49.0% (10.9)
Mari j. Possess For Sale 717 206 (511) 331 97 (234) 46.2% 47.1% 0.9
Arson 182 146 (36) 78 65 (13) 42.9% 44.5% 1.6
Assault w. Deadly Weapon 5,439 3,192 (2,247) 2,655 1,373 (1,282) 48.8% 43.0% (5.8)
Robbery 4,880 3,257 (1,623) 2,356 1,393 (963) 48.3% 42.8% (5.5)
Forgery/Fraud 1,919 625 (1,294) 924 258 (666) 48.2% 41.3% (6.9)
Other Sex 2,188 923 (1,265) 1,038 373 (665) 47.4% 40.4% (7.0)
CS Possess ion For Sale 6,111 2,889 (3,222) 2,827 1,122 (1,705) 46.3% 38.8% (7.5)
CS Sales 1,971 1,064 (907) 942 388 (554) 47.8% 36.5% (11.3)
Mari juana Sale 327 130 (197) 161 47 (114) 49.2% 36.2% (13.0)
Driving Under Influence 1,735 887 (848) 552 250 (302) 31.8% 28.2% (3.6)
Mans laughter 390 289 (101) 98 67 (31) 25.1% 23.2% (1.9)
Penetration With Object 125 75 (50) 26 17 (9) 20.8% 22.7% 1.9
Kidnapping 196 176 (20) 62 37 (25) 31.6% 21.0% (10.6)
CS Manufacturing 142 72 (70) 38 15 (23) 26.8% 20.8% (6.0)
Attempted Murder 2nd 220 204 (16) 76 42 (34) 34.5% 20.6% (13.9)
Rape 415 251 (164) 116 44 (72) 28.0% 17.5% (10.5)
Oral Copulation 148 81 (67) 44 13 (31) 29.7% 16.0% (13.7)
Vehicular Mans laughter 182 144 (38) 32 17 (15) 17.6% 11.8% (5.8)
Lewd Act With Chi ld 1,877 1,073 (804) 377 87 (290) 20.1% 8.1% (12.0)
Murder 1st 83 120 37 3 6 3 3.6% 5.0% 1.4
Murder 2nd 326 308 (18) 30 12 (18) 9.2% 3.9% (5.3)
Attempted Murder 1st 26 32 6 3 1 (2) N/A 3.1% N/A
Hashish Possess ion 46 11 (35) 31 7 (24) 67.4% N/A N/A
Mari juana Other 110 24 (86) 33 6 (27) 30.0% N/A N/A
Sodomy 42 21 (21) 9 4 (5) 21.4% N/A N/A
Substance Use Disorder Treatment Participation
In‐Prison SUDT Participation
Completed Aftercare 460 339 (121) 169 99 (70) 36.7% 29.2% (7.5)
Some Aftercare 622 259 (363) 349 144 (205) 56.1% 55.6% (0.5)
No Aftercare 2,750 2,673 (77) 1,429 1,200 (229) 52.0% 44.9% (7.1)
No In‐Prison SUDT Participation
Completed Aftercare 2,893 1,698 (1,195) 1,436 655 (781) 49.6% 38.6% (11.0)
Some Aftercare 4,221 1,861 (2,360) 2,747 1,094 (1,653) 65.1% 58.8% (6.3)
No Aftercare 63,929 28,960 (34,969) 34,514 13,304 (21,210) 54.0% 45.9% (8.1)
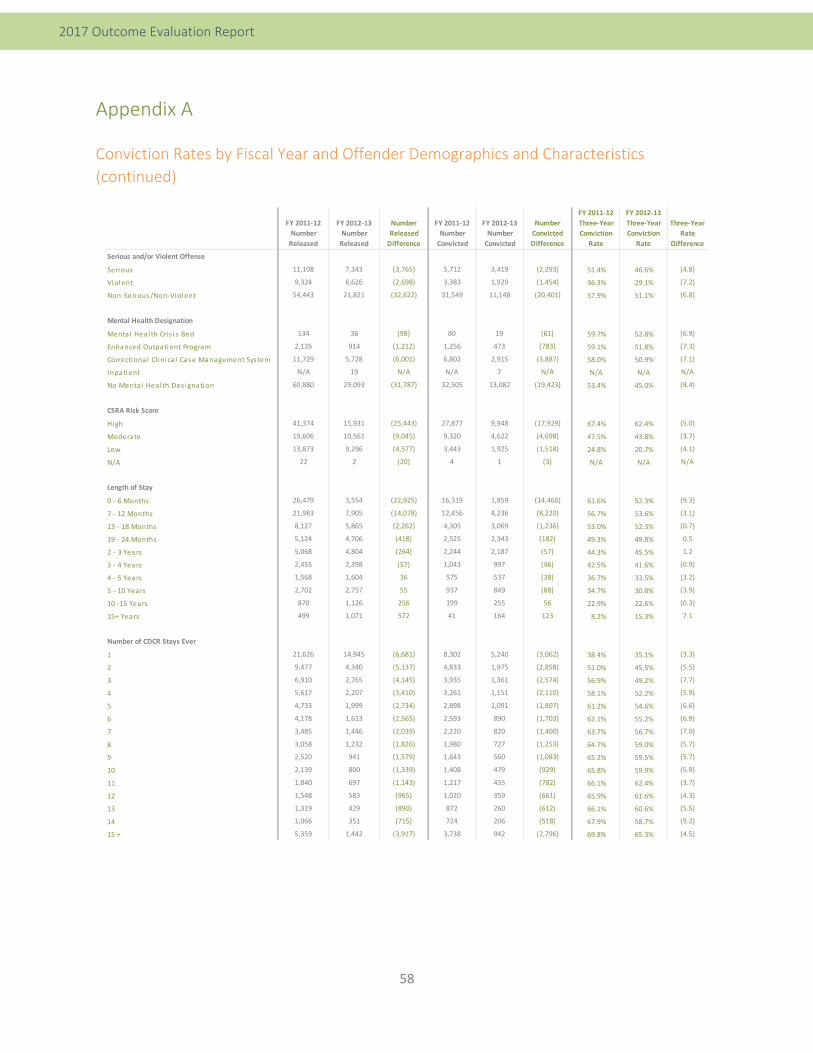
58
2017 Outcome Evaluation Report
Appendix A
Conviction Rates by Fiscal Year and Offender Demographics and Characteristics
(continued)
FY 2011‐12
Number
Released
FY 2012‐13
Number
Released
Number
Released
Difference
FY 2011‐12
Number
Convicted
FY 2012‐13
Number
Convicted
Number
Convicted
Difference
FY 2011‐12
Three‐Year
Conviction
Rate
FY 2012‐13
Three‐Year
Conviction
Rate
Three‐Year
Rate
Difference
Serious and/or Violent Offense
Serious 11,108 7,343 (3,765) 5,712 3,419 (2,293) 51.4% 46.6% (4.8)
Violent 9,324 6,626 (2,698) 3,383 1,929 (1,454) 36.3% 29.1% (7.2)
Non‐Serious/Non‐Violent 54,443 21,821 (32,622) 31,549 11,148 (20,401) 57.9% 51.1% (6.8)
Mental Health Designation
Menta l Health Cris i s Bed 134 36 (98) 80 19 (61) 59.7% 52.8% (6.9)
Enhanced Outpatient Program 2,126 914 (1,212) 1,256 473 (783) 59.1% 51.8% (7.3)
Correctiona l Cl inica l Case Management System 11,729 5,728 (6,001) 6,802 2,915 (3,887) 58.0% 50.9% (7.1)
Inpatient N/A 19 N/A N/A 7 N/A N/A N/A N/A
No Mental Health Des ignation 60,880 29,093 (31,787) 32,505 13,082 (19,423) 53.4% 45.0% (8.4)
CSRA Risk Score
High 41,374 15,931 (25,443) 27,877 9,948 (17,929) 67.4% 62.4% (5.0)
Moderate 19,606 10,561 (9,045) 9,320 4,622 (4,698) 47.5% 43.8% (3.7)
Low 13,873 9,296 (4,577) 3,443 1,925 (1,518) 24.8% 20.7% (4.1)
N/A 22 2 (20) 4 1 (3) N/A N/A N/A
Length of Stay
0 ‐ 6 Months 26,479 3,554 (22,925) 16,319 1,859 (14,460) 61.6% 52.3% (9.3)
7 ‐ 12 Months 21,983 7,905 (14,078) 12,456 4,236 (8,220) 56.7% 53.6% (3.1)
13 ‐ 18 Months 8,127 5,865 (2,262) 4,305 3,069 (1,236) 53.0% 52.3% (0.7)
19 ‐ 24 Months 5,124 4,706 (418) 2,525 2,343 (182) 49.3% 49.8% 0.5
2 ‐ 3 Years 5,068 4,804 (264) 2,244 2,187 (57) 44.3% 45.5% 1.2
3 ‐ 4 Years 2,455 2,398 (57) 1,043 997 (46) 42.5% 41.6% (0.9)
4 ‐ 5 Years 1,568 1,604 36 575 537 (38) 36.7% 33.5% (3.2)
5 ‐ 10 Years 2,702 2,757 55 937 849 (88) 34.7% 30.8% (3.9)
10 ‐15 Years 870 1,126 256 199 255 56 22.9% 22.6% (0.3)
15+ Years 499 1,071 572 41 164 123 8.2% 15.3% 7.1
Number of CDCR Stays Ever
1 21,626 14,945 (6,681) 8,302 5,240 (3,062) 38.4% 35.1% (3.3)
2 9,477 4,340 (5,137) 4,833 1,975 (2,858) 51.0% 45.5% (5.5)
3 6,910 2,765 (4,145) 3,935 1,361 (2,574) 56.9% 49.2% (7.7)
4 5,617 2,207 (3,410) 3,261 1,151 (2,110) 58.1% 52.2% (5.9)
5 4,733 1,999 (2,734) 2,898 1,091 (1,807) 61.2% 54.6% (6.6)
6 4,178 1,613 (2,565) 2,593 890 (1,703) 62.1% 55.2% (6.9)
7 3,485 1,446 (2,039) 2,220 820 (1,400) 63.7% 56.7% (7.0)
8 3,058 1,232 (1,826) 1,980 727 (1,253) 64.7% 59.0% (5.7)
9 2,520 941 (1,579) 1,643 560 (1,083) 65.2% 59.5% (5.7)
10 2,139 800 (1,339) 1,408 479 (929) 65.8% 59.9% (5.9)
11 1,840 697 (1,143) 1,217 435 (782) 66.1% 62.4% (3.7)
12 1,548 583 (965) 1,020 359 (661) 65.9% 61.6% (4.3)
13 1,319 429 (890) 872 260 (612) 66.1% 60.6% (5.5)
14 1,066 351 (715) 724 206 (518) 67.9% 58.7% (9.2)
15 + 5,359 1,442 (3,917) 3,738 942 (2,796) 69.8% 65.3% (4.5)
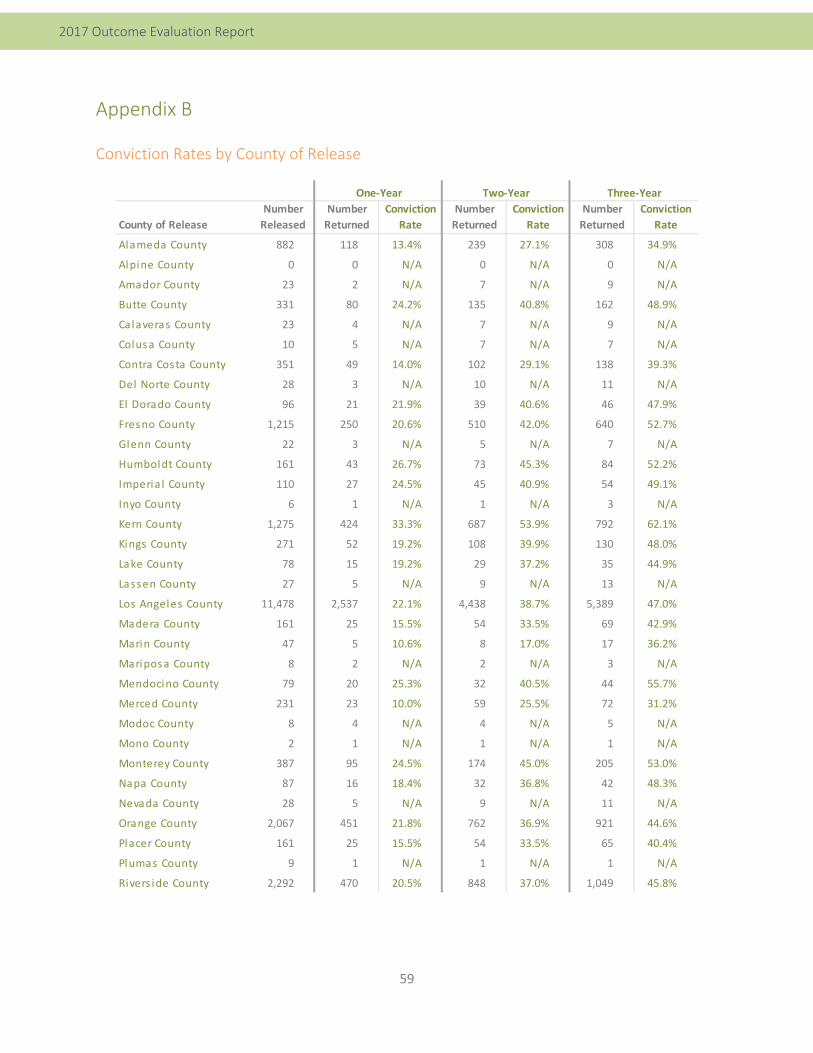
59
2017 Outcome Evaluation Report
Appendix B
Conviction Rates by County of Release
County of Release
Number
Released
Number
Returned
Conviction
Rate
Number
Returned
Conviction
Rate
Number
Returned
Conviction
Rate
Alameda County 882 118 13.4% 239 27.1% 308 34.9%
Alpine County 0 0 N/A 0 N/A 0 N/A
Amador County 23 2 N/A 7 N/A 9 N/A
Butte County 331 80 24.2% 135 40.8% 162 48.9%
Calaveras County 23 4 N/A 7 N/A 9 N/A
Colusa County 10 5 N/A 7 N/A 7 N/A
Contra Costa County 351 49 14.0% 102 29.1% 138 39.3%
Del Norte County 28 3 N/A 10 N/A 11 N/A
El Dorado County 96 21 21.9% 39 40.6% 46 47.9%
Fresno County 1,215 250 20.6% 510 42.0% 640 52.7%
Glenn County 22 3 N/A 5 N/A 7 N/A
Humboldt County 161 43 26.7% 73 45.3% 84 52.2%
Imperia l County 110 27 24.5% 45 40.9% 54 49.1%
Inyo County 6 1 N/A 1 N/A 3 N/A
Kern County 1,275 424 33.3% 687 53.9% 792 62.1%
Kings County 271 52 19.2% 108 39.9% 130 48.0%
Lake County 78 15 19.2% 29 37.2% 35 44.9%
Lassen County 27 5 N/A 9 N/A 13 N/A
Los Angeles County 11,478 2,537 22.1% 4,438 38.7% 5,389 47.0%
Madera County 161 25 15.5% 54 33.5% 69 42.9%
Marin County 47 5 10.6% 8 17.0% 17 36.2%
Mariposa County 8 2 N/A 2 N/A 3 N/A
Mendocino County 79 20 25.3% 32 40.5% 44 55.7%
Merced County 231 23 10.0% 59 25.5% 72 31.2%
Modoc County 8 4 N/A 4 N/A 5 N/A
Mono County 2 1 N/A 1 N/A 1 N/A
Monterey County 387 95 24.5% 174 45.0% 205 53.0%
Napa County 87 16 18.4% 32 36.8% 42 48.3%
Nevada County 28 5 N/A 9 N/A 11 N/A
Orange County 2,067 451 21.8% 762 36.9% 921 44.6%
Placer County 161 25 15.5% 54 33.5% 65 40.4%
Plumas County 9 1 N/A 1 N/A 1 N/A
Rivers ide County 2,292 470 20.5% 848 37.0% 1,049 45.8%
One‐Year Two‐Year Three‐Year
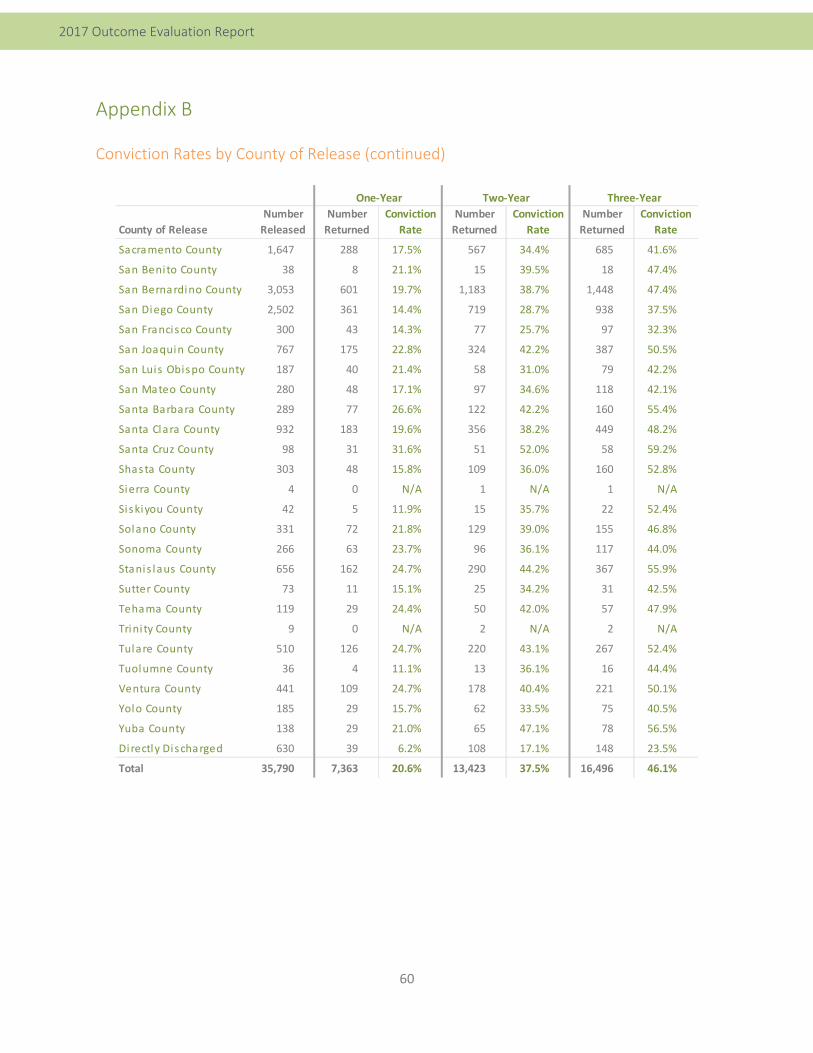
60
2017 Outcome Evaluation Report
Appendix B
Conviction Rates by County of Release (continued)
County of Release
Number
Released
Number
Returned
Conviction
Rate
Number
Returned
Conviction
Rate
Number
Returned
Conviction
Rate
Sacramento County 1,647 288 17.5% 567 34.4% 685 41.6%
San Benito County 38 8 21.1% 15 39.5% 18 47.4%
San Bernardino County 3,053 601 19.7% 1,183 38.7% 1,448 47.4%
San Diego County 2,502 361 14.4% 719 28.7% 938 37.5%
San Francisco County 300 43 14.3% 77 25.7% 97 32.3%
San Joaquin County 767 175 22.8% 324 42.2% 387 50.5%
San Luis Obispo County 187 40 21.4% 58 31.0% 79 42.2%
San Mateo County 280 48 17.1% 97 34.6% 118 42.1%
Santa Barbara County 289 77 26.6% 122 42.2% 160 55.4%
Santa Clara County 932 183 19.6% 356 38.2% 449 48.2%
Santa Cruz County 98 31 31.6% 51 52.0% 58 59.2%
Shasta County 303 48 15.8% 109 36.0% 160 52.8%
Sierra County 4 0 N/A 1 N/A 1 N/A
Siskiyou County 42 5 11.9% 15 35.7% 22 52.4%
Solano County 331 72 21.8% 129 39.0% 155 46.8%
Sonoma County 266 63 23.7% 96 36.1% 117 44.0%
Stanis laus County 656 162 24.7% 290 44.2% 367 55.9%
Sutter County 73 11 15.1% 25 34.2% 31 42.5%
Tehama County 119 29 24.4% 50 42.0% 57 47.9%
Trini ty County 9 0 N/A 2 N/A 2 N/A
Tulare County 510 126 24.7% 220 43.1% 267 52.4%
Tuolumne County 36 4 11.1% 13 36.1% 16 44.4%
Ventura County 441 109 24.7% 178 40.4% 221 50.1%
Yolo County 185 29 15.7% 62 33.5% 75 40.5%
Yuba County 138 29 21.0% 65 47.1% 78 56.5%
Directly Discharged 630 39 6.2% 108 17.1% 148 23.5%
Total 35,790 7,363 20.6% 13,423 37.5% 16,496 46.1%
One‐Year Two‐Year Three‐Year
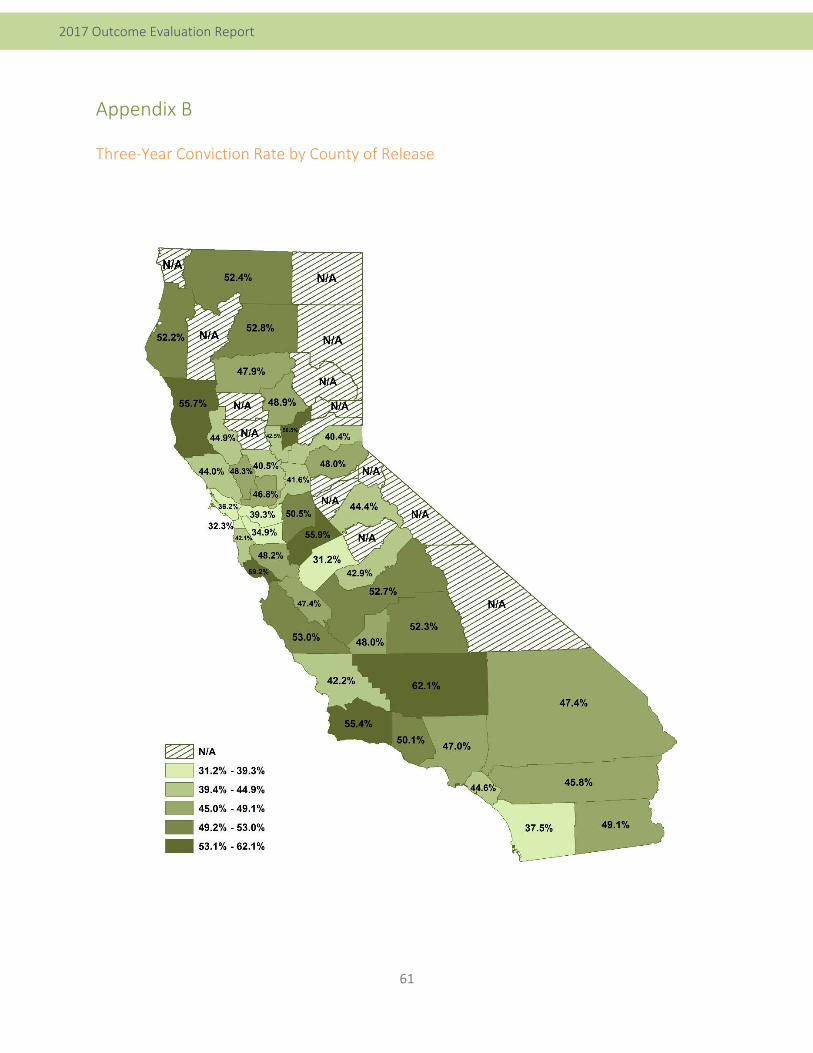
61
2017 Outcome Evaluation Report
Appendix B
Three‐Year Conviction Rate by County of Release
62
2017 Outcome Evaluation Report
Appendix C
Primary and Supplemental Recidivism Rates: Arrests, Convictions, and Returns to Prison
The below figures and tables present supplemental recidivism measures (arrests and returns to prison),
as well as the primary measure of recidivism (convictions), in one‐, two‐, and three‐year intervals (when
available) for adult offenders released from CDCR adult institutions between FY 2002‐03 and FY 2014‐
15. One‐year rates are provided for offenders released from CDCR in FY 2002‐03 through FY 2014‐15
and provide the most years of comparative data.29 The one‐year rates are followed by two‐year and
three‐year supplemental recidivism rates. Two‐year rates are provided for offenders released from
CDCR between FY 2002‐03 and FY 2013‐14 and three‐year rates are provided for offenders released
between FY 2002‐03 and FY 2012‐13.30 Although the three‐year rates provide the most comprehensive
picture of reoffending among CDCR offenders, one‐ and two‐year rates present the most recent data
available and offer insight into trends associated with future three‐year rates.
Arrests
Following multiple years of growth in the arrest rate, the three‐year rate decreased 8.6 percentage
points (from 75.3 percent to 66.7 percent) between the FY 2011‐12 and FY 2012‐13 release cohorts,
which are the most recent cohorts for which three‐year data is available. The two‐year arrest rate for
the FY 2013‐14 release cohort (61.1 percent) and the one‐year arrest rate for the FY 2014‐15 release
cohort (50.2 percent) indicated the three‐year arrest rate will remain relatively stable over the next two
fiscal years of releases. The three‐year arrest rate for the FY 2012‐13 release cohort was the lowest
arrest rate observed since CDCR began reporting these data with the FY 2002‐03 release cohort. The
three‐year arrest rate peaked with the FY 2005‐06 release cohort at 77.2 percent.
Convictions
Recent conviction rates followed a similar pattern to the three‐year arrest rate: following growth
between the FY 2008‐09 and FY 2011‐12 release cohorts, the three‐year conviction rate decreased 8.2
percentage points between the FY 2011‐12 and FY 2012‐13 release cohorts. Again, the two‐year
conviction rate for the FY 2013‐14 release cohort (35.7 percent) and the one‐year rate for the FY 2014‐
15 release cohort (19.7 percent) indicated the conviction rate will remain stable over the next two fiscal
years of releases. The three‐year conviction rate for the FY 2012‐13 release cohort of 46.1 percent is 1.6
percentage points lower than the lowest conviction rate observed (47.7 percent) with the release of the
FY 2002‐03 release cohort when CDCR began reporting these data. The three‐year conviction rate
peaked with the FY 2011‐12 release cohort at 54.3 percent.
29 The arrest, conviction, and return‐to‐prison data contained in these figures and charts were extracted in October 2016 to minimize the effects of the time lag of data entry into the State’s system. 30 Supplemental recidivism rates are “frozen” at three years, meaning the three‐year follow‐up period is complete and no further analyses are performed. Reported one‐year and two‐year rates may fluctuate slightly, as the data used in subsequent reporting years will likely increase, particularly for arrests and convictions, since these data are routinely updated in accordance with criminal justice processing.
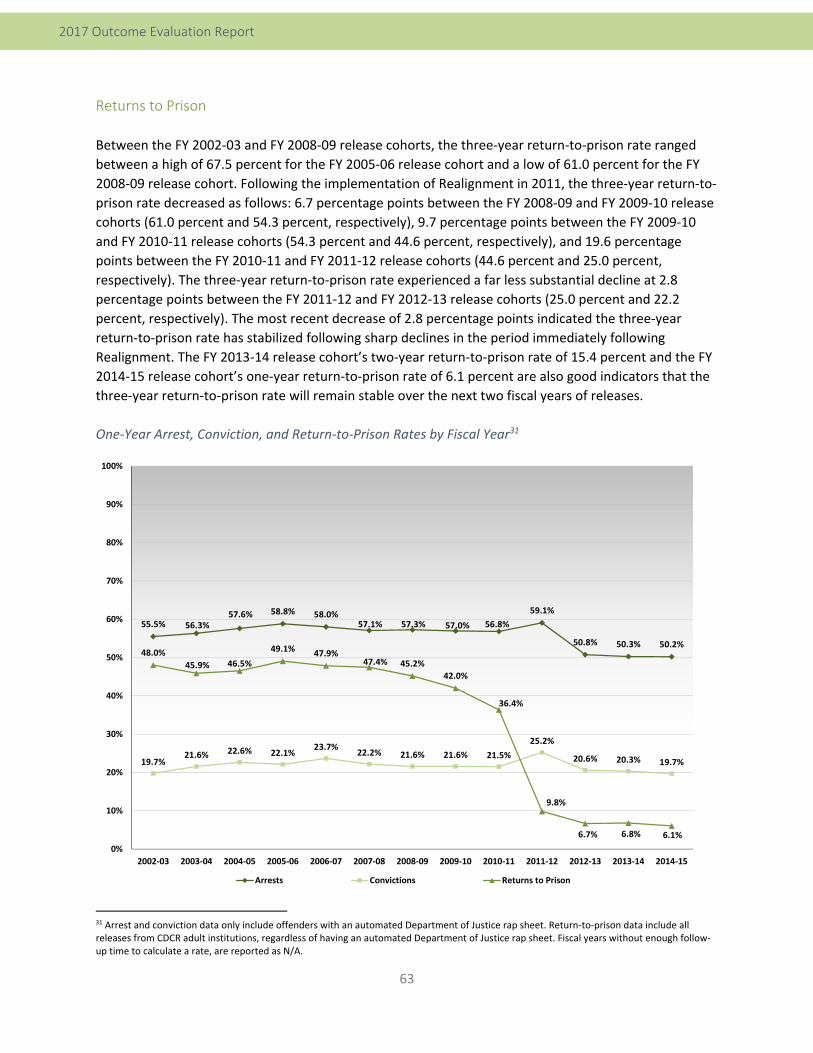
63
2017 Outcome Evaluation Report
Returns to Prison
Between the FY 2002‐03 and FY 2008‐09 release cohorts, the three‐year return‐to‐prison rate ranged
between a high of 67.5 percent for the FY 2005‐06 release cohort and a low of 61.0 percent for the FY
2008‐09 release cohort. Following the implementation of Realignment in 2011, the three‐year return‐to‐
prison rate decreased as follows: 6.7 percentage points between the FY 2008‐09 and FY 2009‐10 release
cohorts (61.0 percent and 54.3 percent, respectively), 9.7 percentage points between the FY 2009‐10
and FY 2010‐11 release cohorts (54.3 percent and 44.6 percent, respectively), and 19.6 percentage
points between the FY 2010‐11 and FY 2011‐12 release cohorts (44.6 percent and 25.0 percent,
respectively). The three‐year return‐to‐prison rate experienced a far less substantial decline at 2.8
percentage points between the FY 2011‐12 and FY 2012‐13 release cohorts (25.0 percent and 22.2
percent, respectively). The most recent decrease of 2.8 percentage points indicated the three‐year
return‐to‐prison rate has stabilized following sharp declines in the period immediately following
Realignment. The FY 2013‐14 release cohort’s two‐year return‐to‐prison rate of 15.4 percent and the FY
2014‐15 release cohort’s one‐year return‐to‐prison rate of 6.1 percent are also good indicators that the
three‐year return‐to‐prison rate will remain stable over the next two fiscal years of releases.
One‐Year Arrest, Conviction, and Return‐to‐Prison Rates by Fiscal Year31
31 Arrest and conviction data only include offenders with an automated Department of Justice rap sheet. Return‐to‐prison data include all releases from CDCR adult institutions, regardless of having an automated Department of Justice rap sheet. Fiscal years without enough follow‐up time to calculate a rate, are reported as N/A.
55.5% 56.3%57.6% 58.8% 58.0%
57.1% 57.3% 57.0% 56.8%
59.1%
50.8% 50.3% 50.2%
19.7%21.6% 22.6% 22.1%
23.7%22.2% 21.6% 21.6% 21.5%
25.2%
20.6% 20.3% 19.7%
48.0%
45.9% 46.5%
49.1% 47.9%47.4% 45.2%
42.0%
36.4%
9.8%
6.7% 6.8% 6.1%
0%
10%
20%
30%
40%
50%
60%
70%
80%
90%
100%
2002‐03 2003‐04 2004‐05 2005‐06 2006‐07 2007‐08 2008‐09 2009‐10 2010‐11 2011‐12 2012‐13 2013‐14 2014‐15
Arrests Convictions Returns to Prison
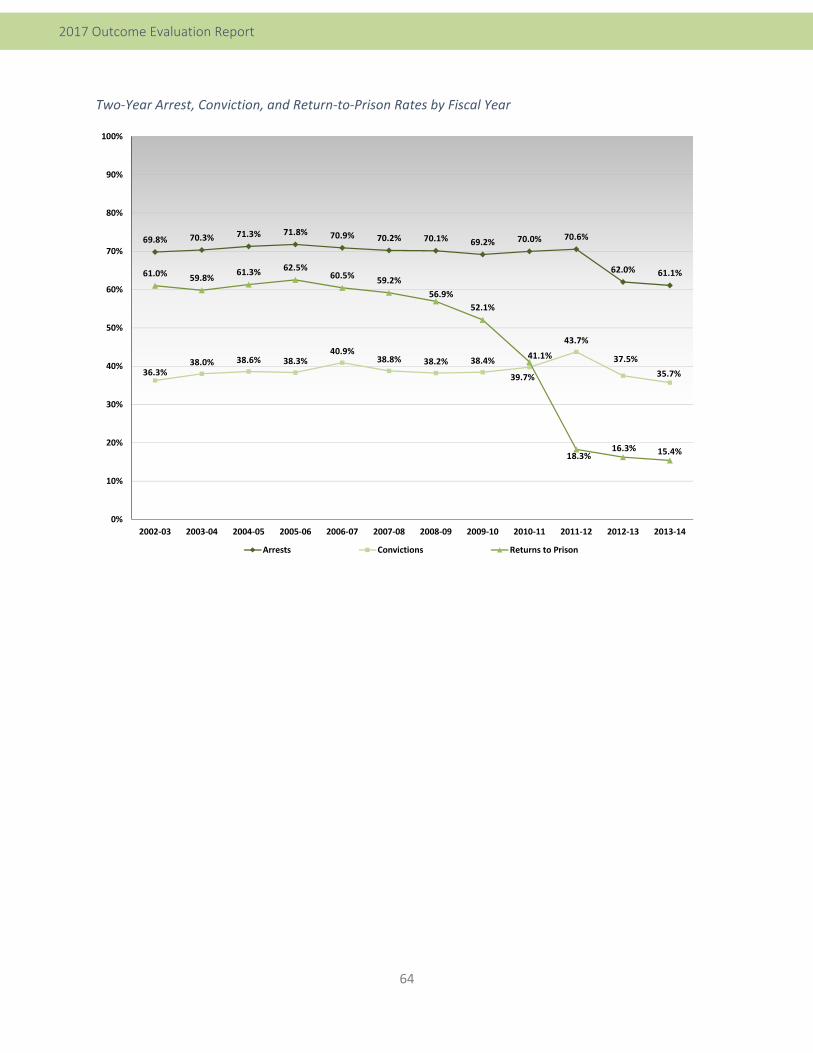
64
2017 Outcome Evaluation Report
Two‐Year Arrest, Conviction, and Return‐to‐Prison Rates by Fiscal Year
69.8% 70.3% 71.3% 71.8% 70.9% 70.2% 70.1% 69.2% 70.0% 70.6%
62.0% 61.1%
36.3%38.0% 38.6% 38.3%
40.9%38.8% 38.2% 38.4%
39.7%
43.7%
37.5%
35.7%
61.0% 59.8%61.3% 62.5%
60.5%59.2%
56.9%
52.1%
41.1%
18.3%16.3% 15.4%
0%
10%
20%
30%
40%
50%
60%
70%
80%
90%
100%
2002‐03 2003‐04 2004‐05 2005‐06 2006‐07 2007‐08 2008‐09 2009‐10 2010‐11 2011‐12 2012‐13 2013‐14
Arrests Convictions Returns to Prison
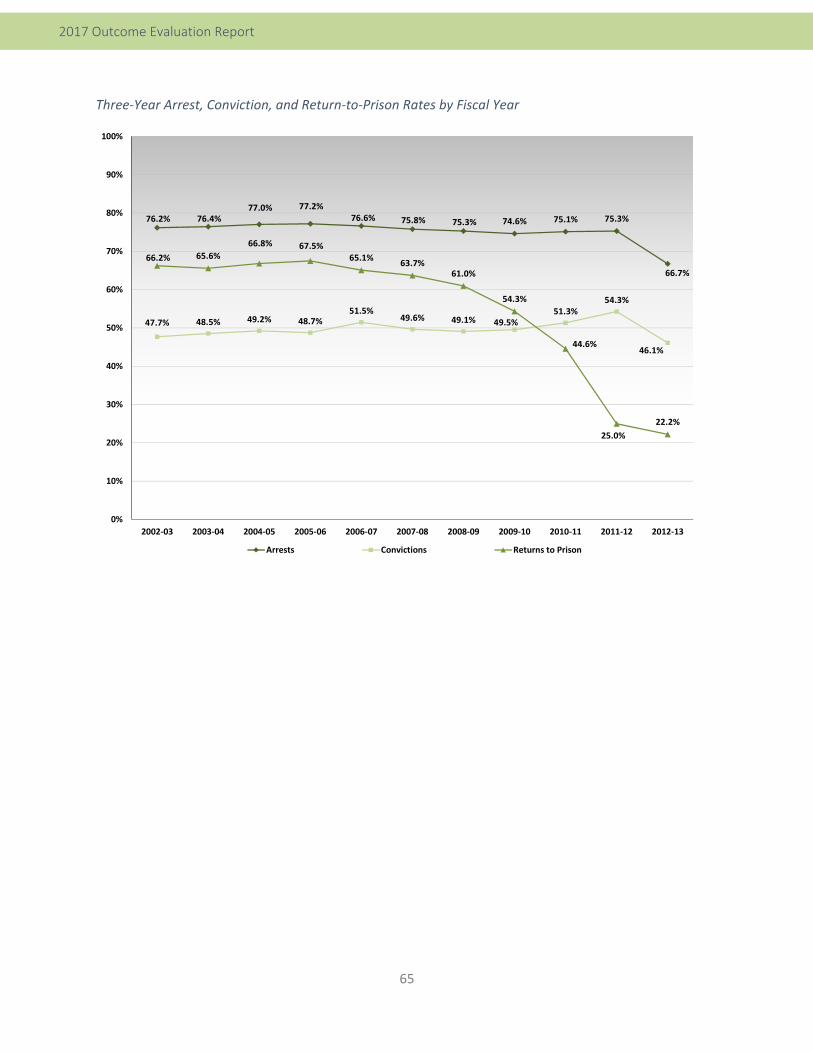
65
2017 Outcome Evaluation Report
Three‐Year Arrest, Conviction, and Return‐to‐Prison Rates by Fiscal Year
76.2% 76.4%77.0% 77.2%
76.6% 75.8% 75.3% 74.6% 75.1% 75.3%
66.7%
47.7% 48.5% 49.2% 48.7%51.5%
49.6% 49.1% 49.5%51.3%
54.3%
46.1%
66.2% 65.6%
66.8% 67.5%65.1%
63.7%61.0%
54.3%
44.6%
25.0%
22.2%
0%
10%
20%
30%
40%
50%
60%
70%
80%
90%
100%
2002‐03 2003‐04 2004‐05 2005‐06 2006‐07 2007‐08 2008‐09 2009‐10 2010‐11 2011‐12 2012‐13
Arrests Convictions Returns to Prison
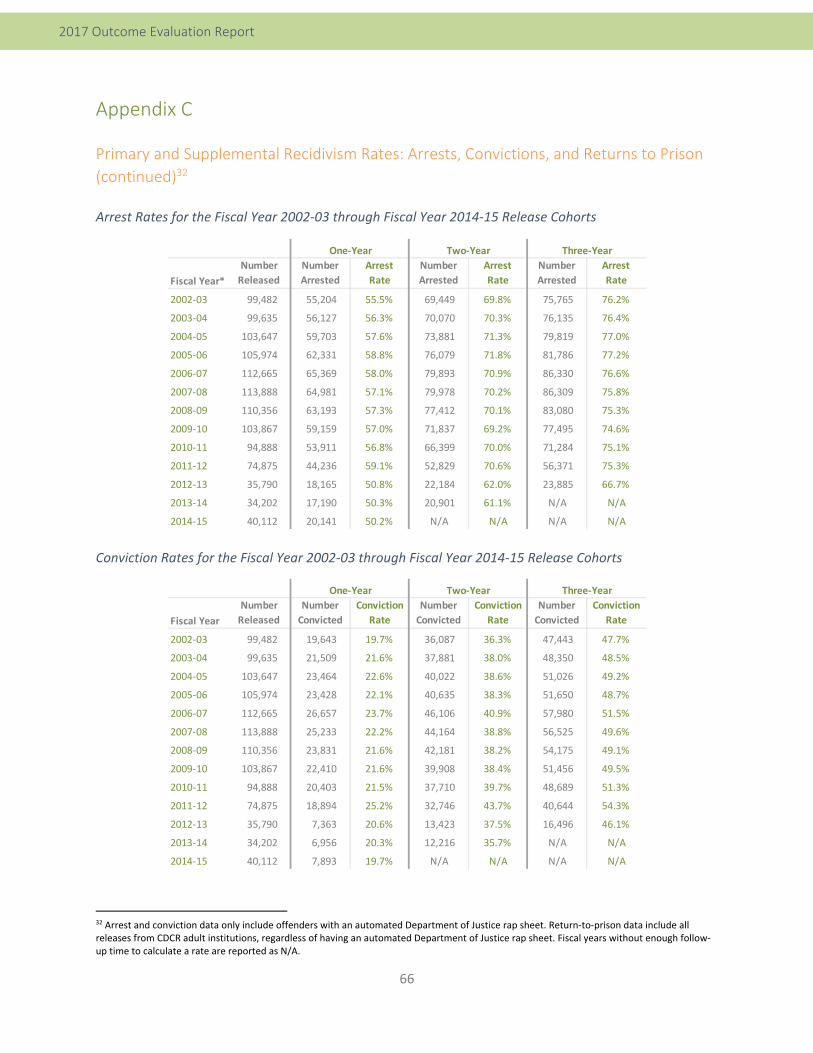
66
2017 Outcome Evaluation Report
Appendix C
Primary and Supplemental Recidivism Rates: Arrests, Convictions, and Returns to Prison
(continued)32
Arrest Rates for the Fiscal Year 2002‐03 through Fiscal Year 2014‐15 Release Cohorts
Conviction Rates for the Fiscal Year 2002‐03 through Fiscal Year 2014‐15 Release Cohorts
32 Arrest and conviction data only include offenders with an automated Department of Justice rap sheet. Return‐to‐prison data include all releases from CDCR adult institutions, regardless of having an automated Department of Justice rap sheet. Fiscal years without enough follow‐up time to calculate a rate are reported as N/A.
Fiscal Year*
Number
Released
Number
Arrested
Arrest
Rate
Number
Arrested
Arrest
Rate
Number
Arrested
Arrest
Rate
2002‐03 99,482 55,204 55.5% 69,449 69.8% 75,765 76.2%
2003‐04 99,635 56,127 56.3% 70,070 70.3% 76,135 76.4%
2004‐05 103,647 59,703 57.6% 73,881 71.3% 79,819 77.0%
2005‐06 105,974 62,331 58.8% 76,079 71.8% 81,786 77.2%
2006‐07 112,665 65,369 58.0% 79,893 70.9% 86,330 76.6%
2007‐08 113,888 64,981 57.1% 79,978 70.2% 86,309 75.8%
2008‐09 110,356 63,193 57.3% 77,412 70.1% 83,080 75.3%
2009‐10 103,867 59,159 57.0% 71,837 69.2% 77,495 74.6%
2010‐11 94,888 53,911 56.8% 66,399 70.0% 71,284 75.1%
2011‐12 74,875 44,236 59.1% 52,829 70.6% 56,371 75.3%
2012‐13 35,790 18,165 50.8% 22,184 62.0% 23,885 66.7%
2013‐14 34,202 17,190 50.3% 20,901 61.1% N/A N/A
2014‐15 40,112 20,141 50.2% N/A N/A N/A N/A
One‐Year Two‐Year Three‐Year
Fiscal Year
Number
Released
Number
Convicted
Conviction
Rate
Number
Convicted
Conviction
Rate
Number
Convicted
Conviction
Rate
2002‐03 99,482 19,643 19.7% 36,087 36.3% 47,443 47.7%
2003‐04 99,635 21,509 21.6% 37,881 38.0% 48,350 48.5%
2004‐05 103,647 23,464 22.6% 40,022 38.6% 51,026 49.2%
2005‐06 105,974 23,428 22.1% 40,635 38.3% 51,650 48.7%
2006‐07 112,665 26,657 23.7% 46,106 40.9% 57,980 51.5%
2007‐08 113,888 25,233 22.2% 44,164 38.8% 56,525 49.6%
2008‐09 110,356 23,831 21.6% 42,181 38.2% 54,175 49.1%
2009‐10 103,867 22,410 21.6% 39,908 38.4% 51,456 49.5%
2010‐11 94,888 20,403 21.5% 37,710 39.7% 48,689 51.3%
2011‐12 74,875 18,894 25.2% 32,746 43.7% 40,644 54.3%
2012‐13 35,790 7,363 20.6% 13,423 37.5% 16,496 46.1%
2013‐14 34,202 6,956 20.3% 12,216 35.7% N/A N/A
2014‐15 40,112 7,893 19.7% N/A N/A N/A N/A
One‐Year Two‐Year Three‐Year
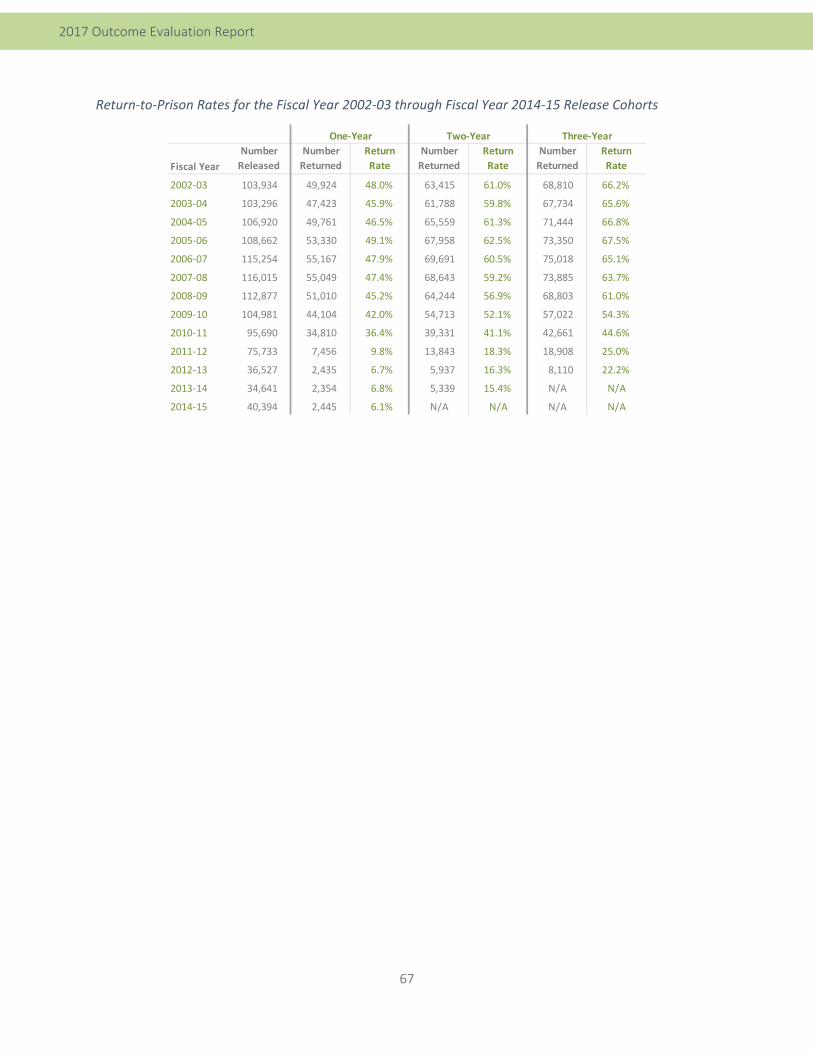
67
2017 Outcome Evaluation Report
Return‐to‐Prison Rates for the Fiscal Year 2002‐03 through Fiscal Year 2014‐15 Release Cohorts
Fiscal Year
Number
Released
Number
Returned
Return
Rate
Number
Returned
Return
Rate
Number
Returned
Return
Rate
2002‐03 103,934 49,924 48.0% 63,415 61.0% 68,810 66.2%
2003‐04 103,296 47,423 45.9% 61,788 59.8% 67,734 65.6%
2004‐05 106,920 49,761 46.5% 65,559 61.3% 71,444 66.8%
2005‐06 108,662 53,330 49.1% 67,958 62.5% 73,350 67.5%
2006‐07 115,254 55,167 47.9% 69,691 60.5% 75,018 65.1%
2007‐08 116,015 55,049 47.4% 68,643 59.2% 73,885 63.7%
2008‐09 112,877 51,010 45.2% 64,244 56.9% 68,803 61.0%
2009‐10 104,981 44,104 42.0% 54,713 52.1% 57,022 54.3%
2010‐11 95,690 34,810 36.4% 39,331 41.1% 42,661 44.6%
2011‐12 75,733 7,456 9.8% 13,843 18.3% 18,908 25.0%
2012‐13 36,527 2,435 6.7% 5,937 16.3% 8,110 22.2%
2013‐14 34,641 2,354 6.8% 5,339 15.4% N/A N/A
2014‐15 40,394 2,445 6.1% N/A N/A N/A N/A
One‐Year Two‐Year Three‐Year
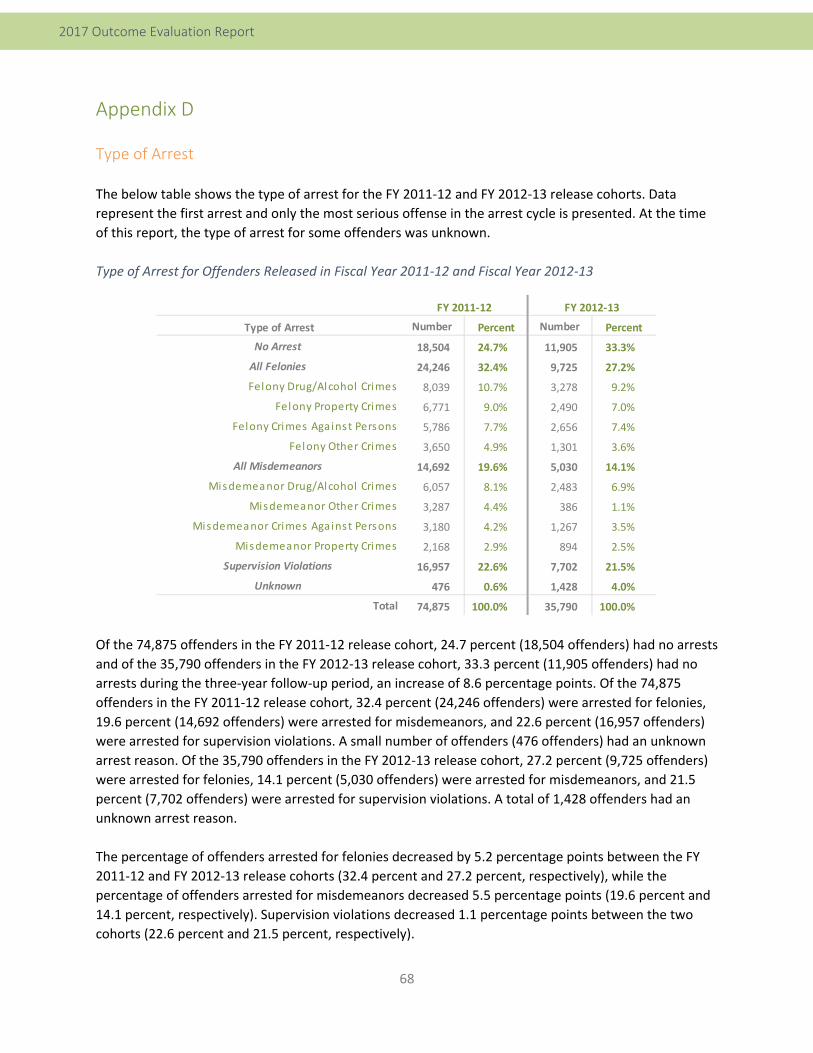
68
2017 Outcome Evaluation Report
Appendix D
Type of Arrest
The below table shows the type of arrest for the FY 2011‐12 and FY 2012‐13 release cohorts. Data
represent the first arrest and only the most serious offense in the arrest cycle is presented. At the time
of this report, the type of arrest for some offenders was unknown.
Type of Arrest for Offenders Released in Fiscal Year 2011‐12 and Fiscal Year 2012‐13
Of the 74,875 offenders in the FY 2011‐12 release cohort, 24.7 percent (18,504 offenders) had no arrests
and of the 35,790 offenders in the FY 2012‐13 release cohort, 33.3 percent (11,905 offenders) had no
arrests during the three‐year follow‐up period, an increase of 8.6 percentage points. Of the 74,875
offenders in the FY 2011‐12 release cohort, 32.4 percent (24,246 offenders) were arrested for felonies,
19.6 percent (14,692 offenders) were arrested for misdemeanors, and 22.6 percent (16,957 offenders)
were arrested for supervision violations. A small number of offenders (476 offenders) had an unknown
arrest reason. Of the 35,790 offenders in the FY 2012‐13 release cohort, 27.2 percent (9,725 offenders)
were arrested for felonies, 14.1 percent (5,030 offenders) were arrested for misdemeanors, and 21.5
percent (7,702 offenders) were arrested for supervision violations. A total of 1,428 offenders had an
unknown arrest reason.
The percentage of offenders arrested for felonies decreased by 5.2 percentage points between the FY
2011‐12 and FY 2012‐13 release cohorts (32.4 percent and 27.2 percent, respectively), while the
percentage of offenders arrested for misdemeanors decreased 5.5 percentage points (19.6 percent and
14.1 percent, respectively). Supervision violations decreased 1.1 percentage points between the two
cohorts (22.6 percent and 21.5 percent, respectively).
Type of Arrest Number Percent Number Percent
No Arrest 18,504 24.7% 11,905 33.3%
All Felonies 24,246 32.4% 9,725 27.2%
Felony Drug/Alcohol Crimes 8,039 10.7% 3,278 9.2%
Felony Property Crimes 6,771 9.0% 2,490 7.0%
Felony Crimes Against Persons 5,786 7.7% 2,656 7.4%
Felony Other Crimes 3,650 4.9% 1,301 3.6%
All Misdemeanors 14,692 19.6% 5,030 14.1%
Misdemeanor Drug/Alcohol Crimes 6,057 8.1% 2,483 6.9%
Misdemeanor Other Crimes 3,287 4.4% 386 1.1%
Misdemeanor Crimes Against Persons 3,180 4.2% 1,267 3.5%
Misdemeanor Property Crimes 2,168 2.9% 894 2.5%
Supervision Violations 16,957 22.6% 7,702 21.5%
Unknown 476 0.6% 1,428 4.0%
Total 74,875 100.0% 35,790 100.0%
FY 2012‐13FY 2011‐12
69
2017 Outcome Evaluation Report
The percentage of offenders arrested for each type of felony and misdemeanor decreased between the
FY 2011‐12 and FY 2012‐13 release cohorts. Other misdemeanor crimes saw the largest decrease at 3.3
percentage points (from 4.4 percent to 1.1 percent), followed by felony property crimes with a 2.0
percentage point decrease (from 9.0 percent to 7.0 percent).
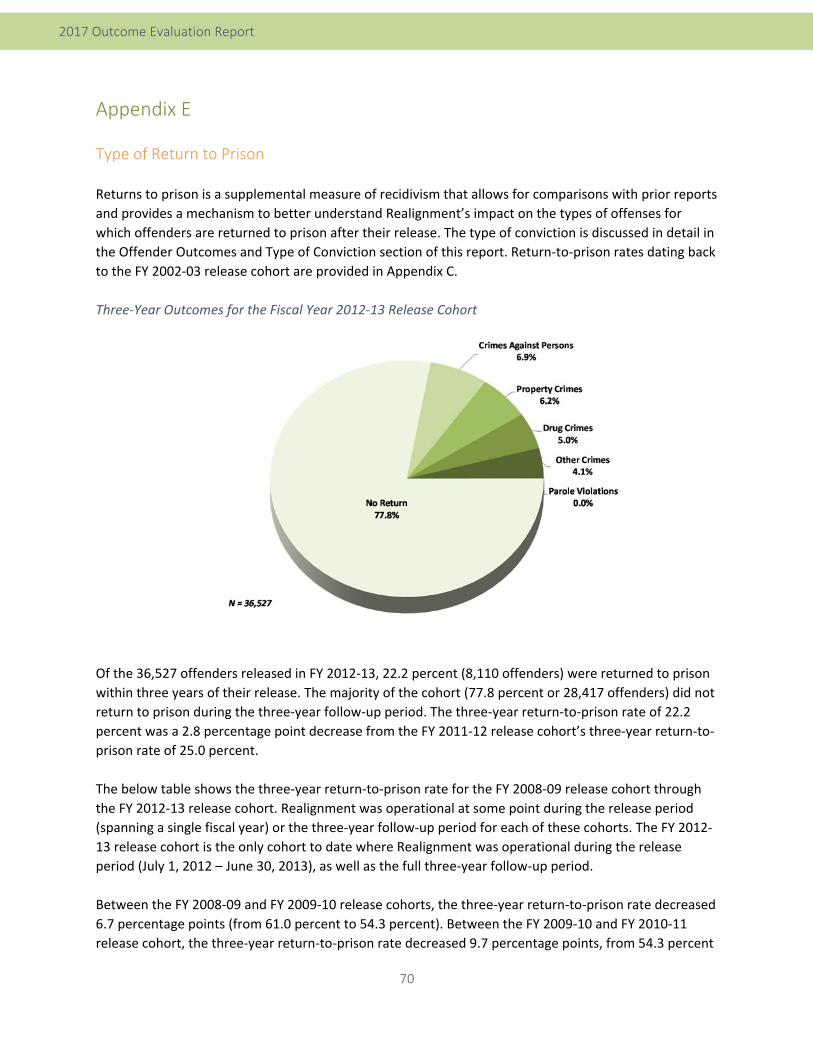
70
2017 Outcome Evaluation Report
Appendix E
Type of Return to Prison
Returns to prison is a supplemental measure of recidivism that allows for comparisons with prior reports
and provides a mechanism to better understand Realignment’s impact on the types of offenses for
which offenders are returned to prison after their release. The type of conviction is discussed in detail in
the Offender Outcomes and Type of Conviction section of this report. Return‐to‐prison rates dating back
to the FY 2002‐03 release cohort are provided in Appendix C.
Three‐Year Outcomes for the Fiscal Year 2012‐13 Release Cohort
Of the 36,527 offenders released in FY 2012‐13, 22.2 percent (8,110 offenders) were returned to prison
within three years of their release. The majority of the cohort (77.8 percent or 28,417 offenders) did not
return to prison during the three‐year follow‐up period. The three‐year return‐to‐prison rate of 22.2
percent was a 2.8 percentage point decrease from the FY 2011‐12 release cohort’s three‐year return‐to‐
prison rate of 25.0 percent.
The below table shows the three‐year return‐to‐prison rate for the FY 2008‐09 release cohort through
the FY 2012‐13 release cohort. Realignment was operational at some point during the release period
(spanning a single fiscal year) or the three‐year follow‐up period for each of these cohorts. The FY 2012‐
13 release cohort is the only cohort to date where Realignment was operational during the release
period (July 1, 2012 – June 30, 2013), as well as the full three‐year follow‐up period.
Between the FY 2008‐09 and FY 2009‐10 release cohorts, the three‐year return‐to‐prison rate decreased
6.7 percentage points (from 61.0 percent to 54.3 percent). Between the FY 2009‐10 and FY 2010‐11
release cohort, the three‐year return‐to‐prison rate decreased 9.7 percentage points, from 54.3 percent
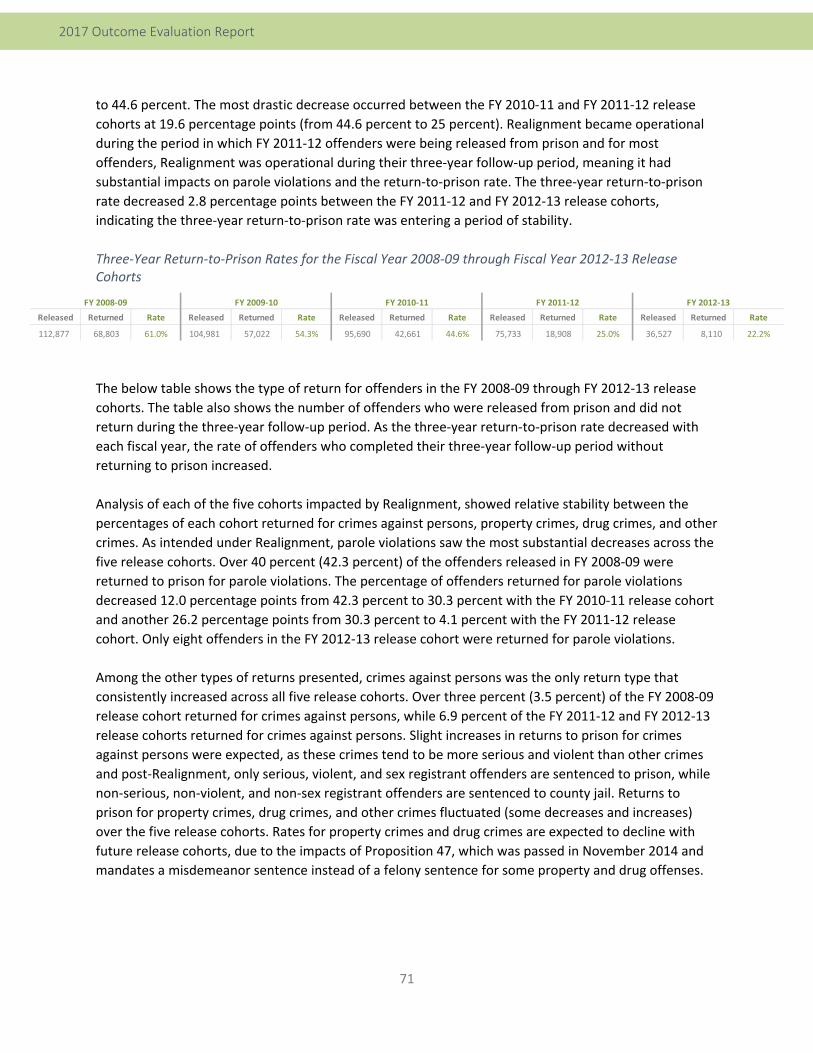
71
2017 Outcome Evaluation Report
to 44.6 percent. The most drastic decrease occurred between the FY 2010‐11 and FY 2011‐12 release
cohorts at 19.6 percentage points (from 44.6 percent to 25 percent). Realignment became operational
during the period in which FY 2011‐12 offenders were being released from prison and for most
offenders, Realignment was operational during their three‐year follow‐up period, meaning it had
substantial impacts on parole violations and the return‐to‐prison rate. The three‐year return‐to‐prison
rate decreased 2.8 percentage points between the FY 2011‐12 and FY 2012‐13 release cohorts,
indicating the three‐year return‐to‐prison rate was entering a period of stability.
Three‐Year Return‐to‐Prison Rates for the Fiscal Year 2008‐09 through Fiscal Year 2012‐13 Release Cohorts
The below table shows the type of return for offenders in the FY 2008‐09 through FY 2012‐13 release
cohorts. The table also shows the number of offenders who were released from prison and did not
return during the three‐year follow‐up period. As the three‐year return‐to‐prison rate decreased with
each fiscal year, the rate of offenders who completed their three‐year follow‐up period without
returning to prison increased.
Analysis of each of the five cohorts impacted by Realignment, showed relative stability between the
percentages of each cohort returned for crimes against persons, property crimes, drug crimes, and other
crimes. As intended under Realignment, parole violations saw the most substantial decreases across the
five release cohorts. Over 40 percent (42.3 percent) of the offenders released in FY 2008‐09 were
returned to prison for parole violations. The percentage of offenders returned for parole violations
decreased 12.0 percentage points from 42.3 percent to 30.3 percent with the FY 2010‐11 release cohort
and another 26.2 percentage points from 30.3 percent to 4.1 percent with the FY 2011‐12 release
cohort. Only eight offenders in the FY 2012‐13 release cohort were returned for parole violations.
Among the other types of returns presented, crimes against persons was the only return type that
consistently increased across all five release cohorts. Over three percent (3.5 percent) of the FY 2008‐09
release cohort returned for crimes against persons, while 6.9 percent of the FY 2011‐12 and FY 2012‐13
release cohorts returned for crimes against persons. Slight increases in returns to prison for crimes
against persons were expected, as these crimes tend to be more serious and violent than other crimes
and post‐Realignment, only serious, violent, and sex registrant offenders are sentenced to prison, while
non‐serious, non‐violent, and non‐sex registrant offenders are sentenced to county jail. Returns to
prison for property crimes, drug crimes, and other crimes fluctuated (some decreases and increases)
over the five release cohorts. Rates for property crimes and drug crimes are expected to decline with
future release cohorts, due to the impacts of Proposition 47, which was passed in November 2014 and
mandates a misdemeanor sentence instead of a felony sentence for some property and drug offenses.
Released Returned Rate Released Returned Rate Released Returned Rate Released Returned Rate Released Returned Rate
112,877 68,803 61.0% 104,981 57,022 54.3% 95,690 42,661 44.6% 75,733 18,908 25.0% 36,527 8,110 22.2%
FY 2009‐10 FY 2010‐11 FY 2011‐12 FY 2012‐13FY 2008‐09
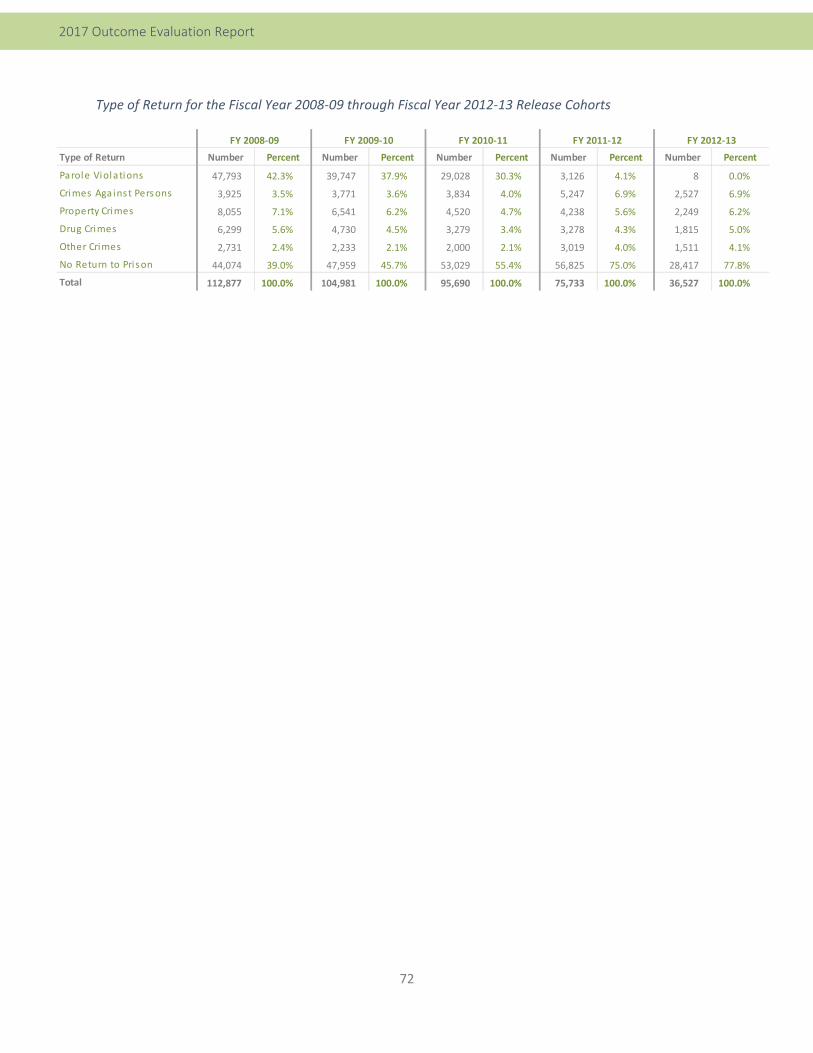
72
2017 Outcome Evaluation Report
Type of Return for the Fiscal Year 2008‐09 through Fiscal Year 2012‐13 Release Cohorts
Type of Return Number Percent Number Percent Number Percent Number Percent Number Percent
Parole Violations 47,793 42.3% 39,747 37.9% 29,028 30.3% 3,126 4.1% 8 0.0%
Crimes Against Persons 3,925 3.5% 3,771 3.6% 3,834 4.0% 5,247 6.9% 2,527 6.9%
Property Crimes 8,055 7.1% 6,541 6.2% 4,520 4.7% 4,238 5.6% 2,249 6.2%
Drug Crimes 6,299 5.6% 4,730 4.5% 3,279 3.4% 3,278 4.3% 1,815 5.0%
Other Crimes 2,731 2.4% 2,233 2.1% 2,000 2.1% 3,019 4.0% 1,511 4.1%
No Return to Prison 44,074 39.0% 47,959 45.7% 53,029 55.4% 56,825 75.0% 28,417 77.8%
Total 112,877 100.0% 104,981 100.0% 95,690 100.0% 75,733 100.0% 36,527 100.0%
FY 2008‐09 FY 2009‐10 FY 2010‐11 FY 2011‐12 FY 2012‐13
73
2017 Outcome Evaluation Report
Appendix F
Definitions of Key Terms
California Static Risk Assessment (CSRA)
The CSRA is an actuarial tool that utilizes demographic and criminal history data to predict an offender’s risk of conviction at the time they are released from CDCR. Offenders are categorized as low, moderate or high risk of incurring a new criminal conviction.
Cohort
A group of individuals who share a common characteristic, such as all inmates who were released during a given year.
Controlling Crime or Commitment Offense
The most serious offense on the conviction for which the inmate was sentenced to prison on that term.
Correctional Clinical Case Management System (CCCMS)
The CCCMS facilitates mental health care by linking inmate/patients to needed services and providing sustained support while accessing such services. CCCMS services are provided as outpatient services within the general population setting at all institutions.
Determinate Sentencing Law (DSL)
Established by Penal Code section 1170 in 1977, Determinate Sentencing Law identifies a specified sentence length for convicted felons who are remanded to state prison. Essentially, three specific terms of imprisonment (low, middle, and high) are assigned for crimes, as well as enhancements (specific case factors that allow judges to add time to a sentence). Opportunities to earn “credits” can reduce the length of incarceration.
Enhanced Outpatient Program (EOP)
A mental health services designation applied to a severely mentally ill inmate receiving treatment at a level similar to day treatment services.
First Release
The first release on the current term for felons with new admissions and parole violators returning with a new term (PV‐WNT).
74
2017 Outcome Evaluation Report
Indeterminate Sentencing Law (ISL)
Established by Penal Code section 1168 in 1917, the Indeterminate Sentencing Law allowed judges to determine a range of time (minimum and maximum) a convicted felon would serve. Different felons convicted for the same crimes could spend varying lengths of time in prison; release depended on many factors, including each prisoner’s individual conduct in prison. After the minimum sentence passed, felons were brought to a parole board that would identify the actual date of release. Indeterminate Sentencing was replaced by Determinate Sentencing (Penal Code section 1170) in 1977. After the implementation of Determinate Sentencing, only individuals with life sentences and third strikers are considered “indeterminately” sentenced, since the parole board determines their release.
Manual California Static Risk Assessment (CSRA)
Inmates who do not have automated criminal history data available from the Department of Justice (DOJ) must have their CSRA score calculated manually. This is done with a review of a paper copy of the inmate’s rap sheet. Manual scores calculated in Fiscal Year 2008‐09 are not readily available for some inmates included in this report.
Parole
A period of conditional supervised release following a prison term.
Parole Violation (Law)
A law violation occurs when a parolee commits a crime while on parole and returns to CDCR custody (RTC) by action of the Board of Parole Hearings rather than by prosecution in the courts.
Parole Violation (Technical)
A technical violation occurs when a parolee violates a condition of his/her parole that is not considered a new crime and returns to CDCR custody (RTC).
Parole Violator Returning With a New Term (PV‐WNT)
A parolee who receives a court sentence for a new crime committed while under parole supervision and returned to prison.
Recidivism
Conviction of a new felony or misdemeanor committed within three years of release from custody or committed within three years of placement on supervision for a previous criminal conviction.
75
2017 Outcome Evaluation Report
Registered Sex Offender
An inmate is designated as a registered sex offender if CDCR records show that the inmate has at some point been convicted of an offense that requires registration as a sex offender under Penal Code section 290. This designation is permanent in CDCR records.
Re‐Release
After a return‐to‐prison for a parole violation, any subsequent release on the same (current) term is a re‐release.
Return‐to‐Prison
An individual convicted of a felony and incarcerated in a CDCR adult institution who was released to parole, discharged after being paroled, or directly discharged during Fiscal Year 2011‐12 and subsequently returned to prison within three years of their release date.
Serious Felony Offenses
Serious felony offenses are specified in Penal Code section 1192.7(c) and Penal Code section 1192.8
Stay
A stay is any period of time an inmate is housed in a CDCR institution. Each time an inmate returns to prison it is considered a new stay, regardless of the reason for returning.
Term
A term is a sentence an inmate receives from a court to be committed to CDCR for a length‐of‐time. If an inmate is released after serving a term and is later returned‐to‐prison for a parole violation, the inmate returns and continues serving the original (current) term. If that inmate returns for committing a new crime, the inmate begins serving a new term.
Violent Felony Offense
Violent felony offenses are specified in Penal Code section 667.5(c).
76
2017 Outcome Evaluation Report
California Department of Corrections and Rehabilitation
Division of Internal Oversight and Research
Office of Research
http://www.cdcr.ca.gov/adult_research_branch