Embed Size (px)
Citation preview
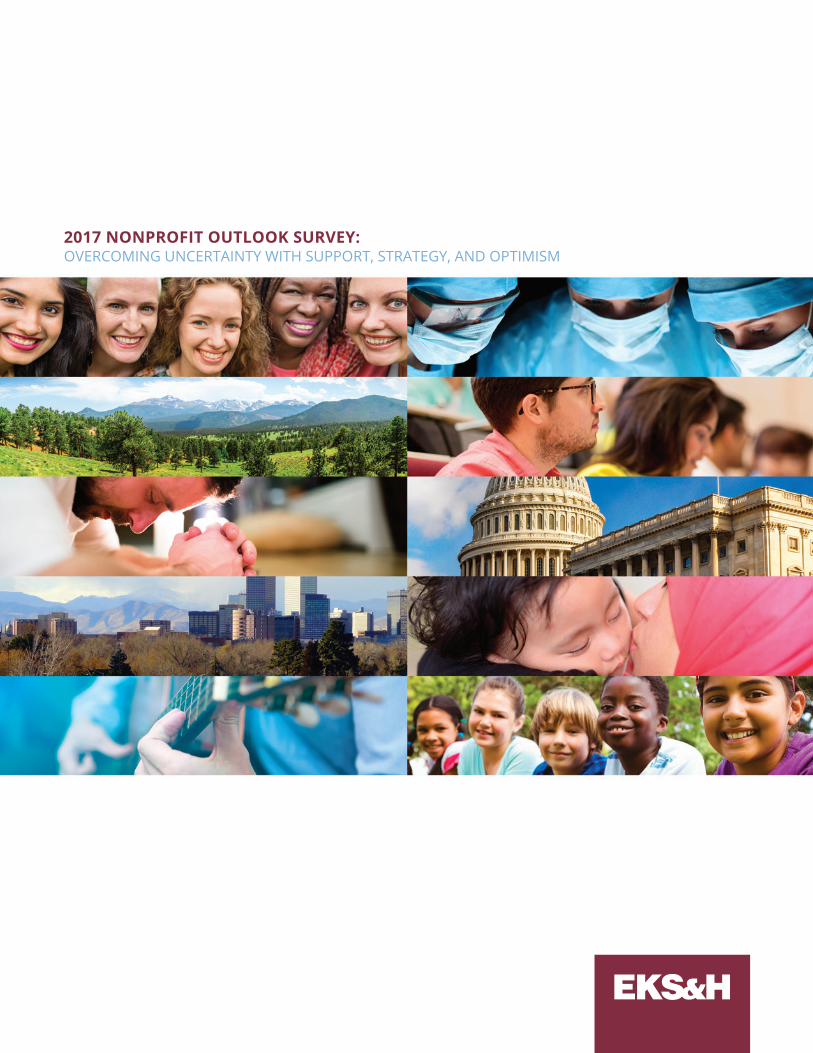
2017 NONPROFIT OUTLOOK SURVEY:OVERCOMING UNCERTAINTY WITH SUPPORT, STRATEGY, AND OPTIMISM
ABOUT EKS&H
EKS&H is a nationally recognized professional services
firm providing audit, tax, technology, wealth advisory, and
business consulting services to public and private clients
locally, nationally, and internationally. Our commitment
to client service has resulted in sustained growth since we
began in 1978. Working collaboratively, the best measure of
our success is the success of our clients.
Passion is a critical element to success.
The leaders of our nonprofit clients have passion for their
organizations’ missions, which is a large part why they’re
so successful. Similarly, we have a passion to serve these
nonprofit clients. One important element of our service is to
strive to present new, useful, and actionable information that
helps make better strategic decisions. In support of that goal,
we are proud to present the results of our latest Nonprofit
Outlook Survey.
In 2016, measures such as revenue and demand appear to have
improved for most organizations. Growing expenses, however,
tempered some of that success and impacted profitability. When
it comes to the 2017 outlook, many respondents expressed
some major uncertainty, particularly related to the economic
impacts of the changing control of government. In the face of
these unknowns, we are very pleased with the positive outlook
many participants expressed as it relates to revenue, profit, and
demand. We consider this confidence and optimism to be a
wonderful facet of the passion of our nonprofit client leaders.
As always, the economy will have important implications
related to attracting and retaining talent, and that appears to
have grown as an area of focus for 2017. In other good news,
wages are rising, board effectiveness appears to have improved
in many ways, and the attention given to strategically using
technology has also grown since our previous survey.
As always, the results described in the following pages could
not have been compiled without the generous time and effort
of many nonprofit leaders. We thank these individuals for
their participation and invite other nonprofits to participate
in the future.
If this year’s results raise any additional questions or concerns
about the strategic decisions of your organization, please do
not hesitate to reach out to us to discuss. We look forward to
serving you in 2017!
ABOUT THE EKS&H NONPROFIT CLIENT SERVICE TEAM
With more than 50 nonprofit industry-focused professionals
and dedicated audit, tax, and consulting partners, the
Denver-based nonprofit specialty group at EKS&H is
larger than all local nonprofit “niche” firms as well as the
nonprofit groups within the regional/national firms. We
currently serve a wide variety of more than 125 local and
national nonprofit clients, including private and community
foundations; professional associations; and organizations
involved with human services, animals, the environment,
healthcare, religion, education, fundraising, and the arts.
Ann Hinkins, CPA Lisa Meacham, CPA Ryan Sells, CPA Kelly Kozeliski, CPA Craig Choun, CPA Dori Eggett, CPA
2017 NONPROFIT OUTLOOK SURVEY:OVERCOMING UNCERTAINTY WITH SUPPORT,
STRATEGY, AND OPTIMISM
Key Findings
2016 Nonprofit Performance
2017 Nonprofit Outlook
2017 Goals
2017 Challenges
2017 Strategies for Success
Talent and Compensation
Technology and Giving
Board Performance
About the Survey and Participants
3
5
11
17
18
19
19
25
27
28
2

3
2016• Two-thirds of respondents indicated that revenue/support
exceeded expenses.
• Revenue grew for 57% of respondents in 2016 (only 51% expected revenue growth) and demand grew for 55% (only 35% expected demand growth). No organizations reported a decrease in demand.
• However, expenses increased for 62% of respondents, and employment grew for 42% of respondents.
•Asaresult,profitsdecreasedfor42%ofrespondents,andonly32%ofrespondentsgrewprofits.Still,thisresultexceedsthe22%whoexpectedprofitgrowthfor2016.
KEYFINDINGS

2017•Politicalchangesaretranslatingtosignificanteconomic
uncertainty — and uncertainty about how this will impact nonprofits.Morethanhalf(54%)ofrespondentsselected“unknown”todescribetheanticipatedeffectontheirorganizations.
•Nonprofitsaremorepositivethisyearthanthepreviousyearaboutgrowthinrevenue(58%versus51%),profit(41%versus22%), and demand (58% versus 35%), but surprisingly fewer (46% versus 52%) expect increases in costs.
• Almost one-third plan to grow employment. Related to that expectation, retaining talent has become the top goal of 2017, and the scarcity of talent is the second biggest challenge.
• Technology priorities have grown with the greatest increases in tracking impacts/outcomes, improving performance of existing systems, and donor/member relations and analysis.
• Board focus also improved in many areas since the previous year with mission, strategic planning, fundraising, and board member expectations all becoming higher priorities.
4

2016 NONPROFIT PERFORMANCE
REVENUE/SUPPORT EXCEEDING EXPENSES
In 2016, two-thirds of organizations indicated that revenue/support had exceeded
expenses. This represents an eight-point decrease from the percent that reported this
resultin2015andthelowestlevelinthepastfiveyears.Theseresultsforetellsubsequent
responses about the increase in expenses many organizations reported during 2016.
5
20120%
25%
50%
75%
100%REVENUE/SUPPORT EXCEEDING EXPENSES
2013 2014 2015 2016
69%76%
71%75%
67%
2/3 of respondents reported revenue/support exceeded expenses

REVENUE CHANGE
A majority (57%) of respondents indicated that revenue grew in 2016. (This includes one-
quarterofrespondentswhoachievedgrowthgreaterthan10%—mirroringafive-year
high from 2014 — and one-third of respondents who achieved 3% to 9%.) Just over one-
fifthofrespondentsreportednochangeinrevenue,andjustoverone-fifthofrespondents
reported a decrease.
6
0%
100%REVENUE CHANGE
p10%
p3%-10%
Neutral
q3%-10%
q10%
2013 2014 2015 20162012
Revenue pNeutral
Revenue q
201246%18%35%
201366%19%15%
201457%22%21%
201554%20%26%
201657%21%22%
15%
20%
18%
33%
13%24% 25% 20% 25%
32%
21%
13%
9%
34%
20%
15%
11%
32%
22%
10%
11%
42%
19%
8%7%

10%
20%
30%
40%
50%REVENUE SOURCES
Program Revenue(Membership, Tuition,Admissions, Sales of
Products and Services)
0Contributions Special Events Corporate/
FoundationGrants
GovernmentGrants
39%
30%
4%
13% 14%
0%
100%DEMAND CHANGE
p
Neutral
q
2013 2014 2015 20162012
43%
51%
7%
46%
49%
6%
57%
37%
7%
44%
52%
3%
55%
45%
7
REVENUE SOURCES (OTHER THAN INVESTMENT INCOME)
When asked about the source of revenue in 2016, average percentages increased for
program revenue (p3%), corporate/foundation grants (p4%), and government grants
(p1%). Revenue from special events decreased (q6%), and contributions stayed the same.
Note:Duetosignificantfluctuationsanddifferingyear-ends,investmentincomeresults
have been excluded from calculations.
DEMAND CHANGE
2016 represented another year in which more than half of respondents (55%) reported
increases in demand for programs and services. No respondents to this year’s survey
indicated that demand for services decreased. 55% represents a 20-point increase over
the percentage of respondents who expected demand to grow in 2016.
8
0%
100%EMPLOYMENT CHANGES
p
Neutral
q
2015 20162014
Employment pNeutral
Employment q
201436%59%5%
201538%57%5%
201642%47%11%
36%
59%
5%
38%
57%
5%
42%
47%
11%
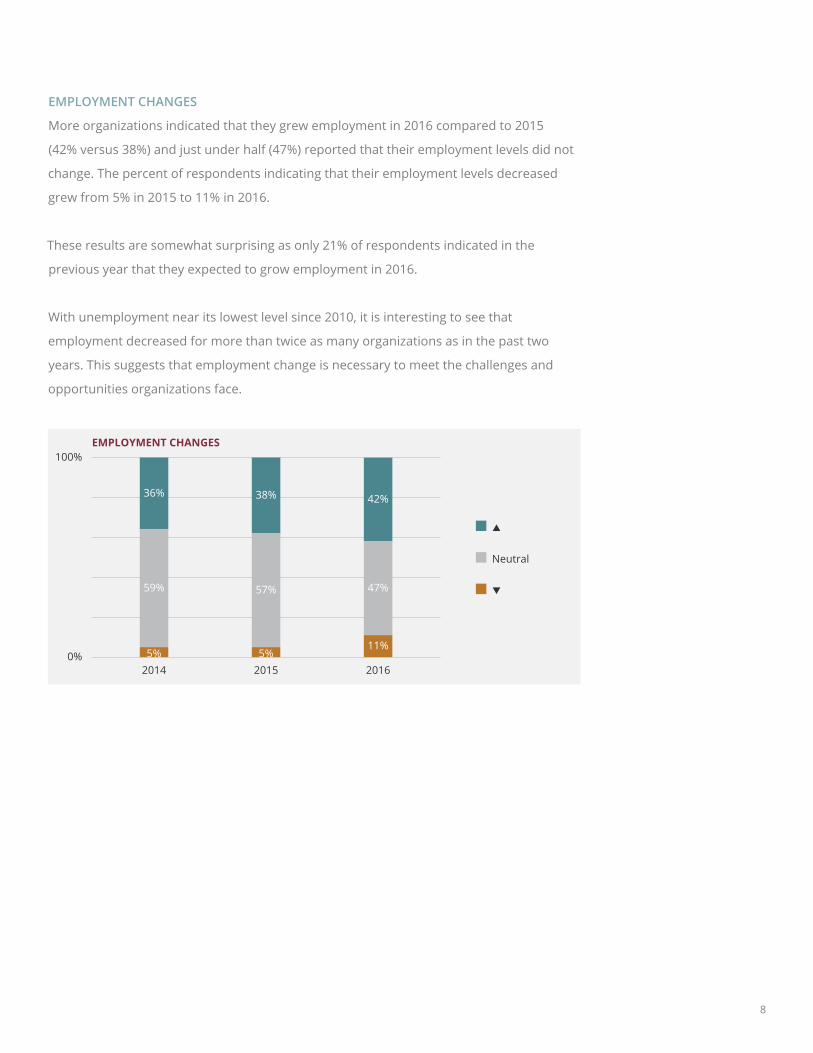
EMPLOYMENT CHANGES
More organizations indicated that they grew employment in 2016 compared to 2015
(42% versus 38%) and just under half (47%) reported that their employment levels did not
change. The percent of respondents indicating that their employment levels decreased
grew from 5% in 2015 to 11% in 2016.
These results are somewhat surprising as only 21% of respondents indicated in the
previous year that they expected to grow employment in 2016.
With unemployment near its lowest level since 2010, it is interesting to see that
employment decreased for more than twice as many organizations as in the past two
years. This suggests that employment change is necessary to meet the challenges and
opportunities organizations face.
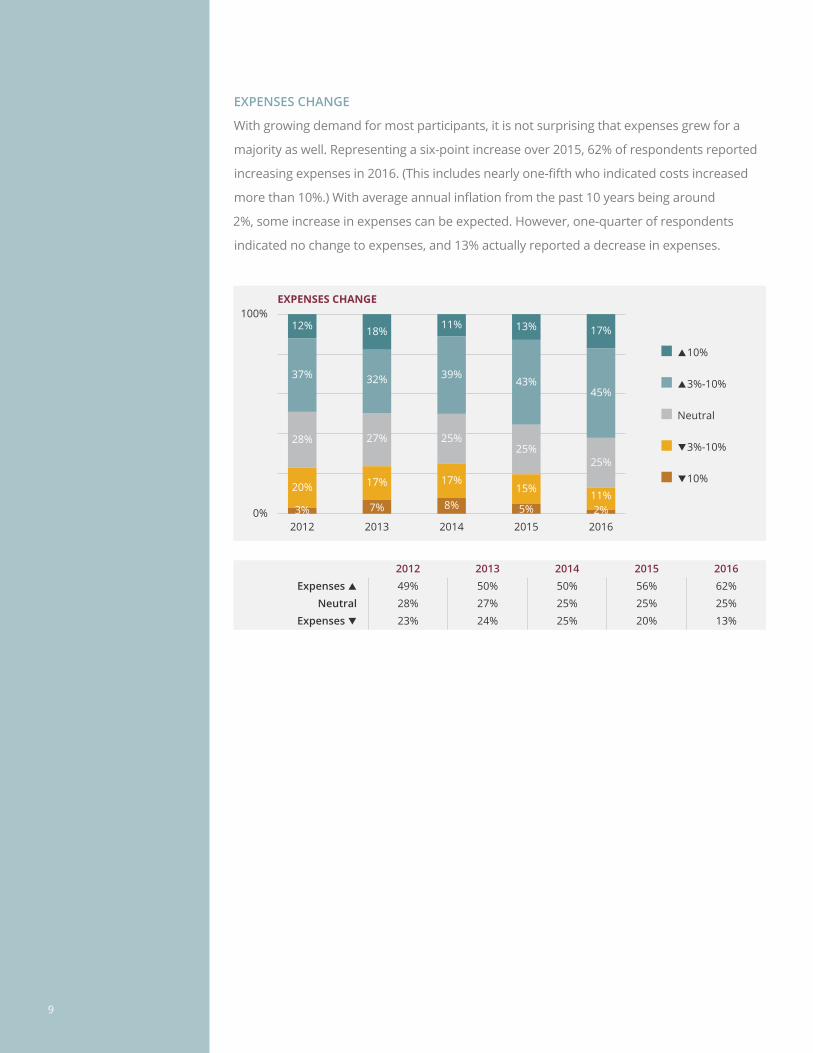
EXPENSES CHANGE
With growing demand for most participants, it is not surprising that expenses grew for a
majority as well. Representing a six-point increase over 2015, 62% of respondents reported
increasingexpensesin2016.(Thisincludesnearlyone-fifthwhoindicatedcostsincreased
morethan10%.)Withaverageannualinflationfromthepast10yearsbeingaround
2%,someincreaseinexpensescanbeexpected.However,one-quarterofrespondents
indicated no change to expenses, and 13% actually reported a decrease in expenses.
9
0%
100%EXPENSES CHANGE
p10%
p3%-10%
Neutral
q3%-10%
q10%
2013 2014 2015 20162012
Expenses pNeutral
Expenses q
201249%28%23%
201350%27%24%
201450%25%25%
201556%25%20%
201662%25%13%
12% 18% 11% 13% 17%
37% 32% 39%43%
45%
28% 27% 25%25%
25%
20% 17% 17%15%
11%3% 7% 8% 5% 2%
10
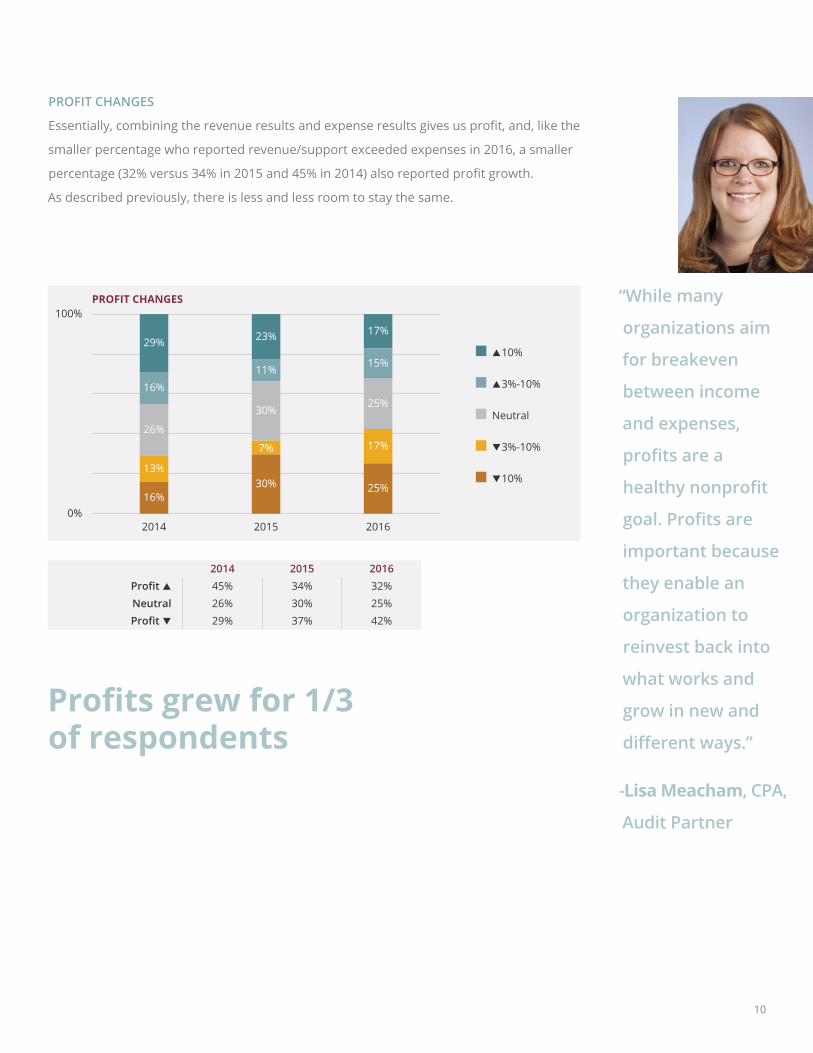
PROFIT CHANGES
Essentially,combiningtherevenueresultsandexpenseresultsgivesusprofit,and,likethe
smaller percentage who reported revenue/support exceeded expenses in 2016, a smaller
percentage(32%versus34%in2015and45%in2014)alsoreportedprofitgrowth.
As described previously, there is less and less room to stay the same.
0%
100%PROFIT CHANGES
2015 20162014
Profit pNeutralProfit q
201445%26%29%
201534%30%37%
201632%25%42%
p10%
p3%-10%
Neutral
q3%-10%
q10%
29%
16%
26%
13%
16%
23%
11%
30%
7%
30%
17%
15%
25%
17%
25%
“While many
organizations aim
for breakeven
between income
and expenses,
profits are a
healthy nonprofit
goal. Profits are
important because
they enable an
organization to
reinvest back into
what works and
grow in new and
different ways.”
-Lisa Meacham, CPA,
Audit Partner
Profits grew for 1/3 of respondents
11
2017 NONPROFIT OUTLOOK
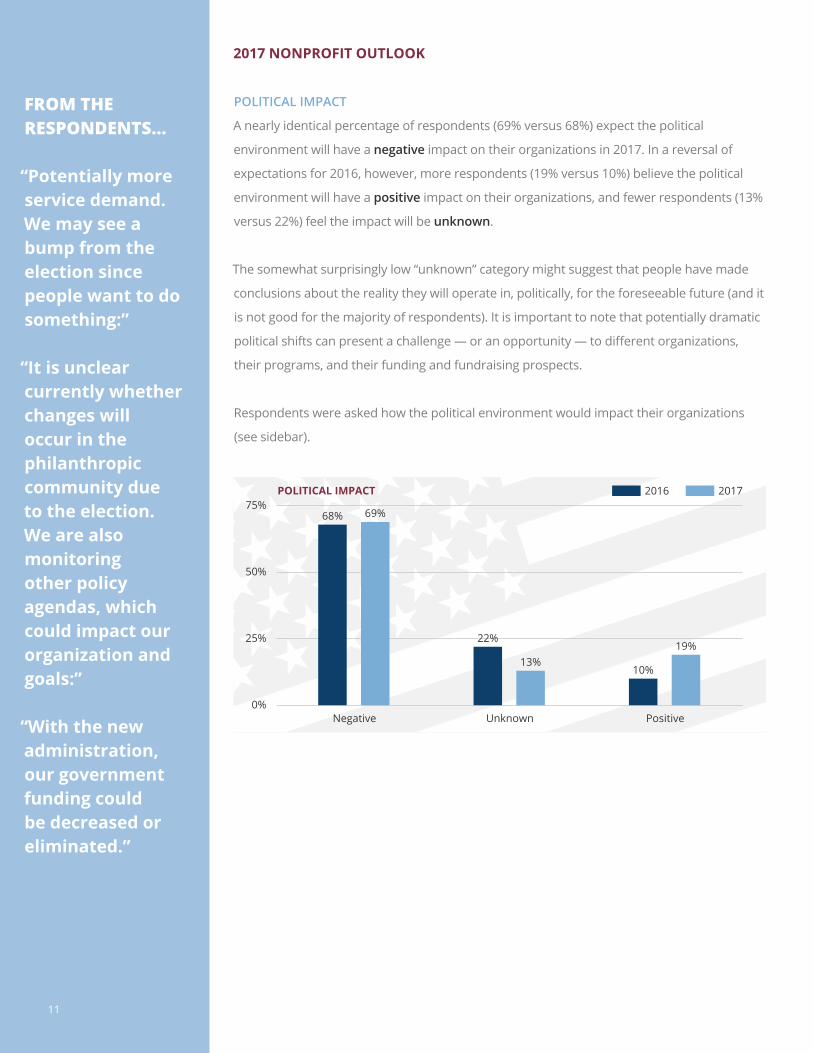
POLITICAL IMPACT
A nearly identical percentage of respondents (69% versus 68%) expect the political
environment will have a negative impact on their organizations in 2017. In a reversal of
expectations for 2016, however, more respondents (19% versus 10%) believe the political
environment will have a positive impact on their organizations, and fewer respondents (13%
versus 22%) feel the impact will be unknown.
The somewhat surprisingly low “unknown” category might suggest that people have made
conclusions about the reality they will operate in, politically, for the foreseeable future (and it
is not good for the majority of respondents). It is important to note that potentially dramatic
politicalshiftscanpresentachallenge—oranopportunity—todifferentorganizations,
their programs, and their funding and fundraising prospects.
Respondents were asked how the political environment would impact their organizations
(see sidebar).
0%
25%
50%
75%POLITICAL IMPACT
PositiveUnknownNegative
20172016
10%
19%22%
13%
68% 69%
“Potentially more service demand. We may see a bump from the election since people want to do something:”
“It is unclear currently whether changes will occur in the philanthropic community due to the election. We are also monitoring other policy agendas, which could impact our organization and goals:”
“With the new administration, our government funding could be decreased or eliminated.”
FROM THE RESPONDENTS…

12
ECONOMIC IMPACT
The economic outlook, however, is much more uncertain yet positive. More than half of
survey participants (54%) selected unknown when asked how the economic environment
would impact their organizations in 2017. More than one-third (39%) indicated it would have
a positive impact, and, somewhat remarkably, only 7% of respondents felt the economic
impact would be negative for their organizations.
Respondents were asked how the economic environment would impact their
organizations (see sidebar).
0%
25%
50%
75%ECONOMIC IMPACT
PositiveUnknownNegative
20172016
42%39%37%
54%
22%
7%
FROM THE RESPONDENTS…
“I think that the expected pro-business policies of the new administration will increase the optimism of our benefactors.”
“We are unsure of what will happen with federal funding opportunities in 2017 and beyond, and this could have a negative impact on our organization. Changes to tax codes could impact us either positively or negatively.”
“Local economy is strong impacting program revenue. Current market outlook is expected to support investment returns.”

13
REVENUE/SUPPORT EXCEEDING EXPENSES
Expectationsaboutrevenue/supportexceedingexpensesin2017reflectasignificant
(13-point) jump from expectations for 2016. Impressively, 85% expect revenue/support to
exceed expenses while 15% do not.
With expectation percentages returning to levels similar to those in past years, one must
wonder whether 2016’s outlook was an anomaly.
Itmaybesurprisingtoconsiderthisyear’soptimisticoutlookwhencomparingthedifference
between expectations and reality for 2016; although 72% predicted a positive balance, only
67% achieved that. Adding the political and economic uncertainty expressed, this makes the
18-point increase from 2016 actual to 2017 expectations even more interesting.
20130%
25%
75%
50%
100%REVENUE/SUPPORT EXCEEDING EXPENSES
2014 2015 2016 2017
NoYes
80% 83% 86%
72%
20% 17% 14%
28%
85%
15%
“While some might
anticipate after
organizations
do not meet
expectations in one
year, they would
lower expectations
for the next. But
perhaps a more
positive outlook
reflects lessons
learned and
changes made.”
-Ann Hinkins CPA,
Audit Partner

14
REVENUE AND PROFIT GROWTH OUTLOOK
Mirroring the optimism of the previous response, more participants (58% versus 51%)
expect revenue to grow in 2017. Similarly, many more respondents (41% versus 22%)
expectprofitstoincrease.(Recallthat57%achievedrevenuegrowth,butonly32%
achievedprofitgrowthin2016.)
Respondents were also asked to describe how revenue and support would increase or
why it might decrease (see sidebar).
20150%
25%
50%
75%REVENUE AND PROFIT GROWTH OUTLOOK
Revenue Growth
Profit Growth
2016 2017
58%
41%
22%19%
51%
60%
FROM THE RESPONDENTS…
“2017 is [our organization’s] anniversary, and special events are being planned with projections of additional donors:”
“Expand into new areas, utilize healthcare worker outreach, and price more competitively.”
“Cyclical nature of [our programs]:”
“Engage board in fundraising efforts.”
“…continue to ramp up advertising and community engagement to increase referrals to our program.”
Respondents who expect profit to grow in 2017 nearly doubled from 22% to 41%
15
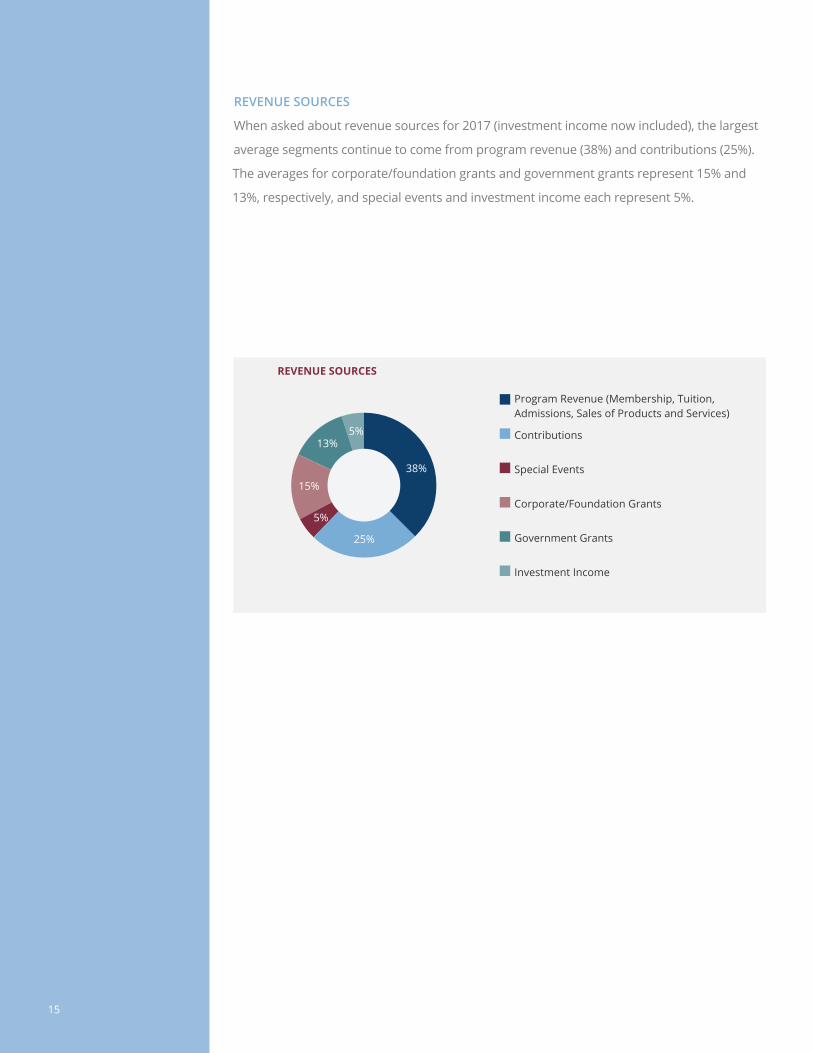
REVENUE SOURCES
When asked about revenue sources for 2017 (investment income now included), the largest
average segments continue to come from program revenue (38%) and contributions (25%).
The averages for corporate/foundation grants and government grants represent 15% and
13%, respectively, and special events and investment income each represent 5%.
REVENUE SOURCES
Special Events
Contributions
Program Revenue (Membership, Tuition,Admissions, Sales of Products and Services)
Government Grants
Corporate/Foundation Grants
Investment Income
5%
5%
15%
13%
38%
25%

16
DEMAND AND EXPENSE GROWTH OUTLOOK
One of the most surprising results in this year’s survey was the deviation of organizations’
expectations for demand and expenses.
More organizations (58%) expect demand to increase (a 23-point increase compared to 2016
expectations), but fewer organizations (46%) expect expenses to increase (down six points
compared to 2016 expectations).
Possibleexplanationsmightbe1)anticipatedefficienciestoberealizedthisyear,2)excess
capacity created in 2016 that will be utilized in 2017, or 3) leaving demand unmet.
20130%
25%
50%
75%DEMAND AND EXPENSE GROWTH OUTLOOK
2014 2015 2016 2017
ExpensesDemand
37%
23%
52%
35%
46%40%
50%
57%52%
58%

17
2017 GOALS
Highlighting the growing concern of competition for talent, retain qualified staff was the
new top goal selected by survey respondents. (It is interesting to note that just three years
agothisgoalwasnoteveninthetopfive.)Thissignificantchangemightbeafacetofthe
expected improved economic environment and its implications on demand for talent or a
concernaboutstrategicandeffectiveorganizationalsuccessionplanningforkeyindividuals.
On the other hand, some things never change: obtain new funding sources/obtain more
funding from current sources and meet annual budget remain critically important goals,
coming in second and third.
Respondents were asked what concrete steps would be taken to achieve top goals
(see sidebar).
2017GOALS 2016 2015 2014 2013
Obtain New Funding Sources/Obtain MoreFunding from Current Sources
Meet Annual BudgetImprove Effectiveness of Fundraising Efforts and Activities
Recruit Qualified StaffStart New/Expand Current Programs
Conduct Long-Term Strategic and Financial PlanningImprove Program Reporting Efficiency and Accuracy
Collaboration with Other Organizations/Entities
2 1 1 1 1
3 2 3 2 34 4 5 4 45 5 7 10 106 6 6 5 67 8 - - -8 7 8 9 79 10 9 8 9
Retain Qualified Staff 1 3 4 6 5
Increase Effectiveness of Board Involvement and Governance 10 9 10 7 8
FROM THE RESPONDENTS…
“Several targeted hires in early 2017; three-year forecast in Q1 2017; fundraising plan in place and progress tracked monthly.”
“We set quarterly goals and have quarterly strategic planning meetings.”
“Strategic planning cycle, exploration of new revenue opportunities, continued build out and deployment of new programs.”
“Continue to improve online recruiting capabilities, re-engage current staff…”

18
2017 CHALLENGES
Unlike the change at the top of this year’s goals, challenge in predicting future funding
continues to be the top challenge since we began surveying in 2008. Two new options,
scarcity of talented job candidates and cybersecurity, started the list impressively at
No. 2 (perhaps echoing the sentiments of the top goal and the importance of succession
planning) and No. 5, respectively. Inadequate access to funding was the only other
challenge that appears to have grown in importance. Interestingly, the challenge of
inefficient, insufficient, or outdated technologydroppedfiveplacessince2016.
Respondents were asked what concrete steps would be taken to manage top challenges
(see sidebar).
2017CHALLENGES 2016 2015 2014 2013
Scarcity of Talented Job CandidatesPotential Loss of Top Management/Talent
Inadequate Access to FundingCybersecurity
Obstacles to New Program ImplementationBoard Effectiveness/Engagement
Inefficient, Insufficient, or Outdated TechnologyIncreased Compliance and Regulation
1 1 1 1 1
5
Challenge in Predicting Future Funding
Challenge in Predicting Cash Flow Needs
2 - - - -3 2 5 4 64 5 3 5 3
- - - -6 4 4 2 47 6 - - -8 3 2 3 59 8 7 8 7
10 7 6 6 2
FROM THE RESPONDENTS…
“Focus on fundraising effort and team; offer training to compliance staff; use staff time to incorporate ‘team problem solving.’”
“New fundraising technology platform; succession planning.”
“Building infrastructure, including technology to help us stay abreast of increasing compliance and regulation requirements.”

19
0%
25%
50%EMPLOYMENT GROWTH OUTLOOK
2014 2015 2016 2017
28%
37%
21%
31%
2017 STRATEGIES FOR SUCCESS
TALENT AND COMPENSATION
EMPLOYMENT GROWTH OUTLOOK
Almost one-third of respondents indicated they plan to grow employment in 2017. This
is similar to percentages from 2014 and 2015 and 10 points higher than the hiring
expectationfor2016.However,itremainssignificantlylower(11points)thanthe42%who
reported actual employment increases in the previous year.
31% of respondents expect to increase hiring

20
25%
50%
75%
100%FUNCTIONAL AREAS FOR INCREASED EMPLOYMENT
Direct Service/Program Management/Member or Constituent Services
0%Fundraising/Development
Administrative
21%26%
79%
FUNCTIONAL AREAS FOR INCREASED EMPLOYMENT
With nearly 80% of respondents indicating that new hires will be made in direct service/
program management/member or constituent services, hiring will clearly be driven by
recipient demand for services. Fundraising/development will be an area of increased
hiringforapproximatelyone-quarterofrespondents,andadministrative will be a focus
ofincreasedemploymentforapproximatelyone-fifthofrespondents.(Thisrepresentsa
reversal in priority from 2016 when 36% expected to increase hiring for administrative
and 22% expected to increase hiring for fundraising/development personnel.)

21
75%50%25%0%
CHALLENGES TO ATTRACTING AND RETAINING TALENT
Advancement Opportunities
Workloads/Staff Resources
Competitive Pay
Cost of Living/Housing
Organizational Culture
Other
67%
67%
40%
31%
4%
8%
CHALLENGES TO ATTRACTING AND RETAINING TALENT
Whenaskedaboutchallengesnonprofitsfacewhenattractingandretainingtalent,the
two top issues from 2016, competitive pay and advancement opportunities, were again
identifiedbythemostrespondents.
However, comparing 2016’s percentages to this year’s, competitive pay seems to be
decreasing as a challenge (67% versus 72% in 2016), and advancement opportunities
seems to be a growing challenge (67% versus 59% in 2016).
22
75%50%25%0%
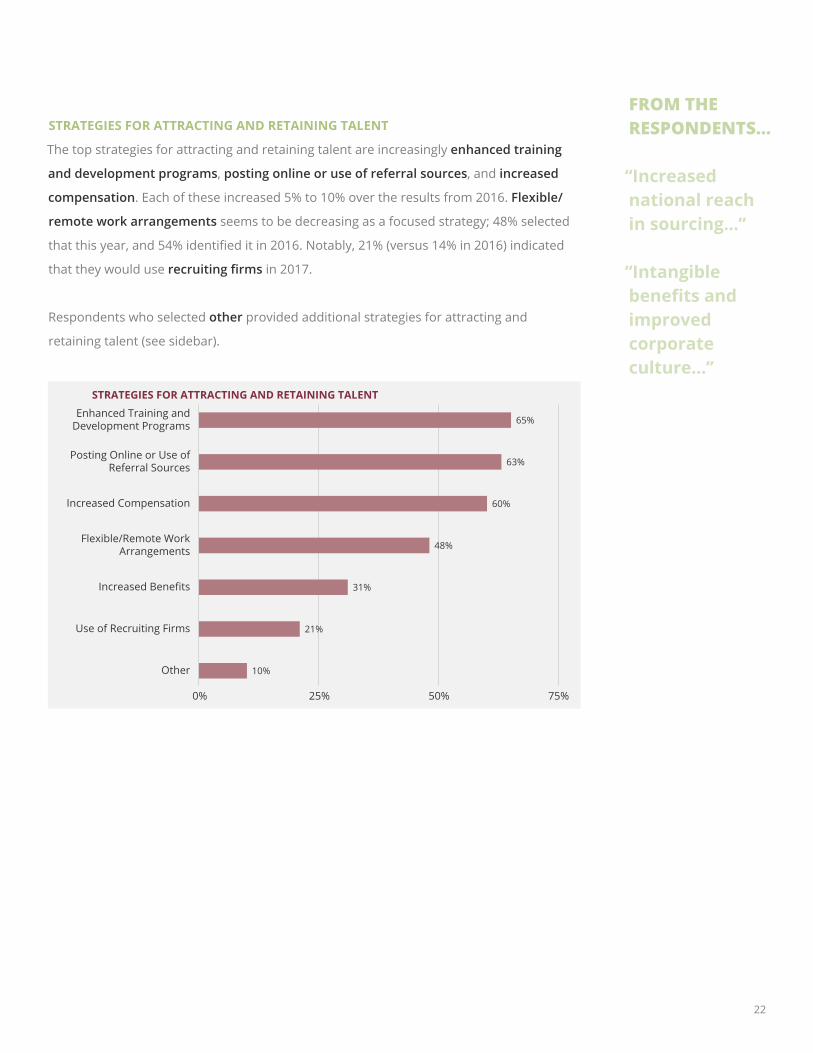
STRATEGIES FOR ATTRACTING AND RETAINING TALENT
Posting Online or Use ofReferral Sources
Enhanced Training andDevelopment Programs
Flexible/Remote WorkArrangements
Increased Compensation
Increased Benefits
Use of Recruiting Firms
Other
65%
63%
60%
48%
31%
21%
10%
STRATEGIES FOR ATTRACTING AND RETAINING TALENT
The top strategies for attracting and retaining talent are increasingly enhanced training
and development programs, posting online or use of referral sources, and increased
compensation. Each of these increased 5% to 10% over the results from 2016. Flexible/
remote work arrangements seems to be decreasing as a focused strategy; 48% selected
thatthisyear,and54%identifieditin2016.Notably,21%(versus14%in2016)indicated
that they would use recruiting firms in 2017.
Respondents who selected other provided additional strategies for attracting and
retaining talent (see sidebar).
FROM THE RESPONDENTS…FROM THE RESPONDENTS…
“Increased national reachin sourcing…”
“Intangible benefits and improved corporate culture…”
q+6%0%
20%
40%
60%
80%
100%COMPENSATION 2016 2017
q4%-6% q2%-4% No Change p2%-4% p4%-6% p+6%
0% 0% 2% 0% 2% 0%
23%
6%
61%
83%
7% 7% 5% 4%
q+6%0%
10%
20%
30%
40%
50%HEALTHCARE BENEFITS 2016 2017
q4%-6% q2%-4% No Change p2%-4% p4%-6% p+6%
2%4%
0% 0%
4%6%
30% 29%
24% 24%
13%
22%
28%
14%
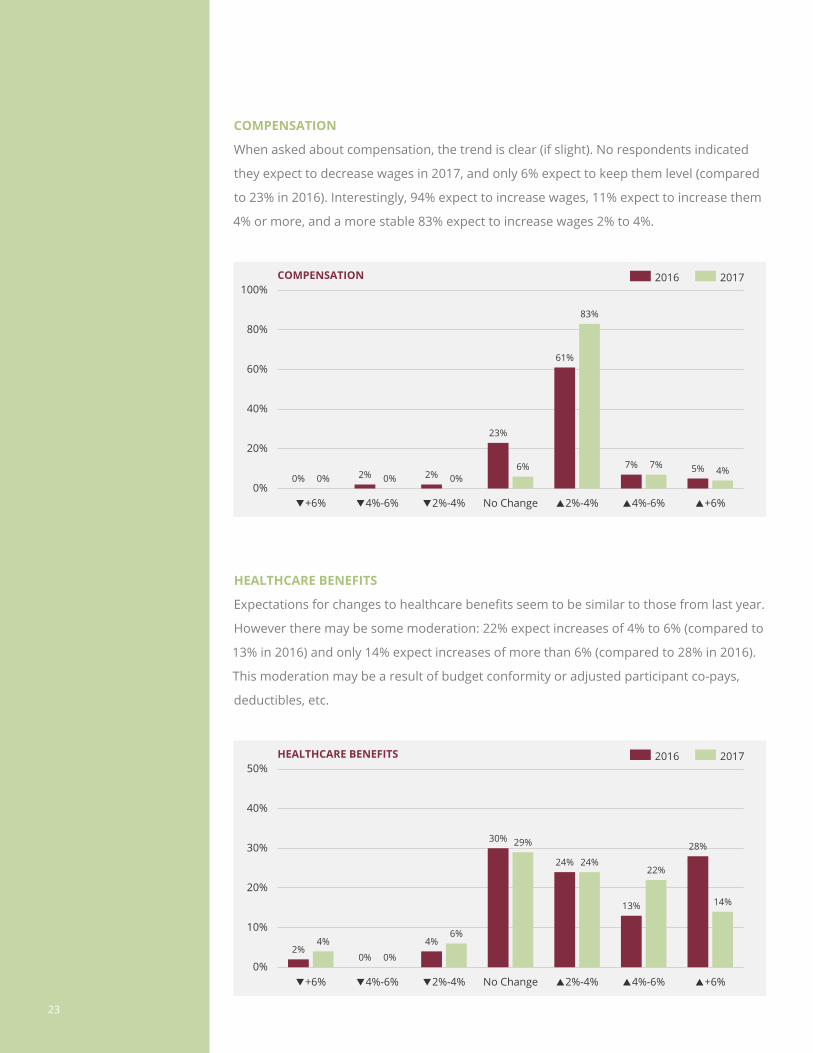
COMPENSATION
When asked about compensation, the trend is clear (if slight). No respondents indicated
they expect to decrease wages in 2017, and only 6% expect to keep them level (compared
to 23% in 2016). Interestingly, 94% expect to increase wages, 11% expect to increase them
4% or more, and a more stable 83% expect to increase wages 2% to 4%.
HEALTHCARE BENEFITS
Expectationsforchangestohealthcarebenefitsseemtobesimilartothosefromlastyear.
However there may be some moderation: 22% expect increases of 4% to 6% (compared to
13% in 2016) and only 14% expect increases of more than 6% (compared to 28% in 2016).
This moderation may be a result of budget conformity or adjusted participant co-pays,
deductibles, etc.
23
24
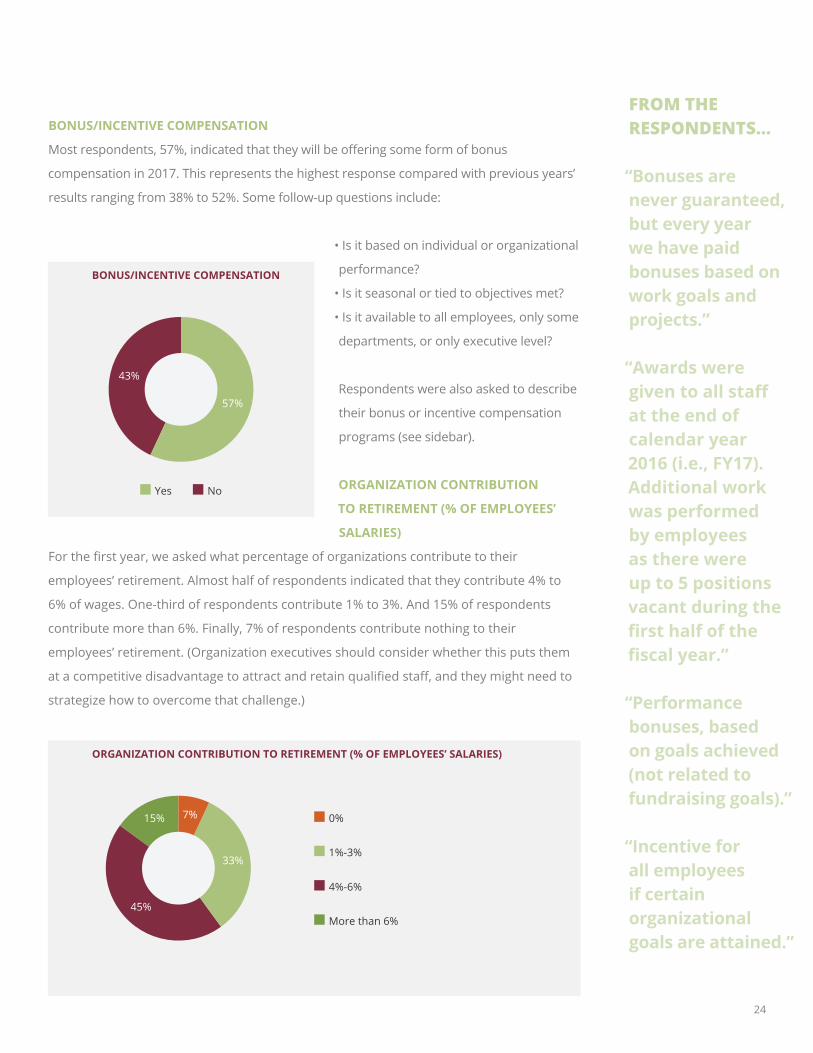
BONUS/INCENTIVE COMPENSATION
Mostrespondents,57%,indicatedthattheywillbeofferingsomeformofbonus
compensation in 2017. This represents the highest response compared with previous years’
resultsrangingfrom38%to52%.Somefollow-upquestionsinclude:
• Is it based on individual or organizational
performance?
• Is it seasonal or tied to objectives met?
• Is it available to all employees, only some
departments, or only executive level?
Respondents were also asked to describe
their bonus or incentive compensation
programs (see sidebar).
ORGANIZATION CONTRIBUTION
TO RETIREMENT (% OF EMPLOYEES’
SALARIES)
Forthefirstyear,weaskedwhatpercentageoforganizationscontributetotheir
employees’ retirement. Almost half of respondents indicated that they contribute 4% to
6% of wages. One-third of respondents contribute 1% to 3%. And 15% of respondents
contribute more than 6%. Finally, 7% of respondents contribute nothing to their
employees’ retirement. (Organization executives should consider whether this puts them
atacompetitivedisadvantagetoattractandretainqualifiedstaff,andtheymightneedto
strategize how to overcome that challenge.)
BONUS/INCENTIVE COMPENSATION
Yes No
57%
43%
ORGANIZATION CONTRIBUTION TO RETIREMENT (% OF EMPLOYEES’ SALARIES)
1%-3%
0%
More than 6%
4%-6%
7%
33%
45%
15%
FROM THE RESPONDENTS…
“Bonuses are never guaranteed, but every year we have paid bonuses based on work goals and projects.”
“Awards were given to all staff at the end of calendar year 2016 (i.e., FY17). Additional work was performed by employees as there were up to 5 positions vacant during the first half of the fiscal year.”
“Performance bonuses, based on goals achieved (not related to fundraising goals).”
“Incentive for all employees if certain organizational goals are attained.”

100%80%60%0% 20% 40%
TECHNOLOGY PRIORITIES
Tracking Impact/Outcomes
Improving Performance of Existing Systems
Social Media and Online Presence
Data Quality/Integration and BusinessIntelligence/Analytics
Donor/Member Relations and Analysis
Donation/Income Collection
Outsourcing Technology Support/Strategy
PriorityConsiderationNot a Focus
Remote Access for Employees
Cybersecurity
Program/Service Delivery to Recipients
Banking, Cash Management,and Expense Payment
59%
46%
33%
20%
15%
11%
9%
6%
7%
4%
6%
24%
31%
43%
46%
35%
37%
35%
39%
26%
30%
17%
17%
22%
24%
33%
50%
52%
56%
56%
67%
67%
78%
TECHNOLOGY AND GIVING
TECHNOLOGY PRIORITIES
The biggest change in technology priorities for 2017, as compared to those for 2016, was
tracking impact/outcomes, which increased 25 points to become a priority for almost
80% of respondents. Improving performance of existing systems also increased, by
14 points, to be a priority of two-thirds of respondents. Finally, donor/member relations
and analysis also increased as a technology priority, by 10 points, to 56% of respondents.
Technology priorities that decreased in importance include banking, cash management,
and expense payment, down nine points, and remote access for employees, down seven
points. It may be that these more foundational organizational technologies have already
been addressed by the majority of organizations.
25

26
CAMPAIGN STATUS
Currently Conducting a Capital Campaign(Silent Phase)
Currently Conducting a Capital Campaign(Public Phase)
No Capital Campaign Plans for the Near Future (2-3 years)
Planning a Capital Campaign for the Next Year
16%
14%
11%59%
CAMPAIGN STATUS
Fewer respondents indicated they will be in a capital campaign (public phase), 16%
versus 22% in 2016, and in planning stages, 11% versus 27%. More will be in a capital
campaign (silent phase), 14% versus 8% in 2016, and many more expressed no capital
campaign plans for the near future, 59% versus 43%.
Fewer organizations appear to be in campaign-mode

BOARD PERFORMANCE
PRIORITIES
When it comes to board priorities, many areas seem to be improving and becoming
a greater focus. Comparing the two highest focus categories from 2016 to 2017,
organizational mission is up from 77% to 87%, strategic plans up from 60% to 75%,
fundraising expectations are up from 48% to 60%, and board member expectations
are up from 43% to 65%. One area, however, that has not become a higher priority is
organizational evaluation methods, down from 39% to 35%. Leadership evaluation
methods remained the same at 41%.
Respondents were also asked to share what new strategies were working in relation to
their boards (see sidebar).
PRIORITIES
Organization Mission
Strategic Plan
Fundraising Expectations
Board Member Expectations
Leadership Evaluation Methods
Organization Evaluation Methods
4%
2%
9%
9%
2%
26%
52%
43%
30%
22%
12%
2%
4%
8%
2%
15%
11%
35%
32%
30%
43%
29%
24%
7%
20%
23%
24%
42%
39%
High FocusLow Focus
FROM THE RESPONDENTS…
“Incorporated an individualized ‘board orientation’ for new board members.”
“New financial statements that are easier to read, encouragement to join and participate in a board committee.”
“We formalized a board policy manual.”
27

28
40%35%30%25%0% 5% 10% 15% 20%
ANNUAL REVENUE
$26 Million-$50 Million
$11 Million-$25 Million
$6 Million-$10 Million
More than $100 Million
$51 Million-$100 Million
$1 Million-$5 Million
Less than $1 Million
4%
1%
13%
25%
15%
32%
4%
35%30%25%0% 5% 10% 15% 20%
TOTAL EMPLOYEES
100-249
50-99
250-500
More than 500
25-49
Less than 25
6%
10%
29%
9%
19%
27%
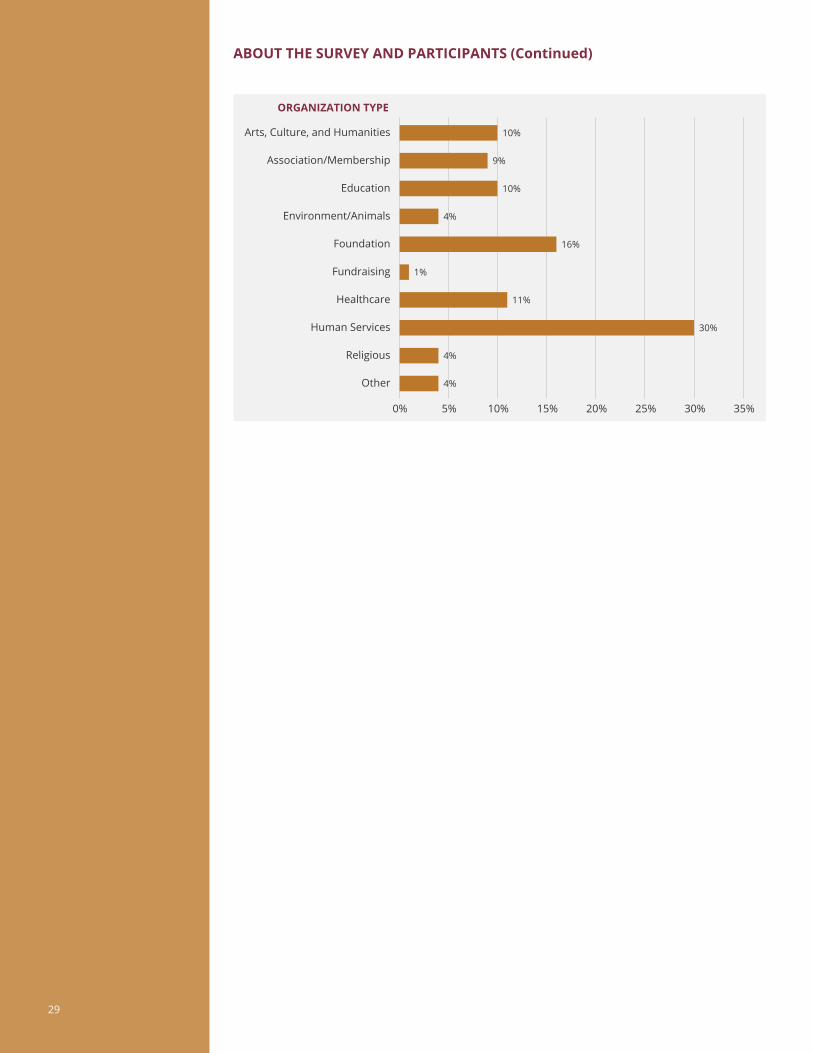
ABOUT THE SURVEY AND PARTICIPANTS
TheEKS&HNonprofitOutlookSurveyhasgrowntobecomeaninformativebarometer
of executives of organizations in Colorado and the western U.S., representing a wide
varietyoftypesandsizesofnonprofits.The2017surveyinvolvedalmost90executive
participants. This report includes results we consider to be meaningful, insightful,
strategic,andactionableinformationfornonprofits.Formoreinformationaboutthe
survey, please contact partners Ann Hinkins at [email protected] or Lisa Meacham
at [email protected], or call us at 303-740-9400.
29
35%15%10%5% 20% 25% 30%
ORGANIZATION TYPE
Education
Foundation
Healthcare
Association/Membership
Arts, Culture, and Humanities
Religious
Environment/Animals
Fundraising
Human Services
Other
0%
10%
9%
10%
4%
16%
1%
11%
4%
4%
30%
ABOUT THE SURVEY AND PARTICIPANTS (Continued)
30
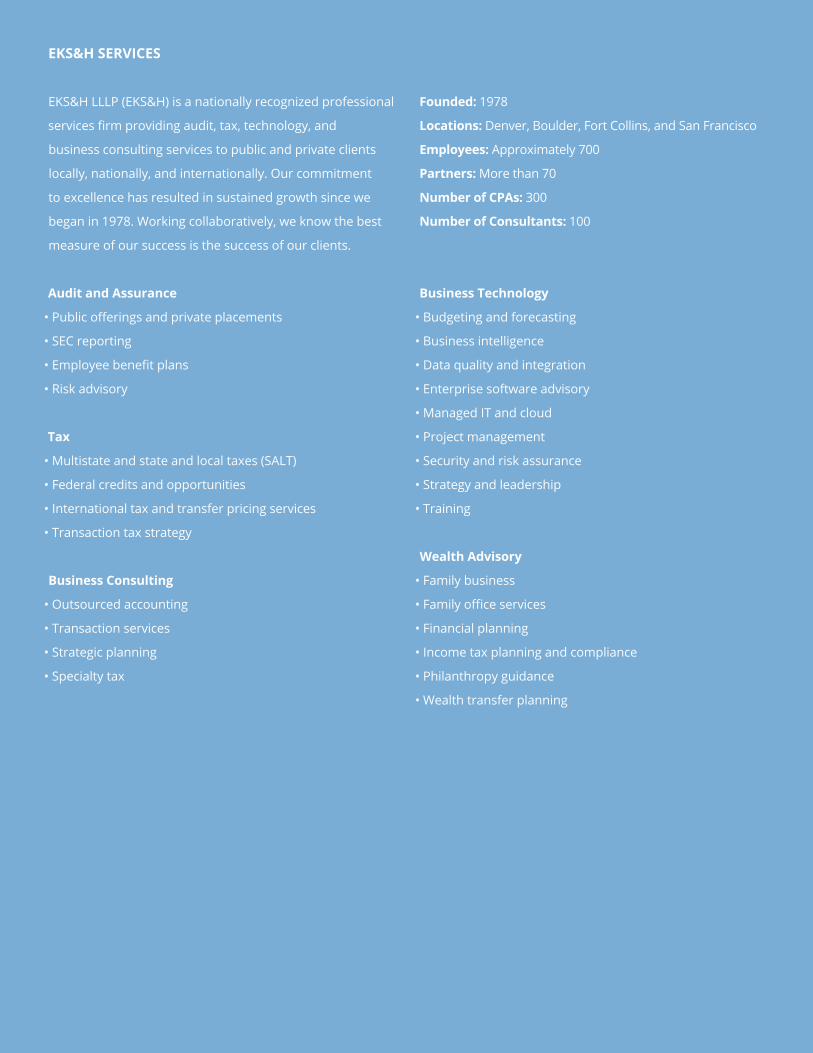
EKS&H SERVICES
EKS&H LLLP (EKS&H) is a nationally recognized professional
servicesfirmprovidingaudit,tax,technology,and
business consulting services to public and private clients
locally, nationally, and internationally. Our commitment
to excellence has resulted in sustained growth since we
began in 1978. Working collaboratively, we know the best
measure of our success is the success of our clients.
Audit and Assurance
•Publicofferingsandprivateplacements
• SEC reporting
•Employeebenefitplans
• Risk advisory
Tax
• Multistate and state and local taxes (SALT)
• Federal credits and opportunities
• International tax and transfer pricing services
• Transaction tax strategy
Business Consulting
• Outsourced accounting
• Transaction services
• Strategic planning
• Specialty tax
Founded: 1978
Locations: Denver, Boulder, Fort Collins, and San Francisco
Employees: Approximately 700
Partners: More than 70
Number of CPAs: 300
Number of Consultants: 100
Business Technology
• Budgeting and forecasting
• Business intelligence
•Dataqualityandintegration
• Enterprise software advisory
• Managed IT and cloud
• Project management
• Security and risk assurance
• Strategy and leadership
• Training
Wealth Advisory
• Family business
•Familyofficeservices
• Financial planning
• Income tax planning and compliance
• Philanthropy guidance
• Wealth transfer planning

303-740-9400 www.EKSH.com