Embed Size (px)
Citation preview

2017 MAJOR PROJECTS PIPELINE REPORT Q U E E N S L A N D E N G I N E E R I N G
C O N S T R U C T I O N O U T L O O K
A JOINT INITIATIVE OF THE QMCA, CSQ AND IAQ
© FEBRUARY 2017 QMCA, CSQ & IAQThe copyright of this document belongs to the Queensland Major Contractors Association (QMCA), Construction Skills Queensland (CSQ) and Infrastructure Association of Queensland.
All rights reserved.
No part of this document may be reproduced or transmitted in any form or by any means, including photocopying, without the prior written permission of the QMCA. All requests to be directed to the QMCA.
EXCLUSION OF LIABILITYThis document is strictly provided on the basis that, to the extent permissible by law, neither the QMCA, CSQ, IAQ or BIS Oxford Economics nor any person involved in the production of this document: (1) warrants in any way the reliability or accuracy of any representation herein; (2) assumes any duty of care or other legal duty to any person who may use or rely on this document and persons using or relying on this document do so entirely at their own risk; (3) shall have any liability to any person with respect to any loss or damage howsoever arising, including in contract, tort or under statute, or otherwise from the use of or reliance upon this document.
ACKNOWLEDGEMENTSThis report has been prepared by Adrian Hart and Aleck Schoevers (BIS Oxford Economics) with the assistance of Iain Ward, Fernando Fajardo, Chris Stanley, Tim Phelps, Sandra Poon (QMCA); Brett Schimming, Susan Armstrong, Robert Sobyra (CSQ); Steve Abson, Loren Hickey and Jon Frew (IAQ). We would also like to acknowledge and thank the Queensland Government Department of Infrastructure, Local Government and Planning, Building Queensland, Queensland Rail, Project Owners and the wider investment community for their time and input into this report.
Note: Although great care has been taken to ensure accuracy and completeness of this report, BIS Oxford Economics Pty Ltd does not accept responsibility for the completeness and accuracy of the factual information on which its opinions and assumptions are based.
QMCA CONTACTQueensland Major Contractors Association GPO Box 3254 Brisbane QLD 4001 Australia T +61 (0)7 3211 4900 E [email protected]
CSQ CONTACTConstruction Skills Queensland PO Box 3294 South Brisbane QLD 4101 Australia T 1800 798 488 F +61 (0)7 3846 5067 E [email protected]
IAQ CONTACTInfrastructure Association of Queensland PO Box 2146 Brisbane QLD 4001 Australia T 0413 384 429 E [email protected]
BIS OXFORD ECONOMICS CONTACTAdrian HartSenior Manager – Infrastructure & MiningBIS Shrapnel Pty LimitedLevel 8, 99 Walker StreetNorth Sydney NSW 2060AustraliaT +61 (0)2 8458 4200F +61 (0)2 9959 5795E [email protected]

Executive Summary .............................................................................................................................................................. 6
1. Queensland Major Projects Outlook ........................................................................................................................ 11
2. International & Australian Economy – Setting the Stage ................................................................................. 23
3. Queensland Economy ................................................................................................................................................... 29
4. Queensland Construction Industry Review .......................................................................................................... 33
5. Queensland Construction Workforce Implications ............................................................................................. 39
6. Key Implications, Challenges and Risks ................................................................................................................ 42
Appendix – 2017 Major Projects List ............................................................................................................................ 58
TABLE OF CONTENTS
4
FOREWORD
The Pipeline is an evolution of the annual QMCA Major Projects Report, which for the past 10 years has provided deep insights into the scale of major projects in our State, informing government and wider industry participants. This year, with the continued support of CSQ and added involvement of the IAQ, the accuracy of project information within the Pipeline is even more robust and reliable, allowing us to make informed commentary on the challenges and implications of the Pipeline for the benefit of our collective members. Sincere thanks also to BIS Oxford Economics for their expert guidance and compilation of the project listings and detailed economic analysis.
This year, we have worked closely with State Government departments, project owners and the wider investment community to both identify and understand where each project is in its lifecycle. We have also lowered the project threshold from $100 million to $50 million to include a greater number of projects.
The result is Australia’s foremost state infrastructure Pipeline, containing an authoritative picture of both public and private sector funded major projects in Queensland over the next 5 years. Not only does our Pipeline provide key information on location, value and timing of each project, but also presents compelling information on jobs creation and skills demand.
It is notable that after a decade of strong private sector investment, fuelled by resources such as coal seam gas and liquefied natural gas demand, the ratio of public to
privately funded projects has shifted dramatically in the past three years from 4:1 in favour of privately funded, to around 50:50 equal split. The ability of Governments to deliver on their planned infrastructure therefore assumes even greater importance and so it is pleasing that both Commonwealth and State Government are continuously improving transparency in the planning and prioritisation of projects and the investment decisions that support them.
Rather than an ability to identify projects, the greatest threat to the Pipeline is the availability of funds and timely investment decisions. This is common to both public and privately funded projects. Worryingly, our report identifies a potential funding shortfall in publicly funded infrastructure, growing to $1 billion by 2019-2020. This supports the case for tough funding reforms and shorter term ways to bridge the ‘funding gap’ through asset leasing and debt funding. From 2018, the health of the Pipeline also relies heavily on unfunded work in the Galillee Basin, which grows to represent some 20% of the whole Pipeline value by 2020.
It is our aim that the 2017 Pipeline will be the leading source of industry guidance for strategic planning, policy positioning and opportunity identification. Experience from successful countries and jurisdictions around the world show that when public and private sectors face infrastructure challenges together, the public and economy are the big winners. Our Pipeline provides a catalyst for an even closer union between government and the private sector. We look forward to seizing opportunities to improve collaboration to benefit both our members and all Queenslanders.
We are proud to introduce the 2017 Major Projects Pipeline Report (Pipeline), an initiative of the Queensland Major Contractors Association (QMCA), Construction Skills Queensland (CSQ) and the Infrastructure Association of Queensland (IAQ).
Iain Ward President
Queensland Major Contractors Association
March 2017
Steve Abson Chief Executive Officer
Infrastructure Association of Queensland
Brett Schimming Chief Executive Officer
Construction Skills Queensland
52017 MAJOR PROJECTS PIPELINE REPORT – QUEENSLAND ENGINEERING CONSTRUCTION OUTLOOK

6
EXECUTIVE SUMMARY
The Pipeline has evolved from the Major Projects Reports published regularly between 2006 and 2016. During this period, Queensland experienced a substantial boom and bust cycle in construction activity and major project work. While times have been tough in the major project market in recent years, there are now signs of improvement.
After many years of decline, public investment in infrastructure is starting to recover, while rising commodity prices are changing the mood in the resources industry towards cautious optimism. Despite promises and plans however, many major projects remain unfunded and the consequent outlook for major project work remains highly uncertain and volatile.
The aim of the Pipeline is to cut through some of this uncertainty by compiling a comprehensive list of major project work and analysing the corresponding demand for skilled construction labour based on both the completion of existing projects and the likelihood of potential projects proceeding. A complete list of major projects considered for this analysis, and the explicit assumptions for each project regarding work done and construction workforces employed each year, are provided in the Appendix at the end of this report. This first Pipeline incorporates several key improvements, including:
• Increased accuracy of the information to deliver an even more authoritative document for the infrastructure industry to use as a tool for forward planning. In addition to QMCA member companies and CSQ, the Pipeline has received a far more rigorous review process for accuracy, including:• Detailed review from State Government infrastructure
departments, non-government organisations, independent infrastructure bodies and investor group representation and
• Additional review by the IAQ across investment, finance, advisory and design disciplines – in total representing a further 56 additional infrastructure companies.
• Increased project visibility. The value threshold in the Pipeline has been lowered from $100 million to $50 million thereby capturing a greater number of projects and increasing visibility.
• New project classifications. The Pipeline has adopted a new set of project classifications to bring greater clarity to the funded and unfunded status of the projects, including
Announced, Under Procurement and Under Construction (representing Funded categories) and Credibly Proposed, Prospective and Unlikely (representing Unfunded categories).
• An enhanced ‘Implications’ chapter. This examines the industry wide implications of the Pipeline including an assessment of the current public sector funding gap and commentary on funding options.
• Improved private and public sector analysis. The Pipeline includes greater analysis and assessment of where public and private sector project investment intersect.
As well as presenting the Pipeline, the report discusses the key drivers of major project activity, the overarching outlook and the implications of this outlook for Queensland.
Key FindingsThe key findings from the 2017 Major Projects Pipeline Report (Pipeline) are:
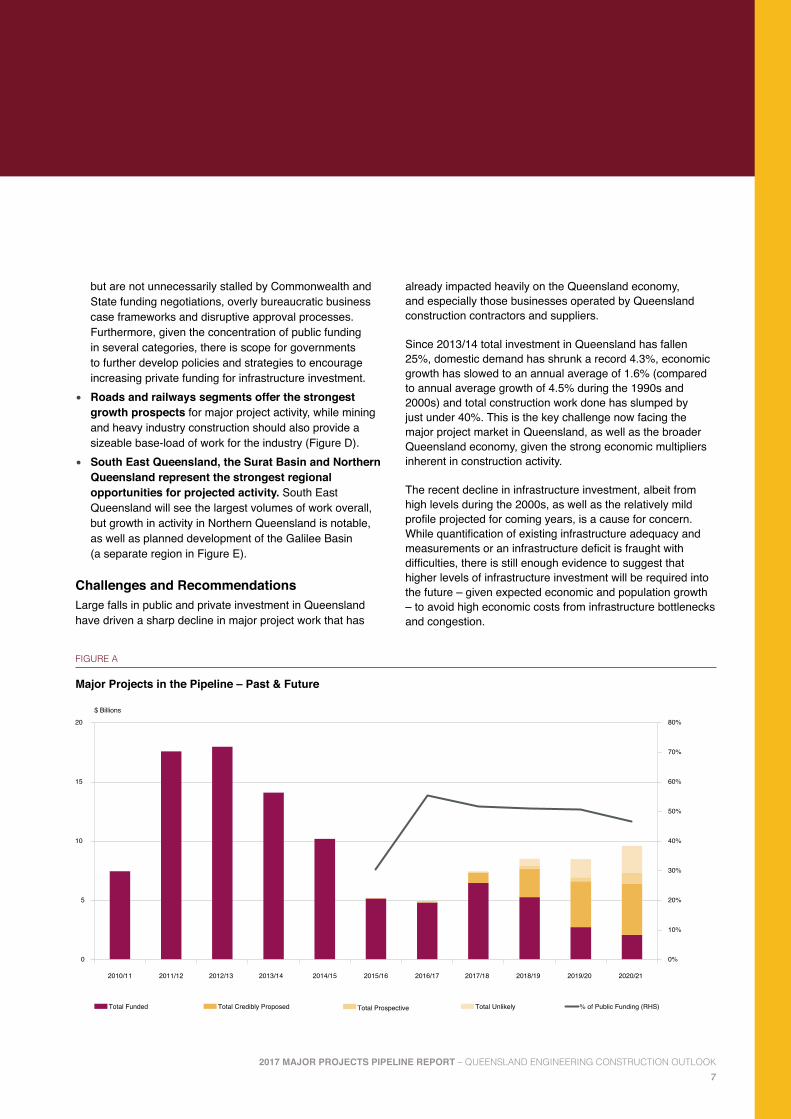
• As previously forecast, a sharp decline in major project work continued through 2015/16. Major project work will reach a trough in 2016/17 before a modest rise in 2017/18 (Figure A). Beyond 2017/18, the certainty of the Pipeline is diminished and is based on unfunded projects proceeding into the construction phase, across both public and private sectors. As such, the outlook beyond 2017/18 is highly susceptible to risk.
• The value of work in the Pipeline (funded and unfunded) is higher than outlined in the 2016 Major Projects Report, even accounting for the lower $50 million threshold value for inclusion. A range of new projects have been announced in the past year, particularly across roads, railways and electricity. However, the value of projected activity that remains unfunded in the forecast remains a concern (Figure B).
• The total value of major project work in the Pipeline over the five year period from 2016/17 to 2020/21 inclusive is $39.1 billion, of which roughly half is projected to be funded by the public sector. This compares to $65 billion in major project work over the past five years (Figure C). Given this, it is important to ensure that projects continue to be selected and financed on sensible criteria,
Welcome to the 2017 Major Projects Pipeline Report (Pipeline), developed by the Queensland Major Contractors Association (QMCA), Construction Skills Queensland (CSQ) and the Infrastructure Association of Queensland (IAQ).
72017 MAJOR PROJECTS PIPELINE REPORT – QUEENSLAND ENGINEERING CONSTRUCTION OUTLOOK
but are not unnecessarily stalled by Commonwealth and State funding negotiations, overly bureaucratic business case frameworks and disruptive approval processes. Furthermore, given the concentration of public funding in several categories, there is scope for governments to further develop policies and strategies to encourage increasing private funding for infrastructure investment.
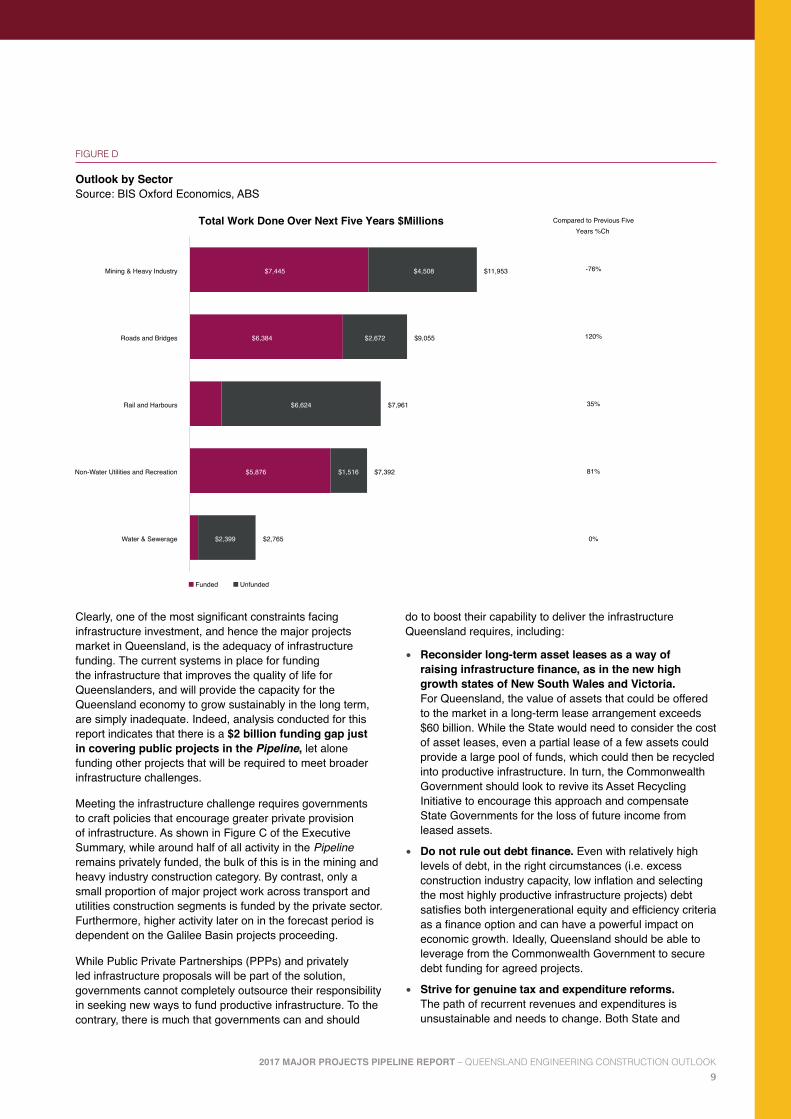
• Roads and railways segments offer the strongest growth prospects for major project activity, while mining and heavy industry construction should also provide a sizeable base-load of work for the industry (Figure D).
• South East Queensland, the Surat Basin and Northern Queensland represent the strongest regional opportunities for projected activity. South East Queensland will see the largest volumes of work overall, but growth in activity in Northern Queensland is notable, as well as planned development of the Galilee Basin (a separate region in Figure E).
Challenges and RecommendationsLarge falls in public and private investment in Queensland have driven a sharp decline in major project work that has
already impacted heavily on the Queensland economy, and especially those businesses operated by Queensland construction contractors and suppliers.
Since 2013/14 total investment in Queensland has fallen 25%, domestic demand has shrunk a record 4.3%, economic growth has slowed to an annual average of 1.6% (compared to annual average growth of 4.5% during the 1990s and 2000s) and total construction work done has slumped by just under 40%. This is the key challenge now facing the major project market in Queensland, as well as the broader Queensland economy, given the strong economic multipliers inherent in construction activity.
The recent decline in infrastructure investment, albeit from high levels during the 2000s, as well as the relatively mild profile projected for coming years, is a cause for concern. While quantification of existing infrastructure adequacy and measurements or an infrastructure deficit is fraught with difficulties, there is still enough evidence to suggest that higher levels of infrastructure investment will be required into the future – given expected economic and population growth – to avoid high economic costs from infrastructure bottlenecks and congestion.
FIGURE A
Major Projects in the Pipeline – Past & Future
0%
10%
20%
30%
40%
50%
60%
70%
80%
0
5
10
15
20
2010/11 2011/12 2012/13 2013/14 2014/15 2015/16 2016/17 2017/18 2018/19 2019/20 2020/21
Total Funded Total Credibly Proposed Total Prospective Total Unlikely % of Public Funding (RHS)
$ Billions

8
EXECUTIVE SUMMARY
FIGURE B
Total Work Done Forecast 2016/17 Forecasts vs 2015/16 Forecasts
FIGURE C
Funding Mix: Public versus Private Funding for Major Projects
20000
15000
5000
10000
17500
7500
12500
2500
0
20000
15000
5000
10000
17500
7500
12500
2500
0
$ Million $ Million
12/13Current
12/13Previous
13/14Current
13/14Previous
14/15Current
14/15Previous
15/16Current
15/16Previous
16/17Current
16/17Previous
17/18Current
17/18Previous
18/19Current
18/19Previous
19/20Current
19/20Previous
20/21Current
20/21Previous
Total Not Funded - Prior Total Funded - Prior Galilee Basin Total Projects < $100 Million Total Not Funded Total Funded
0% 20% 40% 60% 80% 100%
Roads & Bridges
Rail & Harbours
Water & Sewerage
Non-Water Utilities & Recreation
Mining & Heavy Industry
Total
Publicly Funded Privately Funded
$11,953 Mil.
$7,392 Mil.
$2,765 Mil.
$7,961 Mil.
$9,055 Mil.
$39,127 Mil.
92017 MAJOR PROJECTS PIPELINE REPORT – QUEENSLAND ENGINEERING CONSTRUCTION OUTLOOK
FIGURE D
Outlook by Sector Source: BIS Oxford Economics, ABS
Clearly, one of the most significant constraints facing infrastructure investment, and hence the major projects market in Queensland, is the adequacy of infrastructure funding. The current systems in place for funding the infrastructure that improves the quality of life for Queenslanders, and will provide the capacity for the Queensland economy to grow sustainably in the long term, are simply inadequate. Indeed, analysis conducted for this report indicates that there is a $2 billion funding gap just in covering public projects in the Pipeline, let alone funding other projects that will be required to meet broader infrastructure challenges.
Meeting the infrastructure challenge requires governments to craft policies that encourage greater private provision of infrastructure. As shown in Figure C of the Executive Summary, while around half of all activity in the Pipeline remains privately funded, the bulk of this is in the mining and heavy industry construction category. By contrast, only a small proportion of major project work across transport and utilities construction segments is funded by the private sector. Furthermore, higher activity later on in the forecast period is dependent on the Galilee Basin projects proceeding.
While Public Private Partnerships (PPPs) and privately led infrastructure proposals will be part of the solution, governments cannot completely outsource their responsibility in seeking new ways to fund productive infrastructure. To the contrary, there is much that governments can and should
do to boost their capability to deliver the infrastructure Queensland requires, including:
• Reconsider long-term asset leases as a way of raising infrastructure finance, as in the new high growth states of New South Wales and Victoria. For Queensland, the value of assets that could be offered to the market in a long-term lease arrangement exceeds $60 billion. While the State would need to consider the cost of asset leases, even a partial lease of a few assets could provide a large pool of funds, which could then be recycled into productive infrastructure. In turn, the Commonwealth Government should look to revive its Asset Recycling Initiative to encourage this approach and compensate State Governments for the loss of future income from leased assets.
• Do not rule out debt finance. Even with relatively high levels of debt, in the right circumstances (i.e. excess construction industry capacity, low inflation and selecting the most highly productive infrastructure projects) debt satisfies both intergenerational equity and efficiency criteria as a finance option and can have a powerful impact on economic growth. Ideally, Queensland should be able to leverage from the Commonwealth Government to secure debt funding for agreed projects.
• Strive for genuine tax and expenditure reforms. The path of recurrent revenues and expenditures is unsustainable and needs to change. Both State and
$7,445
$6,384
$5,876
$4,508
$2,672
$6,624
$1,516
$2,399
$11,953
$9,055
$7,961
$7,392
$2,765
Mining & Heavy Industry
Roads and Bridges
Rail and Harbours
Non-Water Utilities and Recreation
Water & Sewerage
Funded Unfunded
Compared to Previous Five Years %Ch
Total Work Done Over Next Five Years $Millions
-76%
120%
35%
81%
0%

10
Federal Governments must continue to make concerted efforts to eliminate structural deficits in Budgets through wholesale tax and expenditure reforms, providing greater fiscal headroom for investment in necessary and productive infrastructure.
• Provide increased certainty of Commonwealth contribution to funding of transport projects on the Land Transport Network by reforming the funding relationship between State and Commonwealth Governments. Queensland’s reliance on Commonwealth funding is increasing and delays over funding contribution levels (50:50, 80:20) decreases business confidence and leads to uncertainty of the projects in the Pipeline.
• Provide increased certainty of long-term Commonwealth funding streams through expanding the number of City Deals that provide a structured, coordinated plan for the long-term funding of city infrastructure by all tiers of government. The Townsville City Deal – Australia’s first, struck in December 2016, is an important start, but the priority list of infrastructure projects must be a productive and efficient use of taxpayer’s funds.
• State Government to do more to identify where privately-led proposals can provide critical infrastructure. Currently, more than 30 Market Lead Proposals (MLPs) remain in assessment stages and only one project, the Logan Motorway Upgrade, has been officially approved. Boosting private investment in infrastructure, whether through MLPs, concessional finance like the Northern Australia Infrastructure Facility (NAIF) or via project bonds will remain an important part of the solution to the infrastructure challenge.
• Establish the rules for value capture funding approaches as soon as possible, so that these can be considered for future infrastructure projects. Ultimately, the most efficient solution is to replace a range of property-related taxes (including stamp duty) with a broader-based land tax that would more fairly and efficiently capture increases in values that could be used for infrastructure provision.
Even with funding solutions in place, meeting Queensland’s infrastructure challenge still means adhering to key rules to ensure the best projects are selected and procured efficiently, generating the biggest ‘bang for the infrastructure buck’. This means, as always:
• Basing short and long-term public investment programs on maximising economic benefits through transparent cost benefit analysis (CBA).
• Maximising efficiencies in public infrastructure provision and reducing costs by following through with reforms to the public infrastructure procurement process, as outlined by the Productivity Commission’s review in 2014.
• Developing long-term industry resourcing plans as Queensland increasingly competes with other states (as well as overseas) for infrastructure funding and skills.
• Encouraging growth in industry productivity through innovation, training and entrepreneurship.
Risks to the OutlookThe Pipeline is subject to significant upside and downside risks. Despite the reasonably mild profile of work projected, there is still the potential for further, more volatile, cycles ahead given Queensland’s natural strengths and advantages: its increasing connections with the fast-growing economies of Asia, strong population growth, and high quality natural resources.
Forecasting the timing and strength of the emerging upturn in major project work remains difficult, as many of the major projects identified in this Pipeline are currently unfunded.
In this respect, the key risks that may affect the Pipeline are:
• The economic outlook for key trading partners, the strategic decisions they make in achieving sustainable growth, and how this will impact on the global trade of resources for which Queensland has a strong supply position, particularly coking coal, thermal coal and gas.
• The trajectory of commodity prices, particularly for coal (both thermal and coking), as well as oil prices (which can influence returns to liquefied natural gas (LNG) projects).
• Movements in the value of the Australian dollar, which not only affect the profitability and competitiveness of resources projects but also helps drive investment in other tradeables sectors of the Queensland economy, including tourism, agriculture, education and manufacturing.
• Political risks, in particular, decisions by State and Federal Governments in tackling debts and deficits, and how this may play out in terms of funding public infrastructure projects through the forecast period.
While most of these risks are outside of the control of those operating in the major projects space, governments and industry participants should continue to focus on what can be controlled to ensure that the Queensland economy remains on a sustainable footing. This includes taking on the recommendations in this report with the long-term aim of mitigating the volatility of the boom/bust investment cycle and achieving high quality, predictable and sustainable outcomes, safe workplaces and decent working conditions. Maintaining a healthy Queensland economy depends on sustaining innovative industries, which are flexible in responding to the challenges ahead, and have the right mix of skills and competencies to meet future demand.
EXECUTIVE SUMMARY

112017 MAJOR PROJECTS PIPELINE REPORT – QUEENSLAND ENGINEERING CONSTRUCTION OUTLOOK
1. QUEENSLAND MAJOR PROJECTS OUTLOOK
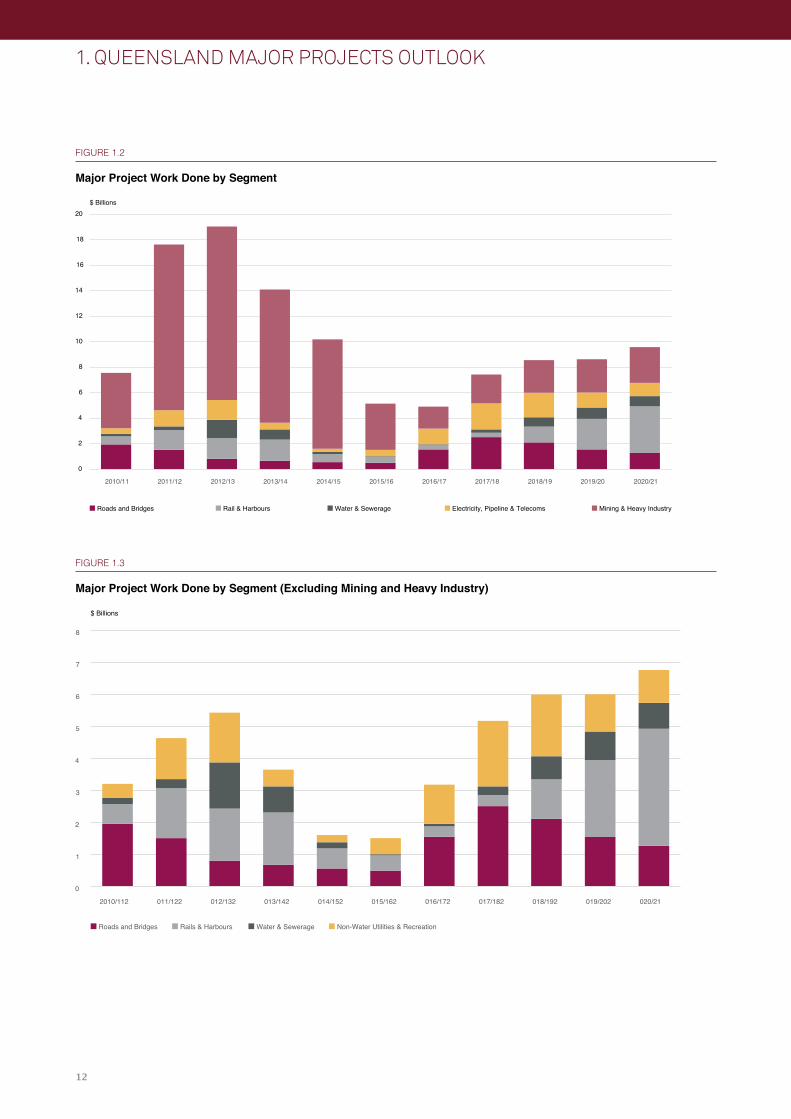
Key FindingsFigures 1.1 to 1.3 highlight historical activity and projections for major project work to 2020/21 based on the 2017 Major Projects Pipeline Report (Pipeline). Key points from this analysis are:
• As previously forecast, a sharp fall in major project work continued through 2015/16. Queensland engineering construction for major projects fell to $5.2 billion in 2015/16, down 75% from the 2012/13 peak of $18.7 billion. Falling mining investment was the key driver of the decline. By contrast, non-mining major project activity fell only marginally in 2015/16, with electricity, telecoms and roads activity rising over the year. Accordingly, the mining and heavy industry share of total major project work decreased in 2015/16, falling to 65% of the work done, from 85% in 2014/15.
• Major project work is expected to trough in 2016/17, but rise in subsequent years. In many respects, major project activity in Queensland has almost completed its transition from the mining boom inspired peak. Currently, major project activity is the lowest it has been since 2009/10. Excluding mining and heavy industry construction, major project work is the lowest it has been for over a decade. On the positive side, current activity levels are still higher than they used to be pre-mining boom. There is also positive upside risks to the outlook if commodity prices, particularly for coal, remain elevated.
• Non-mining engineering construction sectors will drive growth in major project work in Queensland over the next few years. Roads, electricity and telecommunications sectors are all expected to benefit from rising levels of non-mining investment. This will more than offset a further significant decline in mining-related major project
The 2017 Major Projects Pipeline List (List) is presented in the Appendix. This year the List has been expanded to include projects in excess of $50 million (compared to $100 million previously) and was developed by BIS Oxford Economics in coordination with Queensland Major Contractors Association (QMCA), Construction Skills Queensland (CSQ) and the Infrastructure Association of Queensland (IAQ) member input throughout November and December 2016.
FIGURE 1.1
Major Project Work Done – All Segments
0
5
10
15
20
2010/11 2011/12 2012/13 2013/14 2014/15 2015/16 2016/17 2017/18 2018/19 2019/20 2020/21
Total Funded (LHS) Total Not Funded (LHS)
$ Billions
12
FIGURE 1.2
Major Project Work Done by Segment
FIGURE 1.3
Major Project Work Done by Segment (Excluding Mining and Heavy Industry)
1. QUEENSLAND MAJOR PROJECTS OUTLOOK
0
2
4
6
8
10
12
14
16
18
20
2010/11 2011/12 2012/13 2013/14 2014/15 2015/16 2016/17 2017/18 2018/19 2019/20 2020/21
Roads and Bridges Rail & Harbours Water & Sewerage Electricity, Pipeline & Telecoms Mining & Heavy Industry
$ Billions
0
1
2
3
4
5
6
7
8
2010/112 011/122 012/132 013/142 014/152 015/162 016/172 017/182 018/192 019/202 020/21
Roads and Bridges Rails & Harbours Water & Sewerage Non-Water Utilities & Recreation
$ Billions

132017 MAJOR PROJECTS PIPELINE REPORT – QUEENSLAND ENGINEERING CONSTRUCTION OUTLOOK
work expected in 2016/17. However, mining-related major project work is itself expected to move higher in subsequent years, and could further increase if commodity prices remain high.
• The total value of major project work in the Pipeline over the five-year period from 2016/17 to 2020/21 inclusive is $39.1 billion, of which roughly half is projected to be funded by the public sector. This compares to $65 billion in major project work over the past five years.
• 2017/18 represents the peak in funded major project work. While growth in major project work may continue beyond this, this is predicated on currently unfunded projects proceeding, including large public sector road and rail projects, as well as another round of resources investment (including the Galilee Basin). As such, the outlook for total major project work is highly susceptible to risk beyond 2017/18.
Funded versus Unfunded ProjectsThis analysis is based on a considered view of both funded and unfunded projects. Consequently, it is likely to provide a more realistic outlook of major project activity in Queensland.
"Funded" project categories include:
• Announced: Projects that have funding support but have not yet entered the procurement stage (as at March 2017).
• Under Procurement: Projects in a procurement stage but have not yet started construction (as at March 2017).
• Under Construction: Projects under construction.
"Unfunded" project categories include:
• Unlikely: Projects considered unlikely to occur in the next five years, even if announced.
• Prospective: Projects considered likely to occur over next five years but not yet formally proposed.
• Credibly Proposed: Projects that are supported by governments and/or the private sector but still in pre-feasibility/business case mode and so do not have funding committed.
Figure 1.4 illustrates the outlook for major project activity based on the subcategories of funded and unfunded work. While total major project activity is projected to rise through much of the forecast period, the outlook for funded work (incorporating those projects Announced, Under Procurement or Under Construction) peaks in aggregate during 2017/18.
Given the limits in funding future projects, and that current projects will eventually move to completion, funded work done will always reach a point from which it inexorably declines. However, the funded forecast view is also like that of a “worst case scenario” outlook, should international developments or public sector finances deteriorate significantly, or the combination of threats to the Queensland construction industry remain unaddressed. Regardless, to have a growing Pipeline of major project work beyond this requires shifting currently unfunded projects into the funded category. In our view, the most likely scenario for major project work excludes “unlikely” projects, but these are included here in Figure 1.4 to show their potential impact on major project work, particularly later in the forecast.
FIGURE 1.4
Major Project Work Done by Funding Category
0%
10%
20%
30%
40%
50%
60%
70%
80%
0
5
10
15
20
2010/11 2011/12 2012/13 2013/14 2014/15 2015/16 2016/17 2017/18 2018/19 2019/20 2020/21
Total Funded Total Credibly Proposed Total Prospective Total Unlikely % of Public Funding (RHS)
$ Billions
14
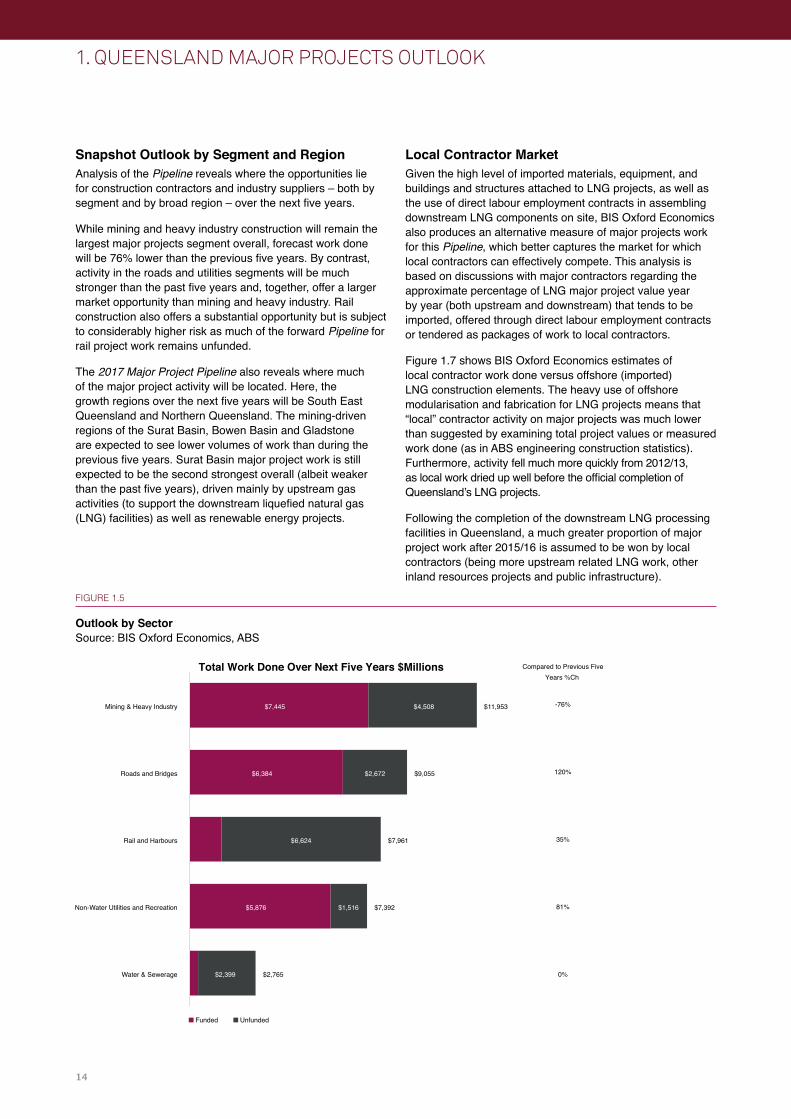
Snapshot Outlook by Segment and RegionAnalysis of the Pipeline reveals where the opportunities lie for construction contractors and industry suppliers – both by segment and by broad region – over the next five years.
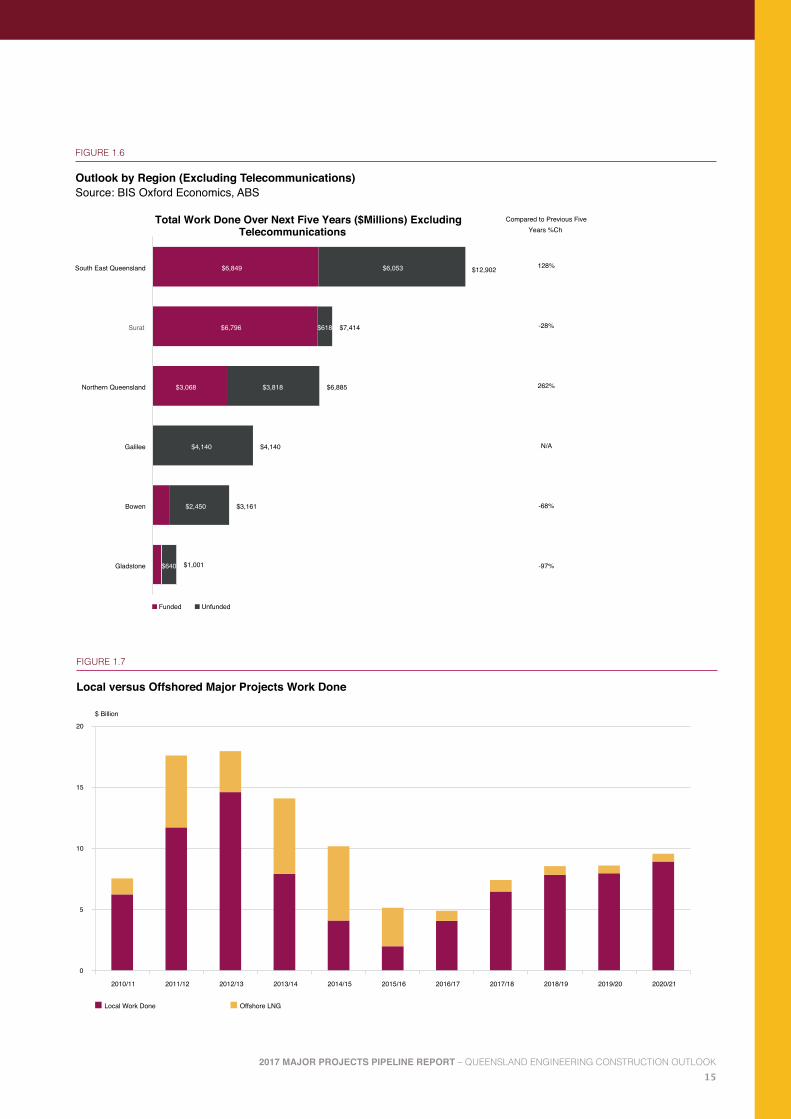
While mining and heavy industry construction will remain the largest major projects segment overall, forecast work done will be 76% lower than the previous five years. By contrast, activity in the roads and utilities segments will be much stronger than the past five years and, together, offer a larger market opportunity than mining and heavy industry. Rail construction also offers a substantial opportunity but is subject to considerably higher risk as much of the forward Pipeline for rail project work remains unfunded.
The 2017 Major Project Pipeline also reveals where much of the major project activity will be located. Here, the growth regions over the next five years will be South East Queensland and Northern Queensland. The mining-driven regions of the Surat Basin, Bowen Basin and Gladstone are expected to see lower volumes of work than during the previous five years. Surat Basin major project work is still expected to be the second strongest overall (albeit weaker than the past five years), driven mainly by upstream gas activities (to support the downstream liquefied natural gas (LNG) facilities) as well as renewable energy projects.
Local Contractor MarketGiven the high level of imported materials, equipment, and buildings and structures attached to LNG projects, as well as the use of direct labour employment contracts in assembling downstream LNG components on site, BIS Oxford Economics also produces an alternative measure of major projects work for this Pipeline, which better captures the market for which local contractors can effectively compete. This analysis is based on discussions with major contractors regarding the approximate percentage of LNG major project value year by year (both upstream and downstream) that tends to be imported, offered through direct labour employment contracts or tendered as packages of work to local contractors.
Figure 1.7 shows BIS Oxford Economics estimates of local contractor work done versus offshore (imported) LNG construction elements. The heavy use of offshore modularisation and fabrication for LNG projects means that “local” contractor activity on major projects was much lower than suggested by examining total project values or measured work done (as in ABS engineering construction statistics). Furthermore, activity fell much more quickly from 2012/13, as local work dried up well before the official completion of Queensland’s LNG projects.
Following the completion of the downstream LNG processing facilities in Queensland, a much greater proportion of major project work after 2015/16 is assumed to be won by local contractors (being more upstream related LNG work, other inland resources projects and public infrastructure).
1. QUEENSLAND MAJOR PROJECTS OUTLOOK
Non-W
$7,445
$6,384
$5,876
$4,508
$2,672
$6,624
$1,516
$2,399
$11,953
$9,055
$7,961
$7,392
$2,765
Mining & Heavy Industry
Roads and Bridges
Rail and Harbours
ater Utilities and Recreation
Water & Sewerage
Funded Unfunded
Compared to Previous Five Years %Ch
Total Work Done Over Next Five Years $Millions
-76%
120%
35%
81%
0%
FIGURE 1.5
Outlook by Sector Source: BIS Oxford Economics, ABS
152017 MAJOR PROJECTS PIPELINE REPORT – QUEENSLAND ENGINEERING CONSTRUCTION OUTLOOK
FIGURE 1.6
Outlook by Region (Excluding Telecommunications) Source: BIS Oxford Economics, ABS
FIGURE 1.7
Local versus Offshored Major Projects Work Done
$6,849
$6,796
$3,068
$6,053
$618
$3,818
$4,140
$2,450
$640
$7,414
$6,885
$4,140
$3,161
South East Queensland
Surat
Northern Queensland
Galilee
Bowen
Gladstone
Compared to Previous Five Years %Ch
Total Work Done Over Next Five Years ($Millions) Excluding Telecommunications
$12,902
$1,001
128%
-28%
262%
N/A
-68%
-97%
Funded Unfunded
0
5
10
15
20
2010/11 2011/12 2012/13 2013/14 2014/15 2015/16 2016/17 2017/18 2018/19 2019/20 2020/21
Local Work Done Offshore LNG
$ Billion

16
1. QUEENSLAND MAJOR PROJECTS OUTLOOK
FIGURE 1.8
Roads and Bridges Major Projects Work Done
0.0
0.5
1.0
1.5
2.0
2.5
3.0
2010/11 2011/12 2012/13 2013/14 2014/15 2015/16 2016/17 2017/18 2018/19 2019/20 2020/21
Total Funded Total Credibly Proposed Total Prospective Total Unlikely
$ Billions
Roads and BridgesMajor project work for roads and bridges is projected to surge significantly over the next two years, being one of the strongest growth markets of all segments during this period. Growth is being driven by the current round of funding under the Federal Government’s Infrastructure Investment Program (IIP) – focusing heavily on the Bruce Highway, and the addition of the Toowoomba Second Range Crossing, Gateway Upgrade North (GUN), the Kingsford Smith Drive and Caloundra to Sunshine Motorway upgrades, all of which are currently under construction.
As shown in Figure 1.8, major project road and bridge construction work done contracted around 70% between the peak of 2010/11 and the trough of 2014/15. Major project work has, however, jumped by 23% in 2015/16, however, driven by the current round of IIP projects.
Given the project Pipeline, Queensland roads and bridge major project work is expected to reach a new peak of over $2.5 billion by 2017/18. However, major project work in this segment is also projected to be highly cyclical, with work falling away significantly after the 2017/18 peak, particularly over 2019/20 and 2020/21 as the next round of projects reach completion. Reducing the degree of cyclicality will require an increase in the number of funded projects later this decade.
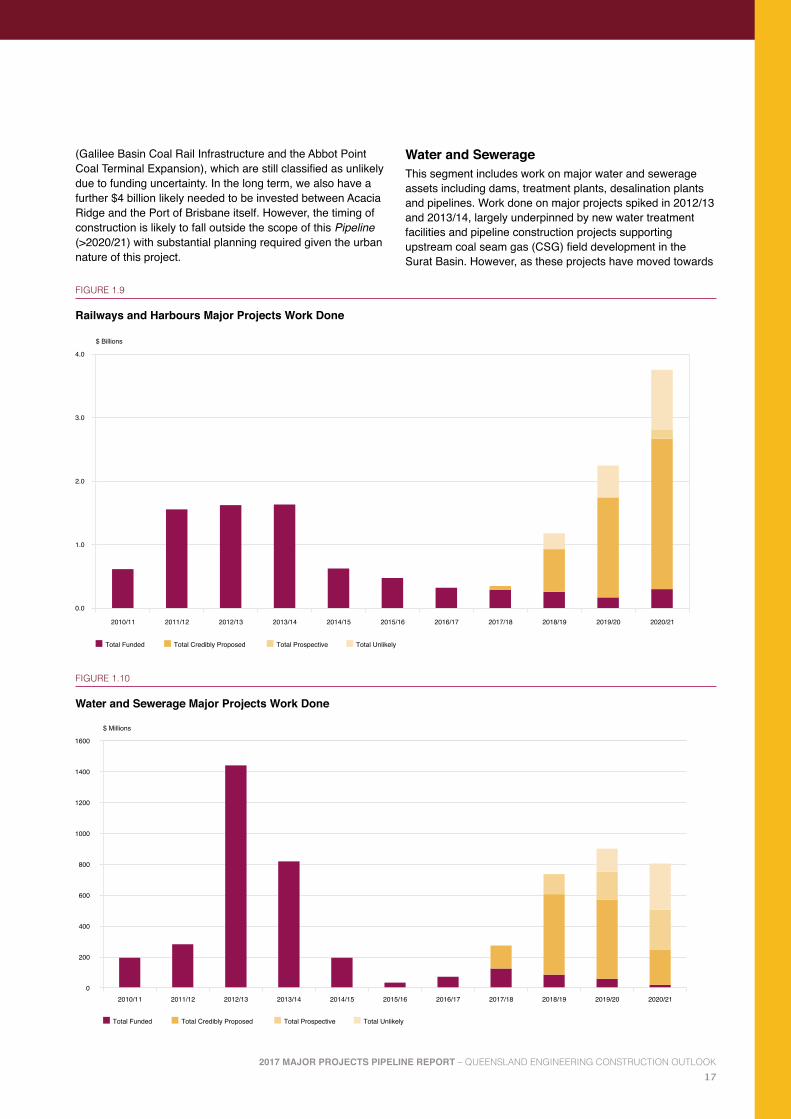
Railways and HarboursMajor project work across the railways and harbours segments in Queensland moved to a plane in the early 2010s, peaking at over $1.75 billion in 2013/14, before falling to just $93 million in 2015/16 with the completion of the Moreton Bay Rail Link. Harbour major project construction work has been
driven predominantly by the demands of the resources sector, but across railways there are also significant contributions from the public sector for passenger and freight projects.
In the near term, harbour and railway work is expected to rise marginally on the back of several publicly funded rail projects (including Gold Coast Light Rail Stage 2 and the Coomera to Helensvale Rail Duplication) as well as privately funded port facilities for the Amrun bauxite project (see Figure 1.9).
However, future levels of activity, particularly beyond 2017/18, could be much higher as long as key funding and investment hurdles are met. This includes, for the public sector, projects such as the Beerburrum to Landsborough Rail Duplication moving beyond the detailed business case phase and awaiting State Government funding decision, the much-anticipated Cross River Rail progressing to delivery, as well as a series of projects related to the Queensland sections of the Inland Rail project. On the publicly funded harbours front, the Port of Gladstone – Second Shipping Lane (Gatcombe and Golding Cutting Channel Duplication Project) and the Port of Townsville – Outer Harbour Expansion (berths 14+15) projects are key drivers of activity.
The stronger long term outlook for railways construction is reflective of a shift in sentiment, both at the Commonwealth and State Government level, towards rail transport solutions. This is in response to rising commuter demands in South East Queensland, as well as the need to improve freight transport productivity. However, both major rail solutions, Cross River Rail and Inland Rail, remain unfunded.
For the private sector, the largest projects later this decade include further upgrades to the Goonyella Coal Rail system as well as works related to the Adani Carmichael Coal venture
172017 MAJOR PROJECTS PIPELINE REPORT – QUEENSLAND ENGINEERING CONSTRUCTION OUTLOOK
(Galilee Basin Coal Rail Infrastructure and the Abbot Point Coal Terminal Expansion), which are still classified as unlikely due to funding uncertainty. In the long term, we also have a further $4 billion likely needed to be invested between Acacia Ridge and the Port of Brisbane itself. However, the timing of construction is likely to fall outside the scope of this Pipeline (>2020/21) with substantial planning required given the urban nature of this project.
Water and SewerageThis segment includes work on major water and sewerage assets including dams, treatment plants, desalination plants and pipelines. Work done on major projects spiked in 2012/13 and 2013/14, largely underpinned by new water treatment facilities and pipeline construction projects supporting upstream coal seam gas (CSG) field development in the Surat Basin. However, as these projects have moved towards
FIGURE 1.9
Railways and Harbours Major Projects Work Done
FIGURE 1.10
Water and Sewerage Major Projects Work Done
0.0
1.0
2.0
3.0
4.0
2010/11 2011/12 2012/13 2013/14 2014/15 2015/16 2016/17 2017/18 2018/19 2019/20 2020/21
Total Funded Total Credibly Proposed Total Prospective Total Unlikely
$ Billions
0
200
400
600
800
1000
1200
1400
1600
2010/11 2011/12 2012/13 2013/14 2014/15 2015/16 2016/17 2017/18 2018/19 2019/20 2020/21
$ Millions
Total Funded Total Credibly Proposed Total Prospective Total Unlikely
18
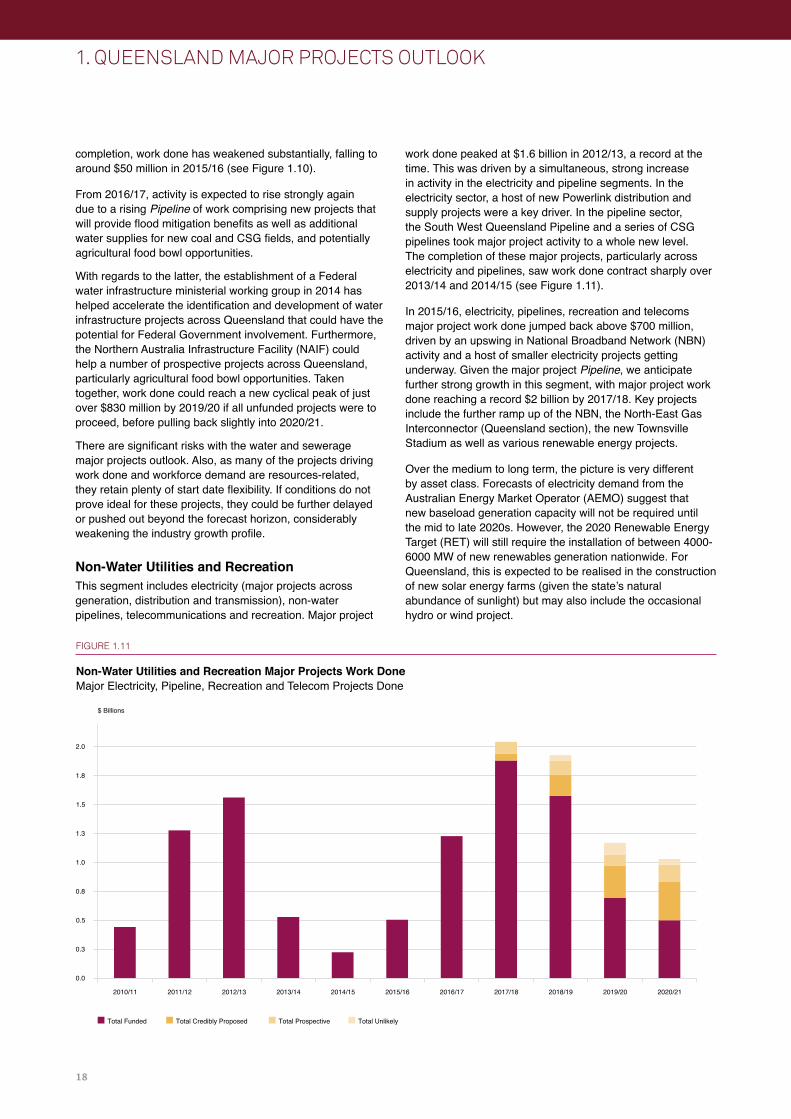
work done peaked at $1.6 billion in 2012/13, a record at the time. This was driven by a simultaneous, strong increase in activity in the electricity and pipeline segments. In the electricity sector, a host of new Powerlink distribution and supply projects were a key driver. In the pipeline sector, the South West Queensland Pipeline and a series of CSG pipelines took major project activity to a whole new level. The completion of these major projects, particularly across electricity and pipelines, saw work done contract sharply over 2013/14 and 2014/15 (see Figure 1.11).
In 2015/16, electricity, pipelines, recreation and telecoms major project work done jumped back above $700 million, driven by an upswing in National Broadband Network (NBN) activity and a host of smaller electricity projects getting underway. Given the major project Pipeline, we anticipate further strong growth in this segment, with major project work done reaching a record $2 billion by 2017/18. Key projects include the further ramp up of the NBN, the North-East Gas Interconnector (Queensland section), the new Townsville Stadium as well as various renewable energy projects.
Over the medium to long term, the picture is very different by asset class. Forecasts of electricity demand from the Australian Energy Market Operator (AEMO) suggest that new baseload generation capacity will not be required until the mid to late 2020s. However, the 2020 Renewable Energy Target (RET) will still require the installation of between 4000-6000 MW of new renewables generation nationwide. For Queensland, this is expected to be realised in the construction of new solar energy farms (given the state’s natural abundance of sunlight) but may also include the occasional hydro or wind project.
completion, work done has weakened substantially, falling to around $50 million in 2015/16 (see Figure 1.10).
From 2016/17, activity is expected to rise strongly again due to a rising Pipeline of work comprising new projects that will provide flood mitigation benefits as well as additional water supplies for new coal and CSG fields, and potentially agricultural food bowl opportunities.
With regards to the latter, the establishment of a Federal water infrastructure ministerial working group in 2014 has helped accelerate the identification and development of water infrastructure projects across Queensland that could have the potential for Federal Government involvement. Furthermore, the Northern Australia Infrastructure Facility (NAIF) could help a number of prospective projects across Queensland, particularly agricultural food bowl opportunities. Taken together, work done could reach a new cyclical peak of just over $830 million by 2019/20 if all unfunded projects were to proceed, before pulling back slightly into 2020/21.
There are significant risks with the water and sewerage major projects outlook. Also, as many of the projects driving work done and workforce demand are resources-related, they retain plenty of start date flexibility. If conditions do not prove ideal for these projects, they could be further delayed or pushed out beyond the forecast horizon, considerably weakening the industry growth profile.
Non-Water Utilities and RecreationThis segment includes electricity (major projects across generation, distribution and transmission), non-water pipelines, telecommunications and recreation. Major project
1. QUEENSLAND MAJOR PROJECTS OUTLOOK
FIGURE 1.11
Non-Water Utilities and Recreation Major Projects Work Done Major Electricity, Pipeline, Recreation and Telecom Projects Done
0.0
0.3
0.5
0.8
1.0
1.3
1.5
1.8
2.0
2010/11 2011/12 2012/13 2013/14 2014/15 2015/16 2016/17 2017/18 2018/19 2019/20 2020/21
$ Billions
Total Funded Total Credibly Proposed Total Prospective Total Unlikely

192017 MAJOR PROJECTS PIPELINE REPORT – QUEENSLAND ENGINEERING CONSTRUCTION OUTLOOK
project work plummet to $3.6 billion in 2015/16, a mere shadow of the previous peak. Major project activity is expected to fall further in 2016/17, the first full year without major project work on a downstream LNG processing facility since 2009/10. Activity in 2016/17 is predominantly supported by upstream coal seam gas field development, as well as sizeable contributions from the Amrun bauxite development and the Dugald River zinc project. Major project work in the coal sector remains very weak as higher coal prices stimulate the re-opening of existing mines such as Collinsville and Isaac Plains rather than driving new developments, at least for now, although the (currently unfunded) Byerwen coal mine is projected to contribute to major project work during the 2016/17 year (see Figure 1.12).
Major project work in mining and heavy industry is expected to move higher throughout the forecast period, but not dramatically so. In the short term, this is driven by the ramping up of activity on Amrun and Dugald River projects, but is supported later by a range of currently unfunded projects moving ahead in coal. Substantial risks surround the outlook for coal-related work, however, given uncertainties over future coal prices and the possibility that concessions may be provided to Adani’s large Galilee Basin railway line, which would stimulate development of its Carmichael mine. Even if the Adani mine were not to proceed, some coal projects (currently slated to commence in the 2020s) may still be pulled forward if coal prices remain relatively high.
Regarding LNG, it has been assumed that no new expansions will take place over the next five years given the outlook for energy prices and the supply/demand balance in the LNG market. Nonetheless, ongoing development of CSG fields
Meanwhile, ongoing development of the coal seam gas fields to feed Queensland’s LNG processing facilities will require continual, large, upstream investment in new wells, pipelines and other infrastructure over the long term. While no specific pipelines major project (over $50 million) is identified in the List, over $6 billion of upstream development work done has been allocated in the Pipeline under the broader “mining and heavy industry construction” category.
As with road construction, major project activity in this segment is expected to cool significantly after 2017/18, mainly driven by the peaking, then move to completion, of the current round of projects, including a winding down in the NBN rollout. However, there remains several significant announced projects which remain unfunded, which could keep activity at a relatively high level. These are focused in the electricity space, and include further renewables projects, the proposed North Queensland power station and potential transmission works to mining regions.
Mining and Heavy IndustryMining and heavy industry major project work experienced a period of unprecedented expansion between 2010/11 to 2012/13, increasing collectively by over 200% to reach a new peak of $13.6 billion. This represented a second, LNG focused phase of the resources boom in Queensland, but there were also substantial coal developments during this time including the construction of the Broadmeadow, Caval Ridge, Daunia and Grosvenor coking coal mines, which also sustained a high level of work.
The completion of “once in a generation” large LNG projects in Queensland has seen mining and heavy industry major
FIGURE 1.12
Mining and Heavy Industry Major Projects Work Done
0
5
10
15
2010/11 2011/12 2012/13 2013/14 2014/15 2015/16 2016/17 2017/18 2018/19 2019/20 2020/21
Total Funded Total Credibly Proposed Total Prospective Total Unlikely
$ Billions
20
While the pace of the shift in work will be slower than that which occurred in Gladstone during the LNG boom, remote regions such as Northern Queensland and the Bowen Basin will have their own challenges to overcome. The regional towns and cities that will inevitably service projects in these regions will face a number of social and economic changes, and will be competing against South East Queensland (as well as interstate) for skills. This will require detailed planning by Federal, State and Local Governments in conjunction with project proponents to keep the project Pipeline intact in these regions whilst maintaining harmonious and sustainable communities.
As history has proven, the South-East Queensland region has considerable experience in handling significant shifts in major project work and employment such as those forecasts in this Pipeline. However, the current forecast upswing will occur at a time when other Australian states and cities (particularly Sydney and soon Melbourne), as well as other global cities, will also be undergoing increasing levels of major project investment. This will likely to see competition for skilled labour and plant and equipment intensify, which will create a challenging period for procurement in Queensland.
Strengths, Weaknesses, Threats by RegionSouth East QueenslandPublicly funded infrastructure works are the key driver in South East Queensland, with roads and railways work likely to remain the principal source of major project activity. In this sense, the projection of increasing levels of public investment and major project works in this region will give local contractors many new opportunities over the forecast horizon (generally $3-5 billion per annum in major project work through the forecast period). Much will depend on the willingness of the Queensland and Federal governments to fund these projects. Given the plethora of rail projects occurring in New South Wales and Victoria, there may also be risks with regard to skilled labour shortages in Queensland. If the timing of signature rail projects in South East Queensland, including Cross River Rail and Inland Rail are not considered
over the operational life of LNG facilities will require continual investment in related field infrastructure, including roads, pipelines and gas facilities, and water. Again, while not as significant as downstream processing and infrastructure projects, in aggregate they will keep the volume of activity high compared to pre-boom times and offer a higher share of work for domestic contractors compared to the LNG trains themselves.
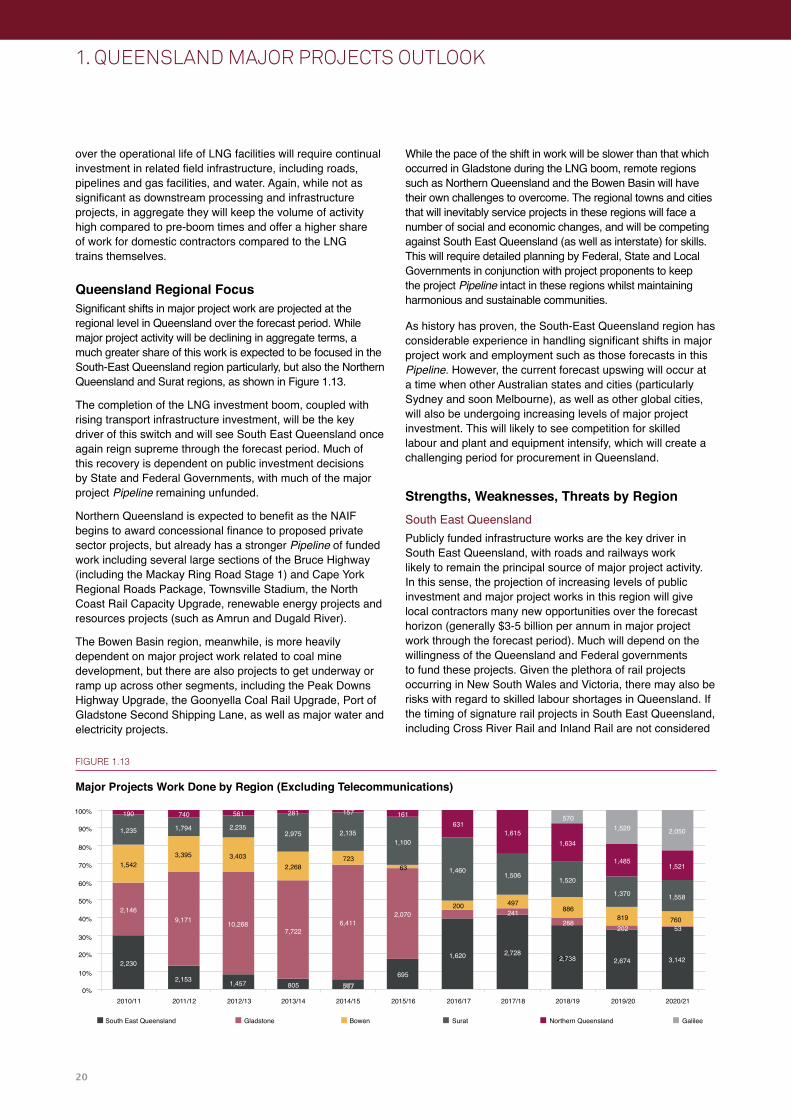
Queensland Regional FocusSignificant shifts in major project work are projected at the regional level in Queensland over the forecast period. While major project activity will be declining in aggregate terms, a much greater share of this work is expected to be focused in the South-East Queensland region particularly, but also the Northern Queensland and Surat regions, as shown in Figure 1.13.
The completion of the LNG investment boom, coupled with rising transport infrastructure investment, will be the key driver of this switch and will see South East Queensland once again reign supreme through the forecast period. Much of this recovery is dependent on public investment decisions by State and Federal Governments, with much of the major project Pipeline remaining unfunded.
Northern Queensland is expected to benefit as the NAIF begins to award concessional finance to proposed private sector projects, but already has a stronger Pipeline of funded work including several large sections of the Bruce Highway (including the Mackay Ring Road Stage 1) and Cape York Regional Roads Package, Townsville Stadium, the North Coast Rail Capacity Upgrade, renewable energy projects and resources projects (such as Amrun and Dugald River).
The Bowen Basin region, meanwhile, is more heavily dependent on major project work related to coal mine development, but there are also projects to get underway or ramp up across other segments, including the Peak Downs Highway Upgrade, the Goonyella Coal Rail Upgrade, Port of Gladstone Second Shipping Lane, as well as major water and electricity projects.
1. QUEENSLAND MAJOR PROJECTS OUTLOOK
FIGURE 1.13
Major Projects Work Done by Region (Excluding Telecommunications)
100%
90%
80%
70%
60%
50%
40%
30%
20%
10%
0%2010/11
2,230
2,146
1,542
1,794 2,2351,235
3,395 3,403
2,975 2,1351,100
1,615
5701,520 2,050
1,4851,521
1,370 1,558
1,506
1,634
1,46063
2,070200 497
241288
886819 760202 53
1,520
1,620 2,7282,7382,738 2,674 3,142
695
2,268
7,7226,411
805
9,171
2,153 1,457
10,268
190 740 561 281 157 161631
723
South East Queensland Gladstone Bowen Surat Northern Queensland Galilee
2011/12 2012/13 2013/14 2014/15 2015/16 2016/17 2017/18 2018/19 2019/20 2020/21

212017 MAJOR PROJECTS PIPELINE REPORT – QUEENSLAND ENGINEERING CONSTRUCTION OUTLOOK
FIGURE 1.14
Major Project Activity in Queensland by Region: 2016/17 to 2020/21 (Excluding Multi-Regional Projects) Source: KPMG, BIS Oxford Economics data
in line with mega rail projects in southern states, attracting this skilled labour force back to Queensland in 2-3 years’ time (once they do get off the ground) will increase costs for these projects.
North QueenslandThe North-West Province in Queensland could stand to benefit from multiple major base minerals projects covering bauxite, phosphates, silver-lead-zinc, copper, tin and nickel. Timing of the global economic recovery and demand for metals and minerals will be the key factor underwriting the next round of minerals investment in this region, but may still be substantial over the next three to five years. However, apart from minerals development, Northern Queensland is poised to benefit significantly from measures to boost regional economic growth through infrastructure investment including the construction of gas pipelines, electricity generation (both renewable and baseload), water pipelines and dams, ports and roads. This is expected to see North Queensland emerge as the strongest regional growth centre for major project work over the next five years.
Surat BasinOngoing upstream CSG work is currently driving activity levels in the Surat Basin. The Pipeline forecasts relatively
stable levels of activity in this region going forward, but the need to replace ageing wells whilst simultaneously increasing upstream capacity for the LNG processing facilities could see a more significant increase in CSG and related infrastructure activity. Outside of CSG, there is also occasional renewable energy projects expected, such as Bulli Creek and Darling Downs Solar Farms and water projects.
Bowen Basin Coal related major projects shape the Bowen Basin region. A substantial portion of these projects are delayed or unfunded, however. While coal prices have surged through calendar year 2016, there are a few new coal projects expected to proceed within the next five years. This includes the greenfield Byerwen project and the Caval Ridge Expansion, with other projects emerging closer to the end of the decade.
However, the Bowen Basin is still expected to see investment in renewables energy through the period (Moranbah and Collinsville), roads, water and port works, as well as potential rail upgrades. Overall, it is expected to be a relatively strong growth region and could see upside if coal prices were to remain at higher levels (see Figure 1.14).
LEGENDTotal Project Value ($million)

22
Galilee Basin While several large projects remain proposed for the Galilee, only one project, Adani’s Carmichael project, features in the Pipeline. We affirm there is a very high risk that this project will not occur given the long-term outlook for coal, as well as issues regarding funding, costs, remoteness, activism and environmental issues. Galilee Basin projects in the list account for $4.4 billion worth of major project work, but these are classified as unlikely to proceed. The absence of these projects sees major project work weaken late in the forecast period.
GladstoneThe strengths, weaknesses and threats to the Gladstone region are shaped by the outlook for LNG and coal
development. Major project demands peaked in 2013/14 and has since declined sharply given the completion of various LNG projects and the Wiggins Island Coal Export Terminal (WICET). A recovery in Gladstone major project work depends heavily on whether further stages to existing LNG projects, or new LNG projects commence during the forecast period or are delayed by high cost pressures and the emergence of competitive threats (such as from US shale gas). In the Pipeline, the latter scenario is assumed, with the next major LNG development occurring beyond 2020/21. Higher than anticipated coal prices in future, however, may see coal-related developments proceed earlier than expected, which presents an upside risk to the current, very low, outlook for work in the region.
1. QUEENSLAND MAJOR PROJECTS OUTLOOK

232017 MAJOR PROJECTS PIPELINE REPORT – QUEENSLAND ENGINEERING CONSTRUCTION OUTLOOK
The key points to this outlook include:
• Global economic growth remained relatively weak in 2016. While an improvement is imminent, the outlook differs by region. There are continued positive signs for growth in the United States of America (USA), the United Kingdom (UK), and Japan. However, China’s economic growth (and demand for metals and minerals) is moderatings for Euro Zone economies remain weak.
• Commodity prices have shown strength in recent times, although uncertainties remain, impacting new investment. Coking coal and thermal coal prices have soared through calendar 2016, while prices have improved for Queensland’s other key commodities including gas, aluminium, gold and zinc. The sustainability of these increases remains uncertain, particularly in the case of coal, where price increases have been driven by changes to China’s coal industry policy (increasing the demand for imported coals) and may contain a significant speculative element. However, while there may be variations in the short term, the longer run trend is up for most commodity prices, following the decline in prices in early 2016.
• The Australian economy remains weak, growing below trend. The Australian economy is struggling with the transition from the mining investment boom as non-mining investment has been slow to recover despite significant monetary stimulus and a falling Australian dollar. Economic growth through 2015/16 (2.5%) mirrors the (under) performance of the two previous years, but the economy contracted 0.5% in the September 2016 quarter, indicating the fragility of growth and its reliance on new drivers of investment.
• Longer term prospects are brighter for the Australian economy. While falling mining investment (as liquefied natural gas (LNG) projects in Western Australia and the Northern Territory move to completion) will remain a drag on the Australian economy over the next few years, the combination of a lower dollar, high consumer spending and rising public investment is expected to see national economic growth return above 3% later this decade.
Outlook for the Global EconomyGlobal economy remains relatively weak, but a pickup is expected . . .
Many advanced economies are still in a protracted recovery from their global financial crisis (GFC) induced economic downturns. However, the US is the key for global growth going forward. Output (or US gross domestic product (GDP)) is now 11% higher than its pre-crisis level and employment is now 6.5 million above its pre-crisis peak, with many indicators suggesting that the US economy is nearing full employment. With inflation heading back towards 2%, the Federal Reserve is expected to continue raising rates through 2017 and 2018 towards a neutral level.
The US economy is expected to accelerate over the next two years as business investment slowly comes through. Capacity utilisation, although picking up, still remains below long-run average levels. Nonetheless, stronger growth is forecast over 2019 to 2021 driven by President Trump’s proposed fiscal stimulus and corporate tax reforms. Because of long lead times in getting major infrastructure projects ‘shovel-ready’, Trump’s fiscal stimulus is unlikely to start materially influencing US GDP growth before 2019.
Meanwhile, with regards to other advanced economies, stimulatory monetary policy and improvements in competitiveness stemming from falling unit labour costs should support growth in the Euro Zone. Japan is expected to benefit from ongoing monetary and fiscal stimulus, including a delay in a sales tax hike in response to ongoing weakness in private demand growth. China, while slowing, is still the world’s largest economy and will continue to make significant contributions to growth. India and ASEAN-5 (Indonesia, Philippines, Malaysia, Thailand and Vietnam) GDP growth is expected to pick up pace over the next two years while Russia and Brazil, currently in recession, are expected to recover from 2017 adding to world growth.
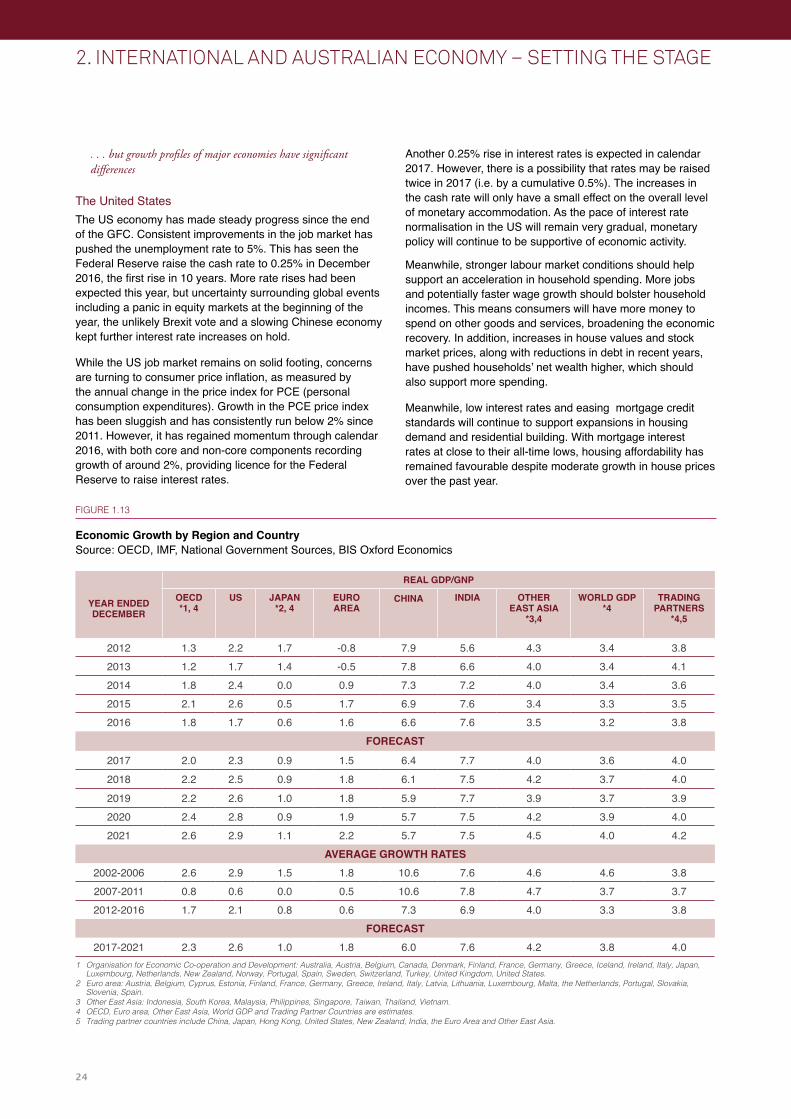
Overall, global economic growth is projected to return to its long-run average growth of 3.6% from 2017. Stronger growth is forecast over 2018 to 2021 driven by US fiscal stimulus, a recovery in the Euro-zone economies and India maintaining its strong growth momentum (see Figure 2.1).
The Queensland economy is closely tied to the prospects for the global economy. Queensland’s growing interconnectedness with the rest of the world (and particularly Asia) through trade in its high-quality minerals and energy resources, as well as trade in other industries including agriculture, manufacturing, tourism and education have profound implications for local investment and construction activity.
2. INTERNATIONAL AND AUSTRALIAN ECONOMY – SETTING THE STAGE
24
. . . but growth profiles of major economies have significant differences
The United States The US economy has made steady progress since the end of the GFC. Consistent improvements in the job market has pushed the unemployment rate to 5%. This has seen the Federal Reserve raise the cash rate to 0.25% in December 2016, the first rise in 10 years. More rate rises had been expected this year, but uncertainty surrounding global events including a panic in equity markets at the beginning of the year, the unlikely Brexit vote and a slowing Chinese economy kept further interest rate increases on hold.
While the US job market remains on solid footing, concerns are turning to consumer price inflation, as measured by the annual change in the price index for PCE (personal consumption expenditures). Growth in the PCE price index has been sluggish and has consistently run below 2% since 2011. However, it has regained momentum through calendar 2016, with both core and non-core components recording growth of around 2%, providing licence for the Federal Reserve to raise interest rates.
Another 0.25% rise in interest rates is expected in calendar 2017. However, there is a possibility that rates may be raised twice in 2017 (i.e. by a cumulative 0.5%). The increases in the cash rate will only have a small effect on the overall level of monetary accommodation. As the pace of interest rate normalisation in the US will remain very gradual, monetary policy will continue to be supportive of economic activity.
Meanwhile, stronger labour market conditions should help support an acceleration in household spending. More jobs and potentially faster wage growth should bolster household incomes. This means consumers will have more money to spend on other goods and services, broadening the economic recovery. In addition, increases in house values and stock market prices, along with reductions in debt in recent years, have pushed households’ net wealth higher, which should also support more spending.
Meanwhile, low interest rates and easing mortgage credit standards will continue to support expansions in housing demand and residential building. With mortgage interest rates at close to their all-time lows, housing affordability has remained favourable despite moderate growth in house prices over the past year.
2. INTERNATIONAL AND AUSTRALIAN ECONOMY – SETTING THE STAGE
YEAR ENDED DECEMBER
REAL GDP/GNP
OECD *1, 4
US JAPAN *2, 4
EURO AREA
CHINA
INDIA OTHER EAST ASIA
*3,4
WORLD GDP *4
TRADING PARTNERS
*4,5
2012 1.3 2.2 1.7 -0.8 7.9 5.6 4.3 3.4 3.82013 1.2 1.7 1.4 -0.5 7.8 6.6 4.0 3.4 4.12014 1.8 2.4 0.0 0.9 7.3 7.2 4.0 3.4 3.62015 2.1 2.6 0.5 1.7 6.9 7.6 3.4 3.3 3.52016 1.8 1.7 0.6 1.6 6.6 7.6 3.5 3.2 3.8
FORECAST
2017 2.0 2.3 0.9 1.5 6.4 7.7 4.0 3.6 4.02018 2.2 2.5 0.9 1.8 6.1 7.5 4.2 3.7 4.02019 2.2 2.6 1.0 1.8 5.9 7.7 3.9 3.7 3.92020 2.4 2.8 0.9 1.9 5.7 7.5 4.2 3.9 4.02021 2.6 2.9 1.1 2.2 5.7 7.5 4.5 4.0 4.2
AVERAGE GROWTH RATES2002-2006 2.6 2.9 1.5 1.8 10.6 7.6 4.6 4.6 3.82007-2011 0.8 0.6 0.0 0.5 10.6 7.8 4.7 3.7 3.72012-2016 1.7 2.1 0.8 0.6 7.3 6.9 4.0 3.3 3.8
FORECAST2017-2021 2.3 2.6 1.0 1.8 6.0 7.6 4.2 3.8 4.0
FIGURE 1.13
Economic Growth by Region and Country Source: OECD, IMF, National Government Sources, BIS Oxford Economics
1 Organisation for Economic Co-operation and Development: Australia, Austria, Belgium, Canada, Denmark, Finland, France, Germany, Greece, Iceland, Ireland, Italy, Japan, Luxembourg, Netherlands, New Zealand, Norway, Portugal, Spain, Sweden, Switzerland, Turkey, United Kingdom, United States.
2 Euro area: Austria, Belgium, Cyprus, Estonia, Finland, France, Germany, Greece, Ireland, Italy, Latvia, Lithuania, Luxembourg, Malta, the Netherlands, Portugal, Slovakia, Slovenia, Spain.
3 Other East Asia: Indonesia, South Korea, Malaysia, Philippines, Singapore, Taiwan, Thailand, Vietnam.4 OECD, Euro area, Other East Asia, World GDP and Trading Partner Countries are estimates. 5 Trading partner countries include China, Japan, Hong Kong, United States, New Zealand, India, the Euro Area and Other East Asia.
252017 MAJOR PROJECTS PIPELINE REPORT – QUEENSLAND ENGINEERING CONSTRUCTION OUTLOOK
Another positive factor for the US economy is that the drag on economic growth in recent years from changes in federal fiscal policies appears to have ended. Temporary fiscal stimulus measures supported economic output during the recession (following the GFC) and early in the recovery. But those stimulus measures have long expired and additional policy actions were taken to reduce the Federal budget deficit. However, fiscal policy at the federal level had a roughly neutral influence on GDP growth in 2016, as the substantial contractionary effects of earlier fiscal consolidation have abated. Going forward, increased public spending and a looser fiscal policy will be mildly supportive of GDP growth over 2017, but more aggressively so in future years if public investment plans are realised.
China’s Growth Continuing to EaseIn China, GDP growth has continued to moderate in recent years, partly reflecting the authorities’ efforts to rebalance the economy towards household consumption and partly due to sheer size of the economy compared to pre-GFC times. GDP growth is expected to average around 6% from 2017 to 2020, supported by strong fundamental drivers such as rising consumer spending, particularly as incomes rise in lower income and rural households. In turn, rising household wealth and incomes in China is driving an increased demand for services, including financial services, health, education, business services and tourism.
Next decade, we expect China’s growth to moderate even further, falling to around 5.7%. Most of the economic reform measures announced by the Third Plenum (the third plenary session of a newly elected Central Committee of the government) will help rebalance the Chinese economy, as the Beijing government tries to shift to a consumer-driven economy from an investment-led economy.
Downside risks to the Chinese economy exist with the unregulated shadow banking industry, impact of banking reforms and some uncertainty around the implementation of the government’s agenda under the Third Plenum. Concerns over the property market are also present with the residential building sector expected to be weighed down by inventory overhang, particularly in the lower tier cities.
Europe Still Struggling for GrowthMany Euro Zone economies (with the exception of Germany) continue to struggle from a lack of competitiveness. This is due to the imbalance in cost structures exacerbated by a fixed exchange rate system, which is impeding the necessary adjustments. Within the Euro Zone, Germany is undervalued while the other countries are overvalued although they are now converging to Germany’s status.
Without loosening the fiscal purse strings, Europe is likely to continue ‘muddling through’ the next few years, hindered by persistent competitive differences, high unemployment, and slow evolution in policies. Overall, we are forecasting Euro zone growth to average just 1.8% per annum over the 2017 to 2021 period.
Japan Pursuing Quantitative Easing but Demographics a Long-term ProblemJapan is another economy that has pursued quantitative easing stimulus measures to ward off deflationary pressures and revive growth, which has been faltering since the 1990s. Nonetheless, private consumption has remained subdued since the increase in consumption tax in early 2014. This led the Japanese government to postpone the next scheduled increase in consumption tax from April 2017 to October 2019. Japanese economic growth improved marginally during 2016, and this marginal improvement is expected to continue in later years.
Demographics are working to slow economic activity, however, as fertility rates remain low and the working age population (and overall population) continues to decline. This highlights the need for businesses to invest and focus on productivity improvements in order to grow the economy going forward. The other major problem facing the country is the size of public debt which now exceeds 220% of GDP. The current government aims to achieve surplus by 2020 but will require a combination of stronger economic growth and inflation, along with higher taxation revenues and contained spending to start to reel in the debt problem particularly as the population ages and welfare/social support payments are projected to rise. Overall we expect the long run rate of economic growth in Japan to settle within the 1.1% to 1.3% band.
Outlook for Commodity PricesCommodity prices have shown strength in 2016 although uncertainties remain.In US dollar terms, most metals and energy prices peaked during 2011 and then fell sharply through 2012 as global economic growth faltered. Further price declines were seen in 2014 and the slowdown gathered pace extending throughout 2015, when a number of commodities recorded multi-year lows. By early 2016, prices for most commodities reached a trough and have since began to recover – some substantially so – as weak investment and cutbacks in high cost production over several years coincided with steady growth in minerals and metals demand (see Figure 2.2).
While many commodities, including steel, remain in a state of global oversupply, an acceleration in global demand combined with relatively low levels of investment is expected to see many commodity markets move back into a balanced situation through the forecast period, resulting in gradually rising commodity prices and the beginnings of another (albeit smaller) investment cycle. Commodity prices are likely to be volatile in the short term, however, as the new US administration disclose details of their economic and trade policy and China steadies its economic growth.
Despite a steel oversupply, Chinese steel production rebounded in 2016, with monthly steel production at around 68 million tonnes. In turn, this ignited interest in the inputs to steel, particularly iron ore and metallurgical coal – which both saw dramatic increases in prices from mid-2016. Base metal

26
FIGURE 2.3
Commodity Prices ($US/Tonne) Source: BIS Oxford Economics, BREE data
2. INTERNATIONAL AND AUSTRALIAN ECONOMY – SETTING THE STAGE
500
1,000
2,000
4,000
8,000
16,000
32,000
64,000
1996 1998 2000 2002 2004 2006 2008 2010 2012 2014 2016 2018
Forecast
As at June
Quarterly Average Prices (Log Scale)
Copper
NickelLead (x10)
Zinc
Aluminium
Gold (x10)
10
20
40
80
160
320
640
1996 1998 2000 2002 2004 2006 2008 2010 2012 2014 2016 2018
Forecast
As at June
Quarterly Average Prices (Log Scale)
Crude Oil (Brent)(US$/bbl)
Coking Coal(US$/t)
Thermal Coal(US$/t)
Iron Ore(US$/t)
FIGURE 2.2
Commodity Prices ($US) Source: BIS Oxford Economics, BREE data

272017 MAJOR PROJECTS PIPELINE REPORT – QUEENSLAND ENGINEERING CONSTRUCTION OUTLOOK
prices have also followed suit with copper and zinc prices recording multi-year highs in late 2016. The systemic impact of recovering demand could keep prices elevated (see Figure 2.3). The rally in commodity prices is, however, likely to be capped by rising production as recently closed mines re-open to take advantage of higher prices.
Given some uncertainty regarding global trade policies under the new Trump administration, as well as China’s own policy initiatives, key commodity prices – particularly for iron ore and coal – could come under some pressure in the near term and are expected to move to levels below the recent 2016 peaks. Despite a slowdown in economic growth, China is still expected to account for a significant portion of commodities demand over the medium term. Meanwhile, the US economy, India and the OECD economies are forecast to record stronger growth rates over the medium term, adding to the demand fundamentals supporting commodity prices.
Outlook for the Australian EconomyCurrent State of Play• Growth in the Australian economy remains weak.
Since the end of the commodity price boom in 2012/13, economic growth in Australia has weakened, falling to around 2.5% per annum annual average growth. Falling mining investment (as well as declining public investment since 2009/10) has been the main drag on growth in Gross National Expenditure (GNE) (down from 4-5% growth per annum during the investment boom to 1.5% currently), with a strong contribution from resources exports keeping overall economic growth (in GDP terms) near or above 2% (see Figure 2.4).
• Australia’s real GDP fell by -0.5% in the September 2016 quarter (seasonally adjusted), bringing the through-the-year growth (September 2016 compared to September 2015) to just 1.6%. As expected, private engineering construction was down heavily (28% through-the-year decline) in the September quarter driven by sharp declines in resources construction, and this was magnified by a sharp correction in public investment (down 10% on the previous quarter).
Short to Medium Term Outlook• The Australian economy will continue to experience
relatively weaker growth through the next two years, before picking up from 2019/20. At present, the economy is in the third year of an expected five year decline in mining-related construction. By 2018/19, resources-related construction is expected to be almost three quarters lower than the peak of $67.5 billion (in constant prices) reached in 2013/14. Much of this downturn will be focused in the largest mining investment component, oil and gas, which has been supercharged in recent years by the construction of multiple, multi-billion dollar LNG projects.
• Housing investment is expected to be another drag on the economy after 2016/17, driven by more balanced capital city markets (except Sydney) where the recent recovery in supply will eventually eliminate dwelling stock deficiencies, and as rising interest rates and weaker price growth delay purchase and investment decisions.
• Despite this, there are positive signs for the Australian economy looking forward. A recession – at the national level – is unlikely. Economic growth will recover. The Australian economy is still in transition from the resources investment boom, but already there are signs of other sectors taking up the mantle of growth. A key contributor to economic growth from here will be exports. Export growth is expected to accelerate not just through new resources facilities coming into operation (particularly in LNG) but also through the competitive boost from the lower Australian dollar on import and export competition industries, ranging from tourism, education and financial services to agriculture, manufacturing and even mining. Consumer demand is robust and is expected to build momentum over the next two years supported by relatively low interest rates and the wealth effects from recent house price gains across most capital cities. Importantly, public investment in infrastructure is also likely to reaccelerate, particularly on new road and rail transport projects as well as for the rollout of the National Broadband Network (NBN).
Longer Term Outlook for the Australian Economy• In the longer term (post 2019/20), Australian economic
growth is expected to accelerate and achieve growth rates consistently above 3% per annum. By this time, the negative impact of falling resources investment on economic growth will have run its course and public investment should be during a significant upswing. While interest rates will be reverting to more “normal” levels, consumer spending is expected to remain robust given rising incomes, employment and confidence.
• Most importantly, a recovery in non-mining business investment is also likely to take place by 2019/20 given rising demand, profitability and tightening industrial capacity (given a paucity of new business investment outside of mining since the GFC). As growth in public investment begins to wane late this decade, the mantle of growth in the economy is expected to shift back towards the private sector.

28
FIGURE 2.4
Australia GNE (Gross National Expenditure) and GDP: Moving Annual Total, Annual % Change Source: BIS Oxford Economics, ABS data
2. INTERNATIONAL AND AUSTRALIAN ECONOMY – SETTING THE STAGE
-4
-2
0
2
4
6
8
87 89 91 93 95 97 99 01 03 05 07 09 11 13 15 17 19
Per Cent
Year Ended June
External Contribution
Forecast
Real GNE
Real GDP
292017 MAJOR PROJECTS PIPELINE REPORT – QUEENSLAND ENGINEERING CONSTRUCTION OUTLOOK
Key points include:
• Queensland economic growth (as measured by Gross State Product or GSP) accelerated marginally in 2015/16 to 2.0% following just 1.2% in 2014/15. This growth is still well below the 4-4.5% average growth rates experienced in Queensland prior to the resources boom. The mild acceleration in 2015/16 was driven by a strong pickup in housing investment (albeit not enough to offset the size of the decline in other parts of private investment) and double-digit growth in exports as liquefied natural gas (LNG) production ramped up in conjunction with rising service credits (tourism).
• By contrast, Queensland State Final Demand (SFD) fell for the second consecutive year in 2015/16, as another double-digit decline in private investment (driven by the resources bust) was joined by a 7.1% slump in public investment. Over 2014/15 and 2015/16, SFD has fallen 4.3% – representing the worst decline in domestic demand in Queensland since consistent Australian Bureau of Statistics (ABS) state accounts have been published.
• Falling SFD has, in turn, impacted the Queensland labour market. In measuring local spending in the economy, SFD is a key driver of state employment. Weak outcomes for SFD in recent years has kept the unemployment rate in Queensland around 6%. As the economy progresses from the highly labour-intensive mining construction phase to the less labour-intensive operations phase, the labour market is not expected to grow as fast as growth in output (GSP).
• Queensland’s economy has gone through the worst of it. The mining investment bust in Queensland has just about run its course, although the transition from mining investment to production and strong export growth is presenting broad challenges. Meanwhile, risks and opportunities for growth remain. Housing investment, which has provided strong support in recent years, is expected to fall heavily from 2017/18. Export growth should continue to be very robust, however, led by resources merchandise trade as well as tourism. The main swing variable for the economy and jobs is a return to positive growth in public investment, following no less than six consecutive years of decline. This is expected to drive the first year of positive
growth in SFD since 2013/14 and contribute to stronger economic growth overall.
• There is reason for optimism going forward. While Queensland and Western Australia are Australia’s largest “resources states”, they are also very different. Queensland has the more diversified economy of the two, and should benefit from a lower Australian dollar boosting its key trading sectors. Prior to the mining boom, the state experienced an extended period of strong, balanced growth, and it will return to balanced growth in the future.
Current Economic Conditions
Queensland economic recovery in sight after hitting rock bottom in recent years.The Queensland economy has recently experienced one of its worst phases of economic growth, with growth weakening markedly since mid-2012, driven by falling mining and public investment. Growth in GSP (Gross State product) decelerated from the boom-time 2011/12 growth of 6%, to 2.4% and 3.3% respectively over 2012/13 and 2013/14, and then weakened further to 1.2% growth in 2014/15, before recovering somewhat to 2.0% in 2015/16.
Meanwhile, growth in SFD (State Final Demand), a measure of domestic demand or spending in the local economy which is highly correlated with employment, slowed to just 1.5% in 2013/14 (compared to growth rates of between 5% to 9% during the boom years), before then falling 3.1% in 2014/15 and a further 1.2% in 2015/16. Employment growth has also weakened and has averaged just 1% per annum over the last four years, much slower than the average growth in the working age population of 1.7%. The end result has been a sharp rise in the unemployment rate from an average of 5.5% in 2011/12 to 6.5% in 2014/15, although it has improved a little over the last year (see Figure 3.1).
In one important sense, the Queensland economy has been partially sheltered from the severity of the downturn in mining investment. Significant components of mining and mining-related investment and equipment were sourced from overseas, and were therefore classed as imports, detracting from GSP. As mining investment retreats, so do these imports.
3. QUEENSLAND ECONOMY
The Queensland economy has traditionally been one of the stronger state performers in Australia, but is suffering the effects of a prolonged downturn in public and private investment. While one of Australia’s key ‘resources’ states – and one of the largest exporters of coal (and soon gas) – the state economy is diversified and increasingly linked into global trade networks through tourism, agriculture and education industries.
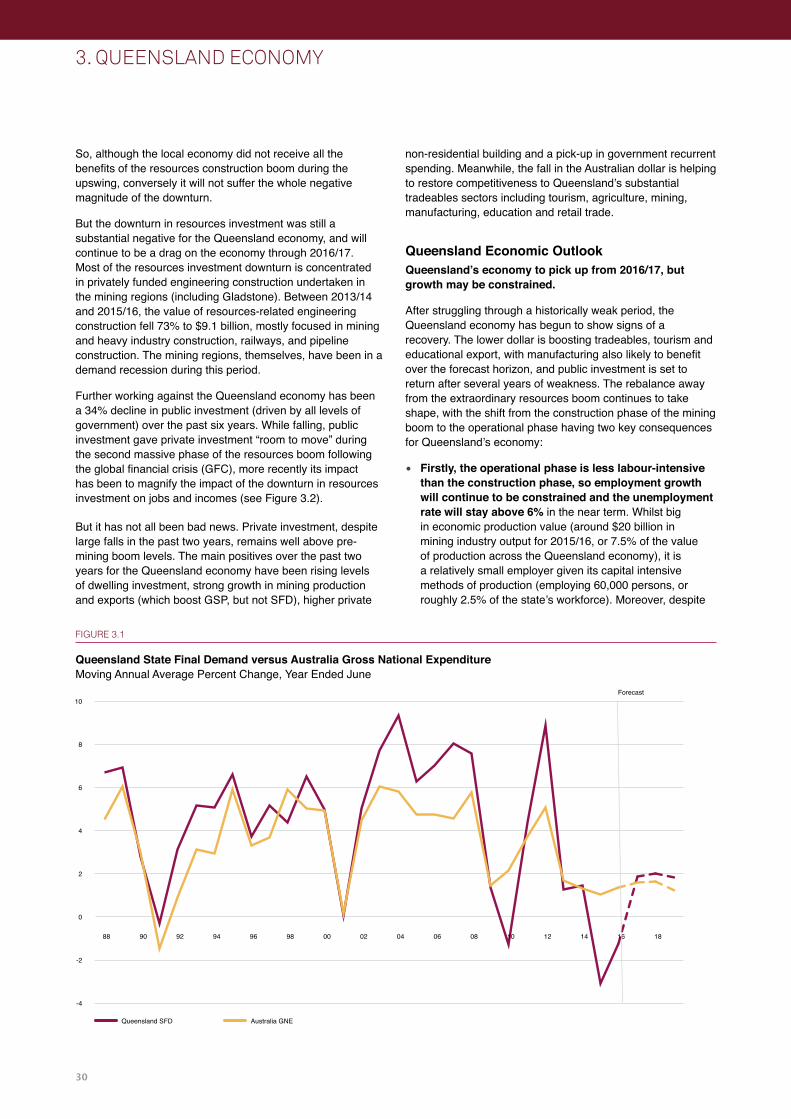
30
non-residential building and a pick-up in government recurrent spending. Meanwhile, the fall in the Australian dollar is helping to restore competitiveness to Queensland’s substantial tradeables sectors including tourism, agriculture, mining, manufacturing, education and retail trade.
Queensland Economic OutlookQueensland’s economy to pick up from 2016/17, but growth may be constrained.
After struggling through a historically weak period, the Queensland economy has begun to show signs of a recovery. The lower dollar is boosting tradeables, tourism and educational export, with manufacturing also likely to benefit over the forecast horizon, and public investment is set to return after several years of weakness. The rebalance away from the extraordinary resources boom continues to take shape, with the shift from the construction phase of the mining boom to the operational phase having two key consequences for Queensland’s economy:
• Firstly, the operational phase is less labour-intensive than the construction phase, so employment growth will continue to be constrained and the unemployment rate will stay above 6% in the near term. Whilst big in economic production value (around $20 billion in mining industry output for 2015/16, or 7.5% of the value of production across the Queensland economy), it is a relatively small employer given its capital intensive methods of production (employing 60,000 persons, or roughly 2.5% of the state’s workforce). Moreover, despite
So, although the local economy did not receive all the benefits of the resources construction boom during the upswing, conversely it will not suffer the whole negative magnitude of the downturn.
But the downturn in resources investment was still a substantial negative for the Queensland economy, and will continue to be a drag on the economy through 2016/17. Most of the resources investment downturn is concentrated in privately funded engineering construction undertaken in the mining regions (including Gladstone). Between 2013/14 and 2015/16, the value of resources-related engineering construction fell 73% to $9.1 billion, mostly focused in mining and heavy industry construction, railways, and pipeline construction. The mining regions, themselves, have been in a demand recession during this period.
Further working against the Queensland economy has been a 34% decline in public investment (driven by all levels of government) over the past six years. While falling, public investment gave private investment “room to move” during the second massive phase of the resources boom following the global financial crisis (GFC), more recently its impact has been to magnify the impact of the downturn in resources investment on jobs and incomes (see Figure 3.2).
But it has not all been bad news. Private investment, despite large falls in the past two years, remains well above pre-mining boom levels. The main positives over the past two years for the Queensland economy have been rising levels of dwelling investment, strong growth in mining production and exports (which boost GSP, but not SFD), higher private
FIGURE 3.1
Queensland State Final Demand versus Australia Gross National Expenditure Moving Annual Average Percent Change, Year Ended June
3. QUEENSLAND ECONOMY
-4
-2
0
2
4
6
8
10
88 90 92 94 96 98 00 02 04 06 08 10 12 14 16 18
Queensland SFD Australia GNE
Forecast
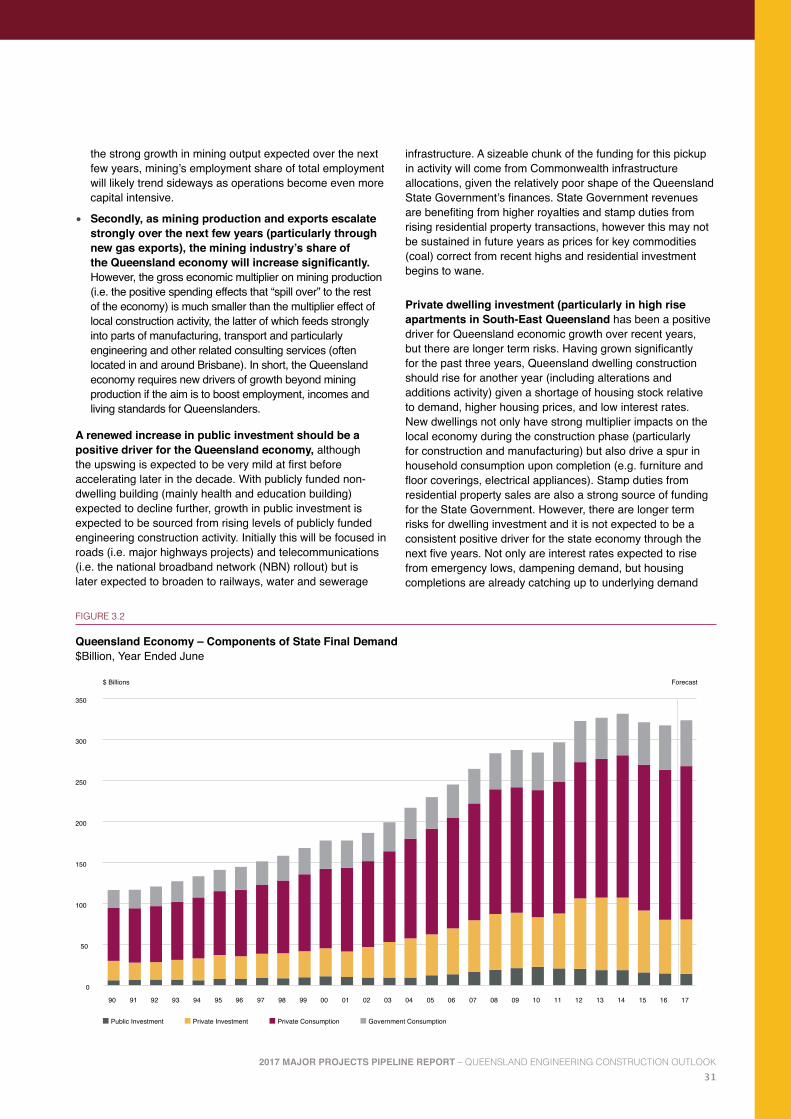
312017 MAJOR PROJECTS PIPELINE REPORT – QUEENSLAND ENGINEERING CONSTRUCTION OUTLOOK
FIGURE 3.2
Queensland Economy – Components of State Final Demand $Billion, Year Ended June
infrastructure. A sizeable chunk of the funding for this pickup in activity will come from Commonwealth infrastructure allocations, given the relatively poor shape of the Queensland State Government’s finances. State Government revenues are benefiting from higher royalties and stamp duties from rising residential property transactions, however this may not be sustained in future years as prices for key commodities (coal) correct from recent highs and residential investment begins to wane.
Private dwelling investment (particularly in high rise apartments in South-East Queensland has been a positive driver for Queensland economic growth over recent years, but there are longer term risks. Having grown significantly for the past three years, Queensland dwelling construction should rise for another year (including alterations and additions activity) given a shortage of housing stock relative to demand, higher housing prices, and low interest rates. New dwellings not only have strong multiplier impacts on the local economy during the construction phase (particularly for construction and manufacturing) but also drive a spur in household consumption upon completion (e.g. furniture and floor coverings, electrical appliances). Stamp duties from residential property sales are also a strong source of funding for the State Government. However, there are longer term risks for dwelling investment and it is not expected to be a consistent positive driver for the state economy through the next five years. Not only are interest rates expected to rise from emergency lows, dampening demand, but housing completions are already catching up to underlying demand
the strong growth in mining output expected over the next few years, mining’s employment share of total employment will likely trend sideways as operations become even more capital intensive.
• Secondly, as mining production and exports escalate strongly over the next few years (particularly through new gas exports), the mining industry’s share of the Queensland economy will increase significantly. However, the gross economic multiplier on mining production (i.e. the positive spending effects that “spill over” to the rest of the economy) is much smaller than the multiplier effect of local construction activity, the latter of which feeds strongly into parts of manufacturing, transport and particularly engineering and other related consulting services (often located in and around Brisbane). In short, the Queensland economy requires new drivers of growth beyond mining production if the aim is to boost employment, incomes and living standards for Queenslanders.
A renewed increase in public investment should be a positive driver for the Queensland economy, although the upswing is expected to be very mild at first before accelerating later in the decade. With publicly funded non-dwelling building (mainly health and education building) expected to decline further, growth in public investment is expected to be sourced from rising levels of publicly funded engineering construction activity. Initially this will be focused in roads (i.e. major highways projects) and telecommunications (i.e. the national broadband network (NBN) rollout) but is later expected to broaden to railways, water and sewerage
0
50
100
150
200
250
300
350
90 91 92 93 94 95 96 97 98 99 00 01 02 03 04 05 06 07 08 09 10 11 12 13 14 15 16 17
$ Billions Forecast
Public Investment Private Investment Private Consumption Government Consumption

32
against the US dollar in coming years, there is the risk that the Australian dollar will stubbornly remain around the US$0.75 mark for some time and may even appreciate, particularly as the Australian economy improves later this decade. Consequently, it will be important for Queensland businesses to take advantage of the competitive gains already rendered by the fall in the dollar now, and not wait or rely on further falls in the currency as part of a longer-term growth strategy.
Overall, a pick up in the Queensland economy is expected in the latter part of 2016/17, supported by strong growth in exports, a slowing in the pace of decline in resources investment and a long-awaited return to positive growth in public investment. GSP growth is forecast to be around 3% over the next two years, above the national average but below pre-mining boom growth rates. Longer term, Queensland economic growth is expected to be sustained in the 3-4% per annum range as growth becomes more broadly based, and its benefits more evenly distributed. Queensland has a diversified economy, and the competitive realignment of its key trade-exposed industries including agriculture, manufacturing, tourism, education and mining, is expected to be the main spur to economic growth through the remainder of the decade.
given much weaker population growth in recent years as the mining investment boom expired. While population growth is expected to gradually accelerate from here (see Figure 3.3), the residential property market may not move back into another strong investment phase until the early 2020s.
The other key growth driver for the Queensland economy remains the Australian dollar. The Queensland tourism industry has been buffeted for almost a decade, first by the GFC and then by the high Australian dollar which made holidaying in Australia more expensive relative to other destinations in the region (for both domestic and international visitors). However, after a decade of constraint, non-mining trade-exposed industries are beginning to recover. At the national level, tourism and education exports increased by 11.5% and 3.8% respectively in 2015/16. These sectors will need to refurbish and then expand to meet demand. Other dollar-exposed industries, are benefiting from the improved competitiveness of a lower dollar, showing initial signs of recovery. That will broaden to growth and, eventually, investment in the non-mining sectors. But it is expected to be a very long process.
While rising US interest rates and a near term correction in some key commodity prices (e.g. coal and iron ore) would suggest that the Australian dollar may depreciate further
FIGURE 3.3
Queensland Annual Population Increase by Source, Thousands of Persons Source: BIS Oxford Economics, ABS data
3. QUEENSLAND ECONOMY
0
20
40
60
80
100
120
01 02 03 04 05 06 07 08 09 10 11 12 13 14 15 16 17 18 19 20 21
Natural Increase Overseas Migration Interstate Migration
Thousands Forecast
332017 MAJOR PROJECTS PIPELINE REPORT – QUEENSLAND ENGINEERING CONSTRUCTION OUTLOOK
Total construction activity in Queensland is projected to stabilise around current levels for the remainder of the decade, with a pickup in engineering construction activity offsetting falling building work after 2016/17. In this weaker construction environment (compared to the recent boom), growth in construction costs has substantially eased, but costs remain well above that experienced a decade ago. Stronger growth in productivity will be important to improving the competitiveness of the Queensland construction industry and encouraging investment.
The key points can be summarised as follows:
• Queensland construction activity collapsed over 2014/15 and 2015/16. From a peak of $62.3 billion in 2013/14, construction work done (encompassing residential building, non-residential building and engineering construction) fell almost 40% to a trough of $37.7 billion 2015/16.
• Much of this decline was driven by the dominant engineering construction segment (including major projects), with total engineering construction work done falling from an official peak of $45.6 billion in 2013/14 to $18.5 billion in 2015/16. As outlined in Section 1 of this Pipeline, the decline in major project work done (a subset of the engineering construction market comprising projects valued over $50 million) is the key driver of the downturn, declining from nearly $18 billion in work done in 2012/13 to $5.2 billion in 2015/16.
• Over the forecast horizon, total construction is forecast to remain around 2015/16 levels (or marginally lower) but remain reasonably high in “pre-boom” terms. Following double-digit growth in recent years, residential building activity (particularly in the apartment sector) is projected to fall after 2016/17, offsetting modest growth in engineering construction. Consequently, it is critical for contractors and suppliers to the construction industry to plan for the changing mix in construction activity in the years ahead.
• The collapse in construction work done is affecting construction employment. From a peak of over 242,000
persons employed in the Queensland construction industry in early 2013, employment slumped to approximately 208,000 persons during 2015/16 but has picked up again recently in response to (relatively labour intensive) residential building work. Declining residential building activity later on is expected to drive lower levels of employment in the Queensland construction industry, despite a pickup in engineering construction work.
• Cycles in aggregate construction activity have implications for costs. The boom in construction activity in Queensland over the past decade produced large increases in construction costs. The stronger levels of activity and rising demand for inputs (in conjunction with a global boom in commodity prices) created capacity constraints, placing pressure on the supply of goods and labour, leading to increased prices.
• Costs tend to be flexible upwards but sticky downwards. While construction activity has declined, overall construction costs (as measured by various construction price indices) have not fallen substantially and are expected to rise again through the remainder of the decade in line with increasing input prices and a mild recovery in margins. Costs remain substantially higher than they were prior to the boom and may need to be sustained at lower levels for a period to make private projects competitive against global rivals, particularly in mining and resources.
Recent Trends and Outlook for Queensland Construction Activity• Since the mid-2000s, measured construction activity
in Queensland has been dominated by the tremendous cycle in resources investment, primarily coal and liquefied natural gas (LNG) related projects. Total construction activity (including residential building, non-residential building and engineering construction) peaked at $62.3 billion in 2013/14, almost 140% higher than 2004/05 levels. Over the past two years, however, the value of total construction work done fell by just under 40%, as several multi-billion dollar LNG projects reached
During the boom in mining and infrastructure investment, the Queensland construction market (encompassing building and engineering construction) was dominated by the fast-growing engineering construction segment. However, engineering construction has fallen steeply in recent years, with major projects, represented by engineering projects valued at over $50 million and focused on for this 2017 Major Project Pipeline Report (Pipeline), hit particularly hard. While a boom in residential building has partially offset the crunch in construction work done, this is not expected to be sustained.
4. QUEENSLAND CONSTRUCTION INDUSTRY REVIEW

34
or neared completion and investment in coal projects continued to decline sharply.
Over the forecast horizon, total construction activity is forecast to edge lower, but remain historically high, with weaker residential and non-residential building activity offsetting modest growth in engineering construction. Residential building construction is expected to peak in 2016/17, before falling away over most of the remainder forecast horizon. Non-residential building is also expected to ease slightly. This will leave engineering construction as the fastest growing industry segment over the remainder of the decade. However, unlike the 2000s boom, growth in engineering construction activity will be driven by rising public investment in infrastructure rather than resources investment. Total construction is forecast to average $36.5 billion per annum on average over the next five years, well down on the previous five-year period where activity averaged $52 billion.
Engineering ConstructionEngineering construction includes the construction of transport and utilities infrastructure, non-building recreation and mining and heavy industry construction. This sector is the prime focus of the Pipeline.
Over the two years to 2015/16, Queensland engineering construction work done has crashed 60% to $18.5 billion,
with privately funded work slumping by two-thirds as the three major LNG projects in Gladstone reached or neared completion, and new coal investment declined significantly.
However, this fall was magnified by a 19% slump in publicly funded engineering construction which, at $6.1 billion in 2015/16, is over 40% below its 2008/09 peak. Much of the decline in publicly funded engineering construction over the past seven years was focused in water and sewerage, bridges, roads and railways. While the 2008/09 peak in publicly funded infrastructure work was extraordinary (and supercharged by the construction of drought busting water infrastructure), it also represented an extensive amount of ‘catch up’ infrastructure construction, with annual average publicly funded engineering construction from the 1970s right through the 1990s generally fixed between $2-3 billion per annum (in real terms), despite substantial growth in the Queensland population and infrastructure demand.
It is expected that engineering construction activity in Queensland will bottom out during 2016/17 and then grow modestly in coming years. Increasing engineering construction work is expected to be driven by large public infrastructure projects and, later this decade, further resource related projects, as indicated in the Pipeline. However, the magnitude of the next upswing is unlikely to be anywhere near as significant as the previous, resources investment-fuelled cycle.
FIGURE 4.1
Queensland Construction Work Done by Segment $Billion, Constant 2012/13 Prices Source: BIS Oxford Economics, ABS
4. QUEENSLAND CONSTRUCTION INDUSTRY REVIEW
0
10
20
30
40
50
60
70
2003 2005 2007 2009 2011 2013 2015 2017 2019 2021
Year ended June
Non-Residential Building Residential Building Engineering Construction
$ Billion

352017 MAJOR PROJECTS PIPELINE REPORT – QUEENSLAND ENGINEERING CONSTRUCTION OUTLOOK
Residential and Non-Residential BuildingAccording to the Australian Bureau of Statistics (ABS), buildings are defined as “rigid, fixed and permanent structures which have a roof”, and include the construction of both residential and non-residential stock. It is noted that the Pipeline does not include building projects, but these may be added to future Pipelines. Building work done in Queensland was valued at just under $20 billion in 2015/16, slightly above the $18 billion in work done in engineering construction. This is the first time building activity has exceeded engineering construction in Queensland since 2007/08, although building is traditionally the larger of the two construction segments.
Residential building started to increase in Queensland in 2013/14 (+8% work done) following a very weak period since the GFC. Activity accelerated in 2014/15 (+16%) and 2015/16 (+18%), with residential work done just below the 2007/08 peak. This increase was driven by growing pressure on the existing dwelling stock as well as low interest rates, and was realised, predominately, by a sharp uplift in apartment construction in Brisbane. Outside of South East Queensland, new dwelling construction continues to run at relatively low levels. While residential building activity is expected to increase marginally in 2017/18 (to a new peak), a significant contraction is forecast from 2017/18. The Inner Brisbane and Gold Coast apartment markets are edging towards oversupply and are likely to see the brunt of the decline.
Non-residential building activity edged up a marginal 2% in 2015/16 to $6.6 billion, but this masks strong cycles playing out in non-residential building subcategories. In particular, sharp increases in accommodation (driven by renewed interstate and international tourism) as well as entertainment and recreation (boosted by Commonwealth Games works) have countered significant falls in transport building, warehouses and education building. Non-residential work done is anticipated to edge down slightly in coming years, mainly driven by the completion of major hospital projects (including the Sunshine Coast University Hospital) and a string of smaller office developments. However, much of these losses will be absorbed by further increases in accommodation building, integrated resort developments and a recovery in education building.
While only a mild recovery for non-residential building is projected later in the forecast period, there is considerable upside for non-residential building given the need to refurbish and expand hotel capacity in the recovering tourism (as opposed to mining) regions, and strong international interest in developing further recreation facilities and precincts as Queensland benefits from rising tourism from China.
Construction Industry Productivity and CostsQueensland construction labour productivity growth has historically been near zero since the mid-1980s, reflecting international trends. However, recent data from the ABS on Construction Gross Value Added (GVA i.e. the output of the domestic construction industry in Queensland, as opposed to “work done”) and employment suggest that this long-term trend has been broken; that there has been a significant
step improvement in Queensland’s construction labour productivity in recent years. However, this productivity surge is likely to be overstated given the likely understatement of employment growth in the industry between 2009 and 2013 (as Queensland construction workers may have been misclassified as mining employees in the official statistics) coupled with unusually large increases in construction industry GVA in 2014/15 despite a 25% slump in work done. Consequently, there are significant doubts as to whether labour productivity has increased in a sustainable way in Queensland’s construction industry. This is important, as developing ways to improve construction labour productivity, through better training and skills development, removing outdated inefficient work practices that do not impinge on safety or environmental standards, or simply labour-saving capital investment, will be vital in improving the long-term cost competitiveness of the industry.
Queensland construction wages (measured by construction industry wage price index data) grew significantly through the construction boom, rising over 40% between 2003 and 2012 at an annual average pace of 4.5% per annum. However, the slowdown in growth in domestic construction work (i.e. excluding fabricated LNG imports) has seen construction wage growth slow significantly. In the three years since 2012, growth in the wage price index has averaged just 2.1% per annum (and just 1.2% in 2015/16, the slowest rate of wage growth since the ABS started records for this measure in 1997/98 (see Figure 4.2).
Queensland construction costs, more broadly, also accelerated during the 2000s construction boom. While construction cost growth has slowed (and in some cases retreated) in recent years, construction costs are still well above the “pre-boom” years.
High and rising construction costs are an important issue for the major projects industry as well as the broader economy as:
• It limits the quantum of publicly funded projects that can be delivered against given State and Commonwealth budgets. Where unplanned increases in construction costs occur, it can effectively reduce the funding available for further work.
• It worsens the competitiveness of developing private sector industrial projects (e.g. in mining or manufacturing) in Australia relative to the rest of the world, in turn potentially impacting on decisions to invest in Australian projects.
Not surprisingly, rapid increases in construction activity can go hand in hand with accelerating construction costs. High (and rising) levels of demand (i.e. construction activity) not only places pressure on the existing supply of inputs, boosting prices, but also allows construction companies to raise their prices (and possibly margins). Where capacity constraints exist, rising construction activity can lead to strong increases in input prices as investment in new capacity is itself costly and takes time to come on stream.
Construction costs may also vary due to changes in input prices determined by global markets (for example, steel and oil
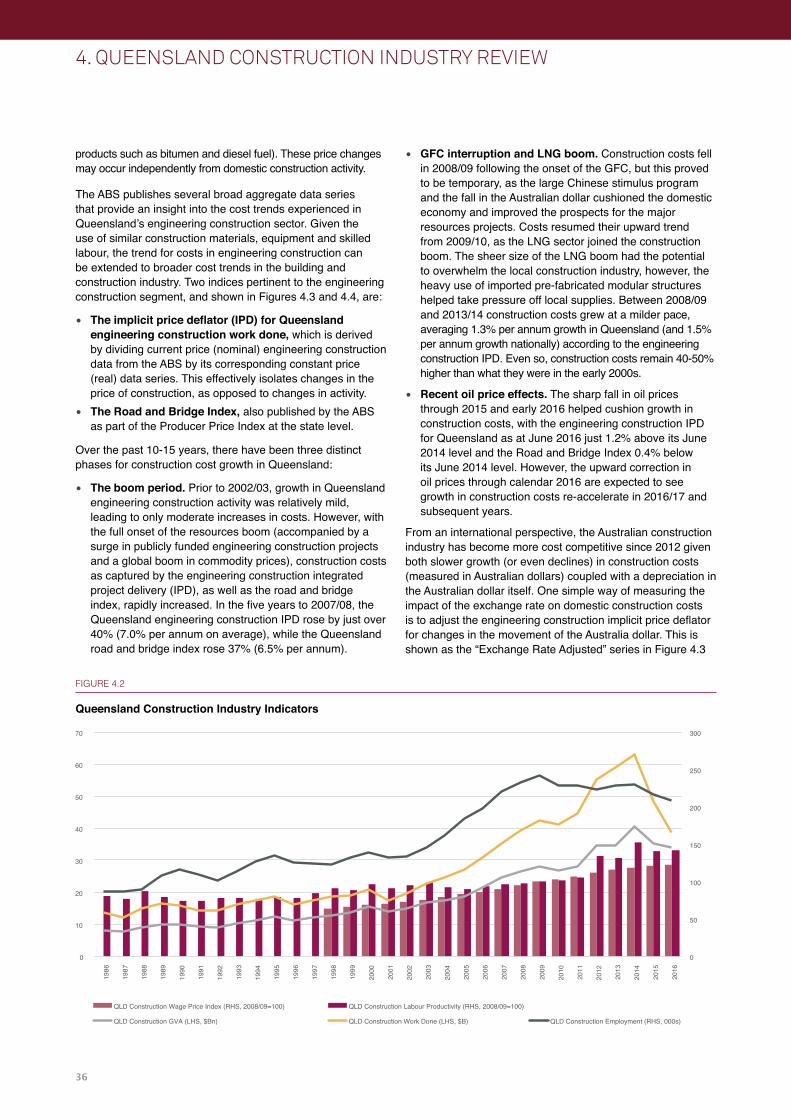
36
products such as bitumen and diesel fuel). These price changes may occur independently from domestic construction activity.
The ABS publishes several broad aggregate data series that provide an insight into the cost trends experienced in Queensland’s engineering construction sector. Given the use of similar construction materials, equipment and skilled labour, the trend for costs in engineering construction can be extended to broader cost trends in the building and construction industry. Two indices pertinent to the engineering construction segment, and shown in Figures 4.3 and 4.4, are:
• The implicit price deflator (IPD) for Queensland engineering construction work done, which is derived by dividing current price (nominal) engineering construction data from the ABS by its corresponding constant price (real) data series. This effectively isolates changes in the price of construction, as opposed to changes in activity.
• The Road and Bridge Index, also published by the ABS as part of the Producer Price Index at the state level.
Over the past 10-15 years, there have been three distinct phases for construction cost growth in Queensland:
• The boom period. Prior to 2002/03, growth in Queensland engineering construction activity was relatively mild, leading to only moderate increases in costs. However, with the full onset of the resources boom (accompanied by a surge in publicly funded engineering construction projects and a global boom in commodity prices), construction costs as captured by the engineering construction integrated project delivery (IPD), as well as the road and bridge index, rapidly increased. In the five years to 2007/08, the Queensland engineering construction IPD rose by just over 40% (7.0% per annum on average), while the Queensland road and bridge index rose 37% (6.5% per annum).
• GFC interruption and LNG boom. Construction costs fell in 2008/09 following the onset of the GFC, but this proved to be temporary, as the large Chinese stimulus program and the fall in the Australian dollar cushioned the domestic economy and improved the prospects for the major resources projects. Costs resumed their upward trend from 2009/10, as the LNG sector joined the construction boom. The sheer size of the LNG boom had the potential to overwhelm the local construction industry, however, the heavy use of imported pre-fabricated modular structures helped take pressure off local supplies. Between 2008/09 and 2013/14 construction costs grew at a milder pace, averaging 1.3% per annum growth in Queensland (and 1.5% per annum growth nationally) according to the engineering construction IPD. Even so, construction costs remain 40-50% higher than what they were in the early 2000s.
• Recent oil price effects. The sharp fall in oil prices through 2015 and early 2016 helped cushion growth in construction costs, with the engineering construction IPD for Queensland as at June 2016 just 1.2% above its June 2014 level and the Road and Bridge Index 0.4% below its June 2014 level. However, the upward correction in oil prices through calendar 2016 are expected to see growth in construction costs re-accelerate in 2016/17 and subsequent years.
From an international perspective, the Australian construction industry has become more cost competitive since 2012 given both slower growth (or even declines) in construction costs (measured in Australian dollars) coupled with a depreciation in the Australian dollar itself. One simple way of measuring the impact of the exchange rate on domestic construction costs is to adjust the engineering construction implicit price deflator for changes in the movement of the Australia dollar. This is shown as the “Exchange Rate Adjusted” series in Figure 4.3
FIGURE 4.2
Queensland Construction Industry Indicators
4. QUEENSLAND CONSTRUCTION INDUSTRY REVIEW
0
50
100
150
200
250
300
0
10
20
30
40
50
60
70
1986
1987
1988
1989
1990
1991
1992
1993
1994
1995
1996
1997
1998
1999
2000
2001
2002
2003
2004
2005
2006
2007
2008
2009
2010
2011
2012
2013
2014
2015
2016
QLD Construction Wage Price Index (RHS, 2008/09=100) QLD Construction Labour Productivity (RHS, 2008/09=100)
QLD Construction GVA (LHS, $Bn) QLD Construction Work Done (LHS, $B) QLD Construction Employment (RHS, 000s)

372017 MAJOR PROJECTS PIPELINE REPORT – QUEENSLAND ENGINEERING CONSTRUCTION OUTLOOK
FIGURE 4.3
Engineering Construction Implicit Price Deflators versus Queensland Work Done Source: BIS Oxford Economics, ABS data
FIGURE 4.4
Road and Bridge Construction Price Indexes versus Queensland Work Done Source: BIS Oxford Economics, ABS data
0.0
2.0
4.0
6.0
8.0
10.0
12.0
14.0
40
50
60
70
80
90
100
110
120
Jun-
1988
Jun-
1989
Jun-
1990
Jun-
1991
Jun-
1992
Jun-
1993
Jun-
1994
Jun-
1995
Jun-
1996
Jun-
1997
Jun-
1998
Jun-
1999
Jun-
2000
Jun-
2001
Jun-
2002
Jun-
2003
Jun-
2004
Jun-
2005
Jun-
2006
Jun-
2007
Jun-
2008
Jun-
2009
Jun-
2010
Jun-
2011
Jun-
2012
Jun-
2013
Jun-
2014
Jun-
2015
Jun-
2016
$ BillionIndex
Queensland Engineering Construction Excluding Oil and Gas Queensland Oil and Gas
AUST IPD QLD IPD Exchange Rate Adjusted Aust IPD
0.0
0.5
1.0
1.5
2.0
2.5
40
50
60
70
80
90
100
110
120
Jun-
1999
Dec
-199
9
Jun-
2000
Dec
-200
0
Jun-
2001
Dec
-200
1
Jun-
2002
Dec
-200
2
Jun-
2003
Dec
-200
3
Jun-
2004
Dec
-200
4
Jun-
2005
Dec
-200
5
Jun-
2006
Dec
-200
6
Jun-
2007
Dec
-200
7
Jun-
2008
Dec
-200
8
Jun-
2009
Dec
-200
9
Jun-
2010
Dec
-201
0
Jun-
2011
Dec
-201
1
Jun-
2012
Dec
-201
2
Jun-
2013
Dec
-201
3
Jun-
2014
Dec
-201
4
Jun-
2015
Dec
-201
5
Jun-
2016
$ Billions
Queensland Road & Bridge Construction AUST Index QLD Index
38
4. QUEENSLAND CONSTRUCTION INDUSTRY REVIEW
where the national engineering construction implicit price deflator for each quarter has been multiplied by the exchange rate of the Australian dollar to Special Drawing Rights, or SDRs (a weighted basket of major currencies representing claims of International Monetary Funds (IMF)member countries).
Viewed in this way, a slightly different historical picture of competitiveness emerges. Firstly, rather than relative construction costs increasing between 1997 and 2003, a falling Australian dollar actually made local construction and development more internationally competitive during this period. This more than likely helped place Australia at the front of the queue as a destination for investment and, along with the rise of China in supercharging global demand, helped
kick-start the domestic boom in resources development. By contrast, the relentless rise in the Australian dollar between 2003 and 2008 reversed these gains and exacerbated the loss of competitiveness from rising domestic costs. The sharp fall in the dollar in the immediate aftermath of the GFC in 2008/09 restored some of this competitiveness (and, fortuitously, at a time when major investment decisions were being made on three massive LNG projects in Queensland). The strong rise in the dollar between 2008 and 2012 once again placed Australia at a competitive disadvantage, but this has been partially unwound by the depreciation of the dollar against the SDR basket of currencies in recent years. Recent increases in the value of the Australian dollar are again affecting international competitiveness, however.

392017 MAJOR PROJECTS PIPELINE REPORT – QUEENSLAND ENGINEERING CONSTRUCTION OUTLOOK
This massive investment has taken a few years to unwind completely, but the process will be all but complete in the 2016/17 financial year. The industry is embarking on a new path that is more modest in scale, but also more stable and sustainable for our workforce.
The mining boom of 2003-2013 created thousands of engineering construction jobs. At the beginning of 2003, there were around 10,000 engineering construction workers in Queensland. By the height of the boom at the end of 2013, that number was around 27,000 – a 180% increase (see Figure 5.1).
However, the sheer number of hours worked per week increased by even more. A 233% increase from 370,000 in 2003, to 1.2 million in 2013. At the height of the boom, the average engineering construction worker was putting in an extra seven hours per week.
Bigger still was the increase in output over the boom years. Engineering construction activity, measured in dollars of work done, soared by 500% between 2003 and 2013. This means about twice as much was spent per worker at the boom’s peak than in 2003. In summary, the mining boom was a period of intensive work characterised by long hours and high pay. Those days are over, which means two things for the workforce going forward.
Firstly, there is no escaping the reality that the boom was a source of a large number of jobs that simply do not exist anymore (at least not in Queensland). Yet the impact on many workers will be less severe than, at a glance, as the ‘mining cliff’ might suggest. For many workers, the post-boom environment will represent a return-to-normal after a relatively short but intense (and rewarding) period. Many workers will plausibly experience a reduction in hours rather than unemployment.
Secondly, these workers are now likely to experience lower wage growth, because the high wages commanded in the mad rush to bring mining and resources projects from the drawing board to production will not be sustainable in a post-boom world. It is expected that wages will stagnate for the near future as the cost of labour rebalances to more natural, pre-boom levels.
Major Projects Employment Outlook The Pipeline of major projects represents a significant engine of job creation for Queensland’s engineering construction workers.
The amount of work forecast for the next few years will hold major project employment around the levels that prevailed prior to the mining boom. In fact, by pre-boom standards,
FIGURE 5.1
Labour Response to the Resources Boom Source: ABS, CSQ
After the Boom: Major project activity forecast in the 2017 Major Projects Pipeline Report (Pipeline) reflects a return to lower trend levels of construction work after the decade-long mine building effort that Queensland began in 2003.
5. QUEENSLAND CONSTRUCTION WORKFORCE IMPLICATIONS
Inde
xed
to 2
013
0
100
200
300
400
500
600
Total Hours Worked No. of Workers Hours per Worker Output ($) Output per Worker
2003 2013 2016

40
Queensland Government Building and Construction Training PolicyThe Queensland Government’s Building and Construction Training Policy (the Training Policy) requires contractors to employ apprentices and trainees and undertake other workforce training as a condition of being awarded work on eligible Queensland Government projects.
The Training Policy is one element in a longstanding partnership between the building and construction industry and the Queensland Government to develop the industry's skills base and future workforce capability. Construction Skills Queensland (CSQ) administers contractor compliance data on behalf of the Queensland Government through the Training Policy Administration System (TPAS), which enables contractors to report electronically their compliance with the policy.
Of the more than 250 projects captured in the Pipeline, it is estimated that around 90 are likely to be eligible for the Training Policy. This is expected to generate around 7.7 million hours of training over the life of this pipeline of work. This will provide great skilling opportunities for existing workers and new employment opportunities for apprentices and trainees.
In addition to administering contractor compliance through TPAS, CSQ also assists contractors to comply with the Training Policy and to identify training needs and connect contractors with funded training opportunities, including training programs funded by CSQ itself.
Encouragingly, recorded new entrant hours under the Training Policy indicate that government-funded infrastructure has provided additional employment opportunities for people entering a career pathway through an apprenticeship or traineeship in the building and construction industry.
The other workforce training hours further supports the fact that government funded infrastructure is providing additional employment and training opportunities for the existing
2017-18 is set to be a bumper year for major project jobs, as clear a sign as any that the contractionary conditions endured for the last few years are now receding (see Figure 5.2).
However, the large bump in 2017-18 is unlikely to be sustained into later years. This would require virtually all of the unfunded projects going ahead. Instead, employment is likely to be closer to pre-boom levels, in the range of 10,000-15,000 major project jobs.
Queensland’s construction workers are entering a period of uncertainty. The next phase of major project construction will be driven by infrastructure investment and, while a new boom of major infrastructure projects is taking shape in the southern states, not as much is slated for Queensland. As a result, there is likely to be a large pool of workers competing for the opportunity to fulfil a dwindling pipeline of activity in the short term. This will encourage many Queenslanders to move south in pursuit of the infrastructure dollar. But this exposes the Queensland construction industry to risks of capability and skills constraints once activity does pick up.
This underlines the importance of a longer-term view on workforce planning. A continued tight coupling between major infrastructure spending and workforce development is critical to ensuring the right skills are available in the right place and at the right time. A focus must be maintained on attracting new entrants, as well as retaining and developing existing workers.
Occupational ProfileThe engineering construction workforce is made-up of more than 75 occupations. Yet 20 of these occupations account for almost 80% of the total workforce, while half of the workforce is concentrated in just 10 occupations. Concreters, labourers, and drivers of trucks and plant are the most populous engineering construction occupations. Forecasts suggest that these occupations will be in surplus in Queensland for the foreseeable future (see Figure 5.3).
FIGURE 5.2
Major Projects Employment Outlook Source: BIS Oxford Economics, CSQ
5. QUEENSLAND CONSTRUCTION WORKFORCE IMPLICATIONSJo
bs (ʼ
000s
)
0
5
10
15
20
25
30
Jul-1
5
Oct
-15
Jan-
16
Apr-1
6
Jul-1
6
Oct
-16
Jan-
17
Apr-1
7
Jul-1
7
Oct
-17
Jan-
18
Apr-1
8
Jul-1
8
Oct
-18
Jan-
19
Apr-1
9
Jul-1
9
Oct
-19
Jan-
20
Apr-2
0
Jul-2
0
Oct
-20
Funded Not Funded

412017 MAJOR PROJECTS PIPELINE REPORT – QUEENSLAND ENGINEERING CONSTRUCTION OUTLOOK
‘Lite’ versions of this technology are already established in the Australian market, with global positioning system (GPS)based survey and machine control systems receiving plenty of attention in recent years. This signals big change for plant operators and surveyors, whose experienced hands and eyes have historically been highly sought after. It may be some time before we see truly humanless earthworks a part of mainstream construction practice, but significant intermediate disruptions will be felt much sooner.
One important effect already evident is the ‘de-specialisation’ of plant operations because of machine control systems being introduced by a range of Australian suppliers, such as Position Partners, SITECH Solutions and C.R. Kennedy. Once the domain of highly skilled and experienced operators, these companies are leveraging leading technologies from international firms like Trimble, Leica and Topcon to simplify the task of plant operations to the point that good results can be achieved by relative novices.
While potentially disorienting for established operators, this trend will be a boon for principal contractors and their supply chain who often need all their workers to be able to perform multiple tasks. The reduced skill requirement also has implications for the length, complexity and cost of plant operator training. It is conceivable that training systems and regulations will need to adjust quickly over the coming years to accommodate this increasingly disrupted landscape.
workforce and career seekers and is contributing towards Indigenous participation in the workforce, specifically in major project work.
Humanless Earthworks (‘Farsight’ Sidebar) CSQ’s research partnership with CSIRO exploring the future of construction — The Farsight Project — predicts engineering construction will feel the pressure of disruption over the coming decades.
To take one example from the engineering construction supply chain, earthmoving is a task that has already been significantly automated, and this trend is set to accelerate. Suppliers of earthmoving equipment and aftermarket accessories are developing technologies that are transforming the traditionally highly-skilled task of plant operations.
Komatsu, for example, has responded to Japan’s dire skills shortages with an end-to-end earthworks service that is completely autonomous. First, Komatsu’s specialists operate drones equipped with high-fidelity instruments to aerially survey the terrain. Engineers use these survey outputs to develop digital building information modelling (BIM) plans for cutting, filling and grading the site. The BIM models are then fed into a proprietary computer system that orchestrates a fleet of driverless plant around the site to complete the work.
FIGURE 5.3
Major Projects Occupational Profile Source: BIS Oxford Economics, CSQ
0% 1% 2% 3% 4% 5% 6% 7% 8% 9%
Concreters
Building and Plumbing Labourers
Truck Drivers
Earthmoving Plant Operators
Structural Steel and Welding Trades Workers
Structural Steel Construction Workers
Construction Managers
Other Construction and Mining Labourers
Other Mobile Plant Operators
Railway Track Workers
Share of Total Employment

42
Several key points are worth emphasising:
• After 5 years of continuous decline, major project work is expected to reach a trough in 2016/17 with only a modest recovery in 2017/18.
• Growth beyond 2017/18 is predicated on unfunded projects proceeding into the construction phase, across both the public and private sectors. As such, the outlook is highly susceptible to risk.
• Roads and railways segments offers the strongest growth prospects for major project activity, while mining and heavy industry construction should also offer a sizeable baseload of work for the industry.
• South East Queensland, the Surat Basin and Northern Queensland represent the strongest regional opportunities for projected activity. South East Queensland will see the largest volumes of work overall, but growth in activity in Northern Queensland is also notable, as is the planned development of the Galilee Basin.
• Public infrastructure investment now represents around 50% of the Pipeline. Given this, it is important to ensure that projects continue to be selected and financed on sensible criteria, but are not unnecessarily stalled by
Commonwealth and State funding negotiations, overly bureaucratic business case frameworks and disruptive approval processes. Policies that encourage private provision of infrastructure should be promoted.
• With other states such as New South Wales and Victoria ramping up infrastructure investment over the remainder of this decade, challenges may re-emerge in finding suitable skill-sets. Queensland needs to apply a longer-term approach to planning for the future workforce in a way that links workforce planning and skills development to both current and future activity. We need to remain vigilant about workforce development, skills acquisition, attracting new entrants and retaining skilled workers. The process of workforce planning needs to be linked to infrastructure planning so that Queensland has the right skills available at the right time to deliver major projects.
Implications and Challenges Queensland has collapsed, driving sharp falls in major project work. While much of the blame for this decline can be traced back to an unsustainable resources boom, which has now well and truly bust, there has also been a significant reduction in public investment over the same period.
Figure 6.1 compares last year’s major projects five-year outlook to the present forecast (note 2015/16 is now historical rather than forecast). In this new report, we also include projects between $50 million to $100 million in value whereas previous reports only considered projects above $100 million in value.
FIGURE 6.1
Major Project Work Done Forecast: 2017 versus 2016
6. KEY IMPLICATIONS, CHALLENGES AND RISKS
5. QUEENSLAND CONSTRUCTION WORKFORCE IMPLICATIONS
20000
15000
5000
10000
17500
7500
12500
2500
0
20000
15000
5000
10000
17500
7500
12500
2500
0
$ Million $ Million
12/13Current
12/13Previous
13/14Current
13/14Previous
14/15Current
14/15Previous
15/16Current
15/16Previous
16/17Current
16/17Previous
17/18Current
17/18Previous
18/19Current
18/19Previous
19/20Current
19/20Previous
20/21Current
20/21Previous
Total Not Funded - Prior Total Funded - Prior Galilee Basin Total Projects < $100 Million Total Not Funded Total Funded
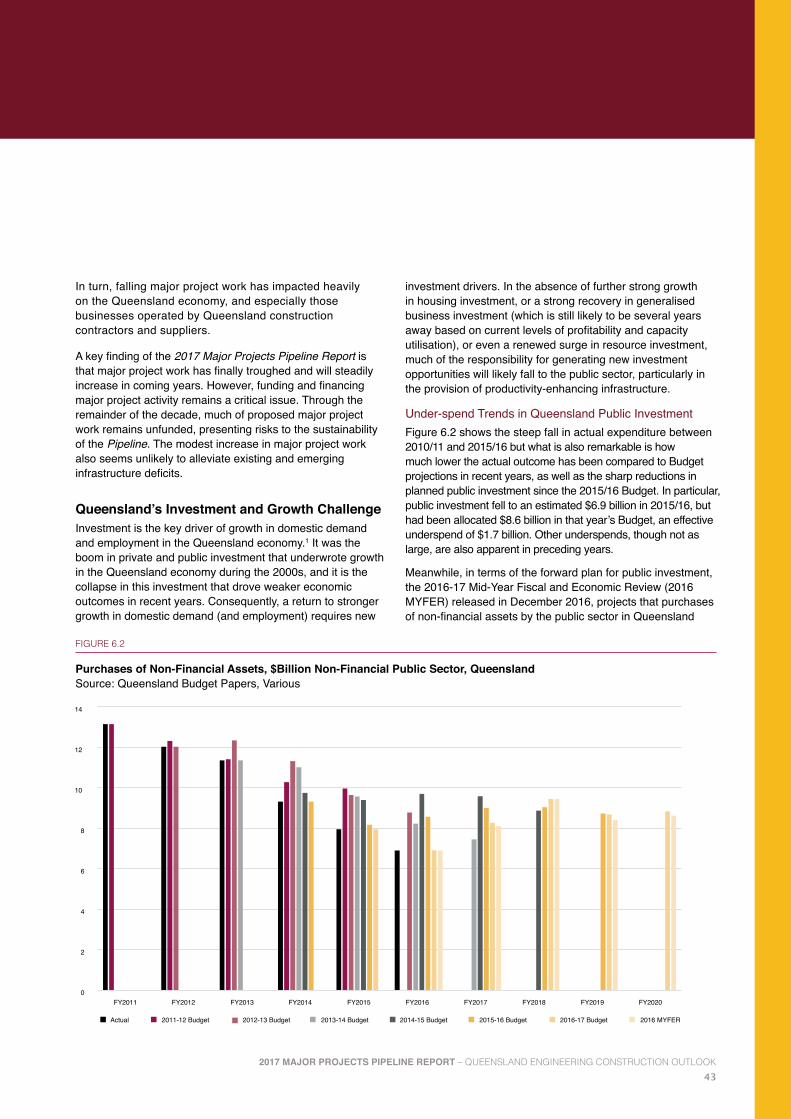
432017 MAJOR PROJECTS PIPELINE REPORT – QUEENSLAND ENGINEERING CONSTRUCTION OUTLOOK
In turn, falling major project work has impacted heavily on the Queensland economy, and especially those businesses operated by Queensland construction contractors and suppliers.
A key finding of the 2017 Major Projects Pipeline Report is that major project work has finally troughed and will steadily increase in coming years. However, funding and financing major project activity remains a critical issue. Through the remainder of the decade, much of proposed major project work remains unfunded, presenting risks to the sustainability of the Pipeline. The modest increase in major project work also seems unlikely to alleviate existing and emerging infrastructure deficits.
Queensland’s Investment and Growth ChallengeInvestment is the key driver of growth in domestic demand and employment in the Queensland economy.1 It was the boom in private and public investment that underwrote growth in the Queensland economy during the 2000s, and it is the collapse in this investment that drove weaker economic outcomes in recent years. Consequently, a return to stronger growth in domestic demand (and employment) requires new
investment drivers. In the absence of further strong growth in housing investment, or a strong recovery in generalised business investment (which is still likely to be several years away based on current levels of profitability and capacity utilisation), or even a renewed surge in resource investment, much of the responsibility for generating new investment opportunities will likely fall to the public sector, particularly in the provision of productivity-enhancing infrastructure.
Under-spend Trends in Queensland Public InvestmentFigure 6.2 shows the steep fall in actual expenditure between 2010/11 and 2015/16 but what is also remarkable is how much lower the actual outcome has been compared to Budget projections in recent years, as well as the sharp reductions in planned public investment since the 2015/16 Budget. In particular, public investment fell to an estimated $6.9 billion in 2015/16, but had been allocated $8.6 billion in that year’s Budget, an effective underspend of $1.7 billion. Other underspends, though not as large, are also apparent in preceding years.
Meanwhile, in terms of the forward plan for public investment, the 2016-17 Mid-Year Fiscal and Economic Review (2016 MYFER) released in December 2016, projects that purchases of non-financial assets by the public sector in Queensland
FIGURE 6.2
Purchases of Non-Financial Assets, $Billion Non-Financial Public Sector, Queensland Source: Queensland Budget Papers, Various
0
2
4
6
8
10
12
14
FY2011 FY2012 FY2013 FY2014 FY2015 FY2016 FY2017 FY2018 FY2019 FY2020
Actual 2011-12 Budget 2012-13 Budget 2013-14 Budget 2014-15 Budget 2015-16 Budget 2016-17 Budget 2016 MYFER

44
will be $2.5 billion lower in the period between 2015/16 and 2018/19 inclusive compared to the 2015/16 Budget, and $655 million lower than the 2016/17 Budget which was released earlier in the year.
Within the Budget, the Queensland Government refers to a $40 billion infrastructure program over four years, a figure drawn from gross investment data. In net terms, allowing for the fact that depreciating infrastructure needs to be refurbished or replaced, infrastructure expenditure is substantially lower and, after peaking in 2017/18, declines again over the remainder of the forward estimates (as shown in Figure 6.3). Under the 2016 MYFER, net acquisitions of non-financial assets is expected to be just $2.2 billion by 2019/20, compared to over $8 billion during the peak years at the turn of the previous decade.
The Economic Costs of Inadequate Infrastructure InvestmentThe recent decline in public investment, albeit from high levels during the 2000s, as well as the relatively mild profile projected for coming years, is a cause for concern. While quantification of existing infrastructure adequacy and measurements or an infrastructure deficit is fraught with difficulties,2 there is still enough evidence to suggest that higher levels of infrastructure investment will be required into the future, given expected economic and population growth, to avoid high economic costs from infrastructure bottlenecks and congestion.
At the national level, studies by the Royal Bank of Scotland and Citigroup 3 as well as Infrastructure Australia4 have quantified Australia’s required infrastructure investment task
at figures ranging from $300 billion to $770 billion. Even so, Australia has performed relatively well in regards to investment in infrastructure since the global financial crisis (GFC), with infrastructure investment between 2008 and 2013 generally higher (as a percentage of gross domestic product (GDP)) than most developed economies and (if sustained) above the rate required to meet projected infrastructure needs between 2016 and 2030.5 Where Australia failed in this comparison, however, was in the quality of infrastructure spending given the level of income, and the downward trajectory of public infrastructure investment since 2010.6 This highlights two important issues in the infrastructure debate: (i) choosing the right infrastructure projects and programs and (ii) sustaining optimal levels of infrastructure investment into the longer term.
There is evidence at the Queensland level, too, which suggests that infrastructure investment is not keeping up with demand. At the peak of the public investment cycle in 2010, Engineers Australia downgraded the quality and adequacy ratings of the state’s infrastructure assets noting specifically that:
“Given the scale of under-investment in maintenance and renewals to date, and the ongoing increase in demand driven by population growth and the resources sector, the challenges in addressing current and future infrastructure demands could be rated as somewhere between considerable to highly disturbing.” 7
In 2015, analysis by the Queensland Infrastructure Alliance suggested that, based on international infrastructure investment to GDP norms, Queensland infrastructure provision has not kept up with infrastructure demand. Despite surging infrastructure expenditure during the 2000s, an
FIGURE 6.3
Purchases of Non-Financial Assets Non-Financial Public Sector, Queensland Source: Queensland Budget Papers, Various
6. KEY IMPLICATIONS, CHALLENGES AND RISKS
Gross purchases of non-financial assets Depreciation and other adjustmentsNet acquisitions of non-financial assets
0
2
4
6
8
10
12
14
FY2011 FY2012 FY2013 FY2014 FY2015 FY2016 FY2017 FY2018 FY2019 FY2020
2016 MYFER Projections

452017 MAJOR PROJECTS PIPELINE REPORT – QUEENSLAND ENGINEERING CONSTRUCTION OUTLOOK
“infrastructure deficit” remained and has widened significantly in recent years.8 While the quantum of the measured deficit is open to debate, the broader result is supported by findings from the 2015 Australian Infrastructure Audit commissioned by Infrastructure Australia. With Australia’s population projected to grow to 30.5 million by 2031 (and with three quarters of this growth to take place in Australia’s four largest capital cities – Sydney, Melbourne, Brisbane and Perth), a key finding of the report was that existing infrastructure gaps in urban transport and regional water will continue to widen unless infrastructure investment is increased.
The infrastructure challenge, according to Infrastructure Australia, would be particularly challenging for Queensland given the expectation of economic and population growth rising at a rate far above the national average over the 20 years to 2031, putting pressure on transport for South East Queensland (including Brisbane) specifically, but also for key regional centres and along freight routes. Given the state of existing infrastructure, the direct economic cost of congestion along the most trafficked Sunshine Coast-Brisbane-Gold Coast transport network, estimated at $2 billion per annum in 2011, will rise to $9 billion per annum by 2031 if not adequately addressed. This is in line with congestion cost estimates from the Bureau of Transport and Regional Economics (BITRE), which estimated avoidable road congestion costs in Brisbane to be approximately $2.3 billion in 2014/15 alone,9 but on a significant rising trend (Figure 6.4) despite considerable investment in road transport in recent years (Figure 6.5). Scenarios modelled by BITRE suggest that these costs could rise to between $3.8 billion to $7.9 billion per annum by 2029/30, with the most significant increases
occurring if recent trends towards lower vehicle kilometres travelled (VKT) per capita following the GFC were to reverse (“High VKT” scenario) and population growth were to be relatively robust (“High Baseline” scenario).
The Infrastructure Funding ChallengeRecent Budget projections suggest that funding for Queensland infrastructure investment will be constrained in coming years, increasing the risk of rising economic costs in the future through congestion and loss of productivity.
This is despite increasing Commonwealth funding for Queensland transport infrastructure in recent years (let alone the sharply rising contribution for the rollout of the national broadband network (NBN) that is provided through an NBN Co, a wholly owned Commonwealth company). Transport infrastructure represents a significant part of the Queensland State Infrastructure Plan, contributing around two thirds of all economic infrastructure planned for delivery over the next three to four years. While the Commonwealth builds almost no transport infrastructure itself, it provides funding contributions to state governments as tied grants for specific projects, known as National Partnership Payments. For major transport projects, it is very common to have both Commonwealth and state funding applied. When the Commonwealth provides funding to a state government, this expenditure is reported at both the Commonwealth and state government level (refer Figure 6.6).
While Commonwealth funding is important to Queensland, it has typically constituted a minority of its transport infrastructure funding, which over the past 12 years has
FIGURE 6.4
Avoidable Road Congestion Costs, $Billion, Brisbane, Year Ended June Source: BITRE
0
1
2
3
4
5
6
7
8
9
90 92 94 96 98 00 02 04 06 08 10 12 14 16 18 20 22 24 26 28 30
Upper Baseline Lower Baseline High VKT Low VKT

46
FIGURE 6.5
Publicly Funded Engineering Construction, Queensland, $Billion, Year Ended June Source: ABS Engineering Construction Survey, Cat. No. 8762.0
FIGURE 6.6
Transport Infrastructure – Commonwealth funding to Queensland (excluding to Local Government) and Queensland Government own source funding, $Billions Source: Grattan Institute
6. KEY IMPLICATIONS, CHALLENGES AND RISKS
0
1
2
3
4
5
6
1974
1975
1976
1977
1978
1979
1980
1981
1982
1983
1984
1985
1986
1987
1988
1989
1990
1991
1992
1993
1994
1995
1996
1997
1998
1999
2000
2001
2002
2003
2004
2005
2006
2007
2008
2009
2010
2011
2012
2013
2014
2015
2016
Roads and Bridges Railways and Harbours Water and Sewerage Electricity and Pipelines Telecoms, recreation and other
0
1
2
3
4
5
6
7
8
2005/06 2007/08 2009/10 2011/12 2013/14 2015/16
Commonwealth Funding Queensland State Government Funding Total QLD Transport Funding
For the first time in 12 years, the Commonwealth / Statefunding relationship now approaches 50:50

472017 MAJOR PROJECTS PIPELINE REPORT – QUEENSLAND ENGINEERING CONSTRUCTION OUTLOOK
or policies, this gap is expected to widen considerably through 2019/20 and 2020/21, with the shortfall in funding across the five years amounting to circa $2 billion.
In estimating this gap, we have filtered the Commonwealth and State funded major projects in this Pipeline and then compared this against the anticipated combined funding capacity of the Commonwealth and State governments via an analysis of the respective budgets, estimates and State Infrastructure Plan. The upshot is that without increased funding capacity, many public sector projects in the Pipeline, such as Cross River Rail or Gold Coast Light Rail Stage 3, are at significant risk of not proceeding as timed in the Pipeline. Furthermore, with Commonwealth contributions for transport projects is at a 12-year historic high, along with competing demand from other states and territories, the responsibility for filling the short fall in public infrastructure spending is likely to rest with the Queensland Government.
It should be noted that the indicative funding gap identified in Figure 6.8 excludes funding for several congestion-easing and transport capacity improvement projects that, subject to business case validation, are likely to become necessary during the Pipeline timeframe. These projects include:
• Brisbane to Gold Coast Motorway• New dams in Regional Queensland and water storage/
supply upgrades• New projects identified in the 2017 State Infrastructure
Plan update (expected in June 2017)• Port of Brisbane dedicated freight rail connection
been around 25% of overall funding, with the state funding around 75%. However, Queensland is now becoming increasingly reliant on the Commonwealth to fund its transport infrastructure program and, in 2016/17, the Commonwealth to State funding relationship now approaches 50:50 according to figures supplied by the Grattan institute.
Queensland’s current position regarding own source funding for transport infrastructure compared to New South Wales is notable. The NSW Government has committed to a $20 billion infrastructure plan, Rebuilding NSW, which was made possible by leasing out 49% of NSW electricity network assets (100% of Transgrid, 50.4% of Ausgrid and 50.4% of Endeavour Energy with Essential Energy remaining not subject to a lease). Consequently, NSW State Government own source spending on transport infrastructure is approximately 80% of total transport spending (compared to 55% for Queensland) and now outstrips Queensland’s own source transport spending by a ratio of 4:1 (see Figure 6.7).
The Public Sector Funding GapOverall, existing policies and funding settings have failed to deliver sustainable, long run growth in Queensland infrastructure investment to meet demand. Worse, current funding levels projected by the Queensland Budget and State Infrastructure Strategy will not even cover the public sector’s Pipeline projections outlined in this report. While current funding is adequate to meet 2016/17 requirements, a funding gap is projected to emerge in subsequent years. In the absence of new funding measures
FIGURE 6.7
Transport Infrastructure – New South Wales versus Queensland Government own source funding, $Billions Source: Grattan Institute
0
2
4
6
8
10
12
2005/06 2007/08 2009/10 2011/12 2013/14 2015/16
NSW QLD
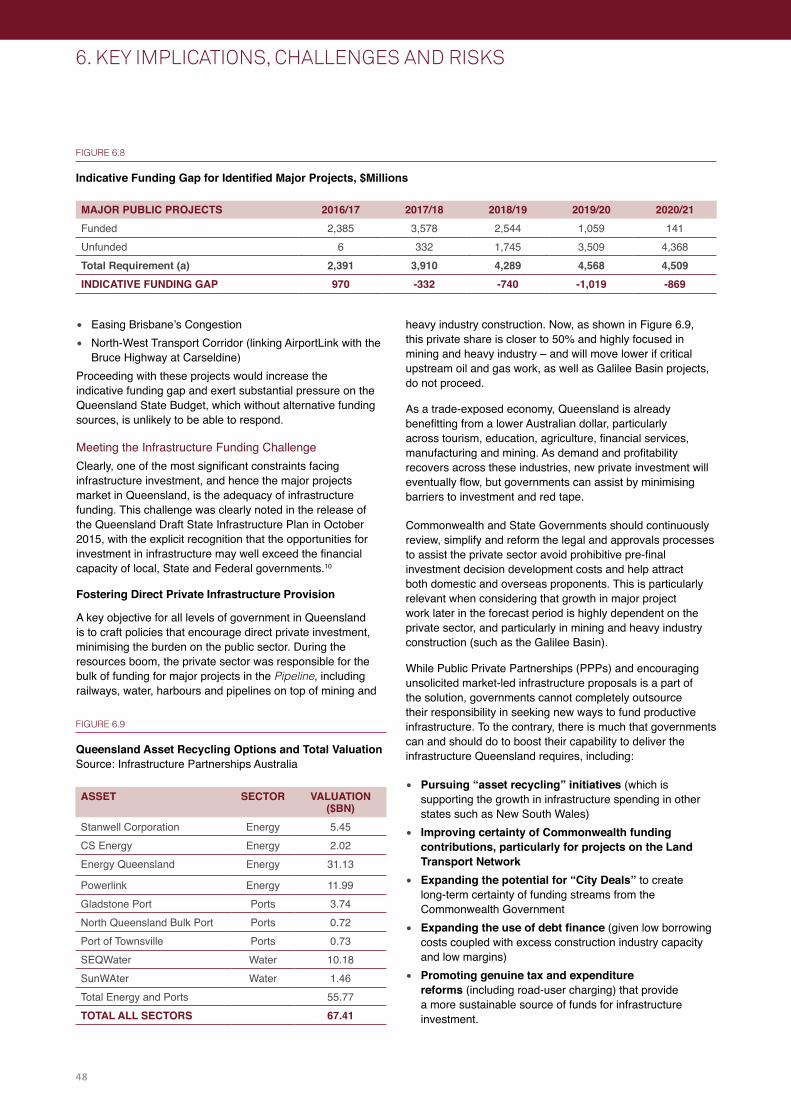
48
FIGURE 6.8
Indicative Funding Gap for Identified Major Projects, $Millions
FIGURE 6.9
Queensland Asset Recycling Options and Total Valuation Source: Infrastructure Partnerships Australia
6. KEY IMPLICATIONS, CHALLENGES AND RISKS
MAJOR PUBLIC PROJECTS 2016/17 2017/18 2018/19 2019/20 2020/21Funded 2,385 3,578 2,544 1,059 141Unfunded 6 332 1,745 3,509 4,368Total Requirement (a) 2,391 3,910 4,289 4,568 4,509INDICATIVE FUNDING GAP 970 -332 -740 -1,019 -869
ASSET SECTOR VALUATION ($BN)
Stanwell Corporation Energy 5.45CS Energy Energy 2.02Energy Queensland Energy 31.13
Powerlink Energy 11.99Gladstone Port Ports 3.74North Queensland Bulk Port Ports 0.72Port of Townsville Ports 0.73SEQWater Water 10.18SunWAter Water 1.46Total Energy and Ports 55.77TOTAL ALL SECTORS 67.41
heavy industry construction. Now, as shown in Figure 6.9, this private share is closer to 50% and highly focused in mining and heavy industry – and will move lower if critical upstream oil and gas work, as well as Galilee Basin projects, do not proceed.
As a trade-exposed economy, Queensland is already benefitting from a lower Australian dollar, particularly across tourism, education, agriculture, financial services, manufacturing and mining. As demand and profitability recovers across these industries, new private investment will eventually flow, but governments can assist by minimising barriers to investment and red tape.
Commonwealth and State Governments should continuously review, simplify and reform the legal and approvals processes to assist the private sector avoid prohibitive pre-final investment decision development costs and help attract both domestic and overseas proponents. This is particularly relevant when considering that growth in major project work later in the forecast period is highly dependent on the private sector, and particularly in mining and heavy industry construction (such as the Galilee Basin).
While Public Private Partnerships (PPPs) and encouraging unsolicited market-led infrastructure proposals is a part of the solution, governments cannot completely outsource their responsibility in seeking new ways to fund productive infrastructure. To the contrary, there is much that governments can and should do to boost their capability to deliver the infrastructure Queensland requires, including:
• Pursuing “asset recycling” initiatives (which is supporting the growth in infrastructure spending in other states such as New South Wales)
• Improving certainty of Commonwealth funding contributions, particularly for projects on the Land Transport Network
• Expanding the potential for “City Deals” to create long-term certainty of funding streams from the Commonwealth Government
• Expanding the use of debt finance (given low borrowing costs coupled with excess construction industry capacity and low margins)
• Promoting genuine tax and expenditure reforms (including road-user charging) that provide a more sustainable source of funds for infrastructure investment.
• Easing Brisbane’s Congestion• North-West Transport Corridor (linking AirportLink with the
Bruce Highway at Carseldine)Proceeding with these projects would increase the indicative funding gap and exert substantial pressure on the Queensland State Budget, which without alternative funding sources, is unlikely to be able to respond.
Meeting the Infrastructure Funding ChallengeClearly, one of the most significant constraints facing infrastructure investment, and hence the major projects market in Queensland, is the adequacy of infrastructure funding. This challenge was clearly noted in the release of the Queensland Draft State Infrastructure Plan in October 2015, with the explicit recognition that the opportunities for investment in infrastructure may well exceed the financial capacity of local, State and Federal governments.10
Fostering Direct Private Infrastructure Provision
A key objective for all levels of government in Queensland is to craft policies that encourage direct private investment, minimising the burden on the public sector. During the resources boom, the private sector was responsible for the bulk of funding for major projects in the Pipeline, including railways, water, harbours and pipelines on top of mining and

492017 MAJOR PROJECTS PIPELINE REPORT – QUEENSLAND ENGINEERING CONSTRUCTION OUTLOOK
Commonwealth contributions for about 25% of the cost of new infrastructure. However, in Queensland the reliance is growing and is now approaching equal contribution for the first time in 12 years.
Typically, around 75% of Commonwealth grants to Queensland relate to projects on the National Land Transport Network (Network). This Network consists of the most important roads and railway lines linking capital cities, major centres of commercial activity and/or intermodal transfer facilities. It is common for a single piece of transport infrastructure to have both Commonwealth and state funding.
Despite this co-dependence, the funding contributions at a discrete project level are somewhat ambiguous and have often led to politicisation of the funding amounts. In turn, this has created uncertainty and delay in arriving at a negotiated position. There is an opportunity to reform the rationale for arriving at contributions to arrive at a position where much greater certainty is provided earlier in the business case development process.
City Deals Commit Commonwealth Funding for City Infrastructure
As highlighted in Infrastructure Australia’s Infrastructure Plan, as well as the Queensland State Infrastructure Plan, a longer-term challenge will be catering for strong population growth in cities, with Sydney, Brisbane, Melbourne and Perth needing to accommodate another 5.9 million persons themselves by 2031. This will require a re-think of how our major cities are designed, how higher densities can be achieved through better infrastructure and planning, where and how other cities, both regional and urban, can be developed, and how people can be more easily connected to jobs, education and community/cultural centres. As noted by Infrastructure Australia:
“Our cities need to be vibrant, liveable and efficient centres of growth and prosperity. The most important resource in these cities is our people. And getting the best from our people means providing them with high quality infrastructure to support their lives.” 11
Consequently, steps should be taken by governments to meet infrastructure challenges in our major cities, but also to foster growth in smaller cities as well as satellite regions. According to Infrastructure Australia, this may mean amalgamating smaller local councils to achieve greater scale in financing development as well as a more direct role for the Commonwealth Government in encouraging city-based reforms and funding of necessary city infrastructure, as well as enunciating a clear population policy.12 The response from the Federal Government was the release of the Smart Cities Plan in April 2016 that included:
• The establishment of an Infrastructure Financing Unit to work closely with the private sector on innovative financing solution
• Committing $50 million to accelerate planning and development works on major infrastructure projects to develop business cases and investment options
Asset Recycling Should Not be Ruled Out
Previous Major Project Reports have highlighted the need for Queensland to urgently consider asset-recycling strategies to boost infrastructure funding capacity. As already illustrated in Figure 6.7, New South Wales is now supercharging transport infrastructure investment through the proceeds of long-term asset leases including major ports and electricity utilities. Victoria is also boosting infrastructure spending through the $10 billion long term lease of the Port of Melbourne, while the Western Australia State Government has also announced plans for a partial sale of Western Power.
While there can be hidden costs in transferring assets to the private sector (in terms of the proper regulation of the newly privatised assets, potential inefficiencies in targeting the maximum transaction revenue and risks in satisfactory private investment in the asset moving forward) there is no doubt that, with market yields and interest rates very low, the private sector retains a healthy appetite for purchasing existing (de-risked) infrastructure assets as part of an asset portfolio.
There are many Queensland Government Owned Corporations (GOCs) that could be suitable candidates for asset recycling. These assets could raise many billions of dollars for infrastructure investment, substantially more than the equity estimates reported in annual reports as private owners would be expected to increase the value of the companies, and would base their bids on their expected earnings. According to an analysis by Infrastructure Partnerships Australia (see Figure 6.9), which is based on recent transactions in other Australian states, the following valuations could be expected for state owned assets in Queensland.
It should be noted that for many of the assets listed above, typically only part of the asset would be sold or leased (such as the electricity assets, as per recent experience in New South Wales), reducing the amount available to government for infrastructure reinvestment after debt repayment. A minority sale of large electricity, port or water assets, where the Queensland Government retains majority ownership, could still potentially yield tens of billions of dollars for infrastructure investment.
Increased finance through asset recycling could be amplified by the reinstatement of appropriate incentives offered by the Federal Government that encourage states for divesting assets.
The Commonwealth should carefully consider the design and timely introduction of a tailored asset recycling reform incentive for Queensland, as well as other states and territories. This would reduce pressure on the Commonwealth to increase contributions to infrastructure investment through debt financing.
Improving Certainty of Commonwealth Funding Contributions for Transport Infrastructure
All three levels of government play a role in funding transport infrastructure. State governments play the primary role in economically important infrastructure, but they rely on
50
6. KEY IMPLICATIONS, CHALLENGES AND RISKS
past year as part of the Commonwealth Government’s Smart Cities Plan, Queensland’s State Infrastructure Plan and for funding specific transport developments ranging from New South Wales’ $1.5 billion Parramatta Light Rail to potentially a privately sponsored $200 billion high speed east coast rail link.18
While value capture may be a sensible and equitable way to fund infrastructure projects in some cases, there are challenges that may limit the broader effectiveness of the approach in the near term. Most importantly, for value capture to work effectively, it requires that a method for calculating the uplift in property values is properly announced well before implementation of the policy or the announcement of infrastructure projects that may be funded by it to prevent speculation. Secondly, the timing of the policy would need to ensure that the funding mechanism is not applied retrospectively. Thirdly, there needs to be a robust agreement on how the charge is to be collected – typically either as an ongoing property tax or paid when properties are sold. Above all, the policy requires a strong relationship between property prices and infrastructure put in place. However, a recent report from Infrastructure Australia suggested that the relationship between the proximity of property to new infrastructure and their values is not at all clear cut, making the estimation of revenues highly risky, as well as potentially unfair and economically inefficient.19
Ideally, the development of an “optimal” value capture system at the state level could be combined with a reassessment of inefficient state-based property taxes such as stamp duties. A more efficient and sustainable revenue system for state governments would see these inefficient taxes replaced by a broader-based land tax system which embeds the impact of infrastructure development on land values – and diverts the “uplift” itself to a designated infrastructure fund. Another advantage of this approach would be that state government revenue growth would tend to be more stable overall (and perhaps less pro-cyclical), reducing the political temptation to boost public spending excessively during economic booms (when there is already strong competition for scarce resources). However, such substantive changes to state government funding are unlikely to take place, at least in the near term, and may differ significantly from state to state. In the interim, value capture approaches may be limited to governments either providing low cost access to residential and commercial space for developers, which can then be on-sold to help finance private infrastructure provision, or simply levying a charge on new developments near the infrastructure location.
Encouraging Private Funding
Despite the recent downturn in private investment, there is still a very important role for direct private involvement in infrastructure funding, Systems facilitating unsolicited “market led proposals” (MLPs) from the private sector are already in place in New South Wales, Victoria and now Queensland, and has seen significant investments proposed and now rolling out, including Sydney’s $3 billion NorthConnex project, as well as the $5.5 billion Western Distributor project in Melbourne
• Inviting State and Territory Governments to partner with the Commonwealth on City Deals.13
City Deals are an innovative strategy for accelerating urban and regional growth through smarter coordination of infrastructure planning, funding, investment and governance between city partners and the central government.14 Originating in the United Kingdom (where now more than 20 City Deals have been signed), City Deals are long term contracts between an economic region and central governments that explicitly target a package of infrastructure projects to boost growth and productivity through (i) a committed baseline funding agreement as well as (ii) agreed “earn back” funds on achieving explicit targeted benchmarks for growth (analogous in Australia to competition payments under the National Competition Policy). Furthermore, stronger growth in local GDP (and associated tax revenues) because of the Deal can then be targeted for future productive investment, while Deal partners can also generate “own source” (“self-help”) funding through capturing additional revenues through mechanisms such as tolls, levies, developer contributions and local taxes. The level of revenues achieved from performance of the City Deal and from self-help funding can then determine how far down the priority list infrastructure projects in the Deal region can be funded.15
Crucially, City Deals offer a structured pathway for central governments to be more directly involved with the funding of city infrastructure. In Australia, the Commonwealth Government has had varied engagement with cities policies, such as the establishment of the Department of Urban and Regional Development in the 1970s and Building Better Cities program in the 1990s, so this concept is not entirely new.16 However, what the City Deals approach champions is an explicit structure and set of guidelines which promote and reward funding specific productive infrastructure projects in cities as part of a broader (and measured) growth and productivity strategy. Already, in December 2016 the Commonwealth Government, the Queensland Government and Townsville City Council have inked Australia’s first ever City Deal, representing a 15-year commitment to infrastructure development in the region.17 This could be the first of many such deals across Australia (Launceston and Western Sydney are expected to follow in 2017). It will be important that productive infrastructure projects are chosen and benefits from infrastructure investment, in terms of economic growth (Gross Regional Product), productivity improvements and jobs, are properly monitored over time so that the success of the City Deal can be measured.
Value Capture May Only Have Limited Potential
Another funding strategy which has garnered the interest of the Queensland Government is that of value capture. This approach involves governments taxing the windfall uplift in property values or other benefits driven by the development of new infrastructure as a means of infrastructure finance. While not new – having been used for decades to fund transport infrastructure in Hong Kong and Japan, as well as the United States (under the term Tax Increment Financing or TIF) – the mechanism has gained significant interest in the

512017 MAJOR PROJECTS PIPELINE REPORT – QUEENSLAND ENGINEERING CONSTRUCTION OUTLOOK
since the GFC was issued in late 2016 as part of refinancing for the Victorian Comprehensive Cancer Centre (VCCC).23 However, the market for project bonds in Australia remains very shallow and, arguably, more could be done by State and Commonwealth Governments to develop the bond market to support infrastructure finance, particularly given the size of Australia’s superannuation industry. This includes establishing incentives to retirees to invest part of their superannuation payouts in the form of longer term annuities (i.e. boosting demand for low risk, long duration assets such as infrastructure), and continuing to offer 20-year government bonds to support the longer tenure corporate bond market.
Debt Financing
Utilising longer term debt financing also makes sense in its own right. Since a landmark report from the usually conservative International Monetary Fund in 2014 highlighting the strong economic benefits from a debt-financed public infrastructure push in Australia,24 governments have been strongly advised to consider this funding approach in meeting their economic goals, including substantive arguments in the 2015 and 2016 editions of this Pipeline.
Interestingly, the message is starting to cut through, politically, in the recognition that Australian public sector debt levels, while higher than they were pre-GFC, remain well below that of their international peers (and certainly well below the debt levels of the private sector and households which is the greatest concern for the Reserve Bank) and that there is considerable “fiscal headroom” to borrow more.
Before handing down the mid-year Budget Update in December 2016, the Federal Treasurer, Scott Morrison noted that:
“Australia’s current account deficit is because there are more investment opportunities than can be covered by domestic capital…Foreign capital is a ‘must have, not a nice to have’ because it underpins economic growth and employment. Once borrowing for recurrent expenditure is under control, we will have more headroom to take on and deploy so-called good debt. This is debt used for investment purposes that increases productivity and produced future income.” 25
While these comments should be viewed in the context that the Treasurer was assuaging ratings agencies of yet another increase in Commonwealth Government debt levels, it is a significant statement nonetheless from the conservative side of politics, and certainly a far cry from the “debt and deficit disaster” mantra under the former Abbott Government. Even so, the Commonwealth Government appears unlikely to dramatically increase debt financing for productive infrastructure projects without first achieving tax and expenditure reforms that push the Budget back towards a structural surplus. For the Queensland State Government, with much higher debt/gross state product (GSP) ratios than the Commonwealth Government, increasing debt to fund infrastructure may still be seen as a politically risky strategy despite its economic sense; that is, so long as the debt is put towards the creation of productive infrastructure assets
(both put forward by Transurban). The “unsolicited proposal” approach allows governments the opportunity to contribute to these projects, leveraging a large amount of private investment for a relatively small public contribution.
The Queensland government is currently considering approximately 37 MLPs – including the development a $100 million cruise terminal within the Port of Brisbane as well as other proposals – following the inclusion of market-led proposals as a key strategic plank of its State Infrastructure Plan. One Queensland project, the Logan Motorway Upgrade, proposed by Transurban has now moved to contractual close.
Private finance can also be promoted through offering concessional commercial lending terms, such as that proposed by the Northern Australia Infrastructure Facility (NAIF). This facility, established by the Commonwealth Government in mid-2016, and based in Cairns, is tasked with providing up to $5 billion in concessional finance for complying projects over five years. For projects to meet NAIF criteria in Queensland, they must be in Northern Australia (generally above the Tropic of Capricorn, but also Gladstone), must create or enhance economic infrastructure, and must have a public benefit amongst other conditions. Potentially, this could include partially financing a $2 billion multi-user rail link for Galilee Basin coal projects, which the NAIF has been asked consider.20 Even so there remain serious concerns as to whether the rail link satisfies the “public interest” criterion enshrined in the NAIF legislation (i.e. that it will have multiple users or produces net public benefits in a broader sense that are unable to be captured by the project proponents). In the absence of Galilee Rail, there remains a significant number of other projects that could qualify for concessional loans once the assessment period is completed, ranging from airports, ports, rail, energy, water and communications infrastructure, although, as with the MLP process, may take another several years before translating to construction activity.
Project bonds, meanwhile, also offer a longer term financing route for private (and public) sector projects as well as PPPs, although in Australia the bond market for infrastructure has more or less dried up since the GFC.21 The advantage of project bonds is that it allows project proponents to tap into longer term capital arrangements from large institutional investors (such as superannuation funds) as well as sovereign wealth funds (SWFs) rather than relying on short term bank loans, which are subject to the upside refinancing risk (particularly when interest rates are rising). In turn, infrastructure assets are attractive to these entities because of the stability of returns over a long timeframe. On the downside, because of the risks often associated with major greenfield construction projects, project bonds typically have a higher cost in the short to medium term than bank debt. In PPP projects in Australia – where bidders are incentivised to offer the lowest cost, this inevitably means giving preference to short term bank debt over project bonds and then swallowing the risk on refinancing.22 Globally, project bond deals for infrastructure have risen from a low of US $1 billion in 2009 towards US$20 billion in 2013 and 2014 as stricter lending requirements have constrained bank debt finance. In Australia, the first bond issue for a PPP project
52
6. KEY IMPLICATIONS, CHALLENGES AND RISKS
Finally, solving government’s debt and deficit challenges at the Queensland and national level will involve not just making changes to both taxes and expenditures (it is not just a revenue problem or an expenditure problem alone), but recognising that investment in productive assets with a long life is very different from recurrent expenditures. This, in turn, entails that governments bring their Budgets in line with modern accounting standards such as separating “capital” and “operation” items so that the debt accumulated to build productive infrastructure can be differentiated from debt accumulated purely to fund the gap in a poorly designed tax/transfer system.
Conclusions and RecommendationsStronger outcomes for growth in demand and employment in Queensland will rely on boosting investment.
Infrastructure investment is not keeping pace with the demands through ongoing population and economic growth; that over the next few years the majority of gross public investment will be directed at replacing existing assets rather than expanding new productive capacity; that the mild and unsustained pickup in net public investment will hobble growth in employment and the economy in the short term and leave Queenslanders exposed to increasing congestion, bottlenecks and other infrastructure gaps in the longer term.
At the core of this issue is funding. The current systems in place for funding the infrastructure that improves the quality of life for Queenslanders, and will provide the capacity for the Queensland economy to grow sustainably in the long term, are simply inadequate. As discussed in this report, current funding arrangements will not even cover the Pipeline, let alone other projects that will be required to meet broader public needs.
State government revenues are highly cyclical, with property taxes, stamp duties and GST revenues, particularly, rising strongly in good economic times and falling in the bad. In the desire for balanced budgets (and perhaps, more cynically, a desire not to leave a legacy for future governments) public spending – including infrastructure spending, tends to move the same way. The result is that governments spend much more on infrastructure in the good economic times, perversely at a time when industry capacity to deliver infrastructure is more stretched and costs are higher, and then pull back on infrastructure spending when the broader economy could do with the spending boost and costs and capacity are much more favourable. Queensland blew the Budget during the 2000s boom, in a massive catch-up on public infrastructure spending that was, itself, caused by inadequate infrastructure provision over previous decades. Now these mistakes are set to be repeated in the future, with low per capita public infrastructure investment likely to widen infrastructure gaps.
The system needs to change, and it is not just a problem peculiar to Queensland. The challenge of generating efficient and sustainable revenues for the provision of public services and infrastructure is an old economic problem, and within the past decade there have been several high profile public reviews to improve the system, complete with detailed
through a transparent cost-benefit analysis process, and not put towards “white elephants”.
Genuine Tax and Expenditure Reforms
Tax and expenditure reforms remains a crucial element in providing sustainable funding streams for future public infrastructure investment. While reforms, if done well, will help push state and Commonwealth Budgets further towards structural balance (i.e. balance recurrent revenues and expenses across the economic cycle), they can also, through the removal of inefficient taxes, improve productivity outcomes in the economy and provide a more sustainable and stable source of income. And, as noted previously, governments that have recurrent expenditures and revenues under control, are more likely to be comfortable using ‘good debt’ to fund productive infrastructure. Key amongst these reforms include:
• Those outlined by the Report on Australia’s Future Tax System (2009), also known as the “Henry Review”. This included 138 recommendations to improve the sustainability of the tax/transfer system including broadening the tax base across its four most efficient pillars – personal income, business income, personal consumption and economic rents from natural resources and land – while removing inefficient taxes such as stamp duties, payroll taxes, royalties (to be replaced by a resources rent tax) and fuel and motor vehicle registrations taxes (to be replaced by efficient road user charges), amongst other changes.
• The implementation of pricing arrangements for the efficient use of infrastructure, across the utilities and transport, and which promote competitive markets as outlined by the Competition Policy Review (2015) also known as the “Harper Review”. Again, this report recommends the introduction of user charges in the roads sector, with revenues raised channelled directly into road investment. This view was supported by Infrastructure Australia in its 2016 Infrastructure Plan.
The challenge here is mainly a political one. Despite recognising the scale of the budgetary problem (which will get worse over time as population ages and payments for health and welfare increase according to the Intergeneration Report)26 no government in Australia has the courage to make the necessary, comprehensive changes being outlined. Ultimately, if infrastructure investment is to be sustained at a rate that meets future demand, and if governments are to help in funding this infrastructure, then sustainable government revenue streams need to be found, not just expenditure cuts. This will demand politically courageous decisions regarding the appropriate pricing for the use of public infrastructure such as roads (which are currently treated as a free public good), replacing inefficient and highly cyclical stamp duties with a broader land tax (as in the ACT), and, in states such as Queensland and Western Australia with vast natural resources, reconsidering how the extraction of these resources is to be properly compensated. The recent gyrations in commodity prices, and its impact on State Government revenues, is testament to this.

532017 MAJOR PROJECTS PIPELINE REPORT – QUEENSLAND ENGINEERING CONSTRUCTION OUTLOOK
city infrastructure by all tiers of government. The Townsville City Deal represents an important start, but the priority list of infrastructure projects selected need to be demonstrated to be a productive and efficient use of taxpayer’s funds. Townsville Stadium, as currently proposed, may not necessarily meet this criterion.
• Improve the pace of assessment – and approval where deemed satisfactory, of private sector led proposals. Currently, more than 30 MLPs remain in assessment stages and only one project, the Logan Motorway Upgrade, has been officially approved. Boosting private investment in infrastructure, whether through MLPs, concessional finance (NAIF) or via project bonds will remain an important part of the solution to the infrastructure challenge. For the Queensland and Federal Governments, it makes sense to target future investment “waves” (e.g. tourism and other services) in incentivising private investment or developing its own complementary infrastructure investment program. This may mean not just investment in different types of infrastructure than the recent past (such as regional airports and ports, water storages, public transport and freight) but also very different regional investment profiles where the investment will take place (focusing on tourism regions, urban centres, agricultural areas and key transport hubs).
• Establish the rules for value capture funding approaches as soon as possible, so that these are used for future infrastructure projects. Ultimately, however, a more efficient solution may be to replace a range of property-related taxes (including stamp duty) with a broader-based land tax that would more fairly and efficiently capture increases in values which could be then used for infrastructure provision.
Even with funding solutions in place, meeting Queensland’s infrastructure challenge still means adhering to key rules to ensure the best projects are selected and procured efficiently, generating the biggest ‘bang for the infrastructure buck’. This means, as always:
• Basing short and long term public investment programs on maximising economic benefits through transparent cost benefit analysis (CBA). This, in turn, requires that Building Queensland continues to publish the CBA’s supporting the public investment decision so it can be rigorously and independently tested.
• Maximise efficiencies in public infrastructure provision and reducing costs by following through with reforms to the public infrastructure procurement process, as outlined by the Productivity Commission’s review in 2014. This includes governments using contracting models which fairly allocate risks to those best able to manage them, investing more in initial designs, contributing to bid costs where innovation is genuinely in prospect, leaving more of the detailed planning and design to the preferred tenderer (rather than all bidders at the tender stage), sizing projects to foster broader competition and a sustainable contracting industry, harmonising contracting rules across regions and levels of government and removing unnecessary, duplicating or otherwise inefficient approvals processes or regulations.
recommendations, many of which have been ignored by successive governments. It is just too hard politically. However, if the recommendations were explained properly and honestly to the electorate – that by broadening the tax base instead of raising existing inefficient taxes many households would be better off whilst providing a more sustainable steady stream of revenues to governments. That by replacing high fixed fees and charges with a low usage charge for infrastructure, households could choose how much they wished to spend while sending important ‘demand’ signals to the market that could more accurately determine the need for new infrastructure spending and its appropriate value. That boosting competition in the monopolistic infrastructure markets would result in greater infrastructure investment and choice, perhaps many of these political challenges could be overcome. While there will be legitimate instances where equity concerns may need to be addressed (as in any change of the tax/transfer system), these concerns would not be insurmountable.
In the absence of genuine tax and expenditure reform, there is still a lot more that could be done by governments to improve funding for productive infrastructure provision. Currently, the Queensland economy is heavily reliant on Commonwealth funding as a share of total public infrastructure funding, which is itself unsustainable if Queensland is to meet long term infrastructure targets. Instead, the Queensland Government should look to:
• Reconsider long term asset leasing as a way of raising infrastructure funds, as in the new high growth states of New South Wales and Victoria. Unlike most other Australian States and Territories, Queensland still retains 100% ownership of its electricity assets, whose value could exceed $50 billion. While the State would need to consider the cost of asset leases (e.g. lost income, cost of regulation to ensure competitive outcomes), even a partial lease could provide a large pool of funds which could be recycled into productive infrastructure. In turn, the Commonwealth Government should look to revive its Asset Recycling Initiative to encourage this approach and compensate State Governments for the loss of future income from leased assets.
• Do not rule out debt finance. Even with relatively high levels of debt, in the right circumstances (i.e. excess construction industry capacity, low inflation and selecting the most highly productive infrastructure projects) debt satisfies both intergenerational equity and efficiency criteria as a finance option and can have a powerful impact on economic growth. This may mean making tough choices on recurrent spending and taxation so that ‘good debt’ for productive infrastructure purposes is not conflated with a build-up of ‘bad debt’ servicing the gap between recurrent revenues and payments across the economic cycle. At the Commonwealth level (where there is arguably more fiscal headroom) a national agency could be established to support an expanded infrastructure program, with a line of debt used by the States guaranteed to a defined maximum figure by the Commonwealth.
• Expand the number of City Deals that provide a structured, coordinated plan for the long-term funding of
54
6. KEY IMPLICATIONS, CHALLENGES AND RISKS
substantial and unforeseen strong increase in prices for coal (as well as iron ore). Not only did this result in greater than anticipated royalties for the Queensland government in 2016/17, but has also put coal mining projects back into consideration.
In general, the view taken in this report is like that espoused in the Queensland 2016-17 State Budget: that the upward spike in coal prices experienced through 2016 will ultimately prove unsustainable, with falls in coal prices expected through 2017. This scenario, in turn, sees only a gradual pickup in coal investment and construction in Queensland. However, the path for global coal prices (both thermal and coking) depends heavily on the interplay between China’s coal industry policies (which will determine the extent to which China needs to import coal), environmental policies (share of coal in overall energy production) and steel production (driving demand for coking coal). Under a “higher demand” scenario based on stronger global growth, coupled with favourable industry policies, the outlook for commodity prices – and hence resources investment – could be stronger than predicted in this Report. Conversely, a “lower demand” scenario could see resources investment come through lower. Overall, the outlook in this report represents a reasonable balance between these scenarios.
Our outlook for global economic growth is detailed in Chapter 2 of this report, which is our baseline forecast. However, there are upside and downside risks to this outlook. Both upside and downside scenarios are heavily influenced by the risks and uncertainties introduced by the US Presidential election victory of Donald Trump in late 2016. Upside risks include a more stimulatory than expected stance of US fiscal policy and, particularly, infrastructure investment, which in turn could feed into demand for commodities and commodity prices. Downside risks include the increased possibility of greater trade controls between the United States and China as well as faster than anticipated increases in Federal Reserve interest rate increases through 2017 and subsequent years. However, there is substantial uncertainty surrounding the ultimate direction of US economic policy under a Trump administration – consequently the baseline forecasts used in this Report are considered reasonable.
On the domestic front, the key domestic risk factors which may influence the projections in this Report are (i) projected housing investment activity in Queensland as well as (ii) government approaches to debt consolidation and public investment via fiscal policy.
With regards to housing investment, as outlined in Chapter 4 of this report, it is expected that the current recovery in housing activity will peak in 2016/17 before falling in subsequent years given likely increases in interest rates and the emergence of a more balanced (and possible oversupplied, in some regions) housing market. This, in turn, is expected to drive a weakening in stamp duty revenues from 2017/18 that may threaten public funding for major infrastructure projects. This outlook is slightly pessimistic compared to the housing investment forecasts presented in both the Commonwealth and State Budgets. However,
• Finally, governments and industry should continue to work together in tackling longer term risks to the construction industry, particularly regarding industry skills and productivity. This Pipeline indicates that demands on the major projects industry are likely to rise in Queensland in coming years, particularly if joined by a strong recovery in resources investment (for example, Galilee Basin projects). This, in turn, is likely to be compounded by rising interstate demands for skilled workers as New South Wales and Victoria, particularly, roll out large infrastructure construction programs funded primarily by asset recycling initiatives. These states have taken advantage of the downturn in Queensland (and Western Australian) construction activity to rebuild skills and industry capability. The challenge for Queensland may be to win back these resources, or develop new ones, to meet demand. This entails a longer-term approach to planning for the future workforce in a way that links workforce planning and skills development to both current and future activity. Queensland need to remain vigilant about workforce development, skills acquisition, attracting new entrants and retaining skilled workers. The process of workforce planning needs to be linked to infrastructure planning so that Queensland has the right skills available at the right time to deliver major projects.
• Stronger growth in productivity would help in this regard. High productivity enables major projects to be completed more quickly and efficiently and, in future, should provide the fundamental basis for increasing returns to capital and labour. Measures which could boost labour productivity include policies that encourage greater capital investment in the construction industry as well as encouraging innovation and entrepreneurship. It also requires a more strategic approach to workforce planning and skilling to ensure that the supply of skills into the future match the likely demand by industry. Here, research undertaken by Construction Skills Queensland (CSQ) for this report, as well as perspectives of Queensland construction jobs for the future27 will be vital.
Risks to the OutlookA key conclusion of this report is that major project activity is currently in a trough and will expand mildly in subsequent years. However, it should be noted that this outlook is subject to significant upside and downside risks; that despite the mildly cyclical profile of work projected, there is still the potential for further, more volatile, cycles ahead given Queensland’s natural strengths and advantages: increasing connections with the fast-growing economies of Asia, strong population growth, and high quality natural resources.
As in previous Major Project Reports, the biggest global risk still relates to the economic outlook for key trading partners, the strategic decisions they make in achieving sustainable growth and how this will impact on the global trade of resources for which Queensland has a strong supply position, particularly coking coal, thermal coal, and gas. Much of this remains outside of the control of the Queensland government and industry. Over 2016, while there was a (more or less expected) recovery in oil and gas prices, there was also a

552017 MAJOR PROJECTS PIPELINE REPORT – QUEENSLAND ENGINEERING CONSTRUCTION OUTLOOK
stronger than anticipated population growth (for example, in a “high growth” global scenario which drives high investment and population inflows into Queensland) could see higher housing investment and stamp duty revenue than in the baseline case presented here. This, in turn, could drive higher major project activity than modelled here.
The forecasts presented in this report also assume that governments – both State and Commonwealth – seek a balanced path between debt consolidation/deficit reduction on the one hand and sustaining public investment on the other. Over the next few years, it is assumed that public investment will rise in line with the Queensland and Commonwealth
2016/17 Budgets. Meanwhile, minor adjustments to recurrent tax and transfer policies, as well as stronger nominal economic growth, are expected to contribute to a gradual improvement in the underlying budget and net public debt position. However, there remains risk on both the upside and downside to this position. On the downside, failure to achieve improvements in the financial positions of governments, both state and Commonwealth, could see more significant cuts to public expenditure in future Budgets, including that slated for capital works. On the upside, a “high growth” global scenario could see better than expected budgetary outcomes, providing scope for stronger increases in public investment.
56
6. KEY IMPLICATIONS, CHALLENGES AND RISKS
1 Investment in economics represents the addition to capital stock or productive capacity. It mostly consists of the construction of buildings and structures and purchases of plant and equipment, but also includes growth in livestock, minerals exploration and intellectual property. This is a very different meaning from finance, where investment refers to the purchase or creation of an asset with the expectation of generating financial returns.
2 Terill, M. and B. Coates 2016, “Budget explainer: does Australia really have an infrastructure deficit?”, Gratten Institute, April 28th 2016, https://grattan.edu.au/news/4058/
3 Infrastructure Partnerships Australia 2012 “The Role of Superannuation in Building Australia’s Future”
4 Infrastructure Australia 2013 “National Infrastructure Plan”, Commonwealth Government, Canberra.
5 McKinsey Global Institute (2016) Bridging Global Infrastructure Gaps, p12.
6 Ibid, pp10-11.7 Engineers Australia (2010) “Queensland infrastructure report card
confirms major improvements required”, media release, 16th November 2010, viewed 19th November 2015: https://www.engineersaustralia.org.au/sites/default/files/shado/Infrastructure%20Report%20Cards/Queensland/2010%20QLD%20IRC%20Media%20Release%2016%20Nov.pdf
8 Queensland Infrastructure Alliance (2015) Building Our Future: 2015 Update – Snapshot: A Review of Infrastructure Investment in Queensland, viewed 19th November 2015: http://www.ccfqld.com/wp-content/uploads/2015/11/CCF0538-Building-Our-Future-low-res1.pdf
9 Bureau of Infrastructure, Transport and Regional Economics (2015), “Traffic and Congestion Cost Trends for Australian Capital Cities”, Information Sheet 74, November.
10 Department of Infrastructure, Local Government and Planning (2015) Draft State Infrastructure Plan, Part A: Strategy, October, p8.
11 Infrastructure Australia (2016) Australian Infrastructure Plan: Priorities and Reforms for our Nation’s Future, p6.
12 Ibid, p32-34.13 Department of Prime Minister and Cabinet (2016) Smart Cities Plan,
Commonwealth of Australia, p5.14 KPMG (2016) Introducing City Deals: A Smart Approach to
Supercharging Economic Growth and Productivity, p2.
15 Ibid, pp3-1816 Infrastructure Australia (2016) op. cit, pp32-3317 Department of Prime Minister and Cabinet (2016) Smart Cities Plan:
Townsville City Deal, Commonwealth of Australia: https://www.pm.gov.au/sites/default/files/media/townsville-city-deal.pdf
18 Martin, S. 2016 “Land deals sealed for $200bn high-speed east-coast rail link”, The Australian, Thursday 14th July 2016, p1.
19 Infrastructure Australia (2016) Capturing Value: Advice on Making Value Capture Work in Australia, p6.
20 Burke, G. and D. Clark (2016) “Adani's $2 billion Carmichael rail line in Queensland closer to federal loan”, ABC News, 3rd December 2016. http://www.abc.net.au/news/2016-12-03/adani-carmichael-rail-line-closer-to-federal-loan/8089790
21 Infrastructure Australia (2014) Review of Infrastructure Debt Capital Market Financing, p6. http://infrastructureaustralia.gov.au/policy-publications/publications/files/Review_of_Infrastructure_Debt_Capital_Market_Financing_2014_03_28.pdf
22 Ibid, p9.23 Plenary Group (2016) “PPP bond a first for an Australian project since
GFC” October 20th, http://plenarygroup.com/news-and-media/news-articles-and-press-releases/2016/ppp-bond-is-a-first-for-an-australian-project-since-gfc.html
24 International Monetary Fund (2014), World Economic Outlook, October 2014. According to IMF analysis, where there is economic slack and efficient public investment processes, an increase of public infrastructure investment amounting to 1% of GDP which is financed by debt increases GDP by 0.9% in the same year and by 2.9% after four years. By contrast, a similar infrastructure push which is funded in a revenue neutral manner (i.e. through cutting government expenditure or raising taxes elsewhere) has output effects which are not statistically different from zero.
25 Belot, H. 2016, “Scott Morrison draws good and bad debt distinction ahead of budget update”, ABC News, http://www.abc.net.au/news/2016-12-14/morrison-seeks-to-define-good,-bad-public-debt/8119976
26 Treasury (2015) 2015 Intergenerational Report: Australia in 2055, Commonwealth of Australia
27 Quezada G, Bratanova A, Boughen N and Hajkowics S (2016) Farsight for construction: Exploratory scenarios for Queensland’s construction industry to 2036, CSIRO, Australia.

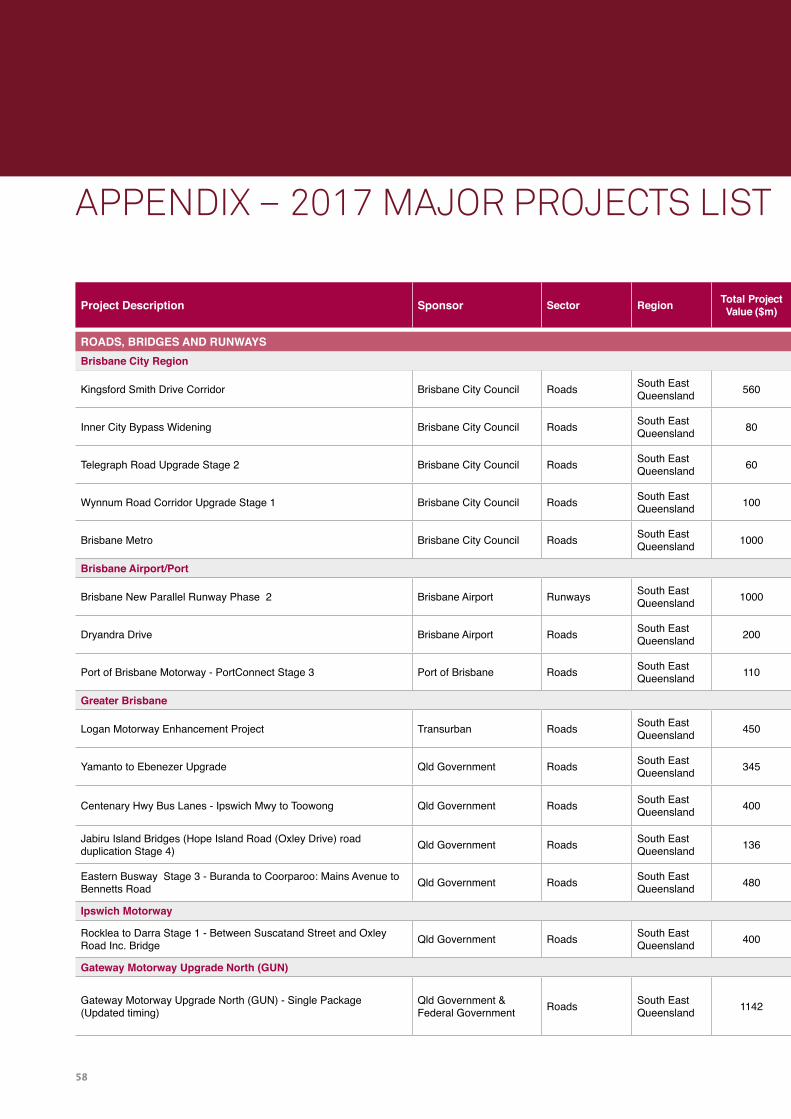
5858
APPENDIX – 2017 MAJOR PROJECTS LIST
Project Description Sponsor Sector Region Total Project Value ($m)
Engineering Value ($m)
Project Status
Commencement Date
Completion Date
2016/17 ($m)
2017/18 ($m)
2018/19 ($m)
2019/20 ($m)
2020/21 ($m)
ROADS, BRIDGES AND RUNWAYSBrisbane City Region
Kingsford Smith Drive Corridor Brisbane City Council Roads South East Queensland 560 448 Under
Construction 2015/16 2018/19 128 144 144
Inner City Bypass Widening Brisbane City Council Roads South East Queensland 80 60 Under
Procurement 2016/17 2017/18 15 45
Telegraph Road Upgrade Stage 2 Brisbane City Council Roads South East Queensland 60 40 Under
Procurement 2016/17 2017/18 10 30
Wynnum Road Corridor Upgrade Stage 1 Brisbane City Council Roads South East Queensland 100 70 Announced 2018/19 2020/21 16 30 24
Brisbane Metro Brisbane City Council Roads South East Queensland 1000 700 Credibly
Proposed 2018/19 2021/22 50 175 250
Brisbane Airport/Port
Brisbane New Parallel Runway Phase 2 Brisbane Airport Runways South East Queensland 1000 500 Under
Procurement 2017/18 2019/20 160 200 140
Dryandra Drive Brisbane Airport Roads South East Queensland 200 150 Under
Procurement 2016/17 2017/18 75 75
Port of Brisbane Motorway - PortConnect Stage 3 Port of Brisbane Roads South East Queensland 110 88 Under
Construction 2016/17 2017/18 38 50
Greater Brisbane
Logan Motorway Enhancement Project Transurban Roads South East Queensland 450 400 Under
Procurement 2016/17 2018/19 100 150 150
Yamanto to Ebenezer Upgrade Qld Government Roads South East Queensland 345 259 Announced 2017/18 2020/21 38 98 98 26
Centenary Hwy Bus Lanes - Ipswich Mwy to Toowong Qld Government Roads South East Queensland 400 240 Prospective 2020/21 2023/24 20
Jabiru Island Bridges (Hope Island Road (Oxley Drive) road duplication Stage 4) Qld Government Roads South East
Queensland 136 102 Prospective 2020/21 2023/24 10
Eastern Busway Stage 3 - Buranda to Coorparoo: Mains Avenue to Bennetts Road Qld Government Roads South East
Queensland 480 182 Prospective 2020/21 2023/24 20
Ipswich Motorway
Rocklea to Darra Stage 1 - Between Suscatand Street and Oxley Road Inc. Bridge Qld Government Roads South East
Queensland 400 200 Under Procurement 2017/18 2019/20 25 75 75 25
Gateway Motorway Upgrade North (GUN)
Gateway Motorway Upgrade North (GUN) - Single Package (Updated timing)
Qld Government & Federal Government Roads South East
Queensland 1142 755 Under Construction 2015/16 2018/19 200 200 185 40

592017 MAJOR PROJECTS PIPELINE REPORT – QUEENSLAND ENGINEERING CONSTRUCTION OUTLOOK
APPENDIX – 2017 MAJOR PROJECTS LIST
Project Description Sponsor Sector Region Total Project Value ($m)
Engineering Value ($m)
Project Status
Commencement Date
Completion Date
2016/17 ($m)
2017/18 ($m)
2018/19 ($m)
2019/20 ($m)
2020/21 ($m)
ROADS, BRIDGES AND RUNWAYSBrisbane City Region
Kingsford Smith Drive Corridor Brisbane City Council Roads South East Queensland 560 448 Under
Construction 2015/16 2018/19 128 144 144
Inner City Bypass Widening Brisbane City Council Roads South East Queensland 80 60 Under
Procurement 2016/17 2017/18 15 45
Telegraph Road Upgrade Stage 2 Brisbane City Council Roads South East Queensland 60 40 Under
Procurement 2016/17 2017/18 10 30
Wynnum Road Corridor Upgrade Stage 1 Brisbane City Council Roads South East Queensland 100 70 Announced 2018/19 2020/21 16 30 24
Brisbane Metro Brisbane City Council Roads South East Queensland 1000 700 Credibly
Proposed 2018/19 2021/22 50 175 250
Brisbane Airport/Port
Brisbane New Parallel Runway Phase 2 Brisbane Airport Runways South East Queensland 1000 500 Under
Procurement 2017/18 2019/20 160 200 140
Dryandra Drive Brisbane Airport Roads South East Queensland 200 150 Under
Procurement 2016/17 2017/18 75 75
Port of Brisbane Motorway - PortConnect Stage 3 Port of Brisbane Roads South East Queensland 110 88 Under
Construction 2016/17 2017/18 38 50
Greater Brisbane
Logan Motorway Enhancement Project Transurban Roads South East Queensland 450 400 Under
Procurement 2016/17 2018/19 100 150 150
Yamanto to Ebenezer Upgrade Qld Government Roads South East Queensland 345 259 Announced 2017/18 2020/21 38 98 98 26
Centenary Hwy Bus Lanes - Ipswich Mwy to Toowong Qld Government Roads South East Queensland 400 240 Prospective 2020/21 2023/24 20
Jabiru Island Bridges (Hope Island Road (Oxley Drive) road duplication Stage 4) Qld Government Roads South East
Queensland 136 102 Prospective 2020/21 2023/24 10
Eastern Busway Stage 3 - Buranda to Coorparoo: Mains Avenue to Bennetts Road Qld Government Roads South East
Queensland 480 182 Prospective 2020/21 2023/24 20
Ipswich Motorway
Rocklea to Darra Stage 1 - Between Suscatand Street and Oxley Road Inc. Bridge Qld Government Roads South East
Queensland 400 200 Under Procurement 2017/18 2019/20 25 75 75 25
Gateway Motorway Upgrade North (GUN)
Gateway Motorway Upgrade North (GUN) - Single Package (Updated timing)
Qld Government & Federal Government Roads South East
Queensland 1142 755 Under Construction 2015/16 2018/19 200 200 185 40

60
APPENDIX – 2017 MAJOR PROJECTS LIST
Project Description Sponsor Sector Region Total Project Value ($m)
Engineering Value ($m)
Project Status
Commencement Date
Completion Date
2016/17 ($m)
2017/18 ($m)
2018/19 ($m)
2019/20 ($m)
2020/21 ($m)
Pacific Motorway
Section (C) Daisy Hill to Logan Motorway at Loganholme Qld Government & Federal Government Roads South East
Queensland 280 200 Credibly Proposed 2019/20 2021/22 60 90
Gateway Motorway/Pacific Motorway Merge Upgrade Qld Government & Federal Government Roads South East
Queensland 210 170 Credibly Proposed 2017/18 2019/20 20 100 50
Mudgeeraba to Varsity Lakes Capacity Upgrade Qld Government & Federal Government Roads South East
Queensland 220 180 Credibly Proposed 2018/19 2020/21 90 90
Coomera Exit 54 Interchange Upgrade Qld Government & Federal Government Roads South East
Queensland 75 60 Under Construction 2014/15 2016/17 23
Sunshine Coast Region
Sunshine Coast Airport - New East-West Runway Queensland Airports Limited Runways South East
Queensland 347 174 Credibly Proposed 2018/19 2020/21 50 100 24
Sunshine Motorway Mooloolah River Interchange Qld Government Roads South East Queensland 430 350 Credibly
Proposed 2018/19 2020/21 50 150 150
Gold Coast Region
Gold Coast Runway Upgrades Queensland Airports Limited Runways South East
Queensland 150 100 Under Construction 2016/17 2017/18 50 50
Toowoomba Region
Toowoomba Range Second Crossing Qld Government/Federal Government/Private Roads South East
Queensland 1606 1205 Under Construction 2015/16 2018/19 300 630 260
Warrego Highway Upgrade Program (WHUP)
Warrego Highway Upgrade Program Qld Government/Federal Government/Private Roads South East
Queensland 635 635 Under Construction 71 200 200 33
Toowoomba to Oakey Duplication Stage 2 (Leeson Road to Kingsthorpe)
Qld Government/Federal Government Roads South East
Queensland 160 60 Under Procurement 2016/17 2018/19 15 30 15
Toowoomba to Oakey Stage 1 - Nugent Pinch to Charlton Qld Government/Federal Government Roads South East
Queensland 110 100 Under Construction 2015/16 2016/17 35
Bruce Highway
Caloundra Road to Sunshine Motorway Qld Government/Federal Government Roads South East
Queensland 920 442 Under Construction 2016/17 2019/20 75 150 150 67
Pine River to Caloundra Interchange Qld Government/Federal Government Roads South East
Queensland 134 100 Announced 2018/19 2019/20 40 60
Deception Bay Road Upgrades Qld Government/Federal Government Roads South East
Queensland 150 95 Prospective 2018/19 2020/21 15 40 40
Bruce Highway - Boundary Road Interchange Qld Government/Federal Government Bridges South East
Queensland 100 75 Under Construction 2016/17 2017/18 20 50
Cooroy to Curra: (Section A) Cooroy Southern interchange to Sankeys Road (updated cost)
Qld Government/Federal Government Roads South East
Queensland 490 259 Under Construction 2013/14 2016/17 50
Cooroy to Curra: (Section C) Traveston Road to Keefton Road (contract value)
Qld Government/Federal Government Roads South East
Queensland 300 160 Under Construction 2016/17 2017/18 60 84
Cooroy to Curra: (Section D) Keefton Road to Curra (Gympie bypass)
Qld Government/Federal Government Roads South East
Queensland 750 555 Credibly Proposed 2018/19 2021/22 35 90 225
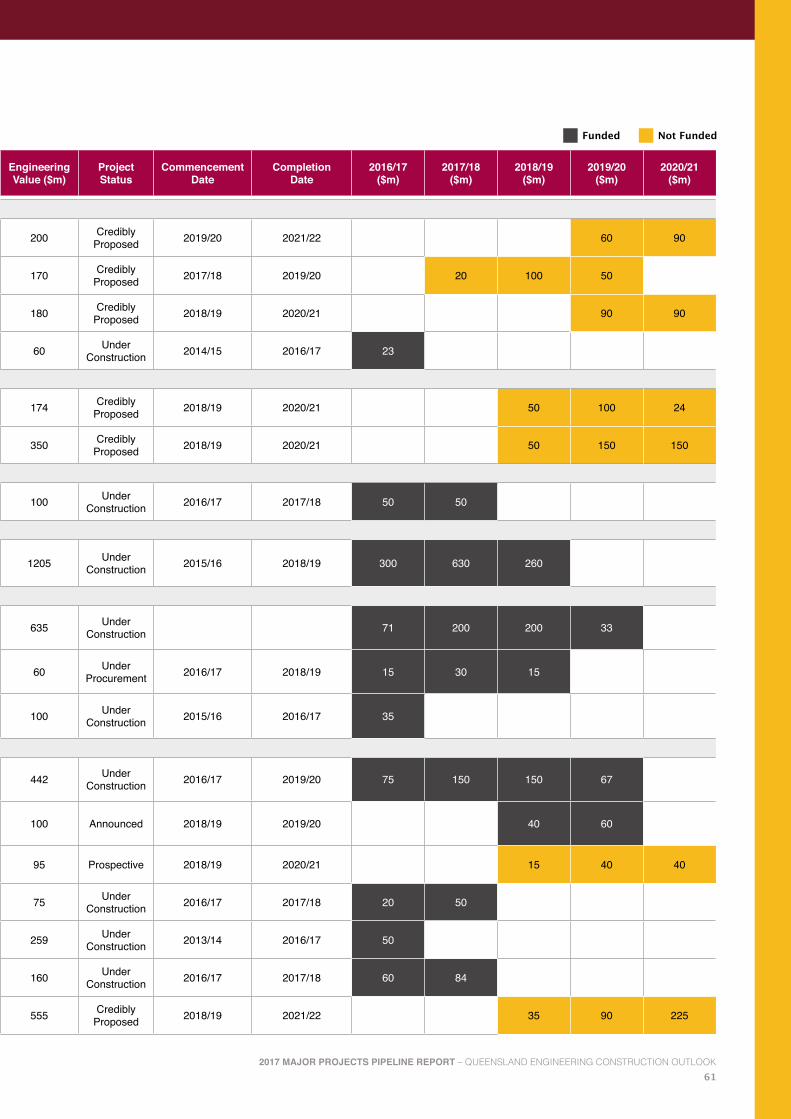
612017 MAJOR PROJECTS PIPELINE REPORT – QUEENSLAND ENGINEERING CONSTRUCTION OUTLOOK
Project Description Sponsor Sector Region Total Project Value ($m)
Engineering Value ($m)
Project Status
Commencement Date
Completion Date
2016/17 ($m)
2017/18 ($m)
2018/19 ($m)
2019/20 ($m)
2020/21 ($m)
Pacific Motorway
Section (C) Daisy Hill to Logan Motorway at Loganholme Qld Government & Federal Government Roads South East
Queensland 280 200 Credibly Proposed 2019/20 2021/22 60 90
Gateway Motorway/Pacific Motorway Merge Upgrade Qld Government & Federal Government Roads South East
Queensland 210 170 Credibly Proposed 2017/18 2019/20 20 100 50
Mudgeeraba to Varsity Lakes Capacity Upgrade Qld Government & Federal Government Roads South East
Queensland 220 180 Credibly Proposed 2018/19 2020/21 90 90
Coomera Exit 54 Interchange Upgrade Qld Government & Federal Government Roads South East
Queensland 75 60 Under Construction 2014/15 2016/17 23
Sunshine Coast Region
Sunshine Coast Airport - New East-West Runway Queensland Airports Limited Runways South East
Queensland 347 174 Credibly Proposed 2018/19 2020/21 50 100 24
Sunshine Motorway Mooloolah River Interchange Qld Government Roads South East Queensland 430 350 Credibly
Proposed 2018/19 2020/21 50 150 150
Gold Coast Region
Gold Coast Runway Upgrades Queensland Airports Limited Runways South East
Queensland 150 100 Under Construction 2016/17 2017/18 50 50
Toowoomba Region
Toowoomba Range Second Crossing Qld Government/Federal Government/Private Roads South East
Queensland 1606 1205 Under Construction 2015/16 2018/19 300 630 260
Warrego Highway Upgrade Program (WHUP)
Warrego Highway Upgrade Program Qld Government/Federal Government/Private Roads South East
Queensland 635 635 Under Construction 71 200 200 33
Toowoomba to Oakey Duplication Stage 2 (Leeson Road to Kingsthorpe)
Qld Government/Federal Government Roads South East
Queensland 160 60 Under Procurement 2016/17 2018/19 15 30 15
Toowoomba to Oakey Stage 1 - Nugent Pinch to Charlton Qld Government/Federal Government Roads South East
Queensland 110 100 Under Construction 2015/16 2016/17 35
Bruce Highway
Caloundra Road to Sunshine Motorway Qld Government/Federal Government Roads South East
Queensland 920 442 Under Construction 2016/17 2019/20 75 150 150 67
Pine River to Caloundra Interchange Qld Government/Federal Government Roads South East
Queensland 134 100 Announced 2018/19 2019/20 40 60
Deception Bay Road Upgrades Qld Government/Federal Government Roads South East
Queensland 150 95 Prospective 2018/19 2020/21 15 40 40
Bruce Highway - Boundary Road Interchange Qld Government/Federal Government Bridges South East
Queensland 100 75 Under Construction 2016/17 2017/18 20 50
Cooroy to Curra: (Section A) Cooroy Southern interchange to Sankeys Road (updated cost)
Qld Government/Federal Government Roads South East
Queensland 490 259 Under Construction 2013/14 2016/17 50
Cooroy to Curra: (Section C) Traveston Road to Keefton Road (contract value)
Qld Government/Federal Government Roads South East
Queensland 300 160 Under Construction 2016/17 2017/18 60 84
Cooroy to Curra: (Section D) Keefton Road to Curra (Gympie bypass)
Qld Government/Federal Government Roads South East
Queensland 750 555 Credibly Proposed 2018/19 2021/22 35 90 225
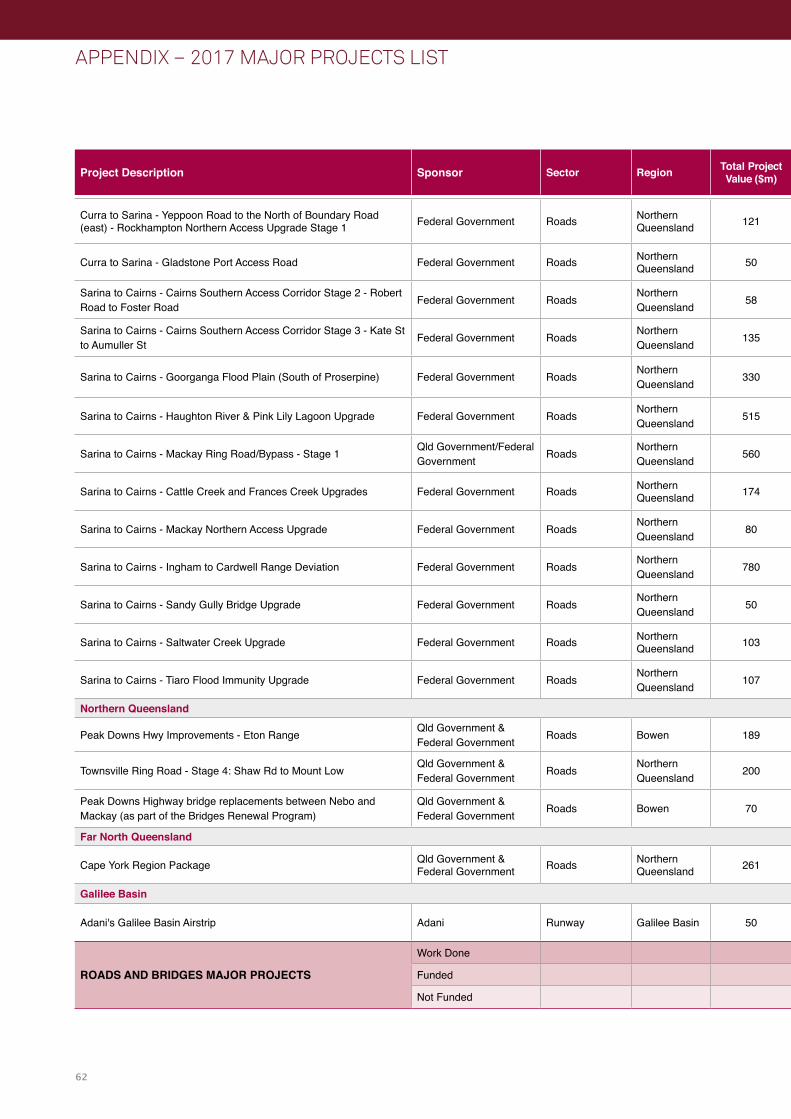
62
APPENDIX – 2017 MAJOR PROJECTS LIST
Project Description Sponsor Sector Region Total Project Value ($m)
Engineering Value ($m)
Project Status
Commencement Date
Completion Date
2016/17 ($m)
2017/18 ($m)
2018/19 ($m)
2019/20 ($m)
2020/21 ($m)
Curra to Sarina - Yeppoon Road to the North of Boundary Road (east) - Rockhampton Northern Access Upgrade Stage 1 Federal Government Roads Northern
Queensland 121 85 Credibly Proposed 2019/20 2022/23 14 18
Curra to Sarina - Gladstone Port Access Road Federal Government Roads Northern Queensland 50 40 Under
Construction 2016/17 2016/17 40
Sarina to Cairns - Cairns Southern Access Corridor Stage 2 - Robert Road to Foster Road Federal Government Roads Northern
Queensland 58 43 Under Construction 2016/17 2018/19 28 15
Sarina to Cairns - Cairns Southern Access Corridor Stage 3 - Kate St to Aumuller St Federal Government Roads Northern
Queensland 135 50 Credibly Proposed 2018/19 2021/22 6 40 40
Sarina to Cairns - Goorganga Flood Plain (South of Proserpine) Federal Government Roads Northern Queensland 330 241 Credibly
Proposed 2019/20 2021/22 50 100
Sarina to Cairns - Haughton River & Pink Lily Lagoon Upgrade Federal Government Roads Northern Queensland 515 300 Credibly
Proposed 2018/19 2021/22 10 100 125
Sarina to Cairns - Mackay Ring Road/Bypass - Stage 1 Qld Government/Federal Government Roads Northern
Queensland 560 275 Under Procurement 2017/18 2019/20 100 100 75
Sarina to Cairns - Cattle Creek and Frances Creek Upgrades Federal Government Roads Northern Queensland 174 65 Under
Procurement 2017/18 2018/19 30 35
Sarina to Cairns - Mackay Northern Access Upgrade Federal Government Roads Northern Queensland 80 60 Credibly
Proposed 2016/17 2018/19 4 27 29
Sarina to Cairns - Ingham to Cardwell Range Deviation Federal Government Roads Northern Queensland 780 585 Probable 2020/21 2024/25 30
Sarina to Cairns - Sandy Gully Bridge Upgrade Federal Government Roads Northern Queensland 50 36 Under
Construction 2016/17 2017/18 30 6
Sarina to Cairns - Saltwater Creek Upgrade Federal Government Roads Northern Queensland 103 77 Credibly
Proposed 2019/20 2022/23 21 19
Sarina to Cairns - Tiaro Flood Immunity Upgrade Federal Government Roads Northern Queensland 107 80 Credibly
Proposed 2022/21 2022/23 5
Northern Queensland
Peak Downs Hwy Improvements - Eton Range Qld Government & Federal Government Roads Bowen 189 120 Under
Construction 2015/16 2018/19 25 70 20
Townsville Ring Road - Stage 4: Shaw Rd to Mount Low Qld Government & Federal Government Roads Northern
Queensland 200 131 Under Construction 2014/15 2016/17 51
Peak Downs Highway bridge replacements between Nebo and Mackay (as part of the Bridges Renewal Program)
Qld Government & Federal Government Roads Bowen 70 70 Under
Construction 2015/16 2017/18 40 17
Far North Queensland
Cape York Region Package Qld Government & Federal Government Roads Northern
Queensland 261 208 Under Construction 2015/16 2018/19 60 60 56
Galilee Basin
Adani's Galilee Basin Airstrip Adani Runway Galilee Basin 50 40 Unlikely 2018/19 2019/20 20 20
ROADS AND BRIDGES MAJOR PROJECTS
Work Done 1568 2521 2123 1562 1282
Funded 1564 2474 1757 562 26
Not Funded 4 47 366 1000 1256
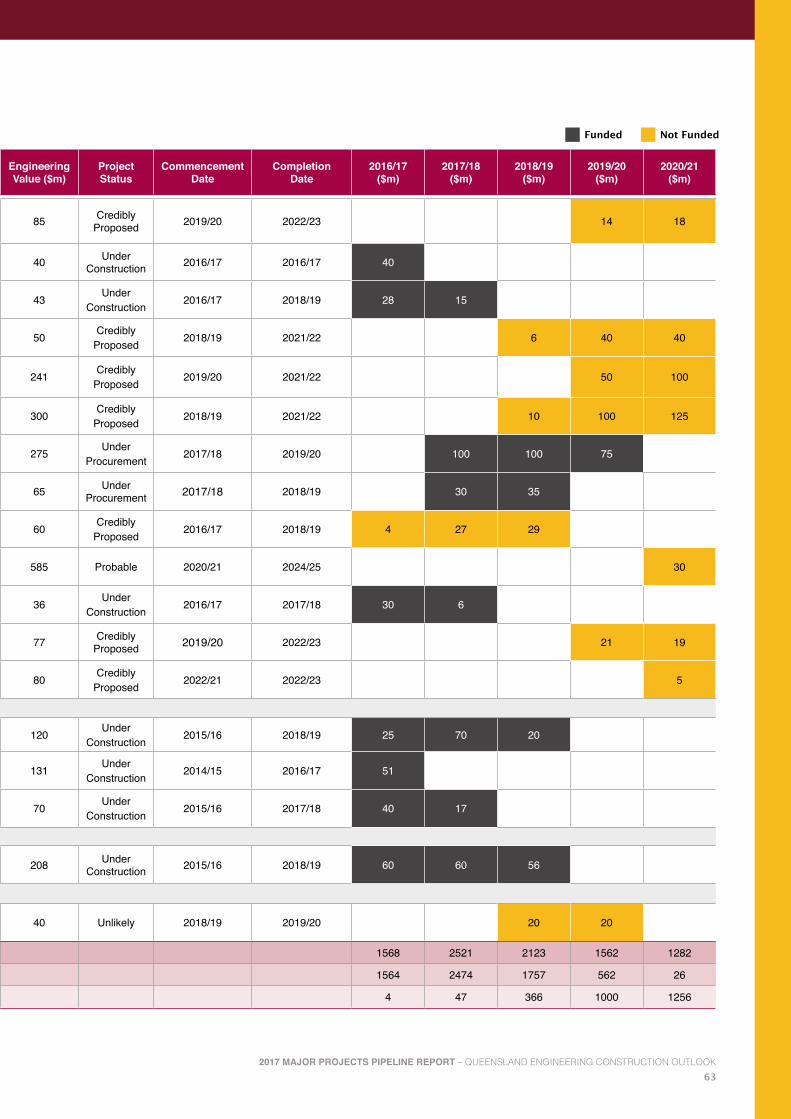
632017 MAJOR PROJECTS PIPELINE REPORT – QUEENSLAND ENGINEERING CONSTRUCTION OUTLOOK
Project Description Sponsor Sector Region Total Project Value ($m)
Engineering Value ($m)
Project Status
Commencement Date
Completion Date
2016/17 ($m)
2017/18 ($m)
2018/19 ($m)
2019/20 ($m)
2020/21 ($m)
Curra to Sarina - Yeppoon Road to the North of Boundary Road (east) - Rockhampton Northern Access Upgrade Stage 1 Federal Government Roads Northern
Queensland 121 85 Credibly Proposed 2019/20 2022/23 14 18
Curra to Sarina - Gladstone Port Access Road Federal Government Roads Northern Queensland 50 40 Under
Construction 2016/17 2016/17 40
Sarina to Cairns - Cairns Southern Access Corridor Stage 2 - Robert Road to Foster Road Federal Government Roads Northern
Queensland 58 43 Under Construction 2016/17 2018/19 28 15
Sarina to Cairns - Cairns Southern Access Corridor Stage 3 - Kate St to Aumuller St Federal Government Roads Northern
Queensland 135 50 Credibly Proposed 2018/19 2021/22 6 40 40
Sarina to Cairns - Goorganga Flood Plain (South of Proserpine) Federal Government Roads Northern Queensland 330 241 Credibly
Proposed 2019/20 2021/22 50 100
Sarina to Cairns - Haughton River & Pink Lily Lagoon Upgrade Federal Government Roads Northern Queensland 515 300 Credibly
Proposed 2018/19 2021/22 10 100 125
Sarina to Cairns - Mackay Ring Road/Bypass - Stage 1 Qld Government/Federal Government Roads Northern
Queensland 560 275 Under Procurement 2017/18 2019/20 100 100 75
Sarina to Cairns - Cattle Creek and Frances Creek Upgrades Federal Government Roads Northern Queensland 174 65 Under
Procurement 2017/18 2018/19 30 35
Sarina to Cairns - Mackay Northern Access Upgrade Federal Government Roads Northern Queensland 80 60 Credibly
Proposed 2016/17 2018/19 4 27 29
Sarina to Cairns - Ingham to Cardwell Range Deviation Federal Government Roads Northern Queensland 780 585 Probable 2020/21 2024/25 30
Sarina to Cairns - Sandy Gully Bridge Upgrade Federal Government Roads Northern Queensland 50 36 Under
Construction 2016/17 2017/18 30 6
Sarina to Cairns - Saltwater Creek Upgrade Federal Government Roads Northern Queensland 103 77 Credibly
Proposed 2019/20 2022/23 21 19
Sarina to Cairns - Tiaro Flood Immunity Upgrade Federal Government Roads Northern Queensland 107 80 Credibly
Proposed 2022/21 2022/23 5
Northern Queensland
Peak Downs Hwy Improvements - Eton Range Qld Government & Federal Government Roads Bowen 189 120 Under
Construction 2015/16 2018/19 25 70 20
Townsville Ring Road - Stage 4: Shaw Rd to Mount Low Qld Government & Federal Government Roads Northern
Queensland 200 131 Under Construction 2014/15 2016/17 51
Peak Downs Highway bridge replacements between Nebo and Mackay (as part of the Bridges Renewal Program)
Qld Government & Federal Government Roads Bowen 70 70 Under
Construction 2015/16 2017/18 40 17
Far North Queensland
Cape York Region Package Qld Government & Federal Government Roads Northern
Queensland 261 208 Under Construction 2015/16 2018/19 60 60 56
Galilee Basin
Adani's Galilee Basin Airstrip Adani Runway Galilee Basin 50 40 Unlikely 2018/19 2019/20 20 20
ROADS AND BRIDGES MAJOR PROJECTS
Work Done 1568 2521 2123 1562 1282
Funded 1564 2474 1757 562 26
Not Funded 4 47 366 1000 1256
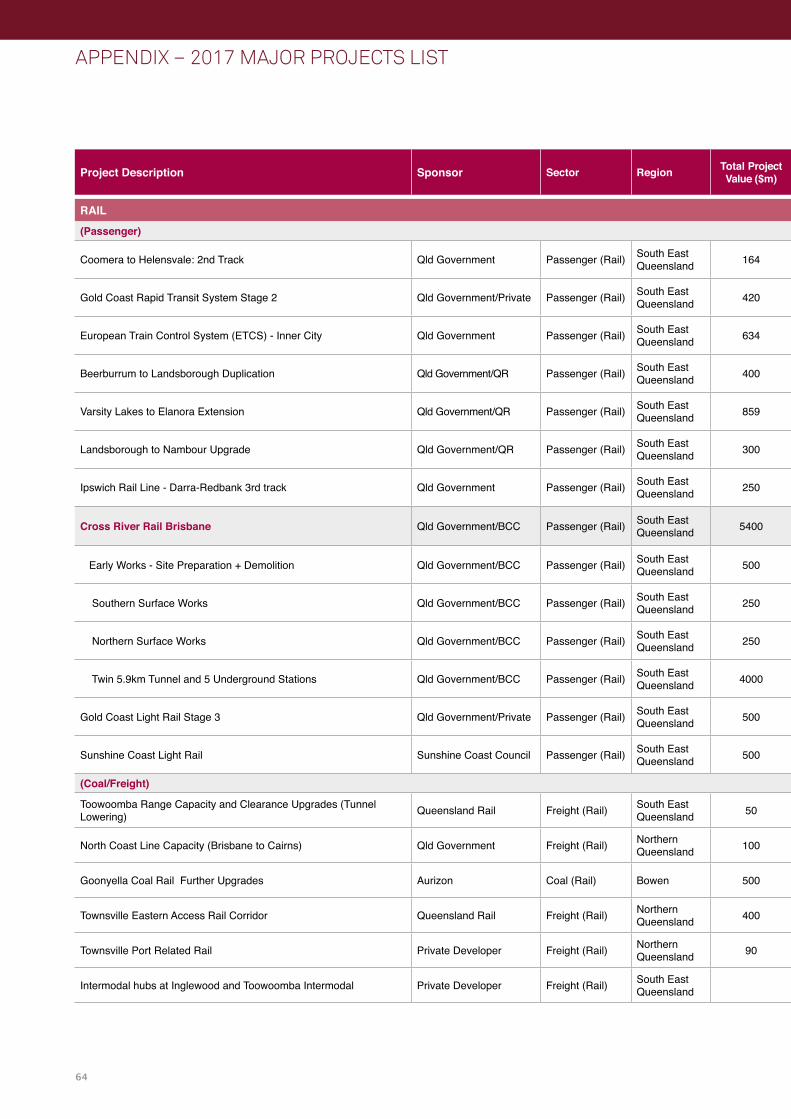
64
APPENDIX – 2017 MAJOR PROJECTS LIST
Project Description Sponsor Sector Region Total Project Value ($m)
Engineering Value ($m)
Project Status
Commencement Date
Completion Date
2016/17 ($m)
2017/18 ($m)
2018/19 ($m)
2019/20 ($m)
2020/21 ($m)
RAIL
(Passenger)
Coomera to Helensvale: 2nd Track Qld Government Passenger (Rail) South East Queensland 164 80 Under
Construction 2015/16 2017/18 60 10
Gold Coast Rapid Transit System Stage 2 Qld Government/Private Passenger (Rail) South East Queensland 420 250 Under
Procurement 2015/16 2017/18 90 90 20
European Train Control System (ETCS) - Inner City Qld Government Passenger (Rail) South East Queensland 634 200 Announced 2017/18 2020/21 50 50 50 50
Beerburrum to Landsborough Duplication Qld Government/QR Passenger (Rail) South East Queensland 400 350 Credibly
Proposed 2018/19 2020/21 80 120 150
Varsity Lakes to Elanora Extension Qld Government/QR Passenger (Rail) South East Queensland 859 600 Probable >2022/23
Landsborough to Nambour Upgrade Qld Government/QR Passenger (Rail) South East Queensland 300 150 Credibly
Proposed 2018/19 2020/21 25 100 25
Ipswich Rail Line - Darra-Redbank 3rd track Qld Government Passenger (Rail) South East Queensland 250 175 Credibly
Proposed 2019/20 2022/23 57 57
Cross River Rail Brisbane Qld Government/BCC Passenger (Rail) South East Queensland 5400 3500
Early Works - Site Preparation + Demolition Qld Government/BCC Passenger (Rail) South East Queensland 500 200 Announced 2017/18 2018/19 100 100
Southern Surface Works Qld Government/BCC Passenger (Rail) South East Queensland 250 200 Credibly
Proposed 2019/20 2021/21 125 125
Northern Surface Works Qld Government/BCC Passenger (Rail) South East Queensland 250 200 Credibly
Proposed 2019/20 2021/21 125 125
Twin 5.9km Tunnel and 5 Underground Stations Qld Government/BCC Passenger (Rail) South East Queensland 4000 3500 Credibly
Proposed 2020/21 2022/23 450
Gold Coast Light Rail Stage 3 Qld Government/Private Passenger (Rail) South East Queensland 500 300 Credibly
Proposed 2019/20 2022/23 50 200
Sunshine Coast Light Rail Sunshine Coast Council Passenger (Rail) South East Queensland 500 300 Prospective 2021/22 2024/25 50
(Coal/Freight)
Toowoomba Range Capacity and Clearance Upgrades (Tunnel Lowering) Queensland Rail Freight (Rail) South East
Queensland 50 35 Under Procurement 2016/17 2017/18 15 20
North Coast Line Capacity (Brisbane to Cairns) Qld Government Freight (Rail) Northern Queensland 100 75 Under
Construction 2016/17 2018/19 20 35 20
Goonyella Coal Rail Further Upgrades Aurizon Coal (Rail) Bowen 500 350 Credibly Proposed 2018/19 2021/22 120 120 110
Townsville Eastern Access Rail Corridor Queensland Rail Freight (Rail) Northern Queensland 400 355 Announced 2018/19 2021/22 55 150 150
Townsville Port Related Rail Private Developer Freight (Rail) Northern Queensland 90 63 Credibly
Proposed 2018/19 2020/21 30 30 3
Intermodal hubs at Inglewood and Toowoomba Intermodal Private Developer Freight (Rail) South East Queensland Prospective

652017 MAJOR PROJECTS PIPELINE REPORT – QUEENSLAND ENGINEERING CONSTRUCTION OUTLOOK
Project Description Sponsor Sector Region Total Project Value ($m)
Engineering Value ($m)
Project Status
Commencement Date
Completion Date
2016/17 ($m)
2017/18 ($m)
2018/19 ($m)
2019/20 ($m)
2020/21 ($m)
RAIL
(Passenger)
Coomera to Helensvale: 2nd Track Qld Government Passenger (Rail) South East Queensland 164 80 Under
Construction 2015/16 2017/18 60 10
Gold Coast Rapid Transit System Stage 2 Qld Government/Private Passenger (Rail) South East Queensland 420 250 Under
Procurement 2015/16 2017/18 90 90 20
European Train Control System (ETCS) - Inner City Qld Government Passenger (Rail) South East Queensland 634 200 Announced 2017/18 2020/21 50 50 50 50
Beerburrum to Landsborough Duplication Qld Government/QR Passenger (Rail) South East Queensland 400 350 Credibly
Proposed 2018/19 2020/21 80 120 150
Varsity Lakes to Elanora Extension Qld Government/QR Passenger (Rail) South East Queensland 859 600 Probable >2022/23
Landsborough to Nambour Upgrade Qld Government/QR Passenger (Rail) South East Queensland 300 150 Credibly
Proposed 2018/19 2020/21 25 100 25
Ipswich Rail Line - Darra-Redbank 3rd track Qld Government Passenger (Rail) South East Queensland 250 175 Credibly
Proposed 2019/20 2022/23 57 57
Cross River Rail Brisbane Qld Government/BCC Passenger (Rail) South East Queensland 5400 3500
Early Works - Site Preparation + Demolition Qld Government/BCC Passenger (Rail) South East Queensland 500 200 Announced 2017/18 2018/19 100 100
Southern Surface Works Qld Government/BCC Passenger (Rail) South East Queensland 250 200 Credibly
Proposed 2019/20 2021/21 125 125
Northern Surface Works Qld Government/BCC Passenger (Rail) South East Queensland 250 200 Credibly
Proposed 2019/20 2021/21 125 125
Twin 5.9km Tunnel and 5 Underground Stations Qld Government/BCC Passenger (Rail) South East Queensland 4000 3500 Credibly
Proposed 2020/21 2022/23 450
Gold Coast Light Rail Stage 3 Qld Government/Private Passenger (Rail) South East Queensland 500 300 Credibly
Proposed 2019/20 2022/23 50 200
Sunshine Coast Light Rail Sunshine Coast Council Passenger (Rail) South East Queensland 500 300 Prospective 2021/22 2024/25 50
(Coal/Freight)
Toowoomba Range Capacity and Clearance Upgrades (Tunnel Lowering) Queensland Rail Freight (Rail) South East
Queensland 50 35 Under Procurement 2016/17 2017/18 15 20
North Coast Line Capacity (Brisbane to Cairns) Qld Government Freight (Rail) Northern Queensland 100 75 Under
Construction 2016/17 2018/19 20 35 20
Goonyella Coal Rail Further Upgrades Aurizon Coal (Rail) Bowen 500 350 Credibly Proposed 2018/19 2021/22 120 120 110
Townsville Eastern Access Rail Corridor Queensland Rail Freight (Rail) Northern Queensland 400 355 Announced 2018/19 2021/22 55 150 150
Townsville Port Related Rail Private Developer Freight (Rail) Northern Queensland 90 63 Credibly
Proposed 2018/19 2020/21 30 30 3
Intermodal hubs at Inglewood and Toowoomba Intermodal Private Developer Freight (Rail) South East Queensland Prospective
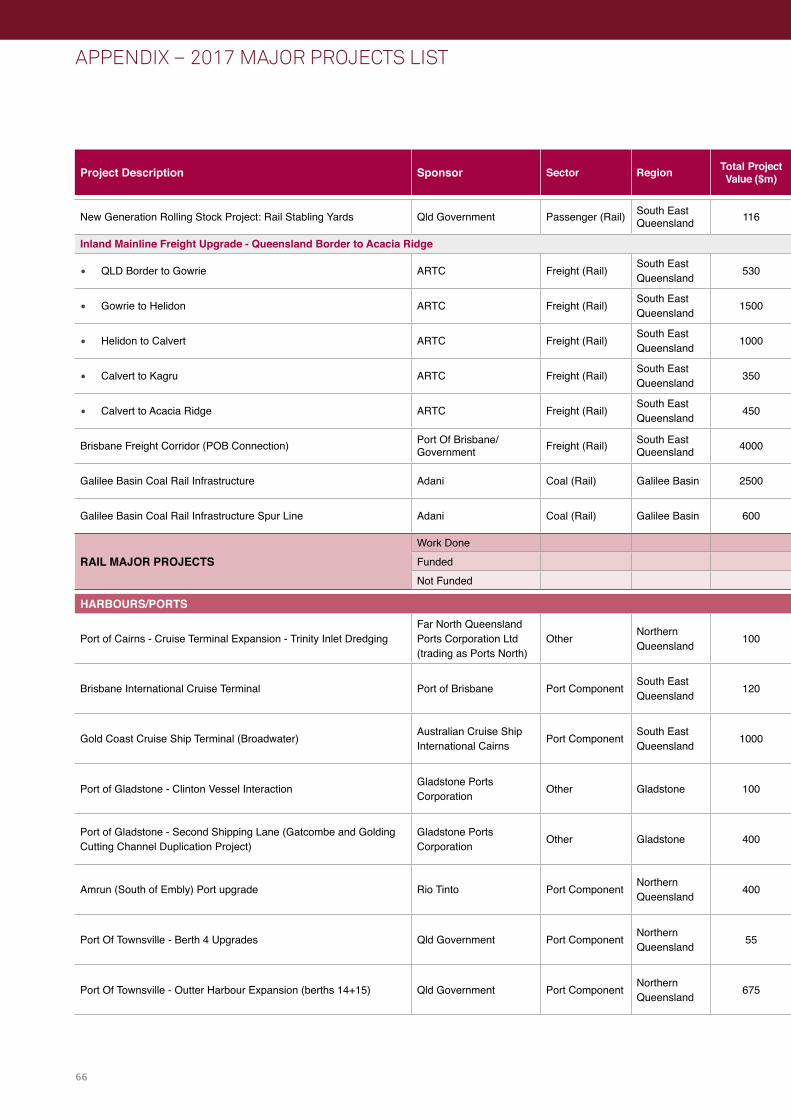
66
APPENDIX – 2017 MAJOR PROJECTS LIST
Project Description Sponsor Sector Region Total Project Value ($m)
Engineering Value ($m)
Project Status
Commencement Date
Completion Date
2016/17 ($m)
2017/18 ($m)
2018/19 ($m)
2019/20 ($m)
2020/21 ($m)
New Generation Rolling Stock Project: Rail Stabling Yards Qld Government Passenger (Rail) South East Queensland 116 98 Under
Construction 2013/14 2015/16 62
Inland Mainline Freight Upgrade - Queensland Border to Acacia Ridge
• QLD Border to Gowrie ARTC Freight (Rail) South East Queensland 530 475 Credibly
Proposed 75 125 150
• Gowrie to Helidon ARTC Freight (Rail) South East Queensland 1500 1250 Credibly
Proposed 150 250 300
• Helidon to Calvert ARTC Freight (Rail) South East Queensland 1000 850 Credibly
Proposed 100 200
• Calvert to Kagru ARTC Freight (Rail) South East Queensland 350 300 Credibly
Proposed 50
• Calvert to Acacia Ridge ARTC Freight (Rail) South East Queensland 450 400 Credibly
Proposed 75
Brisbane Freight Corridor (POB Connection) Port Of Brisbane/Government Freight (Rail) South East
Queensland 4000 3250 Credibly Proposed >2021/22 >2021/22
Galilee Basin Coal Rail Infrastructure Adani Coal (Rail) Galilee Basin 2500 1750 Unlikely 250 500 500
Galilee Basin Coal Rail Infrastructure Spur Line Adani Coal (Rail) Galilee Basin 600 500 Unlikely 200
RAIL MAJOR PROJECTS Work Done 232 200 995 2002 2970Funded 232 200 210 150 50Not Funded 0 0 785 1852 2920
HARBOURS/PORTS
Port of Cairns - Cruise Terminal Expansion - Trinity Inlet DredgingFar North Queensland Ports Corporation Ltd (trading as Ports North)
Other Northern Queensland 100 50 Credibly
Proposed 2019/20 2020+ 50 50
Brisbane International Cruise Terminal Port of Brisbane Port Component South East Queensland 120 100 Credibly
Proposed 2017/18 2019/20 30 50 20
Gold Coast Cruise Ship Terminal (Broadwater) Australian Cruise Ship International Cairns Port Component South East
Queensland 1000 750 Prospective 2020/21 2022/23 90
Port of Gladstone - Clinton Vessel Interaction Gladstone Ports Corporation Other Gladstone 100 75 Credibly
Proposed 2020/21 2021/22 25
Port of Gladstone - Second Shipping Lane (Gatcombe and Golding Cutting Channel Duplication Project)
Gladstone Ports Corporation Other Gladstone 400 280 Credibly
Proposed 2017/18 2019/20 35 140 105
Amrun (South of Embly) Port upgrade Rio Tinto Port Component Northern Queensland 400 120 Under
Construction 2015/16 2017/18 75 30
Port Of Townsville - Berth 4 Upgrades Qld Government Port Component Northern Queensland 55 40 Under
Construction 2019/20 2021/22 15 25
Port Of Townsville - Outter Harbour Expansion (berths 14+15) Qld Government Port Component Northern Queensland 675 473 Credibly
Proposed 2019/20 2021/22 200 272

672017 MAJOR PROJECTS PIPELINE REPORT – QUEENSLAND ENGINEERING CONSTRUCTION OUTLOOK
Project Description Sponsor Sector Region Total Project Value ($m)
Engineering Value ($m)
Project Status
Commencement Date
Completion Date
2016/17 ($m)
2017/18 ($m)
2018/19 ($m)
2019/20 ($m)
2020/21 ($m)
New Generation Rolling Stock Project: Rail Stabling Yards Qld Government Passenger (Rail) South East Queensland 116 98 Under
Construction 2013/14 2015/16 62
Inland Mainline Freight Upgrade - Queensland Border to Acacia Ridge
• QLD Border to Gowrie ARTC Freight (Rail) South East Queensland 530 475 Credibly
Proposed 75 125 150
• Gowrie to Helidon ARTC Freight (Rail) South East Queensland 1500 1250 Credibly
Proposed 150 250 300
• Helidon to Calvert ARTC Freight (Rail) South East Queensland 1000 850 Credibly
Proposed 100 200
• Calvert to Kagru ARTC Freight (Rail) South East Queensland 350 300 Credibly
Proposed 50
• Calvert to Acacia Ridge ARTC Freight (Rail) South East Queensland 450 400 Credibly
Proposed 75
Brisbane Freight Corridor (POB Connection) Port Of Brisbane/Government Freight (Rail) South East
Queensland 4000 3250 Credibly Proposed >2021/22 >2021/22
Galilee Basin Coal Rail Infrastructure Adani Coal (Rail) Galilee Basin 2500 1750 Unlikely 250 500 500
Galilee Basin Coal Rail Infrastructure Spur Line Adani Coal (Rail) Galilee Basin 600 500 Unlikely 200
RAIL MAJOR PROJECTS Work Done 232 200 995 2002 2970Funded 232 200 210 150 50Not Funded 0 0 785 1852 2920
HARBOURS/PORTS
Port of Cairns - Cruise Terminal Expansion - Trinity Inlet DredgingFar North Queensland Ports Corporation Ltd (trading as Ports North)
Other Northern Queensland 100 50 Credibly
Proposed 2019/20 2020+ 50 50
Brisbane International Cruise Terminal Port of Brisbane Port Component South East Queensland 120 100 Credibly
Proposed 2017/18 2019/20 30 50 20
Gold Coast Cruise Ship Terminal (Broadwater) Australian Cruise Ship International Cairns Port Component South East
Queensland 1000 750 Prospective 2020/21 2022/23 90
Port of Gladstone - Clinton Vessel Interaction Gladstone Ports Corporation Other Gladstone 100 75 Credibly
Proposed 2020/21 2021/22 25
Port of Gladstone - Second Shipping Lane (Gatcombe and Golding Cutting Channel Duplication Project)
Gladstone Ports Corporation Other Gladstone 400 280 Credibly
Proposed 2017/18 2019/20 35 140 105
Amrun (South of Embly) Port upgrade Rio Tinto Port Component Northern Queensland 400 120 Under
Construction 2015/16 2017/18 75 30
Port Of Townsville - Berth 4 Upgrades Qld Government Port Component Northern Queensland 55 40 Under
Construction 2019/20 2021/22 15 25
Port Of Townsville - Outter Harbour Expansion (berths 14+15) Qld Government Port Component Northern Queensland 675 473 Credibly
Proposed 2019/20 2021/22 200 272
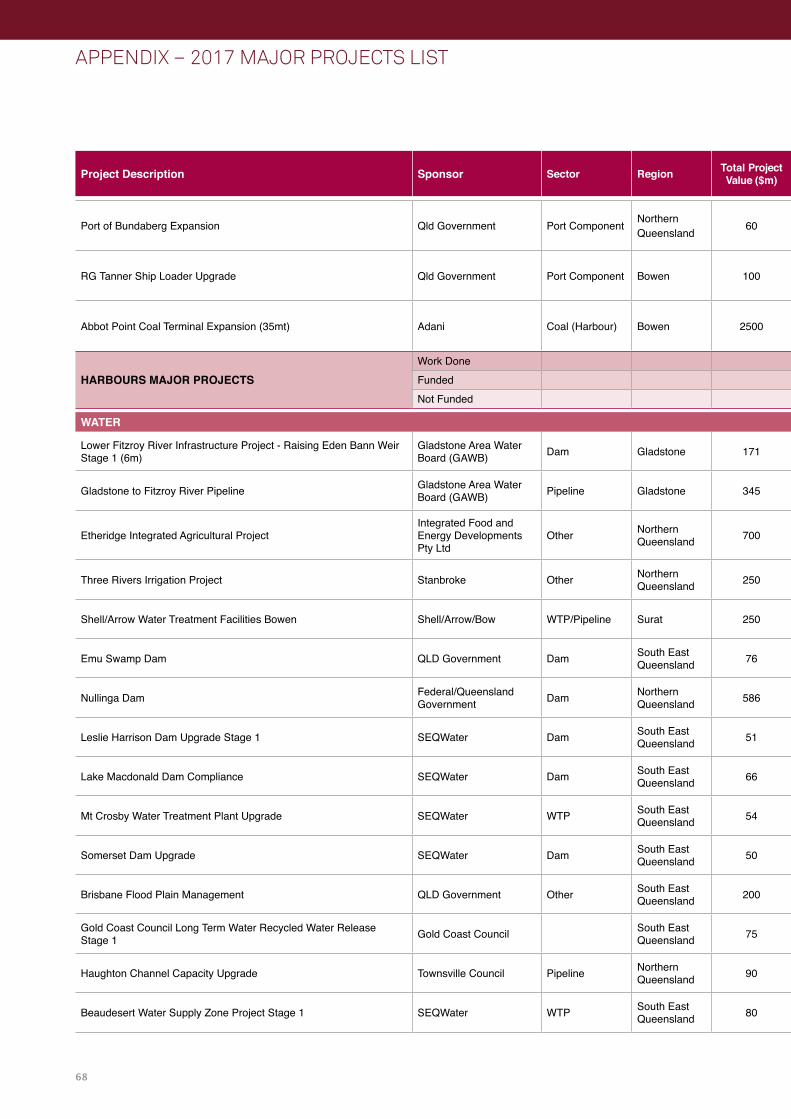
68
APPENDIX – 2017 MAJOR PROJECTS LIST
Project Description Sponsor Sector Region Total Project Value ($m)
Engineering Value ($m)
Project Status
Commencement Date
Completion Date
2016/17 ($m)
2017/18 ($m)
2018/19 ($m)
2019/20 ($m)
2020/21 ($m)
Port of Bundaberg Expansion Qld Government Port Component Northern Queensland 60 40 Announced 20 20
RG Tanner Ship Loader Upgrade Qld Government Port Component Bowen 100 60 Announced 2017/18 2018/19 30 30
Abbot Point Coal Terminal Expansion (35mt) Adani Coal (Harbour) Bowen 2500 2000 Unlikely 2020/21 2023/24 250
HARBOURS MAJOR PROJECTS Work Done 90 150 240 395 687Funded 90 85 50 20 250Not Funded 0 65 190 375 437
WATER
Lower Fitzroy River Infrastructure Project - Raising Eden Bann Weir Stage 1 (6m)
Gladstone Area Water Board (GAWB) Dam Gladstone 171 128 Credibly
Proposed 2018/19 2020/21 40 60 28
Gladstone to Fitzroy River Pipeline Gladstone Area Water Board (GAWB) Pipeline Gladstone 345 207 Credibly
Proposed 2017/18 2019/20 70 100 37
Etheridge Integrated Agricultural ProjectIntegrated Food and Energy Developments Pty Ltd
Other Northern Queensland 700 500 Prospective 100
Three Rivers Irrigation Project Stanbroke Other Northern Queensland 250 200 Prospective 80
Shell/Arrow Water Treatment Facilities Bowen Shell/Arrow/Bow WTP/Pipeline Surat 250 175 Credibly Proposed 2016/17 2019/20 88
Emu Swamp Dam QLD Government Dam South East Queensland 76 60 Announced 2018/19 2019/20 30 30
Nullinga Dam Federal/Queensland Government Dam Northern
Queensland 586 440 Credibly Proposed 2017/18 2019/20 50 200 190
Leslie Harrison Dam Upgrade Stage 1 SEQWater Dam South East Queensland 51 36 Credibly
Proposed 2017/18 2018/19 25 11
Lake Macdonald Dam Compliance SEQWater Dam South East Queensland 66 46 Announced 2016/17 2018/19 24 22
Mt Crosby Water Treatment Plant Upgrade SEQWater WTP South East Queensland 54 38 Under
Construction 2014/15 2017/18 4 12
Somerset Dam Upgrade SEQWater Dam South East Queensland 50 40 Announced 20 20
Brisbane Flood Plain Management QLD Government Other South East Queensland 200 150 Credibly
Proposed 2018/19 2020/21 50 50 50
Gold Coast Council Long Term Water Recycled Water Release Stage 1 Gold Coast Council South East
Queensland 75 50 Announced 2016/17 2017/18 10 40
Haughton Channel Capacity Upgrade Townsville Council Pipeline Northern Queensland 90 70 Prospective 2019/20 2021/22 20 50
Beaudesert Water Supply Zone Project Stage 1 SEQWater WTP South East Queensland 80 60 Prospective 2018/19 2019/20 30 30

692017 MAJOR PROJECTS PIPELINE REPORT – QUEENSLAND ENGINEERING CONSTRUCTION OUTLOOK
Project Description Sponsor Sector Region Total Project Value ($m)
Engineering Value ($m)
Project Status
Commencement Date
Completion Date
2016/17 ($m)
2017/18 ($m)
2018/19 ($m)
2019/20 ($m)
2020/21 ($m)
Port of Bundaberg Expansion Qld Government Port Component Northern Queensland 60 40 Announced 20 20
RG Tanner Ship Loader Upgrade Qld Government Port Component Bowen 100 60 Announced 2017/18 2018/19 30 30
Abbot Point Coal Terminal Expansion (35mt) Adani Coal (Harbour) Bowen 2500 2000 Unlikely 2020/21 2023/24 250
HARBOURS MAJOR PROJECTS Work Done 90 150 240 395 687Funded 90 85 50 20 250Not Funded 0 65 190 375 437
WATER
Lower Fitzroy River Infrastructure Project - Raising Eden Bann Weir Stage 1 (6m)
Gladstone Area Water Board (GAWB) Dam Gladstone 171 128 Credibly
Proposed 2018/19 2020/21 40 60 28
Gladstone to Fitzroy River Pipeline Gladstone Area Water Board (GAWB) Pipeline Gladstone 345 207 Credibly
Proposed 2017/18 2019/20 70 100 37
Etheridge Integrated Agricultural ProjectIntegrated Food and Energy Developments Pty Ltd
Other Northern Queensland 700 500 Prospective 100
Three Rivers Irrigation Project Stanbroke Other Northern Queensland 250 200 Prospective 80
Shell/Arrow Water Treatment Facilities Bowen Shell/Arrow/Bow WTP/Pipeline Surat 250 175 Credibly Proposed 2016/17 2019/20 88
Emu Swamp Dam QLD Government Dam South East Queensland 76 60 Announced 2018/19 2019/20 30 30
Nullinga Dam Federal/Queensland Government Dam Northern
Queensland 586 440 Credibly Proposed 2017/18 2019/20 50 200 190
Leslie Harrison Dam Upgrade Stage 1 SEQWater Dam South East Queensland 51 36 Credibly
Proposed 2017/18 2018/19 25 11
Lake Macdonald Dam Compliance SEQWater Dam South East Queensland 66 46 Announced 2016/17 2018/19 24 22
Mt Crosby Water Treatment Plant Upgrade SEQWater WTP South East Queensland 54 38 Under
Construction 2014/15 2017/18 4 12
Somerset Dam Upgrade SEQWater Dam South East Queensland 50 40 Announced 20 20
Brisbane Flood Plain Management QLD Government Other South East Queensland 200 150 Credibly
Proposed 2018/19 2020/21 50 50 50
Gold Coast Council Long Term Water Recycled Water Release Stage 1 Gold Coast Council South East
Queensland 75 50 Announced 2016/17 2017/18 10 40
Haughton Channel Capacity Upgrade Townsville Council Pipeline Northern Queensland 90 70 Prospective 2019/20 2021/22 20 50
Beaudesert Water Supply Zone Project Stage 1 SEQWater WTP South East Queensland 80 60 Prospective 2018/19 2019/20 30 30

70
APPENDIX – 2017 MAJOR PROJECTS LIST
Project Description Sponsor Sector Region Total Project Value ($m)
Engineering Value ($m)
Project Status
Commencement Date
Completion Date
2016/17 ($m)
2017/18 ($m)
2018/19 ($m)
2019/20 ($m)
2020/21 ($m)
Beaudesert Water Supply Zone Project Stage 2 SEQWater WTP South East Queensland 80 60 Prospective 2019/20 2020/21 30 30
Urannah Dam Sunwater Dam Bowen 250 200 Prospective 2018/19 2019/20 100 100
Burdekin Falls Dam - Saddle Dam and Monolith Improvement Sunwater Dam Bowen 190 150 Credibly Proposed 2018/19 2019/20 75 75
Gorge Weir to Byerwen Coal Project Pipeline project (110km) Sunwater for QCoal Pipeline Bowen 240 180 Credibly Proposed 2018/19 2020/21 30 90 60
Galilee Basin Flood Mitigation and Water Supply Dam Adani Dam Galilee Basin 300 225 Unlikely 50 100
Galilee Basin Flood Mitigation and Water Supply Pipeline Adani Pipeline Galilee Basin 600 450 Unlikely 100 200
WATER MAJOR PROJECTS Work Done 14 221 688 882 806Funded 14 76 52 50 20Not Funded 0 145 636 832 786
SEWERAGE
S1 Sewer Upgrade - Brisbane BCC Pipeline South East Queensland 160 120 Under
Construction 2014/15 2019 35 20 20
Cleveland Bay WWTP Repair/Upgrade Townsville Council WTP Northern Queensland 51 30 Credibly
Proposed 2017/18 2019/20 5 15 10
Rubyanna WWTP Bundaberg Council WTP Bowen 71 50 Under Construction 2016/17 2017/18 25 25
SEWERAGE MAJOR PROJECTS Work Done 60 50 35 10 0Funded 60 50 35 10 0Not Funded 0 0 0 0 0
ELECTRICITY
North Queensland Power Station Private/Qld Gov/Feds Generation Northern Queensland 800 600 Credibly
Proposed 2017/18 2020/21 100 250
Springdale to Blackwall Transmission Line Powerlink Distribution/ Supply
South East Queensland 125 50 Expected
Ross River Solar Farm (135 MW) ESCO Pacific Generation Northern Queensland 225 135 Announced 2016/17 2018/19 50 35 50
Mt Emerald Wind Farm (180 MW) Ratch-Australia Port Bajool JV Generation Northern
Queensland 380 228 Announced 2016/17 2018/19 100 78 50
Cooper's Gap Wind Farm - Stage 1 (175 MW) AGL Generation Northern Queensland 300 150 Under
Procurement 2017/18 2018/19 80 70
Kennedy Energy Park Stage 1 (Solar 40MW) Windlab/Eurus Energy Generation Northern Queensland 70 42 Under
Procurement 2017/18 2017/18 42
Kennedy Energy Park Stage 1 (Wind 40MW) Windlab/Eurus Energy Generation Northern Queensland 70 42 Under
Procurement 2017/18 2017/18 42
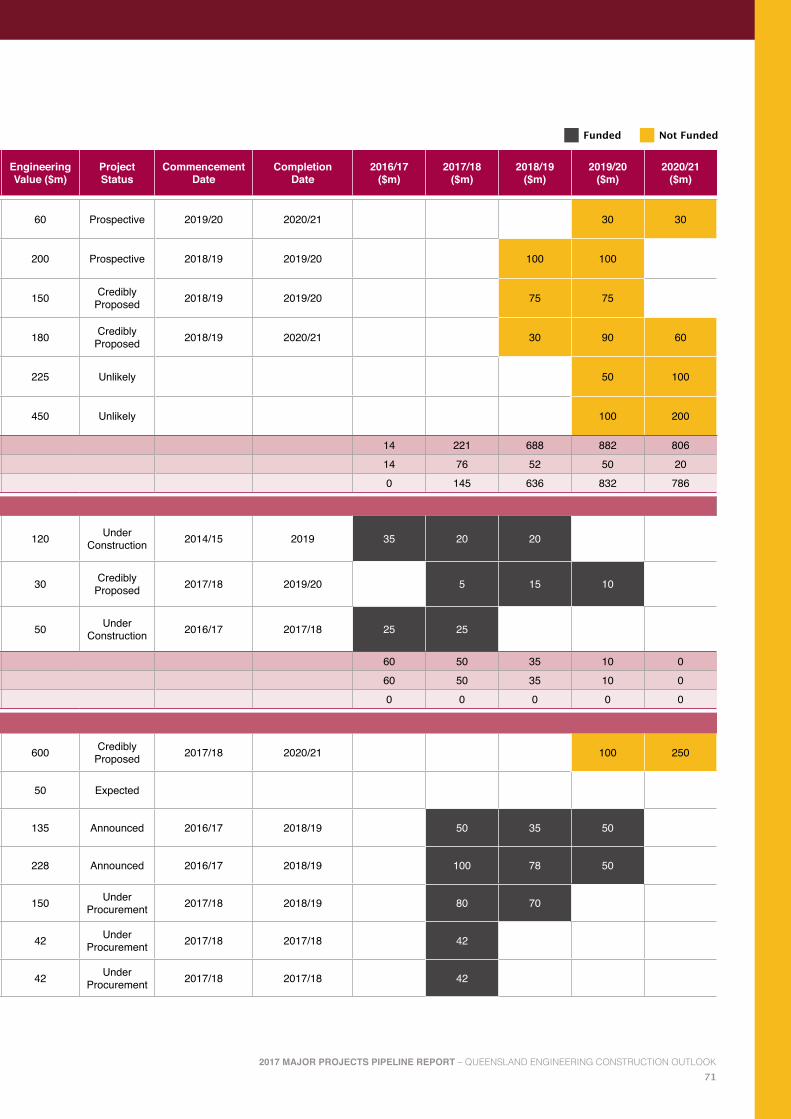
712017 MAJOR PROJECTS PIPELINE REPORT – QUEENSLAND ENGINEERING CONSTRUCTION OUTLOOK
Project Description Sponsor Sector Region Total Project Value ($m)
Engineering Value ($m)
Project Status
Commencement Date
Completion Date
2016/17 ($m)
2017/18 ($m)
2018/19 ($m)
2019/20 ($m)
2020/21 ($m)
Beaudesert Water Supply Zone Project Stage 2 SEQWater WTP South East Queensland 80 60 Prospective 2019/20 2020/21 30 30
Urannah Dam Sunwater Dam Bowen 250 200 Prospective 2018/19 2019/20 100 100
Burdekin Falls Dam - Saddle Dam and Monolith Improvement Sunwater Dam Bowen 190 150 Credibly Proposed 2018/19 2019/20 75 75
Gorge Weir to Byerwen Coal Project Pipeline project (110km) Sunwater for QCoal Pipeline Bowen 240 180 Credibly Proposed 2018/19 2020/21 30 90 60
Galilee Basin Flood Mitigation and Water Supply Dam Adani Dam Galilee Basin 300 225 Unlikely 50 100
Galilee Basin Flood Mitigation and Water Supply Pipeline Adani Pipeline Galilee Basin 600 450 Unlikely 100 200
WATER MAJOR PROJECTS Work Done 14 221 688 882 806Funded 14 76 52 50 20Not Funded 0 145 636 832 786
SEWERAGE
S1 Sewer Upgrade - Brisbane BCC Pipeline South East Queensland 160 120 Under
Construction 2014/15 2019 35 20 20
Cleveland Bay WWTP Repair/Upgrade Townsville Council WTP Northern Queensland 51 30 Credibly
Proposed 2017/18 2019/20 5 15 10
Rubyanna WWTP Bundaberg Council WTP Bowen 71 50 Under Construction 2016/17 2017/18 25 25
SEWERAGE MAJOR PROJECTS Work Done 60 50 35 10 0Funded 60 50 35 10 0Not Funded 0 0 0 0 0
ELECTRICITY
North Queensland Power Station Private/Qld Gov/Feds Generation Northern Queensland 800 600 Credibly
Proposed 2017/18 2020/21 100 250
Springdale to Blackwall Transmission Line Powerlink Distribution/ Supply
South East Queensland 125 50 Expected
Ross River Solar Farm (135 MW) ESCO Pacific Generation Northern Queensland 225 135 Announced 2016/17 2018/19 50 35 50
Mt Emerald Wind Farm (180 MW) Ratch-Australia Port Bajool JV Generation Northern
Queensland 380 228 Announced 2016/17 2018/19 100 78 50
Cooper's Gap Wind Farm - Stage 1 (175 MW) AGL Generation Northern Queensland 300 150 Under
Procurement 2017/18 2018/19 80 70
Kennedy Energy Park Stage 1 (Solar 40MW) Windlab/Eurus Energy Generation Northern Queensland 70 42 Under
Procurement 2017/18 2017/18 42
Kennedy Energy Park Stage 1 (Wind 40MW) Windlab/Eurus Energy Generation Northern Queensland 70 42 Under
Procurement 2017/18 2017/18 42

72
APPENDIX – 2017 MAJOR PROJECTS LIST
Project Description Sponsor Sector Region Total Project Value ($m)
Engineering Value ($m)
Project Status
Commencement Date
Completion Date
2016/17 ($m)
2017/18 ($m)
2018/19 ($m)
2019/20 ($m)
2020/21 ($m)
Kennedy Energy Park Stage 2 (Wind 150MW) Windlab/Eurus Energy Generation Northern Queensland 260 156 Credibly
Proposed 2018/19 2019/20 100 56
Bulli Creek Solar Farm Stage 1 (100 MW) Solar Choice Generation Surat 200 120 Under Procurement 2017/18 2018/19 40 80
Bulli Creek Solar Farm Stage 2 (100 MW) Solar Choice Generation Surat 200 120 Credibly Proposed 2018/19 2019/20 40 80
Bulli Creek Solar Farm Stage 3 (100 MW) Solar Choice Generation Surat 200 120 Credibly Proposed 2019/20 2020/21 40 80
Darling Downs Solar Farm (106.8 MW) Origin Energy Generation Surat 210 126 Under Construction 2016/17 2017/18 60 66
Kidston Solar Project - Stage 1 (50 MW) Genex Generation Northern Queensland 120 100 Credibly
Proposed 2017/18 2018/19 60 40
Kidston Hydro Project - Stage 2 300MW Genex Power Generation Northern Queensland 282 220 Prospective 2017/18 2018/19 100 120
Moranbah Solar Farm 200MW Adani Generation Bowen 400 350 Prospective 2019/20 2020/21 100 150
Collinsville Solar Farm (42MW) (Whitsunday Solar Farm) Hatch Generation Bowen 96 75 Announced 2017/18 2018/19 25 50
Longreach Solar Farm (15MW) Canadian Solar Generation Northern Queensland 50 30 Announced 2017/18 2018/19 15 15
Mackay Substation Rebuild and Nebo Primary Plant Replacement Qld Government Distribution/ Supply Bowen 60 54 Under
Construction 2015/16 2018/19 8 26 11
Moura and Callide A Switchyard Replacement Qld Government Distribution/ Supply Bowen 59 59 Under
Construction 2016/17 2018/19 11 27 22
Stanwell Power Station Works Qld Government Generation Gladstone 206 187 Under Construction 2015/16 2018/19 48 92 8
Tarong and Tarong North Power Station Works Qld Government Generation South East Queensland 125 125 Under
Construction 2015/16 2018/19 18 55 13
Callide Power Station Works Qld Government Generation Gladstone 300 280 Under Construction 2013/14 2017/18 168 44
Substation Upgrades at Various SEQ Locations Qld Government Distribution/ Supply
South East Queensland 203 150 Under
Construction 2013/14 2018/19 35 35 35
SunCoast Powerline Project - Palmwoods to Maroochydore Qld Government Distribution/ Supply
South East Queensland 80 69 Under
Construction 2015/16 2018/19 5 53 9
Kingston to Jimboomba Network Upgrade Qld Government Distribution/ Supply
South East Queensland 58 31 Under
Construction 2015/16 2016/17 12
Galilee Basin Transmission Project Adani Distribution/ Supply Galilee Basin 300 200 Unlikely >2020/21 50 100 50
ELECTRICITY MAJOR PROJECTS Work Done 364 952 777 576 530Funded 364 792 427 100 0Not Funded 0 160 350 476 530
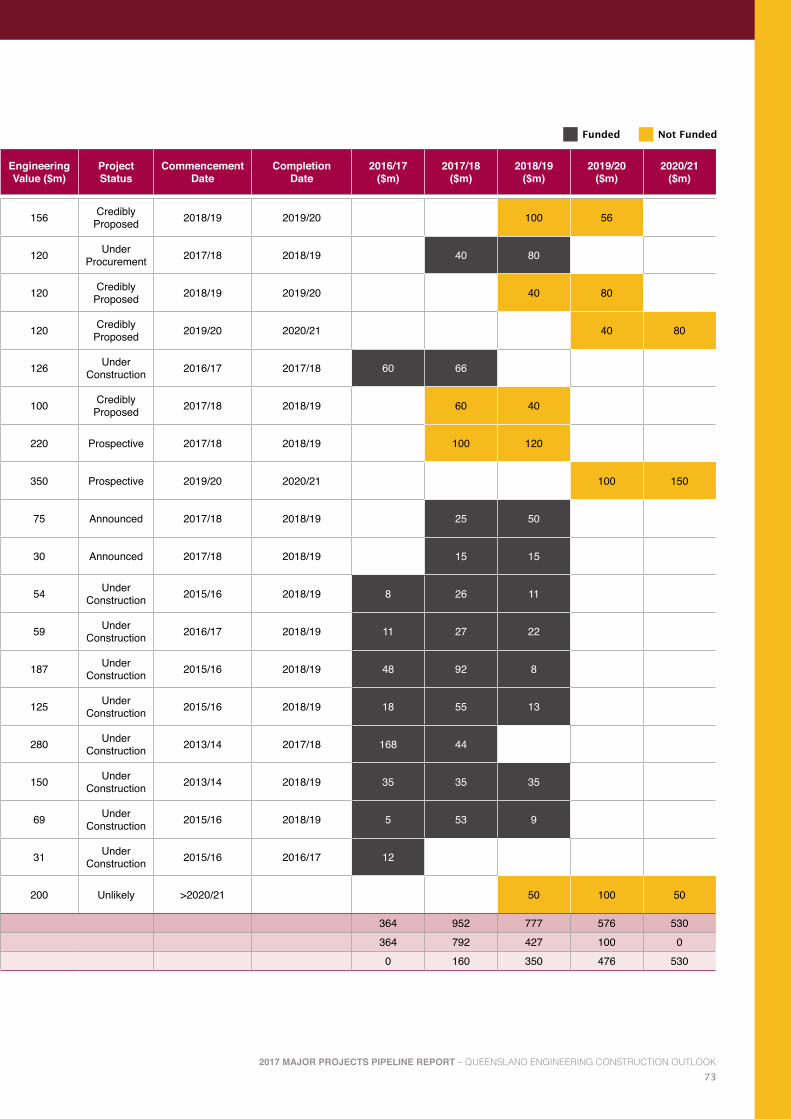
732017 MAJOR PROJECTS PIPELINE REPORT – QUEENSLAND ENGINEERING CONSTRUCTION OUTLOOK
Project Description Sponsor Sector Region Total Project Value ($m)
Engineering Value ($m)
Project Status
Commencement Date
Completion Date
2016/17 ($m)
2017/18 ($m)
2018/19 ($m)
2019/20 ($m)
2020/21 ($m)
Kennedy Energy Park Stage 2 (Wind 150MW) Windlab/Eurus Energy Generation Northern Queensland 260 156 Credibly
Proposed 2018/19 2019/20 100 56
Bulli Creek Solar Farm Stage 1 (100 MW) Solar Choice Generation Surat 200 120 Under Procurement 2017/18 2018/19 40 80
Bulli Creek Solar Farm Stage 2 (100 MW) Solar Choice Generation Surat 200 120 Credibly Proposed 2018/19 2019/20 40 80
Bulli Creek Solar Farm Stage 3 (100 MW) Solar Choice Generation Surat 200 120 Credibly Proposed 2019/20 2020/21 40 80
Darling Downs Solar Farm (106.8 MW) Origin Energy Generation Surat 210 126 Under Construction 2016/17 2017/18 60 66
Kidston Solar Project - Stage 1 (50 MW) Genex Generation Northern Queensland 120 100 Credibly
Proposed 2017/18 2018/19 60 40
Kidston Hydro Project - Stage 2 300MW Genex Power Generation Northern Queensland 282 220 Prospective 2017/18 2018/19 100 120
Moranbah Solar Farm 200MW Adani Generation Bowen 400 350 Prospective 2019/20 2020/21 100 150
Collinsville Solar Farm (42MW) (Whitsunday Solar Farm) Hatch Generation Bowen 96 75 Announced 2017/18 2018/19 25 50
Longreach Solar Farm (15MW) Canadian Solar Generation Northern Queensland 50 30 Announced 2017/18 2018/19 15 15
Mackay Substation Rebuild and Nebo Primary Plant Replacement Qld Government Distribution/ Supply Bowen 60 54 Under
Construction 2015/16 2018/19 8 26 11
Moura and Callide A Switchyard Replacement Qld Government Distribution/ Supply Bowen 59 59 Under
Construction 2016/17 2018/19 11 27 22
Stanwell Power Station Works Qld Government Generation Gladstone 206 187 Under Construction 2015/16 2018/19 48 92 8
Tarong and Tarong North Power Station Works Qld Government Generation South East Queensland 125 125 Under
Construction 2015/16 2018/19 18 55 13
Callide Power Station Works Qld Government Generation Gladstone 300 280 Under Construction 2013/14 2017/18 168 44
Substation Upgrades at Various SEQ Locations Qld Government Distribution/ Supply
South East Queensland 203 150 Under
Construction 2013/14 2018/19 35 35 35
SunCoast Powerline Project - Palmwoods to Maroochydore Qld Government Distribution/ Supply
South East Queensland 80 69 Under
Construction 2015/16 2018/19 5 53 9
Kingston to Jimboomba Network Upgrade Qld Government Distribution/ Supply
South East Queensland 58 31 Under
Construction 2015/16 2016/17 12
Galilee Basin Transmission Project Adani Distribution/ Supply Galilee Basin 300 200 Unlikely >2020/21 50 100 50
ELECTRICITY MAJOR PROJECTS Work Done 364 952 777 576 530Funded 364 792 427 100 0Not Funded 0 160 350 476 530
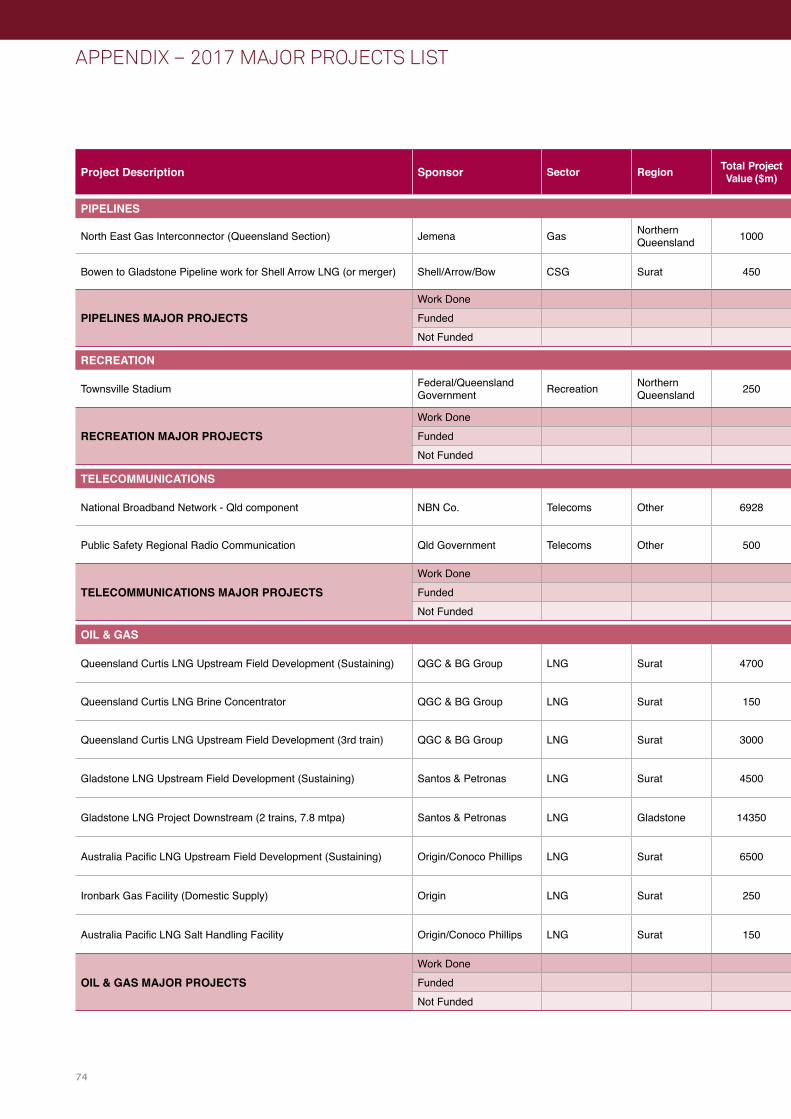
74
APPENDIX – 2017 MAJOR PROJECTS LIST
Project Description Sponsor Sector Region Total Project Value ($m)
Engineering Value ($m)
Project Status
Commencement Date
Completion Date
2016/17 ($m)
2017/18 ($m)
2018/19 ($m)
2019/20 ($m)
2020/21 ($m)
PIPELINES
North East Gas Interconnector (Queensland Section) Jemena Gas Northern Queensland 1000 350 Under
Construction 2016/17 2018/19 70 180 100
Bowen to Gladstone Pipeline work for Shell Arrow LNG (or merger) Shell/Arrow/Bow CSG Surat 450 360 Unlikely >2020/21
PIPELINES MAJOR PROJECTS Work Done 70 180 100 0 0Funded 70 180 100 0 0Not Funded 0 0 0 0 0
RECREATION
Townsville Stadium Federal/Queensland Government Recreation Northern
Queensland 250 220 Expected 2017/18 2019/20 60 120 40
RECREATION MAJOR PROJECTS Work Done 0 60 120 40 0Funded 0 60 120 40 0Not Funded 0 0 0 0 0
TELECOMMUNICATIONS
National Broadband Network - Qld component NBN Co. Telecoms Other 6928 4850 Under Construction 2010/11 >2020/21 793 848 830 453 400
Public Safety Regional Radio Communication Qld Government Telecoms Other 500 300 Announced 2018/19 2020/21 100 100 100
TELECOMMUNICATIONS MAJOR PROJECTS Work Done 793 848 930 553 500Funded 793 848 930 553 500Not Funded 0 0 0 0 0
OIL & GAS
Queensland Curtis LNG Upstream Field Development (Sustaining) QGC & BG Group LNG Surat 4700 3700 Under Construction 2009/10 >2019/20 450 400 400 400 400
Queensland Curtis LNG Brine Concentrator QGC & BG Group LNG Surat 150 150 Credibly Proposed 2017/18 2018/19 100 50
Queensland Curtis LNG Upstream Field Development (3rd train) QGC & BG Group LNG Surat 3000 2000 Unlikely >2020/21
Gladstone LNG Upstream Field Development (Sustaining) Santos & Petronas LNG Surat 4500 3600 Under Construction 2009/10 >2019/20 500 400 400 400 400
Gladstone LNG Project Downstream (2 trains, 7.8 mtpa) Santos & Petronas LNG Gladstone 14350 7500 Under Construction 2009/10 2015/16
Australia Pacific LNG Upstream Field Development (Sustaining) Origin/Conoco Phillips LNG Surat 6500 5200 Under Construction 2009/10 >2019/20 450 450 450 450 450
Ironbark Gas Facility (Domestic Supply) Origin LNG Surat 250 250 Prospective 2015/16 2017/18 140
Australia Pacific LNG Salt Handling Facility Origin/Conoco Phillips LNG Surat 150 150 Announced 2017/18 2018/19 50 100
OIL & GAS MAJOR PROJECTS Work Done 1400 1400 1400 1250 1390Funded 1400 1300 1350 1250 1250Not Funded 0 100 50 0 140

752017 MAJOR PROJECTS PIPELINE REPORT – QUEENSLAND ENGINEERING CONSTRUCTION OUTLOOK
Project Description Sponsor Sector Region Total Project Value ($m)
Engineering Value ($m)
Project Status
Commencement Date
Completion Date
2016/17 ($m)
2017/18 ($m)
2018/19 ($m)
2019/20 ($m)
2020/21 ($m)
PIPELINES
North East Gas Interconnector (Queensland Section) Jemena Gas Northern Queensland 1000 350 Under
Construction 2016/17 2018/19 70 180 100
Bowen to Gladstone Pipeline work for Shell Arrow LNG (or merger) Shell/Arrow/Bow CSG Surat 450 360 Unlikely >2020/21
PIPELINES MAJOR PROJECTS Work Done 70 180 100 0 0Funded 70 180 100 0 0Not Funded 0 0 0 0 0
RECREATION
Townsville Stadium Federal/Queensland Government Recreation Northern
Queensland 250 220 Expected 2017/18 2019/20 60 120 40
RECREATION MAJOR PROJECTS Work Done 0 60 120 40 0Funded 0 60 120 40 0Not Funded 0 0 0 0 0
TELECOMMUNICATIONS
National Broadband Network - Qld component NBN Co. Telecoms Other 6928 4850 Under Construction 2010/11 >2020/21 793 848 830 453 400
Public Safety Regional Radio Communication Qld Government Telecoms Other 500 300 Announced 2018/19 2020/21 100 100 100
TELECOMMUNICATIONS MAJOR PROJECTS Work Done 793 848 930 553 500Funded 793 848 930 553 500Not Funded 0 0 0 0 0
OIL & GAS
Queensland Curtis LNG Upstream Field Development (Sustaining) QGC & BG Group LNG Surat 4700 3700 Under Construction 2009/10 >2019/20 450 400 400 400 400
Queensland Curtis LNG Brine Concentrator QGC & BG Group LNG Surat 150 150 Credibly Proposed 2017/18 2018/19 100 50
Queensland Curtis LNG Upstream Field Development (3rd train) QGC & BG Group LNG Surat 3000 2000 Unlikely >2020/21
Gladstone LNG Upstream Field Development (Sustaining) Santos & Petronas LNG Surat 4500 3600 Under Construction 2009/10 >2019/20 500 400 400 400 400
Gladstone LNG Project Downstream (2 trains, 7.8 mtpa) Santos & Petronas LNG Gladstone 14350 7500 Under Construction 2009/10 2015/16
Australia Pacific LNG Upstream Field Development (Sustaining) Origin/Conoco Phillips LNG Surat 6500 5200 Under Construction 2009/10 >2019/20 450 450 450 450 450
Ironbark Gas Facility (Domestic Supply) Origin LNG Surat 250 250 Prospective 2015/16 2017/18 140
Australia Pacific LNG Salt Handling Facility Origin/Conoco Phillips LNG Surat 150 150 Announced 2017/18 2018/19 50 100
OIL & GAS MAJOR PROJECTS Work Done 1400 1400 1400 1250 1390Funded 1400 1300 1350 1250 1250Not Funded 0 100 50 0 140
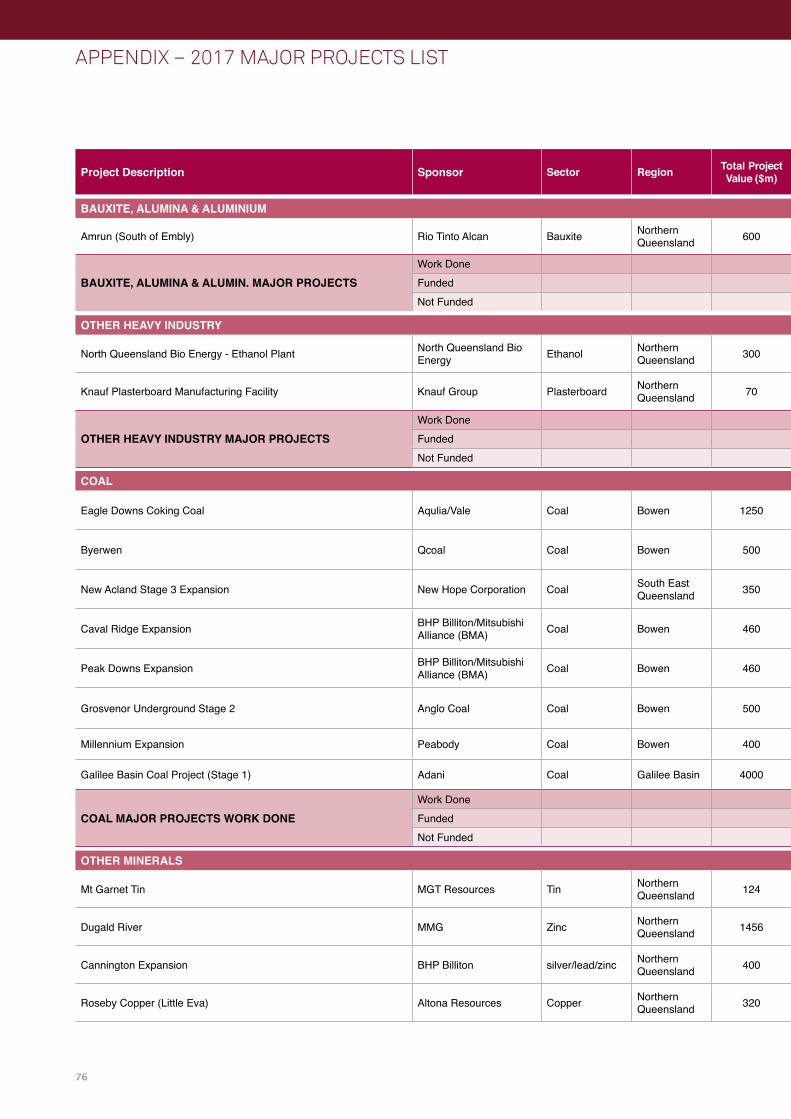
76
APPENDIX – 2017 MAJOR PROJECTS LIST
Project Description Sponsor Sector Region Total Project Value ($m)
Engineering Value ($m)
Project Status
Commencement Date
Completion Date
2016/17 ($m)
2017/18 ($m)
2018/19 ($m)
2019/20 ($m)
2020/21 ($m)
BAUXITE, ALUMINA & ALUMINIUM
Amrun (South of Embly) Rio Tinto Alcan Bauxite Northern Queensland 600 360 Under
Construction 2015/16 2017/18 120 140 50
BAUXITE, ALUMINA & ALUMIN. MAJOR PROJECTS Work Done 120 140 50 0 0Funded 120 140 50 0 0Not Funded 0 0 0 0 0
OTHER HEAVY INDUSTRY
North Queensland Bio Energy - Ethanol Plant North Queensland Bio Energy Ethanol Northern
Queensland 300 200 Credibly Proposed 2018/19 2020/21 75 75 50
Knauf Plasterboard Manufacturing Facility Knauf Group Plasterboard Northern Queensland 70 35 Announced 2016/17 2017/18 18 18
OTHER HEAVY INDUSTRY MAJOR PROJECTSWork Done 18 93 75 50 0Funded 18 18 0 0 0Not Funded 0 75 75 50 0
COAL
Eagle Downs Coking Coal Aqulia/Vale Coal Bowen 1250 813 Credibly Proposed 2017/18 2020/21 35 158 228 270
Byerwen Qcoal Coal Bowen 500 360 Credibly Proposed 2017/18 2019/20 56 120 120 64
New Acland Stage 3 Expansion New Hope Corporation Coal South East Queensland 350 200 Credibly
Proposed 2016/17 2018/19 60 90 50
Caval Ridge Expansion BHP Billiton/Mitsubishi Alliance (BMA) Coal Bowen 460 345 Credibly
Proposed 2020/21 2022/23 80
Peak Downs Expansion BHP Billiton/Mitsubishi Alliance (BMA) Coal Bowen 460 345 Credibly
Proposed 2020/21 2022/23 80
Grosvenor Underground Stage 2 Anglo Coal Coal Bowen 500 350 Credibly Proposed 2020/21 2021/22 70
Millennium Expansion Peabody Coal Bowen 400 320 Unlikely 2020/21 2021/22 40
Galilee Basin Coal Project (Stage 1) Adani Coal Galilee Basin 4000 3500 Unlikely >2019/20 250 750 1000
COAL MAJOR PROJECTS WORK DONEWork Done 91 338 768 1134 1190Funded 0 0 0 0 0Not Funded 91 338 768 1134 1190
OTHER MINERALS
Mt Garnet Tin MGT Resources Tin Northern Queensland 124 50 Credibly
Proposed 2015/16 2016/17 9.6 40
Dugald River MMG Zinc Northern Queensland 1456 728 Under
Construction 2017/18 2020/21 100 250 200
Cannington Expansion BHP Billiton silver/lead/zinc Northern Queensland 400 120 Prospective 2016/17 2018/19 20 90
Roseby Copper (Little Eva) Altona Resources Copper Northern Queensland 320 96 Credibly
Proposed 2017/18 2019/20 21 45 30

772017 MAJOR PROJECTS PIPELINE REPORT – QUEENSLAND ENGINEERING CONSTRUCTION OUTLOOK
Project Description Sponsor Sector Region Total Project Value ($m)
Engineering Value ($m)
Project Status
Commencement Date
Completion Date
2016/17 ($m)
2017/18 ($m)
2018/19 ($m)
2019/20 ($m)
2020/21 ($m)
BAUXITE, ALUMINA & ALUMINIUM
Amrun (South of Embly) Rio Tinto Alcan Bauxite Northern Queensland 600 360 Under
Construction 2015/16 2017/18 120 140 50
BAUXITE, ALUMINA & ALUMIN. MAJOR PROJECTS Work Done 120 140 50 0 0Funded 120 140 50 0 0Not Funded 0 0 0 0 0
OTHER HEAVY INDUSTRY
North Queensland Bio Energy - Ethanol Plant North Queensland Bio Energy Ethanol Northern
Queensland 300 200 Credibly Proposed 2018/19 2020/21 75 75 50
Knauf Plasterboard Manufacturing Facility Knauf Group Plasterboard Northern Queensland 70 35 Announced 2016/17 2017/18 18 18
OTHER HEAVY INDUSTRY MAJOR PROJECTSWork Done 18 93 75 50 0Funded 18 18 0 0 0Not Funded 0 75 75 50 0
COAL
Eagle Downs Coking Coal Aqulia/Vale Coal Bowen 1250 813 Credibly Proposed 2017/18 2020/21 35 158 228 270
Byerwen Qcoal Coal Bowen 500 360 Credibly Proposed 2017/18 2019/20 56 120 120 64
New Acland Stage 3 Expansion New Hope Corporation Coal South East Queensland 350 200 Credibly
Proposed 2016/17 2018/19 60 90 50
Caval Ridge Expansion BHP Billiton/Mitsubishi Alliance (BMA) Coal Bowen 460 345 Credibly
Proposed 2020/21 2022/23 80
Peak Downs Expansion BHP Billiton/Mitsubishi Alliance (BMA) Coal Bowen 460 345 Credibly
Proposed 2020/21 2022/23 80
Grosvenor Underground Stage 2 Anglo Coal Coal Bowen 500 350 Credibly Proposed 2020/21 2021/22 70
Millennium Expansion Peabody Coal Bowen 400 320 Unlikely 2020/21 2021/22 40
Galilee Basin Coal Project (Stage 1) Adani Coal Galilee Basin 4000 3500 Unlikely >2019/20 250 750 1000
COAL MAJOR PROJECTS WORK DONEWork Done 91 338 768 1134 1190Funded 0 0 0 0 0Not Funded 91 338 768 1134 1190
OTHER MINERALS
Mt Garnet Tin MGT Resources Tin Northern Queensland 124 50 Credibly
Proposed 2015/16 2016/17 9.6 40
Dugald River MMG Zinc Northern Queensland 1456 728 Under
Construction 2017/18 2020/21 100 250 200
Cannington Expansion BHP Billiton silver/lead/zinc Northern Queensland 400 120 Prospective 2016/17 2018/19 20 90
Roseby Copper (Little Eva) Altona Resources Copper Northern Queensland 320 96 Credibly
Proposed 2017/18 2019/20 21 45 30

78
APPENDIX – 2017 MAJOR PROJECTS LIST
Project Description Sponsor Sector Region Total Project Value ($m)
Engineering Value ($m)
Project Status
Commencement Date
Completion Date
2016/17 ($m)
2017/18 ($m)
2018/19 ($m)
2019/20 ($m)
2020/21 ($m)
Red Dome Mungana Mungana gold mines Gold Northern Queensland 330 215 Credibly
Proposed 2019/20 2021/22 65 85
Sarsfield open pit (At Ravenswood Mine) Resolute Mining Gold Northern Queensland 123 43 Prospective 8 35
East End No.5 Cement Australia Cement South East Queensland 80 24 Credibly
Proposed 2017/18 2018/19 12 12
Watershed Tungsten Vital Metals Tugsten Northern Queensland 172 60 Prospective 2019/20 2022/23 6 20
OTHER MINERALS MAJOR PROJECTSWork Done 100 283 267 169 230Funded 100 250 200 0 0Not Funded 0 33 67 169 230
TOTAL MAJOR PROJECTS
Work Done 4920.0 7435.0 8565.5 8622.3 9584.5
Funded 4824.9 6472.9 5280.3 2734.2 2096.3
Not Funded 95.1 962.1 3285.2 5888.1 7488.3

792017 MAJOR PROJECTS PIPELINE REPORT – QUEENSLAND ENGINEERING CONSTRUCTION OUTLOOK
Project Description Sponsor Sector Region Total Project Value ($m)
Engineering Value ($m)
Project Status
Commencement Date
Completion Date
2016/17 ($m)
2017/18 ($m)
2018/19 ($m)
2019/20 ($m)
2020/21 ($m)
Red Dome Mungana Mungana gold mines Gold Northern Queensland 330 215 Credibly
Proposed 2019/20 2021/22 65 85
Sarsfield open pit (At Ravenswood Mine) Resolute Mining Gold Northern Queensland 123 43 Prospective 8 35
East End No.5 Cement Australia Cement South East Queensland 80 24 Credibly
Proposed 2017/18 2018/19 12 12
Watershed Tungsten Vital Metals Tugsten Northern Queensland 172 60 Prospective 2019/20 2022/23 6 20
OTHER MINERALS MAJOR PROJECTSWork Done 100 283 267 169 230Funded 100 250 200 0 0Not Funded 0 33 67 169 230
TOTAL MAJOR PROJECTS
Work Done 4920.0 7435.0 8565.5 8622.3 9584.5
Funded 4824.9 6472.9 5280.3 2734.2 2096.3
Not Funded 95.1 962.1 3285.2 5888.1 7488.3

80
NOTES

812017 MAJOR PROJECTS PIPELINE REPORT – QUEENSLAND ENGINEERING CONSTRUCTION OUTLOOK