Embed Size (px)
Citation preview

2017 JP Morgan Automotive ConferenceAugust 8, 2017

This presentation contains forward-looking statements within the meaning of the Private Securities Litigation Reform Act of 1995, including, without limitation,
statements about the anticipated consequences and benefits of our recent acquisition of MPG, our financial and business outlook, and other information
relating to matters that are not historical facts. These forward-looking statements involve certain risks and uncertainties that could cause actual results to differ
materially from those expressed or implied by these statements. These risks and uncertainties include the ability to successfully operate and integrate MPG
operations and realize estimated synergies, and the other factors detailed in the reports we file with the SEC, including those described under “Risk Factors” in
our most recent Annual Report on Form 10-K and our Quarterly Reports on Form 10-Q. These forward-looking statements speak only as of the date of this
communication. We expressly disclaim any obligation or undertaking to disseminate any updates or revisions to any forward-looking statement contained
herein to reflect any change in our expectations with regard thereto or any change in events, conditions or circumstances on which any such statement is
based.
It should also be noted that this presentation contains certain financial measures, including Adjusted EBITDA, Adjusted Earnings per share, Adjusted free cash
flow, and Net Leverage Ratio that are not required by, or presented in accordance with, accounting principles generally accepted in the United States, or
GAAP. These measures are presented here to provide additional useful measurements to review our operations, provide transparency to investors and enable
period-to-period comparability of financial performance. A description of non-GAAP financial measures that we use to evaluate our operations and financial
performance, and reconciliation of these non-GAAP financial measures to the most directly comparable financial measures calculated and reported in
accordance with GAAP, can be found in the appendix under “Reconciliation of Non-GAAP Measures”.
Forward Looking Statements
2

• AAM’s 2Q 2017 Highlights and 2017 Full Year Financial Outlook
• Industry Trends and Technology Leadership
• Diversification and Value Creation
Agenda
3

AAM HIGHLIGHTS AND TARGETS

2Q 2017 AAM Highlights
* For definitions of terms, please see the attached appendix.
Non-GM Sales
exceed 50% of Revenue –
the First Time
in AAM History
Completion of MPG
Acquisition
on April 6, 2017
2Q FINANCIAL PERFORMANCE
Record
Quarterly
Sales
Strong Adj.
Free Cash
Flow*
$1.76B $326M18.5% of sales
$142M
Record
Quarterly
Adj. EBITDA*
5

Synergy Achievement Progress from MPG Acquisition
$0
$38
Run Rate – July 2017
Synergy Achievement Gauge(Annual Run Rate in millions)
$100 – $120
1Q 2019 Target
Sources of Cost SavingsTargeted Annual
Profit Impact
Overhead
Optimize operating structure
Elimination of redundant public company costs
≈ $45 - $50 million
Purchasing
Combine global purchasing to leverage larger scale
Direct and indirect material opportunities
Insourcing initiatives
≈ $45 - $50 million
Other Cost Savings
Manufacturing initiatives
Plant loading optimization / facility rationalization≈ $10 - $20 million
Total Targeted Annual Improvement ≈ $100-$120 million
AAM is on track to achieve synergy targets6
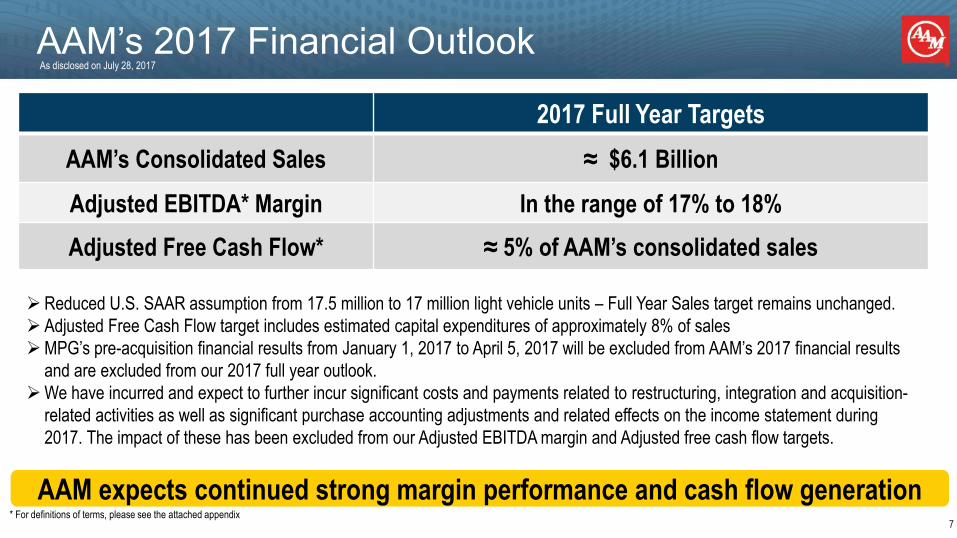
AAM’s 2017 Financial Outlook
2017 Full Year Targets
AAM’s Consolidated Sales ≈ $6.1 Billion
Adjusted EBITDA* Margin In the range of 17% to 18%
Adjusted Free Cash Flow* ≈ 5% of AAM’s consolidated sales
* For definitions of terms, please see the attached appendix
As disclosed on July 28, 2017
AAM expects continued strong margin performance and cash flow generation
Reduced U.S. SAAR assumption from 17.5 million to 17 million light vehicle units – Full Year Sales target remains unchanged.
Adjusted Free Cash Flow target includes estimated capital expenditures of approximately 8% of sales
MPG’s pre-acquisition financial results from January 1, 2017 to April 5, 2017 will be excluded from AAM’s 2017 financial results
and are excluded from our 2017 full year outlook.
We have incurred and expect to further incur significant costs and payments related to restructuring, integration and acquisition-
related activities as well as significant purchase accounting adjustments and related effects on the income statement during
2017. The impact of these has been excluded from our Adjusted EBITDA margin and Adjusted free cash flow targets.
7
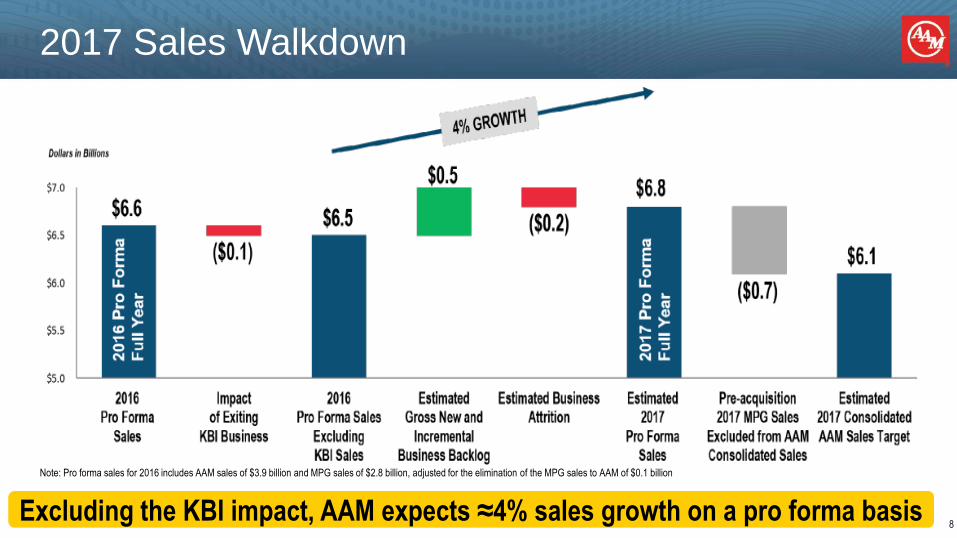
2017 Sales Walkdown
Excluding the KBI impact, AAM expects ≈4% sales growth on a pro forma basis
Note: Pro forma sales for 2016 includes AAM sales of $3.9 billion and MPG sales of $2.8 billion, adjusted for the elimination of the MPG sales to AAM of $0.1 billion
8

Revenue segment
North America full-size trucks and SUVs ≈50%
North America crossovers ≈15%
Global light vehicles ≈15%
Commercial vehicles and other ≈10%
North America passenger cars ≈10%
% of Pro Forma 2017
Estimated Sales
Vehicle Mix Sensitivity
• Year-over-year, full-size truck and SUV
mix increased in the first half of 2017
• Consumer demand for crossovers
continues to increase in North
America, Europe, and Asia
• Approximately 25% of AAM’s revenue
base relates to light vehicle markets
outside of North America or non-
automotive industries
Market Commentary
AAM’s product mix is well positioned against reductions in passenger car sales in the US 9

Superior Margin Performance
Adjusted EBITDA* Margin
• Advanced process technologies:
3D printing
Laser welding
State-of-the-art tooling
• Global operations committed to continuous
improvement, productivity initiatives, and
operational excellence
• Benefits from global restructuring actions
• Synergy attainment from acquisitions
• Strong product mix and new business backlog
* For definitions of terms, please see the attached appendix
**Mid point of the Adjusted EBITDA target used for charting purposes
2013 AAM 2014 AAM 2015 AAM 2016 AAM 2016 proforma
2017 -2019 AAM Target
13.2%
13.9%
14.6%
15.7%
16.6%
17%-18%**
Continued margin growth opportunities
10

INDUSTRY TRENDS AND TECHNOLOGY LEADERSHIP

Powertrain Projections
North America
0
5
10
15
Mill
ions
Greater China Europe
0
5
10
15
20
25
30
35
Mill
ions
0
5
10
15
20
25
Mill
ions
17M
32M 23MICE
ICE
ICE
IHS Production Forecasts as of August 2, 2017
0
20
40
60
80
100
Mill
ions
ICE
Global
101M
For at least the next decade, the internal combustion engine (ICE)
is expected to be the main source of power for vehicles 12

Projected Light Vehicle Production Mix IHS Forecasts as of August 2, 2017
37%
44%
48%
63%
56%
52%
2012 2016 2020
European Union
Vehicle mix is trending favorably for AAM in all of our key markets
42%
55%
60%58%
45%
40%
2012 2016 2020
China
55%
62%
67%
45%
38%33%
2012 2016 2020
North America
13

Driveline
Powertrain
Metal
Forming
Castings
Evolution of the Propulsion SystemExample: AAM Content Opportunity on an AWD Crossover
Hybrid with ICE Battery Electric (BEV)Internal Combustion Engine (ICE)
• Power transfer units and rear
drive modules featuring our
EcoTrac® Disconnecting AWD
system
• Actuators
• Power dense gears
• Shafts
• CVJ components
• Wheel spindles
• Clutch components
• CVT pulleys
• Chassis, steering and structural components
• eAAM electric front and rear
drive units
• E-torque vectoring and vehicle
level control applications
• Actuators
• Power transfer units and rear drive
modules featuring our EcoTrac®
Disconnecting AWD system or
eAAM hybrid drive unit
• Actuators
• Powdered metal connecting rods, gears and stators
• Clutch modules
• Differential assemblies
• Planetary gear systems
• Valve bodies
• Vibration control systems
• Balance shaft assemblies
• Shift actuators
• Power dense gears
• Shafts
• CVJ components
• Wheel spindles
• Clutch components
• CVT pulleys
• Chassis, steering and structural components
• Powdered metal gears and stators
• Clutch modules
• Differential assemblies
• Planetary gear systems
• Valve bodies
• Shift actuators
• eParking components
• Pump assemblies and e-auxiliary systems
• Power dense gears for edrive units
• Shafts
• CVJ components
• Wheel spindles
• Clutch components
• Chassis, steering and structural components
• Powdered metal connecting rods and gears
• Clutch modules
• Differential assemblies
• Planetary gear systems
• Valve bodies
• Vibration controls systems
• Balance shaft assemblies
• Shift actuators
• Ductile-ITE ™ steering knuckles and control arms
• Powertrain and turbocharger housings
• Brake caliper housings
• Ductile-ITE ™ steering knuckles and control arms
• Powertrain and turbocharger housings
• Brake caliper housings for electric braking
• Ductile-ITE ™ steering knuckles and control arm
• Electric powertrain housings
• Brake caliper housings for electric braking
14
AAM
Strength:

e-AAM™ Hybrid and Electric Driveline Systems
15
Power dense design allows for easy integration for
multiple vehicle platforms
Modular solutions for passenger cars / crossovers
Torque vectoring options provides maximum traction
and ride control
Improved fuel efficiency up to 30% and reduces CO2
emissions while enhancing vehicle performance and
drive quality
Electric Rear Drive Unit
KEY ATTRIBUTES
Our e-AAM driveline systems position AAM to benefit
from the global trend of electrification
An e-AAM program included in our new business backlog will launch in 2018

EcoTrac® Disconnecting AWD Systems
EcoTrac® Disconnecting PTU
Advanced mechatronics
(motors, actuators and
sensors) integrated within
mechanical technology
Disconnects at the power
transfer unit (PTU), causing the
driveshaft to stop spinning
Can automatically engage
when it senses AWD traction
requirement
Benefits:
Improved vehicle fuel economy
without sacrifice in AWD
functionality
Improved vehicle handling
and safety
Our Gen II design, which
begins production in 2018, will
reduce the parasitic loss
associated with traditional AWD
system by 90%
KEY ATTRIBUTES
AAM’s EcoTrac AWD systems utilize electronics and
connectivity to improve Fuel Economy, Safety, and Performance
2018 GMC Terrain AWD
16

EcoTrac Sales Growth
2013 2015 2017 2019
$55M
≈$700M54% CAGR
from 2013
to 2019!
$265M
≈$450M
Results of Innovation!17

QUANTUM™ Technology
Industry first technology along with a revolutionary design
Significant mass reduction (up to 35%)
In combination, additional efficiency and weight reduction can
deliver 1% to 1.5% improved vehicle fuel economy
Scalable across multiple applications— without loss of
performance or power
Streamlined manufacturing process for key driveline components.
KEY ATTRIBUTES
AAM’s QUANTUM technology features all-new, completely
redesigned family of lightweight axles and drive units
QUANTUMTM Rear AxleQUANTUMTM RFU w/ eLSD
18

Content Per Vehicle
Full Size Trucks and SUVs Crossovers and Passenger Cars e-AAM Driveline Systems
$700 - $2,400 $300 - $1,200 $500 - >$2,500
Content from other AAM business units offers up to an additional $400 per vehicle
Driveline Business Unit
Significant market and CPV growth opportunities19

DIVERSIFICATION AND VALUE CREATION

Comprehensive Solutions from Engine to Driveline
21
DRIVELINE
Rear and front axles
Rear drive modules
Power transfer units
Driveshafts
Transfer cases
Electric drive units
METAL FORMING
Ring / pinion gears
Axle / transmission shafts
Differential gears
Transmission gears
CVT components
Suspension components
Transmission module and
differential assemblies
Aluminum valve bodies
Vibration control systems
Connecting rods
VVT products
Axle carriers
Differential cases
Steering knuckles
Control arms
Turbo charger housings
Brackets
≈ $1.5 billion
≈ $3.7 billion
CASTING
POWERTRAIN
≈ $1.1 billion
≈ $800 million*Based on 2016 actual pro forma amounts before eliminations of intercompany sales of approximately $0.5 billion
Our diverse product portfolio and technologies provide continued growth and exciting cross-selling
opportunities

Accelerated Customer Diversification
GM45%
Ford8%
FCA11%
Other Top 15 Global OEMs
9%
Other 27%
AAM 2Q 2017 Sales By Customer
Rebalancing of customer concentrations benefitting AAM22

AAM’s Gross New and Incremental Business Backlog
$1.5 BILLION: 2017-2019Backlog by Global MarketBacklog by Vehicle Segment
As disclosed on May 5, 2017
Over 70% of new business backlog relates to Non-GM business23

Backlog and Impact of GM’s Sourcing Decision
24
Dollars in Millions
2017 2018 2019
$500 ($200)
$450 ($100-$200)*
$550
($175)
($275)
≈ $450 - $650*
2017-2019
AAM’s gross new
business backlog
Estimated sales
impact to AAM of
GM’s Next-Gen full-
size truck sourcing
Net impact for the
three year period of
2017 - 2019
Normal business
attrition
($100-$200)*
* Utilized the mid point for the range for charting purposes.
The chart above does not include an additional estimated sales impact of GM’s sourcing decision in 2020.
As disclosed on May 5, 2017
AAM’s new business backlog more than offsets attrition and the sales
impact of GM’s next generation full-size truck program sourcing 24

Capital Allocation Priorities
Debt Paydown
*For definitions of terms, please see the attached appendix
Maintain Appropriate Liquidity*
3.12
June 30, 2017 December 31, 2017 Target
Net Leverage Ratio*
X
X
June 30, 2017 December 31, 2019 target
Plan to Delever
• $1.45 billion at June 30, 2017
• Target >$1B going forward
Favorable Debt Maturities • Minimal through 2019
• $400mm of Senior Notes due in 2019
• After 2019, minimal maturities until 2021
• Flexible Prepayment Options for both Senior
Notes and Term Loan
Organic Growth
Capital Investment• Support $1.5 billion in new and
incremental business backlog
• Constant focus of quoting and
emerging opportunities on profitable
growth and diversification
Research and Development
• Product, process and systems
technology
• Leverage global engineering
capabilities
• Focused on the global automotive
megatrends of lightweighting, fuel
efficiency and electrification
OthersStrategic Initiatives
• Will analyze opportunities within our
current capital structure to:
• Diversify geographically
• Expand technology leadership
• Enhance profitability
Shareholder Friendly Actions
• Will balance among other capital
allocation priorities
25

Well Positioned for Potential Downside Scenario
Ad
just
ed E
BIT
DA
*
• Targeting Adjusted EBITDA
well above projected cash
requirements
• Variable cost structure
allows for flexibility during
periods of lower volumes
• Positioned to be cash
breakeven in a 25% - 30%
downturn scenario
26

Why AAM?
EXPERIENCED & CREDIBLE – A management team that consistently delivers results and has
demonstrated the ability to manage through the cyclicality of the industry
STRONG EXECUTION – World-class global manufacturing capabilities, operational
excellence, and synergy attainment activities leading to superior profit margins
FINANCIAL STRENGTH – Consistently generating strong operating profits and free cash flow
PROFITABLE GROWTH - Solid foundational business concentrated in the strongest
vehicle segments, complemented by new technologies driving future profitable growth
and diversification
DRIVING VALUE – Generating a highly attractive free cash flow yield while diversifying our
business on the strength of AAM’s technology leadership and strategic growth
Plus: Acquisition integration on track to maximize value27


SUPPLEMENTAL DATA

Reconciliation of Non-GAAP Measures
In addition to the results reported in accordance with accounting principles generally accepted in the United States of America (GAAP) included within this presentation, we have provided certain information, which includes non-GAAP financial measures. Such information is reconciled to its closest GAAP measure in accordance with Securities and Exchange Commission rules and is included in the following slides.
Certain of the forward-looking financial measures included in this presentation are provided on a non-GAAP basis. A reconciliation of non-GAAP forward-looking financial measures to the most directly comparable financial measures calculated and presented in accordance with GAAP is not practical given the difficulty of projecting event driven transactional and other non-core operating items, as well as purchase price adjustments and their related effects in any future period. The magnitude of these items, however, may be significant.
30

2017
Global Light Vehicle Production* ≈ 94.9M units
North American Light Vehicle Production* ≈ 17.4M units
Europe Light Vehicle Production* ≈ 22.1M units
China Light Vehicle Production* ≈ 27.6M units
Class 5-7 Commercial Vehicle Production** ≈ 244.5k units
Class 8 Commercial Vehicle Production** ≈ 245.5k units
Supplemental Data
31* IHS data as of 8.2.17
** ACT July 2017 N.A. Commercial Vehicle Outlook

Supplemental Data
2017 2016 2017 2016
Net income attributable to AAM 66.2$ 71.0$ 144.6$ 132.1$
Interest expense 56.9 23.4 82.4 47.0
Income tax expense 2.4 20.7 9.9 36.0
Depreciation and amortization 124.6 50.7 180.8 100.5
EBITDA 250.1$ 165.8$ 417.7$ 315.6$
Restructuring and acquisition-related costs 51.7 __ 67.7 __
Debt refinancing and redemption costs 2.7 __ 2.7 __
Non-recurring items:Acquisition-related fair value inventory
adjustment 24.9__
24.9__
Other (3.7) (1.0) (3.7) (1.0)
Adjusted EBITDA 325.7$ 164.8$ 509.3$ 314.6$
As % of net sales 18.5 % 16.1 % 18.1 % 15.8 %
June 30, June 30,
Three Months Ended Six Months Ended
EBITDA and Adjusted EBITDA Reconciliation
($ in millions)
32

2016 2015 2014 2013
Net income attributable to shareholder 240.7$ 235.6$ 143.0$ 94.5$
Interest expense 93.4 99.2 99.9 115.9
Income tax expense 58.3 37.1 33.7 (8.2)
Depreciation and amortization 201.8 198.4 199.9 177.0
EBITDA 594.2$ 570.3$ 476.5$ 379.2$
Restructuring and acquisition-related costs, debt
refinancing and redepemtion costs and non-recurring items 25.2 0.8 35.5 42.6
Adjusted EBITDA 619.4$ 571.1$ 512.0$ 421.8$
as % of net sales 15.7 % 14.6 % 13.9 % 13.2 %
($ in millions)
American Axle & Manufacturing Holdings, Inc.
Earnings before Interest, Income Taxes, Depreciation and Amortization (EBITDA) and Adjusted EBITDA
Supplemental Data
33

COMBINED
Net income attributable to shareholders 240.7$ 96.3$ 337.0$
Interest expense 93.4 103.5 196.9
Income tax expense 58.3 38.4 96.7
Depreciation and amortization 201.8 221.3 423.1
EBITDA 594.2$ 459.5$ 1,053.7$
Restructuring and acquisition-related costs, debt
refinancing and redemption costs and non-recurring items 25.2 24.7 49.9
Adjusted EBITDA 619.4$ 484.2$ 1,103.6$
as % of net sales 15.7 % 17.4 % 16.6 %
2016 Full Year Earnings before Interest, Income Taxes, Depreciation and Amortization (EBITDA) and Adjusted EBITDA Reconciliation Schedule
($ in millions)
AAM MPG
Supplemental Data
34

Supplemental Data
2017 2016 2017 2016
Net cash provided by operating activities 150.9$ 157.3$ 213.2$ 183.5$
Purchases of property, plant and equipment, net of proceeds from
sale of property, plant and equipment and government grants (103.0) (52.3) (137.1) (102.3)
Free cash flow 47.9 105.0 76.1 81.2
Cash payments for restructuring and acquisition-related costs 56.7 __ 66.2 __
Acquisition-related settlement of pre-existing accounts payable
balances with acquired entities 12.4__
35.2__
Interest payments upon the settlement of acquired company debt 24.6 __ 24.6 __
Adjusted free cash flow 141.6$ 105.0$ 202.1$ 81.2$
($ in millions)
Three Months Ended Six Months Ended
June 30, June 30,
Free Cash Flow and Adjusted Free Cash Flow Reconciliation
35

Supplemental Data
Trailing Twelve
Months Ended
September 30, December 31, March 31, June 30, June 30,
2016 2016 2017 2017 2017
Net income attributable to AAM 61.7$ 46.9$ 78.4$ 66.2$ 253.2$
Interest expense 23.2 23.2 25.5 56.9 128.8
Income tax expense 17.8 4.5 7.5 2.4 32.2
Depreciation and amortization 49.9 51.4 56.2 124.6 282.1
EBITDA 152.6$ 126.0$ 167.6$ 250.1$ 696.3$
Restructuring and acquisition-related costs 4.1 22.2 16.0 51.7 94.0
Debt refinancing and redemption costs __ __ __ 2.7 2.7
Non-recurring items:
Acquisition-related fair value inventory
adjustment__ __ __
24.9 24.9
Other __ __ __ (3.7) (3.7)
Adjusted EBITDA 156.7$ 148.2$ 183.6$ 325.7$ 814.2$
Pre-acquisition Adjusted EBITDA from acquired entities 380.2
Pro forma Adjusted EBITDA 1,194.4$
EBITDA and Adjusted EBITDA Reconciliation for the Trailing Twelve Months Ended June 30, 2017
($ in millions)
Quarter Ended
36

Supplemental Data
37
Trailing Twelve
Months Ended
June 30, 2017
Current portion of long-term debt 5.2$
Long-term debt, net 4,173.6
4,178.8
Less: Cash and cash equivalents 490.6
Net debt at end of period 3,688.2$
Pro forma Adjusted EBITDA 1,194.4$
Net Leverage Ratio 3.1
Net Debt and Net Leverage Ratio
($ in millions)

Definition of Non-GAAP Terms
38
EBITDA and Adjusted EBITDA
We define EBITDA to be earnings before interest expense, income taxes, depreciation and amortization. Adjusted EBITDA is defined as EBITDA excluding the impact of restructuring and acquisition-related costs, debt refinancing
and redemption costs, and non-recurring items. We believe that EBITDA and Adjusted EBITDA are meaningful measures of performance as they are commonly utilized by management and investors to analyze operating performance
and entity valuation. Our management, the investment community and the banking institutions routinely use EBITDA and Adjusted EBITDA, together with other measures, to measure our operating performance relative to other Tier
1 automotive suppliers. We also use Segment Adjusted EBITDA as the measure of earnings to assess the performance of each segment and determine the resources to be allocated to the segments. EBITDA and Adjusted EBITDA
should not be construed as income from operations, net income or cash flow from operating activities as determined under GAAP. Other companies may calculate EBITDA and Adjusted EBITDA differently.
Other Non-recurring Items
For the three and six months ended on June 30, 2017, other non-recurring items reflect the impact of a gain related to the change of our method of accounting for indirect inventory and the interest expense for the debt drawdown
period prior to acquisition funding requirement . For the three and six months ended on June 30, 2016, other non-recurring items reflect the impact of an investment gain related to the final distribution of the Reserve Yield Plus
Fund.
Adjusted Earnings per Share
We define Adjusted earnings per share to be diluted earnings per share excluding the impact of restructuring and acquisition-related costs, debt refinancing and redemption costs, and non-recurring items, including the tax effect
thereon. We believe Adjusted earnings per share is a meaningful measure as it is commonly utilized by management and investors in assessing ongoing financial performance that provides improved comparability between periods
through the exclusion of certain items that management believes are not indicative of core operating performance and which may obscure underlying business results and trends. Other companies may calculate Adjusted earnings per
share differently.
Free Cash Flow and Adjusted Free Cash Flow
We define free cash flow to be net cash provided by operating activities less capital expenditures net of proceeds from the sale of property, plant and equipment and government grants. Adjusted free cash flow is defined as free cash
flow excluding the impact of cash payments for restructuring and acquisition-related costs, settlements of pre-existing accounts payable balances with acquired entities, and interest payments upon the settlement of acquired
company debt. We believe free cash flow and Adjusted free cash flow are meaningful measures as they are commonly utilized by management and investors to assess our ability to generate cash flow from business operations to
repay debt and return capital to our stockholders. Free cash flow and Adjusted free cash flow are also key metrics used in our calculation of incentive compensation. Other companies may calculate free cash flow and Adjusted free
cash flow differently.
Net Debt and Net Leverage Ratio
We define net debt to be the current portion of long-term debt plus long-term debt, net less cash and cash equivalents. We define Net Leverage Ratio to be net debt divided by the trailing 12 months of pro forma Adjusted EBITDA.
Pro forma Adjusted EBITDA includes AAM's Adjusted EBITDA and the pre-acquisition EBITDA of acquired entities. We believe that Net Leverage Ratio is a meaningful measure of financial condition as it is commonly used by
management, investors and creditors to assess capital structure risk. Other companies may calculate Net Leverage Ratio differently.
Liquidity
We define Liquidity as cash on hand plus amounts available on our revolving credit facility and foreign credit facilities.
US SAAR
We define US SAAR as the seasonally adjusted annual rate of light vehicle sales in the United States


![[JP Morgan] Variance Swaps](https://img.pdfslide.us/doc/110x75/551e53714a795970108b4afb/jp-morgan-variance-swaps.jpg)