Embed Size (px)
Citation preview
2017 Half Year Results
John Dawson
Director, Investor Relations

3
Agenda for today
Introductions John Dawson
Highlights Warren East
Financial review Stephen Daintith
Reflections and outlook Warren East
4
Notices
Safety Safe
Harbour
Mobile
phones

Warren East
Chief Executive
6
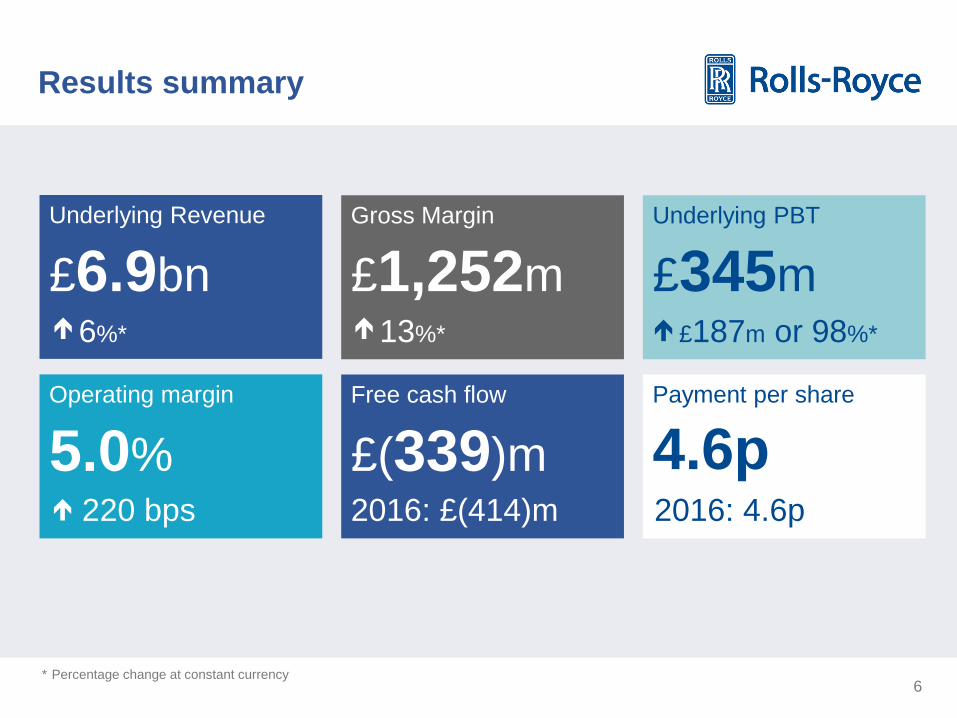
Underlying Revenue
£6.9bn
Results summary
Operating margin
Gross Margin Underlying PBT
£1,252m £345m
5.0%
6%*
Free cash flow
£(339)m 2016: £(414)m 220 bps
13%*
£187m or 98%*
Payment per share
4.6p 2016: 4.6p
* Percentage change at constant currency

First half overview
Highlights
+ Large engine deliveries up by 27%; production up 37%
+ Good further progress with Trent XWB OE economics
+ Strong first half for Power Systems
+ Transformation programme continues ahead of plan
+ Successful technology and engineering organisational changes
+ UltraFan® power gear box testing and Advance3 engine build
Challenges
- Marine markets remain challenging : restructuring proceeding well
- In-service issues for Civil Aerospace
8
H1 2017 invoiced deliveries to customer
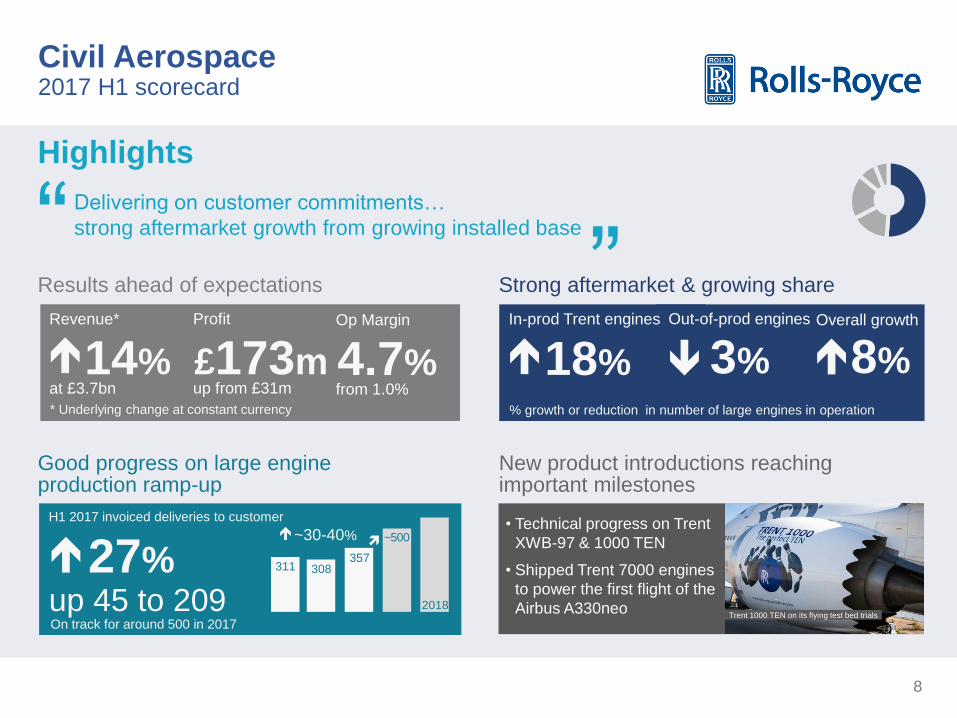
Civil Aerospace 2017 H1 scorecard
27% up 45 to 209
Good progress on large engine production ramp-up
~30-40%
18%
Strong aftermarket & growing share
Highlights
Delivering on customer commitments…
strong aftermarket growth from growing installed base
New product introductions reaching important milestones
• Technical progress on Trent
XWB-97 & 1000 TEN
• Shipped Trent 7000 engines
to power the first flight of the
Airbus A330neo
Revenue*
at £3.7bn
Profit
up from £31m
* Underlying change at constant currency
Results ahead of expectations
4.7%
Op Margin
from 1.0%
2018
308 357
311
~500
3%
“
“
% growth or reduction in number of large engines in operation
8% 14% £173m
In-prod Trent engines Out-of-prod engines Overall growth
On track for around 500 in 2017 Trent 1000 TEN on its flying test bed trials
9
H1 2017 delivery performance
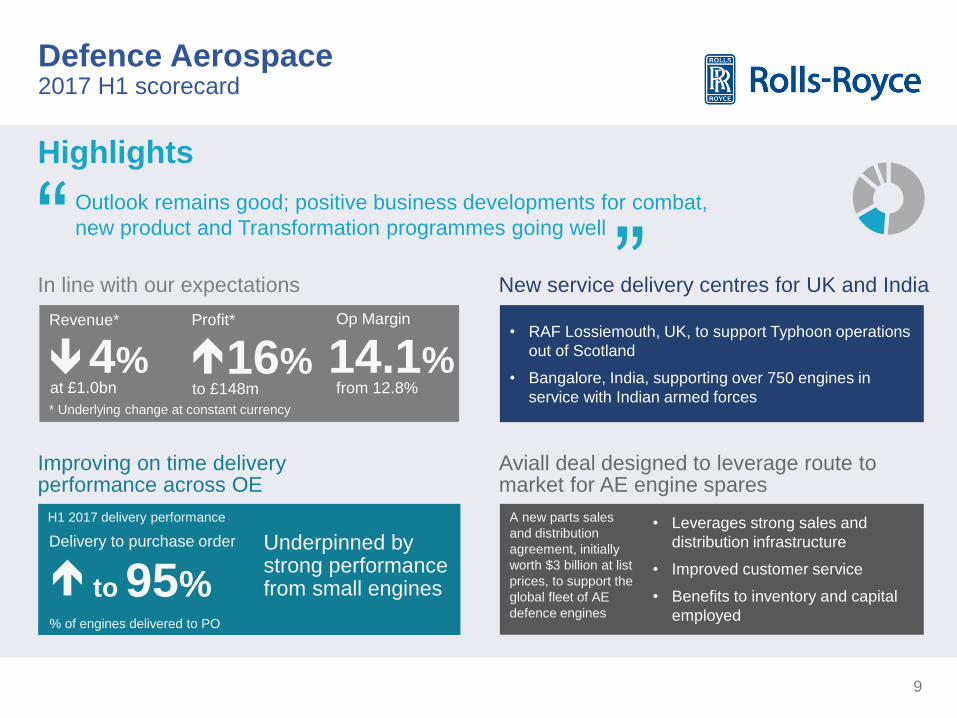
Defence Aerospace 2017 H1 scorecard
to 95% % of engines delivered to PO
• RAF Lossiemouth, UK, to support Typhoon operations
out of Scotland
• Bangalore, India, supporting over 750 engines in
service with Indian armed forces
A new parts sales
and distribution
agreement, initially
worth $3 billion at list
prices, to support the
global fleet of AE
defence engines
Revenue* Profit* Op Margin
* Underlying change at constant currency
Delivery to purchase order
at £1.0bn to £148m
14.1%
from 12.8%
4%
16%
• Leverages strong sales and
distribution infrastructure
• Improved customer service
• Benefits to inventory and capital
employed
Underpinned by strong performance from small engines
Improving on time delivery performance across OE
New service delivery centres for UK and India
Highlights
Outlook remains good; positive business developments for combat,
new product and Transformation programmes going well
Aviall deal designed to leverage route to market for AE engine spares
In line with our expectations
“
“
10
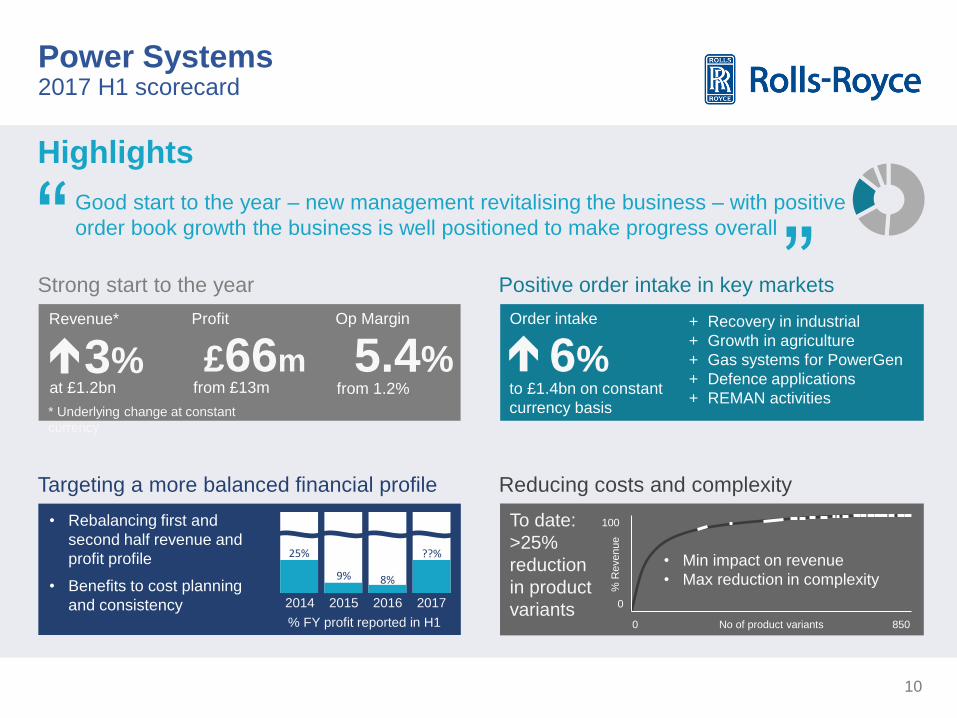
Power Systems 2017 H1 scorecard
• Rebalancing first and
second half revenue and
profit profile
• Benefits to cost planning
and consistency
Revenue* Profit Op Margin
* Underlying change at constant
currency
at £1.2bn from £13m
5.4%
from 1.2%
3% 6% £66m
+ Recovery in industrial
+ Growth in agriculture
+ Gas systems for PowerGen
+ Defence applications
+ REMAN activities
2014 2015 2016 2017
To date:
>25%
reduction
in product
variants 0 No of product variants 850
0
100
% R
evenue
• Min impact on revenue
• Max reduction in complexity
Targeting a more balanced financial profile
Positive order intake in key markets
Highlights
Good start to the year – new management revitalising the business – with positive
order book growth the business is well positioned to make progress overall
Reducing costs and complexity
Strong start to the year
“
“ 25%
9% 8%
??%
% FY profit reported in H1
to £1.4bn on constant
currency basis
Order intake
11
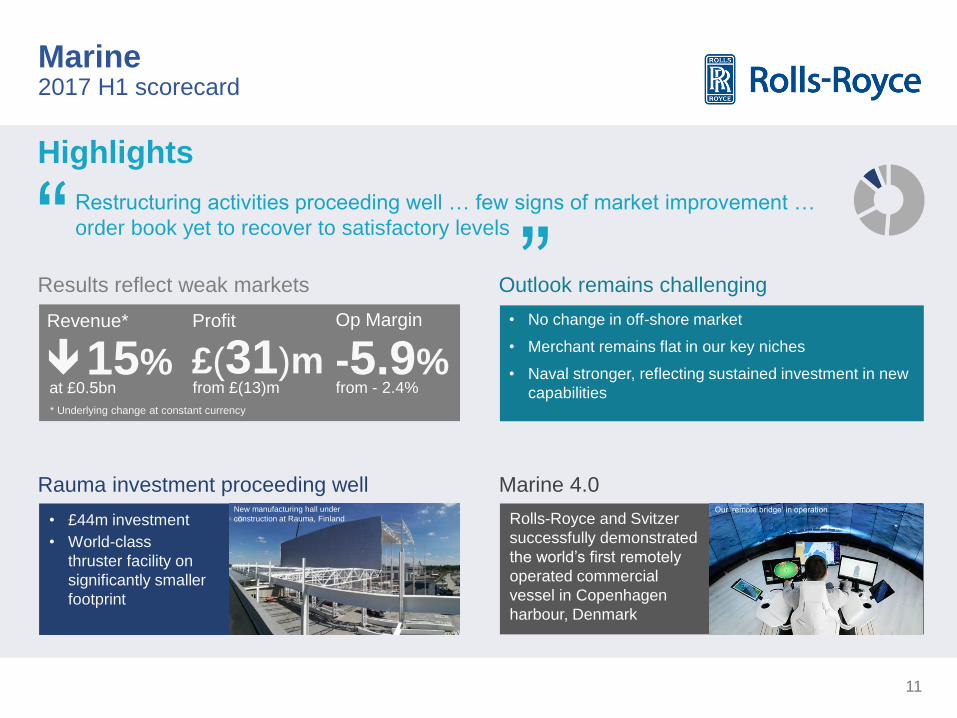
Marine 2017 H1 scorecard
Revenue* Profit Op Margin
* Underlying change at constant currency
at £0.5bn from £(13)m
-5.9%
from - 2.4% 15%
• £44m investment
• World-class
thruster facility on
significantly smaller
footprint
£(31)m
• No change in off-shore market
• Merchant remains flat in our key niches
• Naval stronger, reflecting sustained investment in new
capabilities
New manufacturing hall under
construction at Rauma, Finland
Rauma investment proceeding well
Outlook remains challenging
Highlights
Restructuring activities proceeding well … few signs of market improvement …
order book yet to recover to satisfactory levels
Results reflect weak markets
“
“
Rolls-Royce and Svitzer
successfully demonstrated
the world’s first remotely
operated commercial
vessel in Copenhagen
harbour, Denmark
Marine 4.0 Our ‘remote bridge’ in operation
12
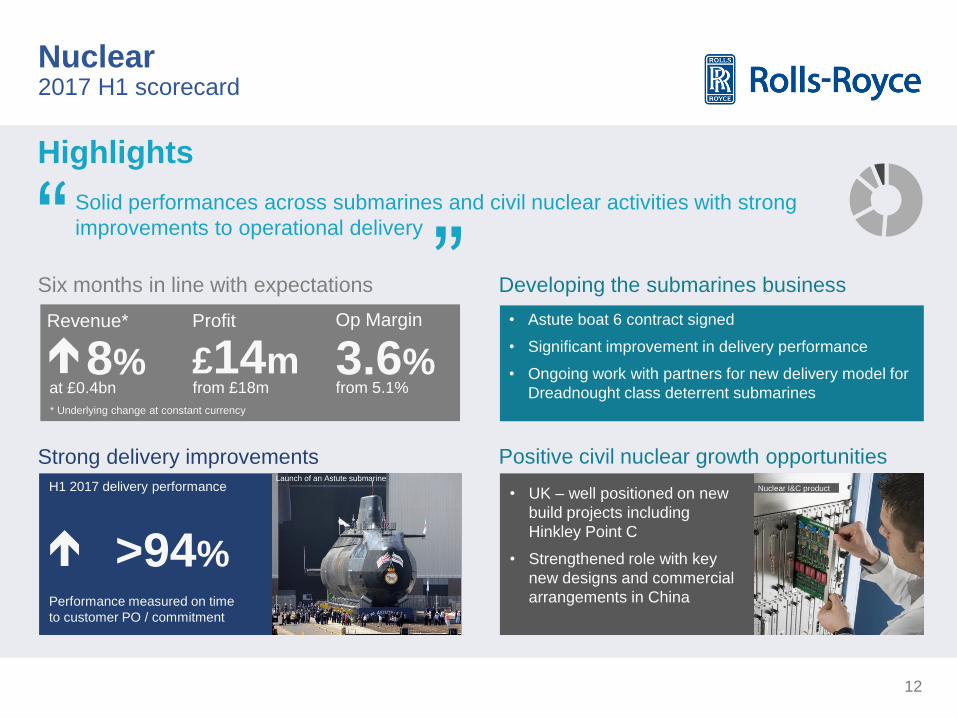
Nuclear 2017 H1 scorecard
Highlights
Solid performances across submarines and civil nuclear activities with strong
improvements to operational delivery
“
“ Revenue* Profit Op Margin
* Underlying change at constant currency
at £0.4bn from £18m
3.6%
from 5.1% 8% £14m
• Astute boat 6 contract signed
• Significant improvement in delivery performance
• Ongoing work with partners for new delivery model for
Dreadnought class deterrent submarines
Strong delivery improvements
Developing the submarines business Six months in line with expectations
>94%
H1 2017 delivery performance
Performance measured on time
to customer PO / commitment
• UK – well positioned on new
build projects including
Hinkley Point C
• Strengthened role with key
new designs and commercial
arrangements in China
Positive civil nuclear growth opportunities
Nuclear I&C product
Launch of an Astute submarine
13
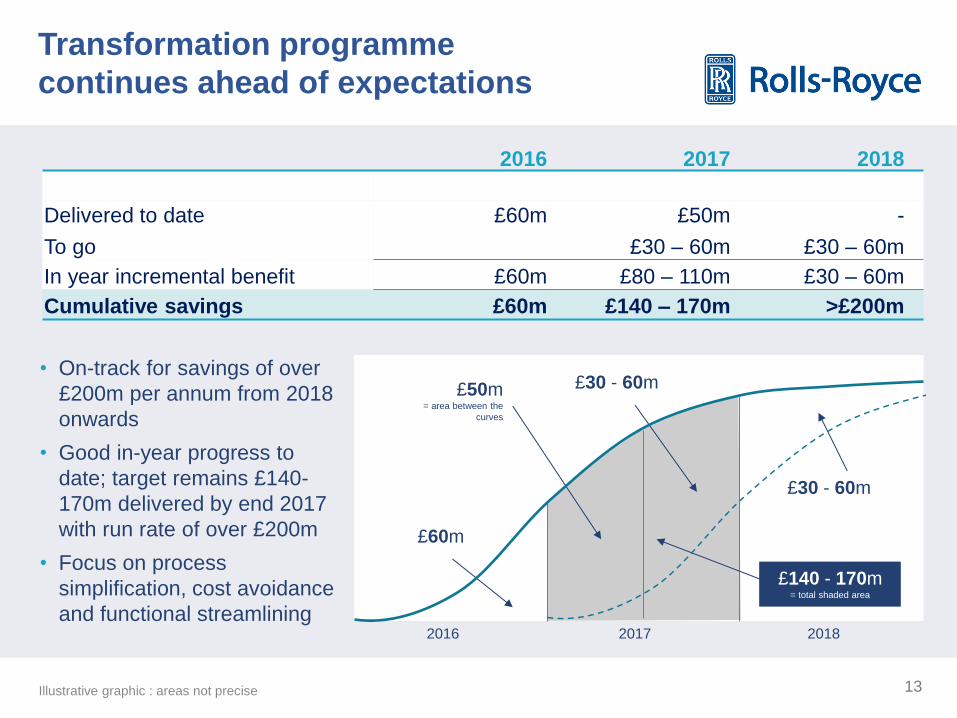
Transformation programme
continues ahead of expectations
2016 2017 2018
Delivered to date £60m £50m -
To go £30 – 60m £30 – 60m
In year incremental benefit £60m £80 – 110m £30 – 60m
Cumulative savings £60m £140 – 170m >£200m
• On-track for savings of over
£200m per annum from 2018
onwards
• Good in-year progress to
date; target remains £140-
170m delivered by end 2017
with run rate of over £200m
• Focus on process
simplification, cost avoidance
and functional streamlining
£60m
£50m = area between the
curves
£30 - 60m
£30 - 60m
2016 2017 2018
£140 - 170m = total shaded area
Illustrative graphic : areas not precise
14
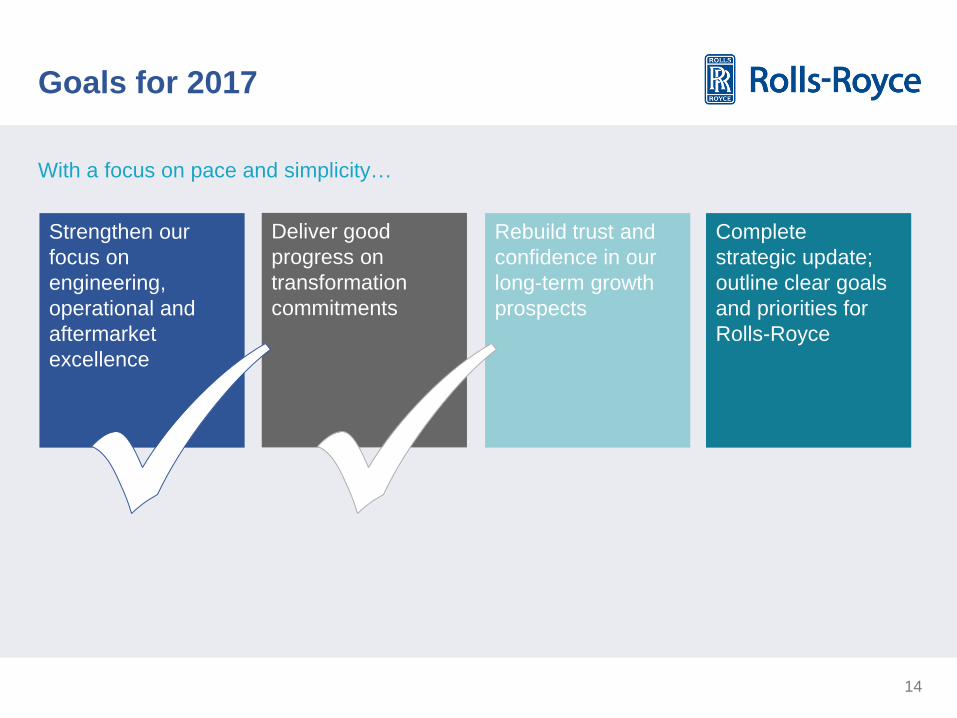
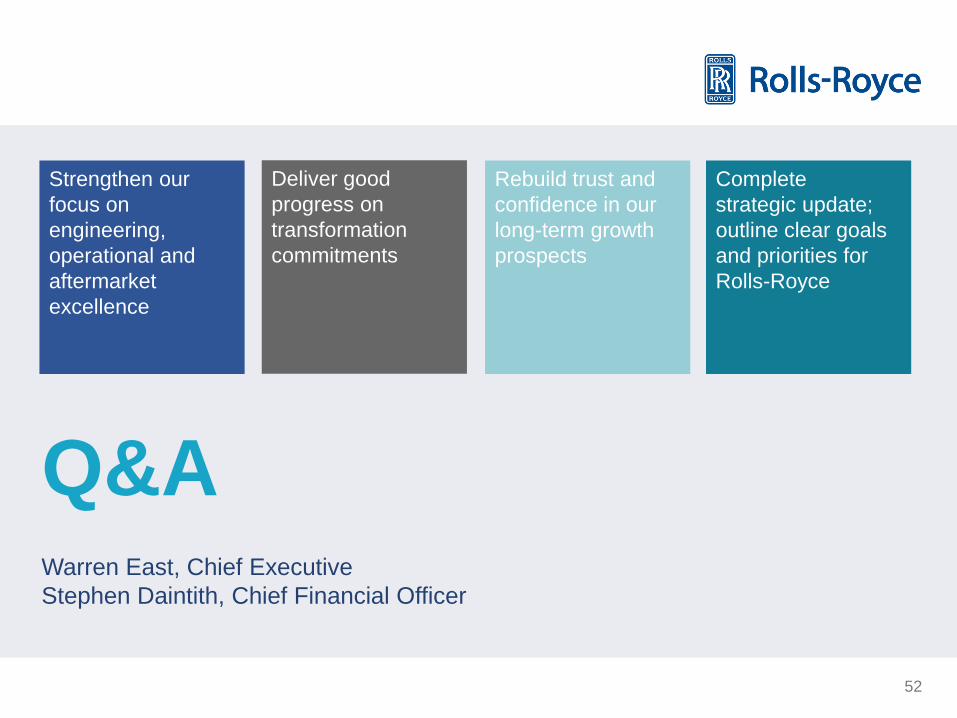
Goals for 2017
With a focus on pace and simplicity…
Strengthen our
focus on
engineering,
operational and
aftermarket
excellence
Deliver good
progress on
transformation
commitments
Rebuild trust and
confidence in our
long-term growth
prospects
Complete
strategic update;
outline clear goals
and priorities for
Rolls-Royce
Stephen Daintith
Chief Financial Officer
16
Agenda
Priorities
H1 Results
Accounting Changes
1
2
3
17
Agenda
Priorities 1
18
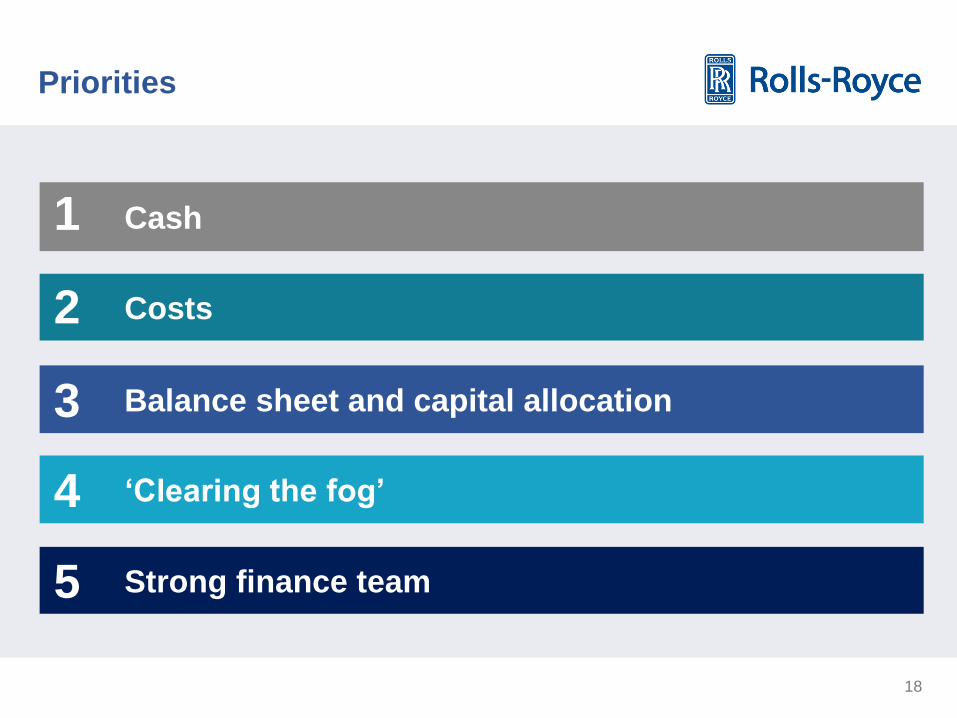
Priorities
‘Clearing the fog’
Cash
Balance sheet and capital allocation
Costs
Strong finance team
4
1
5
3
2
19
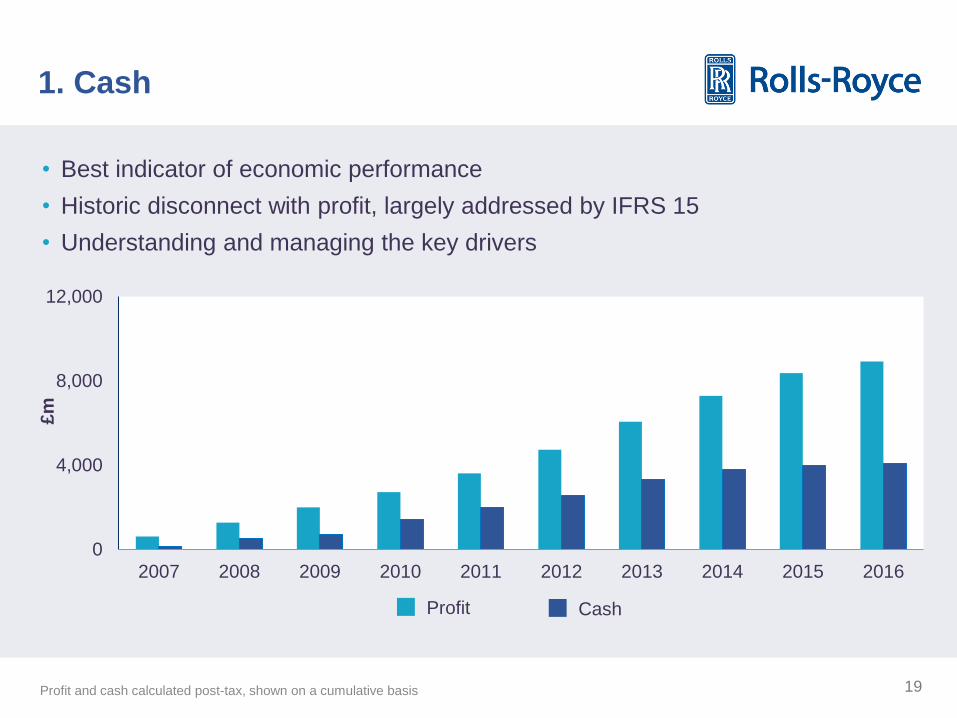
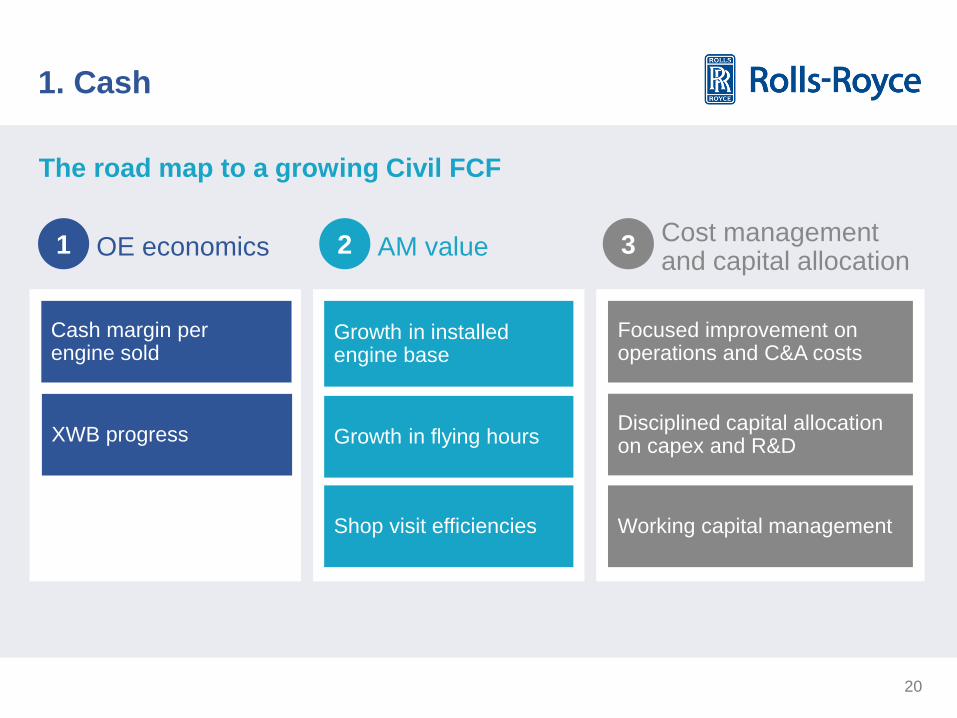
1. Cash
• Best indicator of economic performance
• Historic disconnect with profit, largely addressed by IFRS 15
• Understanding and managing the key drivers
0
4,000
8,000
12,000
2007 2008 2009 2010 2011 2012 2013 2014 2015 2016
Profit Cash
Profit and cash calculated post-tax, shown on a cumulative basis
£m
20
1. Cash
The road map to a growing Civil FCF
Growth in installed engine base
Growth in flying hours
Shop visit efficiencies
Focused improvement on operations and C&A costs
Disciplined capital allocation on capex and R&D
Working capital management
Cash margin per engine sold
OE economics 1 AM value 2 Cost management and capital allocation
3
XWB progress
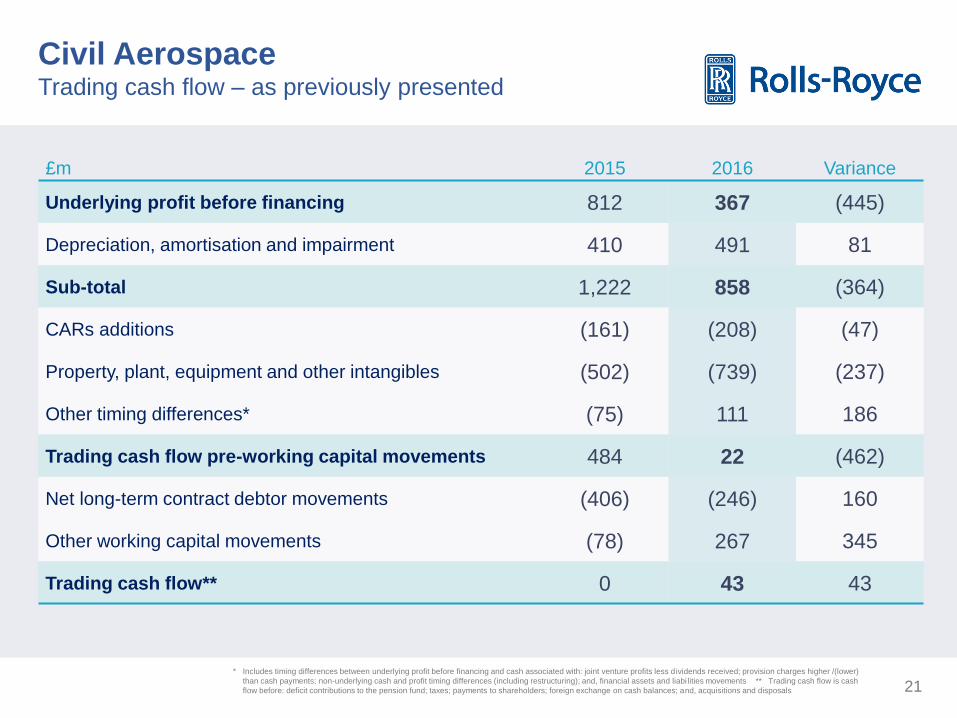
21
Civil Aerospace Trading cash flow – as previously presented
£m 2015 2016 Variance
Underlying profit before financing 812 367 (445)
Depreciation, amortisation and impairment 410 491 81
Sub-total 1,222 858 (364)
CARs additions (161) (208) (47)
Property, plant, equipment and other intangibles (502) (739) (237)
Other timing differences* (75) 111 186
Trading cash flow pre-working capital movements 484 22 (462)
Net long-term contract debtor movements (406) (246) 160
Other working capital movements (78) 267 345
Trading cash flow** 0 43 43
* Includes timing differences between underlying profit before financing and cash associated with: joint venture profits less dividends received; provision charges higher /(lower)
than cash payments; non-underlying cash and profit timing differences (including restructuring); and, financial assets and liabi lities movements ** Trading cash flow is cash
flow before: deficit contributions to the pension fund; taxes; payments to shareholders; foreign exchange on cash balances; and, acquisitions and disposals
22
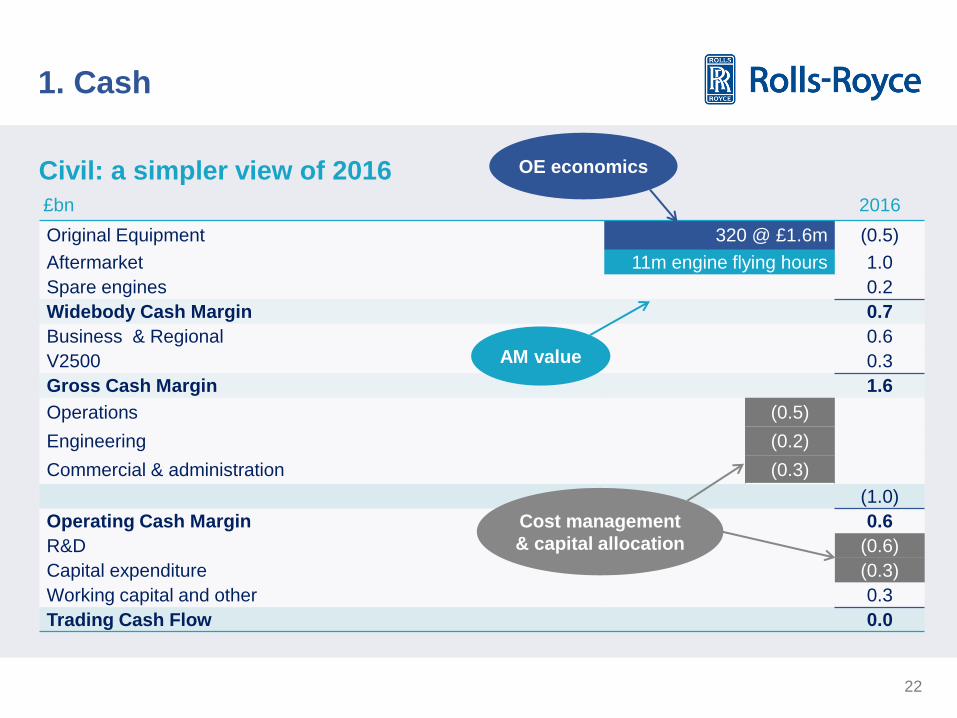
1. Cash
£bn 2016
Original Equipment 320 @ £1.6m (0.5)
Aftermarket 11m engine flying hours 1.0
Spare engines 0.2
Widebody Cash Margin 0.7
Business & Regional 0.6
V2500 0.3
Gross Cash Margin 1.6
Operations (0.5)
Engineering (0.2)
Commercial & administration (0.3)
(1.0)
Operating Cash Margin 0.6
R&D (0.6)
Capital expenditure (0.3)
Working capital and other 0.3
Trading Cash Flow 0.0
Civil: a simpler view of 2016 OE economics
AM value
Cost management
& capital allocation
23
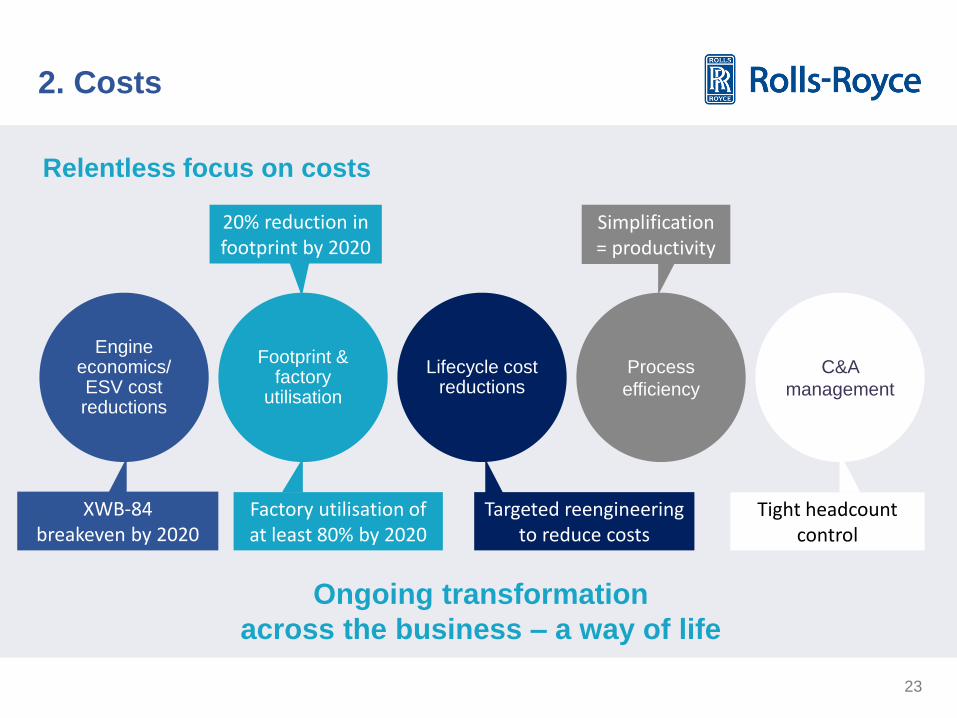
2. Costs
Relentless focus on costs
Engine economics/ ESV cost reductions
C&A
management
Footprint & factory
utilisation
Process
efficiency
Lifecycle cost reductions
Ongoing transformation
across the business – a way of life
XWB-84 breakeven by 2020
20% reduction in footprint by 2020
Factory utilisation of at least 80% by 2020
Targeted reengineering to reduce costs
Simplification = productivity
Tight headcount control
24
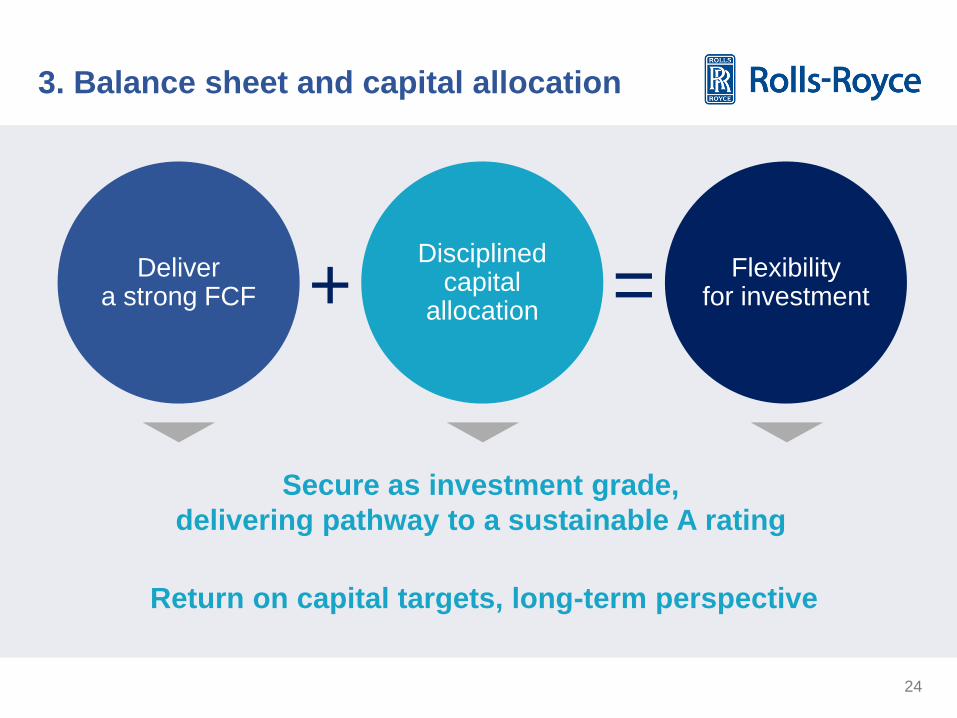
3. Balance sheet and capital allocation
Deliver a strong FCF +
Disciplined capital
allocation = Flexibility for investment
Secure as investment grade,
delivering pathway to a sustainable A rating
Return on capital targets, long-term perspective
25
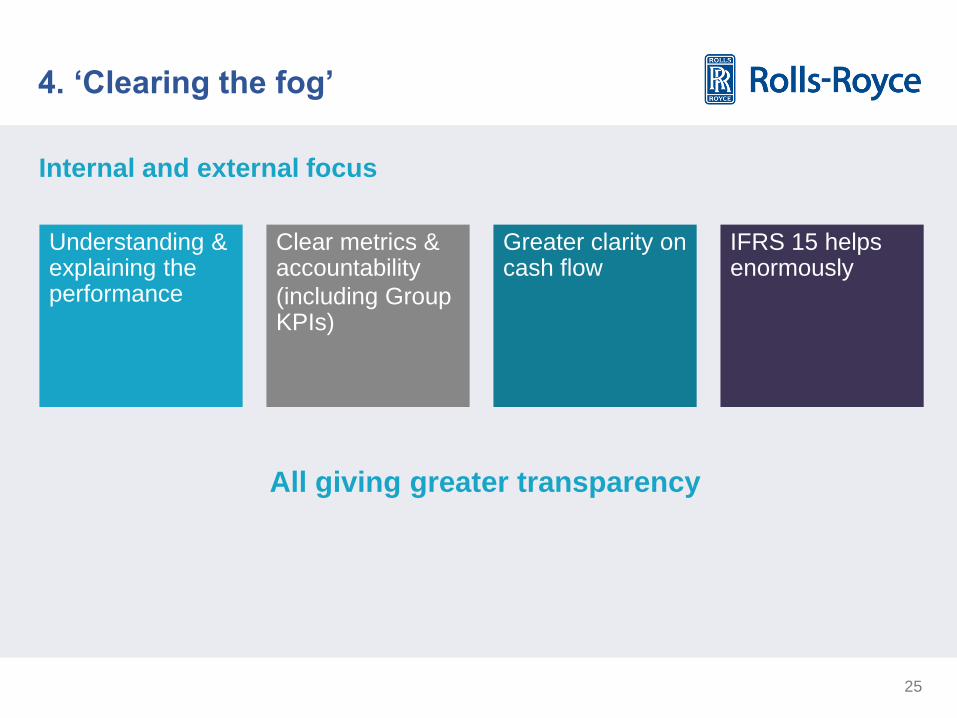
4. ‘Clearing the fog’
Understanding & explaining the performance
Greater clarity on cash flow
Clear metrics & accountability
(including Group KPIs)
IFRS 15 helps enormously
Internal and external focus
All giving greater transparency
26
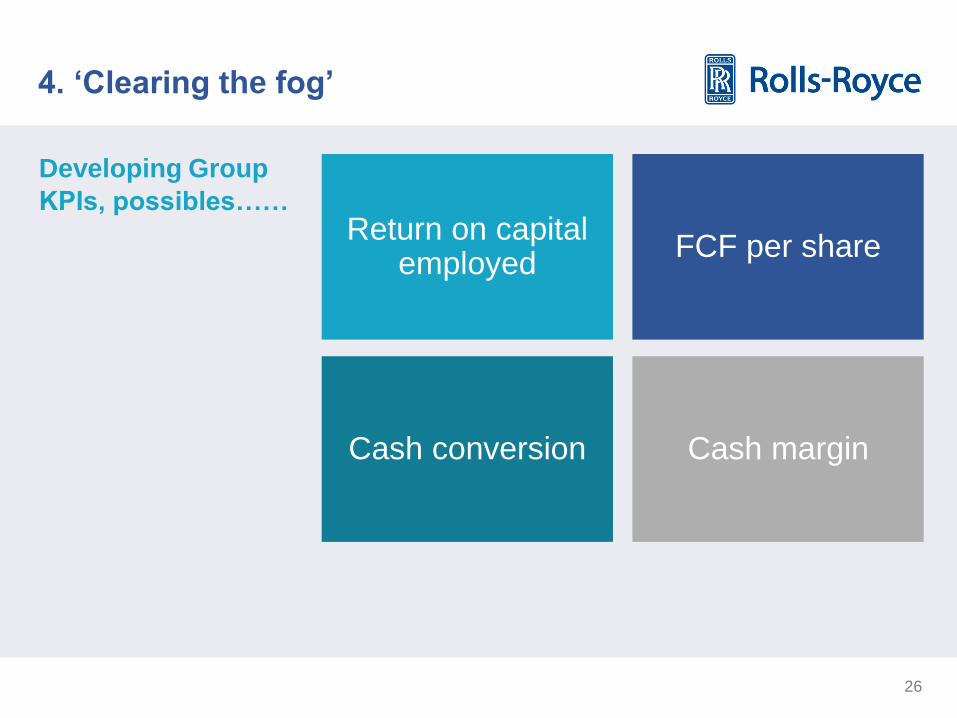
4. ‘Clearing the fog’
Return on capital employed
FCF per share
Cash conversion Cash margin
Developing Group KPIs, possibles……
27
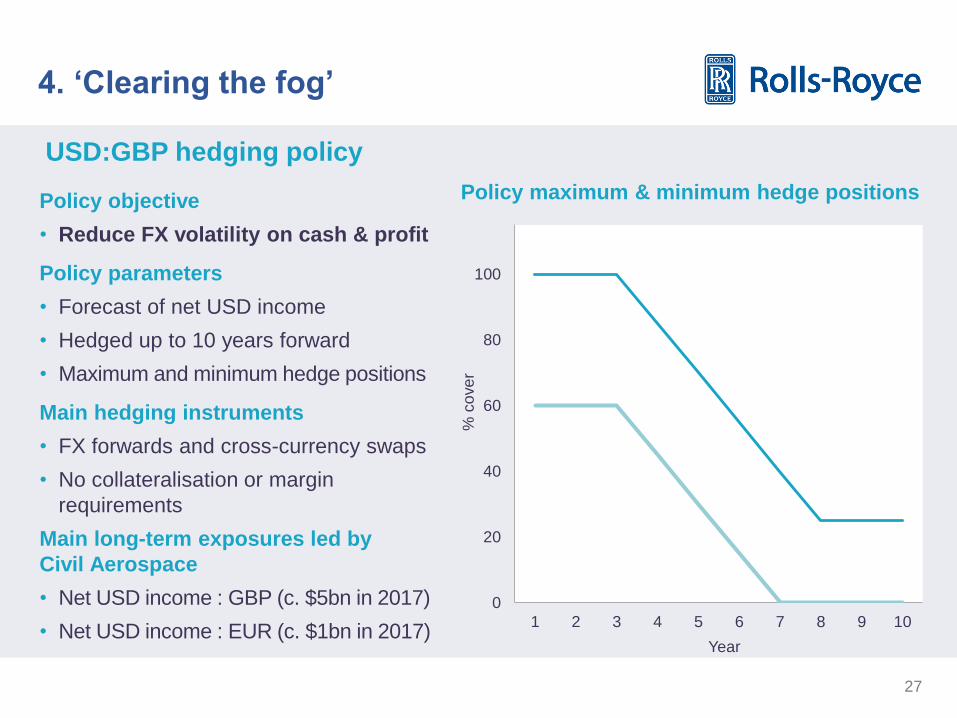
4. ‘Clearing the fog’
Policy objective
• Reduce FX volatility on cash & profit
Policy parameters
• Forecast of net USD income
• Hedged up to 10 years forward
• Maximum and minimum hedge positions
Main hedging instruments
• FX forwards and cross-currency swaps
• No collateralisation or margin
requirements
Main long-term exposures led by
Civil Aerospace
• Net USD income : GBP (c. $5bn in 2017)
• Net USD income : EUR (c. $1bn in 2017)
Policy maximum & minimum hedge positions
0
20
40
60
80
100
1 2 3 4 5 6 7 8 9 10
Year
% c
ove
r
USD:GBP hedging policy

28
4. ‘Clearing the fog’ %
co
ve
r o
f fo
reca
st U
S$
ne
t
inco
me
to
be
co
nve
rte
d
0
20
40
60
80
100
2017 2018 2019 2020 2021 2022 2023 2024 2025 2026 1.20
1.60
1.30
1.40
1.50
Unhedged Hedged Forward rate Achieved rate (current
view of potential range)
£/$
exch
an
ge
rate
USD hedge book: looking forward
29
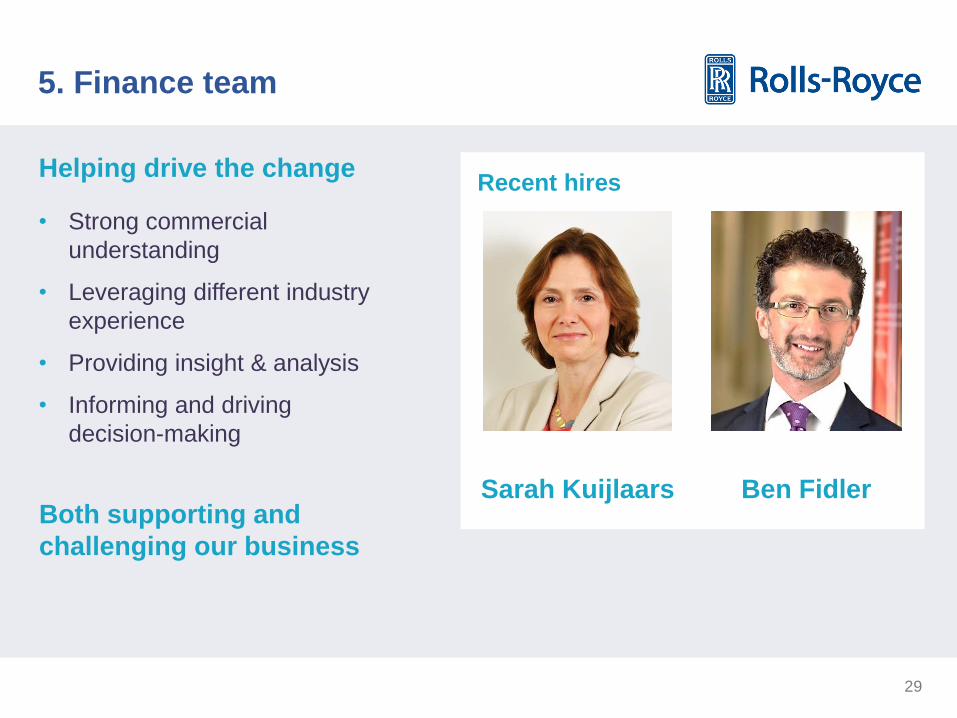
5. Finance team
• Strong commercial
understanding
• Leveraging different industry
experience
• Providing insight & analysis
• Informing and driving
decision-making
Sarah Kuijlaars Ben Fidler Both supporting and
challenging our business
Recent hires Helping drive the change
30
Agenda
HY Results 2
31
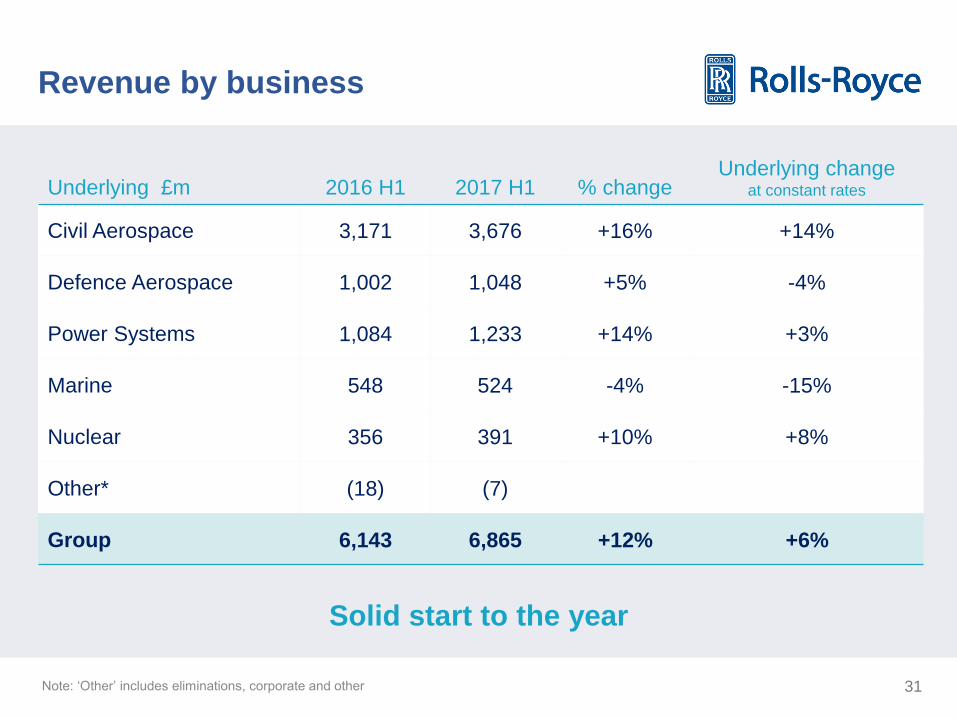
Revenue by business
Underlying £m 2016 H1 2017 H1 % change Underlying change
at constant rates
Civil Aerospace 3,171 3,676 +16% +14%
Defence Aerospace 1,002 1,048 +5% -4%
Power Systems 1,084 1,233 +14% +3%
Marine 548 524 -4% -15%
Nuclear 356 391 +10% +8%
Other* (18) (7)
Group 6,143 6,865 +12% +6%
Note: ‘Other’ includes eliminations, corporate and other
Solid start to the year
32
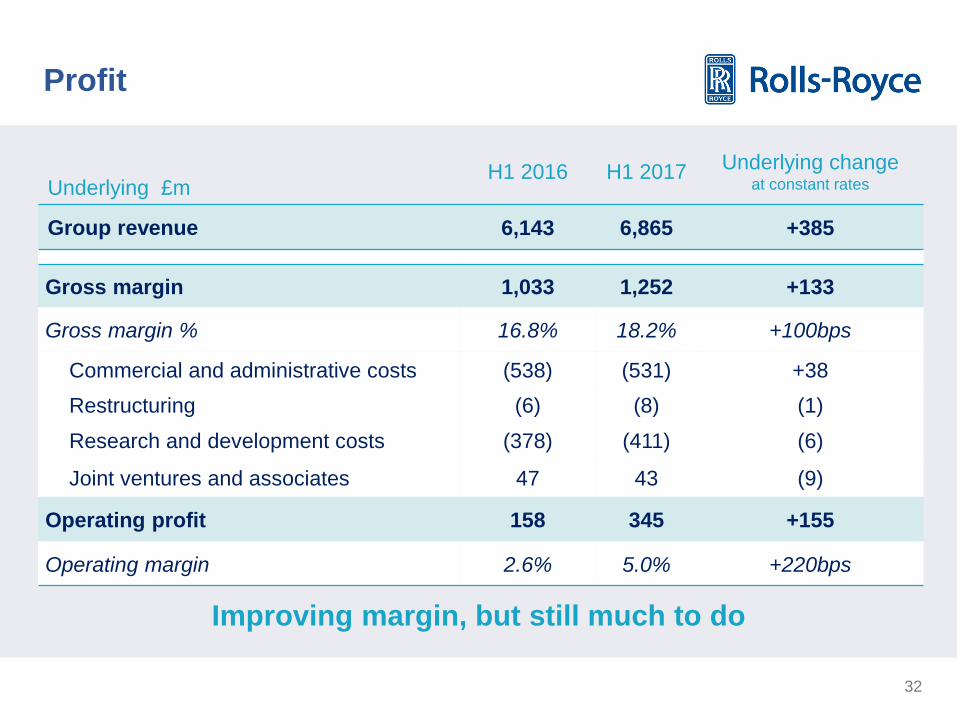
Profit
Underlying £m H1 2016 H1 2017 Underlying change
at constant rates
Group revenue 6,143 6,865 +385
Gross margin 1,033 1,252 +133
Gross margin % 16.8% 18.2% +100bps
Commercial and administrative costs (538) (531) +38
Restructuring (6) (8) (1)
Research and development costs (378) (411) (6)
Joint ventures and associates 47 43 (9)
Operating profit 158 345 +155
Operating margin 2.6% 5.0% +220bps
Improving margin, but still much to do
33
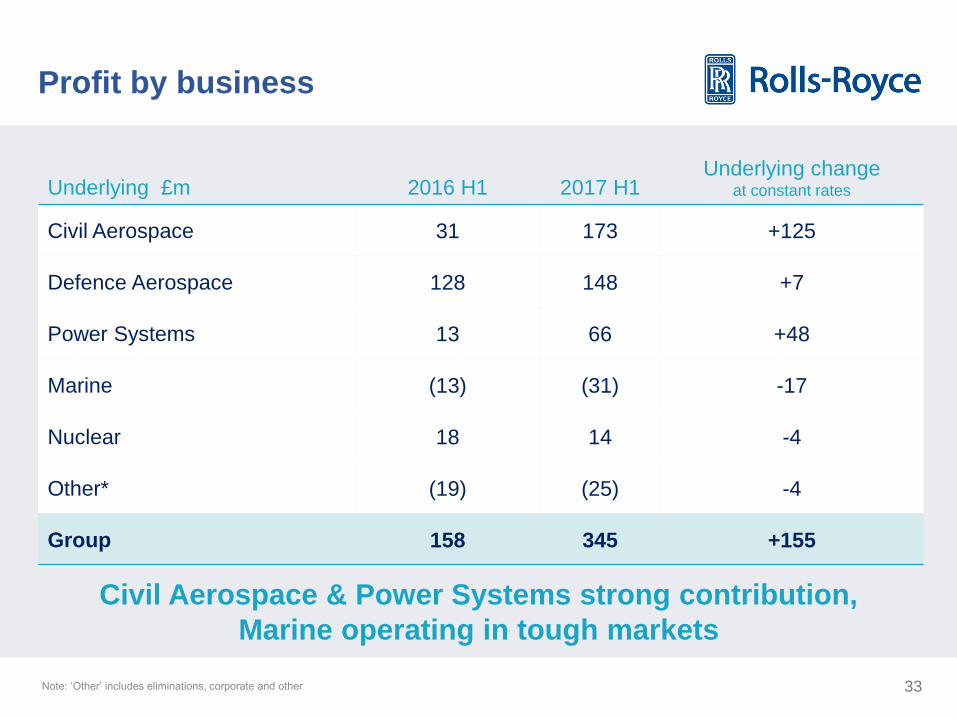
Profit by business
Underlying £m 2016 H1 2017 H1 Underlying change
at constant rates
Civil Aerospace 31 173 +125
Defence Aerospace 128 148 +7
Power Systems 13 66 +48
Marine (13) (31) -17
Nuclear 18 14 -4
Other* (19) (25) -4
Group 158 345 +155
Note: ‘Other’ includes eliminations, corporate and other
Civil Aerospace & Power Systems strong contribution,
Marine operating in tough markets
34
£m H1 2016 H1 2017 Change
Operating profit 158 345 +187
Net financing (54) (58) -4
Profit before tax 104 287 +183
Depreciation & amortisation 335 372 +37
Movement in net working capital (255) (110) +145
PPE, intangibles (539) (753) -214
Other 13 (52) -65
Trading cash flow (342) (256) +86
Pension and tax (72) (83) -11
Free cash flow* (414) (339) +75
Free cash flow
Steady operating performance,
effective working capital management
Note: Free cash outflow comparator for H1 2016 of £399m was restated to include
£15m of exceptional restructuring which had been excluded when reported in June 2016
35
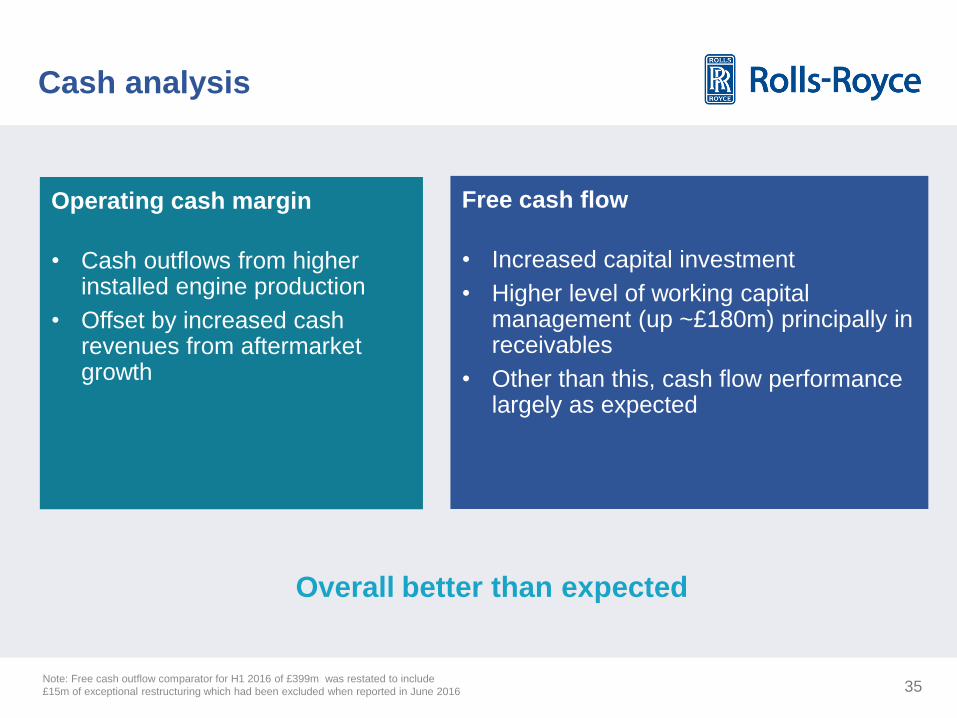
Cash analysis
Operating cash margin
• Cash outflows from higher installed engine production
• Offset by increased cash revenues from aftermarket growth
Note: Free cash outflow comparator for H1 2016 of £399m was restated to include
£15m of exceptional restructuring which had been excluded when reported in June 2016
Free cash flow
• Increased capital investment
• Higher level of working capital management (up ~£180m) principally in receivables
• Other than this, cash flow performance largely as expected
Overall better than expected
36
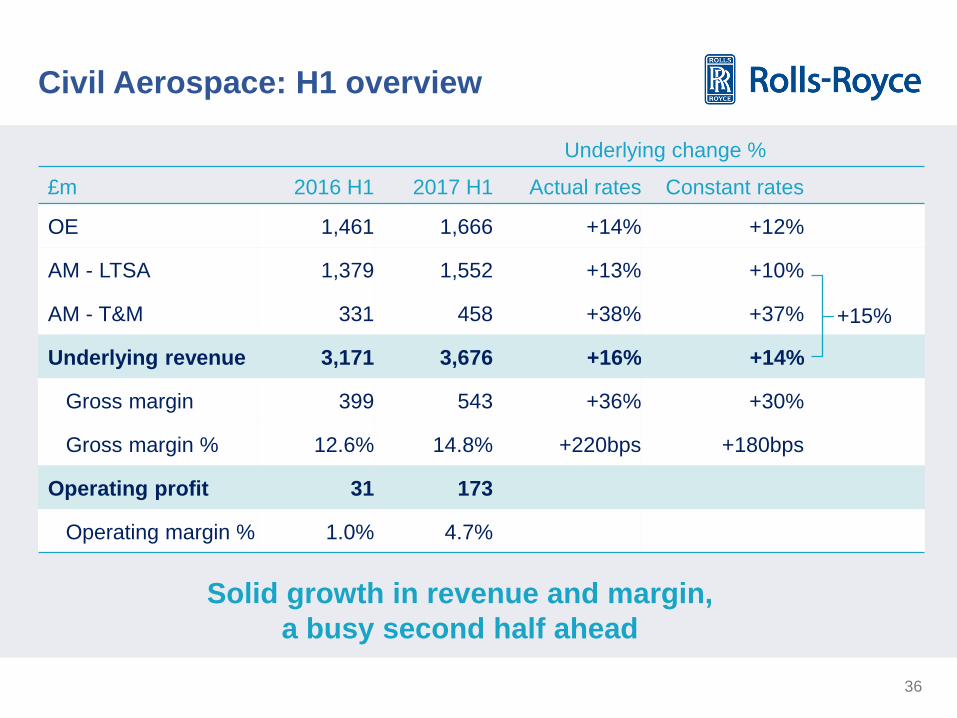
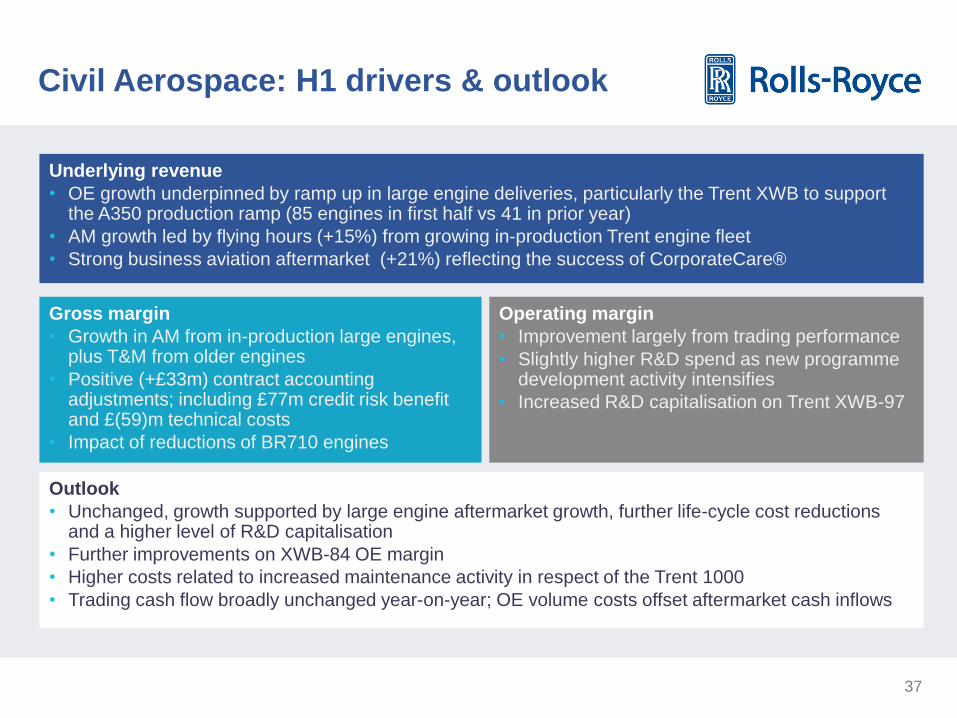
Civil Aerospace: H1 overview
Underlying change %
£m 2016 H1 2017 H1 Actual rates Constant rates
OE 1,461 1,666 +14% +12%
AM - LTSA 1,379 1,552 +13% +10%
AM - T&M 331 458 +38% +37%
Underlying revenue 3,171 3,676 +16% +14%
Gross margin 399 543 +36% +30%
Gross margin % 12.6% 14.8% +220bps +180bps
Operating profit 31 173
Operating margin % 1.0% 4.7%
+15%
Solid growth in revenue and margin,
a busy second half ahead
37
Underlying revenue
• OE growth underpinned by ramp up in large engine deliveries, particularly the Trent XWB to support the A350 production ramp (85 engines in first half vs 41 in prior year)
• AM growth led by flying hours (+15%) from growing in-production Trent engine fleet
• Strong business aviation aftermarket (+21%) reflecting the success of CorporateCare®
Civil Aerospace: H1 drivers & outlook
Gross margin
• Growth in AM from in-production large engines, plus T&M from older engines
• Positive (+£33m) contract accounting adjustments; including £77m credit risk benefit and £(59)m technical costs
• Impact of reductions of BR710 engines
Operating margin
• Improvement largely from trading performance
• Slightly higher R&D spend as new programme development activity intensifies
• Increased R&D capitalisation on Trent XWB-97
Outlook
• Unchanged, growth supported by large engine aftermarket growth, further life-cycle cost reductions and a higher level of R&D capitalisation
• Further improvements on XWB-84 OE margin
• Higher costs related to increased maintenance activity in respect of the Trent 1000
• Trading cash flow broadly unchanged year-on-year; OE volume costs offset aftermarket cash inflows
38
Defence Aerospace: H1 overview
Underlying change %
£m 2016 H1 2017 H1 Actual rates Constant rates
OE 412 431 +5% -4%
AM - LTSA 206 199 -3% -10%
AM - T&M 384 418 +9% -
Underlying revenue 1,002 1,048 +5% -4%
Gross margin 211 230 +9% -
Gross margin % 21.1% 21.9% +90bps +80bps
Operating profit 128 148
Operating margin % 12.8% 14.1%
-4%
Performance as expected,
second half production growth
39
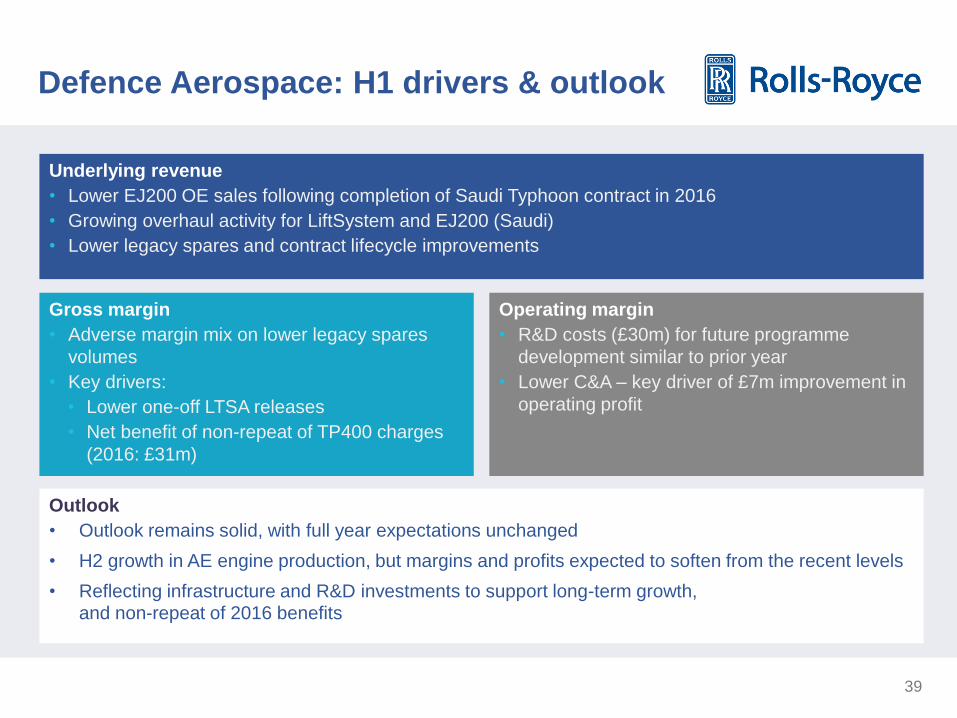
Defence Aerospace: H1 drivers & outlook
Underlying revenue
• Lower EJ200 OE sales following completion of Saudi Typhoon contract in 2016
• Growing overhaul activity for LiftSystem and EJ200 (Saudi)
• Lower legacy spares and contract lifecycle improvements
Gross margin
• Adverse margin mix on lower legacy spares
volumes
• Key drivers:
• Lower one-off LTSA releases
• Net benefit of non-repeat of TP400 charges
(2016: £31m)
Operating margin
• R&D costs (£30m) for future programme
development similar to prior year
• Lower C&A – key driver of £7m improvement in
operating profit
Outlook
• Outlook remains solid, with full year expectations unchanged
• H2 growth in AE engine production, but margins and profits expected to soften from the recent levels
• Reflecting infrastructure and R&D investments to support long-term growth, and non-repeat of 2016 benefits
40
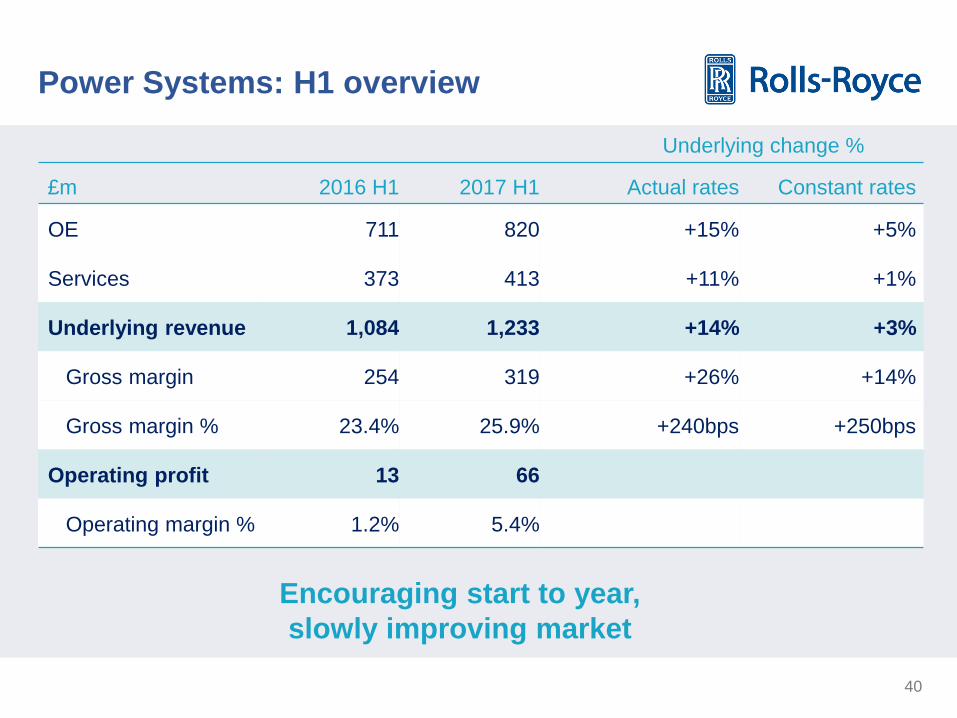
Power Systems: H1 overview
Underlying change %
£m 2016 H1 2017 H1 Actual rates Constant rates
OE 711 820 +15% +5%
Services 373 413 +11% +1%
Underlying revenue 1,084 1,233 +14% +3%
Gross margin 254 319 +26% +14%
Gross margin % 23.4% 25.9% +240bps +250bps
Operating profit 13 66
Operating margin % 1.2% 5.4%
Encouraging start to year,
slowly improving market
41
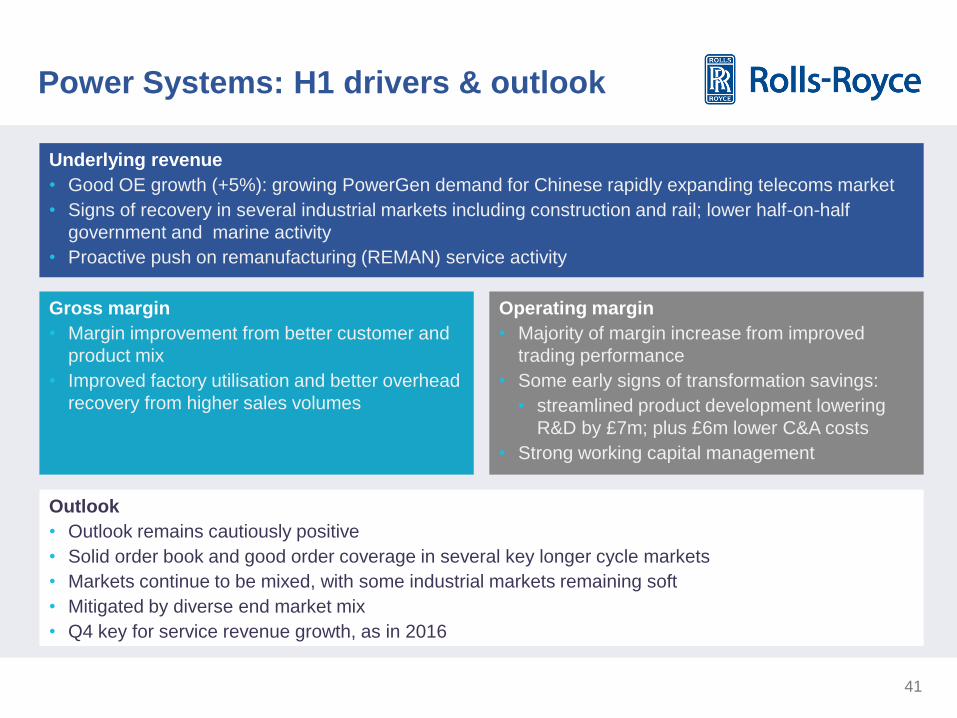
Power Systems: H1 drivers & outlook
Underlying revenue
• Good OE growth (+5%): growing PowerGen demand for Chinese rapidly expanding telecoms market
• Signs of recovery in several industrial markets including construction and rail; lower half-on-half
government and marine activity
• Proactive push on remanufacturing (REMAN) service activity
Gross margin
• Margin improvement from better customer and
product mix
• Improved factory utilisation and better overhead
recovery from higher sales volumes
Operating margin
• Majority of margin increase from improved
trading performance
• Some early signs of transformation savings:
• streamlined product development lowering
R&D by £7m; plus £6m lower C&A costs
• Strong working capital management
Outlook
• Outlook remains cautiously positive
• Solid order book and good order coverage in several key longer cycle markets
• Markets continue to be mixed, with some industrial markets remaining soft
• Mitigated by diverse end market mix
• Q4 key for service revenue growth, as in 2016
42
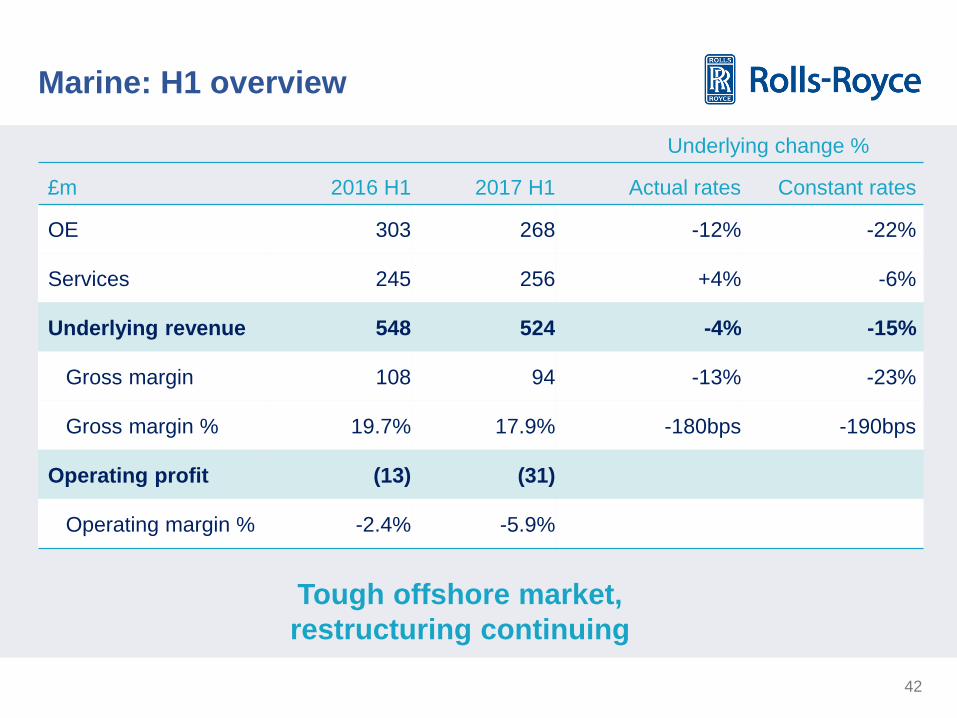
Marine: H1 overview
Underlying change %
£m 2016 H1 2017 H1 Actual rates Constant rates
OE 303 268 -12% -22%
Services 245 256 +4% -6%
Underlying revenue 548 524 -4% -15%
Gross margin 108 94 -13% -23%
Gross margin % 19.7% 17.9% -180bps -190bps
Operating profit (13) (31)
Operating margin % -2.4% -5.9%
Tough offshore market,
restructuring continuing
43
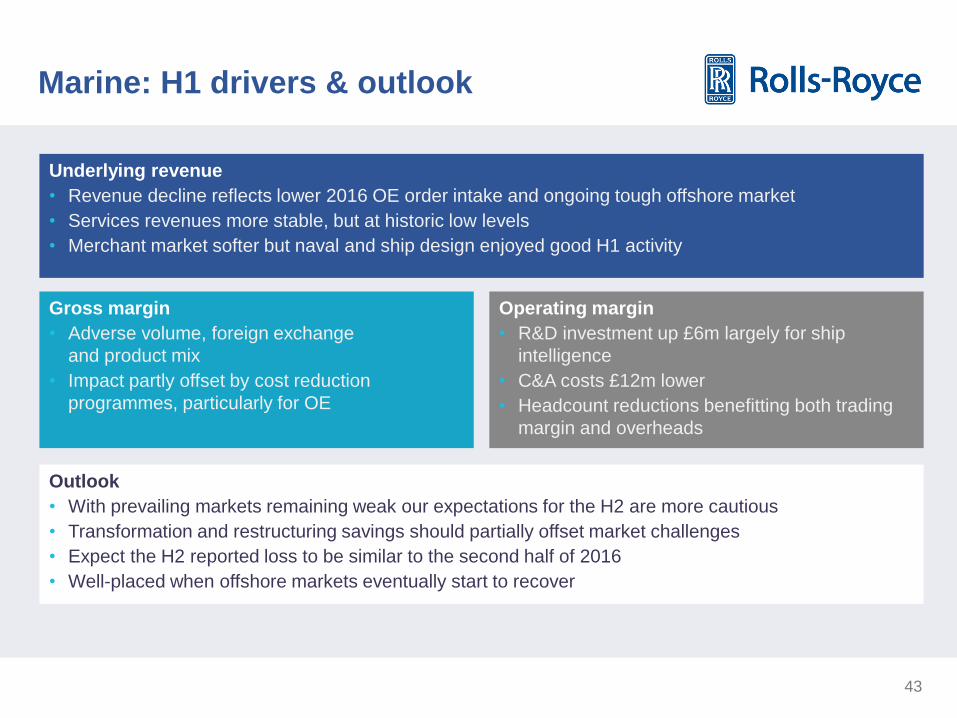
Marine: H1 drivers & outlook
Underlying revenue
• Revenue decline reflects lower 2016 OE order intake and ongoing tough offshore market
• Services revenues more stable, but at historic low levels
• Merchant market softer but naval and ship design enjoyed good H1 activity
Gross margin
• Adverse volume, foreign exchange
and product mix
• Impact partly offset by cost reduction
programmes, particularly for OE
Operating margin
• R&D investment up £6m largely for ship
intelligence
• C&A costs £12m lower
• Headcount reductions benefitting both trading
margin and overheads
Outlook
• With prevailing markets remaining weak our expectations for the H2 are more cautious
• Transformation and restructuring savings should partially offset market challenges
• Expect the H2 reported loss to be similar to the second half of 2016
• Well-placed when offshore markets eventually start to recover
44
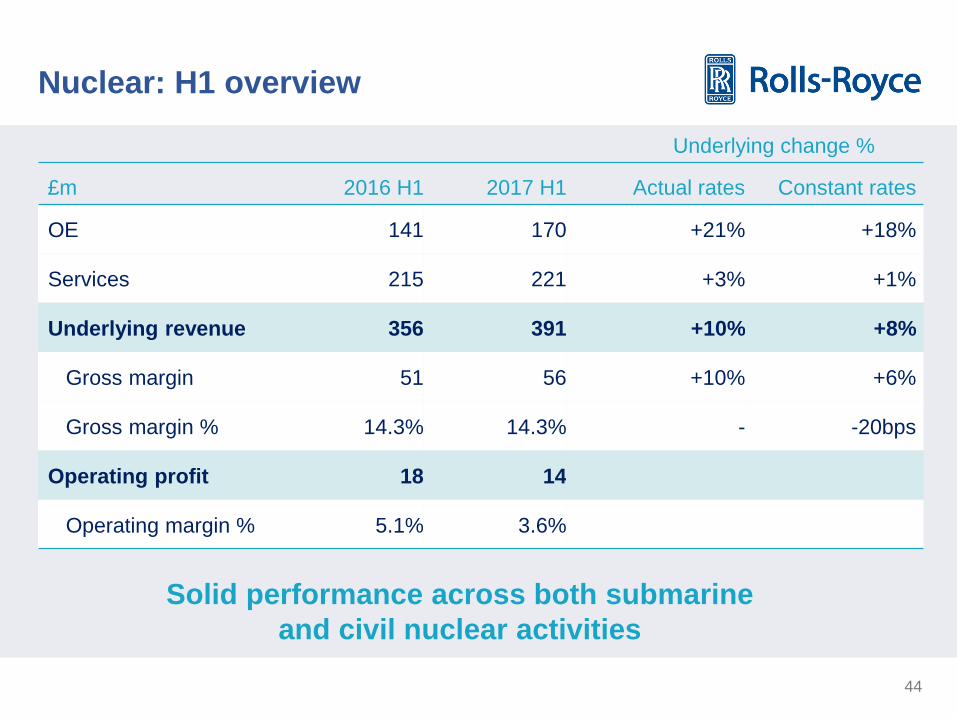
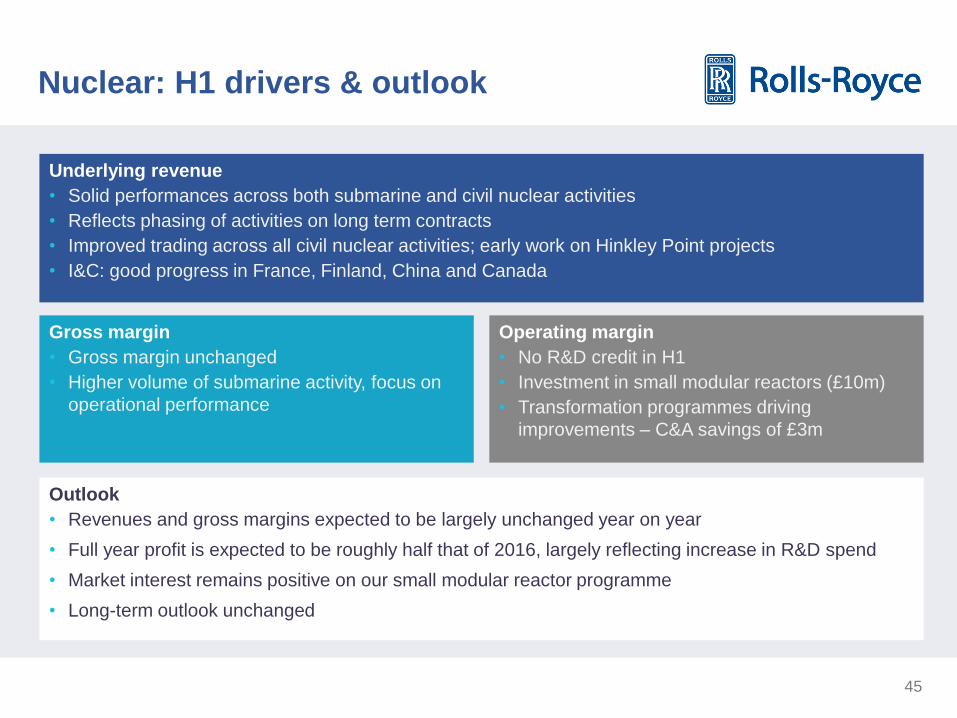
Nuclear: H1 overview
Underlying change %
£m 2016 H1 2017 H1 Actual rates Constant rates
OE 141 170 +21% +18%
Services 215 221 +3% +1%
Underlying revenue 356 391 +10% +8%
Gross margin 51 56 +10% +6%
Gross margin % 14.3% 14.3% - -20bps
Operating profit 18 14
Operating margin % 5.1% 3.6%
Solid performance across both submarine
and civil nuclear activities
45
Nuclear: H1 drivers & outlook
Underlying revenue
• Solid performances across both submarine and civil nuclear activities
• Reflects phasing of activities on long term contracts
• Improved trading across all civil nuclear activities; early work on Hinkley Point projects
• I&C: good progress in France, Finland, China and Canada
Gross margin
• Gross margin unchanged
• Higher volume of submarine activity, focus on
operational performance
Operating margin
• No R&D credit in H1
• Investment in small modular reactors (£10m)
• Transformation programmes driving
improvements – C&A savings of £3m
Outlook
• Revenues and gross margins expected to be largely unchanged year on year
• Full year profit is expected to be roughly half that of 2016, largely reflecting increase in R&D spend
• Market interest remains positive on our small modular reactor programme
• Long-term outlook unchanged

46
Agenda
Accounting changes 3
47
Accounting changes: no effect on cash
Civil Aerospace adjustments £m 2015 2016
OE underlying revenue (888) (816)
Aftermarket underlying revenue (208) (474)
Total underlying revenue (1,096) (1,290)
Underlying operating profit (933) (823)
Transition adjustment:
Post-tax balance sheet reserves (£bn) (3.2) (3.9)
IFRS 15 (from 1 Jan 2018)
IFRS 16 (from 1 Jan 2019)
• Operating leases will be brought onto the balance sheet (2016: c. £1bn)
• Similar principles already used by rating agencies
2016: rest of group impact <£25m for revenue/operating profit
48
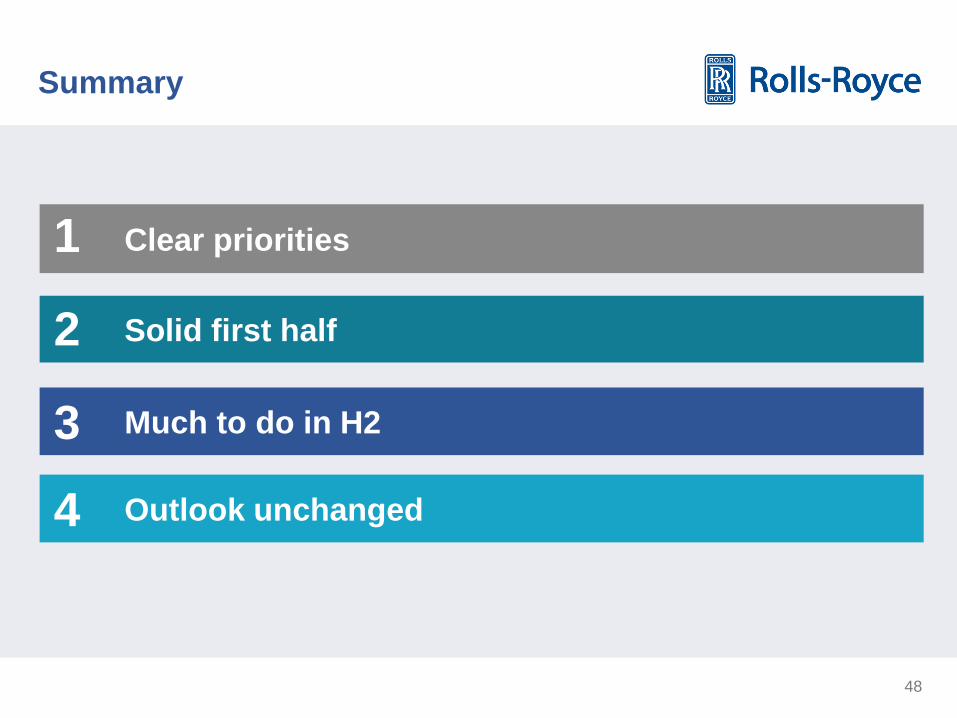
Summary
Clear priorities
Outlook unchanged 4
1
Much to do in H2 3
Solid first half 2
Warren East
Chief Executive
50
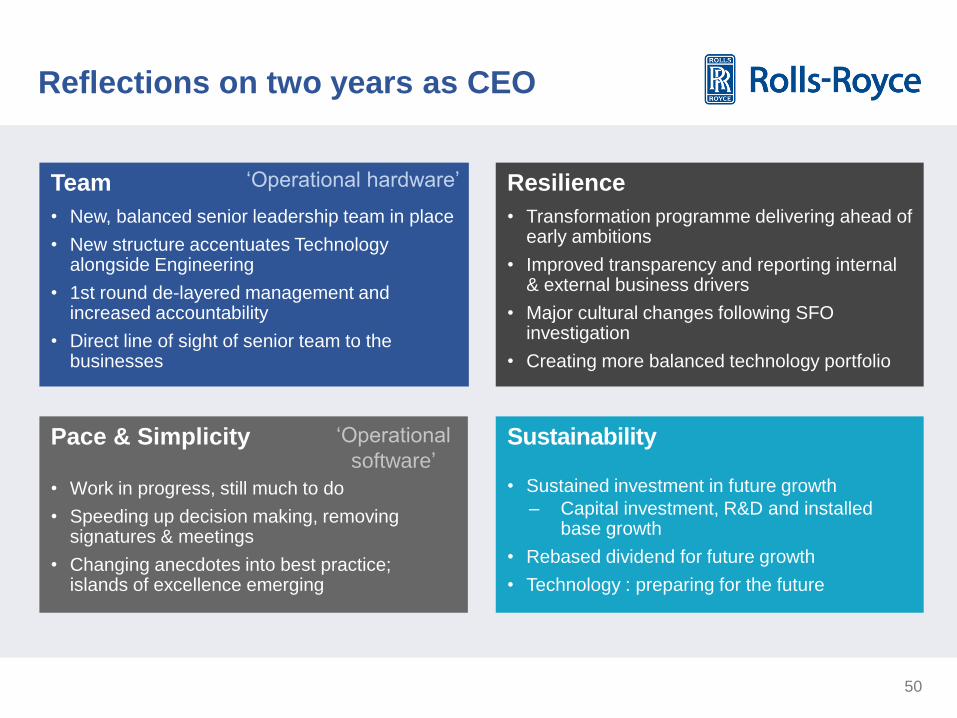
Reflections on two years as CEO
Pace & Simplicity
• Work in progress, still much to do
• Speeding up decision making, removing signatures & meetings
• Changing anecdotes into best practice; islands of excellence emerging
Team
• New, balanced senior leadership team in place
• New structure accentuates Technology alongside Engineering
• 1st round de-layered management and increased accountability
• Direct line of sight of senior team to the businesses
Resilience
• Transformation programme delivering ahead of early ambitions
• Improved transparency and reporting internal & external business drivers
• Major cultural changes following SFO investigation
• Creating more balanced technology portfolio
Sustainability
• Sustained investment in future growth
‒ Capital investment, R&D and installed base growth
• Rebased dividend for future growth
• Technology : preparing for the future
‘Operational hardware’
‘Operational
software’
51
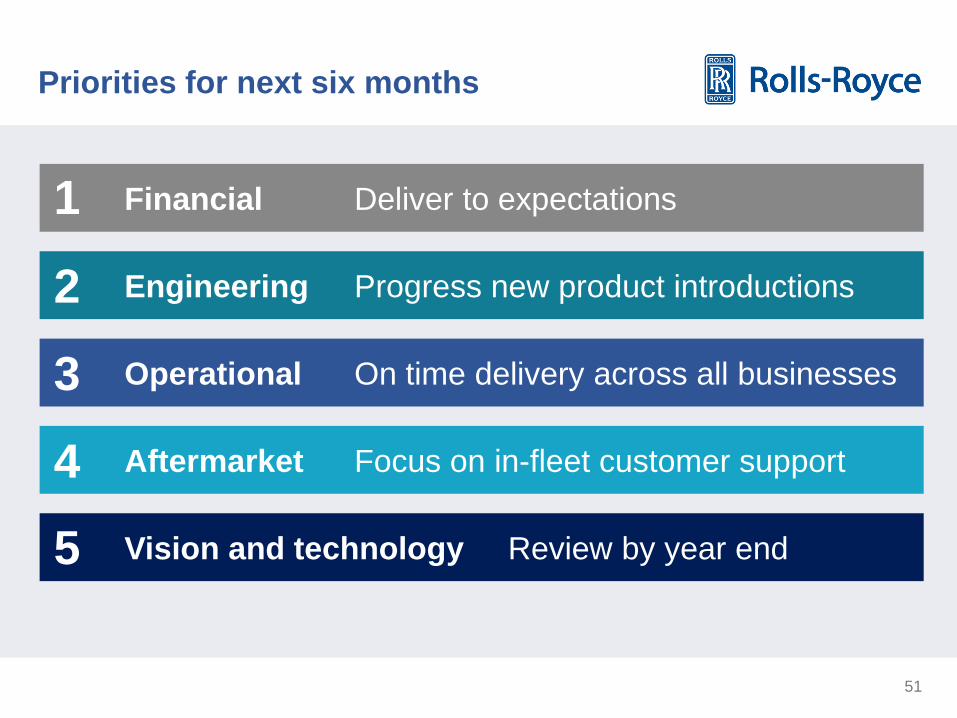
Priorities for next six months
Aftermarket Focus on in-fleet customer support
Financial Deliver to expectations
Operational On time delivery across all businesses
Engineering Progress new product introductions
Vision and technology Review by year end
4
1
5
3
2
52
Q&A Warren East, Chief Executive
Stephen Daintith, Chief Financial Officer
Strengthen our
focus on
engineering,
operational and
aftermarket
excellence
Deliver good
progress on
transformation
commitments
Rebuild trust and
confidence in our
long-term growth
prospects
Complete
strategic update;
outline clear goals
and priorities for
Rolls-Royce
53
Investor Relations
Contacts
John Dawson
Director – Investor Relations
Tel: +44(0)207 227 9087
Helen Harman
Assistant Director – Investor Relations
Tel: +44(0)207 227 9339
Ross Hawley
Assistant Director – Investor Relations
Tel: +44(0)207 227 9282
Richard Foster
Manager – Investor Relations
Tel: +44(0)207 227 9141
Elena Prentice
Programme Coordinator – Investor Relations
Tel: +44(0)207 227 9237
For more information: www.rolls-royce.com/investors
54
Safe harbour statement
This announcement contains certain forward-looking statements. These forward-looking
statements can be identified by the fact that they do not relate only to historical or current
facts. In particular, all statements that express forecasts, expectations and projections with
respect to future matters, including trends in results of operations, margins, growth rates,
overall market trends, the impact of interest or exchange rates, the availability of financing to
the Company, anticipated cost savings or synergies and the completion of the Company's
strategic transactions, are forward-looking statements. By their nature, these statements and
forecasts involve risk and uncertainty because they relate to events and depend on
circumstances that may or may not occur in the future. There are a number of factors that
could cause actual results or developments to differ materially from those expressed or
implied by these forward-looking statements and forecasts. The forward-looking statements
reflect the knowledge and information available at the date of preparation of this
announcement, and will not be updated during the year. Nothing in this announcement should
be construed as a profit forecast. All figures are on an underlying basis unless otherwise
stated. See note 2 of the Financial Review for definition.