Embed Size (px)
Citation preview
2017 GRC SED RIBA Presentation
Jamie Martin Sr. Director, Business Finance PG&E
March 25, 2016
Eric Back Director, Compliance & Risk Management PG&E
2
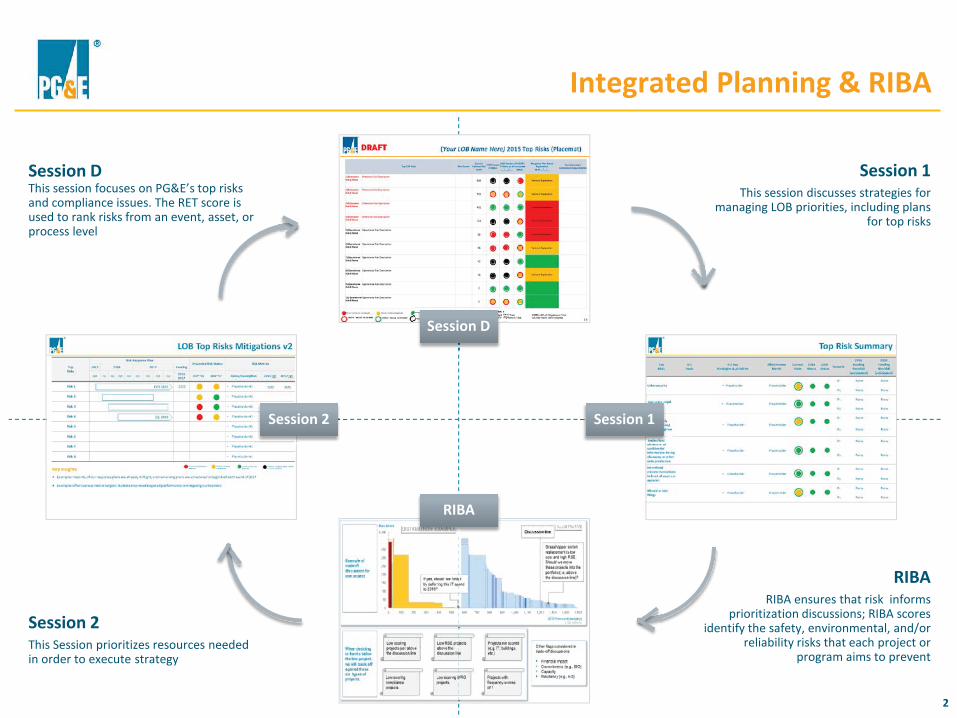
Integrated Planning & RIBA
Session D This session focuses on PG&E’s top risks and compliance issues. The RET score is used to rank risks from an event, asset, or process level
Session 1 This session discusses strategies for
managing LOB priorities, including plans for top risks
RIBA RIBA ensures that risk informs
prioritization discussions; RIBA scores identify the safety, environmental, and/or
reliability risks that each project or program aims to prevent
sset, or
ideSession 2 This Session prioritizes resources needed in order to execute strategy
Session D
RIBA
Session 1 Session 2
3
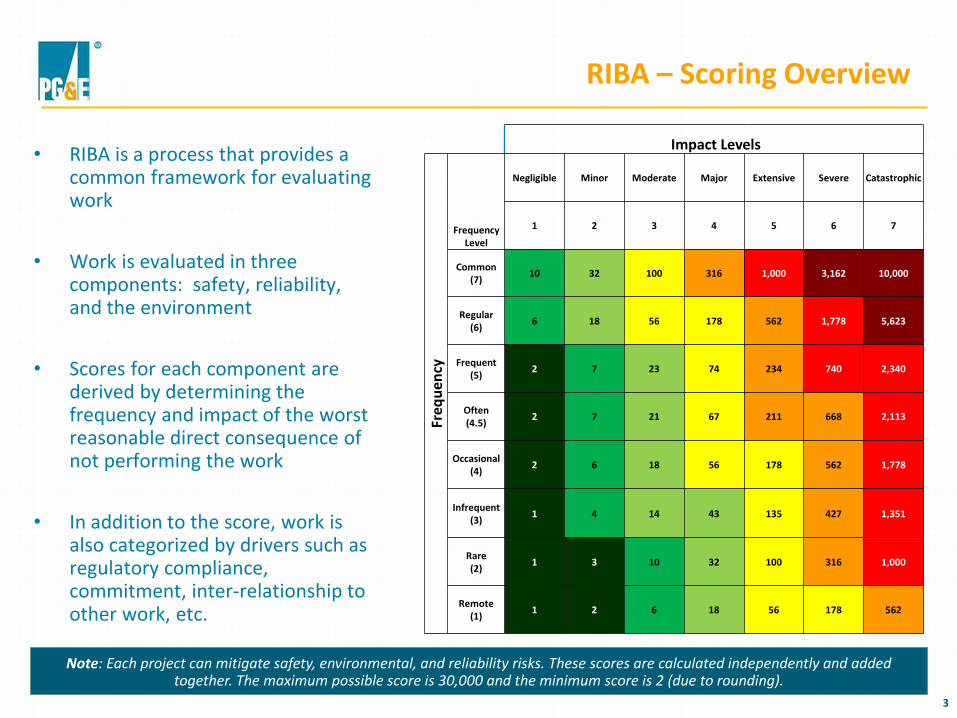
• RIBA is a process that provides a common framework for evaluating work
• Work is evaluated in three
components: safety, reliability, and the environment
• Scores for each component are derived by determining the frequency and impact of the worst reasonable direct consequence of not performing the work
• In addition to the score, work is also categorized by drivers such as regulatory compliance, commitment, inter-relationship to other work, etc.
Impact Levels
Freq
uenc
y
Negligible Minor Moderate Major Extensive Severe Catastrophic
Frequency Level
1 2 3 4 5 6 7
Common (7) 10 32 100 316 1,000 3,162 10,000
Regular (6) 6 18 56 178 562 1,778 5,623
Frequent (5) 2 7 23 74 234 740 2,340
Often (4.5) 2 7 21 67 211 668 2,113
Occasional (4) 2 6 18 56 178 562 1,778
Infrequent (3) 1 4 14 43 135 427 1,351
Rare (2) 1 3 10 32 100 316 1,000
Remote (1) 1 2 6 18 56 178 562
RIBA – Scoring Overview
Note: Each project can mitigate safety, environmental, and reliability risks. These scores are calculated independently and added together. The maximum possible score is 30,000 and the minimum score is 2 (due to rounding).
4
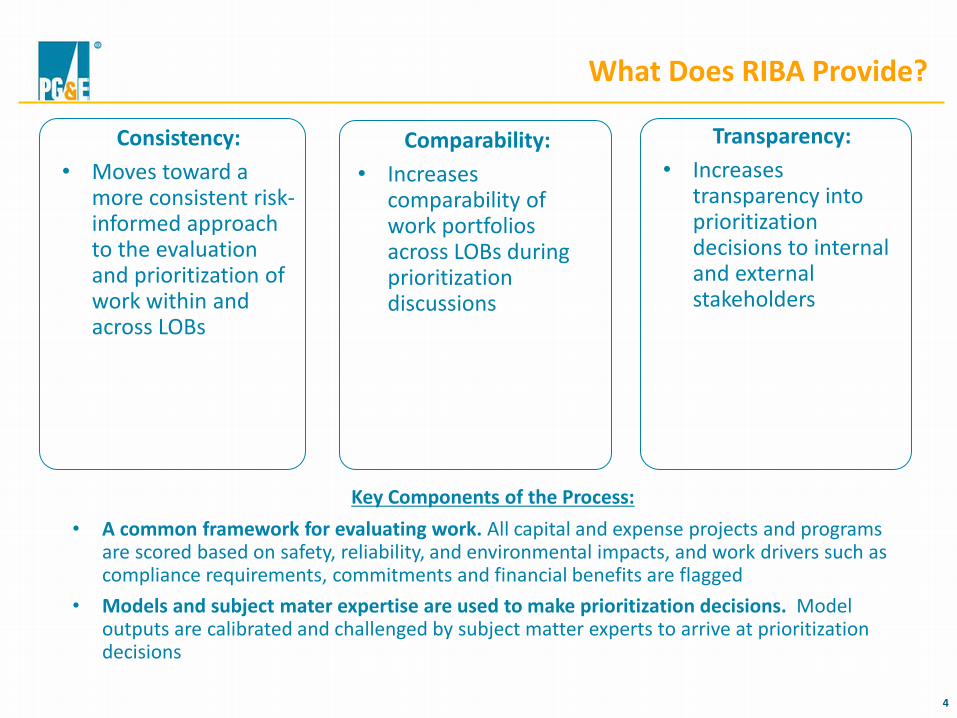
What Does RIBA Provide?
Transparency: • Increases
transparency into prioritization decisions to internal and external stakeholders
Comparability: • Increases
comparability of work portfolios across LOBs during prioritization discussions
Consistency: • Moves toward a
more consistent risk-informed approach to the evaluation and prioritization of work within and across LOBs
• A common framework for evaluating work. All capital and expense projects and programs are scored based on safety, reliability, and environmental impacts, and work drivers such as compliance requirements, commitments and financial benefits are flagged
• Models and subject mater expertise are used to make prioritization decisions. Model outputs are calibrated and challenged by subject matter experts to arrive at prioritization decisions
Key Components of the Process:
5
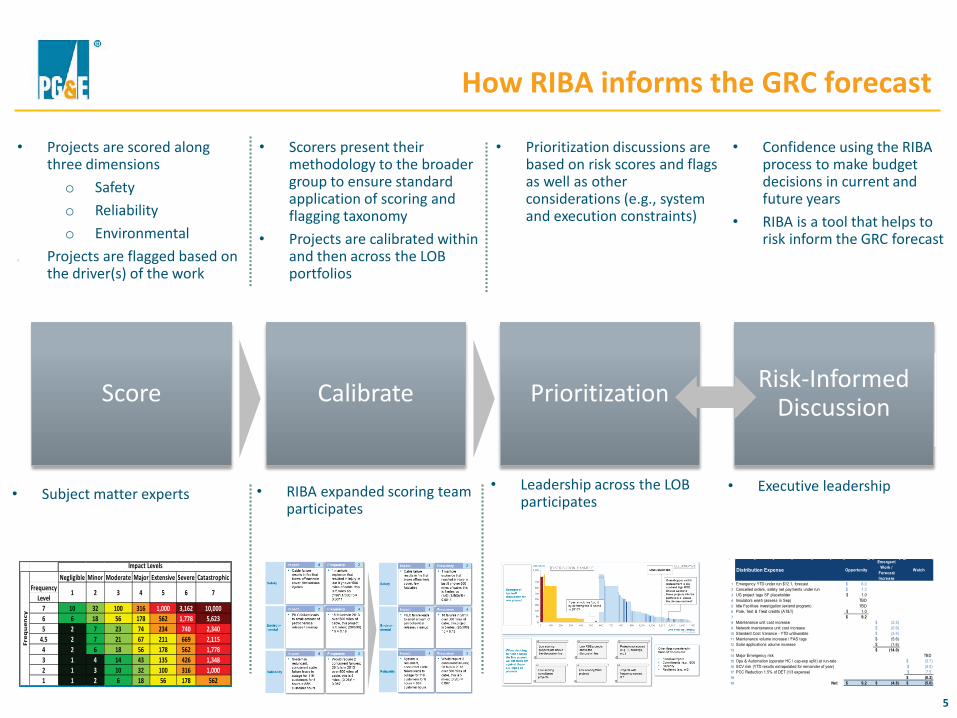
How RIBA informs the GRC forecast
Score Calibrate Prioritization Risk-Informed Discussion
Subject matter experts
Negligible Minor Moderate Major Extensive Severe CatastrophicFrequency
Level7 10 32 100 316 1,000 3,162 10,0006 6 18 56 178 562 1,778 5,6235 2 7 23 74 234 740 2,340
4.5 2 7 21 67 211 669 2,1154 2 6 18 56 178 562 1,7783 1 4 14 43 135 426 1,3482 1 3 10 32 100 316 1,0001 1 2 6 18 56 178 562
Impact Levels
Fre
qu
en
cy
1 2 3 4 5 6 7
Leadership across the LOB participates
RIBA expanded scoring team participates
Executive leadership
Projects are scored along three dimensions
Safety Reliability Environmental
Projects are flagged based on the driver(s) of the work
Scorers present their methodology to the broader group to ensure standard application of scoring and flagging taxonomy Projects are calibrated within and then across the LOB portfolios
Prioritization discussions are based on risk scores and flags as well as other considerations (e.g., system and execution constraints)
Confidence using the RIBA process to make budget decisions in current and future years RIBA is a tool that helps to risk inform the GRC forecast
6
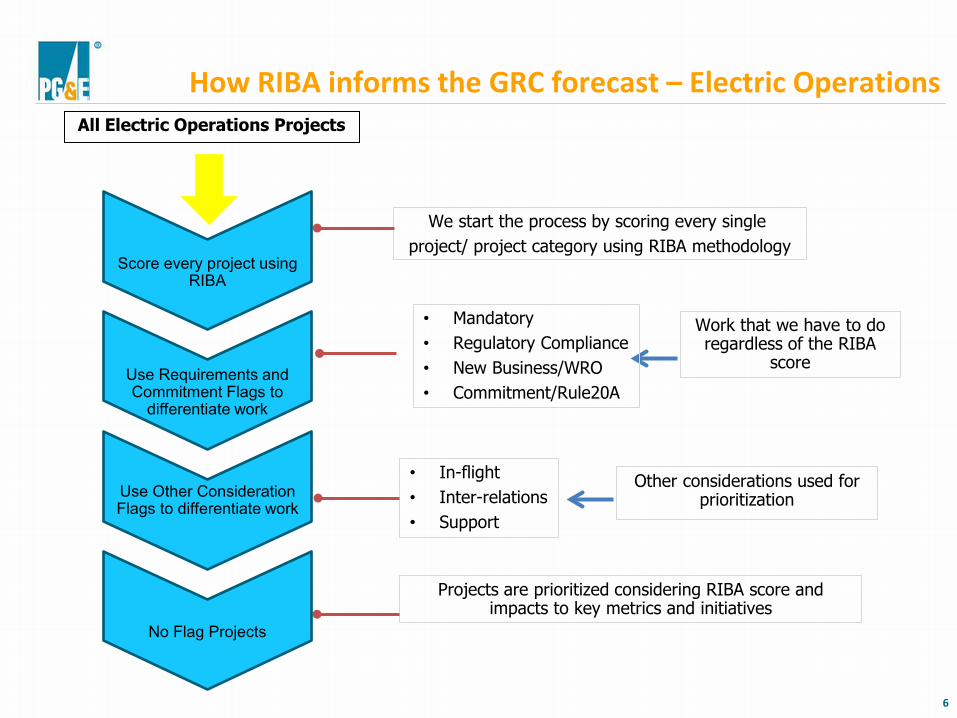
How RIBA informs the GRC forecast – Electric Operations
Work that we have to do regardless of the RIBA
score
Other considerations used for prioritization
We start the process by scoring every single project/ project category using RIBA methodology
• Mandatory • Regulatory Compliance • New Business/WRO • Commitment/Rule20A
• In-flight • Inter-relations • Support
Projects are prioritized considering RIBA score and impacts to key metrics and initiatives
All Electric Operations Projects
Score every project using
RIBA
Use Requirements and Commitment Flags to
differentiate work
Use Other Consideration Flags to differentiate work
No Flag Projects
7
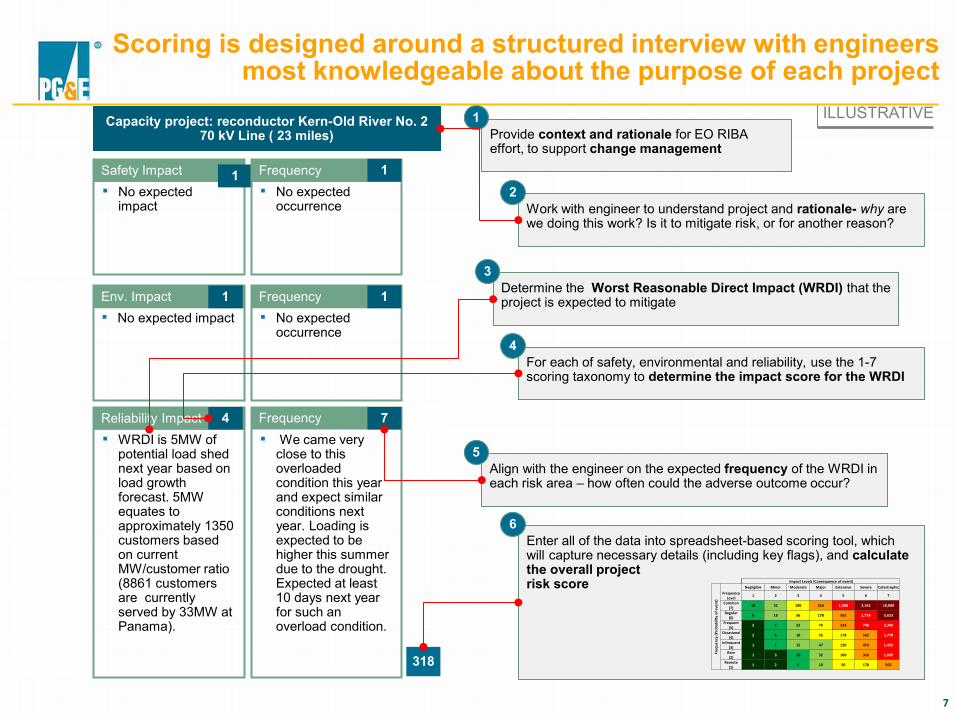
Scoring is designed around a structured interview with engineers most knowledgeable about the purpose of each project
Capacity project: reconductor Kern-Old River No. 2 70 kV Line ( 23 miles)
Safety Impact 1 ▪ No expected
impact
1 Frequency 1 ▪ No expected
occurrence
Env. Impact 1 ▪ No expected impact
Frequency 1 ▪ No expected
occurrence
Reliability Impact 4 ▪ WRDI is 5MW of
potential load shed next year based on load growth forecast. 5MW equates to approximately 1350 customers based on current MW/customer ratio (8861 customers are currently served by 33MW at Panama).
Frequency 7 ▪ We came very
close to this overloaded condition this year and expect similar conditions next year. Loading is expected to be higher this summer due to the drought. Expected at least 10 days next year for such an overload condition.
1
316
Safety
Environ-mental
Reliability
ILLUSTRATIVE Provide context and rationale for EO RIBA effort, to support change management
1
Work with engineer to understand project and rationale- why are we doing this work? Is it to mitigate risk, or for another reason?
2
Determine the Worst Reasonable Direct Impact (WRDI) that the project is expected to mitigate
3
For each of safety, environmental and reliability, use the 1-7 scoring taxonomy to determine the impact score for the WRDI
4
318
Align with the engineer on the expected frequency of the WRDI in each risk area – how often could the adverse outcome occur?
5
Enter all of the data into spreadsheet-based scoring tool, which will capture necessary details (including key flags), and calculate the overall project risk score
6
Impact Levels (Consequence of event)
Freq
uenc
y (P
roba
bilit
yof
eve
nt)
Negligible Minor Moderate Major Extensive Severe CatastrophicFrequency
Level 1 2 3 4 5 6 7
Common(7) 10 32 100 316 1,000 3,162 10,000
Regular(6) 6 18 56 178 562 1,778 5,623
Frequent(5) 2 7 23 74 234 740 2,340
Occasional(4) 2 6 18 56 178 562 1,778
Infrequent(3) 1 5 15 47 150 473 1,495
Rare(2) 1 3 10 32 100 316 1,000
Remote(1) 1 2 6 18 56 178 562
8
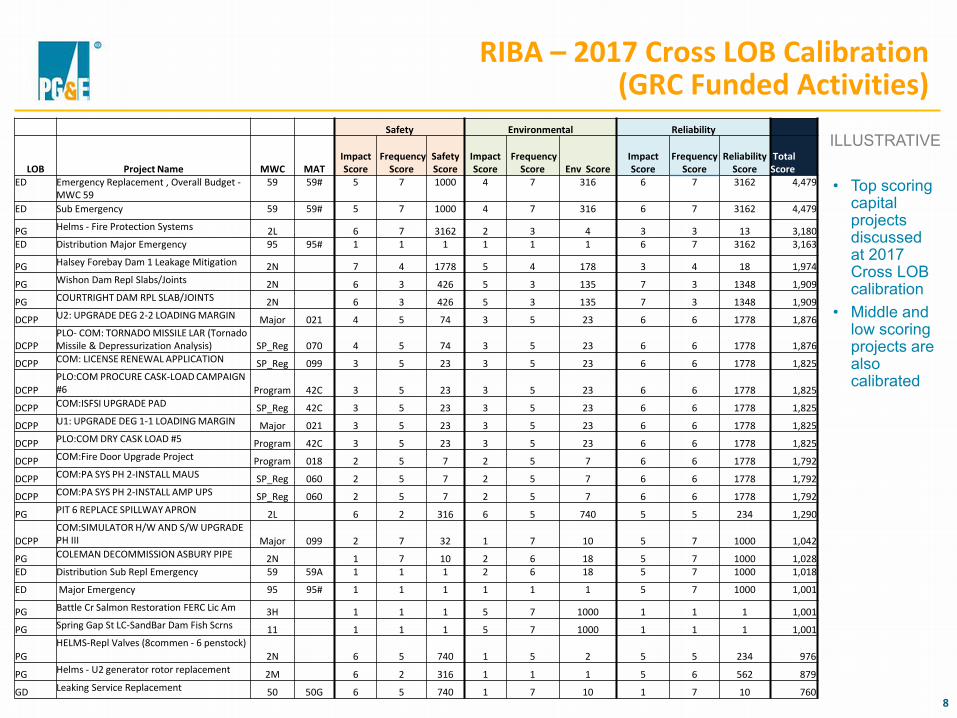
RIBA – 2017 Cross LOB Calibration (GRC Funded Activities)
Safety Environmental Reliability
LOB Project Name MWC MAT Impact Score
Frequency Score
Safety Score
Impact Score
Frequency Score Env Score
Impact Score
Frequency Score
Reliability Score
Total Score
ED Emergency Replacement , Overall Budget - MWC 59
59 59# 5 7 1000 4 7 316 6 7 3162 4,479
ED Sub Emergency 59 59# 5 7 1000 4 7 316 6 7 3162 4,479
PG Helms - Fire Protection Systems 2L 6 7 3162 2 3 4 3 3 13 3,180 ED Distribution Major Emergency 95 95# 1 1 1 1 1 1 6 7 3162 3,163
PG Halsey Forebay Dam 1 Leakage Mitigation 2N 7 4 1778 5 4 178 3 4 18 1,974
PG Wishon Dam Repl Slabs/Joints 2N 6 3 426 5 3 135 7 3 1348 1,909
PG COURTRIGHT DAM RPL SLAB/JOINTS 2N 6 3 426 5 3 135 7 3 1348 1,909
DCPP U2: UPGRADE DEG 2-2 LOADING MARGIN Major 021 4 5 74 3 5 23 6 6 1778 1,876
DCPP PLO- COM: TORNADO MISSILE LAR (Tornado Missile & Depressurization Analysis) SP_Reg 070 4 5 74 3 5 23 6 6 1778 1,876
DCPP COM: LICENSE RENEWAL APPLICATION SP_Reg 099 3 5 23 3 5 23 6 6 1778 1,825
DCPP PLO:COM PROCURE CASK-LOAD CAMPAIGN #6 Program 42C 3 5 23 3 5 23 6 6 1778 1,825
DCPP COM:ISFSI UPGRADE PAD SP_Reg 42C 3 5 23 3 5 23 6 6 1778 1,825
DCPP U1: UPGRADE DEG 1-1 LOADING MARGIN Major 021 3 5 23 3 5 23 6 6 1778 1,825
DCPP PLO:COM DRY CASK LOAD #5 Program 42C 3 5 23 3 5 23 6 6 1778 1,825
DCPP COM:Fire Door Upgrade Project Program 018 2 5 7 2 5 7 6 6 1778 1,792
DCPP COM:PA SYS PH 2-INSTALL MAUS SP_Reg 060 2 5 7 2 5 7 6 6 1778 1,792
DCPP COM:PA SYS PH 2-INSTALL AMP UPS SP_Reg 060 2 5 7 2 5 7 6 6 1778 1,792
PG PIT 6 REPLACE SPILLWAY APRON 2L 6 2 316 6 5 740 5 5 234 1,290
DCPP COM:SIMULATOR H/W AND S/W UPGRADE PH III Major 099 2 7 32 1 7 10 5 7 1000 1,042
PG COLEMAN DECOMMISSION ASBURY PIPE 2N 1 7 10 2 6 18 5 7 1000 1,028 ED Distribution Sub Repl Emergency 59 59A 1 1 1 2 6 18 5 7 1000 1,018
ED Major Emergency 95 95# 1 1 1 1 1 1 5 7 1000 1,001
PG Battle Cr Salmon Restoration FERC Lic Am 3H 1 1 1 5 7 1000 1 1 1 1,001
PG Spring Gap St LC-SandBar Dam Fish Scrns 11 1 1 1 5 7 1000 1 1 1 1,001
PG HELMS-Repl Valves (8commen - 6 penstock)
2N 6 5 740 1 5 2 5 5 234 976
PG Helms - U2 generator rotor replacement 2M 6 2 316 1 1 1 5 6 562 879
GD Leaking Service Replacement 50 50G 6 5 740 1 7 10 1 7 10 760
• Top scoring capital projects discussed at 2017 Cross LOB calibration
• Middle and low scoring projects are also calibrated
ILLUSTRATIVE
9
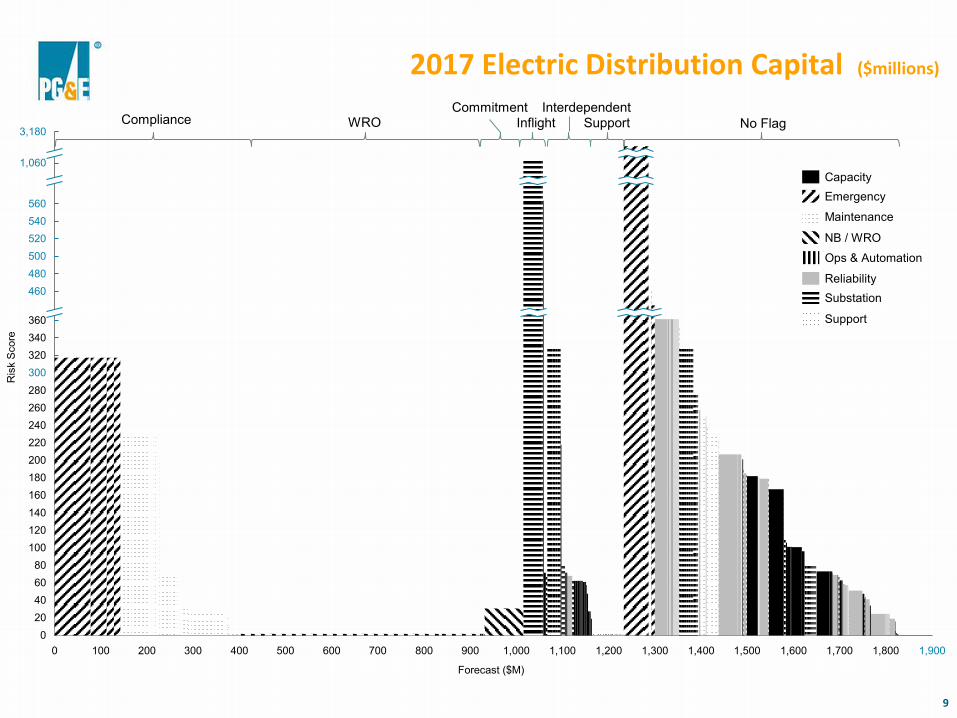
2017 Electric Distribution Capital ($millions)
360 340 320 300 280 260 240 220 200 180 160 140 120 100
80 60 40 20 0
1,900 1,800 1,700
3,180
1,060
560 540 520 500 480
500 400 300 200 100 0
460
1,600 1,500 1,400 1,300 1,200 1,100 1,000 900 800 700 600
Forecast ($M)
Ris
k S
core
Reliability
Ops & Automation
Capacity
Substation
Emergency
Support
NB / WRO
Maintenance
WRO Compliance No Flag Inflight Interdependent
Support Commitment
10
Appendix RIBA Taxonomy
11
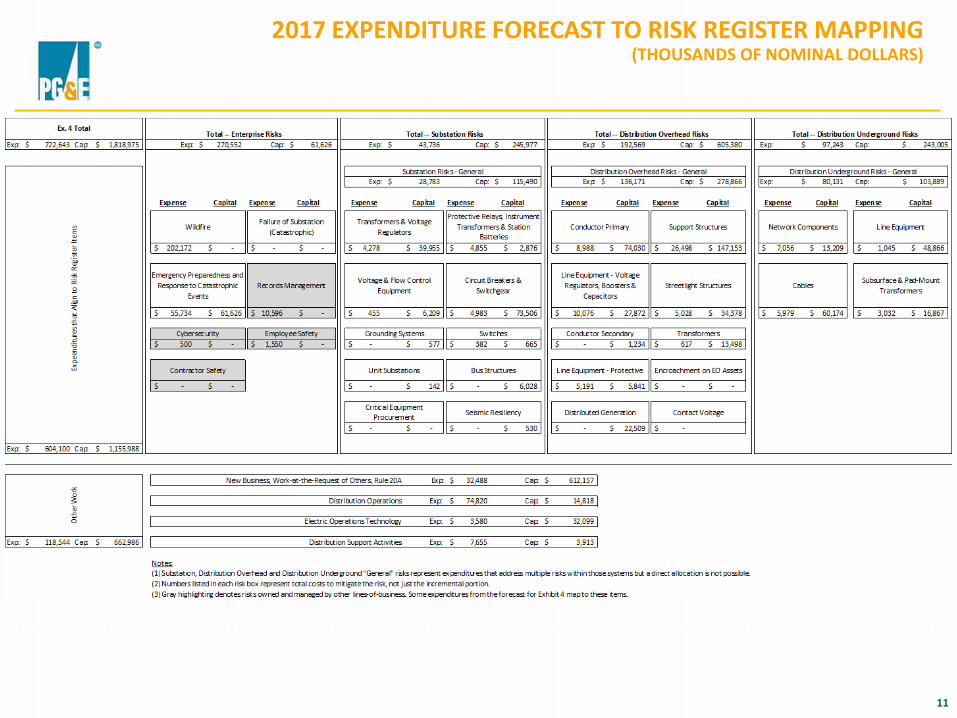
2017 EXPENDITURE FORECAST TO RISK REGISTER MAPPING (THOUSANDS OF NOMINAL DOLLARS)
12
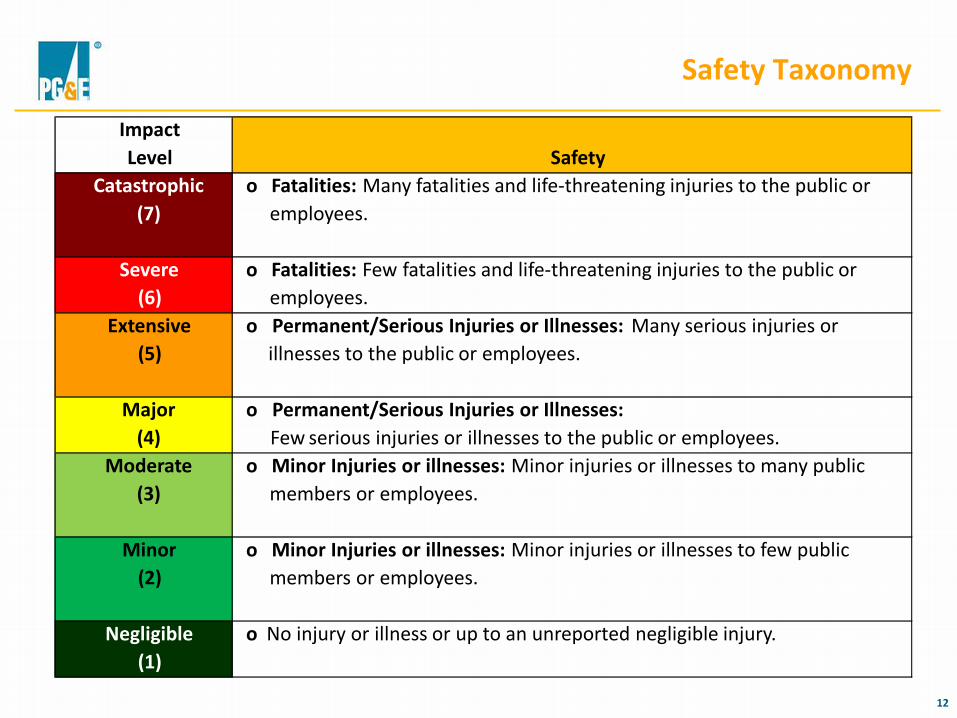
Safety Taxonomy
Impact Level Safety
Catastrophic (7)
o Fatalities: Many fatalities and life-threatening injuries to the public or employees.
Severe (6)
o Fatalities: Few fatalities and life-threatening injuries to the public or employees.
Extensive (5)
o Permanent/Serious Injuries or Illnesses: Many serious injuries or illnesses to the public or employees.
Major (4)
o Permanent/Serious Injuries or Illnesses: Few serious injuries or illnesses to the public or employees.
Moderate (3)
o Minor Injuries or illnesses: Minor injuries or illnesses to many public members or employees.
Minor (2)
o Minor Injuries or illnesses: Minor injuries or illnesses to few public members or employees.
Negligible (1)
o No injury or illness or up to an unreported negligible injury.
13
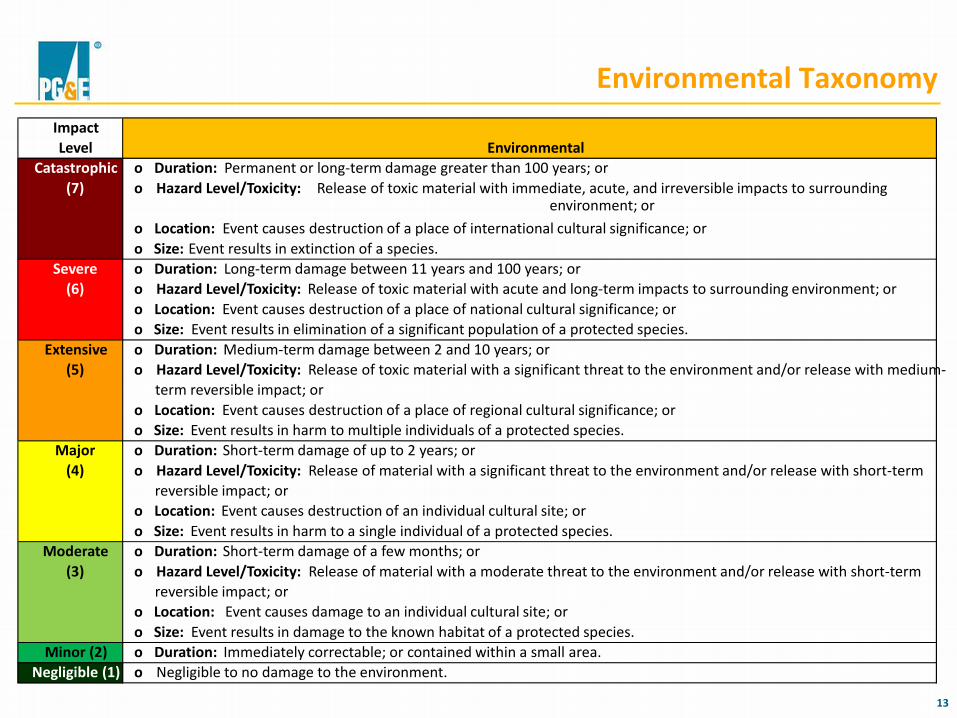
Environmental Taxonomy
Impact Level Environmental
Catastrophic (7)
o o
o o
Duration: Permanent or long-term damage greater than 100 years; or Hazard Level/Toxicity: Release of toxic material with immediate, acute, and irreversible impacts to surrounding
environment; or Location: Event causes destruction of a place of international cultural significance; or Size: Event results in extinction of a species.
Severe (6)
o o o o
Duration: Long-term damage between 11 years and 100 years; or Hazard Level/Toxicity: Release of toxic material with acute and long-term impacts to surrounding environment; or Location: Event causes destruction of a place of national cultural significance; or Size: Event results in elimination of a significant population of a protected species.
Extensive (5)
o o
o o
Duration: Medium-term damage between 2 and 10 years; or Hazard Level/Toxicity: Release of toxic material with a significant threat to the environment and/or release with medium- term reversible impact; or Location: Event causes destruction of a place of regional cultural significance; or Size: Event results in harm to multiple individuals of a protected species.
Major (4)
o o
o o
Duration: Short-term damage of up to 2 years; or Hazard Level/Toxicity: Release of material with a significant threat to the environment and/or release with short-term reversible impact; or Location: Event causes destruction of an individual cultural site; or Size: Event results in harm to a single individual of a protected species.
Moderate (3)
o o
o o
Duration: Short-term damage of a few months; or Hazard Level/Toxicity: Release of material with a moderate threat to the environment and/or release with short-term reversible impact; or Location: Event causes damage to an individual cultural site; or Size: Event results in damage to the known habitat of a protected species.
Minor (2) o Duration: Immediately correctable; or contained within a small area. Negligible (1) o Negligible to no damage to the environment.
14
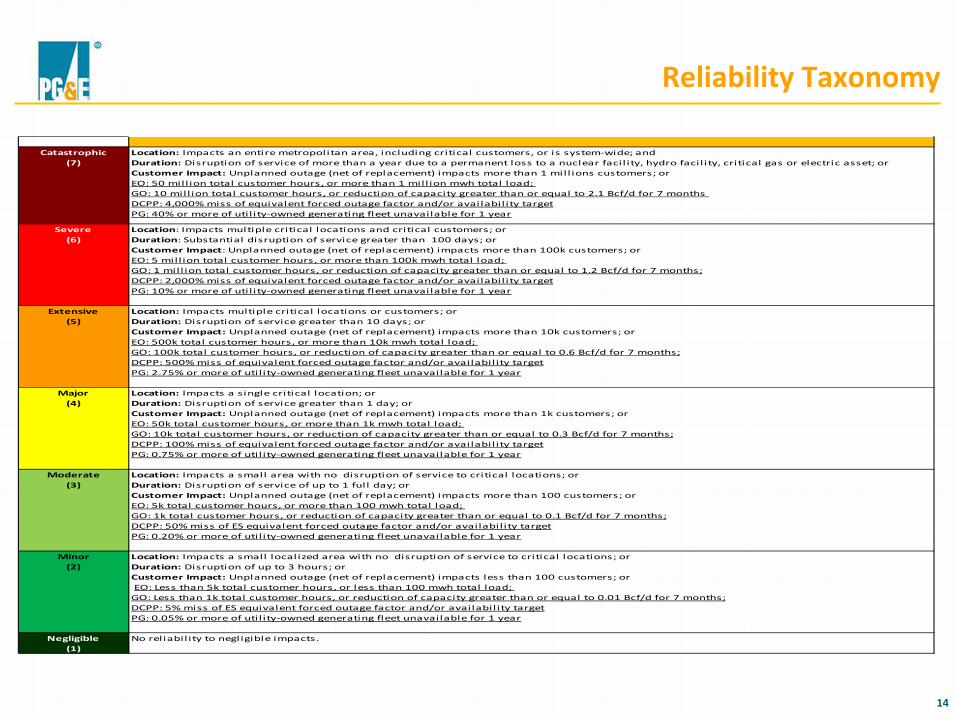
Reliability Taxonomy
Catastrophic(7)
Location: Impacts an entire metropolitan area, including critical customers, or is system-wide; andDuration: Disruption of service of more than a year due to a permanent loss to a nuclear facil ity, hydro facil ity, critical gas or electric asset; orCustomer Impact: Unplanned outage (net of replacement) impacts more than 1 mill ions customers; orEO: 50 mill ion total customer hours, or more than 1 mill ion mwh total load; GO: 10 mill ion total customer hours, or reduction of capacity greater than or equal to 2.1 Bcf/d for 7 months DCPP: 4,000% miss of equivalent forced outage factor and/or availabil ity targetPG: 40% or more of util ity-owned generating fleet unavailable for 1 year
Severe(6)
Location: Impacts multiple critical locations and critical customers; orDuration: Substantial disruption of service greater than 100 days; orCustomer Impact: Unplanned outage (net of replacement) impacts more than 100k customers; orEO: 5 mill ion total customer hours, or more than 100k mwh total load; GO: 1 mill ion total customer hours, or reduction of capacity greater than or equal to 1.2 Bcf/d for 7 months;DCPP: 2,000% miss of equivalent forced outage factor and/or availabil ity targetPG: 10% or more of util ity-owned generating fleet unavailable for 1 year
Extensive(5)
Location: Impacts multiple critical locations or customers; orDuration: Disruption of service greater than 10 days; orCustomer Impact: Unplanned outage (net of replacement) impacts more than 10k customers; orEO: 500k total customer hours, or more than 10k mwh total load; GO: 100k total customer hours, or reduction of capacity greater than or equal to 0.6 Bcf/d for 7 months;DCPP: 500% miss of equivalent forced outage factor and/or availabil ity targetPG: 2.75% or more of util ity-owned generating fleet unavailable for 1 year
Major(4)
Location: Impacts a single critical location; orDuration: Disruption of service greater than 1 day; orCustomer Impact: Unplanned outage (net of replacement) impacts more than 1k customers; orEO: 50k total customer hours, or more than 1k mwh total load; GO: 10k total customer hours, or reduction of capacity greater than or equal to 0.3 Bcf/d for 7 months;DCPP: 100% miss of equivalent forced outage factor and/or availabil ity targetPG: 0.75% or more of util ity-owned generating fleet unavailable for 1 year
Moderate(3)
Location: Impacts a small area with no disruption of service to critical locations; orDuration: Disruption of service of up to 1 full day; orCustomer Impact: Unplanned outage (net of replacement) impacts more than 100 customers; orEO: 5k total customer hours, or more than 100 mwh total load; GO: 1k total customer hours, or reduction of capacity greater than or equal to 0.1 Bcf/d for 7 months;DCPP: 50% miss of ES equivalent forced outage factor and/or availabil ity targetPG: 0.20% or more of util ity-owned generating fleet unavailable for 1 year
Minor(2)
Location: Impacts a small localized area with no disruption of service to critical locations; orDuration: Disruption of up to 3 hours; orCustomer Impact: Unplanned outage (net of replacement) impacts less than 100 customers; or EO: Less than 5k total customer hours, or less than 100 mwh total load; GO: Less than 1k total customer hours, or reduction of capacity greater than or equal to 0.01 Bcf/d for 7 months;DCPP: 5% miss of ES equivalent forced outage factor and/or availabil ity targetPG: 0.05% or more of util ity-owned generating fleet unavailable for 1 year
Negligible(1)
No reliabil ity to negligible impacts.
15
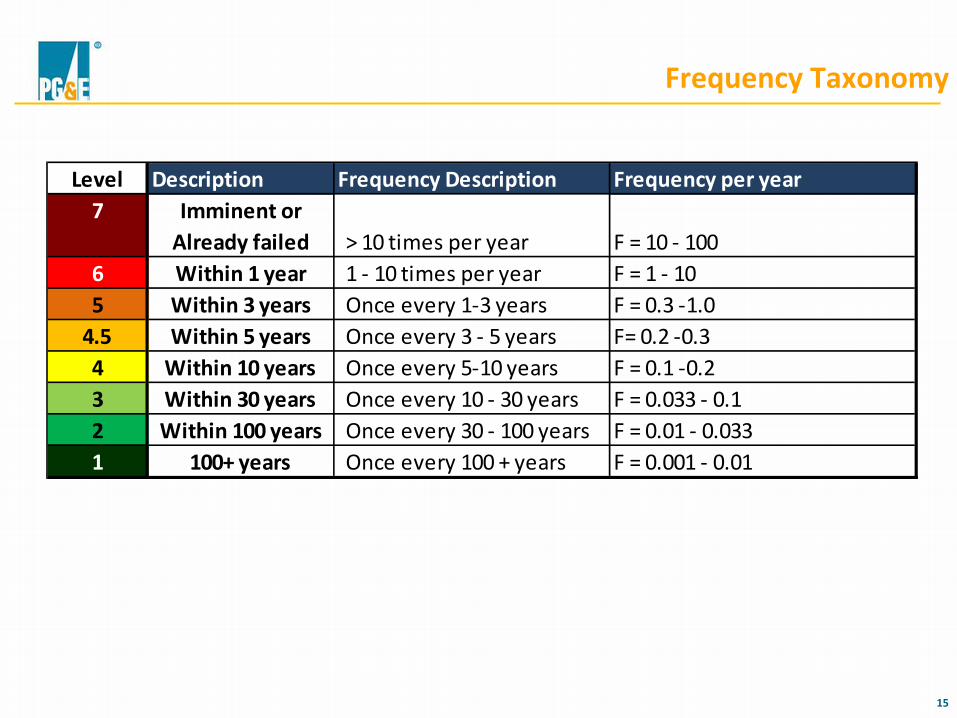
Frequency Taxonomy
Level Description Frequency Description Frequency per year7 Imminent or
Already failed > 10 times per year F = 10 - 1006 Within 1 year 1 - 10 times per year F = 1 - 105 Within 3 years Once every 1-3 years F = 0.3 -1.0
4.5 Within 5 years Once every 3 - 5 years F= 0.2 -0.34 Within 10 years Once every 5-10 years F = 0.1 -0.23 Within 30 years Once every 10 - 30 years F = 0.033 - 0.12 Within 100 years Once every 30 - 100 years F = 0.01 - 0.0331 100+ years Once every 100 + years F = 0.001 - 0.01
16
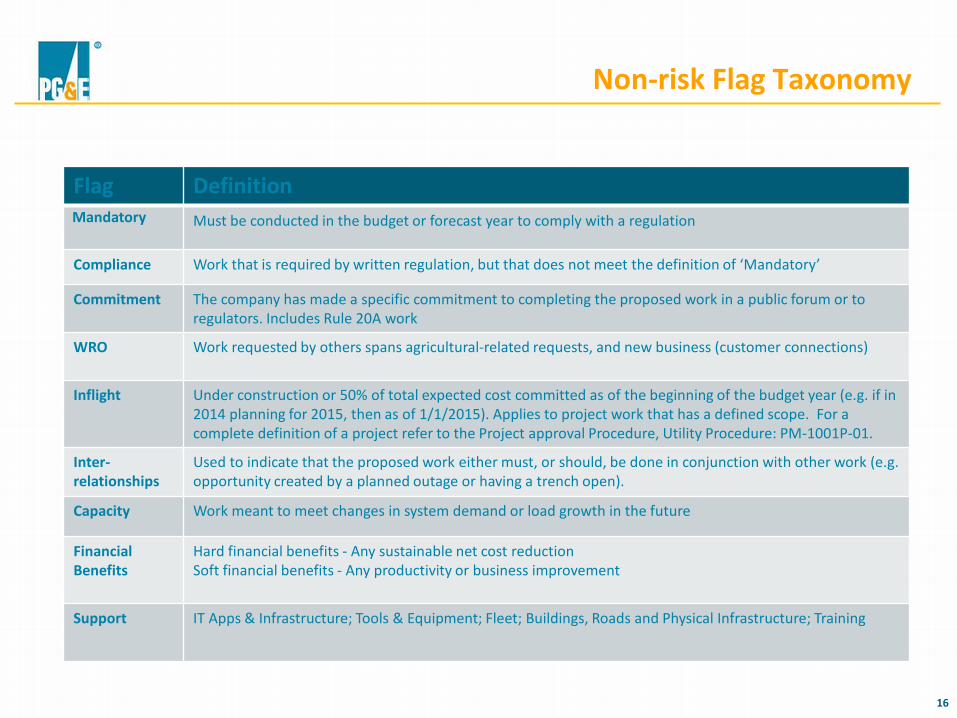
Non-risk Flag Taxonomy
Flag Definition Mandatory Must be conducted in the budget or forecast year to comply with a regulation
Compliance Work that is required by written regulation, but that does not meet the definition of ‘Mandatory’
Commitment The company has made a specific commitment to completing the proposed work in a public forum or to regulators. Includes Rule 20A work
WRO Work requested by others spans agricultural-related requests, and new business (customer connections)
Inflight Under construction or 50% of total expected cost committed as of the beginning of the budget year (e.g. if in 2014 planning for 2015, then as of 1/1/2015). Applies to project work that has a defined scope. For a complete definition of a project refer to the Project approval Procedure, Utility Procedure: PM-1001P-01.
Inter-relationships
Used to indicate that the proposed work either must, or should, be done in conjunction with other work (e.g. opportunity created by a planned outage or having a trench open).
Capacity Work meant to meet changes in system demand or load growth in the future
Financial Benefits
Hard financial benefits - Any sustainable net cost reduction Soft financial benefits - Any productivity or business improvement
Support IT Apps & Infrastructure; Tools & Equipment; Fleet; Buildings, Roads and Physical Infrastructure; Training
17
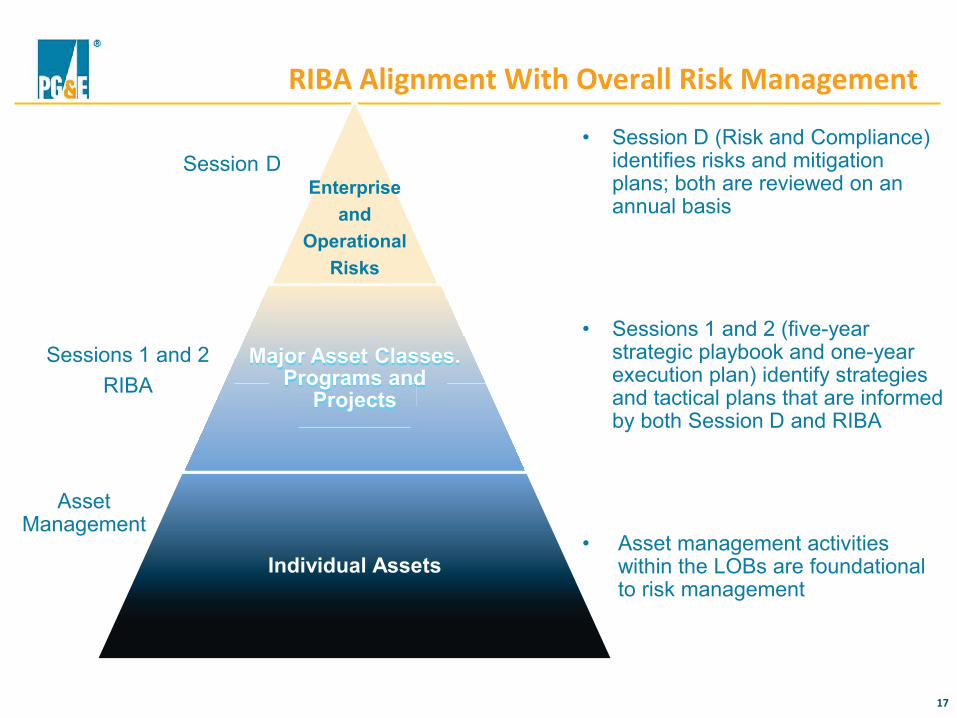
RIBA Alignment With Overall Risk Management