Embed Size (px)
Citation preview
THISEXIT
MARKET
In Today’s Global Food & Beverage Environment
A Conversation with Ag Communicators
June 7, 2017
SNAPSHOT OF FOOD & BEVERAGE TRUST
• While trust in institutions around the world see a broad decline,
food and beverage continues to earn trust with both the mass
population and the Informed Public.
• However, the gap between the mass population and Informed
Public saw its sharpest growth in the past five years. The sector’s
success in conversing with the Informed Public is threatening to
leave mass population behind in bigger ways than before.
• While food and beverage enjoys a higher trust level than business
writ large, it is crucial to proactively seek to earn more trust/protect
trust – use it responsibly or risk losing it.
• “Swing trusters” – the largest group of constituents – are the food
and beverage industry’s equivalent to “on-the-fence” voters, and
continue to be a key determiner in which way the trust pendulum
could swing.
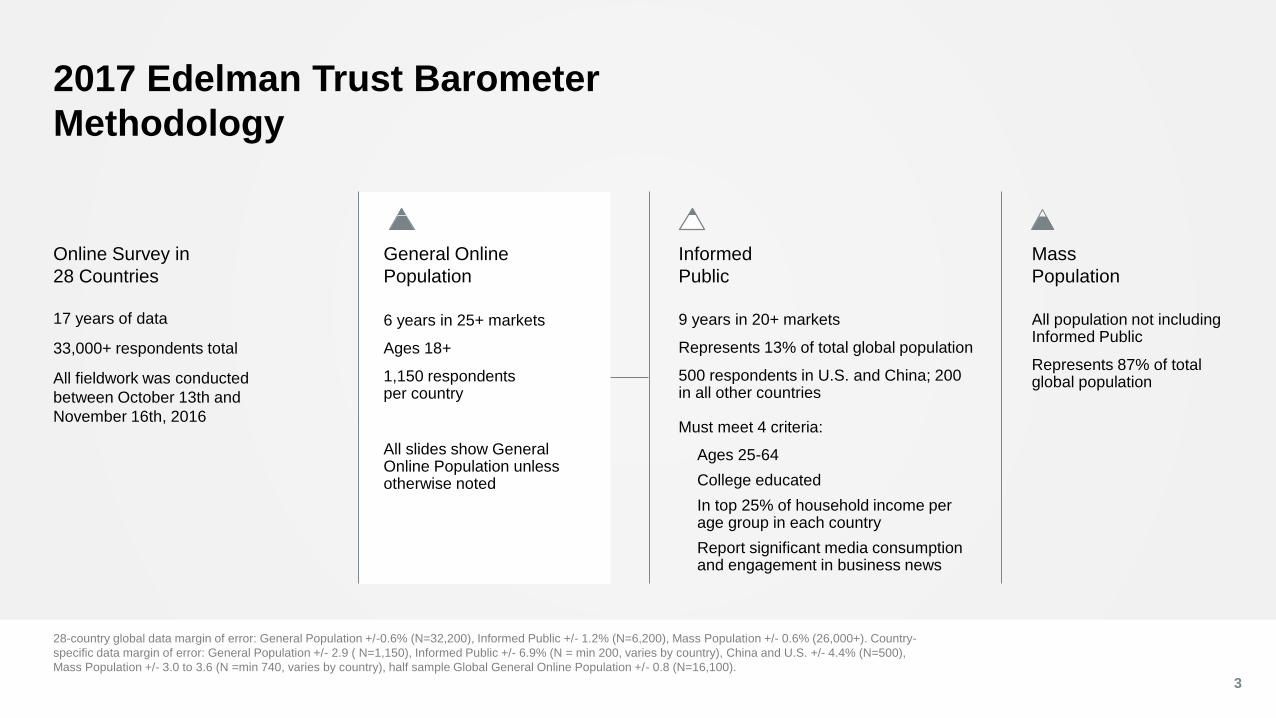
Informed
Public
9 years in 20+ markets
Represents 13% of total global population
500 respondents in U.S. and China; 200 in all other countries
Must meet 4 criteria:
Ages 25-64
College educated
In top 25% of household income per age group in each country
Report significant media consumption and engagement in business news
General Online
Population
6 years in 25+ markets
Ages 18+
1,150 respondents per country
All slides show General Online Population unless otherwise noted
2017 Edelman Trust Barometer
Methodology
28-country global data margin of error: General Population +/-0.6% (N=32,200), Informed Public +/- 1.2% (N=6,200), Mass Population +/- 0.6% (26,000+). Country-
specific data margin of error: General Population +/- 2.9 ( N=1,150), Informed Public +/- 6.9% (N = min 200, varies by country), China and U.S. +/- 4.4% (N=500),
Mass Population +/- 3.0 to 3.6 (N =min 740, varies by country), half sample Global General Online Population +/- 0.8 (N=16,100).
3
17 years of data
33,000+ respondents total
All fieldwork was conducted
between October 13th and
November 16th, 2016
Online Survey in
28 Countries
Mass
Population
All population not including Informed Public
Represents 87% of total global population

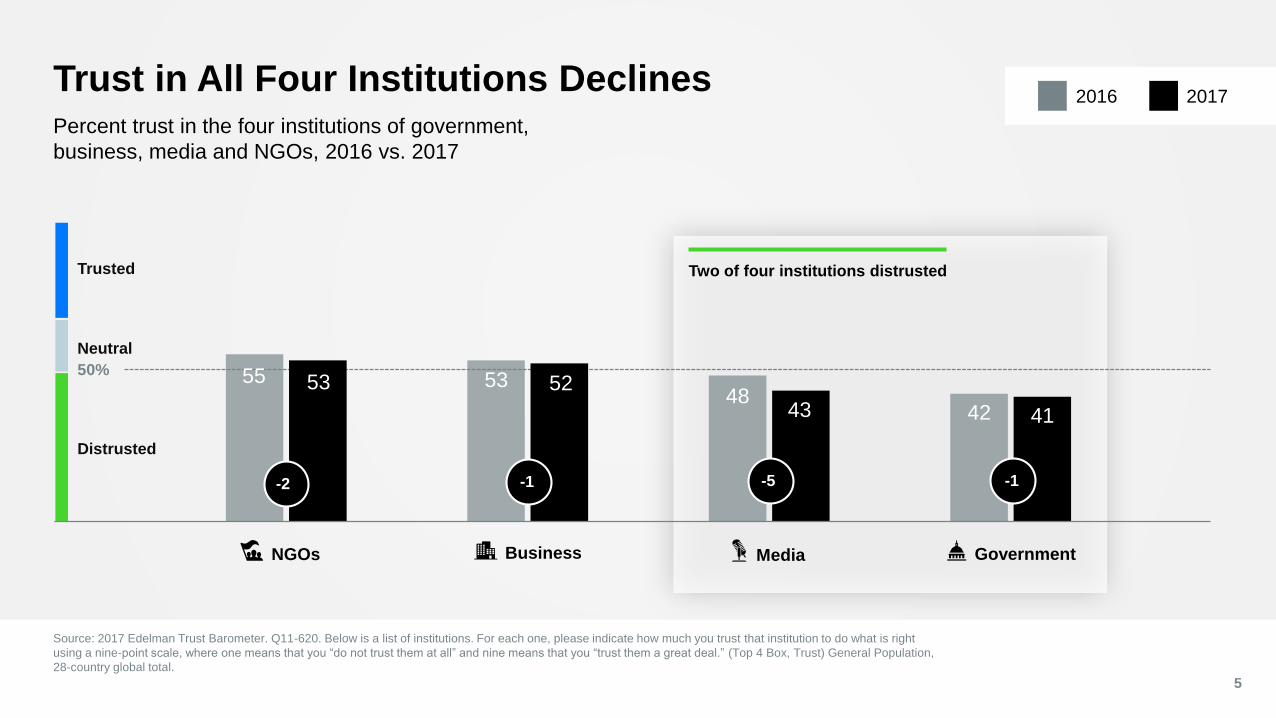
50% 55 5348
42
53 52
43 41
Trust in All Four Institutions Declines
Source: 2017 Edelman Trust Barometer. Q11-620. Below is a list of institutions. For each one, please indicate how much you trust that institution to do what is right
using a nine-point scale, where one means that you “do not trust them at all” and nine means that you “trust them a great deal.” (Top 4 Box, Trust) General Population,
28-country global total.
5
Percent trust in the four institutions of government,
business, media and NGOs, 2016 vs. 2017
Business MediaNGOs Government
Two of four institutions distrusted
Neutral
Trusted
Distrusted
-2 -1 -5 -1
20172016
6
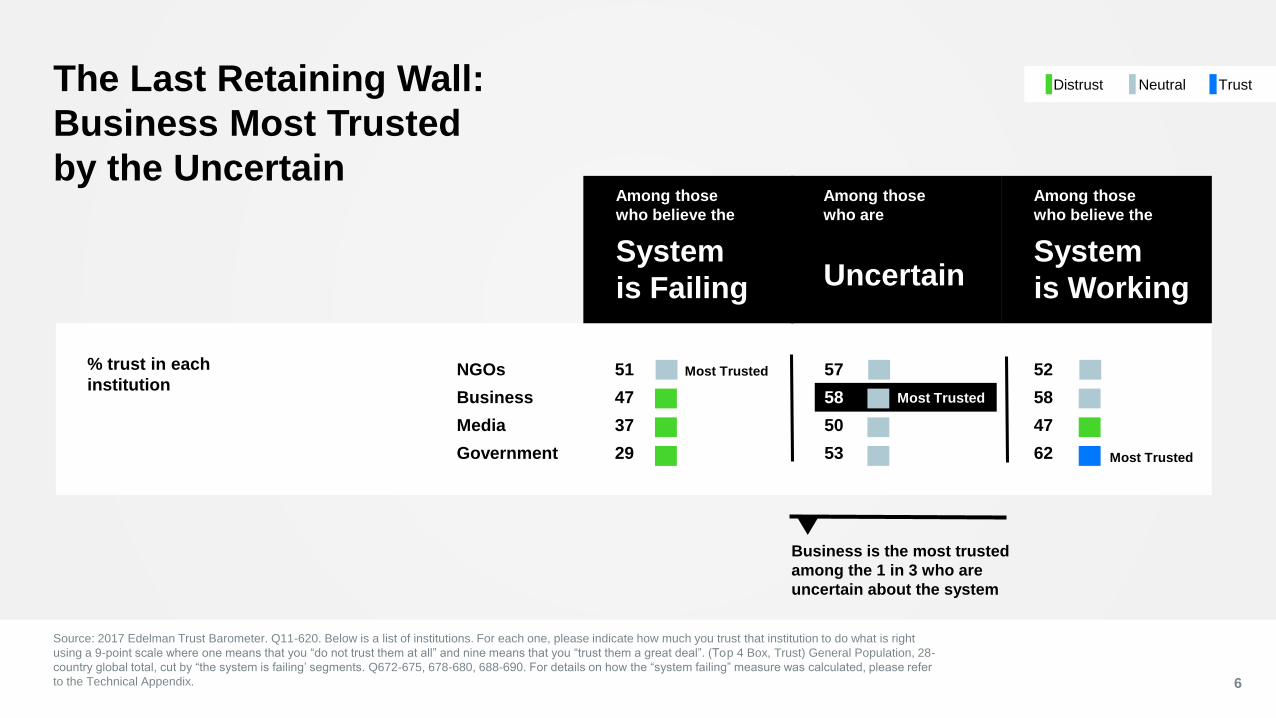
Most Trusted
Business is the most trusted
among the 1 in 3 who are
uncertain about the system
The Last Retaining Wall:
Business Most Trusted
by the Uncertain
Source: 2017 Edelman Trust Barometer. Q11-620. Below is a list of institutions. For each one, please indicate how much you trust that institution to do what is right
using a 9-point scale where one means that you “do not trust them at all” and nine means that you “trust them a great deal”. (Top 4 Box, Trust) General Population, 28-
country global total, cut by “the system is failing’ segments. Q672-675, 678-680, 688-690. For details on how the “system failing” measure was calculated, please refer
to the Technical Appendix.
NeutralDistrust Trust
% trust in each
institution
Among those
who believe the
System
is Working
Among those
who are
Uncertain
Among those
who believe the
System
is Failing
Most Trusted
Most Trusted
NGOs 51 57 52
Business 47 58 58
Media 37 50 47
Government 29 53 62
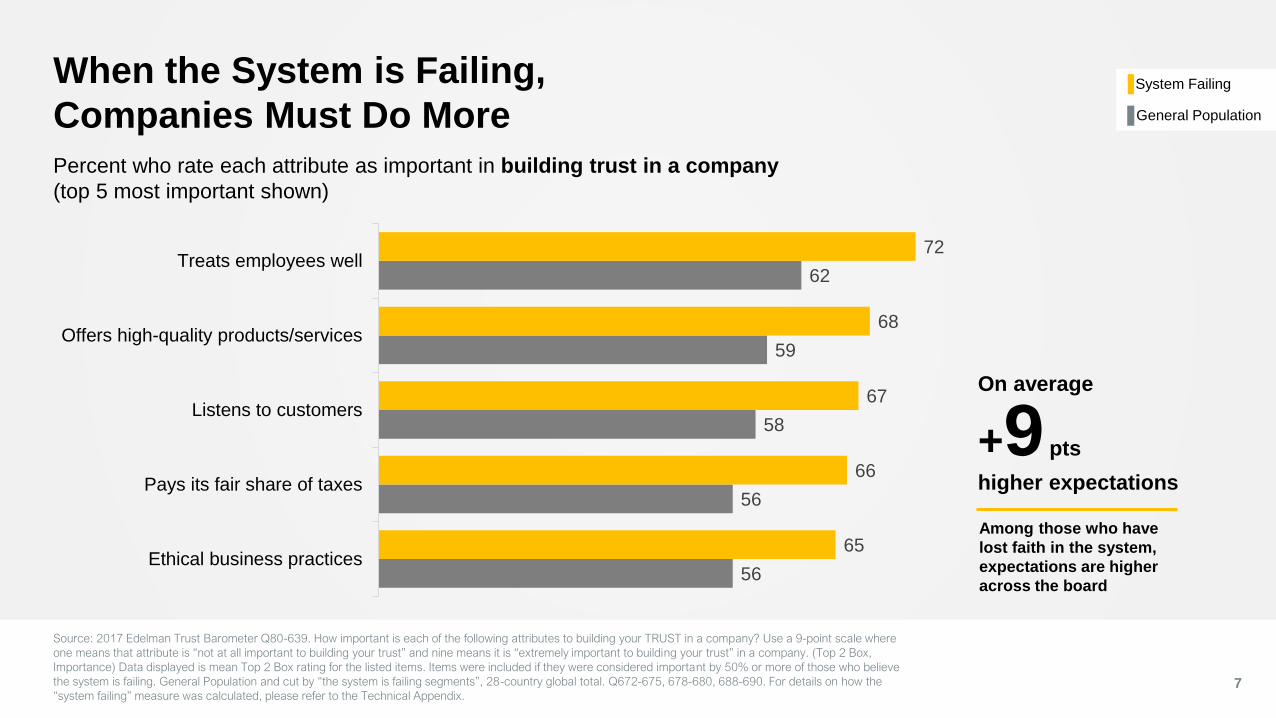
When the System is Failing,
Companies Must Do More
Source: 2017 Edelman Trust Barometer Q80-639. How important is each of the following attributes to building your TRUST in a company? Use a 9-point scale where
one means that attribute is “not at all important to building your trust” and nine means it is “extremely important to building your trust” in a company. (Top 2 Box,
Importance) Data displayed is mean Top 2 Box rating for the listed items. Items were included if they were considered important by 50% or more of those who believe
the system is failing. General Population and cut by “the system is failing segments”, 28-country global total. Q672-675, 678-680, 688-690. For details on how the
“system failing” measure was calculated, please refer to the Technical Appendix.7
Percent who rate each attribute as important in building trust in a company
(top 5 most important shown)
56
56
58
59
62
65
66
67
68
72
Ethical business practices
Pays its fair share of taxes
Listens to customers
Offers high-quality products/services
Treats employees well
Among those who have
lost faith in the system,
expectations are higher
across the board
On average
+9 pts
higher expectations
System Failing
General Population
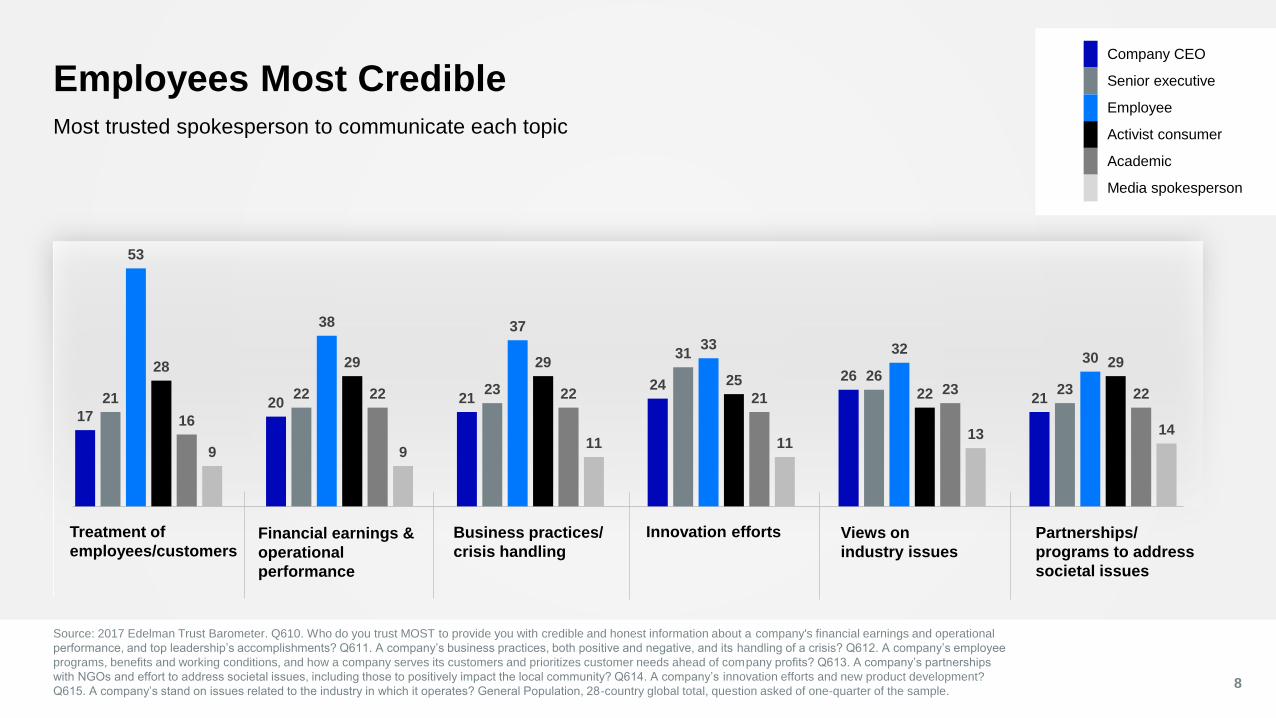
Partnerships/
programs to address
societal issues
Business practices/
crisis handlingFinancial earnings &
operational
performance
Employees Most Credible
Source: 2017 Edelman Trust Barometer. Q610. Who do you trust MOST to provide you with credible and honest information about a company's financial earnings and operational
performance, and top leadership’s accomplishments? Q611. A company’s business practices, both positive and negative, and its handling of a crisis? Q612. A company’s employee
programs, benefits and working conditions, and how a company serves its customers and prioritizes customer needs ahead of company profits? Q613. A company’s partnerships
with NGOs and effort to address societal issues, including those to positively impact the local community? Q614. A company’s innovation efforts and new product development?
Q615. A company’s stand on issues related to the industry in which it operates? General Population, 28-country global total, question asked of one-quarter of the sample.8
Most trusted spokesperson to communicate each topic
Innovation effortsTreatment of
employees/customersViews on
industry issues
Company CEO
Senior executive
Employee
Activist consumer
Academic
Media spokesperson
1720 21
2426
2121 22 23
31
2623
53
38 37
33 3230
28 29 29
2522
29
16
22 22 2123 22
9 911 11
13 14
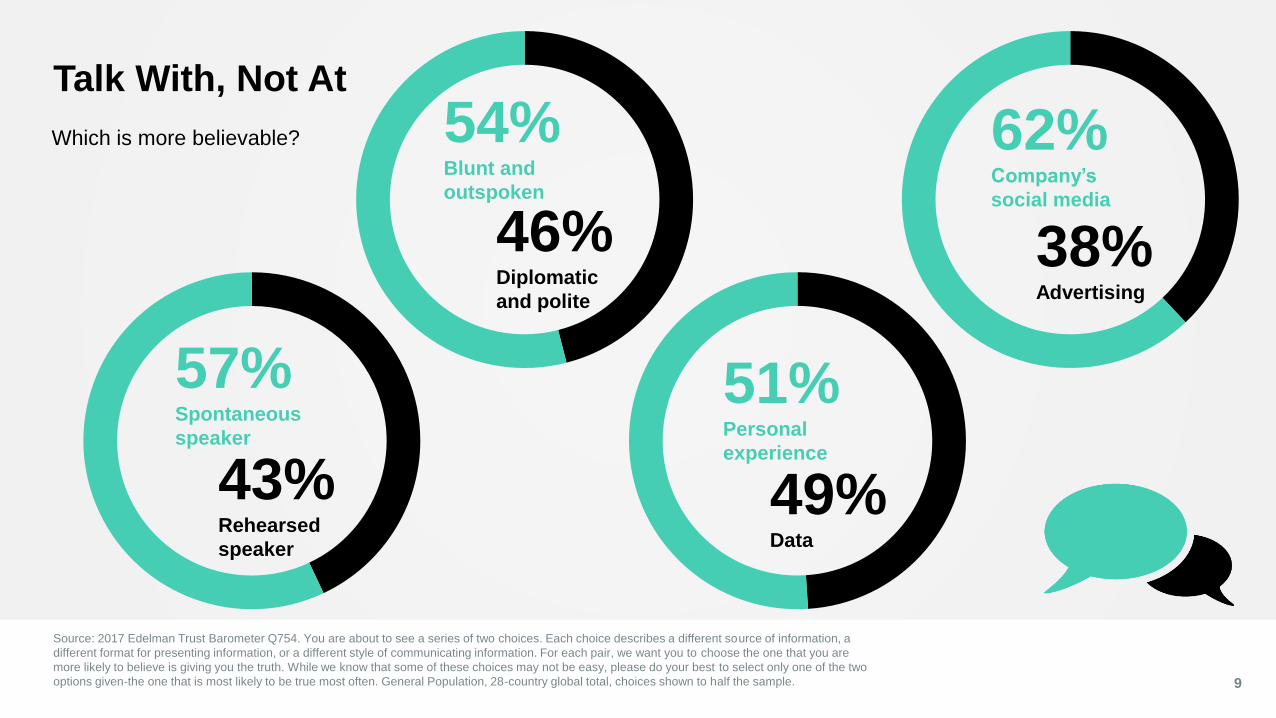
Which is more believable?
Talk With, Not At
9
Source: 2017 Edelman Trust Barometer Q754. You are about to see a series of two choices. Each choice describes a different source of information, a
different format for presenting information, or a different style of communicating information. For each pair, we want you to choose the one that you are
more likely to believe is giving you the truth. While we know that some of these choices may not be easy, please do your best to select only one of the two
options given-the one that is most likely to be true most often. General Population, 28-country global total, choices shown to half the sample.
51% Personal
experience
49% Data
57% Spontaneous
speaker
43% Rehearsed
speaker
54% Blunt and
outspoken
46% Diplomatic
and polite
62% Company’s
social media
38% Advertising
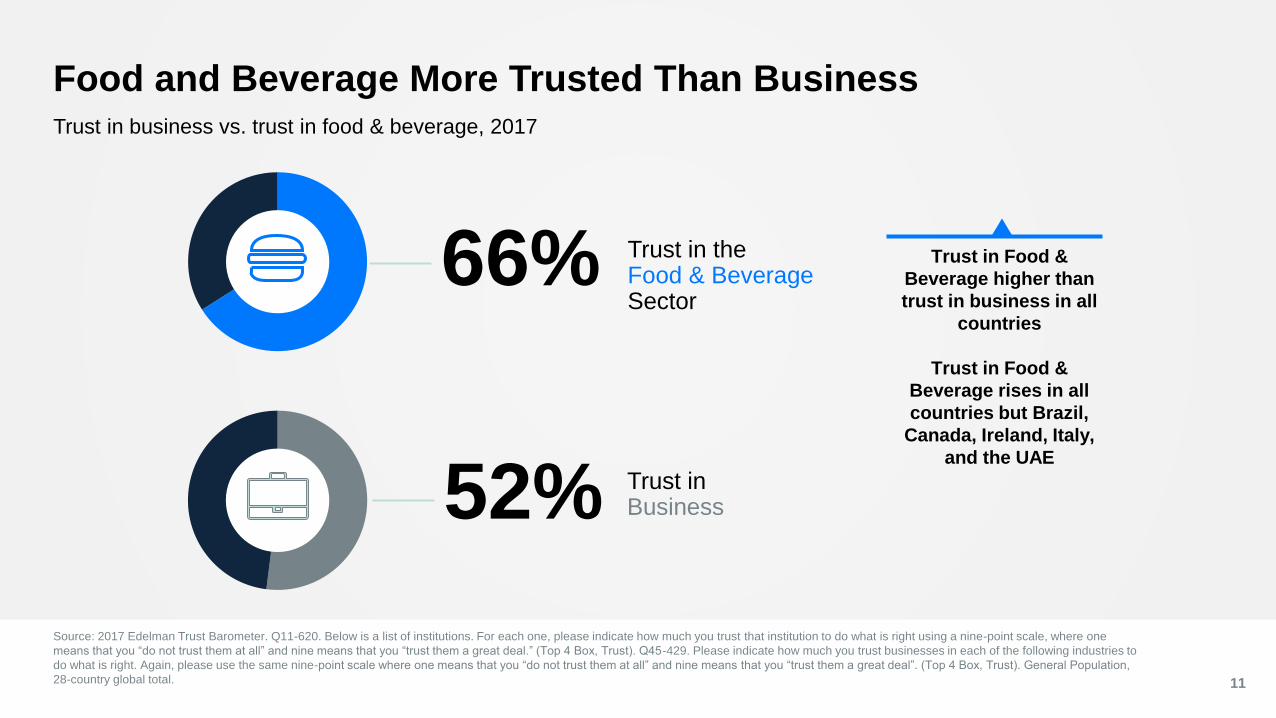
Food and Beverage More Trusted Than Business
11
Trust in business vs. trust in food & beverage, 2017
Trust in Business
Trust in the Food & Beverage Sector
52%
66% Trust in Food &
Beverage higher than
trust in business in all
countries
Trust in Food &
Beverage rises in all
countries but Brazil,
Canada, Ireland, Italy,
and the UAE
Source: 2017 Edelman Trust Barometer. Q11-620. Below is a list of institutions. For each one, please indicate how much you trust that institution to do what is right using a nine-point scale, where one
means that you “do not trust them at all” and nine means that you “trust them a great deal.” (Top 4 Box, Trust). Q45-429. Please indicate how much you trust businesses in each of the following industries to
do what is right. Again, please use the same nine-point scale where one means that you “do not trust them at all” and nine means that you “trust them a great deal”. (Top 4 Box, Trust). General Population,
28-country global total.
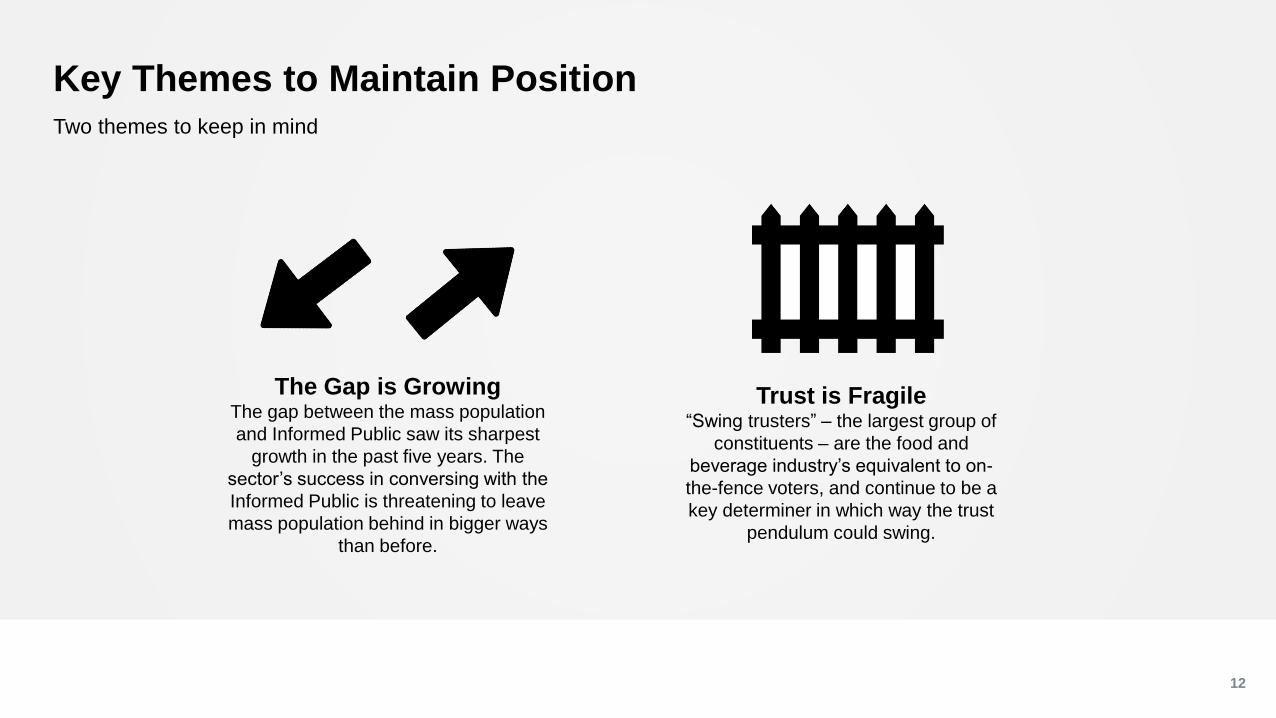
Key Themes to Maintain Position
12
Two themes to keep in mind
The Gap is GrowingThe gap between the mass population
and Informed Public saw its sharpest
growth in the past five years. The
sector’s success in conversing with the
Informed Public is threatening to leave
mass population behind in bigger ways
than before.
Trust is Fragile“Swing trusters” – the largest group of
constituents – are the food and
beverage industry’s equivalent to on-
the-fence voters, and continue to be a
key determiner in which way the trust
pendulum could swing.
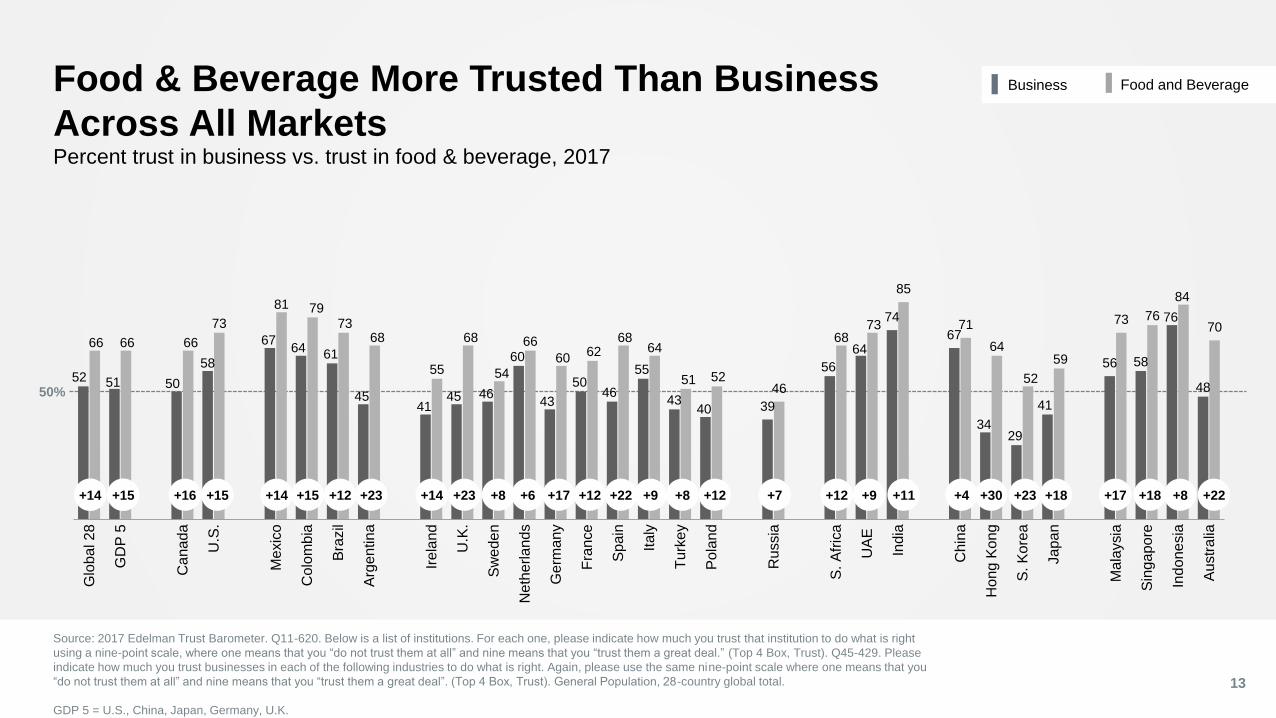
Food & Beverage More Trusted Than Business
Across All Markets
13
Percent trust in business vs. trust in food & beverage, 2017
52 51 50
58
6764
61
4541
45 46
60
43
5046
55
4340 39
56
64
74
67
3429
41
56 58
76
48
66 66 66
73
81 7973
68
55
68
54
66
6062
6864
51 5246
6873
85
71
64
52
59
73 76
84
70
Glo
ba
l 2
8
GD
P 5
Ca
na
da
U.S
.
Me
xic
o
Co
lom
bia
Bra
zil
Arg
en
tin
a
Ire
land
U.K
.
Sw
ede
n
Ne
the
rla
nd
s
Ge
rma
ny
Fra
nce
Sp
ain
Ita
ly
Turk
ey
Po
land
Ru
ssia
S. A
fric
a
UA
E
India
Ch
ina
Ho
ng
Ko
ng
S. K
ore
a
Ja
pa
n
Ma
laysia
Sin
ga
po
re
Indo
ne
sia
Au
str
alia
50%
+22 +9 +12 +7 +12 +9 +11 +4 +30 +23 +18 +17 +18 +8 +22+16 +15+14 +12+8 +6 +17+23+12 +23 +14+14 +15 +8+15
Source: 2017 Edelman Trust Barometer. Q11-620. Below is a list of institutions. For each one, please indicate how much you trust that institution to do what is right
using a nine-point scale, where one means that you “do not trust them at all” and nine means that you “trust them a great deal.” (Top 4 Box, Trust). Q45-429. Please
indicate how much you trust businesses in each of the following industries to do what is right. Again, please use the same nine-point scale where one means that you
“do not trust them at all” and nine means that you “trust them a great deal”. (Top 4 Box, Trust). General Population, 28-country global total.
GDP 5 = U.S., China, Japan, Germany, U.K.
Food and BeverageBusiness
63 6364
6364
66
47
5049 49
5352
2012 2013 2014 2015 2016 2017
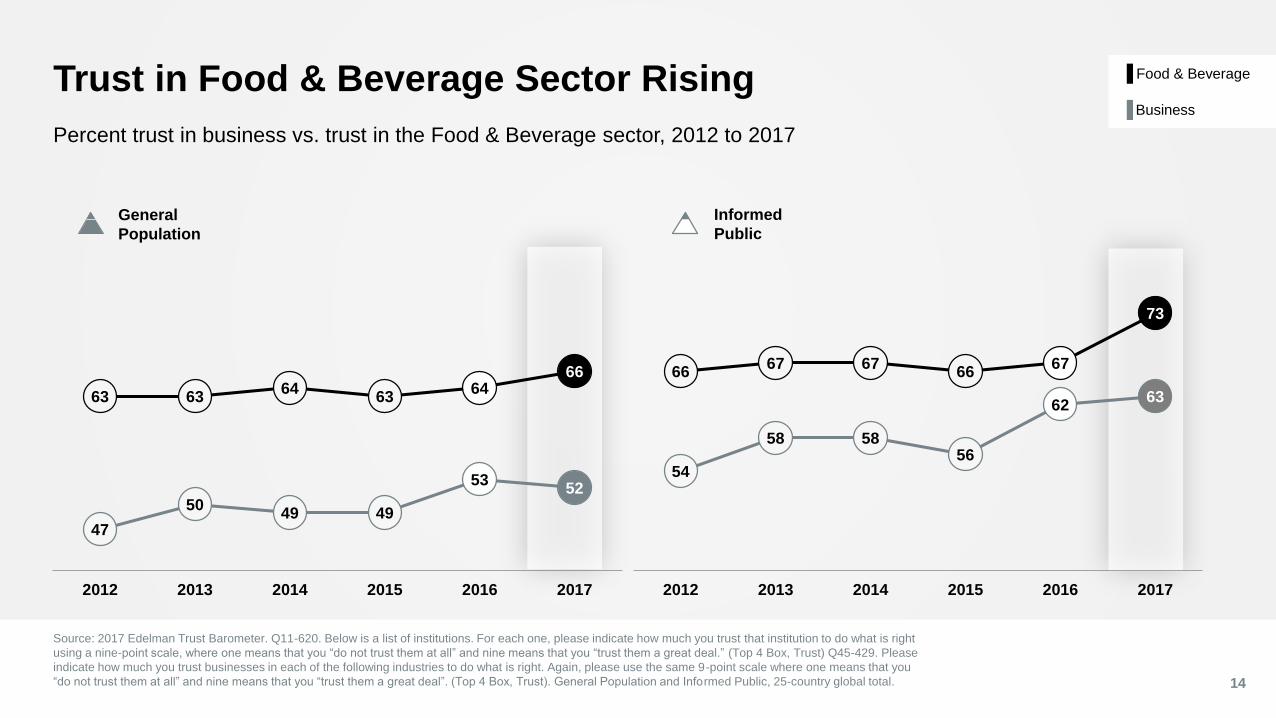
Trust in Food & Beverage Sector Rising
14
Percent trust in business vs. trust in the Food & Beverage sector, 2012 to 2017
Food & Beverage
Business
6667 67
6667
73
54
58 5856
6263
2012 2013 2014 2015 2016 2017
General
Population
Informed
Public
Source: 2017 Edelman Trust Barometer. Q11-620. Below is a list of institutions. For each one, please indicate how much you trust that institution to do what is right
using a nine-point scale, where one means that you “do not trust them at all” and nine means that you “trust them a great deal.” (Top 4 Box, Trust) Q45-429. Please
indicate how much you trust businesses in each of the following industries to do what is right. Again, please use the same 9-point scale where one means that you
“do not trust them at all” and nine means that you “trust them a great deal”. (Top 4 Box, Trust). General Population and Informed Public, 25-country global total.
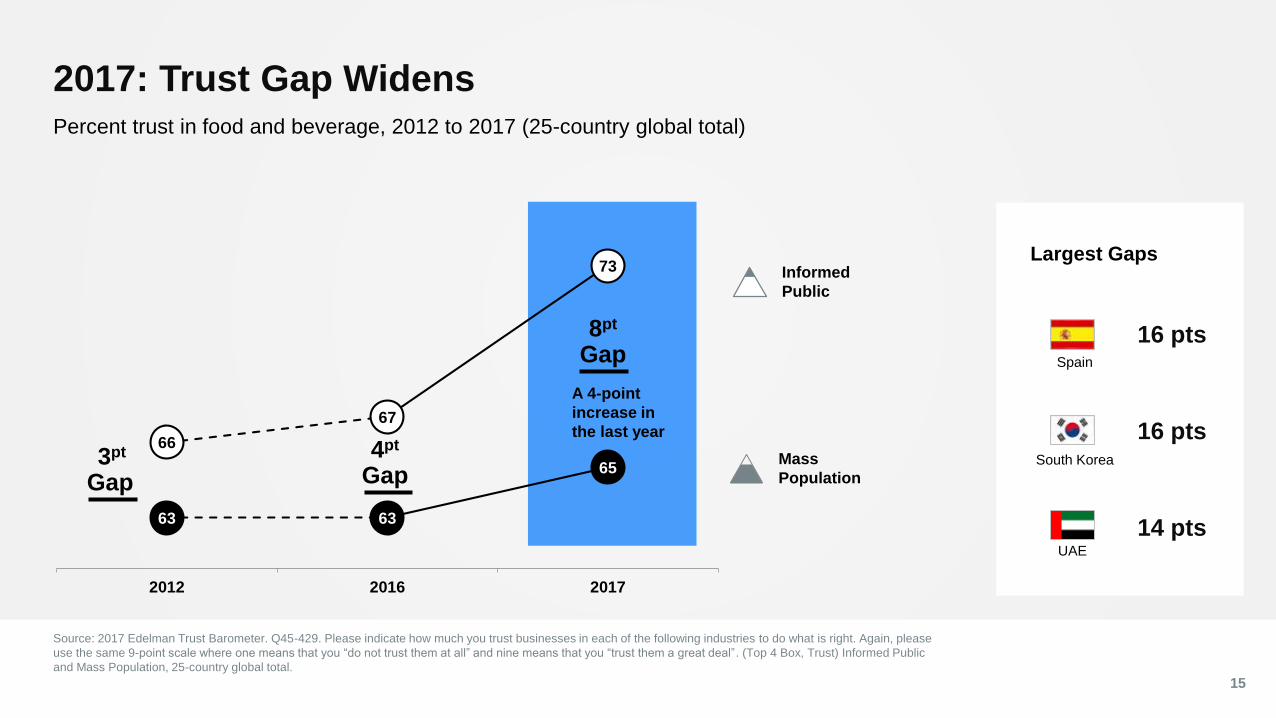
2017: Trust Gap Widens
Source: 2017 Edelman Trust Barometer. Q45-429. Please indicate how much you trust businesses in each of the following industries to do what is right. Again, please
use the same 9-point scale where one means that you “do not trust them at all” and nine means that you “trust them a great deal”. (Top 4 Box, Trust) Informed Public
and Mass Population, 25-country global total.
15
Percent trust in food and beverage, 2012 to 2017 (25-country global total)
16 pts
16 pts
14 pts
66
67
73
63 63
65
2012 2016 2017
Informed
Public
8pt
Gap
3pt
Gap
A 4-point
increase in
the last year
4pt
Gap
Largest Gaps
Mass
Population
Spain
South Korea
UAE
66 66
4651 52 52 54 55
59 60 62 64 64 66 66 68 68 68 68 70 71 73 73 73 7376
79 8184 85
Glo
ba
l 2
8
GD
P 5
Ru
ssia
Turk
ey
Po
land
S. K
ore
a
Sw
ed
en
Ire
land
Ja
pa
n
Ge
rma
ny
Fra
nce
Ho
ng
Ko
ng
Ita
ly
Ca
na
da
Ne
the
rla
nd
s
Arg
en
tin
a
S. A
fric
a
Sp
ain
U.K
.
Au
str
alia
Ch
ina
Bra
zil
Ma
laysia
UA
E
U.S
.
Sin
ga
po
re
Colo
mb
ia
Me
xic
o
Indo
ne
sia
India
50%
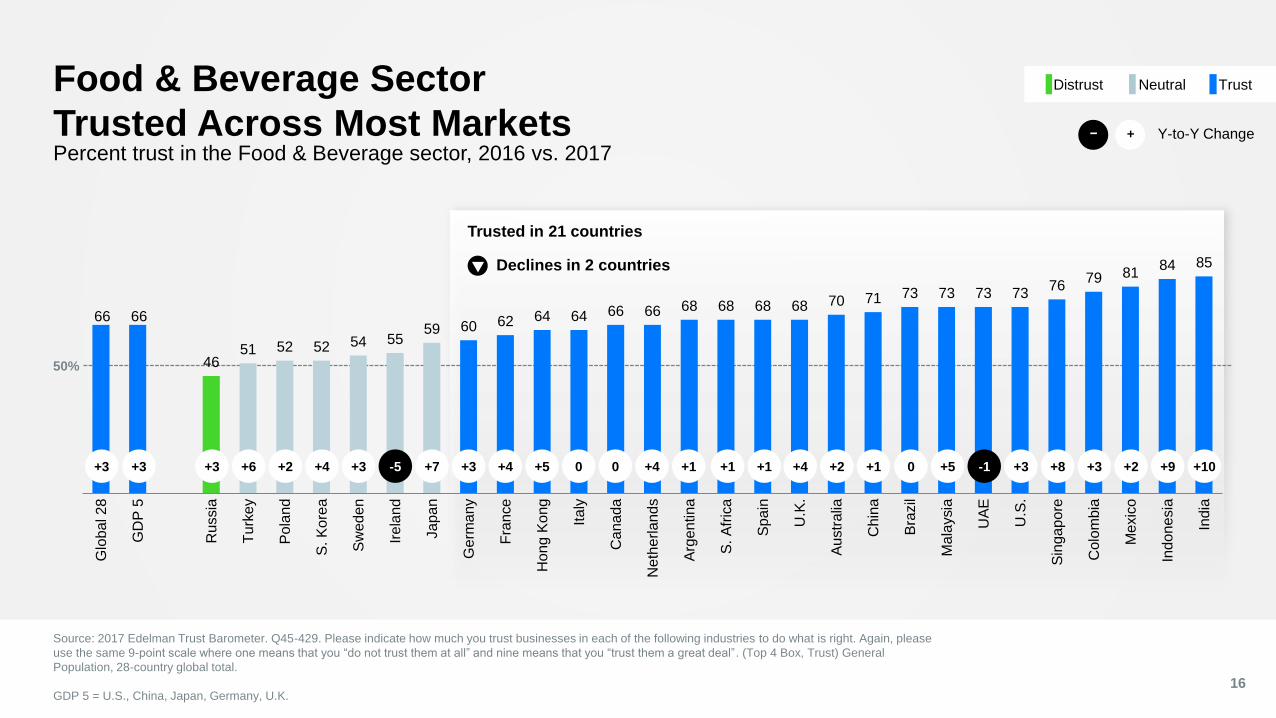
Food & Beverage Sector
Trusted Across Most Markets
Source: 2017 Edelman Trust Barometer. Q45-429. Please indicate how much you trust businesses in each of the following industries to do what is right. Again, please
use the same 9-point scale where one means that you “do not trust them at all” and nine means that you “trust them a great deal”. (Top 4 Box, Trust) General
Population, 28-country global total.
GDP 5 = U.S., China, Japan, Germany, U.K. 16
Percent trust in the Food & Beverage sector, 2016 vs. 2017
Trusted in 21 countries
+4 +1 +1 +4 +2 +1 0 +5 -1 +3 +8 +3 +2 +9 +10+3 +6+3 0+4 +5 0+3+3 -5 +7+2 +4 +1+3
Declines in 2 countries
Y-to-Y Change+−
NeutralDistrust Trust
74 73
5458 59 59
62 63 64 65 66 6771 71 72 73 73 74 75
78 79 81 81 82 82 82 8287 88 88
Glo
ba
l 2
8
GD
P 5
Ru
ssia
Turk
ey
Po
land
Sw
ed
en
Ire
land
Ja
pa
n
Ne
the
rla
nd
s
S. K
ore
a
Ge
rma
ny
S. A
fric
a
Ca
na
da
Ita
ly
Fra
nce
Ho
ng
Ko
ng
U.K
.
Arg
en
tin
a
Au
str
alia
Sin
ga
po
re
Ma
laysia
Bra
zil
Ch
ina
Colo
mb
ia
Me
xic
o
Sp
ain
U.S
.
UA
E
India
Indo
ne
sia
50%
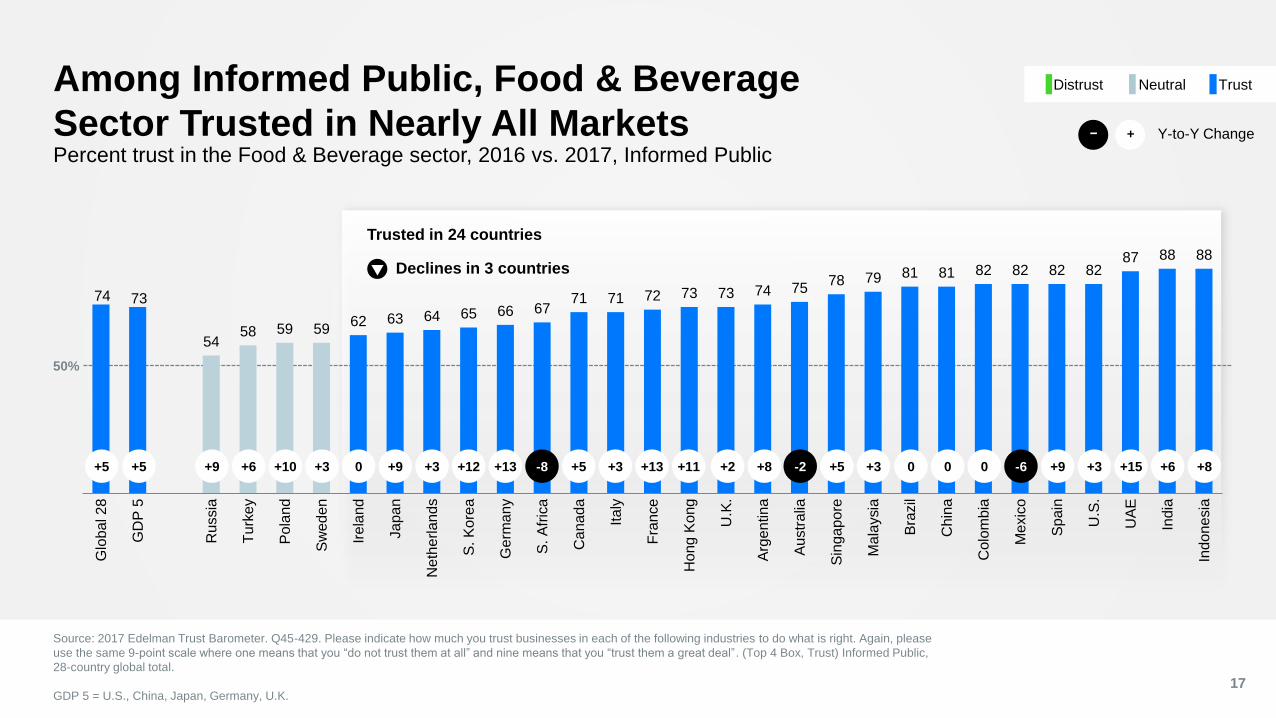
Among Informed Public, Food & Beverage
Sector Trusted in Nearly All Markets
Source: 2017 Edelman Trust Barometer. Q45-429. Please indicate how much you trust businesses in each of the following industries to do what is right. Again, please
use the same 9-point scale where one means that you “do not trust them at all” and nine means that you “trust them a great deal”. (Top 4 Box, Trust) Informed Public,
28-country global total.
GDP 5 = U.S., China, Japan, Germany, U.K. 17
Percent trust in the Food & Beverage sector, 2016 vs. 2017, Informed PublicY-to-Y Change+−
NeutralDistrust Trust
+13 +11 +8 -2 +5 +3 0 0 0 -6 +9 +3 +15 +6 +8+9 +6+5 +3+13 -8 +5+120 +9 +3+10 +3 +2+5
Trusted in 24 countries
Declines in 3 countries
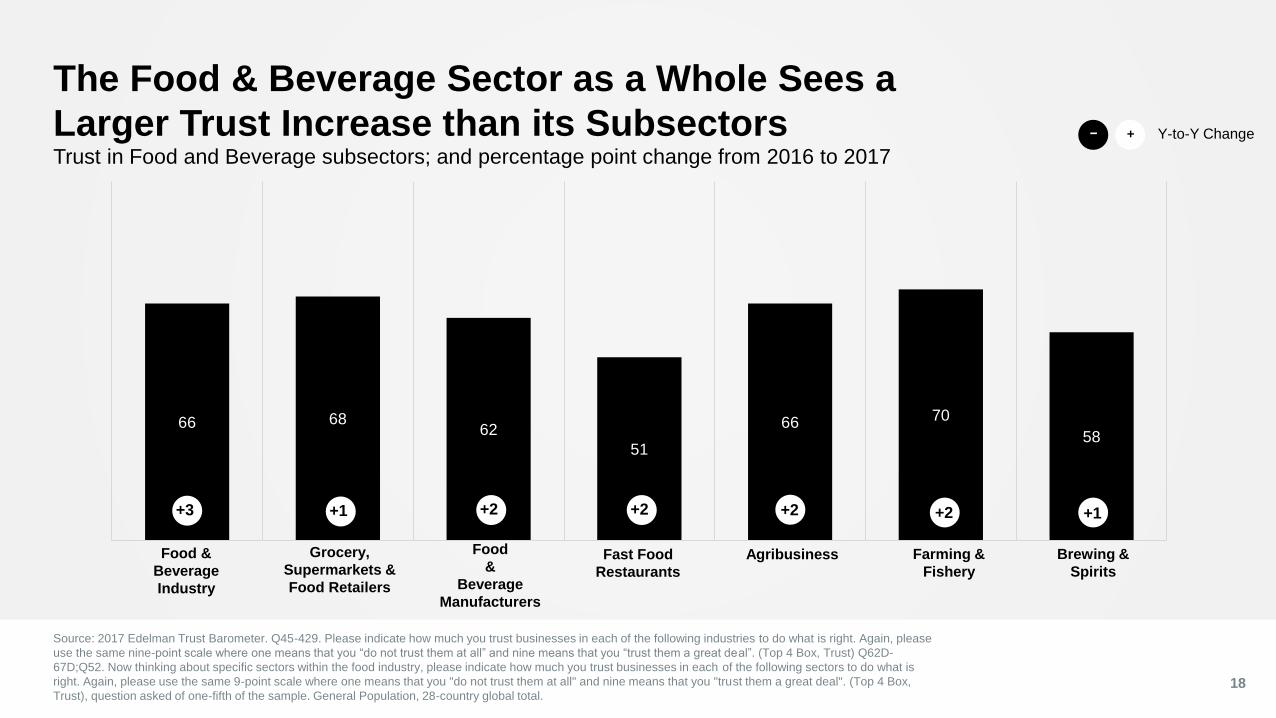
The Food & Beverage Sector as a Whole Sees a
Larger Trust Increase than its Subsectors
Source: 2017 Edelman Trust Barometer. Q45-429. Please indicate how much you trust businesses in each of the following industries to do what is right. Again, please
use the same nine-point scale where one means that you “do not trust them at all” and nine means that you “trust them a great deal”. (Top 4 Box, Trust) Q62D-
67D;Q52. Now thinking about specific sectors within the food industry, please indicate how much you trust businesses in each of the following sectors to do what is
right. Again, please use the same 9-point scale where one means that you "do not trust them at all" and nine means that you "trust them a great deal". (Top 4 Box,
Trust), question asked of one-fifth of the sample. General Population, 28-country global total.18
Trust in Food and Beverage subsectors; and percentage point change from 2016 to 2017
66 6862
51
66 70
58
Food &
Beverage
Industry
Grocery,
Supermarkets &
Food Retailers
Food
&
Beverage
Manufacturers
Fast Food
Restaurants
Agribusiness Farming &
Fishery
Brewing &
Spirits
+1 +2 +2 +2 +1+3 +2
Y-to-Y Change+−
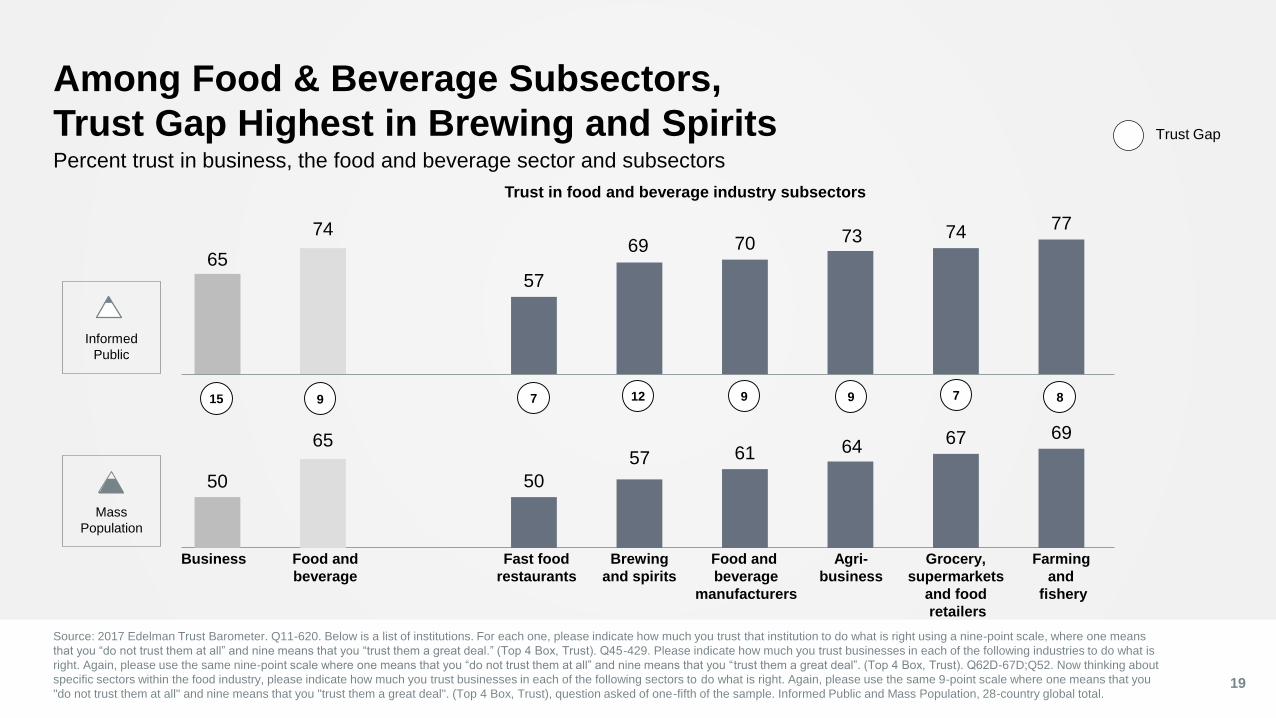
Among Food & Beverage Subsectors,
Trust Gap Highest in Brewing and Spirits
19
Percent trust in business, the food and beverage sector and subsectors
65
74
57
69 70 73 74 77
50
65
50
57 61 6467 69
Food and
beverage
Business
Trust in food and beverage industry subsectors
Food and
beverage
manufacturers
Fast food
restaurants
Agri-
business
Farming
and
fishery
Grocery,
supermarkets
and food
retailers
Informed
Public
Brewing
and spirits
Source: 2017 Edelman Trust Barometer. Q11-620. Below is a list of institutions. For each one, please indicate how much you trust that institution to do what is right using a nine-point scale, where one means
that you “do not trust them at all” and nine means that you “trust them a great deal.” (Top 4 Box, Trust). Q45-429. Please indicate how much you trust businesses in each of the following industries to do what is
right. Again, please use the same nine-point scale where one means that you “do not trust them at all” and nine means that you “trust them a great deal”. (Top 4 Box, Trust). Q62D-67D;Q52. Now thinking about
specific sectors within the food industry, please indicate how much you trust businesses in each of the following sectors to do what is right. Again, please use the same 9-point scale where one means that you
"do not trust them at all" and nine means that you "trust them a great deal". (Top 4 Box, Trust), question asked of one-fifth of the sample. Informed Public and Mass Population, 28-country global total.
Mass
Population
15 9 7 12 9 9 7 8
Trust Gap
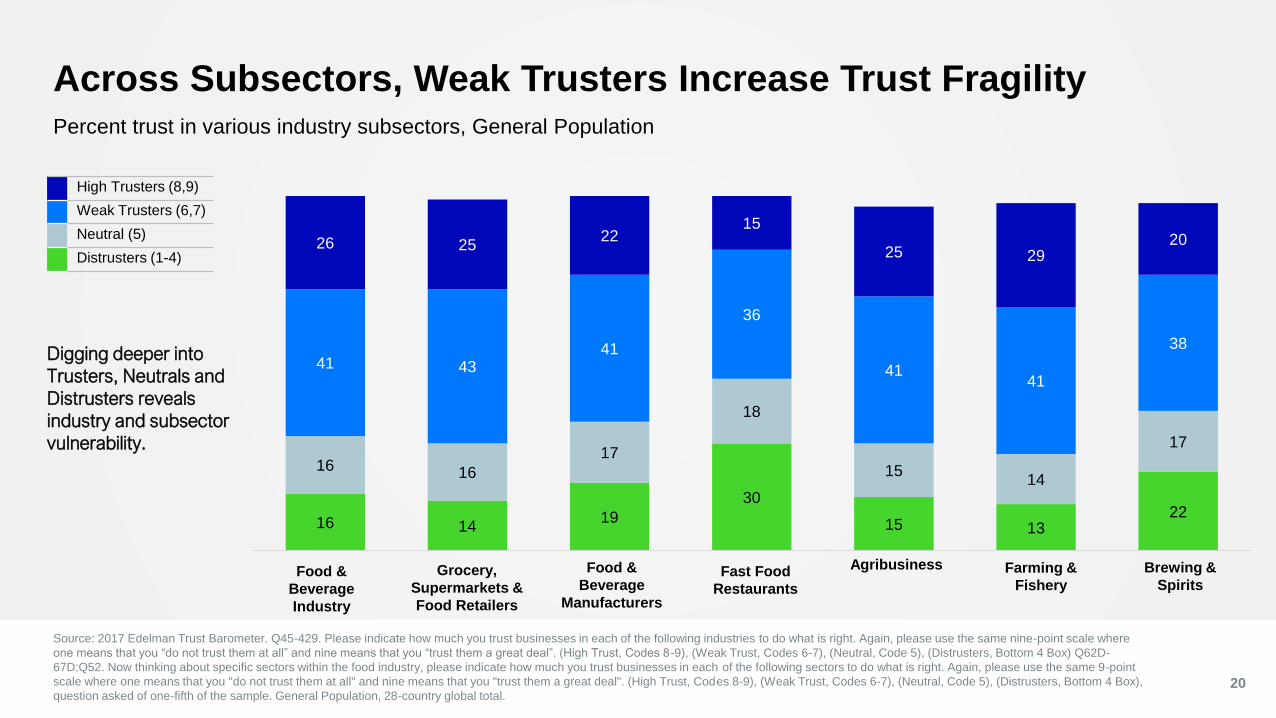
Across Subsectors, Weak Trusters Increase Trust Fragility
Source: 2017 Edelman Trust Barometer. Q45-429. Please indicate how much you trust businesses in each of the following industries to do what is right. Again, please use the same nine-point scale where
one means that you “do not trust them at all” and nine means that you “trust them a great deal”. (High Trust, Codes 8-9), (Weak Trust, Codes 6-7), (Neutral, Code 5), (Distrusters, Bottom 4 Box) Q62D-
67D;Q52. Now thinking about specific sectors within the food industry, please indicate how much you trust businesses in each of the following sectors to do what is right. Again, please use the same 9-point
scale where one means that you "do not trust them at all" and nine means that you "trust them a great deal". (High Trust, Codes 8-9), (Weak Trust, Codes 6-7), (Neutral, Code 5), (Distrusters, Bottom 4 Box),
question asked of one-fifth of the sample. General Population, 28-country global total.20
Percent trust in various industry subsectors, General Population
Digging deeper into
Trusters, Neutrals and
Distrusters reveals
industry and subsector
vulnerability.
High Trusters (8,9)
Weak Trusters (6,7)
Neutral (5)
Distrusters (1-4)
16 1419
30
15 1322
16 16
17
18
1514
17
41 4341
36
4141
38
26 2522
15
25 2920
Food &
Beverage
Industry
Grocery,
Supermarkets &
Food Retailers
Food &
Beverage
Manufacturers
Fast Food
Restaurants
Agribusiness Farming &
Fishery
Brewing &
Spirits
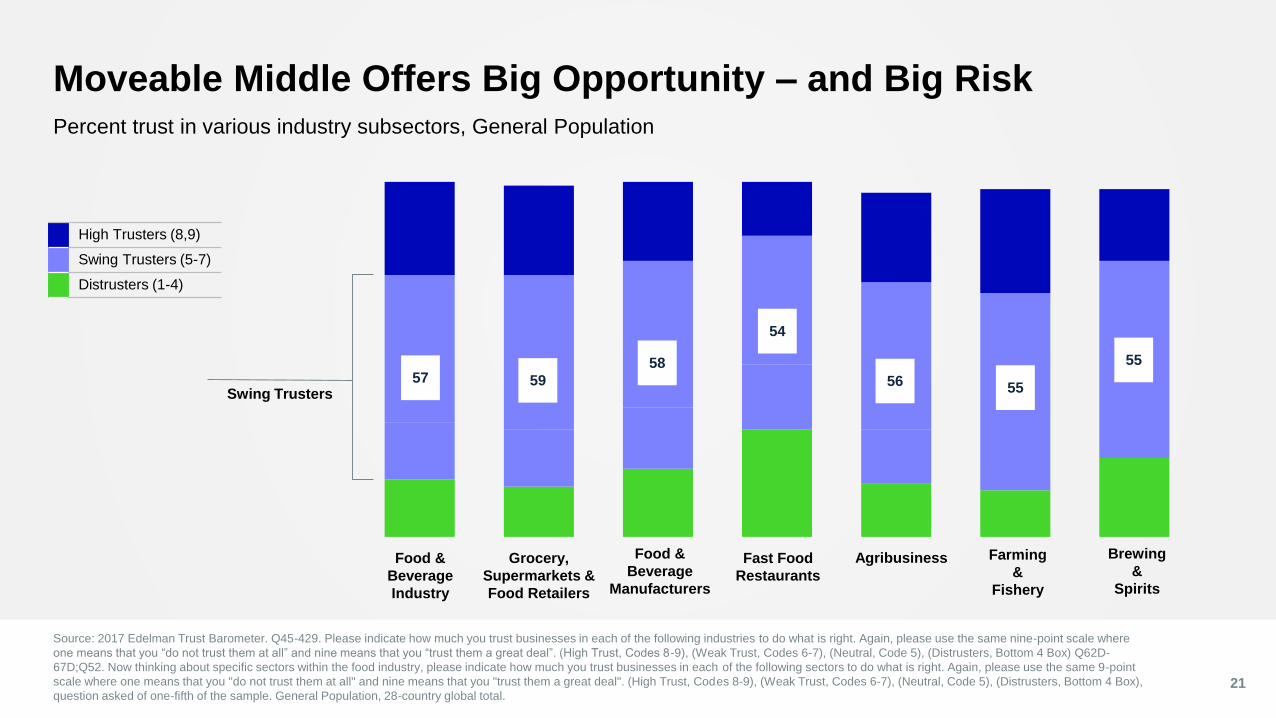
Moveable Middle Offers Big Opportunity – and Big Risk
21
Percent trust in various industry subsectors, General Population
Swing Trusters57 59
58
54
56 55
Food &
Beverage
Industry
Grocery,
Supermarkets &
Food Retailers
Food &
Beverage
Manufacturers
Fast Food
Restaurants
Agribusiness Farming
&
Fishery
Brewing
&
Spirits
55
High Trusters (8,9)
Swing Trusters (5-7)
Distrusters (1-4)
Source: 2017 Edelman Trust Barometer. Q45-429. Please indicate how much you trust businesses in each of the following industries to do what is right. Again, please use the same nine-point scale where
one means that you “do not trust them at all” and nine means that you “trust them a great deal”. (High Trust, Codes 8-9), (Weak Trust, Codes 6-7), (Neutral, Code 5), (Distrusters, Bottom 4 Box) Q62D-
67D;Q52. Now thinking about specific sectors within the food industry, please indicate how much you trust businesses in each of the following sectors to do what is right. Again, please use the same 9-point
scale where one means that you "do not trust them at all" and nine means that you "trust them a great deal". (High Trust, Codes 8-9), (Weak Trust, Codes 6-7), (Neutral, Code 5), (Distrusters, Bottom 4 Box),
question asked of one-fifth of the sample. General Population, 28-country global total.
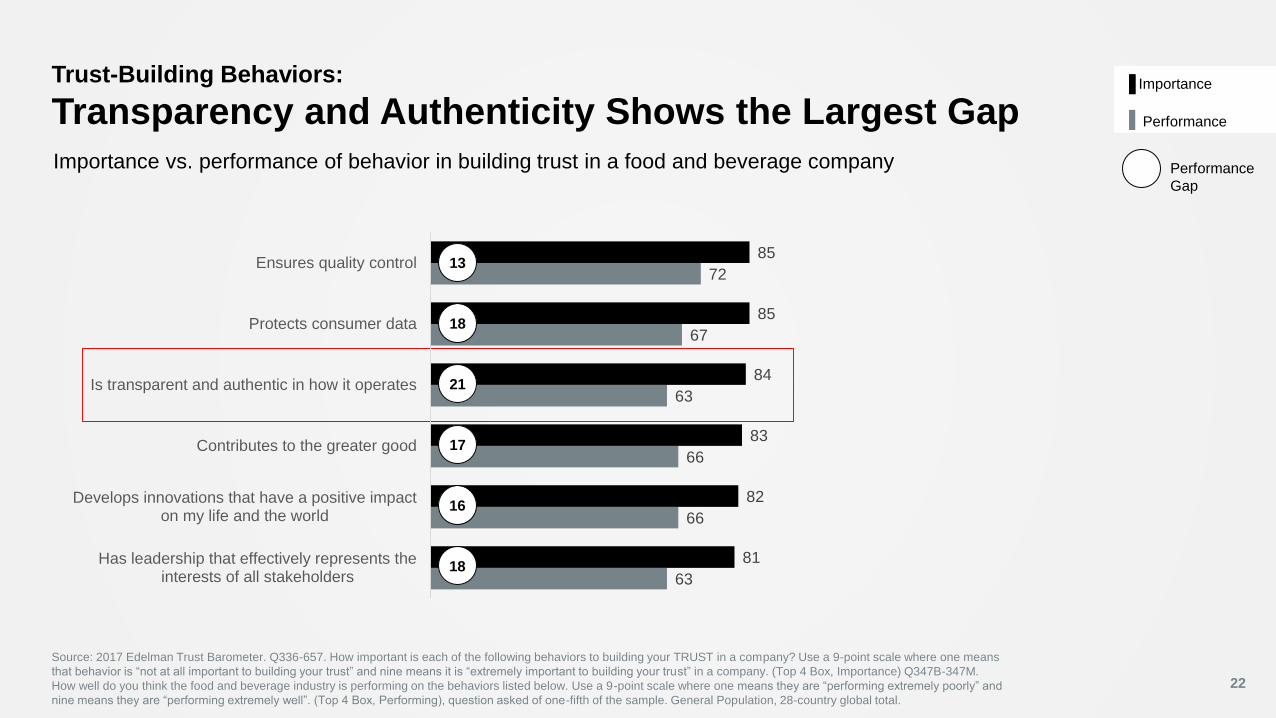
Trust-Building Behaviors:
Transparency and Authenticity Shows the Largest Gap
Importance vs. performance of behavior in building trust in a food and beverage company
22
63
66
66
63
67
72
81
82
83
84
85
85
Has leadership that effectively represents theinterests of all stakeholders
Develops innovations that have a positive impacton my life and the world
Contributes to the greater good
Is transparent and authentic in how it operates
Protects consumer data
Ensures quality control
Importance
Performance
13
Performance
Gap
18
21
17
16
18
Source: 2017 Edelman Trust Barometer. Q336-657. How important is each of the following behaviors to building your TRUST in a company? Use a 9-point scale where one means
that behavior is “not at all important to building your trust” and nine means it is “extremely important to building your trust” in a company. (Top 4 Box, Importance) Q347B-347M.
How well do you think the food and beverage industry is performing on the behaviors listed below. Use a 9-point scale where one means they are “performing extremely poorly” and
nine means they are “performing extremely well”. (Top 4 Box, Performing), question asked of one-fifth of the sample. General Population, 28-country global total.
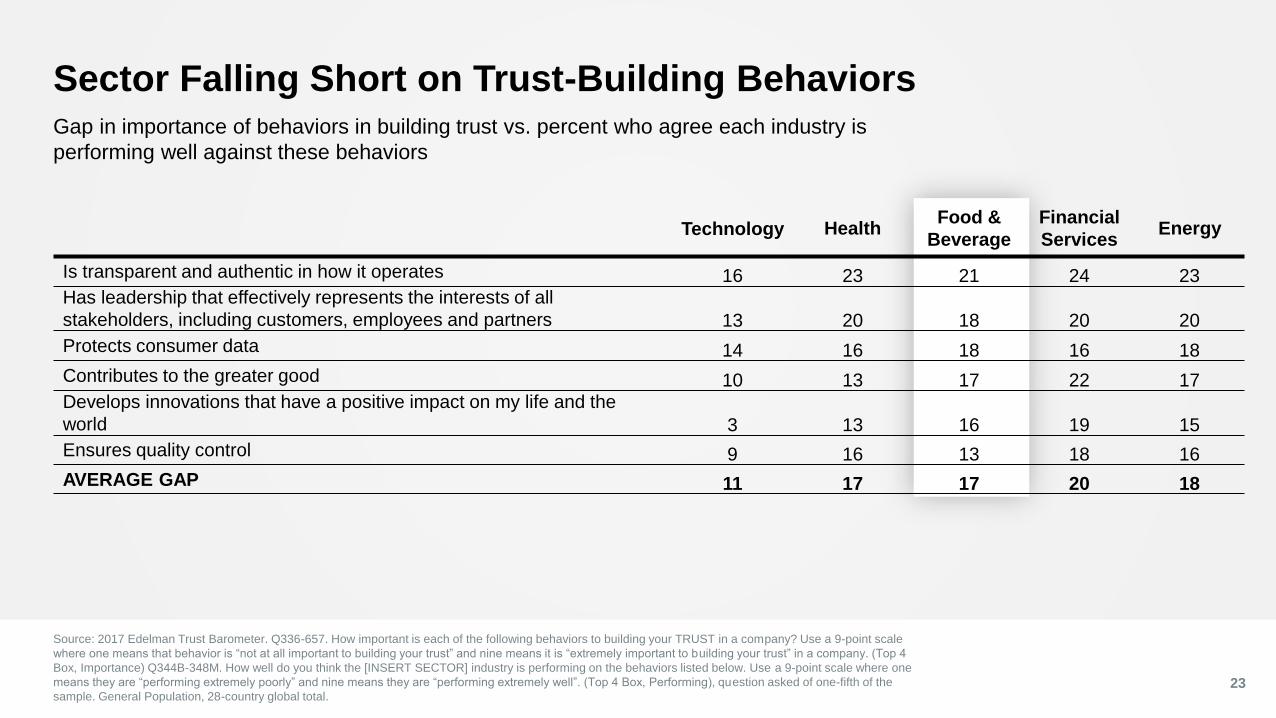
Technology HealthFood &
Beverage
Financial
ServicesEnergy
Is transparent and authentic in how it operates 16 23 21 24 23Has leadership that effectively represents the interests of all
stakeholders, including customers, employees and partners 13 20 18 20 20
Protects consumer data 14 16 18 16 18
Contributes to the greater good 10 13 17 22 17Develops innovations that have a positive impact on my life and the
world 3 13 16 19 15
Ensures quality control 9 16 13 18 16
AVERAGE GAP 11 17 17 20 18
Sector Falling Short on Trust-Building Behaviors
23
Gap in importance of behaviors in building trust vs. percent who agree each industry is
performing well against these behaviors
Source: 2017 Edelman Trust Barometer. Q336-657. How important is each of the following behaviors to building your TRUST in a company? Use a 9-point scale
where one means that behavior is “not at all important to building your trust” and nine means it is “extremely important to building your trust” in a company. (Top 4
Box, Importance) Q344B-348M. How well do you think the [INSERT SECTOR] industry is performing on the behaviors listed below. Use a 9-point scale where one
means they are “performing extremely poorly” and nine means they are “performing extremely well”. (Top 4 Box, Performing), question asked of one-fifth of the
sample. General Population, 28-country global total.
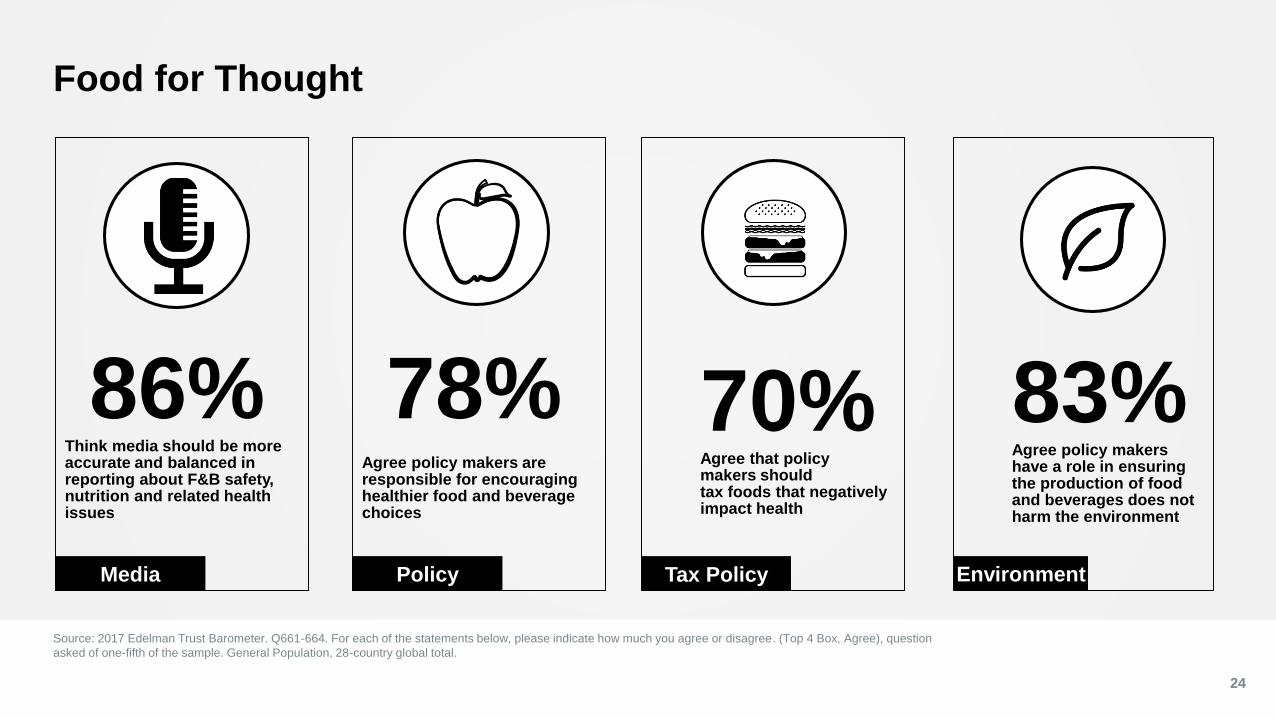
Food for Thought
Source: 2017 Edelman Trust Barometer. Q661-664. For each of the statements below, please indicate how much you agree or disagree. (Top 4 Box, Agree), question
asked of one-fifth of the sample. General Population, 28-country global total.
24
86% Think media should be more accurate and balanced in reporting about F&B safety, nutrition and related health issues
70%Agree that policy makers should tax foods that negatively impact health
83%Agree policy makers have a role in ensuring the production of food and beverages does not harm the environment
Media EnvironmentTax Policy
78% Agree policy makers are responsible for encouraging healthier food and beverage choices
Policy